fluid loading responsiveness
TRANSCRIPT
Fluid loading responsivenessGeerts, B.
CitationGeerts, B. (2011, May 25). Fluid loading responsiveness.Retrieved from https://hdl.handle.net/1887/17663 Version: Corrected Publisher’s Version
License:Licence agreement concerninginclusion of doctoral thesis in theInstitutional Repository of theUniversity of Leiden
Downloaded from: https://hdl.handle.net/1887/17663 Note: To cite this publication please use the final publishedversion (if applicable).

Fluid loadin
g responsiven
ess Bart Fran
ciscus G
eerts
Fluid loading responsivenessBart Franciscus Geerts

Aan Jo en Frederike
(1

2)
(3
Fluid loading responsiveness
PROEFSCHRIFT
ter verkrijging van de graad van Doctor aan de Universiteit Leiden,
op gezag van Rector Magnificus prof. mr. P.F. van der Heijden,
volgens besluit van het College voor Promoties
te verdedigen op woensdag 25 mei 2011
klokke 13.45 uur
door
Bart Franciscus Geerts
geboren te Amsterdam
in 1979

4)

(5
Promotiecommissie
Promotor: Prof. dr. L.P.H.J. Aarts
Co-promotor: Dr. J.R.C. Jansen
Overige leden: Prof. dr. A.B.J. Groeneveld (Vrije Universiteit Amsterdam)
Prof. dr. W. Buhre (Universiteit Utrecht)
Prof. dr. A. Dahan

6)
This study was funded by institutional funds of the departments of intensive care and
anaesthesiology of the Leiden University Medical Centre.
Copyright © B.F. Geerts, Amsterdam, The Netherlands
Cover: Kanagawa Oki Nami Uraby by Katsushika Hokusai 1831
Design: Boulogne Jonkers Vormgeving, Zoetermeer
Printed by Schulten, Zoetermeer
ISBN: 978-90-9026085-3
Typeset in Scala
The printing of this thesis was supported by the department of Anaesthesiology of the
LUMC and the Centre for Human Drug Research.
(7
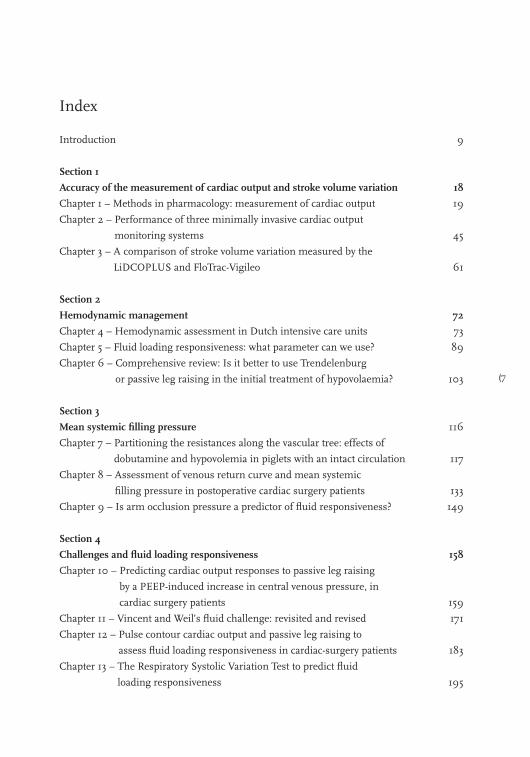
Index
Introduction 9
Section 1
Accuracy of the measurement of cardiac output and stroke volume variation 18
Chapter 1 – Methods in pharmacology: measurement of cardiac output 19
Chapter 2 – Performance of three minimally invasive cardiac output
monitoring systems 45
Chapter 3 – A comparison of stroke volume variation measured by the
LiDCOPLUS and FloTrac-Vigileo 61
Section 2
Hemodynamic management 72
Chapter 4 – Hemodynamic assessment in Dutch intensive care units 73
Chapter 5 – Fluid loading responsiveness: what parameter can we use? 89
Chapter 6 – Comprehensive review: Is it better to use Trendelenburg
or passive leg raising in the initial treatment of hypovolaemia? 103
Section 3
Mean systemic filling pressure 116
Chapter 7 – Partitioning the resistances along the vascular tree: effects of
dobutamine and hypovolemia in piglets with an intact circulation 117
Chapter 8 – Assessment of venous return curve and mean systemic
filling pressure in postoperative cardiac surgery patients 133
Chapter 9 – Is arm occlusion pressure a predictor of fluid responsiveness? 149
Section 4
Challenges and fluid loading responsiveness 158
Chapter 10 – Predicting cardiac output responses to passive leg raising
by a PEEP-induced increase in central venous pressure, in
cardiac surgery patients 159
Chapter 11 – Vincent and Weil’s fluid challenge: revisited and revised 171
Chapter 12 – Pulse contour cardiac output and passive leg raising to
assess fluid loading responsiveness in cardiac-surgery patients 183
Chapter 13 – The Respiratory Systolic Variation Test to predict fluid
loading responsiveness 195

8)
Section 5
Discussion and conclusions 202
Chapter 14 – Discussion; fluid loading responsiveness and how can we use it? 203
Chapter 15 – Summary 213
Chapter 16 – Samenvatting 221
List of abbreviations 230
Curriculum vitae 234
Dankwoord 235
Publications 236
(9
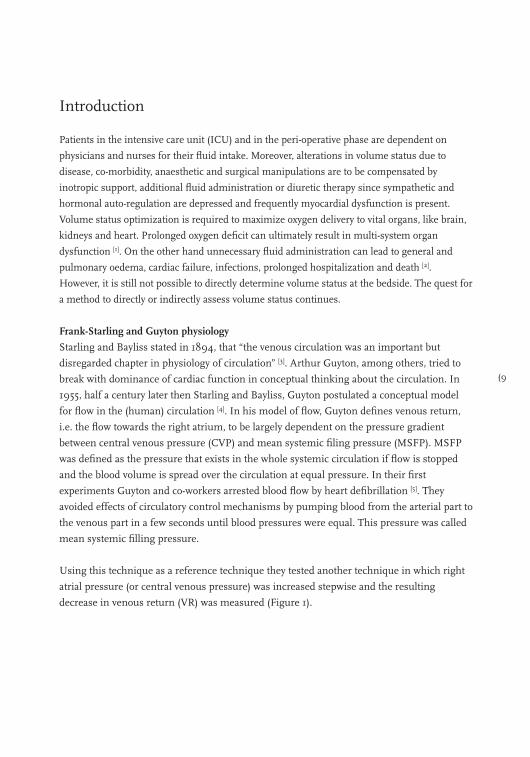
Introduction
Patients in the intensive care unit (ICU) and in the peri-operative phase are dependent on
physicians and nurses for their fluid intake. Moreover, alterations in volume status due to
disease, co-morbidity, anaesthetic and surgical manipulations are to be compensated by
inotropic support, additional fluid administration or diuretic therapy since sympathetic and
hormonal auto-regulation are depressed and frequently myocardial dysfunction is present.
Volume status optimization is required to maximize oxygen delivery to vital organs, like brain,
kidneys and heart. Prolonged oxygen deficit can ultimately result in multi-system organ
dysfunction [1]. On the other hand unnecessary fluid administration can lead to general and
pulmonary oedema, cardiac failure, infections, prolonged hospitalization and death [2].
However, it is still not possible to directly determine volume status at the bedside. The quest for
a method to directly or indirectly assess volume status continues.
Frank-Starling and Guyton physiology
Starling and Bayliss stated in 1894, that “the venous circulation was an important but
disregarded chapter in physiology of circulation” [3]. Arthur Guyton, among others, tried to
break with dominance of cardiac function in conceptual thinking about the circulation. In
1955, half a century later then Starling and Bayliss, Guyton postulated a conceptual model
for flow in the (human) circulation [4]. In his model of flow, Guyton defines venous return,
i.e. the flow towards the right atrium, to be largely dependent on the pressure gradient
between central venous pressure (CVP) and mean systemic filing pressure (MSFP). MSFP
was defined as the pressure that exists in the whole systemic circulation if flow is stopped
and the blood volume is spread over the circulation at equal pressure. In their first
experiments Guyton and co-workers arrested blood flow by heart defibrillation [5]. They
avoided effects of circulatory control mechanisms by pumping blood from the arterial part to
the venous part in a few seconds until blood pressures were equal. This pressure was called
mean systemic filling pressure.
Using this technique as a reference technique they tested another technique in which right
atrial pressure (or central venous pressure) was increased stepwise and the resulting
decrease in venous return (VR) was measured (Figure 1).
10)
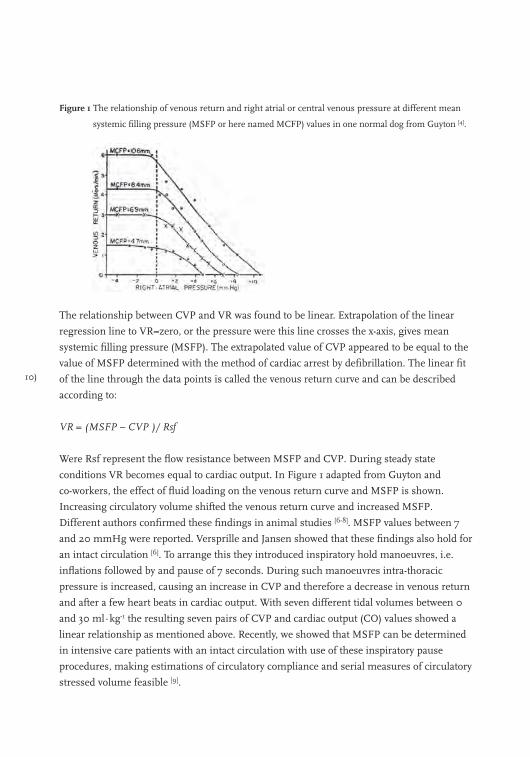
Figure 1 The relationship of venous return and right atrial or central venous pressure at different mean
systemic filling pressure (MSFP or here named MCFP) values in one normal dog from Guyton [4].
The relationship between CVP and VR was found to be linear. Extrapolation of the linear
regression line to VR=zero, or the pressure were this line crosses the x-axis, gives mean
systemic filling pressure (MSFP). The extrapolated value of CVP appeared to be equal to the
value of MSFP determined with the method of cardiac arrest by defibrillation. The linear fit
of the line through the data points is called the venous return curve and can be described
according to:
VR = (MSFP – CVP )/ Rsf
Were Rsf represent the flow resistance between MSFP and CVP. During steady state
conditions VR becomes equal to cardiac output. In Figure 1 adapted from Guyton and
co-workers, the effect of fluid loading on the venous return curve and MSFP is shown.
Increasing circulatory volume shifted the venous return curve and increased MSFP.
Different authors confirmed these findings in animal studies [6-8]. MSFP values between 7
and 20 mmHg were reported. Versprille and Jansen showed that these findings also hold for
an intact circulation [6]. To arrange this they introduced inspiratory hold manoeuvres, i.e.
inflations followed by and pause of 7 seconds. During such manoeuvres intra-thoracic
pressure is increased, causing an increase in CVP and therefore a decrease in venous return
and after a few heart beats in cardiac output. With seven different tidal volumes between 0
and 30 ml∙kg-1 the resulting seven pairs of CVP and cardiac output (CO) values showed a
linear relationship as mentioned above. Recently, we showed that MSFP can be determined
in intensive care patients with an intact circulation with use of these inspiratory pause
procedures, making estimations of circulatory compliance and serial measures of circulatory
stressed volume feasible [9].
(11
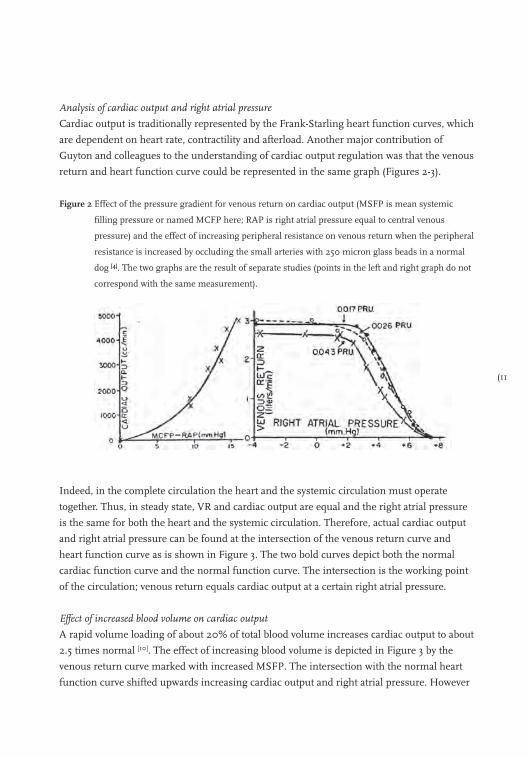
Analysis of cardiac output and right atrial pressure
Cardiac output is traditionally represented by the Frank-Starling heart function curves, which
are dependent on heart rate, contractility and afterload. Another major contribution of
Guyton and colleagues to the understanding of cardiac output regulation was that the venous
return and heart function curve could be represented in the same graph (Figures 2-3).
Figure 2 Effect of the pressure gradient for venous return on cardiac output (MSFP is mean systemic
filling pressure or named MCFP here; RAP is right atrial pressure equal to central venous
pressure) and the effect of increasing peripheral resistance on venous return when the peripheral
resistance is increased by occluding the small arteries with 250 micron glass beads in a normal
dog [4]. The two graphs are the result of separate studies (points in the left and right graph do not
correspond with the same measurement).
Indeed, in the complete circulation the heart and the systemic circulation must operate
together. Thus, in steady state, VR and cardiac output are equal and the right atrial pressure
is the same for both the heart and the systemic circulation. Therefore, actual cardiac output
and right atrial pressure can be found at the intersection of the venous return curve and
heart function curve as is shown in Figure 3. The two bold curves depict both the normal
cardiac function curve and the normal function curve. The intersection is the working point
of the circulation; venous return equals cardiac output at a certain right atrial pressure.
Effect of increased blood volume on cardiac output
A rapid volume loading of about 20% of total blood volume increases cardiac output to about
2.5 times normal [10]. The effect of increasing blood volume is depicted in Figure 3 by the
venous return curve marked with increased MSFP. The intersection with the normal heart
function curve shifted upwards increasing cardiac output and right atrial pressure. However
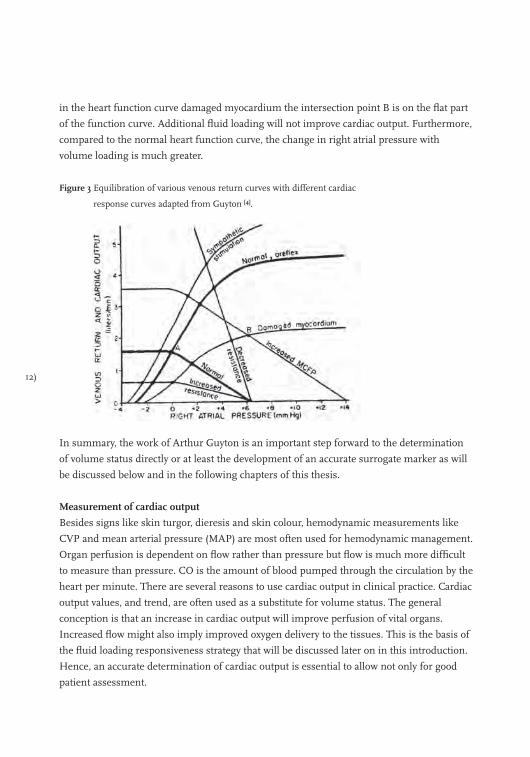
12)
in the heart function curve damaged myocardium the intersection point B is on the flat part
of the function curve. Additional fluid loading will not improve cardiac output. Furthermore,
compared to the normal heart function curve, the change in right atrial pressure with
volume loading is much greater.
Figure 3 Equilibration of various venous return curves with different cardiac
response curves adapted from Guyton [4].
In summary, the work of Arthur Guyton is an important step forward to the determination
of volume status directly or at least the development of an accurate surrogate marker as will
be discussed below and in the following chapters of this thesis.
Measurement of cardiac output
Besides signs like skin turgor, dieresis and skin colour, hemodynamic measurements like
CVP and mean arterial pressure (MAP) are most often used for hemodynamic management.
Organ perfusion is dependent on flow rather than pressure but flow is much more difficult
to measure than pressure. CO is the amount of blood pumped through the circulation by the
heart per minute. There are several reasons to use cardiac output in clinical practice. Cardiac
output values, and trend, are often used as a substitute for volume status. The general
conception is that an increase in cardiac output will improve perfusion of vital organs.
Increased flow might also imply improved oxygen delivery to the tissues. This is the basis of
the fluid loading responsiveness strategy that will be discussed later on in this introduction.
Hence, an accurate determination of cardiac output is essential to allow not only for good
patient assessment.
(13
In the first chapter of this thesis we provide an overview of some of the most-often-used
methods to measure cardiac output. We describe the Fick-method, ultrasound, indicator
dilution techniques, arterial pulse contour analysis and bio-impedance. Characteristics like
accuracy, precision, operator variability, invasiveness, interval of measurements, robustness
and complications are reviewed. Thermodilution with a pulmonary artery catheter (PAC) is
the de-facto gold standard for the measurement of cardiac output. The use of a PAC is
however associated with several complications, like infection, pulmonary artery dissection,
lung infarction, valvular lesion and pneumothorax [11]. In recent years, several less invasive
methods have been developed. Pulse contour analysis is one of them and requires only a
radial or femoral artery catheter [12]. In chapter two results are shown of an evaluation of the
accuracy of the measurement of cardiac output using three methods (FloTrac–Vigileo,
Modelflow and HemoSonic system) with thermodilution as the reference method [13].
Another parameter that can be estimated from the arterial pulse wave is stroke volume
variation (SVV). Mechanical ventilation causes cyclic changes in venous return, pulmonary
artery blood flow, and aortic blood flow. The changes in these parameters due to ventilation
seem to be an indirect reflection of effective volume status [14]. SVV is the difference between
the minimal and the maximum stroke volume divided by the mean stroke volume over a
certain period of time. SVV is displayed as a percentage value. In some studies [15,16], stroke
volume variation has been shown to have high sensitivity and specificity to predict of fluid
loading responsiveness, i.e. the prediction of an increase in cardiac output with fluid loading.
However, SVV requires full mechanical ventilation of the lungs and absence of arrhythmias
when fluid loading responsiveness (FLR) is assessed [17]. Moreover, since stroke volume
cannot be measured directly without a PAC, pulse contour methods are used. Different
pulse contour methods are available but reports on their accuracy are rare. In chapter three,
we present a comparison of the accuracy of SVV measured with the LiDCOplus and
FloTrac-Vigileo system [18].
Parameters used in hemodynamic management in the ICU
Hemodynamic instability caused by relative or absolute intravascular volume deficiency are
common in the ICU and OR. Physicians use several surrogate parameters to select patients who
will benefit from fluid loading. We performed a survey to evaluate the use of these parameters by
Dutch intensive care physicians. Results of this survey are shown in chapter four.
Fluid loading responsiveness
Traditional filling pressures like CVP often fail as a predictor [19-21]. Therefore, new methods
are being developed or traditional parameters are used in a different setting to prevent fluid
overloading by an accurate prediction of the response to fluid loading.
14)
Relatively few strategies exist to assist the physician in hemodynamic management. One
such strategy has recently received broad attention. This strategy is fluid loading
responsiveness (FLR). FLR is used to predict whether cardiac output will significantly
increase or not with fluid loading. A parameter that can accurately predict FLR has been
sought for many years. New parameters like SVV have been developed and used in the FLR
strategy. In chapter five we review the accuracy and limitations reported of the most
frequently used methods in clinical practice to predict fluid responsiveness in patients
undergoing mechanical ventilation. We provide a straightforward overview of determinants
that can be used to predict a clinically significant effect of fluid administration on cardiac
output.
Treating hypovolaemia
When hypovolaemia occurs and is diagnosed. Treatment is initiated. This will comprise the
rapid administration of fluids. Fluid resuscitation is however not achieved immediately. The
Trendelenburg position or head-down tilt, and passive leg raising (PLR) are routinely used in
the initial treatment. In chapter six a meta-analysis is described into the hemodynamic
effects of PLR and Trendelenburg. We asked ourselves which manoeuvre has the optimal
effect on cardiac output (CO) while awaiting fluid resuscitation?
Mean systemic filling pressure
As we described above Arthur Guyton is responsible for some major steps in the
development of a method to determine volume status directly. He defined mean systemic
filling pressure as the mean pressure throughout the circulatory system under conditions of
no flow. Together with the shape of cardiac output function curve, dimensions of the
vascular system and blood viscosity, mean systemic filling pressure can be considered as a
primary determinant of venous return and thus cardiac output. In chapters seven to nine, we
present the results of three studies into mean systemic filling pressure. Ultimately, MSFP
can be used to calculate stressed volume and, hence, quantify effective volume status in a
specific patient [5].
However, in line with its definition determination of MSFP will require zero flow conditions
throughout the circulatory system. Creating zero flow conditions at the bedside is unethical.
We therefore developed a method to determine MSFP indirectly with two new methods; an
arm model and a mechanical ventilator manoeuvre. In chapter seven, we studied the effect
of dobutamine and hypovolemia on the circulation and tested the model of ventilatory holds
with increasing airway pressure in pigs. In this model, CVP values can be used to extrapolate
pressure at zero flow conditions. In chapter eight, we expanded on earlier work by Versprille
and Jansen [6] to estimate MSFP with a ventilatory manoeuvre in humans. In chapter nine,
(15
we use the second model (i.e. the arm model) to predict FLR in patients who underwent
coronary artery bypass surgery.
Challenges to predict fluid loading responsiveness
In chapters ten to thirteen we study several challenges to predict FLR; +10 cmH2O (chapter
ten), the fluid challenge (chapter eleven), passive leg raising (chapter twelve) and the
respiratory ventilator manoeuvre (chapter thirteen). New parameters like SVV and PPV are
being developed to prevent fluid over-loading. But these parameters have their own
limitations like inaccuracy in predicting FLR during low tidal volume ventilation [22] or in
patients with arrhythmias [17]. In recent years traditional filling pressures like CVP often
failed as a predictor for FLR [19-21]. We looked to re-use these traditional parameters, i.e. the
changes induced by a challenge, to predict FLR.
A PLR-, fluid- or PEEP-challenge is aimed at determining the working point of the
circulation on the Frank-Starling curve. It is assumed that when the patient is on the
ascending portion of the Frank-Starling curve an (auto)transfusion will increase cardiac
output. Once the heart is functioning near the ‘‘flat’’ part of the Frank-Starling curve fluid
loading has little effect on cardiac output and central venous pressure will increase more. A
PEEP-challenge on the other hand will give incrementally greater decreases in CO when the
heart functions toward the flat part of the Frank Starling curve. We studied whether changes
in parameters like CVP or CO as a result of a challenge can be used to estimate the working
point on the Starling curve and consequently predict FLR.
In the discussion (chapter fourteen) of this thesis, we concentrate on the definition of fluid
loading responsiveness and look for solutions and research directions for the future.

16)
References
1. Bilkovski RN, Rivers EP, Horst HM. Targeted resuscitation strategies after injury. Curr Opin Crit Care 2004;
10: 529-38.
2. Chappell D, Jacob M, Hofmann-Kiefer K, Conzen P, Rehm M. A rational approach to perioperative fluid
management. Anesthesiology 2008; 109: 723-40.
3. Bayliss WM, Starling EH. On some Points in the Innervation of the Mammalian Heart. J Physiol 1892; 13:
407-18.
4. Guyton AC, Lindsey AW, Kaufmann BN. Effect of Mean Circulatory Filling Pressure and Other Peripheral
Circulatory Factors on Cardiac Output. AJP - Legacy 1955; 180: 463-8.
5. Guyton AC, Polizo D, Armstrong GG. Mean circulatory filling pressure measured immediately after
cessation of heart pumping. Am J Physiol 1954; 179: 261-7.
6. Versprille A, Jansen JR. Mean systemic filling pressure as a characteristic pressure for venous return.
Pflugers Arch 1985; 405: 226-33.
7. Pinsky MR. Instantaneous venous return curves in an intact canine preparation. J Appl Physiol 1984; 56:
765-71.
8. Den Hartog EA, Versprille A, Jansen JR. Systemic filling pressure in intact circulation determined on basis
of aortic vs. central venous pressure relationships. Am J Physiol 1994; 267: H2255-H2258.
9. Maas JJ, Geerts BF, de Wilde RB, et al. Assessment of venous return curve and mean systemic filling
pressure in post-operative cardiac surgery patients. Crit Care Med 2009; 37: 912-8.
10. Guyton AC, Jones CE, Coleman TG. Cardiac output and its regulation. Philidelphia, USA: W.B. Saunders
Company, 1973.
11. Harvey S, Harrison DA, Singer M, et al. Assessment of the clinical effectiveness of pulmonary artery
catheters in management of patients in intensive care (PAC-Man): a randomised controlled trial. Lancet
2005; 366: 472-7.
12. de Wilde RB, Breukers RB, van den Berg PC, Jansen JR. Monitoring cardiac output using the femoral and
radial arterial pressure waveform. Anaesthesia 2006; 61: 743-6.
13. de Wilde RB, Geerts BF, Cui J, van den Berg PC, Jansen JR. Performance of three minimally invasive cardiac
output monitoring systems. Anaesthesia 2009; 64: 762-9.
14. Michard F. Changes in arterial pressure during mechanical ventilation. Anesthesiology 2005; 103: 419-28.
15. Michard F, Boussat S, Chemla D, et al. Relation between respiratory changes in arterial pulse pressure and
fluid responsiveness in septic patients with acute circulatory failure. Am J Respir Crit Care Med. 2000; 162:
134-8.
16. Berkenstadt H, Margalit N, Hadani M, et al. Stroke volume variation as a predictor of fluid responsiveness in
patients undergoing brain surgery. Anesth Analg 2001; 92: 984-9.
17. Michard F, Teboul JL. Using heart-lung interactions to assess fluid responsiveness during mechanical
ventilation. Crit Care 2000; 4: 282-9.
18. de Wilde RB, Geerts BF, van den Berg PC, Jansen JR. A comparison of stroke volume variation measured by
the LiDCOplus and FloTrac-Vigileo system. Anaesthesia 2009; 64: 1004-9.
19. Kumar A, Anel R, Bunnell E, et al. Pulmonary artery occlusion pressure and central venous pressure fail to
predict ventricular filling volume, cardiac performance, or the response to volume infusion in normal
subjects. Crit Care Med 2004; 32: 691-9.
20. Michard F, Teboul JL. Predicting Fluid Responsiveness in ICU Patients* : A Critical Analysis of the
Evidence. Chest 2002; 121: 2000-8.

(17
21. Reuse C, Vincent JL, Pinsky MR. Measurements of right ventricular volumes during fluid challenge. Chest
1990; 98: 1450-4.
22. Reuter DA, Bayerlein J, Goepfert MS, et al. Influence of tidal volume on left ventricular stroke volume
variation measured by pulse contour analysis in mechanically ventilated patients. Intensive Care Med 2003;
29: 476-80.

18)
Section 1
Accuracy of the measurement of cardiac output
and stroke volume variation

(19
Chapter 1
Methods in pharmacology: measurement of cardiac output
Bart Geerts, Leon Aarts and Jos Jansen
British Journal of Clinical Pharmacology 2011; 71(3): 316-330
20)
“It is a source of regret that measurement of flow is much more difficult than measurement of
pressure. This has led to an undue interest in blood pressure measurements. Most organs
however, require flow rather than pressure.” This statement by Jarisch in 1928 [1] is still fully
valid. Many methods of cardiac output measurement have been developed, but the number of
methods useful for human pharmacological studies is limited. Methods proposed to achieve
this goal include; the Fick principle; ultrasound; indicator dilution techniques; arterial pulse
contour analysis; and bio-impedance. To gain widespread acceptance, these methods should
ideally be accurate, precise, operator independent, fast responding, non-invasive, continuous,
easy of use, cheap and without complications. The methods may allow testing of circulatory
changes on pharmacological interventions. In this review on cardiac output, the methods used
in pharmacology are described.
Fick’s cardiac output measurement
Direct Fick for oxygen
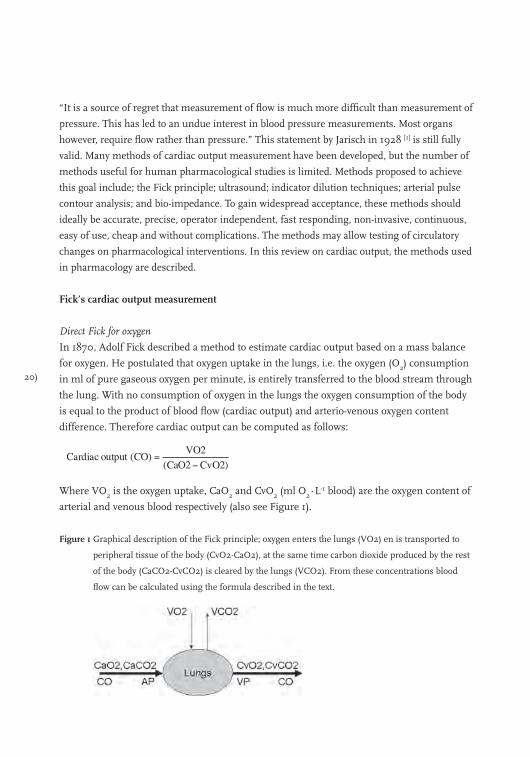
In 1870, Adolf Fick described a method to estimate cardiac output based on a mass balance
for oxygen. He postulated that oxygen uptake in the lungs, i.e. the oxygen (O2) consumption
in ml of pure gaseous oxygen per minute, is entirely transferred to the blood stream through
the lung. With no consumption of oxygen in the lungs the oxygen consumption of the body
is equal to the product of blood flow (cardiac output) and arterio-venous oxygen content
difference. Therefore cardiac output can be computed as follows:
Where VO2 is the oxygen uptake, CaO2 and CvO2 (ml O2∙L-1 blood) are the oxygen content of
arterial and venous blood respectively (also see Figure 1).
Figure 1 Graphical description of the Fick principle; oxygen enters the lungs (VO2) en is transported to
peripheral tissue of the body (CvO2-CaO2), at the same time carbon dioxide produced by the rest
of the body (CaCO2-CvCO2) is cleared by the lungs (VCO2). From these concentrations blood
flow can be calculated using the formula described in the text.
(21
At first sight the method seems simple to execute. VO2 can be determined by breathing or
mechanical ventilation within a spirometer incorporating a carbon dioxide absorber or, more
conveniently, via an indirect calorimetry monitor. Also, the calculation of the arterial and
venous oxygen content of the blood is a straightforward process and is readily available to
physicians. However, the method is laborious and many variables need to be determined.
During the acquisition of data the circulation needs to be stable. Considerations: 1; the large
number of variables involved in the computation result in a large chance on permutation of
errors, 2; ventilation of subjects with inspiratory O2 fractions larger than 60% have been
reported to decline the accuracy of the method [2], 3; the technique requires an invasive
pulmonary artery catheter to sample mixed venous blood. Accurate measurement of VO2 as
well as reliable sampling of arterial and venous blood sample is labor-intensive.
Nevertheless, in a laboratory with skilled researchers, the method is considered the most
accurate method to which other methods are compared.
Partial carbon dioxide rebreathing
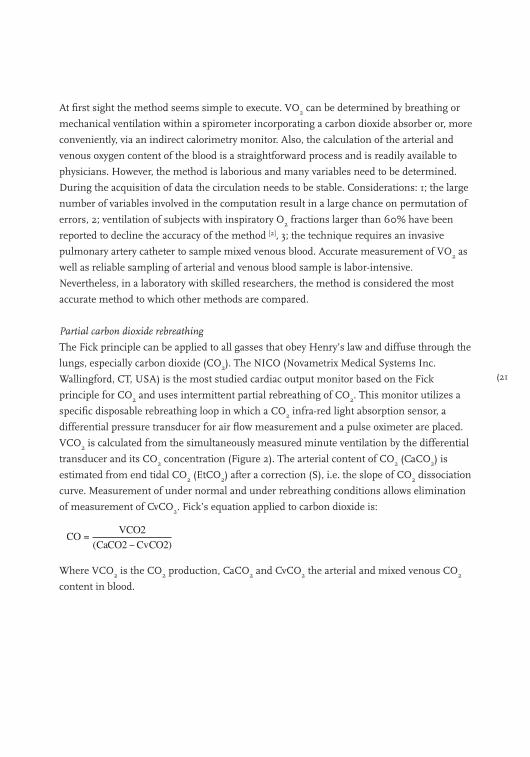
The Fick principle can be applied to all gasses that obey Henry’s law and diffuse through the
lungs, especially carbon dioxide (CO2). The NICO (Novametrix Medical Systems Inc.
Wallingford, CT, USA) is the most studied cardiac output monitor based on the Fick
principle for CO2 and uses intermittent partial rebreathing of CO2. This monitor utilizes a
specific disposable rebreathing loop in which a CO2 infra-red light absorption sensor, a
differential pressure transducer for air flow measurement and a pulse oximeter are placed.
VCO2 is calculated from the simultaneously measured minute ventilation by the differential
transducer and its CO2 concentration (Figure 2). The arterial content of CO2 (CaCO2) is
estimated from end tidal CO2 (EtCO2) after a correction (S), i.e. the slope of CO2 dissociation
curve. Measurement of under normal and under rebreathing conditions allows elimination
of measurement of CvCO2. Fick’s equation applied to carbon dioxide is:
Where VCO2 is the CO2 production, CaCO2 and CvCO2 the arterial and mixed venous CO2
content in blood.
22)
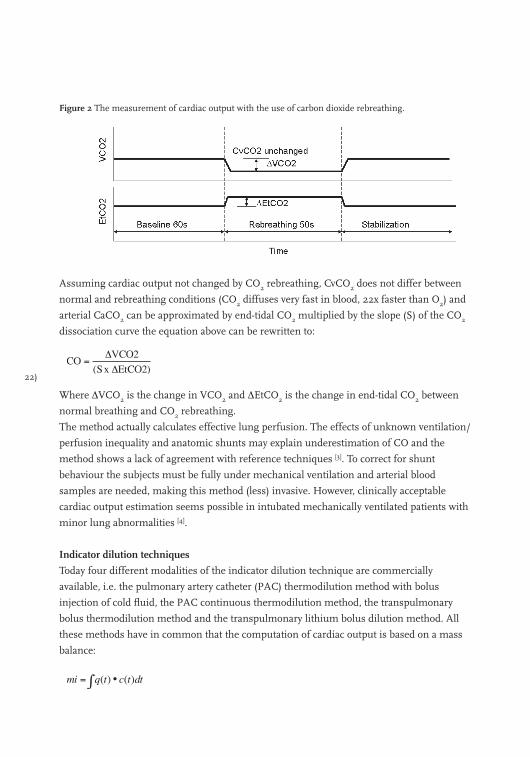
Figure 2 The measurement of cardiac output with the use of carbon dioxide rebreathing.
Assuming cardiac output not changed by CO2 rebreathing, CvCO2 does not differ between
normal and rebreathing conditions (CO2 diffuses very fast in blood, 22x faster than O2) and
arterial CaCO2 can be approximated by end-tidal CO2 multiplied by the slope (S) of the CO2
dissociation curve the equation above can be rewritten to:
Where ∆VCO2 is the change in VCO2 and ∆EtCO2 is the change in end-tidal CO2 between
normal breathing and CO2 rebreathing.
The method actually calculates effective lung perfusion. The effects of unknown ventilation/
perfusion inequality and anatomic shunts may explain underestimation of CO and the
method shows a lack of agreement with reference techniques [3]. To correct for shunt
behaviour the subjects must be fully under mechanical ventilation and arterial blood
samples are needed, making this method (less) invasive. However, clinically acceptable
cardiac output estimation seems possible in intubated mechanically ventilated patients with
minor lung abnormalities [4].
Indicator dilution techniques
Today four different modalities of the indicator dilution technique are commercially
available, i.e. the pulmonary artery catheter (PAC) thermodilution method with bolus
injection of cold fluid, the PAC continuous thermodilution method, the transpulmonary
bolus thermodilution method and the transpulmonary lithium bolus dilution method. All
these methods have in common that the computation of cardiac output is based on a mass
balance:
(23
Where; mi is the amount of indicator injected, q(t) is instantaneous blood flow and c(t) is
concentration as function of time.
Application of this equation assumes complete mixing of blood and indicator, no loss of
indicator between place of injection and place of detection. If we further assume blood flow
to be constant than we found the well-known Stewart-Hamilton equation:
Where ∫c(t)dt is the area under the indicator dilution curve. Errors made in the application of
indicator dilution methods are primarily related to violation of the assumption mentioned
above, inaccurate implementation of the method [5] and anatomic abnormalities [6].
Intermittent Pulmonary Thermodilution
Since the introduction of the pulmonary artery catheter (PAC) equipped with a thermistor by
Swan and Ganz in 1970 [7] the thermodilution method has become the standard method to
determine cardiac output in patients. The thermodilution method is based on the law of
conservation of thermal energy. With the intermittent thermodilution technique a certain
amount of cold fluid is injected into the blood stream near the entrance of the right atrium
and the resulting dilution curve is detected in the pulmonary artery. With temperature as
indicator the Stewart-Hamilton equation can be rewritten as follows:
Where COtd is cardiac output by thermodilution, Tb is the temperature of blood in the
pulmonary artery before injection of injectate, Ti the temperature of the injectate, and
(∫∆Tb(t)dt the area under the dilution curve (Figure 3) and cc is the computation constant.
The computation constant contains corrections for specific mass and heat of injectate and
blood respectively, injected volume and loss of indicator in the PAC and has to be entered in
the thermodilution cardiac output computer.
24)
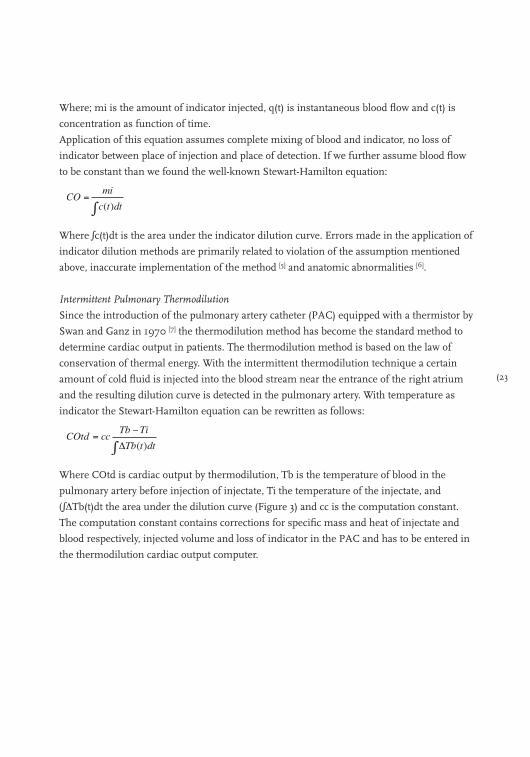
Figure 3 Indicator dilution to measure cardiac output. A dye solution or cold saline is injected and
detected by a (dye or thermal) sensor downstream of the injection site. The dilution signal is fed
to a cardiac output device. To compute cardiac output the dose injected is divided by the area
under the indicator dilution curve. The inset shows the difference in temperature changes for
two different locations of detection (see text).
Investigators have previously explored methods of minimizing the errors in the intermitted
thermodilution technique [8-12]. The best method is to average the results of three or four
thermodilution measurement with the injection of cold fluid equidistantly distributed over
the ventilatory cycle. For such an approach injections of fluid must be done with an injector
under computer control. Use of such a set-up results in a coefficient of variation or
1SD-precision of 3.5%. Whereas the averaged result of three randomly applied
measurements have a 1SD-precision of about 10% and single measurements a 1SD-precision
of 15%. After 40 years of clinical experience, the conventional thermodilution method has
been generally accepted as the clinical standard to which all other methods are compared.
However, some serious complications can arise from PAC insertion like arrhythmias,
valvular lesions, rupture of the pulmonary artery and lung infarction.
(25
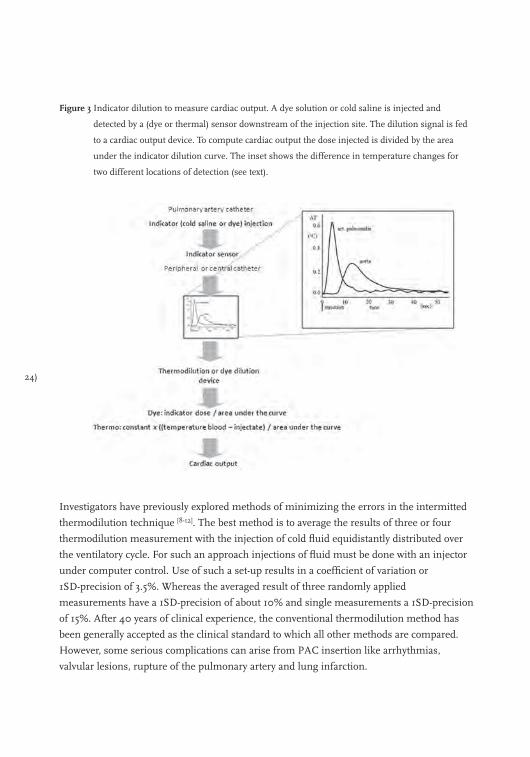
Figure 4 Schematic diagram of the working principle of the continuous thermodilution method.
PAC continuous cardiac output
The Vigilance system, (Edwards Lifescience, Irvine, CA, USA) combines heat-dilution
principles with stochastic system identification to measure cardiac output [13]. Small amounts
of thermal energy (heat-indicator) are transported directly into the blood in a pseudo random
on-off pattern to form the input signal (see Figure 4). The resulting blood temperature
changes are detected with a thermistor in the pulmonary artery. This signal is small in
proportion to the resident pulmonary artery thermal noise. To overcome this problem, a
cross correlation is carried out on the input signal and the temperature data measured in the
pulmonary artery, resulting in a thermodilution curve, as would have been found after a
bolus injection. From this dilution curve, cardiac output is computed using the classical
Stewart-Hamilton equation. The entire process is automated, requiring no user intervention.
A detailed explanation of the technique is given by Yelderman et al. [13]. The “continuous”
cardiac output measurement makes extensively use of averaging techniques, therefore, the
displayed cardiac output number represents the averaged value of the previous 1 to 6
minutes [13]. Under extreme clinical situations this delay can run up to 12 minutes [14]. This
property of the technique makes the method continuous but not instantaneous.
Concerns for the pulmonary thermodilution techniques
Recently, the use of both pulmonary artery thermodilution cardiac output methods has been
under discussion. Many physicians believe that the PAC due to its multi-purpose role is
useful for the diagnoses, treatment and assessment of volume status in critical ill patients [15].
However, this is not confounded by studies. In contrast, different investigators raised doubts
about the safety of the PAC. Indeed, most recent studies do not show a difference in
morbidity and mortality between patients with and without a PAC [16-18]. On the other hand,
26)
in these trials the introduction of the PAC could not be associated with an increase in
morbidity and mortality. The inability to demonstrate the merit of the PAC in predicting
outcome does not necessarily mean that our monitors using the PAC are not functioning [17].
It may also indicate a persisting lack of correct and consistent interpretation of PAC-derived
data among physicians [19] or ineffectiveness of our current therapeutic options in reversing
critical disease states. Thus, further investigation into the role of the PAC is feasible, likely
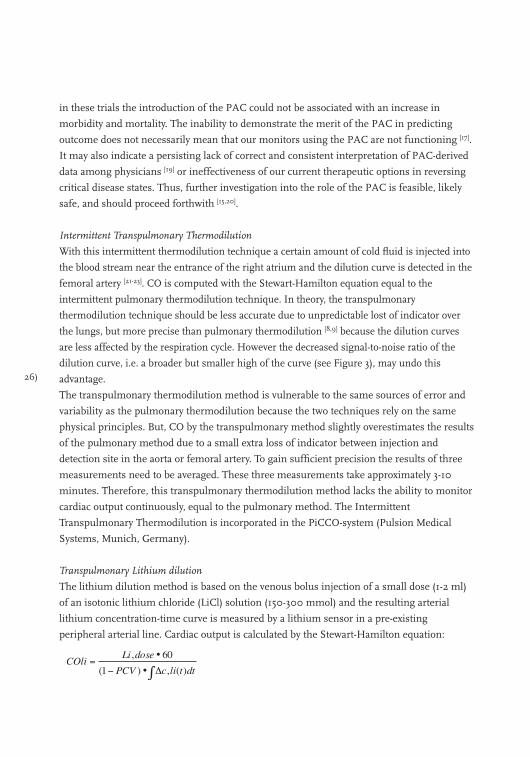
safe, and should proceed forthwith [15,20].
Intermittent Transpulmonary Thermodilution
With this intermittent thermodilution technique a certain amount of cold fluid is injected into
the blood stream near the entrance of the right atrium and the dilution curve is detected in the
femoral artery [21-23]. CO is computed with the Stewart-Hamilton equation equal to the
intermittent pulmonary thermodilution technique. In theory, the transpulmonary
thermodilution technique should be less accurate due to unpredictable lost of indicator over
the lungs, but more precise than pulmonary thermodilution [8,9] because the dilution curves
are less affected by the respiration cycle. However the decreased signal-to-noise ratio of the
dilution curve, i.e. a broader but smaller high of the curve (see Figure 3), may undo this
advantage.
The transpulmonary thermodilution method is vulnerable to the same sources of error and
variability as the pulmonary thermodilution because the two techniques rely on the same
physical principles. But, CO by the transpulmonary method slightly overestimates the results
of the pulmonary method due to a small extra loss of indicator between injection and
detection site in the aorta or femoral artery. To gain sufficient precision the results of three
measurements need to be averaged. These three measurements take approximately 3-10
minutes. Therefore, this transpulmonary thermodilution method lacks the ability to monitor
cardiac output continuously, equal to the pulmonary method. The Intermittent
Transpulmonary Thermodilution is incorporated in the PiCCO-system (Pulsion Medical
Systems, Munich, Germany).
Transpulmonary Lithium dilution
The lithium dilution method is based on the venous bolus injection of a small dose (1-2 ml)
of an isotonic lithium chloride (LiCl) solution (150-300 mmol) and the resulting arterial
lithium concentration-time curve is measured by a lithium sensor in a pre-existing
peripheral arterial line. Cardiac output is calculated by the Stewart-Hamilton equation:
(27
Where Li,dose is amount of lithium injected, ∫∆c,li(t)dt the area under the lithium dilution
curve and PCV the packed cell volume (calculated as the haemoglobin concentration (g.dL-1)
divided by 34). This correction is needed because lithium is only diluted in the plasma and
not in the red and white cells of blood [24]. The pharmacokinetics of intravenous lithium
administration is described [25]. No side effects have been reported. To achieve a good
precision with this technique, the results of three measurements should be measured [26].
The lithium dilution method is incorporated in the LiDCO system (LiDCO, London, UK).
Some of the concerns relate to the lithium dilution method are the need for repetitive blood
draws. Furthermore, the lithium dilution technique is contraindicated in patients using high
doses of neuromuscular blocking agents, because of interference with the sensing electrode.
The technique can not be used in patients receiving lithium therapy and is not licensed in
subjects weighing less than 40 kg.
Pulse contour cardiac output
The pulse contour devices are perhaps the most promising with respect to their ease of use.
The estimation of cardiac output via pulse contour analysis is an indirect method; CO is
computed from an arterial pressure pulsation on basis of a criterion or model. The origin of
the pulse contour method for estimation of beat-to-beat stroke volume goes back to the
classical Windkessel model described by Otto Frank in 1899 [27]. In principle the aortic
pressure waveform is the input of the Windkessel models of the systemic circulation. In
medical practice, the pressure waveform is not obtained from the aorta but from a peripheral
artery (radial or femoral), which requires a backward filtering from the peripheral to aorta
pressure. Not much is known about the algorithms applied. At present there are four
commercial pulse-contour cardiac output computers available; PiCCO, PRAM, LidCO,
Vigileo and Modelflow.
The PiCCO system
The PiCCO-system (Pulsion Medical Systems, Munich, Germany) uses a modified version of
Wesseling’s cZ algorithm [28,29]. It analyzes the actual shape and area under the pressure
waveform and uses individual aortic compliance and systemic vascular resistance. The
PiCCO algorithm is summarized in the following equation:
28)
Where: COpi, cardiac output; K, calibration factor; HR, heart rate; P, arterial blood pressure;
∫P(t)dt, area under the systolic part of the pressure curve; SVR, systemic vascular resistance;
C(P), pressure dependent arterial compliance; dP/dt, describes the shape of the pressure
wave. The calibration factor (K) is determined with transpulmonary thermodilution and
recalibration is needed after profound changes in SVR and at regular (≥ 1-hour) intervals [30-32]. Invasive catheterization is thus still required. For the PiCCO device both the radial and
the femoral artery approach can be used [33]. A basic overview of the computation of pulse
contour cardiac output is shown in Figure 5.
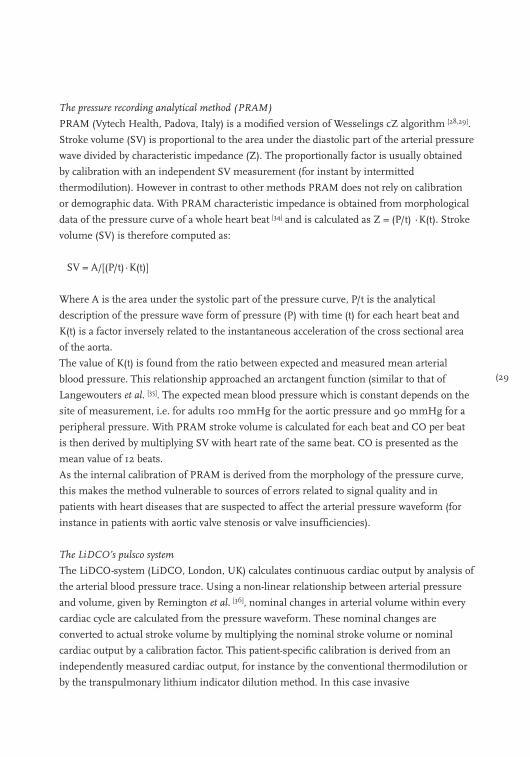
Figure 5 General working principle to estimate cardiac output by pulse contour analysis. A pressure signal
is conducted from the pressure sensor to a pulse contour cardiac output device. Together with
either calibration values obtained by transpulmonary thermodilution (PiCCO) or lithium dilution
(LidCO), and personal patient data the algorithm estimates aortic flow over a certain interval.
This is shown on the device as cardiac output.
(29
The pressure recording analytical method (PRAM)
PRAM (Vytech Health, Padova, Italy) is a modified version of Wesselings cZ algorithm [28,29].
Stroke volume (SV) is proportional to the area under the diastolic part of the arterial pressure
wave divided by characteristic impedance (Z). The proportionally factor is usually obtained
by calibration with an independent SV measurement (for instant by intermitted
thermodilution). However in contrast to other methods PRAM does not rely on calibration
or demographic data. With PRAM characteristic impedance is obtained from morphological
data of the pressure curve of a whole heart beat [34] and is calculated as Z = (P/t) ∙K(t). Stroke
volume (SV) is therefore computed as:
SV = A/[(P/t)∙K(t)]
Where A is the area under the systolic part of the pressure curve, P/t is the analytical
description of the pressure wave form of pressure (P) with time (t) for each heart beat and
K(t) is a factor inversely related to the instantaneous acceleration of the cross sectional area
of the aorta.
The value of K(t) is found from the ratio between expected and measured mean arterial
blood pressure. This relationship approached an arctangent function (similar to that of
Langewouters et al. [35]. The expected mean blood pressure which is constant depends on the
site of measurement, i.e. for adults 100 mmHg for the aortic pressure and 90 mmHg for a
peripheral pressure. With PRAM stroke volume is calculated for each beat and CO per beat
is then derived by multiplying SV with heart rate of the same beat. CO is presented as the
mean value of 12 beats.
As the internal calibration of PRAM is derived from the morphology of the pressure curve,
this makes the method vulnerable to sources of errors related to signal quality and in
patients with heart diseases that are suspected to affect the arterial pressure waveform (for
instance in patients with aortic valve stenosis or valve insufficiencies).
The LiDCO’s pulsco system
The LiDCO-system (LiDCO, London, UK) calculates continuous cardiac output by analysis of
the arterial blood pressure trace. Using a non-linear relationship between arterial pressure
and volume, given by Remington et al. [36], nominal changes in arterial volume within every
cardiac cycle are calculated from the pressure waveform. These nominal changes are
converted to actual stroke volume by multiplying the nominal stroke volume or nominal
cardiac output by a calibration factor. This patient-specific calibration is derived from an
independently measured cardiac output, for instance by the conventional thermodilution or
by the transpulmonary lithium indicator dilution method. In this case invasive
30)
catheterization with a PAC or an additional peripheral venous catheter is still necessary.
Recent data suggest recalibration every eight hours or whenever major hemodynamic
changes occur [37].
Vigileo/FloTrac system
The FloTrac/Vigileo (Edwards Lifesciences, Irvine, CA, USA) is a pulse contour technique
utilizing a dedicated pressure sensor (FloTrac) and a monitor to compute stroke volume and
cardiac output (Vigileo). It does not require an independent calibration. The cardiac output
algorithm is based on the principle that aortic pulse pressure is proportional to stroke
volume and inversely related to aortic compliance. The system obtains the pressure signal
from any standard peripheral arterial line. From the arterial pressure the standard deviation
(σAP) around mean arterial pressure (MAP) is computed over a 20-second interval. This
σAP is multiplied by a conversion factor Khi to calculated stroke volume. Khi incorporates a
multivariate polynomial equation which assesses the impact of the patient’s ever-changing
vascular tone on pulse pressure. It is calculated by analyzing the patient’s heart rate,
standard deviation σAP, mean arterial pressure, pressure dependent arterial compliance
estimated by patients demographics with the Langewouters equation [35], BSA body surface
area calculated from weight and height, skewness (symmetry) and kurtosis (distinctness of a
peak) of the beat-to-beat arterial waveform. Khi is updated and applied to the stroke volume
algorithm on a rolling 60-second average:
Stroke Volume (ml∙beat-1) = σAP (mmHg) ∙ Khi (ml∙mmHg-1)
Cardiac output is calculated by multiplying stroke volume with heart rate. The extensive use
of arterial pressure signal processing makes the FloTrac algorithm highly dependent upon a
high fidelity pressure signal. Therefore, attention to the quality of the pressure monitoring
signal by testing for optimal dampening and flushing of the arterial line is important.
Modelflow method
Fifteen years ago Wesseling and co-workers [29] discovered that a straightforward extension of
the classical Windkessel model could be adequate for pulse contour analysis. Modelflow
(FMS, Amsterdam, The Netherlands) is a three-element Windkessel model of the arterial
circulation, the model includes three principal components of opposition: characteristic
impedance which represents the opposition of the aorta to pulsatile inflow, Windkessel
compliance which represents the opposition of the aorta to volume increases, and peripheral
resistance which represents the opposition of the vascular beds to the drainage of blood.
Aortic compliance is not constant but depends besides demographic data of the patient
(31
(gender, age, weight and height) on arterial pressure itself [35]. Aortic characteristic
impedance, in contrast to compliance increases moderately with pressure. Systemic
peripheral resistance depends on many factors including circulatory filling, metabolism,
sympatic tone and the presence of vasoactive drugs. The Modelflow method simulates this
behaviour. The modelflow method uses a peripheral arterial pressure and can be applied
uncalibrated by using demographic data of the subject as well as calibrated. For calibration
an independent measure of cardiac output [38] or a measure of the cross sectional area of the
aorta can be used [39]. A more detailed description of the method can be found elsewhere [29,38].
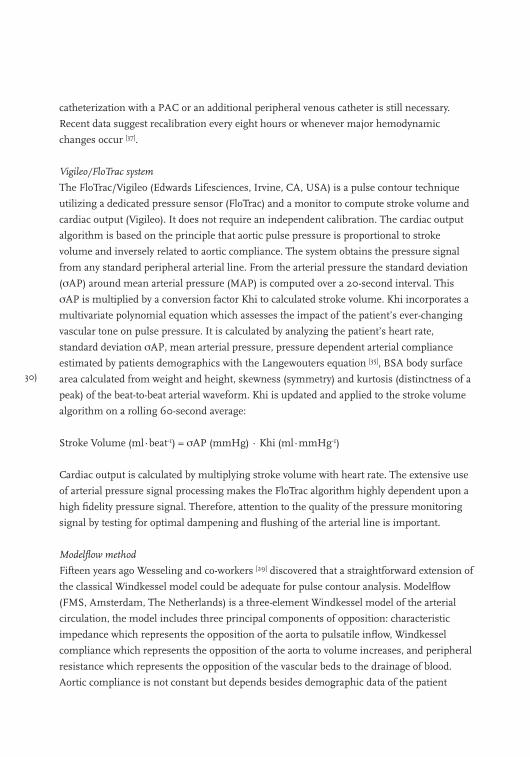
Figure 6 Effects of damped radial artery pressure on LidCO pulse contour output of an individual patient.
Upper panel systolic (Sys), diastolic (Dia) and mean (MAP) radial artery pressure (Prad). Bottom
panel cardiac output by PulseCO (CCO).
32)
General concerns for pulse contour methods.
All pulse contour systems are based on a mathematical model and not on a mass balance as
the indicator dilution and Fick method do. This implies that deviations of the model to the
physiological reality have consequences for the estimated cardiac output. Growing
knowledge of the arterial circulation and increasing computation possibilities has led to
different software versions of the different methods. This complicates reviewing these
methods. We selected only those papers that make use of recent software versions.
Furthermore, with a peripheral arterial pressure as input of the model instead of aortic
pressure, loss of signal quality may be crucial. An example of the effect of loss of signal
quality on blood pressure and cardiac output is shown in Figure 6.
Echo-Doppler ultrasound methods
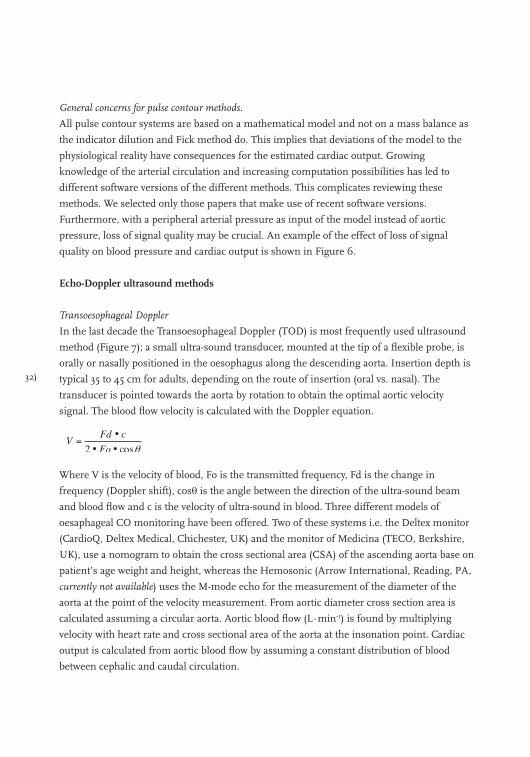
Transoesophageal Doppler
In the last decade the Transoesophageal Doppler (TOD) is most frequently used ultrasound
method (Figure 7); a small ultra-sound transducer, mounted at the tip of a flexible probe, is
orally or nasally positioned in the oesophagus along the descending aorta. Insertion depth is
typical 35 to 45 cm for adults, depending on the route of insertion (oral vs. nasal). The
transducer is pointed towards the aorta by rotation to obtain the optimal aortic velocity
signal. The blood flow velocity is calculated with the Doppler equation.
Where V is the velocity of blood, Fo is the transmitted frequency, Fd is the change in
frequency (Doppler shift), cosθ is the angle between the direction of the ultra-sound beam
and blood flow and c is the velocity of ultra-sound in blood. Three different models of
oesaphageal CO monitoring have been offered. Two of these systems i.e. the Deltex monitor
(CardioQ, Deltex Medical, Chichester, UK) and the monitor of Medicina (TECO, Berkshire,
UK), use a nomogram to obtain the cross sectional area (CSA) of the ascending aorta base on
patient’s age weight and height, whereas the Hemosonic (Arrow International, Reading, PA,
currently not available) uses the M-mode echo for the measurement of the diameter of the
aorta at the point of the velocity measurement. From aortic diameter cross section area is
calculated assuming a circular aorta. Aortic blood flow (L∙min-1) is found by multiplying
velocity with heart rate and cross sectional area of the aorta at the insonation point. Cardiac
output is calculated from aortic blood flow by assuming a constant distribution of blood
between cephalic and caudal circulation.
(33
Figure 7 Transoesophageal probe geometry. Blood flow velocity is measured by the Doppler beam using
the well known Doppler principle. Aortic diameter is determined by the echographic beam by
measuring the distance between the backward scatter of the proximal and distal aortic wall. From
this distance the cross sectional area of the aorta is calculated.
It is however questionable whether this partitioning of blood streams is constant under a
variety of patho-physiological circumstances [40,41]. Most obvious concerns with the technique
are angle of insonation and the fixation of the transducer with respect to the blood flow,
especially during subject movements. This has led to the conclusion that the method is
operator dependent [42] and that additional training is required. Another point of concern is
the use of a nomogram to estimated CSA. It is clearly that a nomogram for CSA is based on
group averages with may include large individual difference. Also CSA has been found
pressure dependent [35]. Lastly, the technique is poorly tolerated in awake non-intubated
subjects and cannot be used in subject with an oesophageal disorder.
In a meta-analysis of Dark and Singer in 2004 [43], the authors concluded that the TOD
estimates absolute cardiac output with minimal bias but limited agreement. However, the
semi-invasive TOD technique enables trend monitoring of CO as long as the probe position
is not changed.
Transthoracic Doppler
Transthoracic Doppler (TTD) is an entirely non-invasive method using a ultrasound probe
positioned in the jugular notch to obtain blood velocity in the outflow of the left ventricle.

34)
The method is in essence equal to oesophageal Doppler technique. Cardiac output is
calculated by measuring the cross sectional area of the aortic valve together with the velocity
profile in the outflow track. However, is may be very difficult to identify the aortic root in
some subjects. In these cases the outflow over the pulmonary valve may be used. Although it
is possible to orientate the ultrasound beam in the assumed 0 degree direction of blood flow
and perpendicular on the valve, in practice this is difficult to realize. The alignment is
affected by operator skill, anatomy and subject movements (for instance during breathing).
Consequently the technique has a larger inter- and intra-observer variability and larger limits
of agreement compared to reference methods than the transoesophageal method. The
portable and non-invasive character of the method allows use in many settings with patients
in supine position.
Thoracic electrical bioimpedance
Electrical bioimpedance was introduced five decades ago as an inexpensive and non-
invasiveness cardiac output method. A high-frequency alternating electrical current with low
amplitude is applied to the thorax via two electrodes. The resulting voltage is measured with
two other electrodes, positioned in between the current electrodes. The measured changes in
bio-impedance are thought to be related to changes in cardiac related blood volume. A
mathematical conversion is used to translate the change in bioimpedance into cardiac
output. Several formulas exist for this conversion. These formulas and their nuances go well
beyond the scope of this review. A more detailed description can be found in a review of de
Waal and co-workers [44]. The over-simplifications of physiological reality by mathematical
equations, motion artefacts, abnormal thoracic anatomy, cardiac valve disease, thoracic
shunts and arrhythmias contribute to the inaccuracy of this method. In a large meta-analysis
of three decades of validation studies on thoracic impedance cardiography Raaijmakers et al. [45] concluded that a better physical-physiological model in combination with improvements
on the impedance CO-equation are still needed.
We expect this aspect accounts also for the recently developed bio-reactance technology
(Biorectance, Cheetah Medical Inc., Indianapolis USA). This method is based on the
observation that blood volume changes induce small changes in frequency and phase of the
electrical signal propagating across the thorax. These small changes have been shown to
correlate with stroke volume [46].
How to evaluate the different cardiac output measurement methods?
Bland and Altman [47,48] proposed that bias (the mean difference between the techniques)
±2SD-precision is an appropriate indication of agreement between techniques. Here bias is the
systematic error and the standard deviation (SD) of the differences is the random error
(35
between methods. Thus the limits of agreement (bias ± 2SD) involve the combination of errors
of each measurement technique.
In the present review on cardiac output methods a lack of consistency was found in the
presentation of results. Regularly the method under study is compared to thermodilution by
linear regression analysis also known as calibration statistic, presenting the regression
coefficients of the line together with the correlation coefficient. Bland and Altman [47,48] in
their statistical notes pointed out that it could be highly misleading to analyse data pairs by
combining repeated observations from several patients and then calculating standard
regressions and correlation coefficients.
Critchley and Critchley [49], in an effort to establish objective criteria for judging the accuracy
and reproducibility of cardiac output measurement state that: if a ‘new’ method is to replace
an older, established method, the new method should itself have errors not greater than the
older method. Therefore, knowledge and a careful application of the older method as a
reliable reference method are essential for a good evaluation of a new technique. Otherwise,
the difference between the evaluated method and the reference method could be determined
mainly by the reference method. In an example Critchley and Critchley [49] showed that if the
reference technique has a 2SD-precision of ±20%, then a new method may have also a
2SD-precision of 20% to be acceptable. According to Pythagoras’ law, the limits of
agreement in the Bland-Altman plot should be less than ±28%, i.e. √(202+202), to conclude
for agreement between methods. This example has led to an oversimplification in
comparison of methods and many authors conclude that the Bland-Altman limits of
agreement should be less than ±30% to accept the new measurement technique. Based on
the fact that the 2SD-precision of reference method may be less than 20%, the criteria of
30% derived from Bland-Altman analysis is highly misleading. Therefore, evaluation studies
should provide the precision of the reference method. In addition to the above discussion
about the evaluation of new methods, we should realize that a proper evaluation method of
continuous cardiac output methods is still awaited [50].
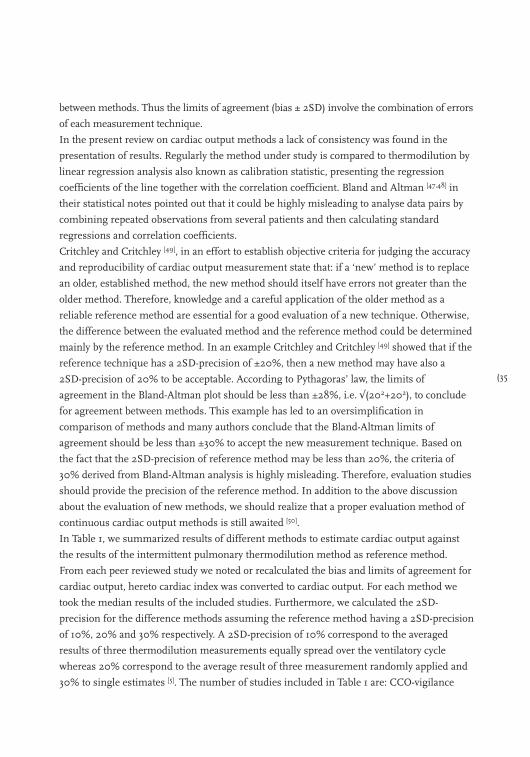
In Table 1, we summarized results of different methods to estimate cardiac output against
the results of the intermittent pulmonary thermodilution method as reference method.
From each peer reviewed study we noted or recalculated the bias and limits of agreement for
cardiac output, hereto cardiac index was converted to cardiac output. For each method we
took the median results of the included studies. Furthermore, we calculated the 2SD-
precision for the difference methods assuming the reference method having a 2SD-precision
of 10%, 20% and 30% respectively. A 2SD-precision of 10% correspond to the averaged
results of three thermodilution measurements equally spread over the ventilatory cycle
whereas 20% correspond to the average result of three measurement randomly applied and
30% to single estimates [5]. The number of studies included in Table 1 are: CCO-vigilance
36)
thermodilution method 13 [13,51-62]; transpulmonary thermodilution method 5 [62-66];
transpulmonary lithium dilution method 4 [67-70]; the Fick CO2-rebreathing method 5 [3,71-75];
calibrated Modelflow method 5 [29,38,76-78]; uncalibrated Modelflow 4 [38,78-80]; PiCCOplus 7 [62,76,81-84], only results with software version 4.x and later are used; LiDCOplus 5 [69,70,85-87];
PRAM 3 [34,88,89]; FloTrack-Vigileo 9 [79,84,90-96], only results of software version 1.07 and later are
selected. No data of ultrasound methods are included because not enough of these methods
were compared to thermodilution cardiac output except for the HemoSonic [79,97-99] which is
however out of production at the moment. Also, the results of the impedance method were
excluded because Raaymakers et al. [45] in a meta-analysis concluded already for insufficient
agreement with reference methods. From the data given in Table 1, we may learn that none of
the methods can replace the averaged results of three measurement with pulmonary artery
intermittent thermodilution equally distributed over the ventilatory cycle (2SD<10%).
Transpulmonary thermodilution, transpulmonary lithium dilution both with the averaged
results of three measurements, calibrated Modelflow and LiDCOplus pulse contour may replace
the pulmonary artery thermodilution with the results of 3 randomly applied measurements. All
methods can replace single thermodilution estimates with a 2SD-precision of 30%.
Table 1 Median results for different methods in comparison to intermitted pulmonary thermodilution
cardiac output.
Method N observations Differences with COpaCalculated 2SD-precision with
Precision Limitations
Bias2SD-
precision2SDpa=10%
2SDpa=20%
2SDpa=30%
L∙min-1 % % % % %
Indicator dilution
CCO-Vigilance 3439 0.03 0.55 27 25 18 6
transpulmonary TD 818 0.43 7.74 21 18 7 0
transpulmonary LiD 245 -0.03 -0.55 26 23 16 0
Fick
CO2-rebreathing 601 -0.25 -4.35 35 34 29 19
Pulse Contour
Modelflow-calibrated 995 0.00 0.00 17 16 0 0
Modelflow-noncalibrated 924 0.31 5.63 31 29 23 7
PiCCOplus 1802 0.04 0.73 32 30 25 10
LiCCOplus 452 0.05 0.91 24 22 13 0
FloTrac-Vigileo 1777 0.25 4.55 41 40 36 29
N obs, total number of obersevation; COpa, cardiac output by intermittent pulmonary thermodilution
(37
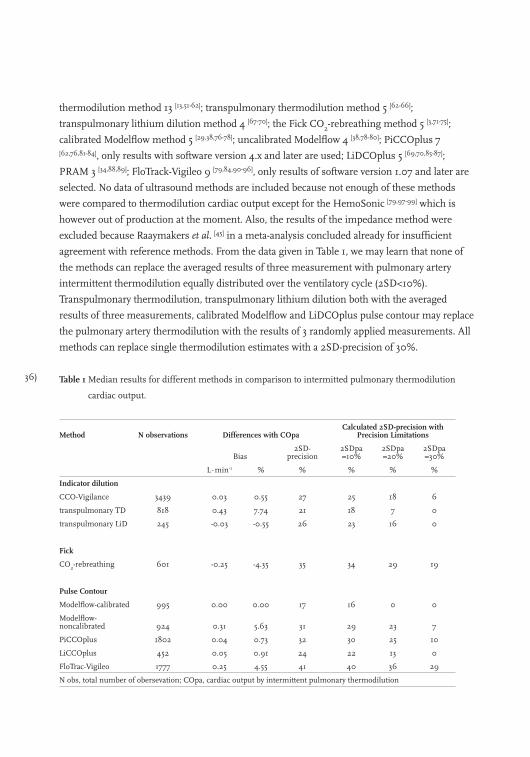
Table 2 Overview of characteristics for different methods to measure cardiac output.
CO method Invasiveness Response Accuracy Precision Limitations
Fick O2 +++ Intermittent High Moderate Requires a PAC for venous O2 and spirometer or mechanical ventilator. Labor intensive technique
Fick CO2 + Slow Low Low Subject must be on ventilator Errors due to shunts
PAC Td bolus +++ Intermittent High High Special precaution during mechanical ventilation Requires a PAC and triplicate measurement
PAC CCO +++ Continuous Moderate Moderate Requires a PAC and triplicate measurement
TP Td bolus ++ Intermittent High High Requires a PAC and triplicate measurement
TP Li bolus ++ Intermittent Moderate Moderate Requires only arterial catheter but needs triplicate measurement for sufficient agreement with reference methods
PiCCO ++ Beat-to-beat Moderate Moderate Requires frequent calibration with independant (other) method
LiDCO ++ Beat-to-beat Moderate Moderate Requires frequent calibration with independant (other) method or lithium indicator method
Vigileo ++ Beat-to-beat Moderate High Needs specific sensor
Modelflow ++ Beat-to-beat High High Needs femoral or radial arterial catheter
TOD + Continuous High Low Not well tolerated in awake subjects and transducer position difficulty
TTE - Continuous Moderate Low Large inter-operator variability
Bioimpedance - Continuous Low Low Artifacts due to anatomic variations, shunt, movement, electrical noise
CO is cardiac output, CCO is continuous cardiac output, Li is Lithium, PAC is pulmonary artery catheter, Td is thermodilution, TOD is transoesophageal Doppler, TP is transpulmonary, TTE is transthoracic echography.

38)
Conclusion
Many methods to measure cardiac output are available (see Table 2). None of the methods
studied fulfil the criteria of accuracy, precision, operator independence, fast responding,
non-invasiveness, continuous measurement, easy of use, low cost and without
complications. The Fick for O2, for instance, is labor intensive and invasive but highly
accurate and precise. The continuous thermodilution method does not have a fast response,
needs skilled physicians to introduce the PAC and is invasive. The pulse contour methods
add no invasiveness give beat-to-beat cardiac output and are easy to use. The ultrasound
methods have large inter-intra observer variability. The transpulmonary indicator dilution
methods score better in accuracy and precision. The ultrasound methods are limited by large
inter-intra observer variability. With respect to precision and accuracy, all methods can
replace single thermodilution estimates with a 2SD-precision of 30%, most can replace the
averaged result of three randomly applied intermittent thermodilution measurements but
none can replace the averaged results of three estimates equally distributed over the
ventilatory cycle.

(39
References
1. Prys-Roberts C. The measurement of cardiac output. Br J Anaesth 1969; 41: 751-760.
2. Ultman JS, Bursztein S. Analysis of error in the determination of respiratory gas exchange at varying FIO2.
J Appl Physiol 1981; 50: 210-216.
3. Tachibana K, Imanaka H, Takeuchi M, et al. Noninvasive cardiac output measurement using partial carbon
dioxide rebreathing is less accurate at settings of reduced minute ventilation and when spontaneous
breathing is present. Anesthesiology 2003; 98: 830-837.
4. Gueret G, Kiss G, Rossignol B, et al. Cardiac output measurements in off-pump coronary surgery:
comparison between NICO and the Swan-Ganz catheter. Eur J Anaesthesiol 2006; 23: 848-854.
5. Jansen JR. The thermodilution method for the clinical assessment of cardiac output. Intensive Care Med
1995; 21: 691-697.
6. Breukers RB, Jansen JR. Pulmonary artery thermodilution cardiac output vs. transpulmonary
thermodilution cardiac output in two patients with intrathoracic pathology. Acta Anaesthesiol Scand 2004;
48: 658-661.
7. Swan HJ, Ganz W, Forrester J, et al. Catheterization of the heart in man with use of a flow-directed
balloon-tipped catheter. N Engl J Med 1970; 283: 447-451.
8. Jansen JR, Schreuder JJ, Settels JJ, et al. Single injection thermodilution. A flow-corrected method.
Anesthesiology 1996; 85: 481-490.
9. Jansen JR, Schreuder JJ, Punt KD, van den Berg PC, Alfieri O. Mean cardiac output by thermodilution with
a single controlled injection. Crit Care Med 2001; 29: 1868-1873.
10. Jansen JR, Schreuder JJ, Bogaard JM, van Rooyen W, Versprille A. Thermodilution technique for
measurement of cardiac output during artificial ventilation. J Appl Physiol 1981; 51: 584-591.
11. Jansen JR, Versprille A. Improvement of cardiac output estimation by the thermodilution method during
mechanical ventilation. Intensive Care Med 1986; 12: 71-79.
12. Jansen JR, Schreuder JJ, Settels JJ, Kloek JJ, Versprille A. An adequate strategy for the thermodilution
technique in patients during mechanical ventilation. Intensive Care Med 1990; 16: 422-425.
13. Yelderman M. Continuous measurement of cardiac output with the use of stochastic system identification
techniques. J Clin Monit 1990; 6: 322-332.
14. Aranda M, Mihm FG, Garrett S, Mihm MN, Pearl RG. Continuous cardiac output catheters: delay in in vitro
response time after controlled flow changes. Anesthesiology 1998; 89: 1592-1595.
15. Vincent JL, Pinsky MR, Sprung CL, et al. The pulmonary artery catheter: in medio virtus. Crit Care Med
2008; 36: 3093-3096.
16. Harvey S, Harrison DA, Singer M, et al. Assessment of the clinical effectiveness of pulmonary artery
catheters in management of patients in intensive care (PAC-Man): a randomised controlled trial. Lancet
2005; 366: 472-477.
17. Sandham JD, Hull RD, Brant RF, et al. A randomized, controlled trial of the use of pulmonary-artery
catheters in high-risk surgical patients. N Engl J Med 2003; 348: 5-14.
18. Richard C, Warszawski J, Anguel N, et al. Early use of the pulmonary artery catheter and outcomes in
patients with shock and acute respiratory distress syndrome: a randomized controlled trial. JAMA 2003;
290: 2713-2720.
19. Squara P, Bennett D, Perret C. Pulmonary artery catheter: does the problem lie in the users? Chest 2002;
121: 2009-2015.
20. Fowler RA, Cook DJ. The arc of the pulmonary artery catheter. JAMA 2003; 290: 2732-2734.

40)
21. Tibby SM, Hatherill M, Marsh MJ, et al. Clinical validation of cardiac output measurements using femoral artery
thermodilution with direct Fick in ventilated children and infants. Intensive Care Med 1997; 23: 987-991.
22. Sakka SG, Bredle DL, Reinhart K, Meier-Hellmann A. Comparison between intrathoracic blood volume and
cardiac filling pressures in the early phase of hemodynamic instability of patients with sepsis or septic
shock. J Crit Care 1999; 14: 78-83.
23. Pauli C, Fakler U, Genz T, et al. Cardiac output determination in children: equivalence of the
transpulmonary thermodilution method to the direct Fick principle. Intensive Care Med 2002; 28: 947-952.
24. Band DM, Linton RA, O’Brien TK, Jonas MM, Linton NW. The shape of indicator dilution curves used for
cardiac output measurement in man. J Physiol 1997; 498 ( Pt 1): 225-229.
25. Jonas MM, Lint RAF, O’Brein TK, et al. The pharmacokinetics of intravenous lithium chloride in patients
and normal volunteers. Journal of Trace and Microprobe Techniques 2001; 19: 313-320.
26. Cecconi M, Fawcett J, Grounds RM, Rhodes A. A prospective study to evaluate the accuracy of pulse power
analysis to monitor cardiac output in critically ill patients. BMC Anesthesiol 2008; 8: 3.
27. Frank O. Die Gründform des arterielen Pulses erste Abhandlung: mathematische Analyse. Z Biol 1899; 483-526.
28. Jansen JR, Wesseling KH, Settels JJ, Schreuder JJ. Continuous cardiac output monitoring by pulse contour
during cardiac surgery. Eur Heart J 1990; 11 Suppl I: 26-32.
29. Wesseling KH, Jansen JR, Settels JJ, Schreuder JJ. Computation of aortic flow from pressure in humans
using a nonlinear, three-element model. J Appl Physiol 1993; 74: 2566-2573.
30. Halvorsen PS, Sokolov A, Cvancarova M, et al. Continuous cardiac output during off-pump coronary artery
bypass surgery: pulse-contour analyses vs pulmonary artery thermodilution. Br J Anaesth 2007; 99: 484-492.
31. Johansson A, Chew M. Reliability of continuous pulse contour cardiac output measurement during
hemodynamic instability. J Clin Monit Comput 2007; 21: 237-242.
32. Hamzaoui O, Monnet X, Richard C, et al. Effects of changes in vascular tone on the agreement between
pulse contour and transpulmonary thermodilution cardiac output measurements within an up to 6-hour
calibration-free period. Crit Care Med 2008; 36: 434-440.
33. de Wilde RB, Breukers RB, van den Berg PC, Jansen JR. Monitoring cardiac output using the femoral and
radial arterial pressure waveform. Anaesthesia 2006; 61: 743-746.
34. Romano SM, Pistolesi M. Assessment of cardiac output from systemic arterial pressure in humans. Crit
Care Med 2002; 30: 1834-1841.
35. Langewouters GJ, Wesseling KH, Goedhard WJ. The static elastic properties of 45 human thoracic and 20
abdominal aortas in vitro and the parameters of a new model. J Biomech 1984; 17: 425-435.
36. Remington JW, Noback CR. Volume elasticity characteristics of the human aorta and prediction of the stroke
volume from the pressure pulse. Am J Physiol 1948; 153: 298-308.
37. Cecconi M, Dawson D, Grounds RM, Rhodes A. Lithium dilution cardiac output measurement in the
critically ill patient: determination of precision of the technique. Intensive Care Med 2009; 35: 498-504.
38. Jansen JR, Schreuder JJ, Mulier JP, et al. A comparison of cardiac output derived from the arterial pressure
wave against thermodilution in cardiac surgery patients. Br J Anaesth 2001; 87: 212-222.
39. de Vaal JB, de Wilde RB, van den Berg PC, Schreuder JJ, Jansen JR. Less invasive determination of cardiac
output from the arterial pressure by aortic diameter-calibrated pulse contour. Br J Anaesth 2005; 95: 326-331.
40. Turner MA. Doppler-based hemodynamic monitoring: a minimally invasive alternative. AACN Clin Issues
2003; 14: 220-231.
41. Cholley BP, Singer M. Esophageal Doppler: noninvasive cardiac output monitor. Echocardiography 2003;
20: 763-769.
42. Spahn DR, Schmid ER, Tornic M, et al. Noninvasive versus invasive assessment of cardiac output after
cardiac surgery: clinical validation. J Cardiothorac Anesth. 1990; 4: 46-59.

(41
43. Dark PM, Singer M. The validity of trans-esophageal Doppler ultrasonography as a measure of cardiac
output in critically ill adults. Intensive Care Med 2004; 30: 2060-2066.
44. de Waal EE, Konings MK, Kalkman CJ, Buhre WF. Assessment of stroke volume index with three different
bioimpedance algorithms: lack of agreement compared to thermodilution. Intensive Care Med 2008; 34:
735-739.
45. Raaijmakers E, Faes TJ, Scholten RJ, Goovaerts HG, Heethaar RM. A meta-analysis of three decades of
validating thoracic impedance cardiography. Crit Care Med 1999; 27: 1203-1213.
46. Raval NY, Squara P, Cleman M, et al. Multicenter evaluation of noninvasive cardiac output measurement by
bioreactance technique. J Clin Monit Comput 2008; 22: 113-119.
47. Bland JM, Altman DG. Calculating correlation coefficients with repeated observations: Part 2--Correlation
between subjects. BMJ 1995; 310: 633.
48. Bland JM, Altman DG. Calculating correlation coefficients with repeated observations: Part 1--Correlation
within subjects. BMJ 1995; 310: 446.
49. Critchley LA, Critchley JA. A meta-analysis of studies using bias and precision statistics to compare cardiac
output measurement techniques. J Clin Monit Comput 1999; 15: 85-91.
50. Cecconi M, Rhodes A. Validation of continuous cardiac output technologies: consensus still awaited. Crit
Care 2009; 13: 159.
51. Schmid ER, Schmidlin D, Tornic M, Seifert B. Continuous thermodilution cardiac output: clinical validation
against a reference technique of known accuracy. Intensive Care Med 1999; 25: 166-172.
52. Jakobsen CJ, Melsen NC, Andresen EB. Continuous cardiac output measurements in the perioperative
period. Acta Anaesthesiol Scand 1995; 39: 485-488.
53. Haller M, Zollner C, Briegel J, Forst H. Evaluation of a new continuous thermodilution cardiac output
monitor in critically ill patients: a prospective criterion standard study. Crit Care Med 1995; 23: 860-866.
54. Boldt J, Menges T, Wollbruck M, Hammermann H, Hempelmann G. Is continuous cardiac output
measurement using thermodilution reliable in the critically ill patient? Crit Care Med 1994; 22: 1913-1918.
55. Rauch H, Muller M, Fleischer F, et al. Pulse contour analysis versus thermodilution in cardiac surgery
patients. Acta Anaesthesiol Scand 2002; 46: 424-429.
56. Bottiger BW, Soder M, Rauch H, et al. Semi-continuous versus injectate cardiac output measurement in
intensive care patients after cardiac surgery. Intensive Care Med 1996; 22: 312-318.
57. Bottiger BW, Rauch H, Bohrer H, et al. Continuous versus intermittent cardiac output measurement in
cardiac surgical patients undergoing hypothermic cardiopulmonary bypass. J Cardiothorac Vasc Anesth
1995; 9: 405-411.
58. Bottiger BW, Sinner B, Motsch J, et al. Continuous versus intermittent thermodilution cardiac output
measurement during orthotopic liver transplantation. Anaesthesia 1997; 52: 207-214.
59. Hogue CW, Jr., Rosenbloom M, McCawley C, Lappas DG. Comparison of cardiac output measurement by
continuous thermodilution with electromagnetometry in adult cardiac surgical patients. J Cardiothorac Vasc
Anesth 1994; 8: 631-635.
60. Singh A, Juneja R, Mehta Y, Trehan N. Comparison of continuous, stat, and intermittent cardiac output
measurements in patients undergoing minimally invasive direct coronary artery bypass surgery. J
Cardiothorac Vasc Anesth 2002; 16: 186-190.
61. Della Rocca RG, Costa MG, Coccia C, et al.Cardiac output monitoring: aortic transpulmonary thermodilution
and pulse contour analysis agree with standard thermodilution methods in patients undergoing lung
transplantation. Can J Anaesth 2003; 50: 707-711.
62. Della Rocca G., Costa MG, Pompei L, Coccia C, Pietropaoli P. Continuous and intermittent cardiac output
measurement: pulmonary artery catheter versus aortic transpulmonary technique. Br J Anaesth 2002; 88: 350-356.
42)
63. Holm C, Melcer B, Horbrand F, Henckel vD, Muhlbauer W. Arterial thermodilution: an alternative to
pulmonary artery catheter for cardiac output assessment in burn patients. Burns 2001; 27: 161-166.
64. Felbinger TW, Reuter DA, Eltzschig HK, Bayerlein J, Goetz AE. Cardiac index measurements during rapid
preload changes: a comparison of pulmonary artery thermodilution with arterial pulse contour analysis. J
Clin Anesth 2005; 17: 241-248.
65. Friesecke S, Heinrich A, Abel P, Felix SB. Comparison of pulmonary artery and aortic transpulmonary
thermodilution for monitoring of cardiac output in patients with severe heart failure: validation of a novel
method. Crit Care Med 2009; 37: 119-123.
66. Wiesenack C, Prasser C, Keyl C, Rodig G. Assessment of intrathoracic blood volume as an indicator of
cardiac preload: single transpulmonary thermodilution technique versus assessment of pressure preload
parameters derived from a pulmonary artery catheter. J Cardiothorac Vasc Anesth 2001; 15: 584-588.
67. Linton RA, Jonas MM, Tibby SM, et al. Cardiac output measured by lithium dilution and transpulmonary
thermodilution in patients in a paediatric intensive care unit. Intensive Care Med 2000; 26: 1507-1511.
68. Linton RA, Band DM, Haire KM. A new method of measuring cardiac output in man using lithium dilution.
Br J Anaesth 1993; 71: 262-266.
69. Costa MG, Della Rocca G, Chiarandini P, et al. Continuous and intermittent cardiac output measurement in
hyperdynamic conditions: pulmonary artery catheter vs. lithium dilution technique. Intensive Care Med
2008; 34: 257-263.
70. Garcia-Rodriguez C, Pittman J, Cassell CH, et al. Lithium dilution cardiac output measurement: a clinical
assessment of central venous and peripheral venous indicator injection. Crit Care Med 2002; 30: 2199-2204.
71. Nilsson LB, Eldrup N, Berthelsen PG. Lack of agreement between thermodilution and carbon dioxide-
rebreathing cardiac output. Acta Anaesthesiol Scand 2001; 45: 680-685.
72. Kotake Y, Moriyama K, Innami Y, et al. Performance of noninvasive partial CO2 rebreathing cardiac output
and continuous thermodilution cardiac output in patients undergoing aortic reconstruction surgery.
Anesthesiology 2003; 99: 283-288.
73. Odenstedt H, Stenqvist O, Lundin S. Clinical evaluation of a partial CO2 rebreathing technique for cardiac
output monitoring in critically ill patients. Acta Anaesthesiol Scand 2002; 46: 152-159.
74. Rocco M, Spadetta G, Morelli A, et al. A comparative evaluation of thermodilution and partial CO2
rebreathing techniques for cardiac output assessment in critically ill patients during assisted ventilation.
Intensive Care Med 2004; 30: 82-87.
75. Tachibana K, Imanaka H, Takeuchi M, et al. Effects of reduced rebreathing time, in spontaneously breathing
patients, on respiratory effort and accuracy in cardiac output measurement when using a partial carbon
dioxide rebreathing technique: a prospective observational study. Crit Care 2005; 9: R569-R574.
76. de Wilde RB, Schreuder JJ, van den Berg PC, Jansen JR. An evaluation of cardiac output by five arterial pulse
contour techniques during cardiac surgery. Anaesthesia 2007; 62: 760-768.
77. Jellema WT, Wesseling KH, Groeneveld AB, et al. Continuous cardiac output in septic shock by simulating a
model of the aortic input impedance: a comparison with bolus injection thermodilution. Anesthesiology
1999; 90: 1317-1328.
78. Harms MP, Wesseling KH, Pott F, et al. Continuous stroke volume monitoring by modelling flow from
non-invasive measurement of arterial pressure in humans under orthostatic stress. Clin Sci (Lond) 1999; 97:
291-301.
79. de Wilde RB, Geerts BF, Cui J, van den Berg PC, Jansen JR. Performance of three minimally invasive cardiac
output monitoring systems. Anaesthesia 2009; 64: 762-769.
80. Hirschl MM, Binder M, Gwechenberger M, et al. Noninvasive assessment of cardiac output in critically ill
patients by analysis of the finger blood pressure waveform. Crit Care Med 1997; 25: 1909-1914.
(43
81. Mielck F, Buhre W, Hanekop G, et al. Comparison of continuous cardiac output measurements in patients
after cardiac surgery. J Cardiothorac Vasc Anesth 2003; 17: 211-216.
82. Godje O, Hoke K, Goetz AE, et al. Reliability of a new algorithm for continuous cardiac output
determination by pulse-contour analysis during hemodynamic instability. Crit Care Med 2002; 30: 52-58.
83. Felbinger TW, Reuter DA, Eltzschig HK, et al. Comparison of pulmonary arterial thermodilution and arterial
pulse contour analysis: evaluation of a new algorithm. J Clin Anesth 2002; 14: 296-301.
84. Della Rocca G, Costa MG, Chiarandini P, et al. Arterial pulse cardiac output agreement with thermodilution
in patients in hyperdynamic conditions. J Cardiothorac Vasc Anesth 2008; 22: 681-687.
85. Jonas MM, Tanser SJ. Lithium dilution measurement of cardiac output and arterial pulse waveform analysis:
an indicator dilution calibrated beat-by-beat system for continuous estimation of cardiac output. Curr Opin
Crit Care 2002; 8: 257-261.
86. Hamilton TT, Huber LM, Jessen ME. PulseCO: a less-invasive method to monitor cardiac output from
arterial pressure after cardiac surgery. Ann Thorac Surg 2002; 74: S1408-S1412.
87. Linton R, Band D, O’Brien T, Jonas M, Leach R. Lithium dilution cardiac output measurement: a
comparison with thermodilution. Crit Care Med 1997; 25: 1796-1800.
88. Zangrillo A, Maj G, Monaco F, et al. Cardiac index validation using the pressure recording analytic method
in unstable patients. J Cardiothorac Vasc Anesth 2010; 24: 265-269.
89. Romagnoli S, Romano SM, Bevilacqua S, et al. Cardiac output by arterial pulse contour: reliability under
hemodynamic derangements. Interact.Cardiovasc Thorac Surg 2009; 8: 642-646.
90. Button D, Weibel L, Reuthebuch O, et al. Clinical evaluation of the FloTrac/Vigileo system and two
established continuous cardiac output monitoring devices in patients undergoing cardiac surgery. Br J
Anaesth 2007; 99: 329-336.
91. McGee WT, Horswell JL, Calderon J, et al. Validation of a continuous, arterial pressure-based cardiac output
measurement: a multicenter, prospective clinical trial. Crit Care 2007; 11: R105.
92. Mayer J, Boldt J, Beschmann R, Stephan A, Suttner S. Uncalibrated arterial pressure waveform analysis for
less-invasive cardiac output determination in obese patients undergoing cardiac surgery. Br J Anaesth 2009;
103: 185-190.
93. Mayer J, Boldt J, Wolf MW, Lang J, Suttner S. Cardiac output derived from arterial pressure waveform
analysis in patients undergoing cardiac surgery: validity of a second generation device. Anesth Analg 2008;
106: 867-72.
94. Breukers RM, Sepehrkhouy S, Spiegelenberg SR, Groeneveld AB. Cardiac output measured by a new arterial
pressure waveform analysis method without calibration compared with thermodilution after cardiac surgery.
J Cardiothorac Vasc Anesth 2007; 21: 632-635.
95. Prasser C, Bele S, Keyl C, et al. Evaluation of a new arterial pressure-based cardiac output device requiring
no external calibration. BMC Anesthesiol 2007; 7: 9.
96. Mehta Y, Chand RK, Sawhney R, et al. Cardiac output monitoring: comparison of a new arterial pressure
waveform analysis to the bolus thermodilution technique in patients undergoing off-pump coronary artery
bypass surgery. J Cardiothorac Vasc Anesth 2008; 22: 394-399.
97. Moxon D, Pinder M, van Heerden PV, Parsons RW. Clinical evaluation of the HemoSonic monitor in cardiac
surgical patients in the ICU. Anaesth Intensive Care 2003; 31: 408-411.
98. Lafanechere A, Albaladejo P, Raux M, et al. Cardiac output measurement during infrarenal aortic surgery:
echo-esophageal Doppler versus thermodilution catheter. J Cardiothorac Vasc Anesth 2006; 20: 26-30.
99 Jaeggi P, Hofer CK, Klaghofer R, et al. Measurement of cardiac output after cardiac surgery by a new
transesophageal Doppler device. J Cardiothorac Vasc Anesth 2003; 17: 217-220.

44)

(45
Chapter 2
Performance of three minimally invasive cardiac output monitoring systems
Rob de Wilde, Bart Geerts, Jisheng Cui, Paul van den Berg and Jos Jansen
Anaesthesia 2009; 64: 762–769
46)
Ideally cardiac output monitoring is accurate, precise, operator-independent, rapid,
non-invasive, continuous, easy to use, and cost-effective. Methods that follow changes in
cardiac output may provide an early warning on changes in circulatory function or allow
‘interrogation’ of the circulation with interventions.
Cardiac output has perhaps traditionally been monitored by using a thermodilution
pulmonary artery catheter (PAC) using intermittent bolus thermodilution (COtd) and this is
still considered by some the best reference method. However, it may not be feasible to follow
changes on interventions or applied challenges, due to its time delay [1,2]. Devices based on
beat-to-beat assessment of stroke volume are better equipped to monitor changes in cardiac
output and two technologies currently available are based on arterial pulse contour and
transoesophageal ultrasound.
The recently introduced auto-calibrated FloTrac/Vigileo (Edwards Lifesciences, Irvine, CA,
USA) is a pulse contour method for cardiac output monitoring that, in contrast to devices
like the PiCCO™ (Pulsion Medical, Munich, Germany) and LiDCO™ (LiDCO Ltd,
Cambridge, UK), does not require an independent calibration [3] and is thus relatively
non-invasive using the pressure signal from a standard peripheral arterial line. The standard
deviation (SD) of the pulse pressure is correlated to stroke volume based on the patient’s
age, gender, body height and weight after an automatic adjustment related to an estimate of
vascular compliance. Early validation showed conflicting results, but after the introduction of
newer software (version 1.07), results became more uniform [4-8].
In some respects the Modelflow method is similar, deriving an aortic flow waveform from
arterial pressure by using a three-element input impedance model. Stroke volume is
integrated from the flow waveform. The parameters of the model are based on aortic
pressure, gender, age, height and weight of the patient. The Modelflow (or pulse contour)
method can follow beat-to-beat cardiac output changes, both after calibration by
thermodilution as well as in a non-calibrated setting [9-12].
The HemoSonic monitor (HemoSonic 100, Arrow International, Reading, PA, USA)
comprises an ultrasound probe with both M-mode and pulsed Doppler transducers [13,14]. The
former measures (in real time) the diameter of the descending aorta while the latter measures
blood velocity in the aorta. From these, aortic blood flow (ABF) is computed which in turn
enables estimation of cardiac output [15].
The aim of our study was to compare the accuracy, precision and monitoring ability of cardiac
output measurements by FloTrac-Vigileo, Modelflow and HemoSonic with intermittent
pulmonary artery thermodilution as the reference method.
(47
Methods
Patients and anaesthesia
After ethical approval and written informed consent, 13 patients were studied after coronary
arterial bypass grafting or mitral valve reconstruction. All patients had symptomatic coronary
artery disease without previous myocardial infarction but patients with a history of abnormal
ventricular function, aortic aneurysm, extensive peripheral arterial occlusive disease, aortic
valve pathology, and pharyngeal or oesophageal pathology were excluded. Patients with
persistent postoperative arrhythmia or the necessity for artificial pacing or heart assist
devices were also excluded. All patients were included in the study during their initial
post-operative period in the Intensive Care Unit (ICU).
Anaesthesia during surgery and ICU stay was generally with appropriate doses of propofol,
sufentanil and vasoactive medication. The lungs were mechanically ventilated (Dräger
EVITA 4, Dräger AG, Lübeck, Germany) in a volume-control mode with settings aimed to
achieve normocapnia with a tidal volume of 8-12 ml∙kg-1 and a respiratory frequency of 12-14
breaths∙min-1. The fraction of inspired oxygen was maintained at 0.4 and PEEP 5 cmH2O.
During the observation period ventilator settings, sedation and vasoactive medication, when
used, were unchanged.
Monitoring techniques
Before ICU admission, a radial artery was catheterized with a 20G catheter (Arrow, Reading,
PA, USA) to monitor arterial pressure (Pa) and a pulmonary artery catheter (Edwards
Lifesciences, Irvine, CA, USA) introduced into the right jugular vein to monitor central
venous pressure (CVP), pulmonary artery pressure (PAP) and to estimate cardiac output
(CO) by the intermittent thermodilution method (COtd).
COtd measurements were performed with an automated system under computer control
and measured in triplicate (10 ml saline solution at room temperature) in 2 minutes, with
the measurements equally spread over the ventilatory cycle. These three individual COtd
measurements were averaged [16]. Blood pressure transducers were referenced to the level of
the tricuspid valve and zeroed to atmospheric pressure.
The radial artery pressure (Pa) from the radial artery catheter was also connected to a FloTrac
pressure transducer (Edwards Lifesciences) with a bifurcated lead, one limb connected to the
Vigileo system (Edwards Lifesciences) to measure pulse contour cardiac output (COed) and
the other limb connected to a bedside monitor pressure module (Hewlett Packard model
M1006A) whose output was used as the input signal to the modified Modelflow system
(BMEYE, Academic Medical Center, Amsterdam, the Netherlands) to estimate pulse contour
cardiac output (COmf). Detailed information about the FloTrac-Vigileo system [3] and
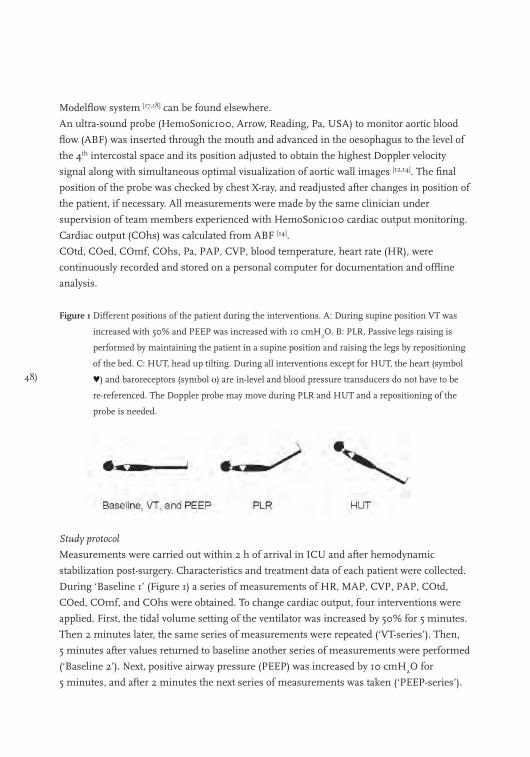
48)
Modelflow system [17,18] can be found elsewhere.
An ultra-sound probe (HemoSonic100, Arrow, Reading, Pa, USA) to monitor aortic blood
flow (ABF) was inserted through the mouth and advanced in the oesophagus to the level of
the 4th intercostal space and its position adjusted to obtain the highest Doppler velocity
signal along with simultaneous optimal visualization of aortic wall images [12,14]. The final
position of the probe was checked by chest X-ray, and readjusted after changes in position of
the patient, if necessary. All measurements were made by the same clinician under
supervision of team members experienced with HemoSonic100 cardiac output monitoring.
Cardiac output (COhs) was calculated from ABF [14].
COtd, COed, COmf, COhs, Pa, PAP, CVP, blood temperature, heart rate (HR), were
continuously recorded and stored on a personal computer for documentation and offline
analysis.
Figure 1 Different positions of the patient during the interventions. A: During supine position VT was
increased with 50% and PEEP was increased with 10 cmH2O. B: PLR, Passive legs raising is
performed by maintaining the patient in a supine position and raising the legs by repositioning
of the bed. C: HUT, head up tilting. During all interventions except for HUT, the heart (symbol
♥) and baroreceptors (symbol o) are in-level and blood pressure transducers do not have to be
re-referenced. The Doppler probe may move during PLR and HUT and a repositioning of the
probe is needed.
Study protocol
Measurements were carried out within 2 h of arrival in ICU and after hemodynamic
stabilization post-surgery. Characteristics and treatment data of each patient were collected.
During ‘Baseline 1’ (Figure 1) a series of measurements of HR, MAP, CVP, PAP, COtd,
COed, COmf, and COhs were obtained. To change cardiac output, four interventions were
applied. First, the tidal volume setting of the ventilator was increased by 50% for 5 minutes.
Then 2 minutes later, the same series of measurements were repeated (‘VT-series’). Then,
5 minutes after values returned to baseline another series of measurements were performed
(‘Baseline 2’). Next, positive airway pressure (PEEP) was increased by 10 cmH2O for
5 minutes, and after 2 minutes the next series of measurements was taken (‘PEEP-series’).
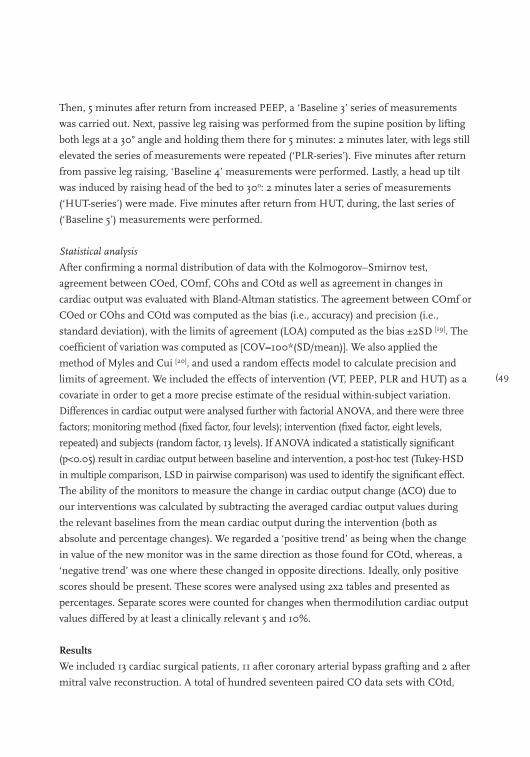
(49
Then, 5 minutes after return from increased PEEP, a ‘Baseline 3’ series of measurements
was carried out. Next, passive leg raising was performed from the supine position by lifting
both legs at a 30° angle and holding them there for 5 minutes: 2 minutes later, with legs still
elevated the series of measurements were repeated (‘PLR-series’). Five minutes after return
from passive leg raising, ‘Baseline 4’ measurements were performed. Lastly, a head up tilt
was induced by raising head of the bed to 30o: 2 minutes later a series of measurements
(‘HUT-series’) were made. Five minutes after return from HUT, during, the last series of
(‘Baseline 5’) measurements were performed.
Statistical analysis
After confirming a normal distribution of data with the Kolmogorov–Smirnov test,
agreement between COed, COmf, COhs and COtd as well as agreement in changes in
cardiac output was evaluated with Bland-Altman statistics. The agreement between COmf or
COed or COhs and COtd was computed as the bias (i.e., accuracy) and precision (i.e.,
standard deviation), with the limits of agreement (LOA) computed as the bias ±2SD [19]. The
coefficient of variation was computed as [COV=100*(SD/mean)]. We also applied the
method of Myles and Cui [20], and used a random effects model to calculate precision and
limits of agreement. We included the effects of intervention (VT, PEEP, PLR and HUT) as a
covariate in order to get a more precise estimate of the residual within-subject variation.
Differences in cardiac output were analysed further with factorial ANOVA, and there were three
factors; monitoring method (fixed factor, four levels); intervention (fixed factor, eight levels,
repeated) and subjects (random factor, 13 levels). If ANOVA indicated a statistically significant
(p<0.05) result in cardiac output between baseline and intervention, a post-hoc test (Tukey-HSD
in multiple comparison, LSD in pairwise comparison) was used to identify the significant effect.
The ability of the monitors to measure the change in cardiac output change (∆CO) due to
our interventions was calculated by subtracting the averaged cardiac output values during
the relevant baselines from the mean cardiac output during the intervention (both as
absolute and percentage changes). We regarded a ‘positive trend’ as being when the change
in value of the new monitor was in the same direction as those found for COtd, whereas, a
‘negative trend’ was one where these changed in opposite directions. Ideally, only positive
scores should be present. These scores were analysed using 2x2 tables and presented as
percentages. Separate scores were counted for changes when thermodilution cardiac output
values differed by at least a clinically relevant 5 and 10%.
Results
We included 13 cardiac surgical patients, 11 after coronary arterial bypass grafting and 2 after
mitral valve reconstruction. A total of hundred seventeen paired CO data sets with COtd,
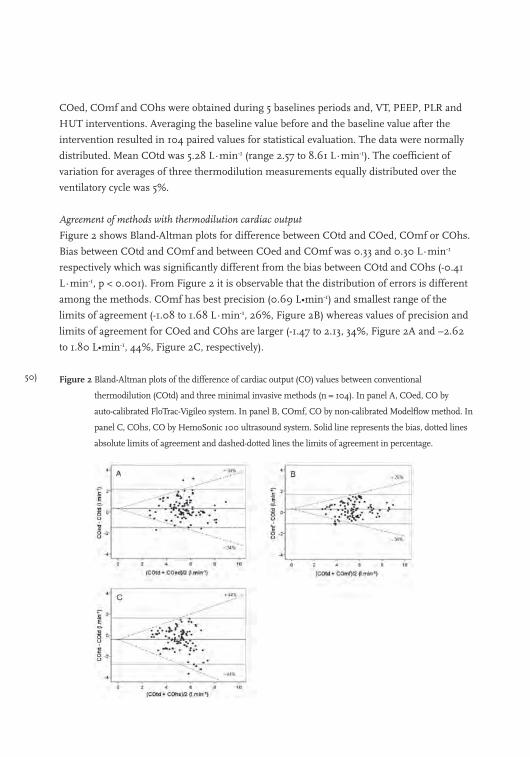
50)
COed, COmf and COhs were obtained during 5 baselines periods and, VT, PEEP, PLR and
HUT interventions. Averaging the baseline value before and the baseline value after the
intervention resulted in 104 paired values for statistical evaluation. The data were normally
distributed. Mean COtd was 5.28 L∙min-1 (range 2.57 to 8.61 L∙min-1). The coefficient of
variation for averages of three thermodilution measurements equally distributed over the
ventilatory cycle was 5%.
Agreement of methods with thermodilution cardiac output
Figure 2 shows Bland-Altman plots for difference between COtd and COed, COmf or COhs.
Bias between COtd and COmf and between COed and COmf was 0.33 and 0.30 L∙min-1
respectively which was significantly different from the bias between COtd and COhs (-0.41
L∙min-1, p < 0.001). From Figure 2 it is observable that the distribution of errors is different
among the methods. COmf has best precision (0.69 L•min-1) and smallest range of the
limits of agreement (-1.08 to 1.68 L∙min-1, 26%, Figure 2B) whereas values of precision and
limits of agreement for COed and COhs are larger (-1.47 to 2.13, 34%, Figure 2A and –2.62
to 1.80 L•min-1, 44%, Figure 2C, respectively).
Figure 2 Bland-Altman plots of the difference of cardiac output (CO) values between conventional
thermodilution (COtd) and three minimal invasive methods (n = 104). In panel A, COed, CO by
auto-calibrated FloTrac-Vigileo system. In panel B, COmf, CO by non-calibrated Modelflow method. In
panel C, COhs, CO by HemoSonic 100 ultrasound system. Solid line represents the bias, dotted lines
absolute limits of agreement and dashed-dotted lines the limits of agreement in percentage.
(51
Result based on the random effects model of Myles and Cui [20] are shown in Figure 3. The
residual within-subject standard deviation was substantially smaller after adjustment for
baseline. For example, the original within-subject standard deviation was 0.41 and 0.79 for
COtd and COed, respectively. After adjusting for the relevant covariates, the within-subject
standard deviation reduced to 0.21 and 0.20, respectively. This reduced the width of the 95%
limits of agreements accordingly (Figures 2 and 3). Bias and precision of both, the original
and modified Bland-Altman methods are presented in Table 1.
Figure 3 Modified Bland-Altman plots of the difference of cardiac output (CO) values between
conventional thermodilution (COtd) and three minimal invasive methods, based on a random
effects model (n = 13). In panel A, COed, CO by auto-calibrated FloTrac-Vigileo system. In panel
B, COmf, CO by non-calibrated Modelflow method. In panel C, COhs, CO by HemoSonic 100
ultrasound system. Solid line represents the bias, dotted lines absolute limits of agreement and
dashed-dotted lines the limits of agreement in percentage
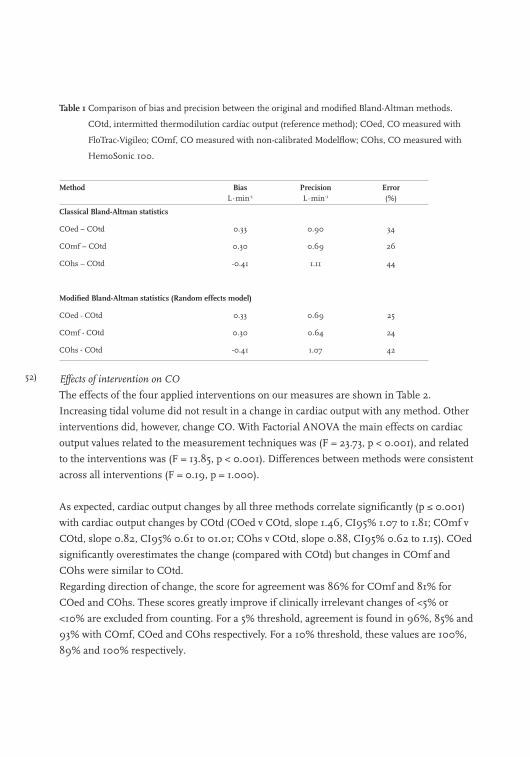
52)
Table 1 Comparison of bias and precision between the original and modified Bland-Altman methods.
COtd, intermitted thermodilution cardiac output (reference method); COed, CO measured with
FloTrac-Vigileo; COmf, CO measured with non-calibrated Modelflow; COhs, CO measured with
HemoSonic 100.
Method BiasL∙min-1
PrecisionL∙min-1
Error(%)
Classical Bland-Altman statistics
COed – COtd 0.33 0.90 34
COmf – COtd 0.30 0.69 26
COhs – COtd -0.41 1.11 44
Modified Bland-Altman statistics (Random effects model)
COed - COtd 0.33 0.69 25
COmf - COtd 0.30 0.64 24
COhs - COtd -0.41 1.07 42
Effects of intervention on CO
The effects of the four applied interventions on our measures are shown in Table 2.
Increasing tidal volume did not result in a change in cardiac output with any method. Other
interventions did, however, change CO. With Factorial ANOVA the main effects on cardiac
output values related to the measurement techniques was (F = 23.73, p < 0.001), and related
to the interventions was (F = 13.85, p < 0.001). Differences between methods were consistent
across all interventions (F = 0.19, p = 1.000).
As expected, cardiac output changes by all three methods correlate significantly (p ≤ 0.001)
with cardiac output changes by COtd (COed v COtd, slope 1.46, CI95% 1.07 to 1.81; COmf v
COtd, slope 0.82, CI95% 0.61 to 01.01; COhs v COtd, slope 0.88, CI95% 0.62 to 1.15). COed
significantly overestimates the change (compared with COtd) but changes in COmf and
COhs were similar to COtd.
Regarding direction of change, the score for agreement was 86% for COmf and 81% for
COed and COhs. These scores greatly improve if clinically irrelevant changes of <5% or
<10% are excluded from counting. For a 5% threshold, agreement is found in 96%, 85% and
93% with COmf, COed and COhs respectively. For a 10% threshold, these values are 100%,
89% and 100% respectively.
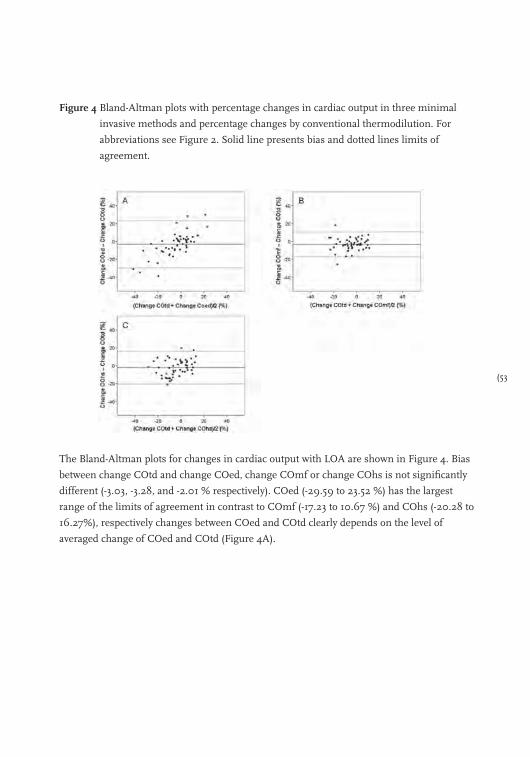
(53
Figure 4 Bland-Altman plots with percentage changes in cardiac output in three minimal
invasive methods and percentage changes by conventional thermodilution. For
abbreviations see Figure 2. Solid line presents bias and dotted lines limits of
agreement.
The Bland-Altman plots for changes in cardiac output with LOA are shown in Figure 4. Bias
between change COtd and change COed, change COmf or change COhs is not significantly
different (-3.03, -3.28, and -2.01 % respectively). COed (-29.59 to 23.52 %) has the largest
range of the limits of agreement in contrast to COmf (-17.23 to 10.67 %) and COhs (-20.28 to
16.27%), respectively changes between COed and COtd clearly depends on the level of
averaged change of COed and COtd (Figure 4A).
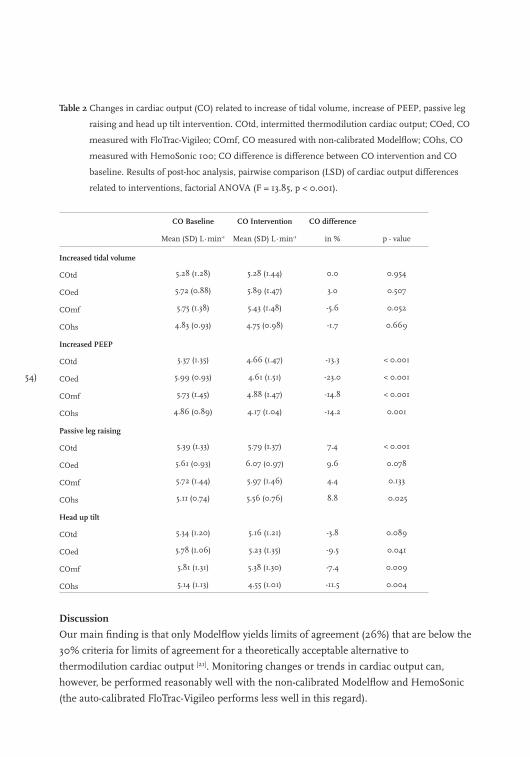
54)
Table 2 Changes in cardiac output (CO) related to increase of tidal volume, increase of PEEP, passive leg
raising and head up tilt intervention. COtd, intermitted thermodilution cardiac output; COed, CO
measured with FloTrac-Vigileo; COmf, CO measured with non-calibrated Modelflow; COhs, CO
measured with HemoSonic 100; CO difference is difference between CO intervention and CO
baseline. Results of post-hoc analysis, pairwise comparison (LSD) of cardiac output differences
related to interventions, factorial ANOVA (F = 13.85, p < 0.001).
CO Baseline CO Intervention CO difference
Mean (SD) L∙min-1 Mean (SD) L∙min-1 in % p - value
Increased tidal volume
COtd 5.28 (1.28) 5.28 (1.44) 0.0 0.954
COed 5.72 (0.88) 5.89 (1.47) 3.0 0.507
COmf 5.75 (1.38) 5.43 (1.48) -5.6 0.052
COhs 4.83 (0.93) 4.75 (0.98) -1.7 0.669
Increased PEEP
COtd 5.37 (1.35) 4.66 (1.47) -13.3 < 0.001
COed 5.99 (0.93) 4.61 (1.51) -23.0 < 0.001
COmf 5.73 (1.45) 4.88 (1.47) -14.8 < 0.001
COhs 4.86 (0.89) 4.17 (1.04) -14.2 0.001
Passive leg raising
COtd 5.39 (1.33) 5.79 (1.37) 7.4 < 0.001
COed 5.61 (0.93) 6.07 (0.97) 9.6 0.078
COmf 5.72 (1.44) 5.97 (1.46) 4.4 0.133
COhs 5.11 (0.74) 5.56 (0.76) 8.8 0.025
Head up tilt
COtd 5.34 (1.20) 5.16 (1.21) -3.8 0.089
COed 5.78 (1.06) 5.23 (1.35) -9.5 0.041
COmf 5.81 (1.31) 5.38 (1.30) -7.4 0.009
COhs 5.14 (1.13) 4.55 (1.01) -11.5 0.004
Discussion
Our main finding is that only Modelflow yields limits of agreement (26%) that are below the
30% criteria for limits of agreement for a theoretically acceptable alternative to
thermodilution cardiac output [21]. Monitoring changes or trends in cardiac output can,
however, be performed reasonably well with the non-calibrated Modelflow and HemoSonic
(the auto-calibrated FloTrac-Vigileo performs less well in this regard).
(55
Any error in our reference method (COtd) might influence the comparison between cardiac
output by thermodilution and FloTrac-Vigileo, Modelflow or HemoSonic. Individual
thermodilution cardiac output estimates show substantial scatter (10-15%) in value even
under stable haemodynamic and ventilatory conditions [22]. An average of at least three
measurements – over the respiratory cycle - is advised to obtain cardiac output estimate with
acceptable precision [11,16] (this can require injections to be performed by a motor driven
syringe under computer control) [23].
The results of the present study did not show conflicting results with respect to the results of
previous reports, obtained with either the FloTrac-Vigileo system version 1.07 [4-8], the
non-calibrated Modelflow method [11,12] or Hemosonic 100 system [24,25].
Myles and Cui [20] criticized in a recent editorial the use of standard Bland-Altman analysis to
compare methodologies (such as ours in this study) where repeated measurements are used.
We feel, however, that multiple observations in a patient really only apply when taken under
the same experimental conditions. Where conditions are changing with time, it seems valid
to take several observations and then assess response over time. Nonetheless, we took the
precaution of applying both the ‘classical’ Bland-Altman statistics [19] and the random effects
model proposed by Myles and Cui [20]. The differences in results of analysis are presented in
the Figures 2 and 3. For all three methods the limits of agreement of the classical Bland-
Altman analysis are larger than with the random effects model. This can be explained by the
removal of within patient variation in cardiac output. Especially the difference between COed
and COtd (Figure 2A) decreased considerably with the random effects model (Figure 3A).
This is account for the overestimation of changes in cardiac output by the FloTrac-Vigileo
system (Figure 4A).
Passive leg raising as an intervention in combination with oesophageal ultra-sound blood
flow measurement has been used to identify those patients that likely beneficially respond to
fluid challenge with an increase in cardiac output [26-28]. Monnet at al. [27] demonstrated that
the HemoSonic device could reliably predict such responders. Our data suggests that this
may also be the case with FloTrac-Vigileo and Modelflow.
One concern was that during passive leg raising (or even head up tilt), the oesophageal probe
position may change. We were careful to reposition the probe regularly to obtain an optimal
signal. However, the position of baroreceptors in relation to the heart is also changed by
these manoeuvres and this may influence arterial blood pressure by auto-regulation (Figure
1). We would expect this effect to be constant across all methods and not bias any particular
device.

56)
Conclusions
The non-calibrated Modelflow method showed best performance in estimation of cardiac
output. Changes in cardiac output by thermodilution were also tracked well by the non-
calibrated Modelflow and also by the HemoSonic device, whereas the auto-calibrated FloTrac-
Vigileo overestimated the changes in cardiac output. Directional changes in cardiac output
by thermodilution were detected with a high score by all three methods. Encouraged by the
simplicity of setup procedure and advantage for the patient, we suggest future work focuses
on the Modelflow system.
(57
References
1. Siegel LC, Hennessy MM, Pearl RG. Delayed time response of the continuous cardiac output pulmonary
artery catheter. Anesthesia and Analgesia. 1996; 83: 1173-7.
2. Aranda M, Mihm FG, Garrett S, Mihm MN, Pearl RG. Continuous cardiac output catheters: delay in in vitro
response time after controlled flow changes. Anesthesiology 1998; 89: 1592-5.
3. Manecke GR. Edwards FloTrac sensor and Vigileo monitor: easy, accurate, reliable cardiac output
assessment using the arterial pulse wave. Expert Review of Medical Devices 2005; 2: 523-7.
4. Button D, Weibel L, Reuthebuch O, et al. Clinical evaluation of the FloTrac/VigileoTM system and two
established continuous cardiac output monitoring devices in patients undergoing cardiac surgery. British
Journal of Anaesthesia 2007; 99: 329-36.
5. McGee WT, Horswell JL, Calderon J, et al. Validation of a continuous, arterial pressure-based cardiac output
measurement: a multicenter, prospective clinical trial. Critical Care 2007; 11: R105.
6. Breukers RM, Sepehrkhouy S, Spiegelenberg SR, Groeneveld AB. Cardiac output measured by a new arterial
pressure waveform analysis method without calibration compared with thermodilution after cardiac surgery.
Journal Cardiothorac and Vascular Anesthesia 2007; 21: 632-5.
7. Mayer J, Boldt J, Wolf MW, Lang J, Suttner S. Cardiac output derived from arterial pressure waveform
analysis in patients undergoing cardiac surgery: validity of a second generation device. Anesthesia and
Analgesia 2008; 106: 867-72.
8. Prasser C, Bele S, Keyl C, et al. Evaluation of a new arterial pressure-based cardiac output device requiring
no external calibration. BMC Anesthesiology 2007; 7: 9.
9. Wesseling KH, Jansen JR, Settels JJ, Schreuder JJ. Computation of aortic flow from pressure in humans
using a nonlinear, three-element model. Journal of Applied Physiology 1993; 74: 2566-73.
10. Jellema WT, Imholz BP, Oosting H, Wesseling KH, van Lieshout JJ. Estimation of beat-to-beat changes in
stroke volume from arterial pressure: a comparison of two pressure wave analysis techniques during
head-up tilt testing in young, healthy men. Clinical Autonomic Research 1999; 9: 185-92.
11. Jansen JR, Schreuder JJ, Mulier JP, et al. A comparison of cardiac output derived from the arterial pressure
wave against thermodilution in cardiac surgery patients. British Journal of Anaesthesia 2001; 87: 212-22.
12. de Vaal JB, de Wilde RB, van den Berg PC, Schreuder JJ, Jansen JR. Less invasive determination of cardiac
output from the arterial pressure by aortic diameter-calibrated pulse contour. British Journal of Anaesthesia
2005; 95: 326-31.
13. Cariou A, Monchi M, Joly LM, et al. Noninvasive cardiac output monitoring by aortic blood flow
determination: evaluation of the Sometec Dynemo-3000 system. Critical Care Medicine 1998; 26: 2066-72.
14. Boulnois JL, Pechoux T. Non-invasive cardiac output monitoring by aortic blood flow measurement with the
Dynemo 3000. Journal of Clinical Monitoring and Computing 2000; 16: 127-40.
15. Monnet X, Teboul JL. Passive leg raising. Intensive Care Medicine 2008; 34: 659-63.
16. Jansen JR, Versprille A. Improvement of cardiac output estimation by the thermodilution method during
mechanical ventilation. Intensive Care Medicine 1986; 12: 71-9.
17. Wesseling KH, Purschke R, Smith NT, et al. A computer module for the continuous monitoring of cardiac
output in the operating theatre and the ICU. Acta Anaesthesiologica Belgica. 1976; 27 suppl: 327-41.
18. Jansen JR, Wesseling KH, Settels JJ, Schreuder JJ. Continuous cardiac output monitoring by pulse contour
during cardiac surgery. European Heart Journal 1990; 11 Suppl I: 26-32.
19. Bland JM, Altman DG. Statistical methods for assessing agreement between two methods of clinical
measurement. Lancet 1986; 1: 307-10.

58)
20. Myles PS, Cui J. I. Using the Bland Altman method to measure agreement with repeated measures. British
Journal of Anaesthesia 2007; 99: 309-11.
21. Critchley LA, Critchley JA. A meta-analysis of studies using bias and precision statistics to compare cardiac
output measurement techniques. Journal of Clinical Monitoring and Computing 1999; 15: 85-91.
22. Stevens JH, Raffin TA, Mihm FG, Rosenthal MH, Stetz CW. Thermodilution cardiac output measurement.
Effects of the respiratory cycle on its reproducibility. Journal of American Medical Association 1985; 253:
2240-2.
23. Nelson N, Janerot-Sjoberg B. Beat-to-beat changes in stroke volume precede the general circulatory effects of
mechanical ventilation: a case report. Critical Care 2001; 5: 41-5.
24. Moxon D, Pinder M, van Heerden PV, Parsons RW. Clinical evaluation of the HemoSonic monitor in cardiac
surgical patients in the ICU. Anaesthesia and Intensive Care 2003; 31: 408-11.
25. Su NY, Huang CJ, Tsai P, et al. Cardiac output measurement during cardiac surgery: esophageal Doppler
versus pulmonary artery catheter. Acta Anaesthesiologica Sinica. 2002; 40: 127-33.
26. Roeck M, Jakob SM, Boehlen T, et al. Change in stroke volume in response to fluid challenge: assessment
using esophageal Doppler. Intensive Care Medicine 2003; 29: 1729-35.
27. Monnet X, Rienzo M, Osman D, et al. Passive leg raising predicts fluid responsiveness in the critically ill.
Critical Care Medicine 2006; 34: 1402-7.
28. Lafanechere A, Pène F, Goulenok C, et al. Changes in aortic blood flow induced by passive leg raising
predict fluid responsiveness in critically ill patients. Critical Care 2006; 10: R132.

(59

60)

(61
Chapter 3
A comparison of stroke volume variation measured by the LiDCOPLUS and FloTrac-Vigileo
Rob de Wilde, Bart Geerts, Paul van den Berg and Jos Jansen
Anaesthesia 2009; 64(9): 1004-9
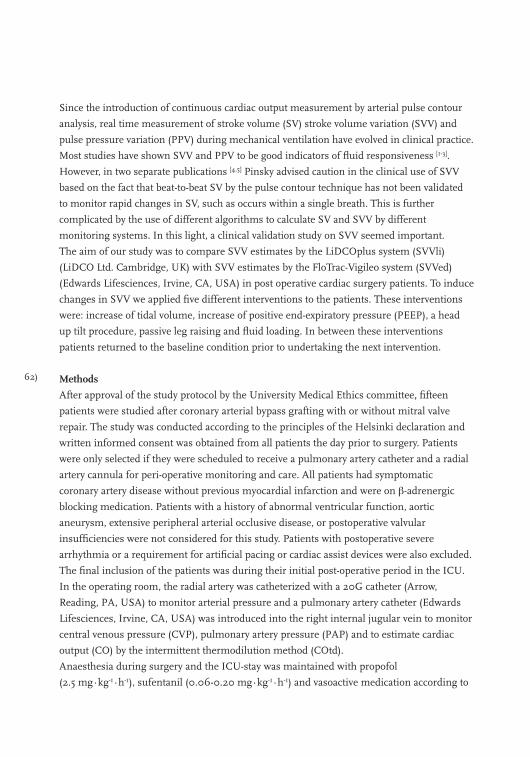
62)
Since the introduction of continuous cardiac output measurement by arterial pulse contour
analysis, real time measurement of stroke volume (SV) stroke volume variation (SVV) and
pulse pressure variation (PPV) during mechanical ventilation have evolved in clinical practice.
Most studies have shown SVV and PPV to be good indicators of fluid responsiveness [1-3].
However, in two separate publications [4,5] Pinsky advised caution in the clinical use of SVV
based on the fact that beat-to-beat SV by the pulse contour technique has not been validated
to monitor rapid changes in SV, such as occurs within a single breath. This is further
complicated by the use of different algorithms to calculate SV and SVV by different
monitoring systems. In this light, a clinical validation study on SVV seemed important.
The aim of our study was to compare SVV estimates by the LiDCOplus system (SVVli)
(LiDCO Ltd. Cambridge, UK) with SVV estimates by the FloTrac-Vigileo system (SVVed)
(Edwards Lifesciences, Irvine, CA, USA) in post operative cardiac surgery patients. To induce
changes in SVV we applied five different interventions to the patients. These interventions
were: increase of tidal volume, increase of positive end-expiratory pressure (PEEP), a head
up tilt procedure, passive leg raising and fluid loading. In between these interventions
patients returned to the baseline condition prior to undertaking the next intervention.
Methods
After approval of the study protocol by the University Medical Ethics committee, fifteen
patients were studied after coronary arterial bypass grafting with or without mitral valve
repair. The study was conducted according to the principles of the Helsinki declaration and
written informed consent was obtained from all patients the day prior to surgery. Patients
were only selected if they were scheduled to receive a pulmonary artery catheter and a radial
artery cannula for peri-operative monitoring and care. All patients had symptomatic
coronary artery disease without previous myocardial infarction and were on β-adrenergic
blocking medication. Patients with a history of abnormal ventricular function, aortic
aneurysm, extensive peripheral arterial occlusive disease, or postoperative valvular
insufficiencies were not considered for this study. Patients with postoperative severe
arrhythmia or a requirement for artificial pacing or cardiac assist devices were also excluded.
The final inclusion of the patients was during their initial post-operative period in the ICU.
In the operating room, the radial artery was catheterized with a 20G catheter (Arrow,
Reading, PA, USA) to monitor arterial pressure and a pulmonary artery catheter (Edwards
Lifesciences, Irvine, CA, USA) was introduced into the right internal jugular vein to monitor
central venous pressure (CVP), pulmonary artery pressure (PAP) and to estimate cardiac
output (CO) by the intermittent thermodilution method (COtd).
Anaesthesia during surgery and the ICU-stay was maintained with propofol
(2.5 mg∙kg-1∙h-1), sufentanil (0.06-0.20 mg∙kg-1∙h-1) and vasoactive medication according to
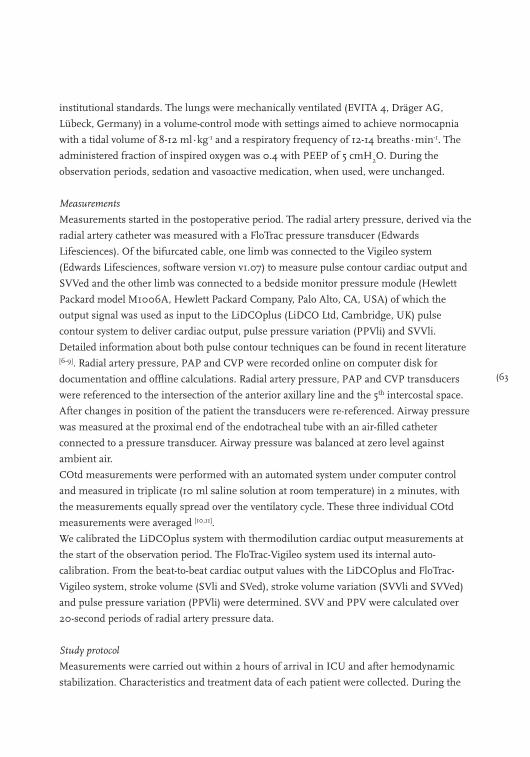
(63
institutional standards. The lungs were mechanically ventilated (EVITA 4, Dräger AG,
Lübeck, Germany) in a volume-control mode with settings aimed to achieve normocapnia
with a tidal volume of 8-12 ml∙kg-1 and a respiratory frequency of 12-14 breaths∙min-1. The
administered fraction of inspired oxygen was 0.4 with PEEP of 5 cmH2O. During the
observation periods, sedation and vasoactive medication, when used, were unchanged.
Measurements
Measurements started in the postoperative period. The radial artery pressure, derived via the
radial artery catheter was measured with a FloTrac pressure transducer (Edwards
Lifesciences). Of the bifurcated cable, one limb was connected to the Vigileo system
(Edwards Lifesciences, software version v1.07) to measure pulse contour cardiac output and
SVVed and the other limb was connected to a bedside monitor pressure module (Hewlett
Packard model M1006A, Hewlett Packard Company, Palo Alto, CA, USA) of which the
output signal was used as input to the LiDCOplus (LiDCO Ltd, Cambridge, UK) pulse
contour system to deliver cardiac output, pulse pressure variation (PPVli) and SVVli.
Detailed information about both pulse contour techniques can be found in recent literature [6-9]. Radial artery pressure, PAP and CVP were recorded online on computer disk for
documentation and offline calculations. Radial artery pressure, PAP and CVP transducers
were referenced to the intersection of the anterior axillary line and the 5th intercostal space.
After changes in position of the patient the transducers were re-referenced. Airway pressure
was measured at the proximal end of the endotracheal tube with an air-filled catheter
connected to a pressure transducer. Airway pressure was balanced at zero level against
ambient air.
COtd measurements were performed with an automated system under computer control
and measured in triplicate (10 ml saline solution at room temperature) in 2 minutes, with
the measurements equally spread over the ventilatory cycle. These three individual COtd
measurements were averaged [10,11].
We calibrated the LiDCOplus system with thermodilution cardiac output measurements at
the start of the observation period. The FloTrac-Vigileo system used its internal auto-
calibration. From the beat-to-beat cardiac output values with the LiDCOplus and FloTrac-
Vigileo system, stroke volume (SVli and SVed), stroke volume variation (SVVli and SVVed)
and pulse pressure variation (PPVli) were determined. SVV and PPV were calculated over
20-second periods of radial artery pressure data.
Study protocol
Measurements were carried out within 2 hours of arrival in ICU and after hemodynamic
stabilization. Characteristics and treatment data of each patient were collected. During the
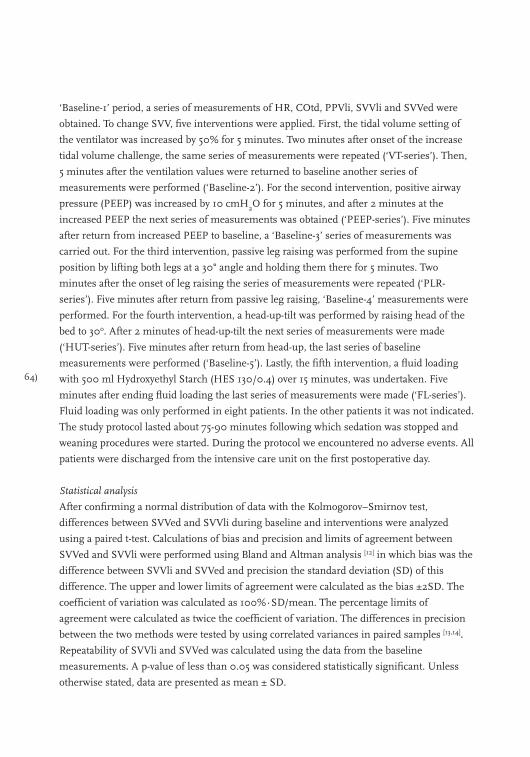
64)
‘Baseline-1’ period, a series of measurements of HR, COtd, PPVli, SVVli and SVVed were
obtained. To change SVV, five interventions were applied. First, the tidal volume setting of
the ventilator was increased by 50% for 5 minutes. Two minutes after onset of the increase
tidal volume challenge, the same series of measurements were repeated (‘VT-series’). Then,
5 minutes after the ventilation values were returned to baseline another series of
measurements were performed (‘Baseline-2’). For the second intervention, positive airway
pressure (PEEP) was increased by 10 cmH2O for 5 minutes, and after 2 minutes at the
increased PEEP the next series of measurements was obtained (‘PEEP-series’). Five minutes
after return from increased PEEP to baseline, a ‘Baseline-3’ series of measurements was
carried out. For the third intervention, passive leg raising was performed from the supine
position by lifting both legs at a 30° angle and holding them there for 5 minutes. Two
minutes after the onset of leg raising the series of measurements were repeated (‘PLR-
series’). Five minutes after return from passive leg raising, ‘Baseline-4’ measurements were
performed. For the fourth intervention, a head-up-tilt was performed by raising head of the
bed to 30o. After 2 minutes of head-up-tilt the next series of measurements were made
(‘HUT-series’). Five minutes after return from head-up, the last series of baseline
measurements were performed (‘Baseline-5’). Lastly, the fifth intervention, a fluid loading
with 500 ml Hydroxyethyl Starch (HES 130/0.4) over 15 minutes, was undertaken. Five
minutes after ending fluid loading the last series of measurements were made (‘FL-series’).
Fluid loading was only performed in eight patients. In the other patients it was not indicated.
The study protocol lasted about 75-90 minutes following which sedation was stopped and
weaning procedures were started. During the protocol we encountered no adverse events. All
patients were discharged from the intensive care unit on the first postoperative day.
Statistical analysis
After confirming a normal distribution of data with the Kolmogorov–Smirnov test,
differences between SVVed and SVVli during baseline and interventions were analyzed
using a paired t-test. Calculations of bias and precision and limits of agreement between
SVVed and SVVli were performed using Bland and Altman analysis [12] in which bias was the
difference between SVVli and SVVed and precision the standard deviation (SD) of this
difference. The upper and lower limits of agreement were calculated as the bias ±2SD. The
coefficient of variation was calculated as 100%∙SD/mean. The percentage limits of
agreement were calculated as twice the coefficient of variation. The differences in precision
between the two methods were tested by using correlated variances in paired samples [13,14].
Repeatability of SVVli and SVVed was calculated using the data from the baseline
measurements. A p-value of less than 0.05 was considered statistically significant. Unless
otherwise stated, data are presented as mean ± SD.
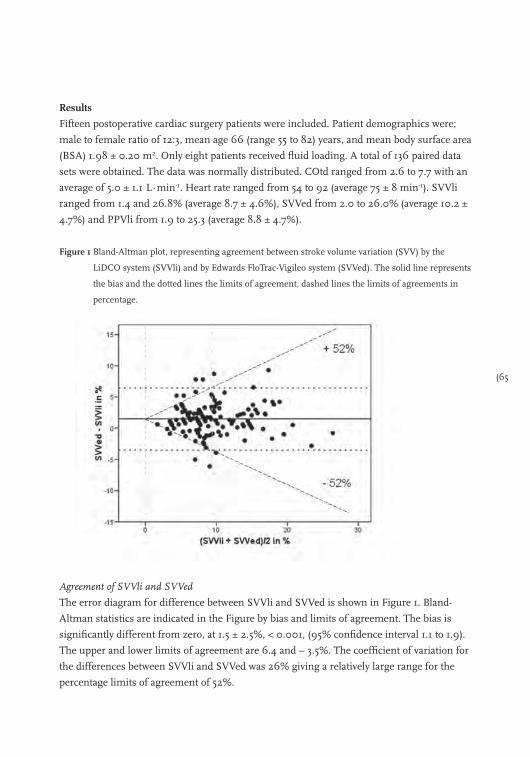
(65
Results
Fifteen postoperative cardiac surgery patients were included. Patient demographics were;
male to female ratio of 12:3, mean age 66 (range 55 to 82) years, and mean body surface area
(BSA) 1.98 ± 0.20 m2. Only eight patients received fluid loading. A total of 136 paired data
sets were obtained. The data was normally distributed. COtd ranged from 2.6 to 7.7 with an
average of 5.0 ± 1.1 L∙min-1. Heart rate ranged from 54 to 92 (average 75 ± 8 min-1). SVVli
ranged from 1.4 and 26.8% (average 8.7 ± 4.6%), SVVed from 2.0 to 26.0% (average 10.2 ±
4.7%) and PPVli from 1.9 to 25.3 (average 8.8 ± 4.7%).
Figure 1 Bland-Altman plot, representing agreement between stroke volume variation (SVV) by the
LiDCO system (SVVli) and by Edwards FloTrac-Vigileo system (SVVed). The solid line represents
the bias and the dotted lines the limits of agreement, dashed lines the limits of agreements in
percentage.
Agreement of SVVli and SVVed
The error diagram for difference between SVVli and SVVed is shown in Figure 1. Bland-
Altman statistics are indicated in the Figure by bias and limits of agreement. The bias is
significantly different from zero, at 1.5 ± 2.5%, < 0.001, (95% confidence interval 1.1 to 1.9).
The upper and lower limits of agreement are 6.4 and – 3.5%. The coefficient of variation for
the differences between SVVli and SVVed was 26% giving a relatively large range for the
percentage limits of agreement of 52%.
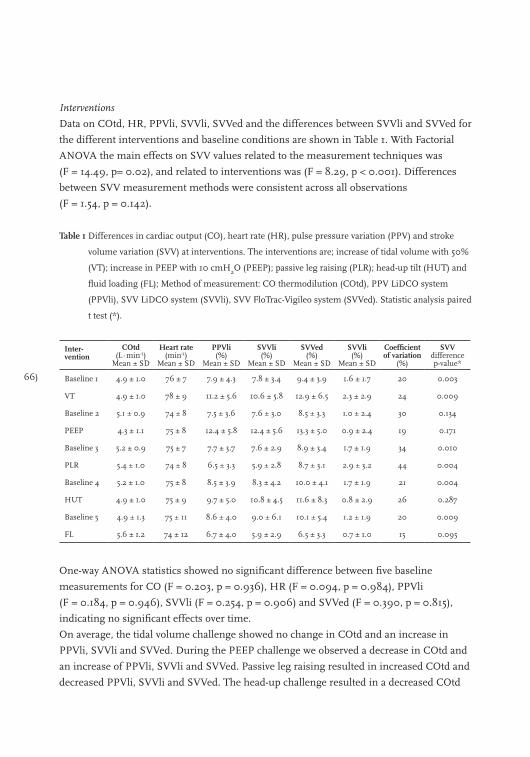
66)
Interventions
Data on COtd, HR, PPVli, SVVli, SVVed and the differences between SVVli and SVVed for
the different interventions and baseline conditions are shown in Table 1. With Factorial
ANOVA the main effects on SVV values related to the measurement techniques was
(F = 14.49, p= 0.02), and related to interventions was (F = 8.29, p < 0.001). Differences
between SVV measurement methods were consistent across all observations
(F = 1.54, p = 0.142).
Table 1 Differences in cardiac output (CO), heart rate (HR), pulse pressure variation (PPV) and stroke
volume variation (SVV) at interventions. The interventions are; increase of tidal volume with 50%
(VT); increase in PEEP with 10 cmH2O (PEEP); passive leg raising (PLR); head-up tilt (HUT) and
fluid loading (FL); Method of measurement: CO thermodilution (COtd), PPV LiDCO system
(PPVli), SVV LiDCO system (SVVli), SVV FloTrac-Vigileo system (SVVed). Statistic analysis paired
t test (*).
Inter-vention
COtd (L∙min-1)
Mean ± SD
Heart rate(min-1)
Mean ± SD
PPVli (%)
Mean ± SD
SVVli (%)
Mean ± SD
SVVed (%)
Mean ± SD
SVVli(%)
Mean ± SD
Coefficient of variation
(%)
SVVdifferencep-value*
Baseline 1 4.9 ± 1.0 76 ± 7 7.9 ± 4.3 7.8 ± 3.4 9.4 ± 3.9 1.6 ± 1.7 20 0.003
VT 4.9 ± 1.0 78 ± 9 11.2 ± 5.6 10.6 ± 5.8 12.9 ± 6.5 2.3 ± 2.9 24 0.009
Baseline 2 5.1 ± 0.9 74 ± 8 7.5 ± 3.6 7.6 ± 3.0 8.5 ± 3.3 1.0 ± 2.4 30 0.134
PEEP 4.3 ± 1.1 75 ± 8 12.4 ± 5.8 12.4 ± 5.6 13.3 ± 5.0 0.9 ± 2.4 19 0.171
Baseline 3 5.2 ± 0.9 75 ± 7 7.7 ± 3.7 7.6 ± 2.9 8.9 ± 3.4 1.7 ± 1.9 34 0.010
PLR 5.4 ± 1.0 74 ± 8 6.5 ± 3.3 5.9 ± 2.8 8.7 ± 3.1 2.9 ± 3.2 44 0.004
Baseline 4 5.2 ± 1.0 75 ± 8 8.5 ± 3.9 8.3 ± 4.2 10.0 ± 4.1 1.7 ± 1.9 21 0.004
HUT 4.9 ± 1.0 75 ± 9 9.7 ± 5.0 10.8 ± 4.5 11.6 ± 8.3 0.8 ± 2.9 26 0.287
Baseline 5 4.9 ± 1.3 75 ± 11 8.6 ± 4.0 9.0 ± 6.1 10.1 ± 5.4 1.2 ± 1.9 20 0.009
FL 5.6 ± 1.2 74 ± 12 6.7 ± 4.0 5.9 ± 2.9 6.5 ± 3.3 0.7 ± 1.0 15 0.095
One-way ANOVA statistics showed no significant difference between five baseline
measurements for CO (F = 0.203, p = 0.936), HR (F = 0.094, p = 0.984), PPVli
(F = 0.184, p = 0.946), SVVli (F = 0.254, p = 0.906) and SVVed (F = 0.390, p = 0.815),
indicating no significant effects over time.
On average, the tidal volume challenge showed no change in COtd and an increase in
PPVli, SVVli and SVVed. During the PEEP challenge we observed a decrease in COtd and
an increase of PPVli, SVVli and SVVed. Passive leg raising resulted in increased COtd and
decreased PPVli, SVVli and SVVed. The head-up challenge resulted in a decreased COtd
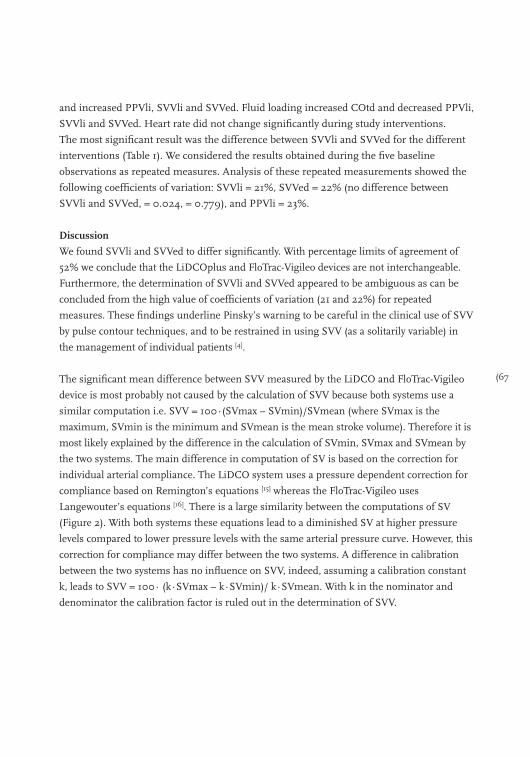
(67
and increased PPVli, SVVli and SVVed. Fluid loading increased COtd and decreased PPVli,
SVVli and SVVed. Heart rate did not change significantly during study interventions.
The most significant result was the difference between SVVli and SVVed for the different
interventions (Table 1). We considered the results obtained during the five baseline
observations as repeated measures. Analysis of these repeated measurements showed the
following coefficients of variation: SVVli = 21%, SVVed = 22% (no difference between
SVVli and SVVed, = 0.024, = 0.779), and PPVli = 23%.
Discussion
We found SVVli and SVVed to differ significantly. With percentage limits of agreement of
52% we conclude that the LiDCOplus and FloTrac-Vigileo devices are not interchangeable.
Furthermore, the determination of SVVli and SVVed appeared to be ambiguous as can be
concluded from the high value of coefficients of variation (21 and 22%) for repeated
measures. These findings underline Pinsky’s warning to be careful in the clinical use of SVV
by pulse contour techniques, and to be restrained in using SVV (as a solitarily variable) in
the management of individual patients [4].
The significant mean difference between SVV measured by the LiDCO and FloTrac-Vigileo
device is most probably not caused by the calculation of SVV because both systems use a
similar computation i.e. SVV = 100∙(SVmax – SVmin)/SVmean (where SVmax is the
maximum, SVmin is the minimum and SVmean is the mean stroke volume). Therefore it is
most likely explained by the difference in the calculation of SVmin, SVmax and SVmean by
the two systems. The main difference in computation of SV is based on the correction for
individual arterial compliance. The LiDCO system uses a pressure dependent correction for
compliance based on Remington’s equations [15] whereas the FloTrac-Vigileo uses
Langewouter’s equations [16]. There is a large similarity between the computations of SV
(Figure 2). With both systems these equations lead to a diminished SV at higher pressure
levels compared to lower pressure levels with the same arterial pressure curve. However, this
correction for compliance may differ between the two systems. A difference in calibration
between the two systems has no influence on SVV, indeed, assuming a calibration constant
k, leads to SVV = 100∙ (k∙SVmax – k∙SVmin)/ k∙SVmean. With k in the nominator and
denominator the calibration factor is ruled out in the determination of SVV.

68)
Figure 2 Similarity of calculation of cardiac output by the LiDCO system and by Edwards FloTrac-Vigileo
system. Arterial volume (V) changes derived after transformation of the radial artery pressure
(Prad) with Remington’s equations. Edward’s corrects cardiac output after SD calculation with
Langewouter’s equations.
In a recent paper Hofer et al. [17] compared the FloTrac-Vigileo and the PiCCOplus system
(Pulsion Medical Systems, Munich, Germany) for assessment of SVV to predict fluid
responsiveness. The authors found SVV measured by the PiCCO system to be higher than
the SVV by the FloTrac-Vigileo system. Besides this bias, we calculated from their Bland-
Altman analysis percentage limits of agreement of approximately 40% between the two
systems. The authors concluded that there was similar performance of the two investigated
systems in terms of predicting fluid responsiveness although the SVV threshold level in
predicting fluid responsiveness by the PiCCO system (12.1%) differed from the FloTrac-
Vigileo system (9.6%). The differences in absolute SVV values were explained by the
difference in signal detection sites (radial artery for FloTrac-Vigileo system and femoral
artery for PiCCO system) as well as difference in signal analysis techniques. In our study we
can exclude the influence of different detection sites because we used the same site for both
techniques, i.e. the radial artery. Thus the difference between SVVli and SVVed was most
probably related to differences in signal analysis. We did not calculate receiver operating
curves to calculate differences in thresholds for predicting fluid responsiveness because we
consider our number of fifteen patients too low. However, we expect different threshold
levels for the LiDCO and FloTrac-Vigileo system as well.
A wide range for the percentage limits of agreement (approximately 40%) can also be
observed in the study by de Castro et al. [18], in which SVV measured by the PiCCOplus
system was compared with SVV measured by aortic Doppler echocardiography.
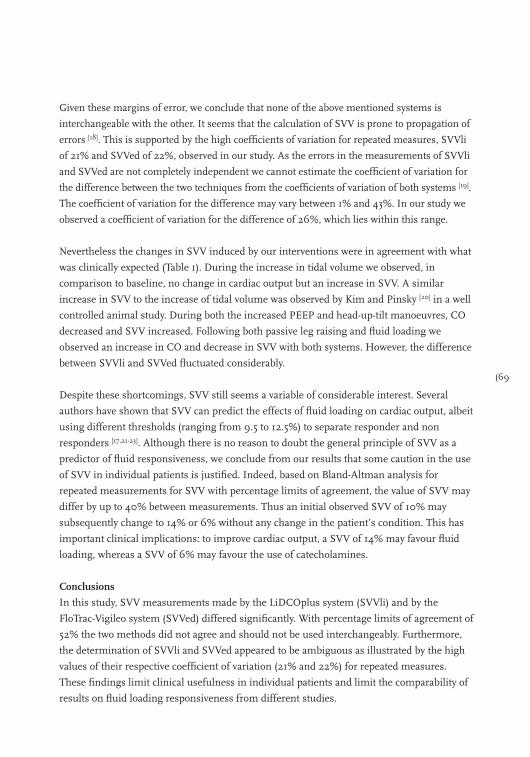
(69
Given these margins of error, we conclude that none of the above mentioned systems is
interchangeable with the other. It seems that the calculation of SVV is prone to propagation of
errors [18]. This is supported by the high coefficients of variation for repeated measures, SVVli
of 21% and SVVed of 22%, observed in our study. As the errors in the measurements of SVVli
and SVVed are not completely independent we cannot estimate the coefficient of variation for
the difference between the two techniques from the coefficients of variation of both systems [19].
The coefficient of variation for the difference may vary between 1% and 43%. In our study we
observed a coefficient of variation for the difference of 26%, which lies within this range.
Nevertheless the changes in SVV induced by our interventions were in agreement with what
was clinically expected (Table 1). During the increase in tidal volume we observed, in
comparison to baseline, no change in cardiac output but an increase in SVV. A similar
increase in SVV to the increase of tidal volume was observed by Kim and Pinsky [20] in a well
controlled animal study. During both the increased PEEP and head-up-tilt manoeuvres, CO
decreased and SVV increased. Following both passive leg raising and fluid loading we
observed an increase in CO and decrease in SVV with both systems. However, the difference
between SVVli and SVVed fluctuated considerably.
Despite these shortcomings, SVV still seems a variable of considerable interest. Several
authors have shown that SVV can predict the effects of fluid loading on cardiac output, albeit
using different thresholds (ranging from 9.5 to 12.5%) to separate responder and non
responders [17,21-23]. Although there is no reason to doubt the general principle of SVV as a
predictor of fluid responsiveness, we conclude from our results that some caution in the use
of SVV in individual patients is justified. Indeed, based on Bland-Altman analysis for
repeated measurements for SVV with percentage limits of agreement, the value of SVV may
differ by up to 40% between measurements. Thus an initial observed SVV of 10% may
subsequently change to 14% or 6% without any change in the patient’s condition. This has
important clinical implications: to improve cardiac output, a SVV of 14% may favour fluid
loading, whereas a SVV of 6% may favour the use of catecholamines.
Conclusions
In this study, SVV measurements made by the LiDCOplus system (SVVli) and by the
FloTrac-Vigileo system (SVVed) differed significantly. With percentage limits of agreement of
52% the two methods did not agree and should not be used interchangeably. Furthermore,
the determination of SVVli and SVVed appeared to be ambiguous as illustrated by the high
values of their respective coefficient of variation (21% and 22%) for repeated measures.
These findings limit clinical usefulness in individual patients and limit the comparability of
results on fluid loading responsiveness from different studies.
70)
References
1. Tavernier B, Makhotine O, Lebuffe G, Dupont J, Scherpereel P. Systolic pressure variation as a guide to fluid
therapy in patients with sepsis-induced hypotension. Anesthesiology 1998; 89: 1313-21.
2. Michard F, Chemla D, Richard C, et al. Clinical use of respiratory changes in arterial pulse pressure to
monitor the hemodynamic effects of PEEP. American Journal of Respiratory and Critical Care Medicine
1999; 159: 935-9.
3. Michard F, Teboul JL. Using heart-lung interactions to assess fluid responsiveness during mechanical
ventilation. Critical Care 2000; 4: 282-9.
4. Pinsky MR. Probing the limits of arterial pulse contour analysis to predict preload responsiveness.
Anesthesia and Analgesia 2003; 96: 1245-7.
5. Pinsky MR. Functional hemodynamic monitoring. Intensive Care Medicine 2002; 28: 386-8.
6. Linton RA, Jonas MM, Tibby SM, et al. Cardiac output measured by lithium dilution and transpulmonary
thermodilution in patients in a paediatric intensive care unit. Intensive Care Medicine 2000; 26: 1507-11.
7. Hamilton TT, Huber LM, Jessen ME. PulseCO: a less-invasive method to monitor cardiac output from
arterial pressure after cardiac surgery. Annals of Thoracic Surgery 2002; 74: S1408-S1412.
8. Button D, Weibel L, Reuthebuch O, et al. Clinical evaluation of the FloTrac/VigileoTM system and two
established continuous cardiac output monitoring devices in patients undergoing cardiac surgery. British
Journal of Anaesthesia 2007; 99: 329-36.
9. de Wilde RB, Schreuder JJ, van den Berg PC, Jansen JR. An evaluation of cardiac output by five arterial pulse
contour techniques during cardiac surgery. Anaesthesia 2007; 62: 760-8.
10. Jansen JR, Versprille A. Improvement of cardiac output estimation by the thermodilution method during
mechanical ventilation. Intensive Care Medicine 1986; 12: 71-9.
11. Jansen JR, Schreuder JJ, Settels JJ, Kloek JJ, Versprille A. An adequate strategy for the thermodilution
technique in patients during mechanical ventilation. Intensive Care Medicine 1990; 16: 422-5.
12. Bland JM, Altman DG. Statistical methods for assessing agreement between two methods of clinical
measurement. Lancet 1986; 1: 307-10.
13. Pitman EJ. A note on normal correlation. Biometrika 1939; 31: 9-12.
14. Snedecor GW, Cochran WG. Statistical Methods. The Iowa State University Press, 1980.
15. Remington JW, Noback CR, Hamilton WF, Gold JJ. Volume elasticity characteristics of the human aorta and
prediction of the stroke volume from the pressure pulse. American Journal of Physiology 1948; 153:
298-308.
16. Langewouters GJ, Wesseling KH, Goedhard WJ. The static elastic properties of 45 human thoracic and 20
abdominal aortas in vitro and the parameters of a new model. Journal of Biomechanics 1984; 17: 425-35.
17. Hofer CK, Senn A, Weibel L, Zollinger A. Assessment of stroke volume variation for prediction of fluid
responsiveness using the modified FloTracTM and PiCCOplusTM system. Critical Care 2008; 12: R82.
18. De Castro V, Goarin JP, Lhotel L, et al. Comparison of stroke volume (SV) and stroke volume respiratory
variation (SVV) measured by the axillary artery pulse-contour method and by aortic Doppler
echocardiography in patients undergoing aortic surgery. British Journal of Anaesthesia 2006; 97: 605-10.
19. Critchley LA, Critchley JA. A meta-analysis of studies using bias and precision statistics to compare cardiac
output measurement techniques. Journal of Clinical Monitoring and Computing 1999; 15: 85-91.
20. Kim HK, Pinsky MR. Effect of tidal volume, sampling duration, and cardiac contractility on pulse pressure
and stroke volume variation during positive-pressure ventilation. Critical Care Medicine 2008.
21. Hofer CK, Muller SM, Furrer L, et al. Stroke volume and pulse pressure variation for prediction of fluid
responsiveness in patients undergoing off-pump coronary artery bypass grafting. Chest 2005; 128: 848-54.

(71
22. Reuter DA, Kirchner A, Felbinger TW, et al. Usefulness of left ventricular stroke volume variation to assess
fluid responsiveness in patients with reduced cardiac function. Critical Care Medicine 2003; 31: 1399-404.
23. Preisman S, Kogan S, Berkenstadt H, Perel A. Predicting fluid responsiveness in patients undergoing
cardiac surgery: functional haemodynamic parameters including the Respiratory Systolic Variation Test and
static preload indicators. British Journal of Anaesthesia 2005; 95: 746-55.

72)
Section 2
Hemodynamic management

(73
Chapter 4
Hemodynamic assessment in Dutch intensive care units
Bart Geerts, Jacinta Maas, Rob de Wilde, Herbert Harinck and Jos Jansen
Netherlands Journal of Critical Care 2009; 13(4): 178-84
74)
The prolonged presence of hypovolaemia seriously impairs oxygen delivery to vital organs,
hence fluid loading is indicated [1]. However, unnecessary fluid administration can lead to
general and pulmonary oedema and cardiac failure [1,2]. Therefore, the selection of patients that
will benefit from fluid administration is critical.
This selection is traditionally based on clinical signs such as urine colour and production, as
well as on filling pressures such as central venous pressure (CVP) and pulmonary artery
wedge pressure (PAWP). In 1998, Boldt and colleagues performed a survey and reported
that 93% of all ICU physicians in Germany used CVP and 58% used PAWP to assess volume
status [3]. Nevertheless, neither clinical signs nor filling pressures have unambiguously been
shown to discriminate between those patients who benefit from fluid loading and those who
do not [4-6]. In most studies, this beneficial effect was defined as a significant increase in
cardiac output. Because, in principle, nearly all patients will experience an increase in
cardiac output after fluid loading [7], there is a necessity to differentiate between an increase
in measured cardiac output (CO) after fluid loading and a “clinically” significant increase in
CO. In fluid-loading-responsiveness studies, responders and non-responders are divided by
an increase of 10% in CO after approximately 500 ml of fluid loading. Furthermore, the
presence of fluid-responsiveness does not imply the need for fluid loading. Not only the
ability to accurately predict the effect on CO after fluid loading is important but, for instance,
also tissue O2 in the different organs and outcome need more attention.
In recent years, new variables based on heart-lung interaction, i.e. respiratory-induced stroke
volume variation (SVV), pulse pressure variation (PPV) and systolic pressure variation (SPV),
have been introduced [8]. These variables have been studied extensively but results regarding
their predictive value in identifying responders and non-responders on fluid loading have
been contradictory [9-11]. In addition, loading the circulation with small amounts of fluid (up
to 500 ml) [12], or by passive leg raising (PLR) [7, 13-17] have become the subject of intense
interest in assessing fluid loading responsiveness (or in other words to identify patients who
will benefit from fluid loading).
We evaluated the impact of newly derived variables (SVV, PPV and SPV), fluid challenges
and PLR, and new cardiac output devices in daily practice in Dutch intensive care units.
Finally, we investigated the use of guidelines to monitor volume status and fluid
responsiveness in the ICU.
Materials and methods
A questionnaire was sent via the Dutch Society of Intensive Care (NVIC) to 446 Dutch
intensive care physicians (i.e. intensivists and fellows) working in one of the 99 hospitals
with an ICU in the Netherlands. In the Netherlands, most intensive care physicians are
members of the NVIC. A cover letter was included to provide background information and a
(75
stamped addressed return envelope was added. The questionnaires were sent by regular
mail in March 2008.
The questionnaire was designed to be answered within 10 minutes. The questionnaire was
checked by a sociologist with experience in the design of surveys. The majority of questions
were multiple choice. The questionnaire consisted of seventeen questions and covered three
topics: 1. General characteristics of ICU physicians; prior specialty training, experience level,
type of hospital; 2. Assessment of haemodynamic condition and treatment of patients; use of
clinical signs, haemodynamic parameters and challenges to the circulation; 3. Guidelines
used in the ICU; definitions of hypovolaemia and hypervolaemia, use of guidelines, date of
guideline update. The questionnaire was in Dutch. A translation is shown in the appendix.
Questionnaires were collected up to one month after being sent. The completed
questionnaires were returned anonymously.
Because of the exploratory character of the data, analysis consisted of descriptive techniques
and chi-square tests when appropriate (SPSS 14.0.1 for Windows, SPSS Inc., Chicago, IL).
Results are expressed in frequencies. A p-value of ≤ 0.05 was regarded significant.
Results
General characteristic of ICU physicians
Altogether 176 of 446 (39%) questionnaires were returned. Respondents were
predominantly specialized in internal medicine and anaesthesiology, the experience level
within these two specialties was not significantly different (χ2, p=0.079). Characteristics of
respondents are shown in Table 1.
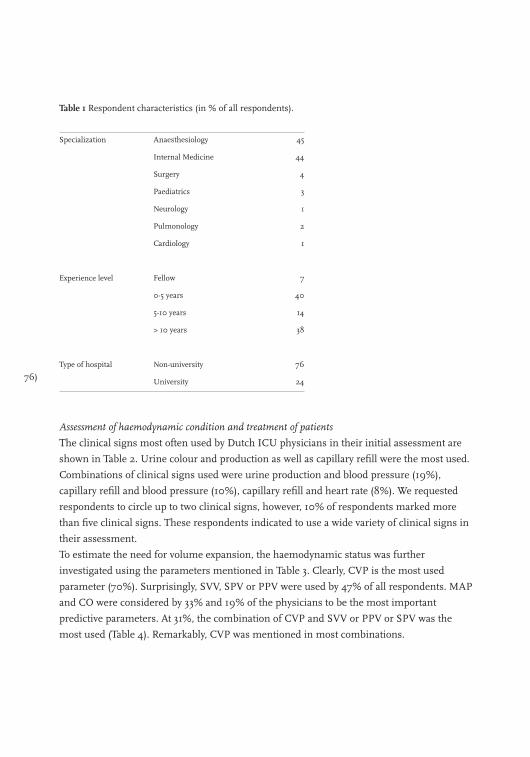
76)
Table 1 Respondent characteristics (in % of all respondents).
Specialization Anaesthesiology 45
Internal Medicine 44
Surgery 4
Paediatrics 3
Neurology 1
Pulmonology 2
Cardiology 1
Experience level Fellow 7
0-5 years 40
5-10 years 14
> 10 years 38
Type of hospital Non-university 76
University 24
Assessment of haemodynamic condition and treatment of patients
The clinical signs most often used by Dutch ICU physicians in their initial assessment are
shown in Table 2. Urine colour and production as well as capillary refill were the most used.
Combinations of clinical signs used were urine production and blood pressure (19%),
capillary refill and blood pressure (10%), capillary refill and heart rate (8%). We requested
respondents to circle up to two clinical signs, however, 10% of respondents marked more
than five clinical signs. These respondents indicated to use a wide variety of clinical signs in
their assessment.
To estimate the need for volume expansion, the haemodynamic status was further
investigated using the parameters mentioned in Table 3. Clearly, CVP is the most used
parameter (70%). Surprisingly, SVV, SPV or PPV were used by 47% of all respondents. MAP
and CO were considered by 33% and 19% of the physicians to be the most important
predictive parameters. At 31%, the combination of CVP and SVV or PPV or SPV was the
most used (Table 4). Remarkably, CVP was mentioned in most combinations.

(77
Table 2 Clinical signs used in the assessment of volume status.
Clinical signs Frequency (in %)
Urine colour or production 39
Capillary refill 28
Blood pressure 7
More than five clinical signs 10
Skin turgor 7
Body temperature 5
Dry mouth 1
Fluid balance 2
Heart rate 1
Table 3 Parameters used in the assessment of volume status.
Parameter Frequency (in %)*
CVP 70
SVV, PPV or SPV 47
MAP 33
Serum urea and creatinine 22
CO 20
SvO2 20
Urine sodium 15
TEE 14
PAWP 12
Serum lactate 8
SAP 4
LVED 2
Shape of arterial wave 1
* Total frequency exceeds 100% since multiple parameters can be used by a respondent
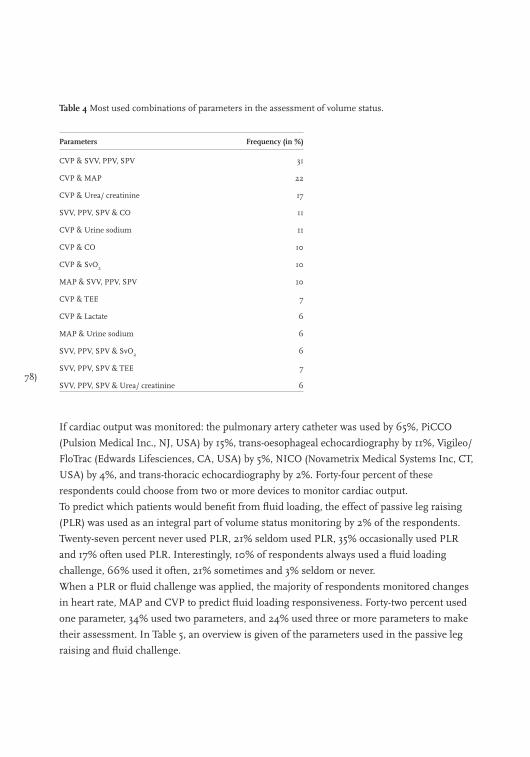
78)
Table 4 Most used combinations of parameters in the assessment of volume status.
Parameters Frequency (in %)
CVP & SVV, PPV, SPV 31
CVP & MAP 22
CVP & Urea/ creatinine 17
SVV, PPV, SPV & CO 11
CVP & Urine sodium 11
CVP & CO 10
CVP & SvO2 10
MAP & SVV, PPV, SPV 10
CVP & TEE 7
CVP & Lactate 6
MAP & Urine sodium 6
SVV, PPV, SPV & SvO2 6
SVV, PPV, SPV & TEE 7
SVV, PPV, SPV & Urea/ creatinine 6
If cardiac output was monitored: the pulmonary artery catheter was used by 65%, PiCCO
(Pulsion Medical Inc., NJ, USA) by 15%, trans-oesophageal echocardiography by 11%, Vigileo/
FloTrac (Edwards Lifesciences, CA, USA) by 5%, NICO (Novametrix Medical Systems Inc, CT,
USA) by 4%, and trans-thoracic echocardiography by 2%. Forty-four percent of these
respondents could choose from two or more devices to monitor cardiac output.
To predict which patients would benefit from fluid loading, the effect of passive leg raising
(PLR) was used as an integral part of volume status monitoring by 2% of the respondents.
Twenty-seven percent never used PLR, 21% seldom used PLR, 35% occasionally used PLR
and 17% often used PLR. Interestingly, 10% of respondents always used a fluid loading
challenge, 66% used it often, 21% sometimes and 3% seldom or never.
When a PLR or fluid challenge was applied, the majority of respondents monitored changes
in heart rate, MAP and CVP to predict fluid loading responsiveness. Forty-two percent used
one parameter, 34% used two parameters, and 24% used three or more parameters to make
their assessment. In Table 5, an overview is given of the parameters used in the passive leg
raising and fluid challenge.
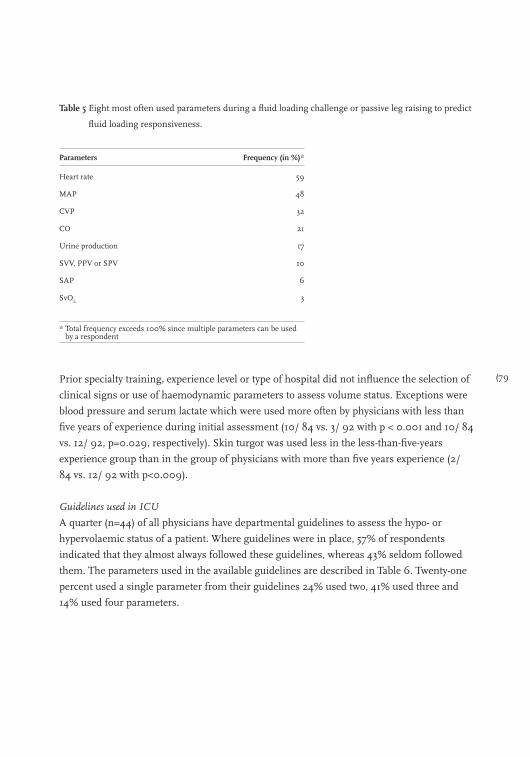
(79
Table 5 Eight most often used parameters during a fluid loading challenge or passive leg raising to predict
fluid loading responsiveness.
Parameters Frequency (in %)*
Heart rate 59
MAP 48
CVP 32
CO 21
Urine production 17
SVV, PPV or SPV 10
SAP 6
SvO2 3
* Total frequency exceeds 100% since multiple parameters can be used by a respondent
Prior specialty training, experience level or type of hospital did not influence the selection of
clinical signs or use of haemodynamic parameters to assess volume status. Exceptions were
blood pressure and serum lactate which were used more often by physicians with less than
five years of experience during initial assessment (10/ 84 vs. 3/ 92 with p < 0.001 and 10/ 84
vs. 12/ 92, p=0.029, respectively). Skin turgor was used less in the less-than-five-years
experience group than in the group of physicians with more than five years experience (2/
84 vs. 12/ 92 with p<0.009).
Guidelines used in ICU
A quarter (n=44) of all physicians have departmental guidelines to assess the hypo- or
hypervolaemic status of a patient. Where guidelines were in place, 57% of respondents
indicated that they almost always followed these guidelines, whereas 43% seldom followed
them. The parameters used in the available guidelines are described in Table 6. Twenty-one
percent used a single parameter from their guidelines 24% used two, 41% used three and
14% used four parameters.
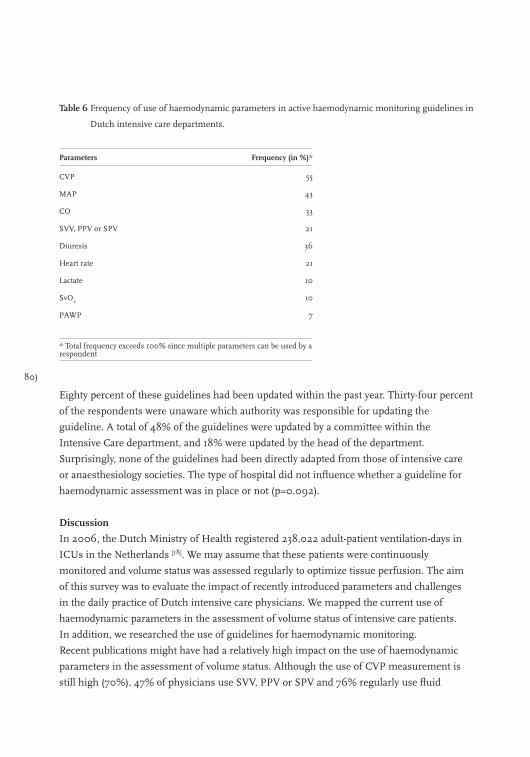
80)
Table 6 Frequency of use of haemodynamic parameters in active haemodynamic monitoring guidelines in
Dutch intensive care departments.
Parameters Frequency (in %)*
CVP 55
MAP 43
CO 33
SVV, PPV or SPV 21
Diuresis 36
Heart rate 21
Lactate 10
SvO2 10
PAWP 7
* Total frequency exceeds 100% since multiple parameters can be used by a respondent
Eighty percent of these guidelines had been updated within the past year. Thirty-four percent
of the respondents were unaware which authority was responsible for updating the
guideline. A total of 48% of the guidelines were updated by a committee within the
Intensive Care department, and 18% were updated by the head of the department.
Surprisingly, none of the guidelines had been directly adapted from those of intensive care
or anaesthesiology societies. The type of hospital did not influence whether a guideline for
haemodynamic assessment was in place or not (p=0.092).
Discussion
In 2006, the Dutch Ministry of Health registered 238,022 adult-patient ventilation-days in
ICUs in the Netherlands [18]. We may assume that these patients were continuously
monitored and volume status was assessed regularly to optimize tissue perfusion. The aim
of this survey was to evaluate the impact of recently introduced parameters and challenges
in the daily practice of Dutch intensive care physicians. We mapped the current use of
haemodynamic parameters in the assessment of volume status of intensive care patients.
In addition, we researched the use of guidelines for haemodynamic monitoring.
Recent publications might have had a relatively high impact on the use of haemodynamic
parameters in the assessment of volume status. Although the use of CVP measurement is
still high (70%), 47% of physicians use SVV, PPV or SPV and 76% regularly use fluid
(81
challenges in their assessment. There is no uniformity or consensus on the use of
parameters in evaluating volume status. This is supported by the low number of ICUs with
guidelines for haemodynamic monitoring of volume status and fluid loading. In addition,
43% of physicians reported that they barely used the available guidelines.
The incidence of use of SVV, PPV or SPV is remarkable for several reasons. First, we found
that pulse contour devices are used less than thermodilution devices to measure CO. This
contrasts the finding that SVV, PPV and SPV are used by 47% and CO by 19%. Second, the
use of these parameters in haemodynamic monitoring has primarily been studied in cardiac
surgery patients [10, 19, 20]. Third, the use of these parameters is restricted to sedated patients
fully dependent on mechanical ventilation [21]. Moreover, the average duration of mechanical
ventilation is decreasing due to fast track protocols [22]. Fourth, arrhythmia, a common
phenomenon in ICU patients, hampers the use of SVV, PPV and SPV. Fifth, variations in
stroke volume and arterial pressure are found to be reliable only when ventilation with
larger tidal volumes (> 8 ml∙kg-1) are used [8] while ventilation with lower tidal volumes
(< 6 ml∙kg-1) are advocated in the ARDSnet study for ARDS/ALI patients.
CVP is still frequently used although its use is controversial. In a recent review the authors
calculated a pooled area under the receiver operating curve to predict fluid loading
responsiveness for CVP of 0.56. They proposed the discontinuation of the routine
measurement of CVP to monitor volume status of the patients in the ICU or operating
room [23]. Moreover, several studies have shown SVV to be a better predictor of fluid loading
responsiveness than CVP [10, 24, 25].
Passive leg raising has been studied for a number of years, and in this survey its use was
limited to 17% of the responding intensivists. Although one advantage of PLR over fluid
challenge could be the reversibility of the fluid challenge, 76% of respondents indicate using
a fluid challenge. These findings become less surprising when we consider that the fluid
challenge as well as SVV, PPV or SPV have been the subject of investigation since the
1990’s. We hypothesize that considerable time has to elapse before experimental findings
become a routine part of clinical care. Nevertheless, it can also be argued that the difference
in use of PLR and fluid challenge is explained by the robustness of the fluid challenge.
When a challenge to the circulation is used to assess volume status, heart rate, MAP and CVP
are most often used parameters to monitor and predict fluid loading responsiveness. Several
of the most-often-used parameters, however, do not concur with recent literature. Change in
CVP due to PLR for instance, has been shown to be an unreliable predictor [15]. The reliability
of other parameters such as urine production and SvO2 has not been studied during a
challenge. This could also imply that some of the respondents performed another type of
fluid challenge.
82)
It must also be noted that the use of lactate is mentioned by only 8% of respondents even
though “surviving sepsis” and “early goal directed therapy” clearly advocate the use of lactate [26,27]. This could be explained by the limitation of the number of answers that could be given
in this survey. However, SvO2 is used by 19% of respondents and this parameter is also
advocated in both guidelines [26,27].
Other surveys
In Germany in 1997, Boldt and colleagues performed a survey to assess fluid loading
strategies in ICUs [3]. In this survey CVP was used by 93% of respondents and PAWP by 58%,
while the dynamic parameters SVV, PPV or SPV were barely used [3]. We assume that similar
strategies have been used in haemodynamic management in Dutch and German ICUs. In the
current survey, the incidence of use of CVP and especially PAWP, is lower and a large group of
ICU physicians used SVV, SPV or PPV as parameter.
More recently, in 2006, Kastrup and colleagues sent a questionnaire to the leading physicians
of 80 cardiac surgery ICUs in Germany [28]. In this subgroup, CVP, MAP and PAWP were
used more frequently (89%, 84% and 33% respectively), while SVV, SPV or SPV was used by
only 15% [28]. We attribute differences in Kastrup’s and our findings to differences in the
surveyed subgroup, time, and/or the country in which the survey was performed, and
concomitant differences in the setup of post-registration education programmes.
Considerations
Firstly, although an acceptable return rate of 39% was achieved, inherent to this type of
survey, it must be noted that it may not represent all physicians. In contrast, Boldt [3] and
Kastrup [28] achieved return rates of around 60%. Secondly, the completed questionnaires
were returned anonymously. Hence, we could not determine a no-response bias. Thirdly,
some answers could have been ‘desired’ answers. The finding that 47% of respondents use
SVV, PPV and/or SPV to evaluate volume status seems to be at odds with the actual use of
pulse contour methods (20% of respondents). Lastly, the group of physicians with an
academic position seems overrepresented as we got 24% respondents from academic
hospitals whereas actually only 8% of ICU physicians have an academic position [18].
However, we could not detect a difference in response, for any of the questions (including
usage of guidelines), between the two groups. Therefore, we do not regard this
overrepresentation as a significant bias.
Conclusions
The present survey shows that CVP is still the most often used parameter to guide fluid
loading. However, Dutch ICU physicians are remarkably compliant in using recently
developed and published dynamic parameters as SVV and PPV as well as fluid challenges.

(83
References
1. Weil H, Henning RJ. New concepts in the diagnosis and fluid treatment of circulatory shock. Thirteenth
annual Becton, Dickinson and Company Oscar Schwidetsky Memorial Lecture. Anesth Analg 1979;
58: 124-32.
2. Shoemaker WC, Czer LS, et al. Evaluation of the biologic importance of various hemodynamic and oxygen
transport variables: which variables should be monitored in postoperative shock? Crit Care Med 1979;
7: 424-31.
3. Boldt J, et al. Volume replacement strategies on intensive care units: results from a postal survey. Intensive
Care Med 1998; 24: 147-51.
4. Kumar A, et al. Pulmonary artery occlusion pressure and central venous pressure fail to predict ventricular
filling volume, cardiac performance, or the response to volume infusion in normal subjects. Crit Care Med
2004; 32: 691-9.
5. Tavernier B, et al. Systolic pressure variation as a guide to fluid therapy in patients with sepsis-induced
hypotension. Anesthesiology 1998; 89: 1313-21.
6. Stephan F, et al. Clinical evaluation of circulating blood volume in critically ill patients--contribution of a
clinical scoring system. Br J Anaesth 2001; 86: 754-62.
7. Monnet X, et al. Passive leg raising predicts fluid responsiveness in the critically ill. Crit Care Med 2006;
34: 1402-7.
8. Michard F, et al. Changes in arterial pressure during mechanical ventilation. Anesthesiology 2005;
103: 419-28.
9. Reuter DA, et al. Effects of mid-line thoracotomy on the interaction between mechanical ventilation and
cardiac filling during cardiac surgery. Br J Anaesth 2004; 92: 808-13.
10. Hofer CK, et al. Stroke volume and pulse pressure variation for prediction of fluid responsiveness in patients
undergoing off-pump coronary artery bypass grafting. Chest 2005; 128: 848-54.
11. Wiesenack C, et al. Stroke volume variation as an indicator of fluid responsiveness using pulse contour
analysis in mechanically ventilated patients. Anesth Analg 2003; 96: 1254-7.
12. Vincent JL, Weil MH, et al. Fluid challenge revisited. Crit Care Med 2006; 34: 1333-7.
13. Boulain T, et al. Changes in BP induced by passive leg raising predict response to fluid loading in critically ill
patients. Chest 2002; 121: 1245-52.
14. Lafanechere A, et al. Changes in aortic blood flow induced by passive leg raising predict fluid responsiveness
in critically ill patients. Crit Care 2006; 10: R132.
15. Cannesson M, et al. Prediction of fluid responsiveness using respiratory variations in left ventricular stroke
area by transesophageal echocardiographic automated border detection in mechanically ventilated patients.
Crit Care 2006; 10: R171.
16. Maizel J, et al. Diagnosis of central hypovolemia by using passive leg raising. Intensive Care Med 2007; 33:
1133-8.
17. Lamia B, et al. Echocardiographic prediction of volume responsiveness in critically ill patients with
spontaneously breathing activity. Intensive Care Med 2007; 33: 1125-32.
18. Inspectie voor de Gezondheidszorg, Intensive Care. Het resultaat telt 2006; 2007. 107.
19. Bendjelid K, et al. The respiratory change in preejection period: a new method to predict fluid
responsiveness. J Appl Physiol 2004; 96: 337-42.
20. Kramer A, et al. Pulse pressure variation predicts fluid responsiveness following coronary artery bypass
surgery. Chest 2004; 126: 1563-8.
21. Michard F, Teboul JL, Using heart-lung interactions to assess fluid responsiveness during mechanical
ventilation. Crit Care 2000; 4: 282-9.

84)
22. Flynn M, et al. Fast-tracking revisited: routine cardiac surgical patients need minimal intensive care.
Eur J Cardiothorac Surg 2004; 25: 116-22.
23. Marik PE, Baram M, Vahid B, et al. Does central venous pressure predict fluid responsiveness? A systematic
review of the literature and the tale of seven mares. Chest 2008; 134: 172-8.
24. Hofer CK, et al. Assessment of stroke volume variation for prediction of fluid responsiveness using the
modified FloTrac and PiCCOplus system. Crit Care 2008; 12: R82.
25. de Waal EE, et al. Dynamic preload indicators fail to predict fluid responsiveness in open-chest conditions.
Crit Care Med 2009; R3.
26. Dellinger RP, et al. Surviving Sepsis Campaign: international guidelines for management of severe sepsis
and septic shock: 2008. Crit Care Med 2008; 36: 296-327.
27. Rivers EP, Coba V, Whitmill M, et al. Early goal-directed therapy in severe sepsis and septic shock: a
contemporary review of the literature. Curr Opin Anaesthesiol 2008; 21: 128-40.
28. Kastrup M, et al. Current practice of hemodynamic monitoring and vasopressor and inotropic therapy in
post-operative cardiac surgery patients in Germany: results from a postal survey. Acta Anaesthesiol Scand
2007; 51: 347-58.

(85
Appendix Questionnaire volume status assessment and fluid loading
1. What is your specialty training, besides intensive care medicine? Circle your choice:
a. Anaesthesiology
b. Cardiology
c. Cardiac surgery
d. Surgery
e. Internal medicine
f. Pulmonology
g. Neurosurgery
h. Neurology
i. Other, ____________________________________
2. How long have you been an intensive care physician? Circle your choice:
a. Fellow
b. 0-5 years
c. 5-10 years
d. > 10 years
3. In what type of hospital do you work? Circle your choice:
a. University hospital
b. Non-university hospital
4. Which clinical indicators do you use to decide on further analyses of a patient’s volume status?
Please circle a maximum of two choices:
a. Skin turgor
b. Dry mouth
c. Dry axillae
d. Urine colour and/or production
e. Body temperature
f. Capillary refill
g. Colour of the extremities
h. Fluid balance
i. Blood pressure
j. Heart rate
k. Other, ____________________________________

86)
5. Which indicator(s) do you use to determine the volume status of the patient?
Please circle up to three of your choices:
a. Central venous pressure
b. Mean arterial pressure
c. Pulmonary arterial pressure
d. Systolic arterial pressure
e. Pulmonary arterial wedge pressure
f. Dynamic parameters: SVV, PPV or SPV
g. Cardiac output
h. PaO2
i. SvO2
j. Trans-oesophageal Doppler echography
k. Plasma urea, creatinine or electrolytes
l. Urine sodium
m. Serum lactate
n. Other, ____________________________________
6. When you determine cardiac output, which device do you use? Circle your choice(s):
a. None
b. Pulmonary artery catheter (thermodilution bolus/ continue)
c. Trans-pulmonary thermodilution
d. Trans-oesophageal Doppler
e. Pulse contour - PiCCO
f. - LidCO
g. - Vigileo/ Flotrac
h. Other, ____________________________________
7. Do you use passive leg raising (PLR) to determine the volume status of your patients? Circle your choice:
a. Never
b. Seldom
c. Once in a while
d. Often
e. Always
8. Do you use fluid challenges to assess the volume status of your patients? Circle your choice:
a. Never
b. Seldom
c. Once in a while
d. Often
e. Always
9. If you use PLR and/or fluid challenges, which parameters do you use to determine the outcome?
Parameter(s): _____________________________________________________

(87
10. Are there guidelines or protocols in your ICU in which parameters for hypo- or hypervolaemia are used. If
yes, which parameters? Please circle your choice:
a. No
b. Yes, the parameter(s) are: ______________________________________
11. If such guidelines exist, do you use the definition for hypo- or hypervolaemia?
Please circle your choice:
Hypovolaemia: Hypervolaemia:
a. Always a. Always
b. Often b. Often
c. Once in a while c. Once in a while
d. Seldom d. Seldom
e. Never e. Never
f. Not defined f. Not defined
12. Are there guidelines in use in your ICU on how to perform fluid loading? Please circle your choice:
a. Yes, please continue with the next question
b. No, this is the end of the questionnaire
13. Do you use these guidelines for fluid loading in your treatment? Please circle your choice:
a. Always
b. Often
c. Once in a while
d. Seldom
e. Never
14. If yes (question 12), when were these guidelines last updated? ____/____/____
15. Who is responsible for keeping these guidelines up to date? Please circle your choice:
a. A committee related to the ICU
b. A committee related to another department in the hospital
c. A society or organization, namely; ________________
d. Head of the department

88)

(89
Chapter 5
Fluid loading responsiveness: what parameter can we use?
Bart Geerts, Leon Aarts and Jos Jansen
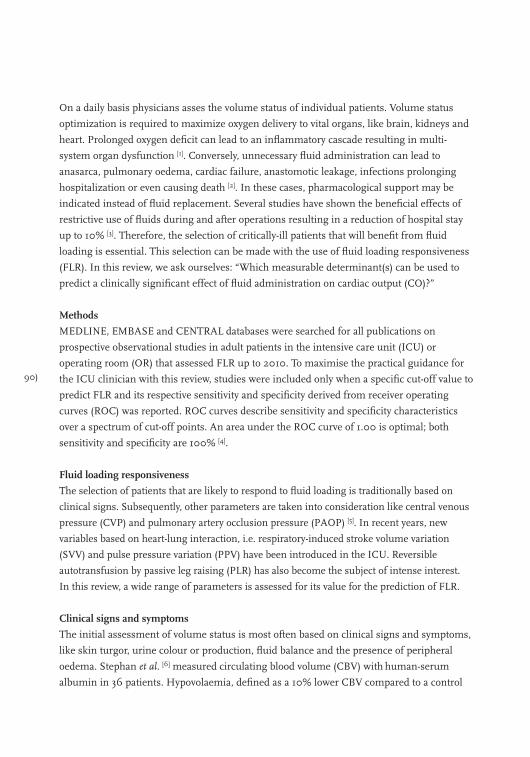
90)
On a daily basis physicians asses the volume status of individual patients. Volume status
optimization is required to maximize oxygen delivery to vital organs, like brain, kidneys and
heart. Prolonged oxygen deficit can lead to an inflammatory cascade resulting in multi-
system organ dysfunction [1]. Conversely, unnecessary fluid administration can lead to
anasarca, pulmonary oedema, cardiac failure, anastomotic leakage, infections prolonging
hospitalization or even causing death [2]. In these cases, pharmacological support may be
indicated instead of fluid replacement. Several studies have shown the beneficial effects of
restrictive use of fluids during and after operations resulting in a reduction of hospital stay
up to 10% [3]. Therefore, the selection of critically-ill patients that will benefit from fluid
loading is essential. This selection can be made with the use of fluid loading responsiveness
(FLR). In this review, we ask ourselves: “Which measurable determinant(s) can be used to
predict a clinically significant effect of fluid administration on cardiac output (CO)?”
Methods
MEDLINE, EMBASE and CENTRAL databases were searched for all publications on
prospective observational studies in adult patients in the intensive care unit (ICU) or
operating room (OR) that assessed FLR up to 2010. To maximise the practical guidance for
the ICU clinician with this review, studies were included only when a specific cut-off value to
predict FLR and its respective sensitivity and specificity derived from receiver operating
curves (ROC) was reported. ROC curves describe sensitivity and specificity characteristics
over a spectrum of cut-off points. An area under the ROC curve of 1.00 is optimal; both
sensitivity and specificity are 100% [4].
Fluid loading responsiveness
The selection of patients that are likely to respond to fluid loading is traditionally based on
clinical signs. Subsequently, other parameters are taken into consideration like central venous
pressure (CVP) and pulmonary artery occlusion pressure (PAOP) [5]. In recent years, new
variables based on heart-lung interaction, i.e. respiratory-induced stroke volume variation
(SVV) and pulse pressure variation (PPV) have been introduced in the ICU. Reversible
autotransfusion by passive leg raising (PLR) has also become the subject of intense interest.
In this review, a wide range of parameters is assessed for its value for the prediction of FLR.
Clinical signs and symptoms
The initial assessment of volume status is most often based on clinical signs and symptoms,
like skin turgor, urine colour or production, fluid balance and the presence of peripheral
oedema. Stephan et al. [6] measured circulating blood volume (CBV) with human-serum
albumin in 36 patients. Hypovolaemia, defined as a 10% lower CBV compared to a control
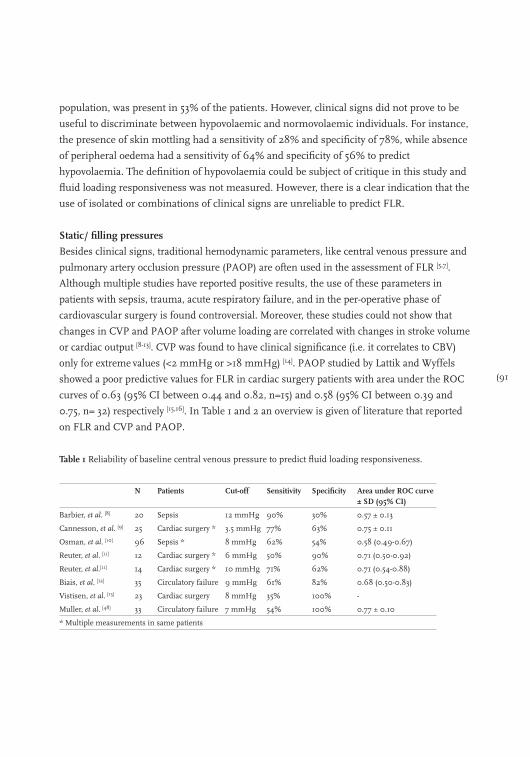
(91
population, was present in 53% of the patients. However, clinical signs did not prove to be
useful to discriminate between hypovolaemic and normovolaemic individuals. For instance,
the presence of skin mottling had a sensitivity of 28% and specificity of 78%, while absence
of peripheral oedema had a sensitivity of 64% and specificity of 56% to predict
hypovolaemia. The definition of hypovolaemia could be subject of critique in this study and
fluid loading responsiveness was not measured. However, there is a clear indication that the
use of isolated or combinations of clinical signs are unreliable to predict FLR.
Static/ filling pressures
Besides clinical signs, traditional hemodynamic parameters, like central venous pressure and
pulmonary artery occlusion pressure (PAOP) are often used in the assessment of FLR [5,7].
Although multiple studies have reported positive results, the use of these parameters in
patients with sepsis, trauma, acute respiratory failure, and in the per-operative phase of
cardiovascular surgery is found controversial. Moreover, these studies could not show that
changes in CVP and PAOP after volume loading are correlated with changes in stroke volume
or cardiac output [8-13]. CVP was found to have clinical significance (i.e. it correlates to CBV)
only for extreme values (<2 mmHg or >18 mmHg) [14]. PAOP studied by Lattik and Wyffels
showed a poor predictive values for FLR in cardiac surgery patients with area under the ROC
curves of 0.63 (95% CI between 0.44 and 0.82, n=15) and 0.58 (95% CI between 0.39 and
0.75, n= 32) respectively [15,16]. In Table 1 and 2 an overview is given of literature that reported
on FLR and CVP and PAOP.
Table 1 Reliability of baseline central venous pressure to predict fluid loading responsiveness.
N Patients Cut-off Sensitivity Specificity Area under ROC curve ± SD (95% CI)
Barbier, et al. [8] 20 Sepsis 12 mmHg 90% 30% 0.57 ± 0.13
Cannesson, et al. [9] 25 Cardiac surgery * 3.5 mmHg 77% 63% 0.75 ± 0.11
Osman, et al. [10] 96 Sepsis * 8 mmHg 62% 54% 0.58 (0.49-0.67)
Reuter, et al. [11] 12 Cardiac surgery * 6 mmHg 50% 90% 0.71 (0.50-0.92)
Reuter, et al.[11] 14 Cardiac surgery * 10 mmHg 71% 62% 0.71 (0.54-0.88)
Biais, et al. [12] 35 Circulatory failure 9 mmHg 61% 82% 0.68 (0.50-0.83)
Vistisen, et al. [13] 23 Cardiac surgery 8 mmHg 35% 100% -
Muller, et al. [48] 33 Circulatory failure 7 mmHg 54% 100% 0.77 ± 0.10
* Multiple measurements in same patients
92)
Table 2 Reliability of baseline pulmonary artery occlusion pressure to predict fluid loading responsiveness.
N Patients Cut-off Sensitivity Specificity Area under ROC curve ± SD (95% CI)
Osman, et al. [10] 96 Sepsis 11 mmHg 77% 51% 0.63 (0.55-0.70)
Reuter, et al. [11] 12 Cardiac surgery * 7 mmHg 79% 70% 0.77 (0.58-0.96)
Reuter, et al. [11] 14 Cardiac surgery * 8 mmHg 59% 75% 0.70 (0.52-0.88)
* Multiple measurements in same patients
It seems that CVP and PAOP are not suitable for standard evaluation of FLR. This is most
like due to the large differences in myocardial function. Especially in critically ill, myocardial
function is oftentimes depressed. Since CVP and PAOP are directly related to the function of
the heart as well as mechanical ventilation, the absolute magnitude of these parameters in
itself are not reliable in predicting FLR.
Although mean arterial pressure (MAP) is a well-identified goal to maintain perfusion of
vital organs, it has not been studied extensively for its value to predict FLR. There are only
two studies available that report on the reliability of MAP to predict FLR; Preisman and
Kramer studied the reliability of baseline mean arterial pressure to predict fluid
responsiveness and found areas under the ROC curves of 0.73 (95% CI between 0.60 and
0.87, n=18) and 0.81 (95% CI between 0.62 and 1.00, n=21) respectively [17,18]. Preisman
found MAP at a cut-off of 76.5 mmHg to have a sensitivity of 64% and a specificity of 77%
to predict FLR in 18 post-elective CABG surgery.
The low predictive value of MAP is likely related to the influence of disease state, for
instance vasoplegia in sepsis, and pre-existing differences in normotensive values in-
between individuals. These differences also complicate consensus on target blood pressures
to guarantee perfusion of the brain and other vital organs. The International Consensus
Conference on Hemodynamic Monitoring in 2006 found moderate to low evidence to
implement target blood pressures in the management of shock [19]. This because relevant
clinical studies were absent.
Heart rate
Heart rate (HR) has been studied on a small scale. Kramer et al. [18] reported baseline HR to
predict FLR with an area under the ROC curve of 0.81 (95% CI between 0.61 and 1.00) in
coronary by-pass grafting surgery patients. Berkenstadt [20] reported an AUC of 0.59 (95% CI
between 0.44 and 0.64) under the ROC curve to predict FLR in patients undergoing
neurosurgery.
In theory, heart rate is considered to be a good predictor of FLR. For instance, in young
spontaneous-breathing trauma patients, tachycardia is indicative of severe haemorrhage.

(93
However, in patients fully under mechanical ventilation and anaesthesia, neuronal and
humoral control seems completely blocked. Consequently a relation is lacking between
baseline or change in HR and changes in CO due to fluid loading. Moreover, a large number
of patients are receiving beta-blockade further complicating the possibility to use heart rate
to predict FLR.
Cardiac output
CO has been used to predict FLR. However, results concerning the reliability of baseline
cardiac output measurements to predict FLR are non-uniform. Baseline cardiac output to
predict FLR has been predominantly studied in coronary by-pass surgery patients; AUC
under the ROC curve vary from 0.52 ± 0.12 to 0.74 ± 0.07 [21,22]. In 30 septic patients, the
AUC of the ROC of baseline triplicate trans-pulmonary thermodilution CO was 0.77 (95%
CI between 0.60 and 0.94) to predict FLR [23]. Monnet et al. [24] reported a sensitivity of 78%,
a specificity of 54% and a cut-off of 2.8 L∙min-1∙m-2 . Although the predictive value of
different cardiac output methods have not been directly studied, Biais et al. [12] found
responder classification with CO Vigileo (Edwards Lifesciences, Irvine CA, USA) to
correspond in 97% of the cases with pulmonary-artery-catheter thermodilution or trans-
thoracic echography CO in liver-transplant patients. Research is needed that directly
compares different cardiac output methods to determine their predictive value for FLR as
accuracy of a CO method can vary between 3,5 and 25% [25,26].
Moreover, if we take in mind the Starling curve; a patient can be either on the upslope of the
Starling curve, on the plateau or in-between. There is a large variability between patients for
the maximum cardiac output that can be reached. This implies that a low baseline value for
cardiac output does not necessarily mean that fluid loading will lead to an increase in cardiac
output. Pharmacological or even mechanical intervention will probably have a similar
chance to lead an improvement in CO.
Volumetric or echographic parameters
The above parameters represent an indirect estimate of preload, more direct estimation
could be provided by ventricular volumes determined with echographic measurement for
instance. Hemodynamic parameters determined with trans-thoracic or trans-oesophageal
echography have been used in daily clinical care for decades. We highlight the results of the
most studied parameters here; results for left ventricular end-diastolic area (LVEDA) [11,27-30]
vary with sensitivity reported to be between 60 to 89%, specificity between 58 and 91% and
the AUC of the ROC curve between 0.24 ± 0.11 and 0.78 (95% CI between 0.59 and 0.97) [11,28]. For global end-diastolic volume index (GEDVI) [26,31-33] the AUC of the ROC curves is
between 0.23 and 0.70 (0.46-0.94) [32,33].
94)
Other interesting parameters linked to echography are measurement of the inferior or
superior vena cava. Vieillard-Baron and colleagues [34] reported that a superior vena cava
collapsibility of 36% has a sensitivity of 90% and a specificity of 100% and an AUC of the
ROC curve of 0.99 ± 0.01 in 66 patients after CABG surgery. Similar assessment of the
inferior vena cava in 20 septic patients offered 90% sensitivity and specificity to predict FLR [8]. The vena cava diameter can only be properly assessed with the use transesophageal
echography.
In theory, these echographically determined volume parameters of the heart are supposed to
be highly reliable. The volume changes within the heart or vena cava are directly linked to
cardiac function; when wall movement is limited inotropic assistance is warranted. And when
filling of the ventricles is not optimal, fluid administration is indicated. Study results are very
promising [35]. Several factors may frustrate these results. Operator-related factors, like level of
experience, changes in probe position and intermittent application, greatly influence the
reliability and robustness of echographic monitoring [36]. The predictive value for FLR of
echographic parameters in patients receiving mechanical ventilation seems to outscore the
results for these parameters in spontaneously-breathing patients [37].
Dynamic parameters: cyclic changes due to mechanical ventilation
In recent years dynamic parameters have been the focus of interest. Especially since more
physicians use pulse contour methods that allow not only directly-available estimation of
beat-to-beat cardiac output but also delivers stroke volume variation (SVV), pulse pressure
variation (PPV) and systolic pressure variation (SPV) [38]. The results of literature review for
the reliability of SVV to predict FLR is shown in Table 3.
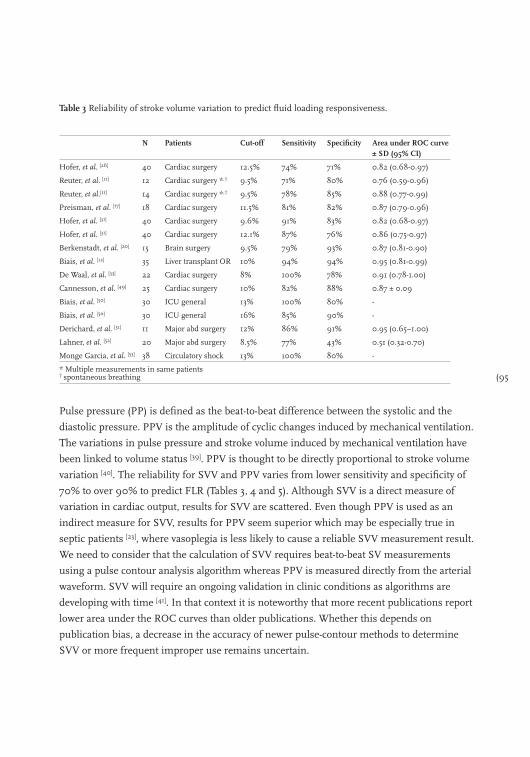
(95
Table 3 Reliability of stroke volume variation to predict fluid loading responsiveness.
N Patients Cut-off Sensitivity Specificity Area under ROC curve ± SD (95% CI)
Hofer, et al. [26] 40 Cardiac surgery 12.5% 74% 71% 0.82 (0.68-0.97)
Reuter, et al. [11] 12 Cardiac surgery *,† 9.5% 71% 80% 0.76 (0.59-0.96)
Reuter, et al.[11] 14 Cardiac surgery *,† 9.5% 78% 85% 0.88 (0.77-0.99)
Preisman, et al. [17] 18 Cardiac surgery 11.5% 81% 82% 0.87 (0.79-0.96)
Hofer, et al. [31] 40 Cardiac surgery 9.6% 91% 83% 0.82 (0.68-0.97)
Hofer, et al. [31] 40 Cardiac surgery 12.1% 87% 76% 0.86 (0.75-0.97)
Berkenstadt, et al. [20] 15 Brain surgery 9.5% 79% 93% 0.87 (0.81-0.90)
Biais, et al. [12] 35 Liver transplant OR 10% 94% 94% 0.95 (0.81-0.99)
De Waal, et al. [33] 22 Cardiac surgery 8% 100% 78% 0.91 (0.78-1.00)
Cannesson, et al. [49] 25 Cardiac surgery 10% 82% 88% 0.87 ± 0.09
Biais, et al. [50] 30 ICU general 13% 100% 80% -
Biais, et al. [50] 30 ICU general 16% 85% 90% -
Derichard, et al. [51] 11 Major abd surgery 12% 86% 91% 0.95 (0.65–1.00)
Lahner, et al. [52] 20 Major abd surgery 8.5% 77% 43% 0.51 (0.32-0.70)
Monge Garcia, et al. [53] 38 Circulatory shock 13% 100% 80% -
* Multiple measurements in same patients† spontaneous breathing
Pulse pressure (PP) is defined as the beat-to-beat difference between the systolic and the
diastolic pressure. PPV is the amplitude of cyclic changes induced by mechanical ventilation.
The variations in pulse pressure and stroke volume induced by mechanical ventilation have
been linked to volume status [39]. PPV is thought to be directly proportional to stroke volume
variation [40]. The reliability for SVV and PPV varies from lower sensitivity and specificity of
70% to over 90% to predict FLR (Tables 3, 4 and 5). Although SVV is a direct measure of
variation in cardiac output, results for SVV are scattered. Even though PPV is used as an
indirect measure for SVV, results for PPV seem superior which may be especially true in
septic patients [23], where vasoplegia is less likely to cause a reliable SVV measurement result.
We need to consider that the calculation of SVV requires beat-to-beat SV measurements
using a pulse contour analysis algorithm whereas PPV is measured directly from the arterial
waveform. SVV will require an ongoing validation in clinic conditions as algorithms are
developing with time [41]. In that context it is noteworthy that more recent publications report
lower area under the ROC curves than older publications. Whether this depends on
publication bias, a decrease in the accuracy of newer pulse-contour methods to determine
SVV or more frequent improper use remains uncertain.
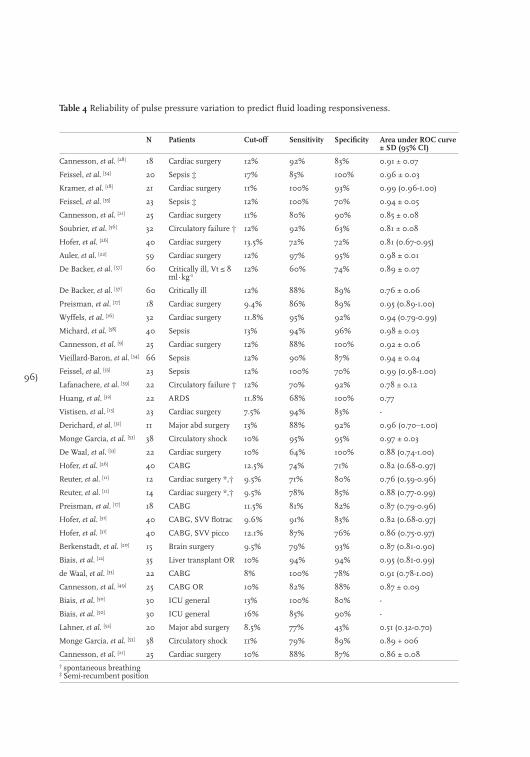
96)
Table 4 Reliability of pulse pressure variation to predict fluid loading responsiveness.
N Patients Cut-off Sensitivity Specificity Area under ROC curve ± SD (95% CI)
Cannesson, et al. [28] 18 Cardiac surgery 12% 92% 83% 0.91 ± 0.07
Feissel, et al. [54] 20 Sepsis ‡ 17% 85% 100% 0.96 ± 0.03
Kramer, et al. [18] 21 Cardiac surgery 11% 100% 93% 0.99 (0.96-1.00)
Feissel, et al. [55] 23 Sepsis ‡ 12% 100% 70% 0.94 ± 0.05
Cannesson, et al. [21] 25 Cardiac surgery 11% 80% 90% 0.85 ± 0.08
Soubrier, et al. [56] 32 Circulatory failure † 12% 92% 63% 0.81 ± 0.08
Hofer, et al. [26] 40 Cardiac surgery 13.5% 72% 72% 0.81 (0.67-0.95)
Auler, et al. [22] 59 Cardiac surgery 12% 97% 95% 0.98 ± 0.01
De Backer, et al. [57] 60 Critically ill, Vt ≤ 8 ml∙kg-1
12% 60% 74% 0.89 ± 0.07
De Backer, et al. [57] 60 Critically ill 12% 88% 89% 0.76 ± 0.06
Preisman, et al. [17] 18 Cardiac surgery 9.4% 86% 89% 0.95 (0.89-1.00)
Wyffels, et al. [16] 32 Cardiac surgery 11.8% 95% 92% 0.94 (0.79-0.99)
Michard, et al. [58] 40 Sepsis 13% 94% 96% 0.98 ± 0.03
Cannesson, et al. [9] 25 Cardiac surgery 12% 88% 100% 0.92 ± 0.06
Vieillard-Baron, et al. [34] 66 Sepsis 12% 90% 87% 0.94 ± 0.04
Feissel, et al. [55] 23 Sepsis 12% 100% 70% 0.99 (0.98-1.00)
Lafanachere, et al. [59] 22 Circulatory failure † 12% 70% 92% 0.78 ± 0.12
Huang, et al. [32] 22 ARDS 11.8% 68% 100% 0.77
Vistisen, et al. [13] 23 Cardiac surgery 7.5% 94% 83% -
Derichard, et al. [51] 11 Major abd surgery 13% 88% 92% 0.96 (0.70–1.00)
Monge Garcia, et al. [53] 38 Circulatory shock 10% 95% 95% 0.97 ± 0.03
De Waal, et al. [33] 22 Cardiac surgery 10% 64% 100% 0.88 (0.74-1.00)
Hofer, et al. [26] 40 CABG 12.5% 74% 71% 0.82 (0.68-0.97)
Reuter, et al. [11] 12 Cardiac surgery *,† 9.5% 71% 80% 0.76 (0.59-0.96)
Reuter, et al. [11] 14 Cardiac surgery *,† 9.5% 78% 85% 0.88 (0.77-0.99)
Preisman, et al. [17] 18 CABG 11.5% 81% 82% 0.87 (0.79-0.96)
Hofer, et al. [31] 40 CABG, SVV flotrac 9.6% 91% 83% 0.82 (0.68-0.97)
Hofer, et al. [31] 40 CABG, SVV picco 12.1% 87% 76% 0.86 (0.75-0.97)
Berkenstadt, et al. [20] 15 Brain surgery 9.5% 79% 93% 0.87 (0.81-0.90)
Biais, et al. [12] 35 Liver transplant OR 10% 94% 94% 0.95 (0.81-0.99)
de Waal, et al. [33] 22 CABG 8% 100% 78% 0.91 (0.78-1.00)
Cannesson, et al. [49] 25 CABG OR 10% 82% 88% 0.87 ± 0.09
Biais, et al. [50] 30 ICU general 13% 100% 80% -
Biais, et al. [50] 30 ICU general 16% 85% 90% -
Lahner, et al. [52] 20 Major abd surgery 8.5% 77% 43% 0.51 (0.32-0.70)
Monge Garcia, et al. [53] 38 Circulatory shock 11% 79% 89% 0.89 + 006
Cannesson, et al. [21] 25 Cardiac surgery 10% 88% 87% 0.86 ± 0.08† spontaneous breathing‡ Semi-recumbent position
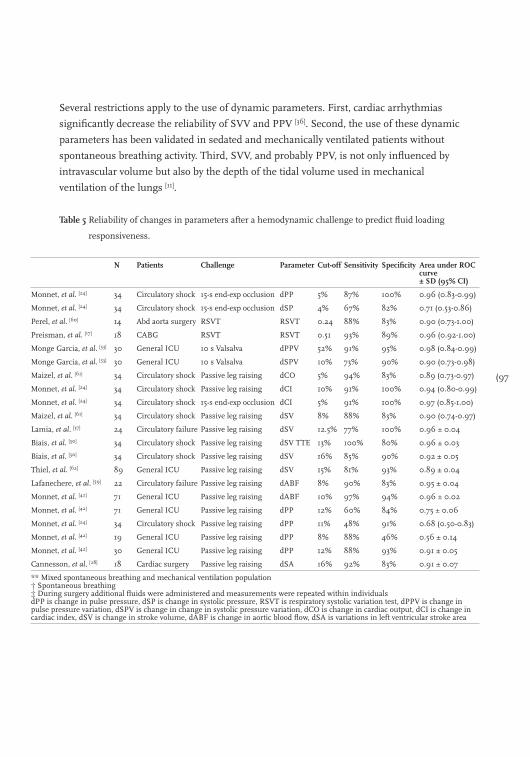
(97
Several restrictions apply to the use of dynamic parameters. First, cardiac arrhythmias
significantly decrease the reliability of SVV and PPV [36]. Second, the use of these dynamic
parameters has been validated in sedated and mechanically ventilated patients without
spontaneous breathing activity. Third, SVV, and probably PPV, is not only influenced by
intravascular volume but also by the depth of the tidal volume used in mechanical
ventilation of the lungs [11].
N Patients Challenge Parameter Cut-off Sensitivity Specificity Area under ROC curve ± SD (95% CI)
Monnet, et al. [24] 34 Circulatory shock 15-s end-exp occlusion dPP 5% 87% 100% 0.96 (0.83-0.99)
Monnet, et al. [24] 34 Circulatory shock 15-s end-exp occlusion dSP 4% 67% 82% 0.71 (0.53-0.86)
Perel, et al. [60] 14 Abd aorta surgery RSVT RSVT 0.24 88% 83% 0.90 (0.73-1.00)
Preisman, et al. [17] 18 CABG RSVT RSVT 0.51 93% 89% 0.96 (0.92-1.00)
Monge Garcia, et al. [53] 30 General ICU 10 s Valsalva dPPV 52% 91% 95% 0.98 (0.84-0.99)
Monge Garcia, et al. [53] 30 General ICU 10 s Valsalva dSPV 10% 73% 90% 0.90 (0.73-0.98)
Maizel, et al. [61] 34 Circulatory shock Passive leg raising dCO 5% 94% 83% 0.89 (0.73-0.97)
Monnet, et al. [24] 34 Circulatory shock Passive leg raising dCI 10% 91% 100% 0.94 (0.80-0.99)
Monnet, et al. [24] 34 Circulatory shock 15-s end-exp occlusion dCI 5% 91% 100% 0.97 (0.85-1.00)
Maizel, et al. [61] 34 Circulatory shock Passive leg raising dSV 8% 88% 83% 0.90 (0.74-0.97)
Lamia, et al. [37] 24 Circulatory failure Passive leg raising dSV 12.5% 77% 100% 0.96 ± 0.04
Biais, et al. [50] 34 Circulatory shock Passive leg raising dSV TTE 13% 100% 80% 0.96 ± 0.03
Biais, et al. [50] 34 Circulatory shock Passive leg raising dSV 16% 85% 90% 0.92 ± 0.05
Thiel, et al. [62] 89 General ICU Passive leg raising dSV 15% 81% 93% 0.89 ± 0.04
Lafanechere, et al. [59] 22 Circulatory failure Passive leg raising dABF 8% 90% 83% 0.95 ± 0.04
Monnet, et al. [42] 71 General ICU Passive leg raising dABF 10% 97% 94% 0.96 ± 0.02
Monnet, et al. [42] 71 General ICU Passive leg raising dPP 12% 60% 84% 0.75 ± 0.06
Monnet, et al. [24] 34 Circulatory shock Passive leg raising dPP 11% 48% 91% 0.68 (0.50-0.83)
Monnet, et al. [42] 19 General ICU Passive leg raising dPP 8% 88% 46% 0.56 ± 0.14
Monnet, et al. [42] 30 General ICU Passive leg raising dPP 12% 88% 93% 0.91 ± 0.05
Cannesson, et al. [28] 18 Cardiac surgery Passive leg raising dSA 16% 92% 83% 0.91 ± 0.07
** Mixed spontaneous breathing and mechanical ventilation population† Spontaneous breathing‡ During surgery additional fluids were administered and measurements were repeated within individuals dPP is change in pulse pressure, dSP is change in systolic pressure, RSVT is respiratory systolic variation test, dPPV is change in pulse pressure variation, dSPV is change in change in systolic pressure variation, dCO is change in cardiac output, dCI is change in cardiac index, dSV is change in stroke volume, dABF is change in aortic blood flow, dSA is variations in left ventricular stroke area
Table 5 Reliability of changes in parameters after a hemodynamic challenge to predict fluid loading
responsiveness.
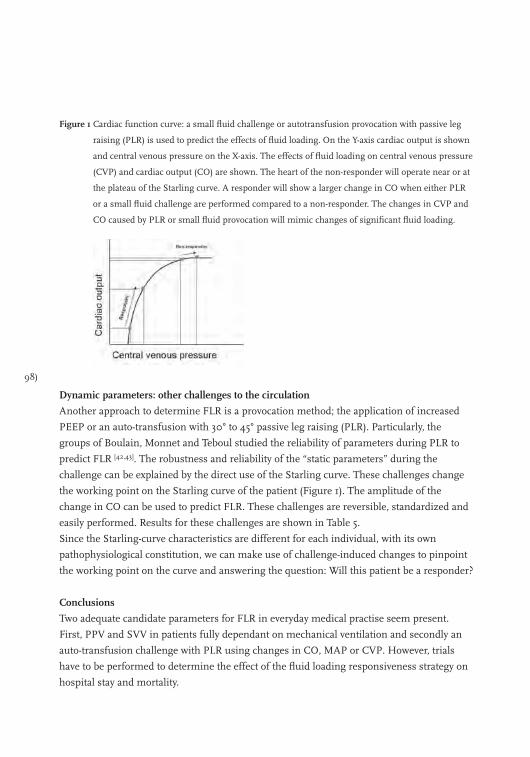
98)
Figure 1 Cardiac function curve: a small fluid challenge or autotransfusion provocation with passive leg
raising (PLR) is used to predict the effects of fluid loading. On the Y-axis cardiac output is shown
and central venous pressure on the X-axis. The effects of fluid loading on central venous pressure
(CVP) and cardiac output (CO) are shown. The heart of the non-responder will operate near or at
the plateau of the Starling curve. A responder will show a larger change in CO when either PLR
or a small fluid challenge are performed compared to a non-responder. The changes in CVP and
CO caused by PLR or small fluid provocation will mimic changes of significant fluid loading.
Dynamic parameters: other challenges to the circulation
Another approach to determine FLR is a provocation method; the application of increased
PEEP or an auto-transfusion with 30° to 45° passive leg raising (PLR). Particularly, the
groups of Boulain, Monnet and Teboul studied the reliability of parameters during PLR to
predict FLR [42,43]. The robustness and reliability of the “static parameters” during the
challenge can be explained by the direct use of the Starling curve. These challenges change
the working point on the Starling curve of the patient (Figure 1). The amplitude of the
change in CO can be used to predict FLR. These challenges are reversible, standardized and
easily performed. Results for these challenges are shown in Table 5.
Since the Starling-curve characteristics are different for each individual, with its own
pathophysiological constitution, we can make use of challenge-induced changes to pinpoint
the working point on the curve and answering the question: Will this patient be a responder?
Conclusions
Two adequate candidate parameters for FLR in everyday medical practise seem present.
First, PPV and SVV in patients fully dependant on mechanical ventilation and secondly an
auto-transfusion challenge with PLR using changes in CO, MAP or CVP. However, trials
have to be performed to determine the effect of the fluid loading responsiveness strategy on
hospital stay and mortality.

(99
References
1. Bilkovski RN, Rivers EP, Horst HM. Targeted resuscitation strategies after injury. Curr Opin Crit Care 2004;
10:529-38.
2. Chappell D, Jacob M, Hofmann-Kiefer K, et al. A rational approach to perioperative fluid management.
Anesthesiology 2008; 109: 723-40.
3. Nisanevich V, Felsenstein I, Almogy G, et al, Matot I. Effect of intraoperative fluid management on outcome
after intraabdominal surgery. Anesthesiology 2005; 103: 25-32.
4. Lasko TA, Bhagwat JG, Zou KH, et al. The use of receiver operating characteristic curves in biomedical
informatics. J Biomed Inform 2005; 38: 404-15.
5. Boldt J, Lenz M, Kumle B, et al. Volume replacement strategies on intensive care units: results from a postal
survey. Intensive Care Med 1998; 24: 147-51.
6. Stephan F, Flahault A, Dieudonne N, et al. Clinical evaluation of circulating blood volume in critically ill
patients--contribution of a clinical scoring system. Br J Anaesth 2001; 86: 754-62.
7. Kastrup M, Markewitz A, Spies C, et al. Current practice of hemodynamic monitoring and vasopressor and
inotropic therapy in post-operative cardiac surgery patients in Germany: results from a postal survey. Acta
Anaesthesiol Scand 2007; 51: 347-58.
8. Barbier C, Loubieres Y, Schmit C, et al. Respiratory changes in inferior vena cava diameter are helpful in
predicting fluid responsiveness in ventilated septic patients. Intensive Care Med 2004; 30: 1740-6.
9. Cannesson M, Delannoy B, Morand A, et al. Does the Pleth variability index indicate the respiratory-induced
variation in the plethysmogram and arterial pressure waveforms? Anesth Analg 2008; 106: 1189-94.
10. Osman D, Ridel C, Ray P, et al. Cardiac filling pressures are not appropriate to predict hemodynamic
response to volume challenge. Crit Care Med 2007; 35: 64-8.
11. Reuter DA, Kirchner A, Felbinger TW, et al. Usefulness of left ventricular stroke volume variation to assess
fluid responsiveness in patients with reduced cardiac function. Crit Care Med 2003; 31: 1399-404.
12. Biais M, Nouette-Gaulain K, Cottenceau V, et al. Uncalibrated pulse contour-derived stroke volume variation
predicts fluid responsiveness in mechanically ventilated patients undergoing liver transplantation.
Br J Anaesth 2008; 101: 761-8.
13. Vistisen ST, Struijk JJ, Larsson A. Automated pre-ejection period variation indexed to tidal volume predicts
fluid responsiveness after cardiac surgery. Acta Anaesthesiol Scand 2009; 53: 534-42.
14. Marik PE, Baram M, Vahid B. Does central venous pressure predict fluid responsiveness? A systematic
review of the literature and the tale of seven mares. Chest 2008; 134: 172-8.
15. Lattik R, Couture P, Denault AY, et al. Mitral Doppler indices are superior to two-dimensional
echocardiographic and hemodynamic variables in predicting responsiveness of cardiac output to a rapid
intravenous infusion of colloid. Anesth Analg 2002; 94: 1092-9.
16. Wyffels PA, Durnez PJ, Helderweirt J, Stockman WM, De Kegel D. Ventilation-induced plethysmographic
variations predict fluid responsiveness in ventilated postoperative cardiac surgery patients. Anesth Analg
2007; 105: 448-52.
17. Preisman S, Kogan S, Berkenstadt H, et al. Predicting fluid responsiveness in patients undergoing cardiac
surgery: functional haemodynamic parameters including the Respiratory Systolic Variation Test and static
preload indicators. Br J Anaesth 2005; 95: 746-55.
18. Kramer A, Zygun D, Hawes H, et al. Pulse pressure variation predicts fluid responsiveness following
coronary artery bypass surgery. Chest 2004; 126: 1563-8.
19. Antonelli M, Levy M, Andrews PJ, et al. Hemodynamic monitoring in shock and implications for
management. International Consensus Conference, Paris, France, 27-28 April 2006. Intensive Care Med
100)
2007; 33: 575-90.
20. Berkenstadt H, Margalit N, Hadani M, et al. Stroke volume variation as a predictor of fluid responsiveness in
patients undergoing brain surgery. Anesth Analg 2001; 92: 984-9.
21. Cannesson M, Attof Y, Rosamel P, et al. Respiratory variations in pulse oximetry plethysmographic waveform
amplitude to predict fluid responsiveness in the operating room. Anesthesiology 2007; 106: 1105-11.
22. Auler JO, Jr., Galas F, Hajjar L, et al. Online monitoring of pulse pressure variation to guide fluid therapy
after cardiac surgery. Anesth Analg 2008; 106: 1201-6.
23. Perner A, Faber T. Stroke volume variation does not predict fluid responsiveness in patients with septic
shock on pressure support ventilation. Acta Anaesthesiol Scand 2006; 50: 1068-73.
24. Monnet X, Osman D, Ridel C, et al. Predicting volume responsiveness by using the end-expiratory occlusion
in mechanically ventilated intensive care unit patients. Crit Care Med 2009; 37: 951-6.
25. Donati A, Nardella R, Gabbanelli V, et al. The ability of PiCCO versus LiDCO variables to detect changes in
cardiac index: a prospective clinical study. Minerva Anestesiol 2008.
26. Hofer CK, Muller SM, Furrer L, et al. Stroke volume and pulse pressure variation for prediction of fluid
responsiveness in patients undergoing off-pump coronary artery bypass grafting. Chest 2005; 128: 848-54.
27. Charron C, Fessenmeyer C, Cosson C, et al. The influence of tidal volume on the dynamic variables of fluid
responsiveness in critically ill patients. Anesth Analg 2006; 102: 1511-7.
28. Cannesson M, Slieker J, Desebbe O, et al. Prediction of fluid responsiveness using respiratory variations in
left ventricular stroke area by transesophageal echocardiographic automated border detection in
mechanically ventilated patients. Crit Care 2006; 10: R171.
29. Solus-Biguenet H, Fleyfel M, Tavernier B, et al. Non-invasive prediction of fluid responsiveness during major
hepatic surgery. Br J Anaesth 2006; 97: 808-16.
30. Lee JH, Kim JT, Yoon SZ, et al. Evaluation of corrected flow time in oesophageal Doppler as a predictor of
fluid responsiveness. Br J Anaesth 2007; 99: 343-8.
31. Hofer CK, Senn A, Weibel L, et al. Assessment of stroke volume variation for prediction of fluid
responsiveness using the modified FloTrac and PiCCOplus system. Crit Care 2008; 12: R82.
32. Huang CC, Fu JY, Hu HC, et al. Prediction of fluid responsiveness in acute respiratory distress syndrome patients
ventilated with low tidal volume and high positive end-expiratory pressure. Crit Care Med 2008; 36: 2810-6.
33. de Waal EE, Rex S, Kruitwagen CL, et al. Dynamic preload indicators fail to predict fluid responsiveness in
open-chest conditions (R3). Crit Care Med 2009.
34. Vieillard-Baron A, Chergui K, Rabiller A, et al. Superior vena caval collapsibility as a gauge of volume status
in ventilated septic patients. Intensive Care Med 2004; 30: 1734-9.
35. Poelaert JI, Schupfer G. Hemodynamic monitoring utilizing transesophageal echocardiography: the
relationships among pressure, flow, and function. Chest 2005; 127: 379-90.
36. Michard F, Teboul JL. Predicting Fluid Responsiveness in ICU Patients* : A Critical Analysis of the
Evidence. Chest 2002; 121: 2000-8.
37. Lamia B, Ochagavia A, Monnet X, et al. Echocardiographic prediction of volume responsiveness in critically
ill patients with spontaneously breathing activity. Intensive Care Med 2007; 33: 1125-32.
38. Geerts BF, Maas JJ, de Wilde RB, et al. Haemodynamic assessment in Dutch Intensive Care Units. Neth J
Crit Care 2009; 13: 178-84.
39. Versprille A, Jansen JR. Tidal variation of pulmonary blood flow and blood volume in piglets during
mechanical ventilation during hyper-, normo- and hypovolaemia. Pflugers Arch 1993; 424: 255-65.
40. Guyton AC. Textbook of medical physiology. Philidelphia, USA: W.B. Saunders Company, 1996.
41. de Wilde RB, Schreuder JJ, van den Berg PC, et al. An evaluation of cardiac output by five arterial pulse
contour techniques during cardiac surgery. Anaesthesia 2007; 62: 760-8.
(101
42. Monnet X, Rienzo M, Osman D, et al. Passive leg raising predicts fluid responsiveness in the critically ill.
Crit Care Med 2006; 34: 1402-7.
43. Boulain T, Achard JM, Teboul JL, et al. Changes in BP induced by passive leg raising predict response to
fluid loading in critically ill patients. Chest 2002; 121: 1245-52.
44. Breukers RM, Trof RJ, de Wilde RB, et al. Relative value of pressures and volumes in assessing fluid
responsiveness after valvular and coronary artery surgery. Eur.J.Cardiothorac Surg 2009; 35: 62-8.
45. Critchley LA, Critchley JA. A meta-analysis of studies using bias and precision statistics to compare cardiac
output measurement techniques. J Clin Monit Comput 1999; 15: 85-91.
46. Heenen S, De Backer D, Vincent JL. How can the response to volume expansion in patients with
spontaneous respiratory movements be predicted? Crit Care 2006;10: R102.
47. Prather JW, Taylor AE, Guyton AC. Effect of blood volume, mean circulatory pressure, and stress relaxation
on cardiac output. AJP - Legacy 1969; 216: 467-72.
48. Muller L, Louart G, Teboul JL, et al. Could B-type Natriuretic Peptide (BNP) plasma concentration be useful
to predict fluid responsiveness [corrected] in critically ill patients with acute circulatory failure? Ann Fr
Anesth Reanim 2009; 28: 31-6.
49. Cannesson M, Musard H, Desebbe O, et al. The ability of stroke volume variations obtained with Vigileo/
FloTrac system to monitor fluid responsiveness in mechanically ventilated patients. Anesth Analg 2009;
108: 513-7.
50. Biais M, Vidil L, Sarrabay P, et al. Changes in stroke volume induced by passive leg raising in spontaneously
breathing patients: comparison between echocardiography and Vigileo/FloTrac device. Crit Care 2009; 13:
R195.
51. Derichard A, Robin E, Tavernier B, et al. Automated pulse pressure and stroke volume variations from radial
artery: evaluation during major abdominal surgery. Br J Anaesth 2009; 103: 678-84.
52. Lahner D, Kabon B, Marschalek C, et al. Evaluation of stroke volume variation obtained by arterial pulse
contour analysis to predict fluid responsiveness intraoperatively. Br J Anaesth 2009; 103: 346-51.
53. Monge Garcia MI, Gil CA, Diaz Monrove JC. Arterial pressure changes during the Valsalva maneuver to
predict fluid responsiveness in spontaneously breathing patients. Intensive Care Med 2009; 35: 77-84.
54. Feissel M, Badie J, Merlani PG, et al. Pre-ejection period variations predict the fluid responsiveness of septic
ventilated patients. Crit Care Med 2005; 33: 2534-9.
55. Feissel M, Teboul JL, Merlani P, et al. Plethysmographic dynamic indices predict fluid responsiveness in
septic ventilated patients. Intensive Care Med 2007; 33: 993-9.
56. Soubrier S, Saulnier F, Hubert H, et al. Can dynamic indicators help the prediction of fluid responsiveness
in spontaneously breathing critically ill patients? Intensive Care Med 2007; 33: 1117-24.
57. De Backer D, Heenen S, Piagnerelli M, et al. Pulse pressure variations to predict fluid responsiveness:
influence of tidal volume. Intensive Care Med 2005; 31: 517-23.
58. Michard F, Boussat S, Chemla D, et al. Relation between respiratory changes in arterial pulse pressure and fluid
responsiveness in septic patients with acute circulatory failure. Am.J Respir.Crit Care Med 2000; 162: 134-8.
59. Lafanechere A, Pene F, Goulenok C, et al. Changes in aortic blood flow induced by passive leg raising predict
fluid responsiveness in critically ill patients. Crit Care 2006; 10: R132.
60. Perel A, Minkovich L, Preisman S, et al. Assessing fluid-responsiveness by a standardized ventilatory
maneuver: the respiratory systolic variation test. Anesth Analg 2005; 100: 942-5.
61. Maizel J, Airapetian N, Lorne E, et al. Diagnosis of central hypovolemia by using passive leg raising.
Intensive Care Med 2007; 33: 1133-8.
62. Thiel SW, Kollef MH, Isakow W. Non-invasive stroke volume measurement and passive leg raising predict
volume responsiveness in medical ICU patients: an observational cohort study. Crit Care 2009; 13: R111.

102)

(103
Chapter 6
Comprehensive review: Is it better to use Trendelenburg or passive leg raising in the initial treatment of hypovolaemia?
Bart Geerts, Lara van den Bergh, Theo Stijnen, Leon Aarts and Jos Jansen
Submitted to Journal of Trauma
104)
Hypovolaemia is a common problem in many clinical situations. The mortality of
hypovolaemic shock is directly related to the severity and duration of organ hypoperfusion,
which means that prompt volume replacement is the hallmark of success for managing the
hypovolaemic patient [1] However, since fluid resuscitation will require some time to
accomplish, manoeuvres like Trendelenburg position or passive leg raising (PLR) are
commonly used as the initial treatment of shock and hypotension [2].
Trendelenburg position is the elevation of the pelvis above horizontal plane in the supine
position. This position was originated by Bardenhauer of Cologne but a surgeon named
Friedrich Trendelenburg popularized the position in the 19th century for facilitating surgery
on the pelvic organs [3]. In World War I, the position was used as an anti-shock manoeuvre.
In a survey by Ostrow and co-workers in 1997 99% of surveyed American nurses used the
Trendelenburg position and approximately 80% had used PLR [4]. The Trendelenburg
position is probably one of the most often used treatments in medicine.
Passive leg raising is straight passive elevation of both legs above cardiac level with the
patient in a supine position. PLR is not only used to treat hypvolaemia but it is also used for
its hemodynamic response to augment the murmur of heart valves and, to facilitate
gynaecological and urological surgery.
Both manoeuvres are used either as a diagnostic tool to assess fluid loading response or as a
therapeutic manoeuvre pending fluid resuscitation. It is the assumption that body inversion
produces shifting of blood from the legs (and with Trendelenburg position also from the
abdomen) towards the heart by gravitational displacement leading to an ‘auto-transfusion’
thereby increasing venous return to the heart and promoting cardiac output (CO) and
ultimately increase perfusion of the vital organs [5,6]. With the advantage of auto-transfusion
readily available both PLR and the Trendelenburg position are used for their expected
instantaneous effect on cardiovascular performance.
The aim of the review is to evaluate whether PLR and Trendelenburg position supports the
mechanism of auto-transfusion and to assess the effect of these manoeuvres on cardiac output.
Methods
This review was performed using the Cochrane Handbook for Systemic Reviews of
Interventions [7]. We included prospective observational studies in normo- or hypovolaemic
humans investigating the effects of hemodynamic parameters within 10 minutes after
change from supine position.
The MEDLINE, EMBASE and CENTRAL databases were searched for relevant articles from
1960 up to 2010. We used (combinations of) the following search terms; passive leg raising,
leg raising test, lower extremities elevation and passive leg elevation; Trendelenburg,
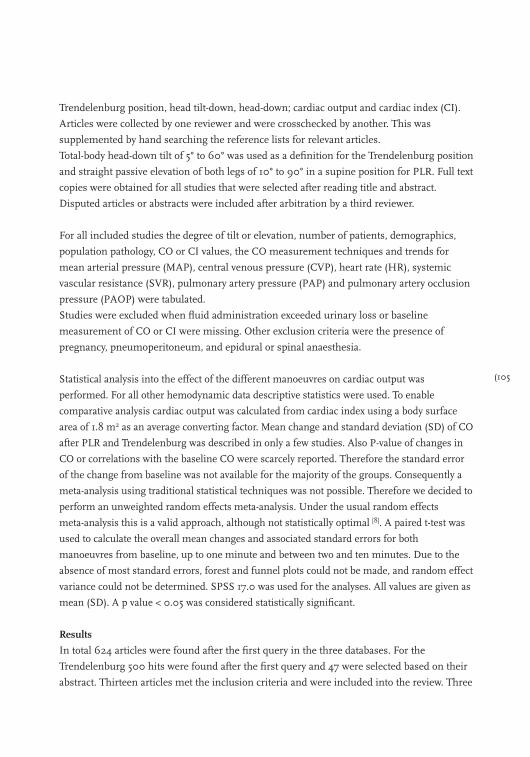
(105
Trendelenburg position, head tilt-down, head-down; cardiac output and cardiac index (CI).
Articles were collected by one reviewer and were crosschecked by another. This was
supplemented by hand searching the reference lists for relevant articles.
Total-body head-down tilt of 5° to 60° was used as a definition for the Trendelenburg position
and straight passive elevation of both legs of 10° to 90° in a supine position for PLR. Full text
copies were obtained for all studies that were selected after reading title and abstract.
Disputed articles or abstracts were included after arbitration by a third reviewer.
For all included studies the degree of tilt or elevation, number of patients, demographics,
population pathology, CO or CI values, the CO measurement techniques and trends for
mean arterial pressure (MAP), central venous pressure (CVP), heart rate (HR), systemic
vascular resistance (SVR), pulmonary artery pressure (PAP) and pulmonary artery occlusion
pressure (PAOP) were tabulated.
Studies were excluded when fluid administration exceeded urinary loss or baseline
measurement of CO or CI were missing. Other exclusion criteria were the presence of
pregnancy, pneumoperitoneum, and epidural or spinal anaesthesia.
Statistical analysis into the effect of the different manoeuvres on cardiac output was
performed. For all other hemodynamic data descriptive statistics were used. To enable
comparative analysis cardiac output was calculated from cardiac index using a body surface
area of 1.8 m2 as an average converting factor. Mean change and standard deviation (SD) of CO
after PLR and Trendelenburg was described in only a few studies. Also P-value of changes in
CO or correlations with the baseline CO were scarcely reported. Therefore the standard error
of the change from baseline was not available for the majority of the groups. Consequently a
meta-analysis using traditional statistical techniques was not possible. Therefore we decided to
perform an unweighted random effects meta-analysis. Under the usual random effects
meta-analysis this is a valid approach, although not statistically optimal [8]. A paired t-test was
used to calculate the overall mean changes and associated standard errors for both
manoeuvres from baseline, up to one minute and between two and ten minutes. Due to the
absence of most standard errors, forest and funnel plots could not be made, and random effect
variance could not be determined. SPSS 17.0 was used for the analyses. All values are given as
mean (SD). A p value < 0.05 was considered statistically significant.
Results
In total 624 articles were found after the first query in the three databases. For the
Trendelenburg 500 hits were found after the first query and 47 were selected based on their
abstract. Thirteen articles met the inclusion criteria and were included into the review. Three
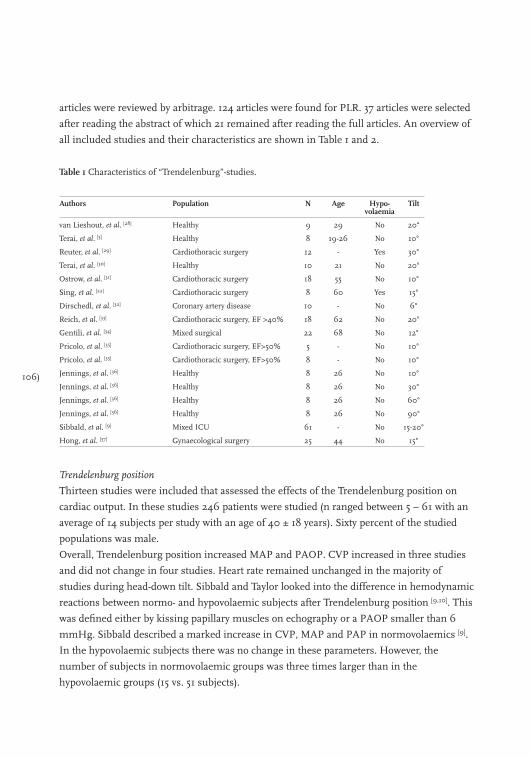
106)
articles were reviewed by arbitrage. 124 articles were found for PLR. 37 articles were selected
after reading the abstract of which 21 remained after reading the full articles. An overview of
all included studies and their characteristics are shown in Table 1 and 2.
Table 1 Characteristics of “Trendelenburg”-studies.
Authors Population N Age Hypo-volaemia
Tilt
van Lieshout, et al. [28] Healthy 9 29 No 20°
Terai, et al. [5] Healthy 8 19-26 No 10°
Reuter, et al. [29] Cardiothoracic surgery 12 - Yes 30°
Terai, et al. [30] Healthy 10 21 No 20°
Ostrow, et al. [31] Cardiothoracic surgery 18 55 No 10°
Sing, et al. [22] Cardiothoracic surgery 8 60 Yes 15°
Dirschedl, et al. [32] Coronary artery disease 10 - No 6°
Reich, et al. [33] Cardiothoracic surgery, EF >40% 18 62 No 20°
Gentili, et al. [34] Mixed surgical 22 68 No 12°
Pricolo, et al. [35] Cardiothoracic surgery, EF>50% 5 - No 10°
Pricolo, et al. [35] Cardiothoracic surgery, EF>50% 8 - No 10°
Jennings, et al. [36] Healthy 8 26 No 10°
Jennings, et al. [36] Healthy 8 26 No 30°
Jennings, et al. [36] Healthy 8 26 No 60°
Jennings, et al. [36] Healthy 8 26 No 90°
Sibbald, et al. [9] Mixed ICU 61 - No 15-20°
Hong, et al. [37] Gynaecological surgery 25 44 No 15°
Trendelenburg position
Thirteen studies were included that assessed the effects of the Trendelenburg position on
cardiac output. In these studies 246 patients were studied (n ranged between 5 – 61 with an
average of 14 subjects per study with an age of 40 ± 18 years). Sixty percent of the studied
populations was male.
Overall, Trendelenburg position increased MAP and PAOP. CVP increased in three studies
and did not change in four studies. Heart rate remained unchanged in the majority of
studies during head-down tilt. Sibbald and Taylor looked into the difference in hemodynamic
reactions between normo- and hypovolaemic subjects after Trendelenburg position [9,10]. This
was defined either by kissing papillary muscles on echography or a PAOP smaller than 6
mmHg. Sibbald described a marked increase in CVP, MAP and PAP in normovolaemics [9].
In the hypovolaemic subjects there was no change in these parameters. However, the
number of subjects in normovolaemic groups was three times larger than in the
hypovolaemic groups (15 vs. 51 subjects).
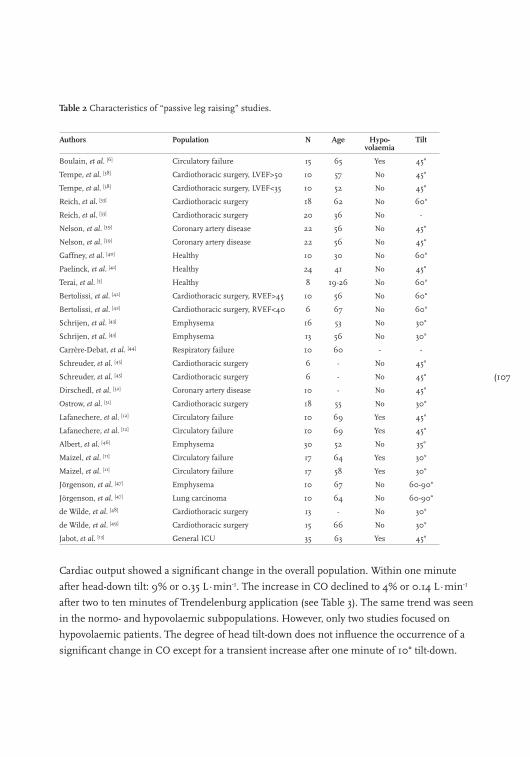
(107
Table 2 Characteristics of “passive leg raising” studies.
Authors Population N Age Hypo-volaemia
Tilt
Boulain, et al. [6] Circulatory failure 15 65 Yes 45°
Tempe, et al. [38] Cardiothoracic surgery, LVEF>50 10 57 No 45°
Tempe, et al. [38] Cardiothoracic surgery, LVEF<35 10 52 No 45°
Reich, et al. [33] Cardiothoracic surgery 18 62 No 60°
Reich, et al. [33] Cardiothoracic surgery 20 36 No -
Nelson, et al. [39] Coronary artery disease 22 56 No 45°
Nelson, et al. [39] Coronary artery disease 22 56 No 45°
Gaffney, et al. [40] Healthy 10 30 No 60°
Paelinck, et al. [41] Healthy 24 41 No 45°
Terai, et al. [5] Healthy 8 19-26 No 60°
Bertolissi, et al. [42] Cardiothoracic surgery, RVEF>45 10 56 No 60°
Bertolissi, et al. [42] Cardiothoracic surgery, RVEF<40 6 67 No 60°
Schrijen, et al. [43] Emphysema 16 53 No 30°
Schrijen, et al. [43] Emphysema 13 56 No 30°
Carrère-Debat, et al. [44] Respiratory failure 10 60 - -
Schreuder, et al. [45] Cardiothoracic surgery 6 - No 45°
Schreuder, et al. [45] Cardiothoracic surgery 6 - No 45°
Dirschedl, et al. [32] Coronary artery disease 10 - No 45°
Ostrow, et al. [31] Cardiothoracic surgery 18 55 No 30°
Lafanechere, et al. [12] Circulatory failure 10 69 Yes 45°
Lafanechere, et al. [12] Circulatory failure 10 69 Yes 45°
Albert, et al. [46] Emphysema 30 52 No 35°
Maizel, et al. [11] Circulatory failure 17 64 Yes 30°
Maizel, et al. [11] Circulatory failure 17 58 Yes 30°
Jörgenson, et al. [47] Emphysema 10 67 No 60-90°
Jörgenson, et al. [47] Lung carcinoma 10 64 No 60-90°
de Wilde, et al. [48] Cardiothoracic surgery 13 - No 30°
de Wilde, et al. [49] Cardiothoracic surgery 15 66 No 30°
Jabot, et al. [13] General ICU 35 63 Yes 45°
Cardiac output showed a significant change in the overall population. Within one minute
after head-down tilt: 9% or 0.35 L∙min-1. The increase in CO declined to 4% or 0.14 L∙min-1
after two to ten minutes of Trendelenburg application (see Table 3). The same trend was seen
in the normo- and hypovolaemic subpopulations. However, only two studies focused on
hypovolaemic patients. The degree of head tilt-down does not influence the occurrence of a
significant change in CO except for a transient increase after one minute of 10° tilt-down.
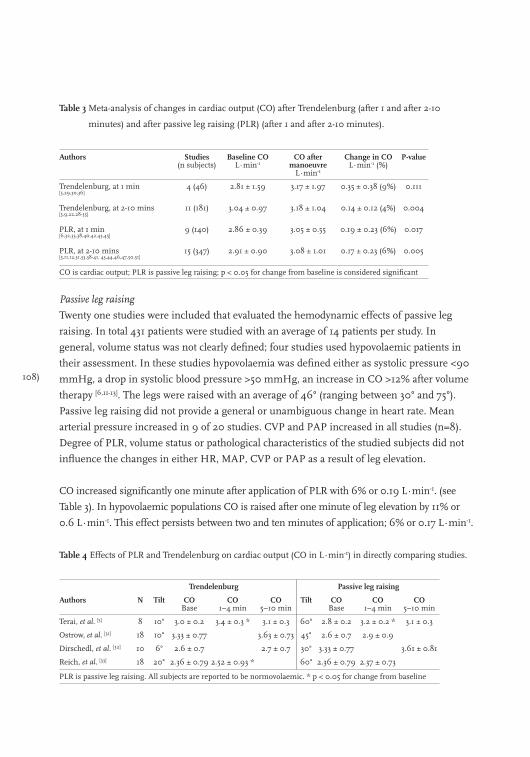
108)
Table 3 Meta-analysis of changes in cardiac output (CO) after Trendelenburg (after 1 and after 2-10
minutes) and after passive leg raising (PLR) (after 1 and after 2-10 minutes).
Authors Studies (n subjects)
Baseline CO L∙min-1
CO after manoeuvre
L∙min-1
Change in CO L∙min-1 (%)
P-value
Trendelenburg, at 1 min [5,29,30,36]
4 (46) 2.81 ± 1.59 3.17 ± 1.97 0.35 ± 0.38 (9%) 0.111
Trendelenburg, at 2-10 mins [5,9,22,28-35]
11 (181) 3.04 ± 0.97 3.18 ± 1.04 0.14 ± 0.12 (4%) 0.004
PLR, at 1 min [6,32,33,38,40,42,43,45]
9 (140) 2.86 ± 0.39 3.05 ± 0.55 0.19 ± 0.23 (6%) 0.017
PLR, at 2-10 mins [5,11,12,31,33,38-41, 43,44,46,47,50,51]
15 (347) 2.91 ± 0.90 3.08 ± 1.01 0.17 ± 0.23 (6%) 0.005
CO is cardiac output; PLR is passive leg raising; p < 0.05 for change from baseline is considered significant
Passive leg raising
Twenty one studies were included that evaluated the hemodynamic effects of passive leg
raising. In total 431 patients were studied with an average of 14 patients per study. In
general, volume status was not clearly defined; four studies used hypovolaemic patients in
their assessment. In these studies hypovolaemia was defined either as systolic pressure <90
mmHg, a drop in systolic blood pressure >50 mmHg, an increase in CO >12% after volume
therapy [6,11-13]. The legs were raised with an average of 46° (ranging between 30° and 75°).
Passive leg raising did not provide a general or unambiguous change in heart rate. Mean
arterial pressure increased in 9 of 20 studies. CVP and PAP increased in all studies (n=8).
Degree of PLR, volume status or pathological characteristics of the studied subjects did not
influence the changes in either HR, MAP, CVP or PAP as a result of leg elevation.
CO increased significantly one minute after application of PLR with 6% or 0.19 L∙min-1. (see
Table 3). In hypovolaemic populations CO is raised after one minute of leg elevation by 11% or
0.6 L∙min-1. This effect persists between two and ten minutes of application; 6% or 0.17 L∙min-1.
Table 4 Effects of PLR and Trendelenburg on cardiac output (CO in L∙min-1) in directly comparing studies.
Trendelenburg Passive leg raising
Authors N Tilt CO Base
CO 1–4 min
CO 5–10 min
Tilt CO Base
CO 1–4 min
CO 5–10 min
Terai, et al. [5] 8 10° 3.0 ± 0.2 3.4 ± 0.3 * 3.1 ± 0.3 60° 2.8 ± 0.2 3.2 ± 0.2 * 3.1 ± 0.3
Ostrow, et al. [31] 18 10° 3.33 ± 0.77 3.63 ± 0.73 45° 2.6 ± 0.7 2.9 ± 0.9
Dirschedl, et al. [32] 10 6° 2.6 ± 0.7 2.7 ± 0.7 30° 3.33 ± 0.77 3.61 ± 0.81
Reich, et al. [33] 18 20° 2.36 ± 0.79 2.52 ± 0.93 * 60° 2.36 ± 0.79 2.37 ± 0.73
PLR is passive leg raising. All subjects are reported to be normovolaemic. * p < 0.05 for change from baseline
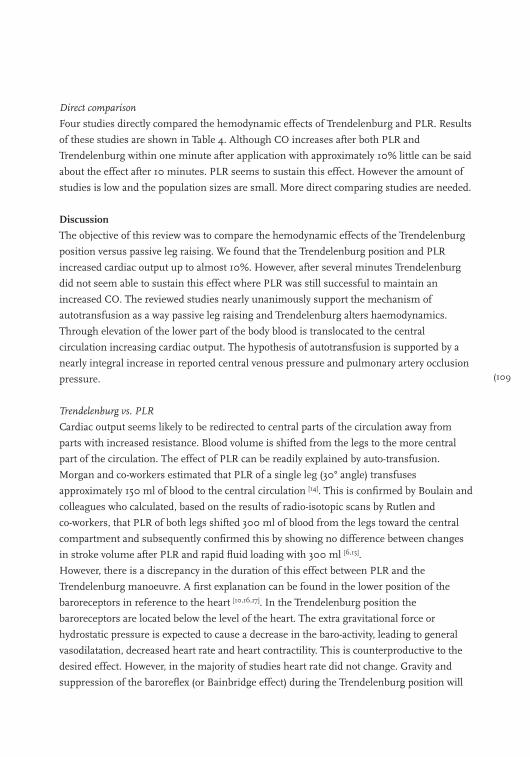
(109
Direct comparison
Four studies directly compared the hemodynamic effects of Trendelenburg and PLR. Results
of these studies are shown in Table 4. Although CO increases after both PLR and
Trendelenburg within one minute after application with approximately 10% little can be said
about the effect after 10 minutes. PLR seems to sustain this effect. However the amount of
studies is low and the population sizes are small. More direct comparing studies are needed.
Discussion
The objective of this review was to compare the hemodynamic effects of the Trendelenburg
position versus passive leg raising. We found that the Trendelenburg position and PLR
increased cardiac output up to almost 10%. However, after several minutes Trendelenburg
did not seem able to sustain this effect where PLR was still successful to maintain an
increased CO. The reviewed studies nearly unanimously support the mechanism of
autotransfusion as a way passive leg raising and Trendelenburg alters haemodynamics.
Through elevation of the lower part of the body blood is translocated to the central
circulation increasing cardiac output. The hypothesis of autotransfusion is supported by a
nearly integral increase in reported central venous pressure and pulmonary artery occlusion
pressure.
Trendelenburg vs. PLR
Cardiac output seems likely to be redirected to central parts of the circulation away from
parts with increased resistance. Blood volume is shifted from the legs to the more central
part of the circulation. The effect of PLR can be readily explained by auto-transfusion.
Morgan and co-workers estimated that PLR of a single leg (30° angle) transfuses
approximately 150 ml of blood to the central circulation [14]. This is confirmed by Boulain and
colleagues who calculated, based on the results of radio-isotopic scans by Rutlen and
co-workers, that PLR of both legs shifted 300 ml of blood from the legs toward the central
compartment and subsequently confirmed this by showing no difference between changes
in stroke volume after PLR and rapid fluid loading with 300 ml [6,15].
However, there is a discrepancy in the duration of this effect between PLR and the
Trendelenburg manoeuvre. A first explanation can be found in the lower position of the
baroreceptors in reference to the heart [10,16,17]. In the Trendelenburg position the
baroreceptors are located below the level of the heart. The extra gravitational force or
hydrostatic pressure is expected to cause a decrease in the baro-activity, leading to general
vasodilatation, decreased heart rate and heart contractility. This is counterproductive to the
desired effect. However, in the majority of studies heart rate did not change. Gravity and
suppression of the baroreflex (or Bainbridge effect) during the Trendelenburg position will

110)
cause blood to dam in the veins, atria and pulmonary circulation which will decrease venous
return and cardiac output subsequently [18-21]. This is supported by Sibbald and co-workers
who reported a rise in central venous pressure [9]. Additionally, Sing and co-workers found
that the Trendelenburg position did not improve systemic tissue oxygenation in
hypovolaemic subjects [22]. This can be explained by the cephalad movement of abdominal
organs against the diaphragm, resulting in a higher thoracic pressure and central venous
pressure thus decreasing venous return [19-21].
Considerations
Several issues need to be taken into consideration. The standard error of the mean change is
underreported in PLR and Trendelenburg literature. Also the standard errors could not be
indirectly extracted from other data given in the articles, such as P-values or correlations.
Henceforth, the data was not suited for traditional meta-analysis. Therefore we did a
straightforward unweighted meta-analysis, which is statistically valid but some power is lost.
The quality of the results of this meta-analysis would improve if more data was available and
direct comparison was performed in the same groups.
We have to realize that hemodynamic parameters were monitored with different techniques.
For instance, arterial blood pressure was measured with the Riva-Rocci method in some
studies or with invasive techniques in either aorta or radial artery. Cardiac output was
measured with variety of techniques with accuracies between 8 and 15% [23,24].
Thermodilution is the most often used technique and can be considered the “gold standard”.
Only the techniques that show a high correlation or good agreement with the gold standard
allowing to combine and to compare the results of the different studies [25]. The amplitude of
the effect of CO with both maneouvers is well accepted in fluid loading responsiveness
research and considered clinically significant [24,26].
The results of this review do not show a difference between normovolaemic and
hypovolaemic patients in their response in CO after PLR or Trendelenburg. The amount of
autotransfusion is likely to be less in a hypovolaemic state. However, this difference is likely
compensated by the relative larger increase to a volume challenge in hypovolaemia
compared to normovolaemia, i.e. when one is on a steeper slope of the Frank-Starling curve.
A fluid loading challenge does not have to increase CO only in hypovolaemic patients but
this will also occur during normovolaemia. In hypervolaemia, however, this is less likely
since the heart will function on the flat part of the Frank Starling curve.
In this review differences exist between the studies such as mechanical ventilation or
spontaneous breathing, level of sedation, beta blockade (i.e. cardiac surgery patients) and
types of surgery. All these factors can influence the endogenous adrenergic response to

(111
positional change and the magnitude of the effect on CO. Identification and consequent
analysis of the influence of these confounders would be very complex and not in the scope of
the present review.
We also have to consider the practical applicability of both manoeuvres. Trendelenburg can
be performed in nearly every situation in a medical setting. Although PLR can be easy to
perform it can be impossible during certain types of surgery. Trendelenburg will be relatively
contraindicated in most head-trauma patients.
Finally, in hypovolaemia guarantee of sufficient cerebral blood flow is vital. Shenkin and
co-workers observed cerebral flow velocity to decrease in normal humans during
Trendelenburg position although carotid blood flow increased [27]. We cannot rule out that
Trendelenburg position changes perfusion of the vital organs with or without coinciding
changes in cardiac output. The absence of studies into the effects on regional blood flow or
local oxygen delivery by these manoeuvres is a major limitation to hemodynamic assessment
in clinical studies as a whole.
Conclusions
We compared the hemodynamic effects of the Trendelenburg and passive leg raising and
found that both manoeuvres increased cardiac output by 6-9% within one minute. However,
after several minutes PLR seemed more able to sustain this effect than Trendelenburg. This
is possibly explained by the position of the baroreceptors and a cephalad movement of
abdominal organs during Trendelenburg. Since fluid resuscitation during hypovolaemia is
not achieved within minutes, we advocate the use of autotransfusion with PLR in the initial
treatment of hypovolaemia if possible.
112)
References
1. Falk JL, O’Brien JF, Kerr R. Fluid resuscitation in traumatic hemorrhagic shock. Crit Care Clin 1992; 8:
323-40.
2. Jastremski MS, Beney KM. Military antishock trouser (MAST). Application as a reversible fluid challenge in
patients on high PEEP. Chest 1984; 85: 595-9.
3. Von Trendelenburg F. Operations for vesico-vaginal fistula and the elavated pelvic position for operations
within the abdominal caivity. Samml klin Vortrage (Volkmanns) 1890; 355: 3373-92.
4. Ostrow CL. Use of the Trendelenburg position by critical care nurses: Trendelenburg survey. Am J Crit Care
1997; 6: 172-6.
5. Terai C, Anada H, Matsushima S, et al. Effects of Trendelenburg versus passive leg raising: autotransfusion
in humans. Intensive Care Med 1996; 22: 613-4.
6. Boulain T, Achard JM, Teboul JL, et al. Changes in BP induced by passive leg raising predict response to
fluid loading in critically ill patients. Chest 2002; 121: 1245-52.
7. Higgins JPT, Green S. Cochrane Handbook for Systematic Reviews of Interventions Chichester, UK, John
Wiley & Sons, Ltd., 2006.
8. Shuster JJ. Empirical vs natural weighting in random effects meta-analysis. Stat Med 2010; 29: 1259-65.
9. Sibbald WJ, Paterson NA, Holliday RL, Baskerville J. The Trendelenburg position: hemodynamic effects in
hypotensive and normotensive patients. Crit Care Med 1979; 7: 218-24.
10. Taylor J, Weil MH. Failure of the Trendelenburg position to improve circulation during clinical shock. Surg
Gynecol Obstet 1967; 124: 1005-10.
11. Maizel J, Airapetian N, Lorne E, et al. Diagnosis of central hypovolemia by using passive leg raising.
Intensive Care Med 2007; 33: 1133-8.
12. Lafanechere A, Pene F, Goulenok C, et al. Changes in aortic blood flow induced by passive leg raising predict
fluid responsiveness in critically ill patients. Crit Care 2006; 10: R132.
13. Jabot J, Teboul JL, Richard C, Monnet X. Passive leg raising for predicting fluid responsiveness: importance
of the postural change. Intensive Care Med 2009; 35: 85-90.
14. Morgan BC, Guntheroth WG, McGough G. Effect of position on leg volume. Case against the Trendelenburg
position. JAMA 1964; 187: 1024-6.
15. Rutlen DL, Wackers FJ, Zaret BL. Radionuclide assessment of peripheral intravascular capacity: a technique
to measure intravascular volume changes in the capacitance circulation in man. Circulation 1981; 64:
146-52.
16. Wilkins RW, Bradley SE, Friedland CK. The acute circulatory effects of the head-down position (negative G
in normal man, with a note on some measures designed to relieve cranial congestion in this position. J Clin
Invest 1950; 29: 940-9.
17. Cole F. Head lowering in treatment of hypotension. JAMA 1952; 150: 273-4.
18. Geelen G, Saumet JL, Arbeille P, et al. Hemodynamic, plasma renin activity and norepinephrine changes
induced by anti-G suit inflation in man. Physiologist 1990; 33: S108-S109.
19. Tenney SM. Fluid volume redistribution and thoracic volume changes during recumbency. J Appl Physiol
1959; 14: 129-32.
20. Matalon SV, Farhi LE. Cardiopulmonary readjustments in passive tilt. J Appl Physiol 1979; 47: 503-7.
21. Agostini E, Mead J. Statistics of the respiratory system, Handbook of physiology, 1st Edition. Edited by Fenn
WO, Rahn H. Washington D.C., American Physiological Society 1964, 387-410.
22. Sing RF, O’Hara D, Sawyer MA, Marino PL. Trendelenburg position and oxygen transport in hypovolemic
adults. Ann Emerg Med 1994; 23: 564-7.
(113
23. Stetz CW, Miller RG, Kelly GE, Raffin TA. Reliability of the thermodilution method in the determination of
cardiac output in clinical practice. Am Rev Respir Dis 1982; 126: 1001-4.
24. Geerts BF, Aarts LP, Jansen JR. Methods in pharmacology: measurement of cardiac output. Br J Clin
Pharmacol 2011; 71: 316-30.
25. Chaney JC, Derdak S. Minimally invasive hemodynamic monitoring for the intensivist: current and
emerging technology. Crit Care Med 2002; 30: 2338-45.
26. Monnet X, Rienzo M, Osman D, et al. Passive leg raising predicts fluid responsiveness in the critically ill.
Crit Care Med 2006; 34: 1402-7.
27. Shenkin HA, Scheuerman WG. Effect of change of position upon the cerebral circulation of man. J Appl
Physiol 1949; 2: 317-26.
28. van Lieshout JJ, Harms MP, Pott F, et al. Stroke volume of the heart and thoracic fluid content during
head-up and head-down tilt in humans. Acta Anaesthesiol Scand 2005; 49: 1287-92.
29. Reuter DA, Felbinger TW, Schmidt C, et al. Trendelenburg positioning after cardiac surgery: effects on
intrathoracic blood volume index and cardiac performance. Eur J Anaesthesiol 2003; 20: 17-20.
30. Terai C, Anada H, Matsushima S, et al. Effects of mild Trendelenburg on central hemodynamics and
internal jugular vein velocity, cross-sectional area, and flow. Am J Emerg Med 1995; 13: 255-8.
31. Ostrow CL, Hupp E, Topjian D. The effect of Trendelenburg and modified trendelenburg positions on
cardiac output, blood pressure, and oxygenation: a preliminary study. Am J Crit Care 1994; 3: 382-6.
32. Dirschedl P, Gregull A, Lollgen H. Volume loading of the heart by “leg up” position and head down tilting
(-6 degrees) (HDT). Acta Astronaut 1992; 27: 41-3.
33. Reich DL, Konstadt SN, Raissi S, et al. Trendelenburg position and passive leg raising do not significantly
improve cardiopulmonary performance in the anesthetized patient with coronary artery disease. Crit Care
Med 1989; 17: 313-7.
34. Gentili DR, Benjamin E, Berger SR, Iberti TJ. Cardiopulmonary effects of the head-down tilt position in
elderly postoperative patients: a prospective study. South Med J 1988; 81: 1258-60.
35. Pricolo VE, Burchard KW, Singh AK, et al. Trendelenburg versus PASG application--hemodynamic response
in man. J Trauma 1986; 26: 718-26.
36. Jennings T, Seaworth J, Howell L, et al. Effect of body inversion on hemodynamics determined by
two-dimensional echocardiography. Crit Care Med 1985; 13: 760-2.
37. Hong JY. Haemodynamic and ventilatory effects of preoperative epidural analgesia during laparoscopic
hysterectomy using NICO. Singapore Med J 2008; 49: 233-8.
38. Tempe DK, Khanna SK, Banerjee A. Importance of venting the left ventricle in aortic valve surgery. Indian
Heart J 1999; 51: 532-6.
39. Nelson GI, Ahuja RC, Silke B, et al. Haemodynamic effects of frusemide and its influence on repetitive rapid
volume loading in acute myocardial infarction. Eur Heart J 1983; 4: 706-11.
40. Gaffney FA, Bastian BC, Thal ER, et al. Passive leg raising does not produce a significant or sustained
autotransfusion effect. J Trauma 1982; 22: 190-3.
41. Paelinck BP, van Eck JW, De Hert SG, Gillebert TC. Effects of postural changes on cardiac function in
healthy subjects. Eur J Echocardiogr 2003; 4: 196-201.
42. Bertolissi M, Broi UD, Soldano F, Bassi F. Influence of passive leg elevation on the right ventricular function
in anaesthetized coronary patients. Crit Care 2003; 7: 164-70.
43. Schrijen FV, Henriquez A, Candina R, Polu JM. Pulmonary blood volume and haemodynamic changes with
legs raised in chronic lung disease patients. Cardiovasc Res 1991; 25: 895-900.
44. Carrère-Debat D, Holzapfel L, Giudicelli DP, et al. Straight Leg Raising: Application As A Reversible Fluid
Challenge in Patients on Peep. Crit Care Med 1987; 15: 398.

114)
45. Schreuder JJ, van der Veen FH, van der Velde ET, et al. Left ventricular pressure-volume relationships before
and after cardiomyoplasty in patients with heart failure. Circulation 1997; 96: 2978-86.
46. Albert RK, Schrijen F, Poincelot F. Oxygen consumption and transport in stable patients with chronic
obstructive pulmonary disease. Am Rev Respir Dis 1986; 134: 678-82.
47. Jorgensen K, Houltz E, Westfelt U, Ricksten SE. Left ventricular performance and dimensions in patients
with severe emphysema. Anesth Analg 2007; 104: 887-92.
48. de Wilde RB, Geerts BF, Cui J, et al. Performance of three minimally invasive cardiac output monitoring
systems. Anaesthesia 2009; 64: 762-9.
49. de Wilde RB, Geerts BF, van den Berg PC, Jansen JR. A comparison of stroke volume variation measured by
the LiDCOplus and FloTrac-Vigileo system. Anaesthesia 2009; 64: 1004-9.
50. Wong DH, O’Connor D, Tremper KK, et al. Changes in cardiac output after acute blood loss and position
change in man. Crit Care Med 1989; 17: 979-83.
51. Wong DH, Tremper KK, Zaccari J, et al. Acute cardiovascular response to passive leg raising. Crit Care Med
1988; 16: 123-5.

(115

116)
Section 3
Mean systemic filling pressure

(117
Chapter 7
Partitioning the resistances along the vascular tree: effects of dobutamine and hypovolemia in piglets with an intact circulation
Bart Geerts, Jacinta Maas, Leon Aarts, Michael Pinsky and Jos Jansen
Journal of Clinical Monitoring and Computing 2010; 24: 377–384
118)
The hemodynamic effects of therapeutic interventions have been extensively studied on
isolated arterial, venous or heart models either in vitro or in vivo. Although, intact circulation
models have been used before, they are often limited to only one study characteristic; i.e.
heart function, venous capacitance, (un)stressed volume, vascular compliance, mean
systemic filling pressure or venous resistance [1]. None of these models is applicable in ICU
patients and none was used to determine the coherent characteristics of the venous and
arterial vasculature and heart function. Since arteries, veins and heart operate in concert, we
developed an integrated in vivo model, applicable in patients, based on Guytonian
physiology.
We modelled the systemic circulation with one resistor upstream (Ra) and one resistor
downstream (Rv) of mean systemic filling pressure (Pmsf) (Figure 1). At the site where the
pressure is equal to Pmsf the large blood volume is indicated by a capacitor [2-4]. This site
contains about 70% of total blood volume and has been reported to correspond with the
location of the capillaries and post-capillary venules [5]. Resistance over the total systemic
circulation (Rsys) and over the venous system (Rv) can be calculated from aortic pressure
(Pao), central venous pressure (Pcv) and cardiac output (CO) values as (Pao-Pcv)/CO and Rv
by (Pmsf-Pcv)/CO, respectively (Figure 1). Rsys reflects both arterial and venous resistance:
Rsys = Ra +Rv. So, Ra = Rsys - Rv.
Figure 1 The circulation model to compute the resistances up-streams (Ra) and down-streams (Rv) of
mean systemic filling pressure (Psf). The sum of Ra and Rv is equal to total systemic resistance
(Rsys). Aortic pressure (Pao) and central venous pressure (Pcv) are measured. Mean systemic
filling pressure is determined with inspiratory hold maneouvers.
In this study we used a hemodynamic condition of hypovolemia as well as dobutamine as a
known cardiovascular stimulant to test our model in an intact anesthetized piglet model. In
the vasculature, Ruffolo and colleagues [6] presumed that with dobutamine, the β2 mediated
(119
effects are counterbalanced by the α1 activity leading a decreased total peripheral vascular
resistance by a reduction of sympathetic tone and arterial vasodilatation. However, since
local vascular effects may differ owning to local differences in receptor expression which
varies in arteries and vein, one may see either local vasodilatation or vasoconstriction.
Presently, no intact-circulation model exists to study differences in systemic arterial and
venous resistance. Since we recently validated a bedside technique to estimate mean
circulatory filling pressure (Pmsf) [7], we are now able to determine the venous resistance in
patients. Thus, examining both total blood flow and the ratio of the systemic to venous
resistance one can quantify the effect of different hemodynamic conditions and vasoactive
agents on total systemic vascular resistance and venous resistance.
The aim of our study was to determine the reproducibility of Pmsf, Rsys and Rv in our intact
in vivo piglet model and, secondly, we tested our model during dobutamine and
hypovolemia. We hypothesize that dobutamine would increase CO by the combined actions
of increasing inotropy, arterial vasodilation, with less evident venodilation. Furthermore, we
expected both hypovolemia and dobutamine to decrease Pmsf and hypovolemia to not
change in the site of Pmsf, i.e. the ratio Rv/Rsys to be constant.
Methods
All experiments were performed according to the ‘‘Guide for Care and Use of Laboratory
Animals’’ published by the US National Institutes of Health and were approved by the local
Animal Care Committee.
Surgery
Ten Yorkshire piglets were anesthetized with 30 mg∙kg-1 sodium pentobarbital intra-
peritoneal, followed by a continuous infusion of 9.0 mg∙kg-1∙h-1. After tracheostomy, the
animals were ventilated at a rate of 10 breaths per minute at an I:E-ratio of 2.4:3.6 and with a
tidal volume adjusted to maintain arterial PCO2 of approximately 40 mmHg, while a positive
end-expiratory pressure of 2 cmH2O was applied. PCO2, airway pressure and airflow were
measured in the tracheal cannula. The animals were placed in a supine position on a
thermo-controlled operating table (38° C). A catheter was inserted through the right
common carotid artery into the aortic arch to measure Pao and to sample arterial blood. Two
other catheters were inserted through the right external jugular vein. A pulmonary artery
catheter was inserted to measure pulmonary artery pressure, to measure thermodilution
cardiac output (COtd) and to sample mixed venous blood. A quadruple-lumen catheter was
inserted into the superior vena cava to measure Pcv and to infuse sodium pentobarbital and
pancuronium bromide (Organon N.V., Boxtel, the Netherlands). The catheters for vascular
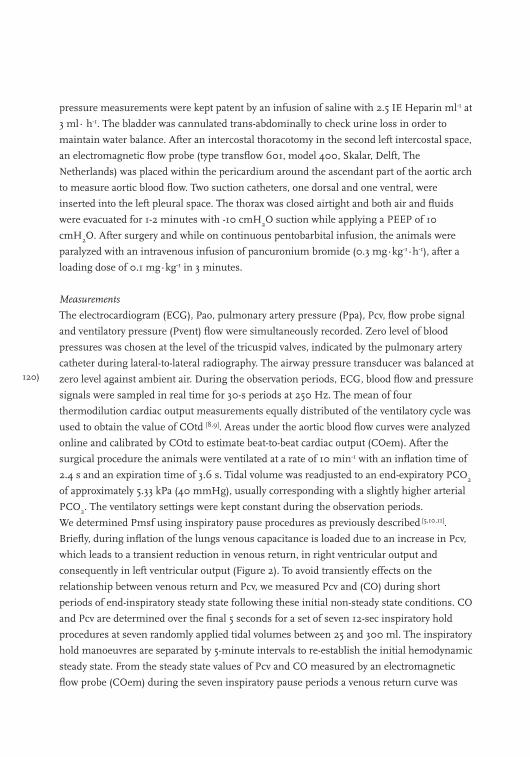
120)
pressure measurements were kept patent by an infusion of saline with 2.5 IE Heparin ml-1 at
3 ml∙ h-1. The bladder was cannulated trans-abdominally to check urine loss in order to
maintain water balance. After an intercostal thoracotomy in the second left intercostal space,
an electromagnetic flow probe (type transflow 601, model 400, Skalar, Delft, The
Netherlands) was placed within the pericardium around the ascendant part of the aortic arch
to measure aortic blood flow. Two suction catheters, one dorsal and one ventral, were
inserted into the left pleural space. The thorax was closed airtight and both air and fluids
were evacuated for 1-2 minutes with -10 cmH2O suction while applying a PEEP of 10
cmH2O. After surgery and while on continuous pentobarbital infusion, the animals were
paralyzed with an intravenous infusion of pancuronium bromide (0.3 mg∙kg-1∙h-1), after a
loading dose of 0.1 mg∙kg-1 in 3 minutes.
Measurements
The electrocardiogram (ECG), Pao, pulmonary artery pressure (Ppa), Pcv, flow probe signal
and ventilatory pressure (Pvent) flow were simultaneously recorded. Zero level of blood
pressures was chosen at the level of the tricuspid valves, indicated by the pulmonary artery
catheter during lateral-to-lateral radiography. The airway pressure transducer was balanced at
zero level against ambient air. During the observation periods, ECG, blood flow and pressure
signals were sampled in real time for 30-s periods at 250 Hz. The mean of four
thermodilution cardiac output measurements equally distributed of the ventilatory cycle was
used to obtain the value of COtd [8,9]. Areas under the aortic blood flow curves were analyzed
online and calibrated by COtd to estimate beat-to-beat cardiac output (COem). After the
surgical procedure the animals were ventilated at a rate of 10 min-1 with an inflation time of
2.4 s and an expiration time of 3.6 s. Tidal volume was readjusted to an end-expiratory PCO2
of approximately 5.33 kPa (40 mmHg), usually corresponding with a slightly higher arterial
PCO2. The ventilatory settings were kept constant during the observation periods.
We determined Pmsf using inspiratory pause procedures as previously described [5,10,11].
Briefly, during inflation of the lungs venous capacitance is loaded due to an increase in Pcv,
which leads to a transient reduction in venous return, in right ventricular output and
consequently in left ventricular output (Figure 2). To avoid transiently effects on the
relationship between venous return and Pcv, we measured Pcv and (CO) during short
periods of end-inspiratory steady state following these initial non-steady state conditions. CO
and Pcv are determined over the final 5 seconds for a set of seven 12-sec inspiratory hold
procedures at seven randomly applied tidal volumes between 25 and 300 ml. The inspiratory
hold manoeuvres are separated by 5-minute intervals to re-establish the initial hemodynamic
steady state. From the steady state values of Pcv and CO measured by an electromagnetic
flow probe (COem) during the seven inspiratory pause periods a venous return curve was
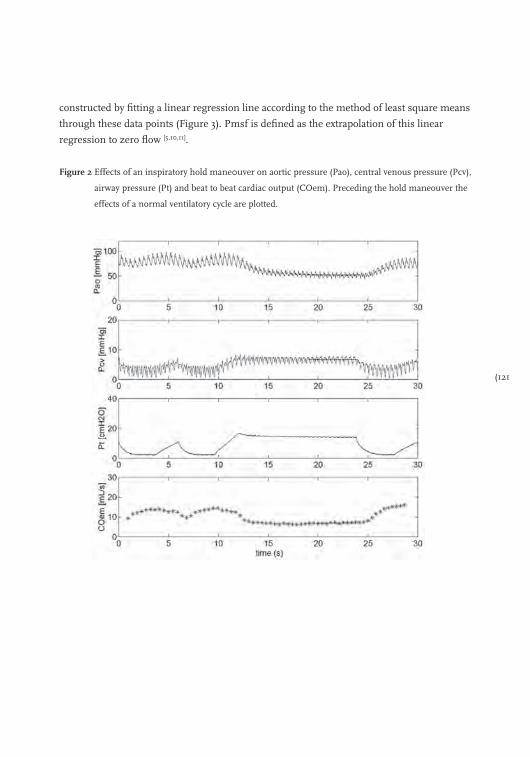
(121
constructed by fitting a linear regression line according to the method of least square means
through these data points (Figure 3). Pmsf is defined as the extrapolation of this linear
regression to zero flow [5,10,11].
Figure 2 Effects of an inspiratory hold mane0uver on aortic pressure (Pao), central venous pressure (Pcv),
airway pressure (Pt) and beat to beat cardiac output (COem). Preceding the hold maneouver the
effects of a normal ventilatory cycle are plotted.
122)
Figure 3 Venous return curve for an individual animal. The relationship between venous return (COem)
and central venous pressure (Pcv) is plotted. Mean system filling pressure (Pmsf) is indicated by
extrapolating the curve to COem=zero.
Protocol
To eliminate the effects of surgery, opening of the pericardium, and applying mechanical
ventilation on the hemodynamic measurements, the piglets were allowed to stabilize for 60 to
120 minutes after surgery. Data collection started once heart rate (HR), mean Pao and Pcv
were stable for at least 15 minutes. After stabilization, baseline-1 measurements were
performed. Next, continuous dobutamine infusion was started with 6 μg∙kg-1∙min-1 and
hemodynamic measurements were performed after 30 minutes. The dobutamine infusion
was stopped and after 30 minutes baseline-2 measurements were obtained. The observations
were continued 15 minutes after bleeding the animals with 10 ml∙kg-1. The observations ended
with baseline-3 measurements 15 minutes after giving back the withdrawn 10 ml∙kg-1 blood.
Data analysis and statistics
We fitted the set of seven data points of Pcv and COem by linear regression for each
condition to define the venous return curve. We defined Pmsf as the extrapolation of this
(123
linear regression to zero flow (Figure 3), assuming that airway pressure does not affects
Pmsf. We have previously validated this extrapolation in piglets [5,10,11]. Total systemic vascular
resistance (Rsys) was calculated as the ratio of the pressure difference between mean Pa and
mean Pcv and COtd (Rsys = (Pa - Pcv)/COtd). The resistance downstream of Pmsf was taken
to reflect the resistance to venous return (Rv) and was calculated as the ratio of the pressure
difference between Pcv and Pmsf and COtd (Rv = (Pmsf-Pcv)/COtd). Systemic arterial
resistance (Ra) was taken to be the difference between systemic and venous resistance. The
ratio of Rv and Rsys describes the location within the circulation where Pmsf exists. A
higher ratio implies a more upstream Pmsf location. After confirming a normal distribution
of data with the Kolmogorov-Smirnov test, differences in parameters during baseline and
interventions were analyzed using paired t-tests. Repeatability was calculated from the three
baseline conditions using Bland-Altman analysis. Hereto, for each animal the mean and
difference of the values of baseline-1 and 2 and of baseline-2 and 3 was determined. The
upper and lower limits of agreement were calculated as bias ± 2SD. The coefficient of
variation (COV) was calculated as 100% x (SD/mean). Effects of time on our data set were
calculated by comparing baseline values. Changes induced by the interventions with
dobutamine and hypovolemia were compared to the mean of the baseline values before and
after the interventions to illuminate time effect. All values are given as mean ± SD. A p value
< 0.05 was considered statistically significant.
Results
Ten 8–10 week old piglets (all females) bodyweight of 10.3 ± 0.7 kg were studied. Pooled data
are shown in Table 1. A Kolmogorov-Smirnov test indicated normal distribution of all data.
In 10 animals baseline-1, dobutamine, and baseline-2 data was obtained, in only 8 animals
we were able to study the effects of bleeding by 10 ml∙kg-1.
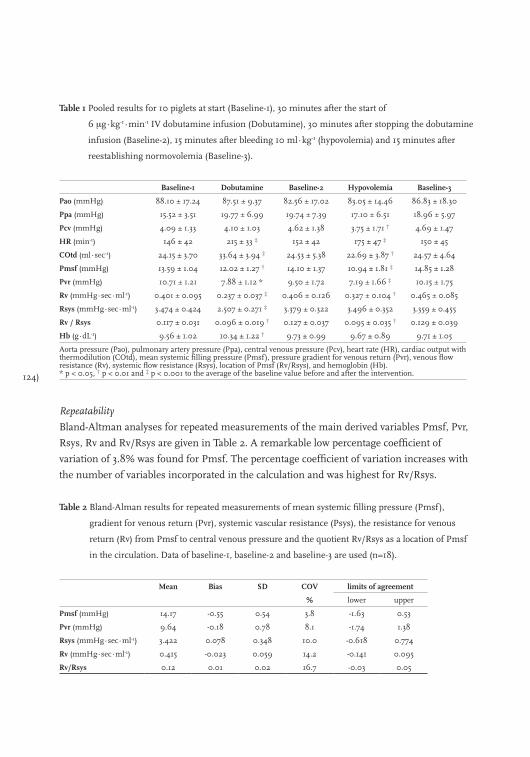
124)
Table 1 Pooled results for 10 piglets at start (Baseline-1), 30 minutes after the start of
6 μg∙kg-1∙min-1 IV dobutamine infusion (Dobutamine), 30 minutes after stopping the dobutamine
infusion (Baseline-2), 15 minutes after bleeding 10 ml∙kg-1 (hypovolemia) and 15 minutes after
reestablishing normovolemia (Baseline-3).
Baseline-1 Dobutamine Baseline-2 Hypovolemia Baseline-3
Pao (mmHg) 88.10 ± 17.24 87.51 ± 9.37 82.56 ± 17.02 83.05 ± 14.46 86.83 ± 18.30
Ppa (mmHg) 15.52 ± 3.51 19.77 ± 6.99 19.74 ± 7.39 17.10 ± 6.51 18.96 ± 5.97
Pcv (mmHg) 4.09 ± 1.33 4.10 ± 1.03 4.62 ± 1.38 3.75 ± 1.71 † 4.69 ± 1.47
HR (min-1) 146 ± 42 215 ± 33 ‡ 152 ± 42 175 ± 47 ‡ 150 ± 45
COtd (ml∙sec-1) 24.15 ± 3.70 33.64 ± 3.94 ‡ 24.53 ± 5.38 22.69 ± 3.87 † 24.57 ± 4.64
Pmsf (mmHg) 13.59 ± 1.04 12.02 ± 1.27 † 14.10 ± 1.37 10.94 ± 1.81 ‡ 14.85 ± 1.28
Pvr (mmHg) 10.71 ± 1.21 7.88 ± 1.12 * 9.50 ± 1.72 7.19 ± 1.66 ‡ 10.15 ± 1.75
Rv (mmHg∙sec∙ml-1) 0.401 ± 0.095 0.237 ± 0.037 ‡ 0.406 ± 0.126 0.327 ± 0.104 † 0.465 ± 0.085
Rsys (mmHg∙sec∙ml-1) 3.474 ± 0.424 2.507 ± 0.271 ‡ 3.379 ± 0.322 3.496 ± 0.352 3.359 ± 0.455
Rv / Rsys 0.117 ± 0.031 0.096 ± 0.019 † 0.127 ± 0.037 0.095 ± 0.035 † 0.129 ± 0.039
Hb (g∙dL-1) 9.56 ± 1.02 10.34 ± 1.22 † 9.73 ± 0.99 9.67 ± 0.89 9.71 ± 1.05
Aorta pressure (Pao), pulmonary artery pressure (Ppa), central venous pressure (Pcv), heart rate (HR), cardiac output with thermodilution (COtd), mean systemic filling pressure (Pmsf), pressure gradient for venous return (Pvr), venous flow resistance (Rv), systemic flow resistance (Rsys), location of Pmsf (Rv/Rsys), and hemoglobin (Hb). * p < 0.05, † p < 0.01 and ‡ p < 0.001 to the average of the baseline value before and after the intervention.
Repeatability
Bland-Altman analyses for repeated measurements of the main derived variables Pmsf, Pvr,
Rsys, Rv and Rv/Rsys are given in Table 2. A remarkable low percentage coefficient of
variation of 3.8% was found for Pmsf. The percentage coefficient of variation increases with
the number of variables incorporated in the calculation and was highest for Rv/Rsys.
Table 2 Bland-Alman results for repeated measurements of mean systemic filling pressure (Pmsf),
gradient for venous return (Pvr), systemic vascular resistance (Psys), the resistance for venous
return (Rv) from Pmsf to central venous pressure and the quotient Rv/Rsys as a location of Pmsf
in the circulation. Data of baseline-1, baseline-2 and baseline-3 are used (n=18).
Mean Bias SD COV limits of agreement
% lower upper
Pmsf (mmHg) 14.17 -0.55 0.54 3.8 -1.63 0.53
Pvr (mmHg) 9.64 -0.18 0.78 8.1 -1.74 1.38
Rsys (mmHg∙sec∙ml-1) 3.422 0.078 0.348 10.0 -0.618 0.774
Rv (mmHg∙sec∙ml-1) 0.415 -0.023 0.059 14.2 -0.141 0.095
Rv/Rsys 0.12 0.01 0.02 16.7 -0.03 0.05
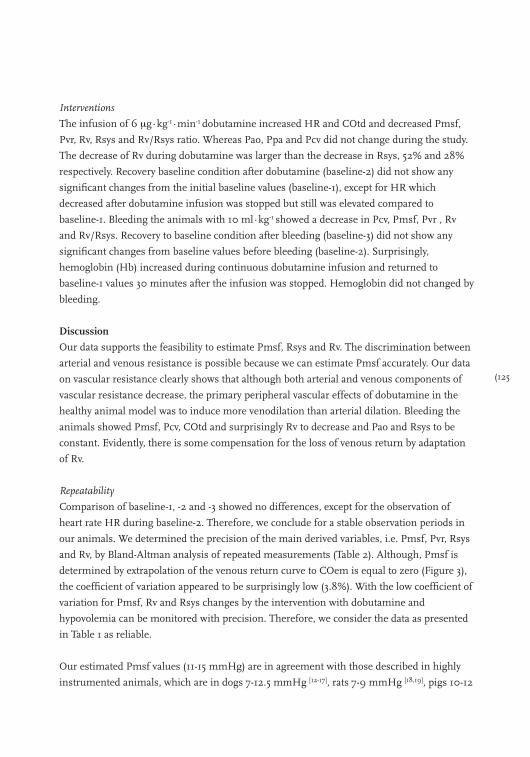
(125
Interventions
The infusion of 6 μg∙kg-1∙min-1 dobutamine increased HR and COtd and decreased Pmsf,
Pvr, Rv, Rsys and Rv/Rsys ratio. Whereas Pao, Ppa and Pcv did not change during the study.
The decrease of Rv during dobutamine was larger than the decrease in Rsys, 52% and 28%
respectively. Recovery baseline condition after dobutamine (baseline-2) did not show any
significant changes from the initial baseline values (baseline-1), except for HR which
decreased after dobutamine infusion was stopped but still was elevated compared to
baseline-1. Bleeding the animals with 10 ml∙kg-1 showed a decrease in Pcv, Pmsf, Pvr , Rv
and Rv/Rsys. Recovery to baseline condition after bleeding (baseline-3) did not show any
significant changes from baseline values before bleeding (baseline-2). Surprisingly,
hemoglobin (Hb) increased during continuous dobutamine infusion and returned to
baseline-1 values 30 minutes after the infusion was stopped. Hemoglobin did not changed by
bleeding.
Discussion
Our data supports the feasibility to estimate Pmsf, Rsys and Rv. The discrimination between
arterial and venous resistance is possible because we can estimate Pmsf accurately. Our data
on vascular resistance clearly shows that although both arterial and venous components of
vascular resistance decrease, the primary peripheral vascular effects of dobutamine in the
healthy animal model was to induce more venodilation than arterial dilation. Bleeding the
animals showed Pmsf, Pcv, COtd and surprisingly Rv to decrease and Pao and Rsys to be
constant. Evidently, there is some compensation for the loss of venous return by adaptation
of Rv.
Repeatability
Comparison of baseline-1, -2 and -3 showed no differences, except for the observation of
heart rate HR during baseline-2. Therefore, we conclude for a stable observation periods in
our animals. We determined the precision of the main derived variables, i.e. Pmsf, Pvr, Rsys
and Rv, by Bland-Altman analysis of repeated measurements (Table 2). Although, Pmsf is
determined by extrapolation of the venous return curve to COem is equal to zero (Figure 3),
the coefficient of variation appeared to be surprisingly low (3.8%). With the low coefficient of
variation for Pmsf, Rv and Rsys changes by the intervention with dobutamine and
hypovolemia can be monitored with precision. Therefore, we consider the data as presented
in Table 1 as reliable.
Our estimated Pmsf values (11-15 mmHg) are in agreement with those described in highly
instrumented animals, which are in dogs 7-12.5 mmHg [12-17], rats 7-9 mmHg [18,19], pigs 10-12
126)
mmHg [5,10,11], and as high as 20-30 mmHg in conscious calves implanted with an artificial
heart [20]. Furthermore, we report a baseline Pmsf value of 19 mmHg in cardiovascular
surgical patients [7].
How can our data be explained? In a non-controlled circulation a decrease in effective blood
volume (i.e. a change from stressed to unstressed volume) will be reflected by a decrease in
Pmsf [21]. If dobutamine caused arterial vasodilation such that the number of perfused
capillaries increased, then unstressed volume should also increase, decreasing Pmsf for a
constant blood volume. The greater number of draining venous conduits would also
decrease the resistance to venous return. We found that dobutamine decreased without
altering Pcv, decreasing the pressure gradient for venous return. Despite this decrease in
pressure gradient, cardiac output was increased. Thus, the decrease in Rv was more than
inversely proportional to the increase in cardiac output or cardiac output would have
remained constant. A decrease in Rv may be caused by four mechanisms; (1) a decrease of
the length of the vascular bed between the sites were the pressure is equal to Pmsf and right
atrium, (2) an increase in cross section of the vascular bed, (3) decrease blood viscosity of
blood or (4) a combination of the three mechanisms. As we measure an increase in Hb
during dobutamine infusion a decrease in viscosity is very unlikely. Thus, the observed
decrease in Pmsf combined with the increased COtd requires that Rv decrease due to an
increase in the venous flow cross-sectional area, presumably due to dobutamine-induced
increased parallel vascular blood flow.
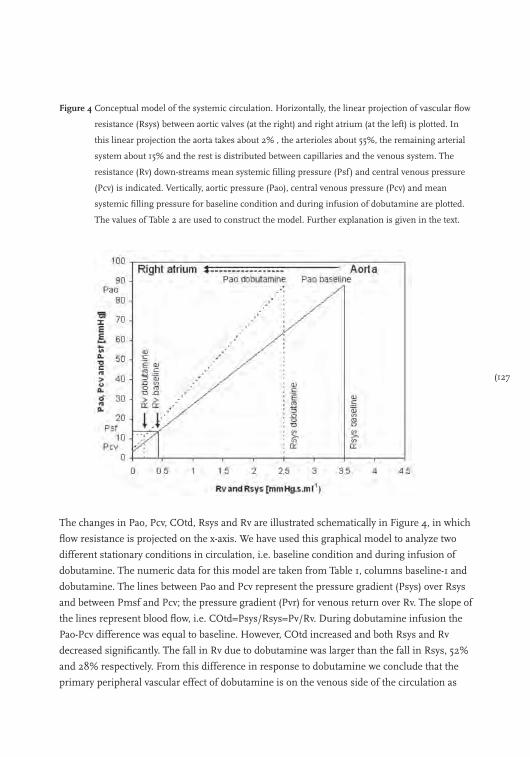
(127
Figure 4 Conceptual model of the systemic circulation. Horizontally, the linear projection of vascular flow
resistance (Rsys) between aortic valves (at the right) and right atrium (at the left) is plotted. In
this linear projection the aorta takes about 2% , the arterioles about 55%, the remaining arterial
system about 15% and the rest is distributed between capillaries and the venous system. The
resistance (Rv) down-streams mean systemic filling pressure (Psf) and central venous pressure
(Pcv) is indicated. Vertically, aortic pressure (Pao), central venous pressure (Pcv) and mean
systemic filling pressure for baseline condition and during infusion of dobutamine are plotted.
The values of Table 2 are used to construct the model. Further explanation is given in the text.
The changes in Pao, Pcv, COtd, Rsys and Rv are illustrated schematically in Figure 4, in which
flow resistance is projected on the x-axis. We have used this graphical model to analyze two
different stationary conditions in circulation, i.e. baseline condition and during infusion of
dobutamine. The numeric data for this model are taken from Table 1, columns baseline-1 and
dobutamine. The lines between Pao and Pcv represent the pressure gradient (Psys) over Rsys
and between Pmsf and Pcv; the pressure gradient (Pvr) for venous return over Rv. The slope of
the lines represent blood flow, i.e. COtd=Psys/Rsys=Pv/Rv. During dobutamine infusion the
Pao-Pcv difference was equal to baseline. However, COtd increased and both Rsys and Rv
decreased significantly. The fall in Rv due to dobutamine was larger than the fall in Rsys, 52%
and 28% respectively. From this difference in response to dobutamine we conclude that the
primary peripheral vascular effect of dobutamine is on the venous side of the circulation as
128)
shown in Figure 4. The larger decrease on the venous side can be explained mainly by the
decrease in Pmsf due to dobutamine. If we had observed no change in Pao, Pcv or Pmsf
despite an increase in COtd, then Rv must have changed proportional to Rsys, which is
described by the intersection of dashed Pao-Pcv dobutamine line and solid Pmsf line.
Importantly, our method to determine Pmsf has recently also been validated in mechanically
ventilated patients [7], thus this approach can now to applied to humans as well. In addition, we
confirmed the well-known positive inotropic effect of dobutamine as manifest by the increase
in HR and stroke volume despite an unchanged Pcv and Pao. It is unclear from our data which
factor plays a greater role in increasing COtd, increasing inotropy or decreasing Rv.
In our animals hypovolemia caused/produced Pmsf, Pcv, COtd and surprisingly Rv to
decrease and Pao and Rsys to be constant. The gradient for venous return, Pvr=Pmsf-Pcv,
decreased with 27%, so with a constant resistance for venous return, Rv, we expected a
decrease in CO of the same order (CO=Pvr/Rv). However, Rv decreased by 16% leading to a
decrease in COtd with only 9%. Thus, there appears to be compensation for the loss of
venous return by adaptation of Rv, manifested by the significant increase in heart rate.
Potentially, this occurred by shifting blood away from the splanchnic circulation with its
higher Rv ro other systemic vascular circuits, as we have previously shown [22], but our study
does not allow us to confirm this speculation. However, since we observed that the location at
which Pmsf exist (Rs/Rsys) shifted more into the direction of the venous site of the
circulation, suggests that such a redistribution of blood flow did occur.
Limitations
Some limitations apply to our model. The technical set-up with a flow probe around the
aorta is not general applicable in humans. A reliable less invasive beat-to-beat determination
of cardiac output by trans-oesophageal ultrasound or arterial pulse contour allow similar
studies to be done in humans [7].
We measured only Pao and Pcv and calculated Pmsf. Pmsf is a lumped variable of all the
vascular beds. Thus, it is not clear, which specific or general vascular beds were affected by
dobutamine infusion or hypovolemia. The difference in local adrenergic receptor (subtype)
expression and overall expression of the receptors vary between different vascular beds and
between species. Although the circulation of the pig bares macroscopic resemblance to the
human physiology, a direct extrapolation of the results is precarious. This, however, also
applies for previous studies [1,6]. Clearly, future human studies using less invasive means will
need to be done to validate these findings in patient with normal vascular responsiveness
and disease.

(129
Conclusions
The use of our in-vivo animal model to assess the hemodynamic effects on Pmsf, Rsys, Rv
and Rv/Rsys of a cardiovascular drug and of hypovolemia was successfully tested. The
discrimination between arterial and venous resistance is possible because we can estimate
Pmsf accurately. The higher cardiac output seen during dobutamine infusion was attributed
to the combined increased cardiac function and decreased venous flow resistance despite a
decrease in Pmsf. Hypovolemia decrease as expected Pmsf but this decrease was partly
compensated for by a decrease in Rv to preserve venous return and thus cardiac output.
130)
References
1. Pang CC. Autonomic control of the venous system in health and disease: effects of drugs. Pharmacol Ther
2001; 90: 179-230.
2. Gelman S. Venous function and central venous pressure: a physiologic story. Anesthesiology 2008; 108: 735-748.
3. Magder S, De Varennes B. Clinical death and the measurement of stressed vascular volume. Crit Care Med
1998; 26: 1061-1064.
4. Peters J, Mack GW, Lister G. The importance of the peripheral circulation in critical illnesses. Intensive Care
Med 2001; 27: 1446-1458.
5. Versprille A, Jansen JR. Mean systemic filling pressure as a characteristic pressure for venous return.
Pflugers Arch 1985; 405: 226-233.
6. Ruffolo RR, Jr. The pharmacology of dobutamine. Am J Med Sci 1987; 294: 244-248.
7. Maas JJ, Geerts BF, van den Berg PC, Pinsky MR, Jansen JR. Assessment of venous return curve and mean
systemic filling pressure in postoperative cardiac surgery patients. Crit Care Med 2009; 37: 912-918.
8. Jansen JR, Schreuder JJ, Bogaard JM, van Rooyen W, Versprille A. Thermodilution technique for
measurement of cardiac output during artificial ventilation. J Appl Physiol 1981; 51: 584-591.
9. Jansen JR, Schreuder JJ, Settels JJ, Kloek JJ, Versprille A. An adequate strategy for the thermodilution
technique in patients during mechanical ventilation. Intensive Care Med 1990; 16: 422-425.
10. Den Hartog EA, Versprille A, Jansen JR. Systemic filling pressure in intact circulation determined on basis
of aortic vs. central venous pressure relationships. Am J Physiol 1994; 267: H2255-H2258.
11. Hiesmayr M, Jansen JR, Versprille A. Effects of endotoxin infusion on mean systemic filling pressure and
flow resistance to venous return. Pflugers Arch 1996; 431: 741-747.
12. Guyton AC. Determination of cardiac output by equating venous return curves with cardiac response curves.
Physiol Rev 1955; 35: 123-129.
13. Guyton AC, Lindsey AW, Abernaty B, Richardson T. Venous return at various right atrial pressures and the
normal venous return curve. Am J Physiol 1957; 189: 609-615.
14. Pinsky MR. Instantaneous venous return curves in an intact canine preparation. J Appl Physiol 1984; 56:
765-771.
15. Greene AS, Shoukas AA. Changes in canine cardiac function and venous return curves by the carotid
baroreflex. Am J Physiol 1986; 251: H288-H296.
16. Lee RW, Lancaster LD, Gay RG, Paquin M, Goldman S. Use of acetylcholine to measure total vascular
pressure-volume relationship in dogs. Am J Physiol 1988; 254: H115-H119.
17. Fessler HE, Brower RG, Wise RA, Permutt S. Effects of positive end-expiratory pressure on the canine
venous return curve. Am Rev Respir Dis 1992; 146: 4-10.
18. Samar RE, Coleman TG. Mean circulatory pressure and vascular compliances in the spontaneously
hypertensive rat. Am J Physiol 1979; 237: H584-H589.
19. Yamamoto J, Trippodo NC, Ishise S, Frohlich ED. Total vascular pressure-volume relationship in the
conscious rat. Am J Physiol 1980; 238: H823-H828.
20. Honda T, Fuqua JM, Edmonds CH, Hibbs CW, Akutsu T. Applications of total artificial heart for studies of
circulatory physiology; measurement of resistance to venous return in postoperative awake calves.
Preliminary report. Ann Biomed Eng 1976; 4: 271-279.
21. Prather JW, Taylor AE, Guyton AC. Effect of blood volume, mean circulatory pressure, and stress relaxation
on cardiac output. Am J Physiol 1969; 216: 467-472.
22. Schlichtig R, Klions HA, Kramer DJ, Nemoto EM. Hepatic dysoxia commences during O2 supply
dependence. J Appl Physiol 1992; 72: 1499-1505.

(131

132)

(133
Chapter 8
Assessment of venous return curve and mean systemic filling pressure in postoperative cardiac surgery patients
Jacinta Maas, Bart Geerts, Paul van den Berg, Micheal Pinsky and Jos Jansen
Critical Care Medicine 2009; 37(3): 912-8
134)
The cardiovascular system is a closed circuit with varying blood flow out of the heart into the
arterial system (cardiac output) and flow back to the heart from the venous system (venous
return) that may not be equal at any point in time owing to ventilation-induced changes in
venous return, but which over time must be equal [1,2]. Thus, under steady state apnoeic
conditions cardiac output (CO) and venous return (VR) equal. Guyton et al. [3,4] showed that
the relationship between stepwise changes in right atrial pressure (Pra) and the resulting
changes in venous return describes a venous return curve, which itself is a function of the
circulating blood volume, vasomotor tone and blood flow distribution. Importantly, right
atrial pressure at the extrapolated zero flow pressure-intercept reflects mean systemic filling
pressure (Pmsf) and the slope of this relation describes the resistance for venous return
(Rvr) [3,5]. This relationship between right atrial pressure and VR was well described in
animal models with an artificial circulation [4], in patients during stop flow conditions [6] and
in animals with an intact circulation using invasive hemodynamic monitoring [7-10]. However,
it has never been evaluated in humans with an intact circulation. If such venous return
curves could be easily calculated at the bedside, then complex cardiovascular analysis would
be feasible thereby augmenting greatly our understanding of the dynamic determinants of
circulatory insufficiency states and their responses to therapies. Intravascular blood volume
can be divided in unstressed volume (the blood volume necessary to fill the blood vessels
without generating an intravascular pressure), and stressed volume (the blood volume which
generates the intravascular pressure, which is mean systemic filling pressure in no flow
conditions).
Previously, Pinsky [7] constructed instantaneous venous return curves based on the beat to
beat changes in Pra and simultaneously measured right ventricular output during a single
mechanical breath, neglecting possible transient effects of increasing Pra on venous return [1,2]. Versprille and Jansen [8] prevented these transient changes by measuring Pra and right
ventricular output during steady state conditions generated by ventilator applied inspiratory
pause periods at different inflation volumes. Unfortunately, it is difficult to measure
pulmonary blood flow on a beat to beat basis at the bedside. We hypothesized that if
inspiratory hold manoeuvres that increase right atrial pressure create a new steady state then
venous return and cardiac output would again be equal and direct measures of left-sided
cardiac output could be used to estimate steady state venous return.
Thus, we studied the effect of 12-second inspiratory hold manoeuvres on the relation
between central venous pressure (Pcv), as a surrogate for right atrial pressure, and arterial
pulse contour-derived cardiac output (COmf), as a surrogate for venous return, as Pcv was
varied by inspiratory hold manoeuvres and intravascular volume status altered by a head-up
tilt body position (relative hypovolemia) and intravascular volume loading (hypervolaemia).
(135
Methods
Patients
Twelve post-operative patients after elective coronary artery bypass surgery or aortic valve
replacement were included into the study after approval by the university medical ethics
committee and patient’s informed consent was obtained. All patients had symptomatic
coronary artery disease without previous myocardial infarction and were on beta adrenergic
blocking medication. Patients with congestive heart failure (NYHA class 4), aortic aneurysm,
extensive peripheral arterial occlusive disease, or postoperative valvular insufficiency, were
not considered for this study. Patients with postoperative arrhythmia or the necessity for
artificial pacing or use of a cardiac assist device were also excluded.
Anaesthesia during surgery was maintained with sufentanil and propofol and patients were
ventilated in synchronized intermittent mandatory surgery was maintained with propofol
and ventilation (SIMV) mode (Evita4 servo ventilator Draeger, Lubeck, Germany) adjusted to
achieve normocapnia (arterial PCO2 between 40 and 45 mmHg) with tidal volumes of 6-8
ml∙kg-1 and a respiratory rate of 12-14 breaths∙min-1. Fraction of inspired oxygen (FiO2) was
0.4 and a positive end-expiratory pressure (PEEP) of 5 cmH2O was applied. A hemodynamic
stability was achieved using fluids and catecholamines. During the study interval all subjects
were haemodynamically stable and no changes were made in their vasoactive drug therapy.
Every patient experienced full recovery from anaesthesia within 8 hours following surgery
and was discharged from intensive care unit on the first post-operative day.
Measurements
Arterial blood pressure (Pa) was monitored via a 20 Gauge, 3.8 cm long radial arterial
catheter inserted by Seldinger technique and connected to a pressure transducer (PX600F,
Edwards Lifesciences). Pcv was measured with a central venous catheter inserted through
the right internal jugular vein (MultiCath 3 venous catheter, Vigon GmbH & Co, Aachen,
Germany) and connected to a pressure transducer (PX600F, Edwards Lifesciences). Both Pa
and Pcv transducers were referenced to the intersection of the anterior axillary line and the
5th intercostal space. Airway pressure (Pvent) was measured at the entrance of the
endotracheal tube. Pvent was balanced at zero level against ambient air. Standard ECG leads
were used to monitor heart rate (HR). Beat to beat cardiac output was obtained by modelflow
(COmf) pulse contour analysis as previously described by us [11-13]. We calibrated the pulse
contour cardiac output measurements with 3 thermodilution cardiac output measurements
equally spread over the ventilatory cycle [12].
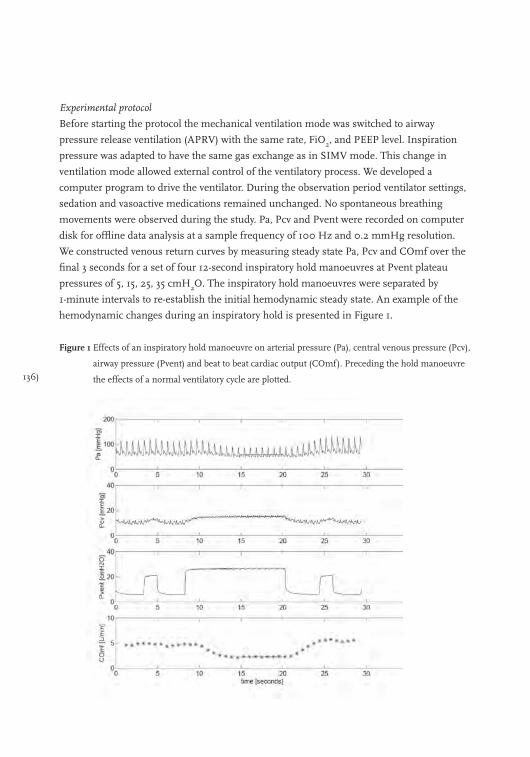
136)
Experimental protocol
Before starting the protocol the mechanical ventilation mode was switched to airway
pressure release ventilation (APRV) with the same rate, FiO2, and PEEP level. Inspiration
pressure was adapted to have the same gas exchange as in SIMV mode. This change in
ventilation mode allowed external control of the ventilatory process. We developed a
computer program to drive the ventilator. During the observation period ventilator settings,
sedation and vasoactive medications remained unchanged. No spontaneous breathing
movements were observed during the study. Pa, Pcv and Pvent were recorded on computer
disk for offline data analysis at a sample frequency of 100 Hz and 0.2 mmHg resolution.
We constructed venous return curves by measuring steady state Pa, Pcv and COmf over the
final 3 seconds for a set of four 12-second inspiratory hold manoeuvres at Pvent plateau
pressures of 5, 15, 25, 35 cmH2O. The inspiratory hold manoeuvres were separated by
1-minute intervals to re-establish the initial hemodynamic steady state. An example of the
hemodynamic changes during an inspiratory hold is presented in Figure 1.
Figure 1 Effects of an inspiratory hold manoeuvre on arterial pressure (Pa), central venous pressure (Pcv),
airway pressure (Pvent) and beat to beat cardiac output (COmf). Preceding the hold manoeuvre
the effects of a normal ventilatory cycle are plotted.
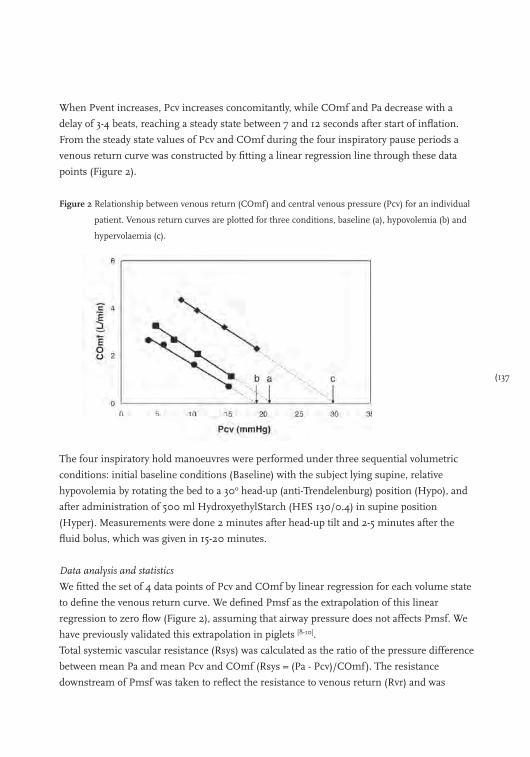
(137
When Pvent increases, Pcv increases concomitantly, while COmf and Pa decrease with a
delay of 3-4 beats, reaching a steady state between 7 and 12 seconds after start of inflation.
From the steady state values of Pcv and COmf during the four inspiratory pause periods a
venous return curve was constructed by fitting a linear regression line through these data
points (Figure 2).
Figure 2 Relationship between venous return (COmf) and central venous pressure (Pcv) for an individual
patient. Venous return curves are plotted for three conditions, baseline (a), hypovolemia (b) and
hypervolaemia (c).
The four inspiratory hold manoeuvres were performed under three sequential volumetric
conditions: initial baseline conditions (Baseline) with the subject lying supine, relative
hypovolemia by rotating the bed to a 30o head-up (anti-Trendelenburg) position (Hypo), and
after administration of 500 ml HydroxyethylStarch (HES 130/0.4) in supine position
(Hyper). Measurements were done 2 minutes after head-up tilt and 2-5 minutes after the
fluid bolus, which was given in 15-20 minutes.
Data analysis and statistics
We fitted the set of 4 data points of Pcv and COmf by linear regression for each volume state
to define the venous return curve. We defined Pmsf as the extrapolation of this linear
regression to zero flow (Figure 2), assuming that airway pressure does not affects Pmsf. We
have previously validated this extrapolation in piglets [8-10].
Total systemic vascular resistance (Rsys) was calculated as the ratio of the pressure difference
between mean Pa and mean Pcv and COmf (Rsys = (Pa - Pcv)/COmf). The resistance
downstream of Pmsf was taken to reflect the resistance to venous return (Rvr) and was
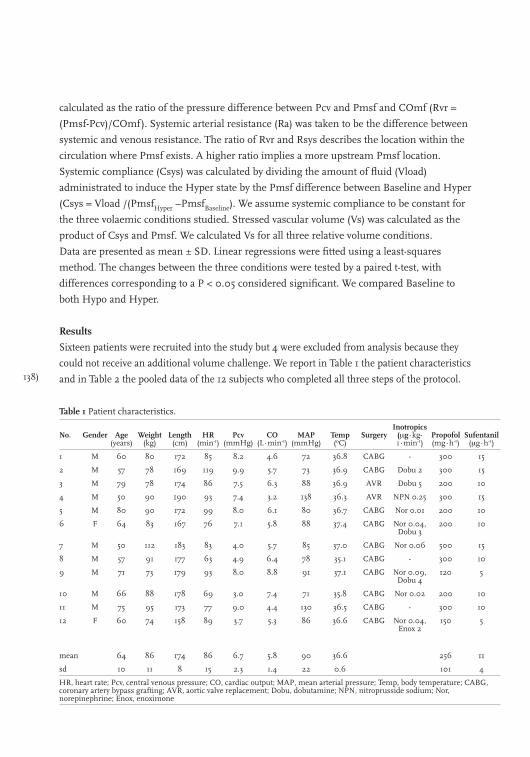
138)
calculated as the ratio of the pressure difference between Pcv and Pmsf and COmf (Rvr =
(Pmsf-Pcv)/COmf). Systemic arterial resistance (Ra) was taken to be the difference between
systemic and venous resistance. The ratio of Rvr and Rsys describes the location within the
circulation where Pmsf exists. A higher ratio implies a more upstream Pmsf location.
Systemic compliance (Csys) was calculated by dividing the amount of fluid (Vload)
administrated to induce the Hyper state by the Pmsf difference between Baseline and Hyper
(Csys = Vload /(PmsfHyper –PmsfBaseline). We assume systemic compliance to be constant for
the three volaemic conditions studied. Stressed vascular volume (Vs) was calculated as the
product of Csys and Pmsf. We calculated Vs for all three relative volume conditions.
Data are presented as mean ± SD. Linear regressions were fitted using a least-squares
method. The changes between the three conditions were tested by a paired t-test, with
differences corresponding to a P < 0.05 considered significant. We compared Baseline to
both Hypo and Hyper.
Results
Sixteen patients were recruited into the study but 4 were excluded from analysis because they
could not receive an additional volume challenge. We report in Table 1 the patient characteristics
and in Table 2 the pooled data of the 12 subjects who completed all three steps of the protocol.
Table 1 Patient characteristics.
No. Gender Age(years)
Weight (kg)
Length (cm)
HR (min-1)
Pcv (mmHg)
CO (L∙min-1)
MAP (mmHg)
Temp(oC)
SurgeryInotropics
(μg∙kg-1∙min-1)
Propofol (mg∙h-1)
Sufentanil (μg∙h-1)
1 M 60 80 172 85 8.2 4.6 72 36.8 CABG - 300 15
2 M 57 78 169 119 9.9 5.7 73 36.9 CABG Dobu 2 300 15
3 M 79 78 174 86 7.5 6.3 88 36.9 AVR Dobu 5 200 10
4 M 50 90 190 93 7.4 3.2 138 36.3 AVR NPN 0.25 300 15
5 M 80 90 172 99 8.0 6.1 80 36.7 CABG Nor 0.01 200 10
6 F 64 83 167 76 7.1 5.8 88 37.4 CABG Nor 0.04, Dobu 3
200 10
7 M 50 112 183 83 4.0 5.7 85 37.0 CABG Nor 0.06 500 15
8 M 57 91 177 63 4.9 6.4 78 35.1 CABG - 300 10
9 M 71 73 179 93 8.0 8.8 91 37.1 CABG Nor 0.09, Dobu 4
120 5
10 M 66 88 178 69 3.0 7.4 71 35.8 CABG Nor 0.02 200 10
11 M 75 95 173 77 9.0 4.4 130 36.5 CABG - 300 10
12 F 60 74 158 89 3.7 5.3 86 36.6 CABG Nor 0.04, Enox 2
150 5
mean 64 86 174 86 6.7 5.8 90 36.6 256 11
sd 10 11 8 15 2.3 1.4 22 0.6 101 4
HR, heart rate; Pcv, central venous pressure; CO, cardiac output; MAP, mean arterial pressure; Temp, body temperature; CABG, coronary artery bypass grafting; AVR, aortic valve replacement; Dobu, dobutamine; NPN, nitroprusside sodium; Nor, norepinephrine; Enox, enoximone
(139
Venous return curve analysis
Pcv and COmf decreased during Hypo and increased during Hyper. Similarly, Pmsf
decreased during Hypo and increased during Hyper, whereas the slope of the venous return
(conductance) was not significantly different for the three conditions of Baseline, Hypo and
Hyper. The pressure gradient for venous return did not change with Hypo but increased
with Hyper such that Rvr was unchanged by Hypo but increased with Hyper. Importantly,
Rsys, did not change. Thus, the estimated location of Pmsf was unchanged by Hypo but
migrated upstream with Hyper.
Table 2 Hemodynamic data of patients during baseline, hypo- and hypervolaemic condition.
Baseline mean SD
Hypo mean SD p1
Hyper mean SD p2
Pa (mmHg) 89.9 21.6 75.7 17.3 0.001 96.5 14.9 0.17
Pcv (mmHg) 6.72 2.26 4.02 2.12 0.001 9.67 2.63 0.007
COmf (L∙min-1) 5.82 1.44 4.76 1.3 0.001 6.83 1.36 0.002
HR (min-1) 86 14.7 85.7 15.1 0.456 84.3 10.7 0.401
Slope (L∙min-1∙mmHg-1) -0.465 0.151 -0.429 0.16 0.388 -0.389 0.135 0.134
Pmsf (mmHg) 18.76 4.53 14.54 2.99 0.005 29.07 5.23 0.001
Pvr (mmHg) 12.04 3.70 10.52 2.27 0.106 19.40 6.88 0.003
Rvr (mmHg∙min∙L-1) 2.18 0.86 2.41 1.14 0.184 2.91 1.10 0.037
Rsys (mmHg∙min∙L-1) 15.89 9.00 16.95 10.27 0.379 13.52 5.60 0.122
Rvr/ Rsys (%) 14.94 5.00 14.84 2.37 0.931 22.62 8.07 0.006
Values are means ± SD; n=12 patients. Pa, arterial pressure; Pcv, central venous pressure; COmf, cardiac output; HR, heart rate; Slope, slope of venous return curve; Pmsf, mean systemic filling pressure; Pvr, pressure difference between Pmsf and Pcv; Rvr, resistance for venous return; Rsys, resistance of the systemic circulation. Statistical comparison, p1, paired t-test between baseline and hypovolaemic condition (hypo) and p2, paired t-test between baseline and hypervolaemic condition (hyper)
Systemic compliance and stressed volume
The change in stressed volume versus Pmsf is shown in Figure 3. Assuming a constant
compliance the loss of stressed volume due to Hypo is approximately 200 ml. On average
systemic compliance was 80 ± 62 ml∙mmHg-1 (0.98 ± 0.82 ml∙mmHg-1∙kg-1 body weight)
and stressed volume during Baseline was 1677 ± 1643 ml (12.5 ± 12.1 ml∙kg-1 body weight).
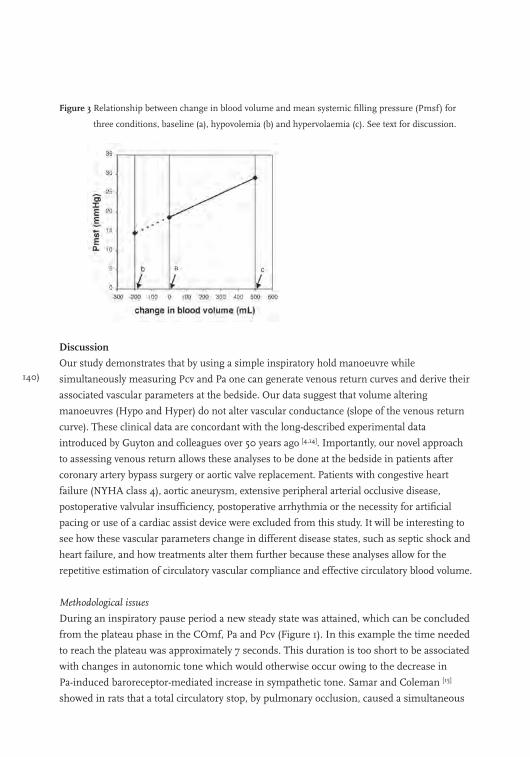
140)
Figure 3 Relationship between change in blood volume and mean systemic filling pressure (Pmsf) for
three conditions, baseline (a), hypovolemia (b) and hypervolaemia (c). See text for discussion.
Discussion
Our study demonstrates that by using a simple inspiratory hold manoeuvre while
simultaneously measuring Pcv and Pa one can generate venous return curves and derive their
associated vascular parameters at the bedside. Our data suggest that volume altering
manoeuvres (Hypo and Hyper) do not alter vascular conductance (slope of the venous return
curve). These clinical data are concordant with the long-described experimental data
introduced by Guyton and colleagues over 50 years ago [4,14]. Importantly, our novel approach
to assessing venous return allows these analyses to be done at the bedside in patients after
coronary artery bypass surgery or aortic valve replacement. Patients with congestive heart
failure (NYHA class 4), aortic aneurysm, extensive peripheral arterial occlusive disease,
postoperative valvular insufficiency, postoperative arrhythmia or the necessity for artificial
pacing or use of a cardiac assist device were excluded from this study. It will be interesting to
see how these vascular parameters change in different disease states, such as septic shock and
heart failure, and how treatments alter them further because these analyses allow for the
repetitive estimation of circulatory vascular compliance and effective circulatory blood volume.
Methodological issues
During an inspiratory pause period a new steady state was attained, which can be concluded
from the plateau phase in the COmf, Pa and Pcv (Figure 1). In this example the time needed
to reach the plateau was approximately 7 seconds. This duration is too short to be associated
with changes in autonomic tone which would otherwise occur owing to the decrease in
Pa-induced baroreceptor-mediated increase in sympathetic tone. Samar and Coleman [15]
showed in rats that a total circulatory stop, by pulmonary occlusion, caused a simultaneous
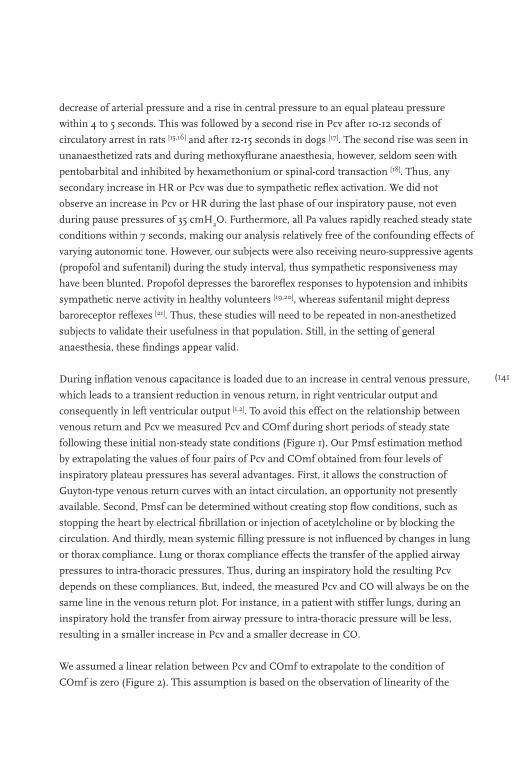
(141
decrease of arterial pressure and a rise in central pressure to an equal plateau pressure
within 4 to 5 seconds. This was followed by a second rise in Pcv after 10-12 seconds of
circulatory arrest in rats [15,16] and after 12-15 seconds in dogs [17]. The second rise was seen in
unanaesthetized rats and during methoxyflurane anaesthesia, however, seldom seen with
pentobarbital and inhibited by hexamethonium or spinal-cord transaction [18]. Thus, any
secondary increase in HR or Pcv was due to sympathetic reflex activation. We did not
observe an increase in Pcv or HR during the last phase of our inspiratory pause, not even
during pause pressures of 35 cmH2O. Furthermore, all Pa values rapidly reached steady state
conditions within 7 seconds, making our analysis relatively free of the confounding effects of
varying autonomic tone. However, our subjects were also receiving neuro-suppressive agents
(propofol and sufentanil) during the study interval, thus sympathetic responsiveness may
have been blunted. Propofol depresses the baroreflex responses to hypotension and inhibits
sympathetic nerve activity in healthy volunteers [19,20], whereas sufentanil might depress
baroreceptor reflexes [21]. Thus, these studies will need to be repeated in non-anesthetized
subjects to validate their usefulness in that population. Still, in the setting of general
anaesthesia, these findings appear valid.
During inflation venous capacitance is loaded due to an increase in central venous pressure,
which leads to a transient reduction in venous return, in right ventricular output and
consequently in left ventricular output [1,2]. To avoid this effect on the relationship between
venous return and Pcv we measured Pcv and COmf during short periods of steady state
following these initial non-steady state conditions (Figure 1). Our Pmsf estimation method
by extrapolating the values of four pairs of Pcv and COmf obtained from four levels of
inspiratory plateau pressures has several advantages. First, it allows the construction of
Guyton-type venous return curves with an intact circulation, an opportunity not presently
available. Second, Pmsf can be determined without creating stop flow conditions, such as
stopping the heart by electrical fibrillation or injection of acetylcholine or by blocking the
circulation. And thirdly, mean systemic filling pressure is not influenced by changes in lung
or thorax compliance. Lung or thorax compliance effects the transfer of the applied airway
pressures to intra-thoracic pressures. Thus, during an inspiratory hold the resulting Pcv
depends on these compliances. But, indeed, the measured Pcv and CO will always be on the
same line in the venous return plot. For instance, in a patient with stiffer lungs, during an
inspiratory hold the transfer from airway pressure to intra-thoracic pressure will be less,
resulting in a smaller increase in Pcv and a smaller decrease in CO.
We assumed a linear relation between Pcv and COmf to extrapolate to the condition of
COmf is zero (Figure 2). This assumption is based on the observation of linearity of the
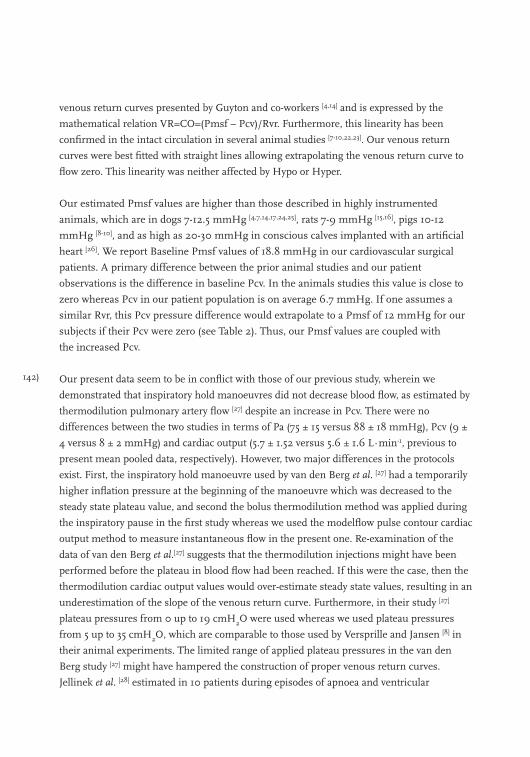
142)
venous return curves presented by Guyton and co-workers [4,14] and is expressed by the
mathematical relation VR=CO=(Pmsf – Pcv)/Rvr. Furthermore, this linearity has been
confirmed in the intact circulation in several animal studies [7-10,22,23]. Our venous return
curves were best fitted with straight lines allowing extrapolating the venous return curve to
flow zero. This linearity was neither affected by Hypo or Hyper.
Our estimated Pmsf values are higher than those described in highly instrumented
animals, which are in dogs 7-12.5 mmHg [4,7,14,17,24,25], rats 7-9 mmHg [15,16], pigs 10-12
mmHg [8-10], and as high as 20-30 mmHg in conscious calves implanted with an artificial
heart [26]. We report Baseline Pmsf values of 18.8 mmHg in our cardiovascular surgical
patients. A primary difference between the prior animal studies and our patient
observations is the difference in baseline Pcv. In the animals studies this value is close to
zero whereas Pcv in our patient population is on average 6.7 mmHg. If one assumes a
similar Rvr, this Pcv pressure difference would extrapolate to a Pmsf of 12 mmHg for our
subjects if their Pcv were zero (see Table 2). Thus, our Pmsf values are coupled with
the increased Pcv.
Our present data seem to be in conflict with those of our previous study, wherein we
demonstrated that inspiratory hold manoeuvres did not decrease blood flow, as estimated by
thermodilution pulmonary artery flow [27] despite an increase in Pcv. There were no
differences between the two studies in terms of Pa (75 ± 15 versus 88 ± 18 mmHg), Pcv (9 ±
4 versus 8 ± 2 mmHg) and cardiac output (5.7 ± 1.52 versus 5.6 ± 1.6 L∙min-1, previous to
present mean pooled data, respectively). However, two major differences in the protocols
exist. First, the inspiratory hold manoeuvre used by van den Berg et al. [27] had a temporarily
higher inflation pressure at the beginning of the manoeuvre which was decreased to the
steady state plateau value, and second the bolus thermodilution method was applied during
the inspiratory pause in the first study whereas we used the modelflow pulse contour cardiac
output method to measure instantaneous flow in the present one. Re-examination of the
data of van den Berg et al.[27] suggests that the thermodilution injections might have been
performed before the plateau in blood flow had been reached. If this were the case, then the
thermodilution cardiac output values would over-estimate steady state values, resulting in an
underestimation of the slope of the venous return curve. Furthermore, in their study [27]
plateau pressures from 0 up to 19 cmH2O were used whereas we used plateau pressures
from 5 up to 35 cmH2O, which are comparable to those used by Versprille and Jansen [8] in
their animal experiments. The limited range of applied plateau pressures in the van den
Berg study [27] might have hampered the construction of proper venous return curves.
Jellinek et al. [28] estimated in 10 patients during episodes of apnoea and ventricular
(143
fibrillation, induced for defibrillator testing, and found a mean Pmsf value of 10.2 mmHg
and Schipke et al. [6] estimated a mean Pmsf value of 12 mmHg in a similar group of 85
patients. However, both studies were done on highly anesthetized non-volume resuscitated
subjects. Our method of estimation of Pmsf differs considerably from stopping flow by
defibrillation of the heart and our method allows an estimation of Pmsf with intact
circulation, applicable in the intensive care unit. Still, until paired comparisons of Pmsf are
made using the two techniques (i.e. stop flow and our method) in the same subjects direct
comparisons and interpretation of the data can not be made.
Using these manoeuvres to assess cardiovascular status
Moving patients from supine into a head up tilt position shifts blood from the central
compartment to the legs, creating a relative hypovolaemic state as manifest by a decreasing
Pmsf, Pcv and cardiac output. Potentially, other conflicting processes could also be occurring
simultaneously. As the blood volume shifted to the legs increase femoral venous pressure,
venous vascular diameter will increase decreasing vascular resistance from the legs. The
impact of the intra-abdominal volume shift off the diaphragm is less clear but may increase
hepatic resistance if chest wall movement compresses the sub-diaphragmatic liver. The results
of these effects lead to no change in Rvr and a decrease in COmf, Pa, Pcv and Pmsf (Table 2).
Volume loading creates relative hypervolaemia which results in an increase of Pmsf, Pcv, CO
and Pa. The higher CO can only be generated by a higher filling of the right atrium reflected
in an increase of Pcv. Because the pressure gradient for venous return is increased more
than Rvr, CO increases (Table 2).
Pmsf is the pressure at the mid-point of the vascular pressure drop from the aorta to the
right atrium. In practice, it is usually locate in the venules and is less than arteriolar pressure
and more than Pcv but close to capillary-venule tissue pressure [8,18]. The localization of Pmsf
within the circulation is a conceptual model at best, since it reflects a lumped parameter of
all the vascular beds. However, its position in the pooled vascular beds will shift depending
on changes in arterial and venous resistances as was pointed out by Versprille and Jansen [8].
Our data suggests that the vascular site for Pmsf exists in the range of the capillary-venule
pressures, i.e. Rvr/Rsys= 15% (Table 2). And, indeed, this site shifted upstream (Rvr/
Rsys=23%) with Hyper, whereas Hypo had no effect on the site of Pmsf
(Rvr/Rsys=15%). These data suggest that in the immediate post-operative period increased
sympathetic tone keeps Pmsf in the venular side but with volume loading and a presumed
reduction of vasomotor tone, this point shifts retrograde toward the arterial system. It will be
interesting to see how this location changes with the use of vasoactive drug therapy and in
patients with either sepsis or heart failure. We also saw that Rvr increased during

144)
hypervolaemic conditions whereas conductance (conductance = 1 / Rvr) was constant. We
are not sure why this would be the case, because anatomically and physiologically speaking,
the same factors affect both resistance and conductance. Potentially, our technique
systematically overestimated Pmsf, and thus pressure gradient for venous return under
hypervolaemic conditions due to squeezing of blood volume out of the lung; or the
associated increase in Pcv decreased the flow through the more dependent venous conduits.
Our study design does not allow us to speculate further on these Rvr changes.
Whole body vascular compliance is calculated as the ratio of the change of volume to the
change in estimated Pmsf (∆V/∆P). Using our inspiratory hold technique we found a
vascular compliance, Csys, of 0.98 ml∙mmHg-1∙kg-1 body weight. Because the
administration of 500 ml of colloid can expand plasma volume with more than 500 ml,
because of fluid recruitment of the extravascular space and because of fluid loss (urine and
blood loss), the amount of 500 ml is an approximation of the actual volume expansion.
Previous studies in instrumented anesthetized animals have reported a linear relation
between Pmsf and blood volume over a Pmsf of 5 to 20 mmHg [18]. Thus, vascular
compliance over this Pmsf range may be considered constant. From this constant total
systemic vascular compliance and the change in Pmsf from Baseline to Hypo we calculated
an effective volume loss to be about 200 ml. This loss is due to a shift of blood from stressed
to unstressed blood volume.
The stressed volume can be estimated from the compliance and Pmsf. In normovolemic
patients in supine position we estimated an averaged stressed volume of 1677 ml or
19.5 ml∙kg-1. To our surprise this calculated stressed volume is close to the stressed volume
of 20.2 ml∙kg-1 reported by Magder and De Varennes [29] in patients undergoing hypothermic
circulatory arrest for surgery on major vessels. They measured stressed volume as the
volume that drained from the patient into the reservoir of the pump when the pump was
turned off.
Previously reported values for Csys ranged from 1.4 to 2.6 ml∙mmHg-1∙kg-1 in dogs [17,30-33]
and from 1.5 to 2.4 ml∙mmHg-1∙kg-1 in rats [15,16,34]. The lower compliance (0.98 ml∙mmHg-
1∙kg-1) observed in our patients may reflect species differences or differences in methodology
used. The main difference in methodology is related to the time between volume loading
and the determination of Pmsf. In animal studies the Pmsf measurement is performed
30 seconds after volume loading, whereas we finished our measurements after more than
20 minutes following volume loading. According to Rothe [18] it is virtually impossible to
measure the vascular capacitance characteristics, and thus passive V/P curves and stressed

(145
volume of the total body in reflex-intact animals and humans. This limitation is because one
cannot change blood volume and measure Pmsf in less than 7-10 seconds, which is the
maximal delay before reflex venoconstriction normally becomes evident, unless these
reflexes are blocked. In our patients the use of propofol and sufentanil might have blocked
these reflexes [19-21] and might be the explanation for the corresponding stressed volume
results of our study and the study of Magder and De Varennes [29].
Conclusions
Mean systemic filling pressure can be determined in intensive care patients with an intact
circulation with use of inspiratory pause procedures, making estimations of circulatory
compliance and serial measures of circulatory stressed volume feasible.

146)
References
1. Versprille A, Jansen JR. Tidal variation of pulmonary blood flow and blood volume in piglets during
mechanical ventilation during hyper-, normo- and hypovolaemia. Pflugers Arch 1993; 424: 255-265.
2. Brengelmann GL. A critical analysis of the view that right atrial pressure determines venous return. J Appl
Physiol 2003; 94: 849-859.
3. Guyton AC, Jones C, Coleman T. Cardiac output and its regulation. Circulatory Physiology. Philadelphia:
W.B. Saunders Company, 1973.
4. Guyton AC, Lindsey AW, Abernathy B, et al. Venous return at various right atrial pressures and the normal
venous return curve. Am J Physiol 1957; 189: 609-615.
5. Green JF. Pressure-flow and volume-flow relationships of the systemic circulation of the dog. Am J Physiol
1975; 229: 761-769.
6. Schipke JD, Heusch G, Sanii AP, et al. Static filling pressure in patients during induced ventricular
fibrillation. Am J Physiol Heart Circ Physiol 2003; 285: H2510-H2515.
7. Pinsky MR. Instantaneous venous return curves in an intact canine preparation. J Appl Physiol 1984; 56:
765-771.
8. Versprille A, Jansen JR. Mean systemic filling pressure as a characteristic pressure for venous return.
Pflugers Arch 1985; 405: 226-233.
9. Den Hartog EA, Versprille A, Jansen JR. Systemic filling pressure in intact circulation determined on basis
of aortic vs. central venous pressure relationships. Am J Physiol 1994; 267: H2255-H2258.
10. Hiesmayr M, Jansen JR, Versprille A. Effects of endotoxin infusion on mean systemic filling pressure and
flow resistance to venous return. Pflugers Arch 1996; 431: 741-747.
11. Wesseling KH, Jansen JR, Settels JJ, et al. Computation of aortic flow from pressure in humans using a
nonlinear, three-element model. J Appl Physiol 1993; 74: 2566-2573.
12. Jansen JR, Schreuder JJ, Mulier JP, et al. A comparison of cardiac output derived from the arterial pressure
wave against thermodilution in cardiac surgery patients. Br J Anaesth 2001; 87: 212-222.
13. de Wilde RB, Schreuder JJ, van den Berg PC, et al. An evaluation of cardiac output by five arterial pulse
contour techniques during cardiac surgery. Anaesthesia 2007; 62: 760-768.
14. Guyton AC. Determination of cardiac output by equating venous return curves with cardiac response curves.
Physiol Rev 1955; 35: 123-129.
15. Samar RE, Coleman TG. Mean circulatory pressure and vascular compliances in the spontaneously
hypertensive rat. Am J Physiol 1979; 237: H584-H589.
16. Yamamoto J, Trippodo NC, Ishise S, et al. Total vascular pressure-volume relationship in the conscious rat.
Am J Physiol 1980; 238: H823-H828.
17. Greene AS, Shoukas AA. Changes in canine cardiac function and venous return curves by the carotid
baroreflex. Am J Physiol 1986; 251: H288-H296.
18. Rothe CF. Mean circulatory filling pressure: its meaning and measurement. J Appl Physiol 1993; 74: 499-509.
19. Sato M, Tanaka M, Umehara S, et al. Baroreflex control of heart rate during and after propofol infusion in
humans. Br J Anaesth 2005; 94: 577-581.
20. Ebert TJ. Sympathetic and hemodynamic effects of moderate and deep sedation with propofol in humans.
Anesthesiology 2005; 103: 20-24.
21. Lennander O, Henriksson BA, Martner J, et al. Effects of fentanyl, nitrous oxide, or both, on baroreceptor
reflex regulation in the cat. Br J Anaesth 1996; 77: 399-403.
22. Fessler HE, Brower RG, Wise RA, et al. Effects of positive end-expiratory pressure on the gradient for venous
return. Am Rev Respir Dis 1991; 143: 19-24.

(147
23. Uemura K, Sugimachi M, Kawada T, et al. A novel framework of circulatory equilibrium. Am J Physiol Heart
Circ Physiol 2004; 286: H2376-H2385.
24. Lee RW, Lancaster LD, Gay RG, et al. Use of acetylcholine to measure total vascular pressure-volume
relationship in dogs. Am J Physiol 1988; 254: H115-H119.
25. Fessler HE, Brower RG, Wise RA, et al. Effects of positive end-expiratory pressure on the canine venous
return curve. Am Rev Respir Dis 1992; 146: 4-10.
26. Honda T, Fuqua JM, Edmonds CH, et al. Applications of total artificial heart for studies of circulatory
physiology; measurement of resistance to venous return in postoperative awake calves. Preliminary report.
Ann Biomed Eng 1976; 4: 271-279.
27. van den Berg PC, Jansen JR, Pinsky MR. Effect of positive pressure on venous return in volume-loaded
cardiac surgical patients. J Appl Physiol 2002; 92: 1223-1231.
28. Jellinek H, Krenn H, Oczenski W, et al. Influence of positive airway pressure on the pressure gradient for
venous return in humans. J Appl Physiol 2000; 88: 926-932.
29. Magder S, De Varennes B. Clinical death and the measurement of stressed vascular volume. Crit Care Med
1998; 26: 1061-1064.
30. Shoukas AA, Sagawa K. Control of total systemic vascular capacity by the carotid sinus baroreceptor reflex.
Circ Res 1973; 33: 22-33.
31. Caldini P, Permutt S, Waddell JA, et al. Effect of epinephrine on pressure, flow, and volume relationships in
the systemic circulation of dogs. Circ Res 1974; 34: 606-623.
32. Ogilvie RI, Zborowska-Sluis D. Effect of chronic rapid ventricular pacing on total vascular capacitance.
Circulation 1992; 85: 1524-1530.
33. Shigemi K, Brunner MJ, Shoukas AA. Alpha- and beta-adrenergic mechanisms in the control of vascular
capacitance by the carotid sinus baroreflex system. Am J Physiol 1994; 267: H201-H210.
34. Chien Y, Frohlich ED, MacPhee AA, et al. Quinaprilat increases total body vascular compliance in rats with
myocardial infarction. Chin Med J (Engl ) 1992; 105: 382-389.

148)

(149
Chapter 9
Is arm occlusion pressure a predictor of fluid responsiveness?
Bart Geerts, Jacinta Maas, Rob de Wilde, Leon Aarts and Jos Jansen
Provisionally accepted by European Journal of Anaesthesia
150)
Fluid therapy is an important tool in hemodynamic management of patients with
suboptimal tissue perfusion. Excessive fluid resuscitation, however, can result in general and
pulmonary oedema; increasing hospital stay and even mortality [1]. In ventilated patients with
regular heart rhythm, stroke volume variation (SVV) and pulse pressure variation (PPV)
perform well as predictors of a clinically significant increase in cardiac output (CO) after
fluid administration (i.e. fluid loading responsiveness or FLR) [2,3]. In vasoplegic patients
both indicators failed [4,5]. Furthermore, SVV and PPV have never been shown to perform as
a measure of volume status. Therefore the search for a measure of volume status and a
predictor of fluid loading responsiveness which can be used independent of respiratory
settings and heart rhythm continues [6].
A physiological measure of effective volume status is mean systemic filling pressure
(MSFP); the equilibrium pressure anywhere in the circulation under circulatory arrest. The
pressure gradient between static filling pressure and central venous pressure is the driving
force for venous return and thus for cardiac output. Consequently, increasing MSFP and
thereby the pressure gradient for venous return by fluid expansion should improve cardiac
output, assuming a constant resistance to venous return and adequate myocardial function.
In pharmacology research, upper arm occlusion pressure (Parm) has been used to determine
(the effects of drugs on) venous capacitance and arterial resistance [7]. We hypothesize that
Parm might function as an indicator of filling pressure and volume status. MSFP has never
been studied as a predictor of fluid responsiveness. We determined Parm by measuring
arterial pressure 30 seconds after stop-flow induced by inflating a cuff around the upper
arm. The aim of this study was to explore the value of Parm as a predictor of fluid loading
responsiveness. This approach is attractive, as it would provide the clinician with a simple,
readily available and robust measure that can be obtained at the bedside. This method would
be independent of sedation, arrhythmias and mechanical ventilation.
(151
Methods
Twenty-four patients undergoing elective-cardiac surgery were included after approval of the
institutional ethics committee (P06.149, chairmen Prof. Dr. F.C. Breedveld, approval date 5
december 2006) and personal informed consent was obtained. All patients had symptomatic
coronary artery or valvular disease with preserved ventricular function. Patients with aortic
aneurysm, extensive peripheral arterial occlusive disease, postoperative severe arrhythmia,
postoperative valvular insufficiency or the necessity for artificial pacing or use of a cardiac
assist device were excluded.
Prior to surgery, each patient received a pulmonary artery catheter (Intellicath; Edwards
Lifesciences; Irvine, CA, USA) to measure thermodilution COtd and CVP and a 20 G radial
artery catheter (Prad). Patient’s anaesthesia was continued with propofol (2.5 mg∙kg-1∙h-1) and
sufentanil (0.06-0.20 μg∙kg-1∙h-1). The lungs were mechanically ventilated (Evita 4, Draeger,
Lubeck, Germany) in a volume-control mode with standard settings (12 breaths∙min-1, tidal
volume 8-10 ml∙kg-1∙min-1, FiO2 0.4, PEEP 5 cmH2O). Airway pressure (Paw) was measured at
the proximal end of the endotracheal tube. During the observation period the patients
maintained the supine position. Use of sedative and vascular medication remained unchanged.
No fluids were administered during the observation period outside the study protocol.
An upper arm blood stop-flow was created with a rapid cuff inflator (Hokanson E20,
Bellevue, Washington) and matching upper arm cuff. Duration of stop-flow was 35 seconds
with a cuff pressure 50 mmHg above the patients’ systolic blood pressure. Arm occlusion
pressure (Parm) was calculated as the average arterial pressure during one second at 30
seconds after arm occlusion.
The arterial pressure Prad was analysed with the modelflow program (CO, FMS,
Amsterdam, the Netherlands) to provide beat-to-beat values of CO. We calibrated the pulse
contour cardiac output measurements with three thermodilution COtd measurements
equally spread over the ventilatory cycle [8]. From these beat-to-beat cardiac output values,
stroke volume variation (SVV) and pulse pressure variation (PPV) were determined. SVV
and PPV were calculated for 5 ventilatory cycles and their values averaged.
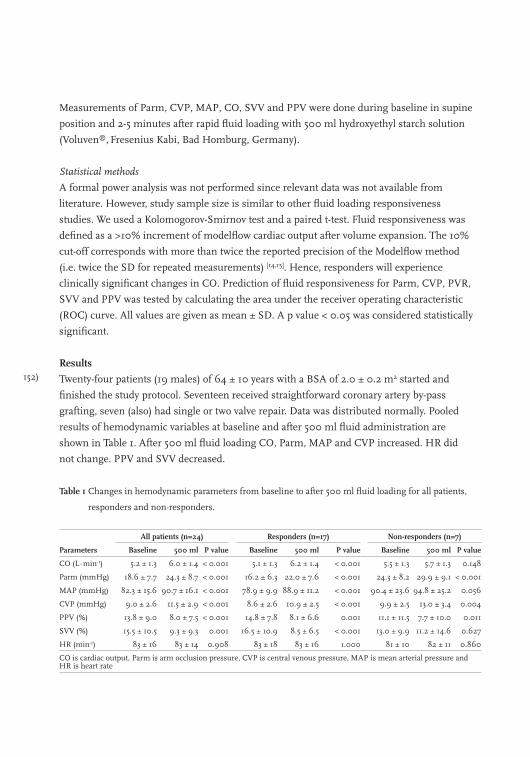
152)
Measurements of Parm, CVP, MAP, CO, SVV and PPV were done during baseline in supine
position and 2-5 minutes after rapid fluid loading with 500 ml hydroxyethyl starch solution
(Voluven®, Fresenius Kabi, Bad Homburg, Germany).
Statistical methods
A formal power analysis was not performed since relevant data was not available from
literature. However, study sample size is similar to other fluid loading responsiveness
studies. We used a Kolomogorov-Smirnov test and a paired t-test. Fluid responsiveness was
defined as a >10% increment of modelflow cardiac output after volume expansion. The 10%
cut-off corresponds with more than twice the reported precision of the Modelflow method
(i.e. twice the SD for repeated measurements) [14,15]. Hence, responders will experience
clinically significant changes in CO. Prediction of fluid responsiveness for Parm, CVP, PVR,
SVV and PPV was tested by calculating the area under the receiver operating characteristic
(ROC) curve. All values are given as mean ± SD. A p value < 0.05 was considered statistically
significant.
Results
Twenty-four patients (19 males) of 64 ± 10 years with a BSA of 2.0 ± 0.2 m2 started and
finished the study protocol. Seventeen received straightforward coronary artery by-pass
grafting, seven (also) had single or two valve repair. Data was distributed normally. Pooled
results of hemodynamic variables at baseline and after 500 ml fluid administration are
shown in Table 1. After 500 ml fluid loading CO, Parm, MAP and CVP increased. HR did
not change. PPV and SVV decreased.
Table 1 Changes in hemodynamic parameters from baseline to after 500 ml fluid loading for all patients,
responders and non-responders.
All patients (n=24) Responders (n=17) Non-responders (n=7)
Parameters Baseline 500 ml P value Baseline 500 ml P value Baseline 500 ml P value
CO (L∙min-1) 5.2 ± 1.3 6.0 ± 1.4 < 0.001 5.1 ± 1.3 6.2 ± 1.4 < 0.001 5.5 ± 1.3 5.7 ± 1.3 0.148
Parm (mmHg) 18.6 ± 7.7 24.3 ± 8.7 < 0.001 16.2 ± 6.3 22.0 ± 7.6 < 0.001 24.3 ± 8.2 29.9 ± 9.1 < 0.001
MAP (mmHg) 82.3 ± 15.6 90.7 ± 16.1 < 0.001 78.9 ± 9.9 88.9 ± 11.2 < 0.001 90.4 ± 23.6 94.8 ± 25.2 0.056
CVP (mmHg) 9.0 ± 2.6 11.5 ± 2.9 < 0.001 8.6 ± 2.6 10.9 ± 2.5 < 0.001 9.9 ± 2.5 13.0 ± 3.4 0.004
PPV (%) 13.8 ± 9.0 8.0 ± 7.5 < 0.001 14.8 ± 7.8 8.1 ± 6.6 0.001 11.1 ± 11.5 7.7 ± 10.0 0.011
SVV (%) 15.5 ± 10.5 9.3 ± 9.3 0.001 16.5 ± 10.9 8.5 ± 6.5 < 0.001 13.0 ± 9.9 11.2 ± 14.6 0.627
HR (min-1) 83 ± 16 83 ± 14 0.908 83 ± 18 83 ± 16 1.000 81 ± 10 82 ± 11 0.860
CO is cardiac output, Parm is arm occlusion pressure, CVP is central venous pressure, MAP is mean arterial pressure and HR is heart rate
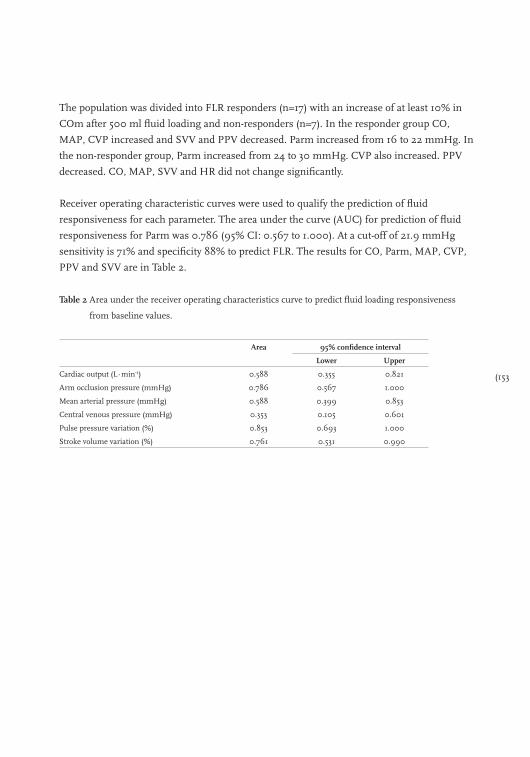
(153
The population was divided into FLR responders (n=17) with an increase of at least 10% in
COm after 500 ml fluid loading and non-responders (n=7). In the responder group CO,
MAP, CVP increased and SVV and PPV decreased. Parm increased from 16 to 22 mmHg. In
the non-responder group, Parm increased from 24 to 30 mmHg. CVP also increased. PPV
decreased. CO, MAP, SVV and HR did not change significantly.
Receiver operating characteristic curves were used to qualify the prediction of fluid
responsiveness for each parameter. The area under the curve (AUC) for prediction of fluid
responsiveness for Parm was 0.786 (95% CI: 0.567 to 1.000). At a cut-off of 21.9 mmHg
sensitivity is 71% and specificity 88% to predict FLR. The results for CO, Parm, MAP, CVP,
PPV and SVV are in Table 2.
Table 2 Area under the receiver operating characteristics curve to predict fluid loading responsiveness
from baseline values.
Area 95% confidence interval
Lower Upper
Cardiac output (L∙min-1) 0.588 0.355 0.821
Arm occlusion pressure (mmHg) 0.786 0.567 1.000
Mean arterial pressure (mmHg) 0.588 0.399 0.853
Central venous pressure (mmHg) 0.353 0.105 0.601
Pulse pressure variation (%) 0.853 0.693 1.000
Stroke volume variation (%) 0.761 0.531 0.990

154)
Discussion
Our study demonstrates that Parm was significantly lower in the responder group. Parm is a
good predictor of fluid responsiveness in our studied group. We used Parm for the first time
to study fluid loading responsiveness.
Both SVV and PPV have been reported to perform better as predictors of fluid
responsiveness than static pressures (CVP and pulmonary artery occlusion pressure) [3,9-12].
However, SVV or PPV are influenced by ventilator settings as tidal volume [9,13], respiratory
rate [14] and also to cardiac function. In patients with reduced cardiac function SVV is
expected to be smaller, because stroke volume is obviously limited and consequently
ventilator induced changes in stroke volume will be reduced [3,10] Reuter and co-workers
showed that SVV could still perform as a predictor of fluid loading responsiveness in
patients with reduced cardiac function, although SVV was indeed smaller in patients with
impaired cardiac function [13]. Furthermore, for the determination of SVV and PPV it is
essential that patients are fully dependent on mechanical ventilation, and a regular heart rate
is obligatory. In spontaneous breathing patients [4,5] and in mechanically ventilated patients
with tidal volumes smaller than 8 ml∙kg-1 SVV and PPV failed to predict FLR accurately [9] In
our study patients, all after cardiac surgery, were mechanically ventilated with an averaged
tidal volume of 9.1 ml∙kg-1 (7-12 ml∙kg-1) predicted body weight. Thus, for some of our
patients SVV and PPV may be less reliable. The Parm technique does not require specific
tidal volume or respiratory rate. To measure Parm with the arm occlusion method only a
peripheral arterial catheter is required. These requirements allow measurement in almost all
operating rooms and intensive care patients. Its application is not limited to sedated and
ventilated patients with a regular heart rhythm. In our study, Parm was a good predictor of
fluid loading responsiveness, at least equal to SVV or PPV. However, our study patients were
a relatively homogenous group.
Definition of fluid loading responsiveness
There is no consensus on the amount of fluid or use of parameter to assess fluid loading
responsiveness. Fluid amounts between 250-1000 ml are reported [3-5,15,16]. The outcome
measures used were CO [4,5,16] and SV [15] or SV index [3]. A positive response was defined as a
change in outcome parameter of more than 10%-25% [3,4,16]. We chose 10% change in pulse
contour CO as cut-off level after fluid loading with 500 ml. The 10% increase in CO was
chosen because this increase can be measured accurately with the modified Modelflow pulse
contour method [17-20]. This value corresponds with the boundaries used in other studies
where a 10% cut-off was used for 500 ml fluid loading responsiveness [4,21-23].
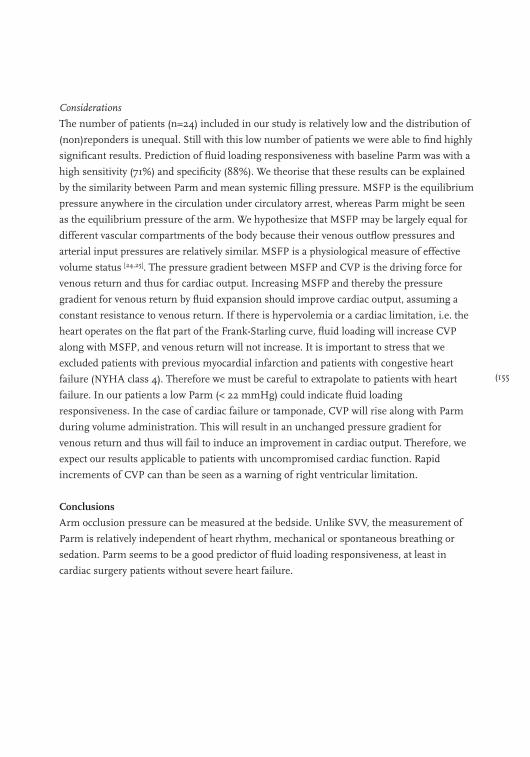
(155
Considerations
The number of patients (n=24) included in our study is relatively low and the distribution of
(non)reponders is unequal. Still with this low number of patients we were able to find highly
significant results. Prediction of fluid loading responsiveness with baseline Parm was with a
high sensitivity (71%) and specificity (88%). We theorise that these results can be explained
by the similarity between Parm and mean systemic filling pressure. MSFP is the equilibrium
pressure anywhere in the circulation under circulatory arrest, whereas Parm might be seen
as the equilibrium pressure of the arm. We hypothesize that MSFP may be largely equal for
different vascular compartments of the body because their venous outflow pressures and
arterial input pressures are relatively similar. MSFP is a physiological measure of effective
volume status [24,25]. The pressure gradient between MSFP and CVP is the driving force for
venous return and thus for cardiac output. Increasing MSFP and thereby the pressure
gradient for venous return by fluid expansion should improve cardiac output, assuming a
constant resistance to venous return. If there is hypervolemia or a cardiac limitation, i.e. the
heart operates on the flat part of the Frank-Starling curve, fluid loading will increase CVP
along with MSFP, and venous return will not increase. It is important to stress that we
excluded patients with previous myocardial infarction and patients with congestive heart
failure (NYHA class 4). Therefore we must be careful to extrapolate to patients with heart
failure. In our patients a low Parm (< 22 mmHg) could indicate fluid loading
responsiveness. In the case of cardiac failure or tamponade, CVP will rise along with Parm
during volume administration. This will result in an unchanged pressure gradient for
venous return and thus will fail to induce an improvement in cardiac output. Therefore, we
expect our results applicable to patients with uncompromised cardiac function. Rapid
increments of CVP can than be seen as a warning of right ventricular limitation.
Conclusions
Arm occlusion pressure can be measured at the bedside. Unlike SVV, the measurement of
Parm is relatively independent of heart rhythm, mechanical or spontaneous breathing or
sedation. Parm seems to be a good predictor of fluid loading responsiveness, at least in
cardiac surgery patients without severe heart failure.
156)
References
1. Chappell D, Jacob M, Hofmann-Kiefer K, et al. A rational approach to perioperative fluid management.
Anesthesiology 2008; 109: 723-40.
2. Michard F, Reuter DA. Assessing cardiac preload or fluid responsiveness? It depends on the question we
want to answer. Intensive Care Medicine 2003; 29: 1396.
3. Hofer CK, Muller SM, Furrer L, et al. Stroke volume and pulse pressure variation for prediction of fluid
responsiveness in patients undergoing off-pump coronary artery bypass grafting. Chest 2005; 128: 848-54.
4. Perner A, Faber T. Stroke volume variation does not predict fluid responsiveness in patients with septic
shock on pressure support ventilation. Acta Anaesthesiologica Scandinavica 2006; 50: 1068-73.
5. Heenen S, De Backer D, Vincent JL. How can the response to volume expansion in patients with
spontaneous respiratory movements be predicted? Critical Care 2006; 10: R102.
6. Magder S. Clinical usefulness of respiratory variations in arterial pressure. American Journal of Respiratory
Critical Care Medicine 2004; 169: 151-5.
7. Pang CC. Measurement of body venous tone. Journal of Pharmacology and Toxicology Methods 2000; 44:
341-60.
8. Jansen JR, Versprille A. Improvement of cardiac output estimation by the thermodilution method during
mechanical ventilation. Intensive Care Medicine 1986; 12: 71-9.
9. De Backer D, Heenen S, Piagnerelli M, et al. Pulse pressure variations to predict fluid responsiveness:
influence of tidal volume. Intensive Care Medicine 2005; 31: 517-23.
10. Huang CC, Fu JY, Hu HC, et al. Prediction of fluid responsiveness in acute respiratory distress syndrome
patients ventilated with low tidal volume and high positive end-expiratory pressure. Critical Care Medicine
2008; 36: 2810-6.
11. Michard F, Teboul JL. Using heart-lung interactions to assess fluid responsiveness during mechanical
ventilation. Critical Care 2000; 4: 282-9.
12. Michard F, Teboul JL. Predicting Fluid Responsiveness in ICU Patients* : A Critical Analysis of the
Evidence. Chest 2002; 121: 2000-8.
13. Reuter DA, Kirchner A, Felbinger TW, et al. Usefulness of left ventricular stroke volume variation to assess
fluid responsiveness in patients with reduced cardiac function. Critical Care Medicine 2003; 31: 1399-404.
14. De Backer D, Taccone FS, Holsten R, et al. Influence of respiratory rate on stroke volume variation in
mechanically ventilated patients. Anesthesiology 2009; 110: 1092-7.
15. Preisman S, Kogan S, Berkenstadt H, et al. Predicting fluid responsiveness in patients undergoing cardiac
surgery: functional haemodynamic parameters including the Respiratory Systolic Variation Test and static
preload indicators. British Journal of Anaesthesia 2005; 95: 746-55.
16. Osman D, Ridel C, Ray P, et al. Cardiac filling pressures are not appropriate to predict hemodynamic
response to volume challenge. Critical Care Medicine 2007; 35: 64-8.
17. Critchley LA, Critchley JA. A meta-analysis of studies using bias and precision statistics to compare cardiac
output measurement techniques. Journal of Clinical Monitoring and Computing 1999; 15: 85-91.
18. Jansen JR, Schreuder JJ, Mulier JP, et al. A comparison of cardiac output derived from the arterial pressure
wave against thermodilution in cardiac surgery patients. British Journal of Anaesthesia 2001; 87: 212-22.
19. de Wilde RB, Geerts BF, Cui J, et al. Performance of three minimally invasive cardiac output monitoring
systems. Anaesthesia 2009; 64: 762-9.
20. de Wilde RB, Schreuder JJ, van den Berg PC, et al. An evaluation of cardiac output by five arterial pulse
contour techniques during cardiac surgery. Anaesthesia 2007; 62: 760-8.

(157
21. Lee JH, Kim JT, Yoon SZ, et al. Evaluation of corrected flow time in oesophageal Doppler as a predictor of
fluid responsiveness. British Journal of Anaesthesia 2007; 99: 343-8.
22. Wagner JG, Leatherman JW. Right ventricular end-diastolic volume as a predictor of the hemodynamic
response to a fluid challenge. Chest 1998; 113: 1048-54.
23. Solus-Biguenet H, Fleyfel M, Tavernier B, et al. Non-invasive prediction of fluid responsiveness during major
hepatic surgery. British Journal of Anaesthesia 2006; 97: 808-16.
24. Guyton AC, Polizo D, Armstrong GG. Mean circulatory filling pressure measured immediately after
cessation of heart pumping. American Journal of Physiology 1954; 179: 261-7.
25. Maas JJ, Geerts BF, de Wilde RB, et al. Assessment of venous return curve and mean systemic filling
pressure in post-operative cardiac surgery patients. Critical Care Medicine 2009; 37: 912-18

158)
Section 4
Challenges and fluid loading responsiveness

(159
Chapter 10
Predicting cardiac output responses to passive leg raising by a PEEP-induced increase in central venous pressure, in cardiac surgery patients
Bart Geerts, Leon Aarts, Johan Groeneveld and Jos Jansen
Accepted for publication in British Journal of Anaesthesia
160)
Changes in central venous pressure (CVP) are probably more useful in guiding fluid
treatment of mechanically ventilated hypovolaemic patients than absolute pressure values
which are confounded by concomitant positive end-expiratory pressure (PEEP) [1-3].
Furthermore, assessment of a reliable predictor prior to fluid loading would allow the
physician to prevent harmful overloading. Ventilator-induced stroke volume variations (SVV)
are commonly used to predict fluid responsiveness, i.e. an increase in cardiac output by fluid
loading or passive leg raising (PLR). However, SVV is only applicable in mechanically-
ventilated patients without spontaneous breathing efforts and with a regular heart rhythm.
Furthermore, SVV depends on respiratory rates and tidal volumes [4-8]. Passive leg raising
can be used as a reversible, endogenous fluid challenge of about 250-300 ml and, if correctly
performed, the cardiac output response correlates well to that upon exogenous fluid
administration in predicting fluid responsiveness [4,9-20]. However, repeated PLR is not
practicable in all patients and all settings. Another manoeuvre to predict fluid
responsiveness is an end-expiratory hold which produces an increase in pulse pressure and
cardiac output. The magnitude of the change may be assessed by comparatively non-invasive
pulse contour methods [19]. However, it is likely that the change depends on inspiratory
pressure and thus on tidal volume and the resultant impediment in venous return. Taken
together, current dynamic methods to predict fluid responsiveness have limitations and may
not prevent harmful fluid overloading in mechanically ventilated, critically ill patients.
We hypothesized that the change in CVP produced by a change in PEEP of short duration can
be used to predict the response of cardiac output to fluid loading, since an increase in PEEP is
associated with an increase in CVP and a decrease in cardiac output, dependent on volume
status [1,21-23]. To test this hypothesis, we measured the changes in CVP due to an increase in
PEEP of 10 cmH2O and defined fluid responsiveness by the response in cardiac output to
subsequent PLR. We compared the predictive value of the change in CVP with those of
absolute CVP and SVV.
Methods
The study was approved by the Medical Ethics Committee of the Leiden University Medical
Centre and written informed consent was obtained prior to surgery. Twenty consecutive
patients undergoing elective cardiac surgery were enrolled into the study. During surgery,
before admission to the ICU, each patient underwent pulmonary artery catheter insertion
(Intellicath; Edwards Lifesciences; Irvine, CA, USA) to measure thermodilution cardiac output
(CO) and CVP. A radial artery catheter was used to measure radial arterial pressure in all
patients. In the ICU, anaesthesia was continued with propofol target control infusion (1.0
μg∙ml-1) and sufentanil according to institutional standards. The lungs were mechanically
(161
ventilated in a volume-control mode with standard settings to achieve normocapnia with a
tidal volume of 8-10 ml∙kg-1 and a respiratory frequency of 12-14 breaths∙min-1. The FiO2 was
0.4 and baseline PEEP 5 cmH2O. None of the patients suffered significant blood loss (> 50
ml∙h-1) during the data collection period.
Protocol and measurements
Blood pressure transducers were referenced to the level of the intersection of the anterior
axillary line and the 5th intercostal space. CVP, mean arterial pressure (MAP) and heart rate
(HR) were averaged over 30 second intervals. Bolus thermodilution CO was obtained, within 3
minutes with an automated system under computer control, by the mean of triplicate
measurements equally spread over the ventilatory cycle [24]. SVV was determined from
beat-to-beat CO values measured over 20 second intervals using the LiDCO (LiDCO Ltd,
Cambridge, UK) radial artery pulse contour system. The system was calibrated by entering the
mean value of the first series of 3 thermodilution measurements at the start of our protocol.
All measurements were carried out following stabilization and within two hours of arrival on
the ICU. During the observation period the patients remined supine and doses of sedative and
vasoactive agents were unaltered. Measurements of CVP, SVV, CO, MAP and HR were made
under five experimental conditions:
1) baseline 1;
2) PEEP increased with 10 cmH2O (to a level of 15 cmH2O);
3) baseline 2;
4) passive leg raising;
5) baseline 3;
Each condition was maintained for a five minute period and measurements were performed
in the final three minutes of each period. Passive leg raising was performed by maintaining
the patient supine position and raising the legs 30 degrees by using the facility to raise the
lower end of the bed. The thorax and head (i.e. the heart and baroreceptors) were maintained
at the same through all of the study periods and the pressure transducers did not have to be
re-referenced.
Statistical analysis
Usually, fluid responsiveness is characterized by an increase of 10-15% in CO after rapid fluid
loading with 500 ml [2]. Recently, Jabot and colleagues showed that PLR from the supine position
induces lower increase in CO than PLR from the semi-recumbent position [17]. Based on their
results and those of Lafanachere and colleagues [15] we reasoned that in responders PLR from the
supine position should result in an increase of CO >7%. Our thermodilution technique with
automated triplicate measurements equally spread over the respiratory cycle has a precision of
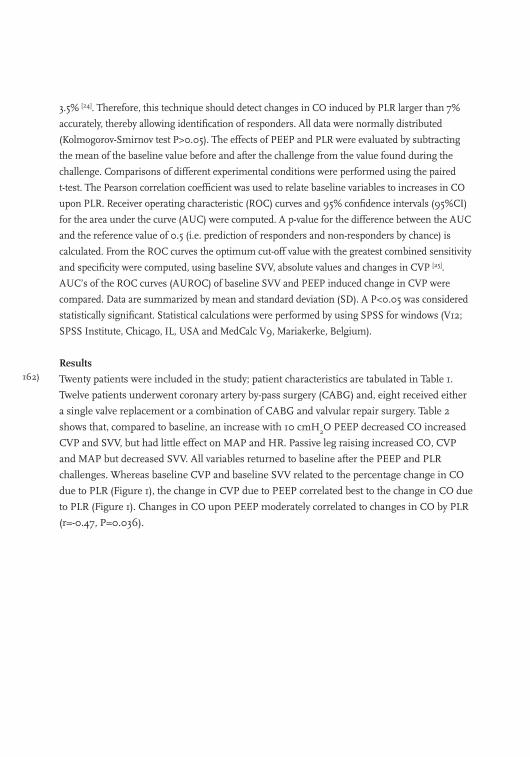
162)
3.5% [24]. Therefore, this technique should detect changes in CO induced by PLR larger than 7%
accurately, thereby allowing identification of responders. All data were normally distributed
(Kolmogorov-Smirnov test P>0.05). The effects of PEEP and PLR were evaluated by subtracting
the mean of the baseline value before and after the challenge from the value found during the
challenge. Comparisons of different experimental conditions were performed using the paired
t-test. The Pearson correlation coefficient was used to relate baseline variables to increases in CO
upon PLR. Receiver operating characteristic (ROC) curves and 95% confidence intervals (95%CI)
for the area under the curve (AUC) were computed. A p-value for the difference between the AUC
and the reference value of 0.5 (i.e. prediction of responders and non-responders by chance) is
calculated. From the ROC curves the optimum cut-off value with the greatest combined sensitivity
and specificity were computed, using baseline SVV, absolute values and changes in CVP [25].
AUC’s of the ROC curves (AUROC) of baseline SVV and PEEP induced change in CVP were
compared. Data are summarized by mean and standard deviation (SD). A P<0.05 was considered
statistically significant. Statistical calculations were performed by using SPSS for windows (V12;
SPSS Institute, Chicago, IL, USA and MedCalc V9, Mariakerke, Belgium).
Results
Twenty patients were included in the study; patient characteristics are tabulated in Table 1.
Twelve patients underwent coronary artery by-pass surgery (CABG) and, eight received either
a single valve replacement or a combination of CABG and valvular repair surgery. Table 2
shows that, compared to baseline, an increase with 10 cmH2O PEEP decreased CO increased
CVP and SVV, but had little effect on MAP and HR. Passive leg raising increased CO, CVP
and MAP but decreased SVV. All variables returned to baseline after the PEEP and PLR
challenges. Whereas baseline CVP and baseline SVV related to the percentage change in CO
due to PLR (Figure 1), the change in CVP due to PEEP correlated best to the change in CO due
to PLR (Figure 1). Changes in CO upon PEEP moderately correlated to changes in CO by PLR
(r=-0.47, P=0.036).
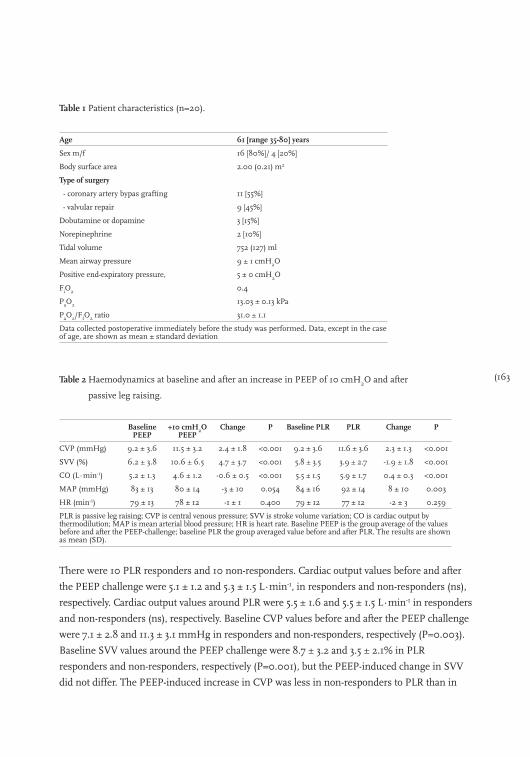
(163
Table 1 Patient characteristics (n=20).
Age 61 [range 35-80] years
Sex m/f 16 [80%]/ 4 [20%]
Body surface area 2.00 (0.21) m2
Type of surgery
- coronary artery bypas grafting 11 [55%]
- valvular repair 9 [45%]
Dobutamine or dopamine 3 [15%]
Norepinephrine 2 [10%]
Tidal volume 752 (127) ml
Mean airway pressure 9 ± 1 cmH2O
Positive end-expiratory pressure, 5 ± 0 cmH2O
FiO2 0.4
PaO2 13.03 ± 0.13 kPa
PaO2/FIO2 ratio 31.0 ± 1.1
Data collected postoperative immediately before the study was performed. Data, except in the case of age, are shown as mean ± standard deviation
Table 2 Haemodynamics at baseline and after an increase in PEEP of 10 cmH2O and after
passive leg raising.
Baseline PEEP
+10 cmH2O PEEP
Change P Baseline PLR PLR Change P
CVP (mmHg) 9.2 ± 3.6 11.5 ± 3.2 2.4 ± 1.8 <0.001 9.2 ± 3.6 11.6 ± 3.6 2.3 ± 1.3 <0.001
SVV (%) 6.2 ± 3.8 10.6 ± 6.5 4.7 ± 3.7 <0.001 5.8 ± 3.5 3.9 ± 2.7 -1.9 ± 1.8 <0.001
CO (L∙min-1) 5.2 ± 1.3 4.6 ± 1.2 -0.6 ± 0.5 <0.001 5.5 ± 1.5 5.9 ± 1.7 0.4 ± 0.3 <0.001
MAP (mmHg) 83 ± 13 80 ± 14 -3 ± 10 0.054 84 ± 16 92 ± 14 8 ± 10 0.003
HR (min-1) 79 ± 13 78 ± 12 -1 ± 1 0.400 79 ± 12 77 ± 12 -2 ± 3 0.259
PLR is passive leg raising; CVP is central venous pressure; SVV is stroke volume variation; CO is cardiac output by thermodilution; MAP is mean arterial blood pressure; HR is heart rate. Baseline PEEP is the group average of the values before and after the PEEP-challenge; baseline PLR the group averaged value before and after PLR. The results are shown as mean (SD).
There were 10 PLR responders and 10 non-responders. Cardiac output values before and after
the PEEP challenge were 5.1 ± 1.2 and 5.3 ± 1.5 L∙min-1, in responders and non-responders (ns),
respectively. Cardiac output values around PLR were 5.5 ± 1.6 and 5.5 ± 1.5 L∙min-1 in responders
and non-responders (ns), respectively. Baseline CVP values before and after the PEEP challenge
were 7.1 ± 2.8 and 11.3 ± 3.1 mmHg in responders and non-responders, respectively (P=0.003).
Baseline SVV values around the PEEP challenge were 8.7 ± 3.2 and 3.5 ± 2.1% in PLR
responders and non-responders, respectively (P=0.001), but the PEEP-induced change in SVV
did not differ. The PEEP-induced increase in CVP was less in non-responders to PLR than in
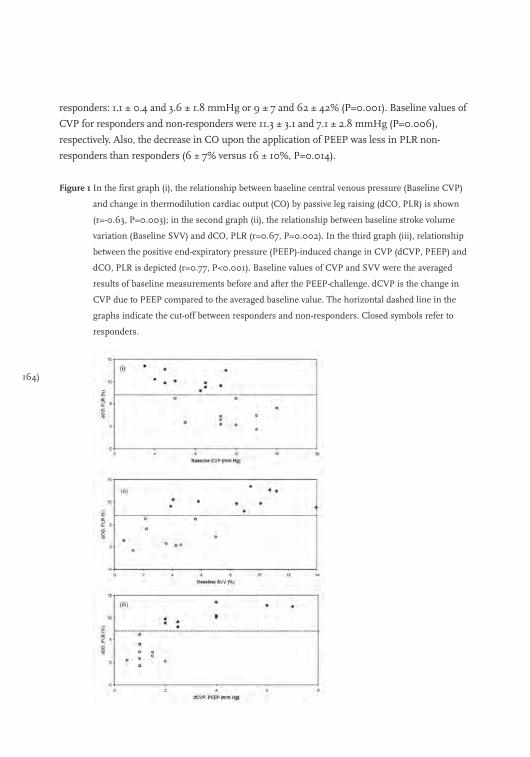
164)
responders: 1.1 ± 0.4 and 3.6 ± 1.8 mmHg or 9 ± 7 and 62 ± 42% (P=0.001). Baseline values of
CVP for responders and non-responders were 11.3 ± 3.1 and 7.1 ± 2.8 mmHg (P=0.006),
respectively. Also, the decrease in CO upon the application of PEEP was less in PLR non-
responders than responders (6 ± 7% versus 16 ± 10%, P=0.014).
Figure 1 In the first graph (i), the relationship between baseline central venous pressure (Baseline CVP)
and change in thermodilution cardiac output (CO) by passive leg raising (dCO, PLR) is shown
(r=-0.63, P=0.003); in the second graph (ii), the relationship between baseline stroke volume
variation (Baseline SVV) and dCO, PLR (r=0.67, P=0.002). In the third graph (iii), relationship
between the positive end-expiratory pressure (PEEP)-induced change in CVP (dCVP, PEEP) and
dCO, PLR is depicted (r=0.77, P<0.001). Baseline values of CVP and SVV were the averaged
results of baseline measurements before and after the PEEP-challenge. dCVP is the change in
CVP due to PEEP compared to the averaged baseline value. The horizontal dashed line in the
graphs indicate the cut-off between responders and non-responders. Closed symbols refer to
responders.
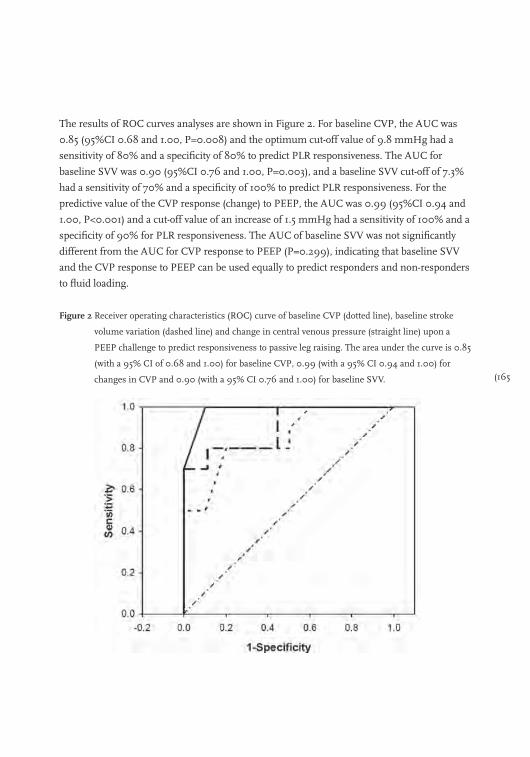
(165
The results of ROC curves analyses are shown in Figure 2. For baseline CVP, the AUC was
0.85 (95%CI 0.68 and 1.00, P=0.008) and the optimum cut-off value of 9.8 mmHg had a
sensitivity of 80% and a specificity of 80% to predict PLR responsiveness. The AUC for
baseline SVV was 0.90 (95%CI 0.76 and 1.00, P=0.003), and a baseline SVV cut-off of 7.3%
had a sensitivity of 70% and a specificity of 100% to predict PLR responsiveness. For the
predictive value of the CVP response (change) to PEEP, the AUC was 0.99 (95%CI 0.94 and
1.00, P<0.001) and a cut-off value of an increase of 1.5 mmHg had a sensitivity of 100% and a
specificity of 90% for PLR responsiveness. The AUC of baseline SVV was not significantly
different from the AUC for CVP response to PEEP (P=0.299), indicating that baseline SVV
and the CVP response to PEEP can be used equally to predict responders and non-responders
to fluid loading.
Figure 2 Receiver operating characteristics (ROC) curve of baseline CVP (dotted line), baseline stroke
volume variation (dashed line) and change in central venous pressure (straight line) upon a
PEEP challenge to predict responsiveness to passive leg raising. The area under the curve is 0.85
(with a 95% CI of 0.68 and 1.00) for baseline CVP, 0.99 (with a 95% CI 0.94 and 1.00) for
changes in CVP and 0.90 (with a 95% CI 0.76 and 1.00) for baseline SVV.
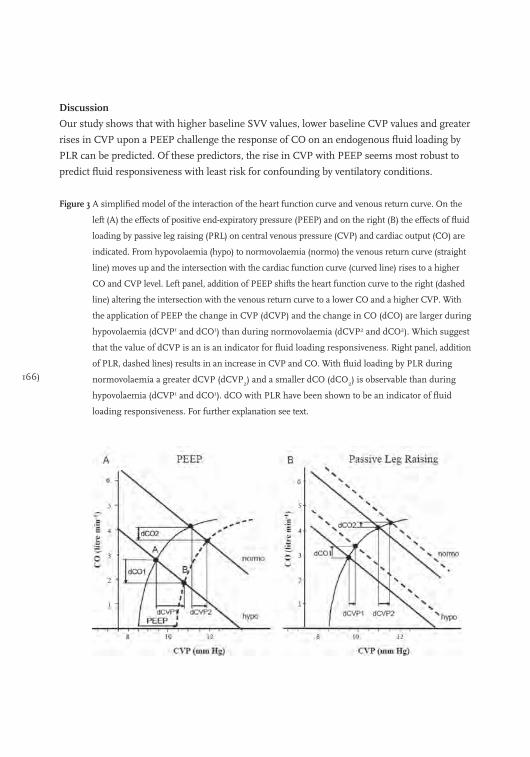
166)
Discussion
Our study shows that with higher baseline SVV values, lower baseline CVP values and greater
rises in CVP upon a PEEP challenge the response of CO on an endogenous fluid loading by
PLR can be predicted. Of these predictors, the rise in CVP with PEEP seems most robust to
predict fluid responsiveness with least risk for confounding by ventilatory conditions.
Figure 3 A simplified model of the interaction of the heart function curve and venous return curve. On the
left (A) the effects of positive end-expiratory pressure (PEEP) and on the right (B) the effects of fluid
loading by passive leg raising (PRL) on central venous pressure (CVP) and cardiac output (CO) are
indicated. From hypovolaemia (hypo) to normovolaemia (normo) the venous return curve (straight
line) moves up and the intersection with the cardiac function curve (curved line) rises to a higher
CO and CVP level. Left panel, addition of PEEP shifts the heart function curve to the right (dashed
line) altering the intersection with the venous return curve to a lower CO and a higher CVP. With
the application of PEEP the change in CVP (dCVP) and the change in CO (dCO) are larger during
hypovolaemia (dCVP1 and dCO1) than during normovolaemia (dCVP2 and dCO2). Which suggest
that the value of dCVP is an is an indicator for fluid loading responsiveness. Right panel, addition
of PLR, dashed lines) results in an increase in CVP and CO. With fluid loading by PLR during
normovolaemia a greater dCVP (dCVP2) and a smaller dCO (dCO2) is observable than during
hypovolaemia (dCVP1 and dCO1). dCO with PLR have been shown to be an indicator of fluid
loading responsiveness. For further explanation see text.
(167
We based our study on the simplified Guytonian model of the circulation (Figure 3). We
consider the effects of PEEP and of PLR in the hypo- and normovolaemic state. Many authors
demonstrated that the venous return curve, i.e. the relationship between CO and CVP, moves
up in parallel with increased blood volumes (Figure 3, lines hypo- and normovolaemia) [26-29].
We have previously constructed venous return curves using prolonged inspiratory hold
manoeuvres in cardiac surgical patients and showed that the slopes were equal in hypo-,
normo-, and hypervolaemic conditions [29]. Magder has shown that application of PEEP shifts
the cardiac function curve to the right, altering the intersection with the venous return curve to
a lower CO and a higher CVP (see Figure 3A, change from point A to point B) [1]. In patients
with hypovolaemia, the increase in CVP and decrease in CO (dCVP1 and dCO1) is larger than
in patients with normovolaemia (dCVP2 and dCO2), in line with experimental data [21]. Thus,
the PEEP-induced change in CVP as well as the change in CO describes in which part of its
function curve the heart operates. Fluid loading by PLR will move up the venous return curve
(Figure 3B, dashed lines). In patients with hypovolaemia and in those with normovolaemia the
intersection with the cardiac function curve will move towards its plateau [30]. Fluid loading in
these two volaemic conditions results in an increasing change in CVP (see Figure 3B, from
dCVP1 to dCVP2) and a decreasing effect on CO (see Figure 3B, from dCO1 to dCO2). Thus,
with PEEP, dCVP and dCO should change inversely but proportionally, depending on the
volume status whereas with fluid loading reverse effects of dCVP and dCO are predicted. We
used PLR as a surrogate for fluid infusion since it well correlates with responsiveness to
exogenous fluids [4,9-20]. Moreover, the use of PLR obviates unnecessary and potentially
harmful fluid loading in non-responders.
We found, as predicted by the model, that the increase in CVP by PEEP directly relates to the
increase in CO by PLR and thus may be of value to predict fluid responsiveness (Figure 1);
second, that PEEP increases CVP and decreases CO, but that the increase in CVP as well as
the decrease in CO is less in non-responders than in responders (normo- versus
hypovolaemia). Our results imply that the predominant mechanism of the decrease in CO
with PEEP is diminished venous return and a decrease in right ventricular preload, that in
turn may limit the rise in CVP [1,21,22] We cannot judge from our data the effect of abnormal
lungs and altered airway pressure transmission on the circulatory response to PEEP [22,23]
Another limitation of the model is that it does not take circulatory control mechanisms into
account. Therefore, we measured the effects of PEEP between 2 and 5 minutes after its
application. Changes in myocardial contractility may change the position and shape of the
heart function curve. Therefore, a deterioration of cardiac function may lead to a decrease in
SVV and a decrease of in the change in CVP produced by PEEP as well as a less fluid-
responsive patient. This was not examined in this study The fact that baseline CVP was also
associated with changes in cardiac output can be explained by the relatively low PEEP we used
168)
in our patients, but changes in filling pressures to guide fluid treatment are less confounded
by PEEP than absolute levels [3,22]. The observation that the CO response to PEEP was of less
predictive value than the CVP response for the CO increase upon PLR can be explained by a
lesser decrease in CO for a given PEEP-induced rise in CVP in hypo- than in normovolaemic
conditions, as shown in animal experiments [21]. We should also keep in mind that the PEEP
challenge moves the work-point of the cardiac function and venous return curves downwards
to the steep part of the curve (larger change in CO), whereas PLR moves the work point
upwards into the flat part of curve (smaller change in CO, Figure 3). This may help explain
why the PLR response of CO was of less predictive value for the PEEP-induced fall in CO than
vice versa (data not shown). The decrease in CO with PEEP may lead to an unacceptably too
low CO for several minutes. Thus, when there areclear signs of hypovolaemia the use of the
PEEP-challenge may not be appropriate.
Our proposed challenge resembles the end-expiratory occlusion test [19] to predict fluid
responsiveness but carries the relative advantage, of being independent of ventilatory
conditions provided that PEEP can be increased by 10 cmH2O. Since the PEEP challenge is
easy to apply and CVP is measured routinely in the ICU, the PEEP-induced change in CVP
may provide the physician with a robust and easy-to-use tool to assess fluid responsiveness.
The drawback of the PEEP challenge is its dependence on maintenance of a steady state
during the challenge and potential worsening of hypotension. A SVV of about 10% or above,
derived from non-invasive arterial pulse contour algorithms, has been used to predict an
increase of 10% to 15% in CO in response to 500 ml fluid loading [4-8]. Our patients were
subjected to a smaller preload challenge and the optimal cut-off to define responsiveness was
somewhat lower. The SVV requires a regular heart rate and full mechanical ventilatory
support, with predictive values dependent on respiratory rates and tidal volumes [7,8] Again,
we may speculate that our PEEP challenge is less dependent on these prerequisites. Even
though SVV had a similar predictive to the PEEP challenge, the latter may thus be
preferable, particularly in case of arrhythmias. One might also argue that performing a PLR
and looking at the CO response would render our PEEP challenge redundant. However, PLR
is not always feasible and necessitates some CO measurement, while our PEEP challenge
does not. (In contrast the PLR challenge does not require mechanical ventilation [14,18].
Finally, the relatively small changes in CVP evoked by PEEP can only be discerned at the
bedside when accurately measured.
Conclusions
Our data suggest that brief PEEP-induced increases in CVP predict fluid responsiveness at
least as well as absolute values of CVP and SVV, after cardiac surgery, and are less likely to be
confounded by ventilatory conditions.

(169
References
1. Magder S, Lagonidis D, Erice F. The use of respiratory variations in right atrial pressure to predict the
cardiac output response to PEEP. J Crit Care 2001; 16: 108-14.
2. Marik PE, Baram M, Vahid B. Does central venous pressure predict fluid responsiveness? A systematic
review of the literature and the tale of seven mares. Chest 2008; 134: 172-8.
3. Verheij J, van Lingen A, Beishuizen A, et al. Cardiac response is greater for colloid than saline fluid loading
after cardiac or vascular surgery. Intensive Care Med 2006; 32: 1030-8.
4. Rex S, Brose S, Metzelder S, et al. Prediction of fluid responsiveness in patients during cardiac surgery. Br J
Anaesth 2004; 93: 782-8.
5. Hofer CK, Senn A, Weibel L, Zollinger A. Assessment of stroke volume variation for prediction of fluid
responsiveness using the modified FloTrac and PiCCOplus system. Crit Care 2008; 12: R82.
6. Preisman S, Kogan S, Berkenstadt H, Perel A. Predicting fluid responsiveness in patients undergoing
cardiac surgery: functional haemodynamic parameters including the Respiratory Systolic Variation Test and
static preload indicators. Br J Anaesth 2005; 95: 746-55.
7. De Backer D, Taccone FS, Holsten R, Ibrahimi F, Vincent JL. Influence of respiratory rate on stroke volume
variation in mechanically ventilated patients. Anesthesiology 2009; 110: 1092-7.
8. Reuter DA, Bayerlein J, Goepfert MS, et al. Influence of tidal volume on left ventricular stroke volume
variation measured by pulse contour analysis in mechanically ventilated patients. Intensive Care Med 2003;
29: 476-80.
9. Thomas M, Shillingford J. The circulatory response to a standard postural change in ischaemic heart
disease. Br Heart J 1965; 27: 17-27.
10. Rutlen DL, Wackers FJ, Zaret BL. Radionuclide assessment of peripheral intravascular capacity: a technique
to measure intravascular volume changes in the capacitance circulation in man. Circulation 1981; 64:
146-52.
11. Wong DH, Tremper KK, Zaccari J, et al. Acute cardiovascular response to passive leg raising. Crit Care Med
1988; 16: 123-5.
12. Wong DH, O’Connor D, Tremper KK, et al. Changes in cardiac output after acute blood loss and position
change in man. Crit Care Med 1989; 17: 979-83.
13. Lamia B, Ochagavia A, Monnet X, et al. Echocardiographic prediction of volume responsiveness in critically
ill patients with spontaneously breathing activity. Intensive Care Med 2007; 33: 1125-32.
14. Maizel J, Airapetian N, Lorne E, et al. Diagnosis of central hypovolemia by using passive leg raising.
Intensive Care Med 2007; 33: 1133-8.
15. Lafanechere A, Pene F, Goulenok C, et al. Changes in aortic blood flow induced by passive leg raising predict
fluid responsiveness in critically ill patients. Crit Care 2006; 10: R132.
16. Monnet X, Rienzo M, Osman D, et al. Passive leg raising predicts fluid responsiveness in the critically ill.
Crit Care Med 2006; 34: 1402-7.
17. Jabot J, Teboul JL, Richard C, Monnet X. Passive leg raising for predicting fluid responsiveness: importance
of the postural change. Intensive Care Med 2009; 35: 85-90.
18. Boulain T, Achard JM, Teboul JL, et al. Changes in BP induced by passive leg raising predict response to
fluid loading in critically ill patients. Chest 2002; 121: 1245-52.
19. Monnet X, Osman D, Ridel C, et al. Predicting volume responsiveness by using the end-expiratory occlusion
in mechanically ventilated intensive care unit patients. Crit Care Med 2009; 37: 951-6.
20. Cavallaro F, Sandroni C, Marano C, et al. Diagnostic accuracy of passive leg raising for prediction of fluid
responsiveness in adults: systematic review and meta-analysis of clinical studies. Intensive Care Med 2010;
170)
36: 1475-83.
21. Schreuder JJ, Jansen JR, Versprille A. Hemodynamic effects of PEEP applied as a ramp in normo-, hyper-,
and hypovolemia. J Appl Physiol 1985; 59: 1178-84.
22. Luecke T, Pelosi P. Clinical review: Positive end-expiratory pressure and cardiac output. Crit Care 2005; 9:
607-21.
23. Fougeres E, Teboul JL, Richard C, et al. Hemodynamic impact of a positive end-expiratory pressure setting in
acute respiratory distress syndrome: importance of the volume status. Crit Care Med 2010; 38: 802-7.
24. Jansen JR, Schreuder JJ, Settels JJ, Kloek JJ, Versprille A. An adequate strategy for the thermodilution
technique in patients during mechanical ventilation. Intensive Care Med 1990; 16: 422-5.
25. Hanley JA, McNeil BJ. The meaning and use of the area under a receiver operating characteristic (ROC)
curve. Radiology 1982; 143: 29-36.
26. Guyton AC, Lindsey AW, Abernathy B, Richardson T. Venous return at various right atrial pressures and the
normal venous return curve. Am J Physiol 1957; 189: 609-15.
27. Pinsky MR. Instantaneous venous return curves in an intact canine preparation. J Appl Physiol 1984; 56:
765-71.
28. Versprille A, Jansen JR. Mean systemic filling pressure as a characteristic pressure for venous return.
Pflugers Arch 1985; 405: 226-33.
29. Maas JJ, Geerts BF, de Wilde RB, et al. Assessment of venous return curve and mean systemic filling
pressure in post-operative cardiac surgery patients. Crit Care Med 2009; 37: 912-8.
30. Versprille A, Jansen JR. Tidal variation of pulmonary blood flow and blood volume in piglets during
mechanical ventilation during hyper-, normo- and hypovolaemia. Pflugers Arch 1993; 424: 255-65.

(171
Chapter 11
Vincent and Weil’s fluid challenge: revisited and revised
Bart Geerts, Robert de Wilde, Jacinta Maas, Leon Aarts and Jos Jansen
Submitted to Critical Care
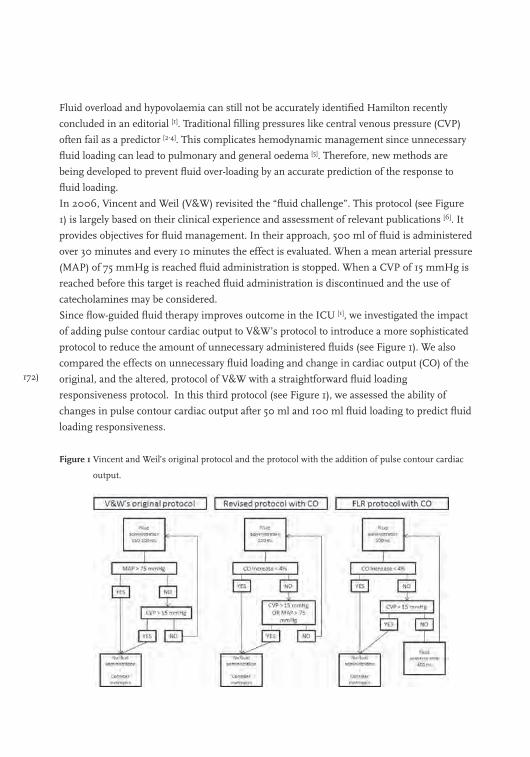
172)
Fluid overload and hypovolaemia can still not be accurately identified Hamilton recently
concluded in an editorial [1]. Traditional filling pressures like central venous pressure (CVP)
often fail as a predictor [2-4]. This complicates hemodynamic management since unnecessary
fluid loading can lead to pulmonary and general oedema [5]. Therefore, new methods are
being developed to prevent fluid over-loading by an accurate prediction of the response to
fluid loading.
In 2006, Vincent and Weil (V&W) revisited the “fluid challenge”. This protocol (see Figure
1) is largely based on their clinical experience and assessment of relevant publications [6]. It
provides objectives for fluid management. In their approach, 500 ml of fluid is administered
over 30 minutes and every 10 minutes the effect is evaluated. When a mean arterial pressure
(MAP) of 75 mmHg is reached fluid administration is stopped. When a CVP of 15 mmHg is
reached before this target is reached fluid administration is discontinued and the use of
catecholamines may be considered.
Since flow-guided fluid therapy improves outcome in the ICU [1], we investigated the impact
of adding pulse contour cardiac output to V&W’s protocol to introduce a more sophisticated
protocol to reduce the amount of unnecessary administered fluids (see Figure 1). We also
compared the effects on unnecessary fluid loading and change in cardiac output (CO) of the
original, and the altered, protocol of V&W with a straightforward fluid loading
responsiveness protocol. In this third protocol (see Figure 1), we assessed the ability of
changes in pulse contour cardiac output after 50 ml and 100 ml fluid loading to predict fluid
loading responsiveness.
Figure 1 Vincent and Weil’s original protocol and the protocol with the addition of pulse contour cardiac
output.
(173
Methods
Twenty-one patients undergoing elective coronary artery bypass grafting (CABG) or single
valve repair were included into the study after approval of the institutional ethics committee
and personal informed consent was obtained. All patients had symptomatic coronary artery
disease without previous myocardial infarction and were on beta-adrenergic blocking
medication. Patients with congestive heart failure (NYHA class 4), aortic aneurysm,
extensive peripheral arterial occlusive disease, or postoperative valvular insufficiency, were
not considered for this study. Patients with the necessity for artificial pacing or use of a
cardiac assist device were also excluded.
Before ICU admission, each patient had received a pulmonary artery catheter (Intellicath,
Edwards Lifesciences; Irvine CA, USA) inserted into the pulmonary artery via the right
jugular vein to measure CVP and thermodilution cardiac output (CO). In addition, all
patients had received a 20 G radial artery catheter to measure arterial pressure (Prad). In the
ICU, patient’s anesthesia was continued with propofol-target-control infusion and sufentanil
according to institutional standard. The lungs were mechanically ventilated in a volume-
control mode with standard settings to achieve normocapnia (arterial PCO2 between 40 and
45 mmHg) with tidal volumes of 8-10 ml∙kg-1 and a respiratory frequency of 12-14
breaths∙min-1. Fraction of inspired oxygen was 0.4 and a positive end expiratory pressure
(PEEP) of 5 cmH2O was applied. During the study interval ventilator settings, sedation and
vasoactive medication continued unchanged. No significant bleeding (<50 ml∙h-1) occurred
during the study period.
Hemodynamic measurements
Both Prad and CVP pressure transducers were referenced to the level of the tricuspid valve and
zeroed to atmospheric pressure. Prad and CVP data were continuously recorded with a
resolution of 0.125 mmHg at a sample frequency of 200 Hertz and stored a personal computer
for analysis and documentation. From Prad we calculated heart rate (HR), MAP, CO, pulse
pressure variation (PPV), and stroke volume variation (SVV) over 30 second intervals using two
different pulse contour methods; modified Modelflow (COm, FMS, Amsterdam, the
Netherlands) and PulseCO (COli, LiDCO, LiDCO Ltd., London, UK). Both methods are
extensively described elsewhere [7]. We calibrated both pulse contour devices with the same
averaged value of three thermodilution measurements performed equally spread over the
ventilatory cycle [8,9]. Over the same 30 seconds interval HR, CVP and MAP were calculated.
Study protocol
All measurements were carried out within two hours after arrival in the ICU. During the
observation period patients maintained a supine position. At baseline, measurements of
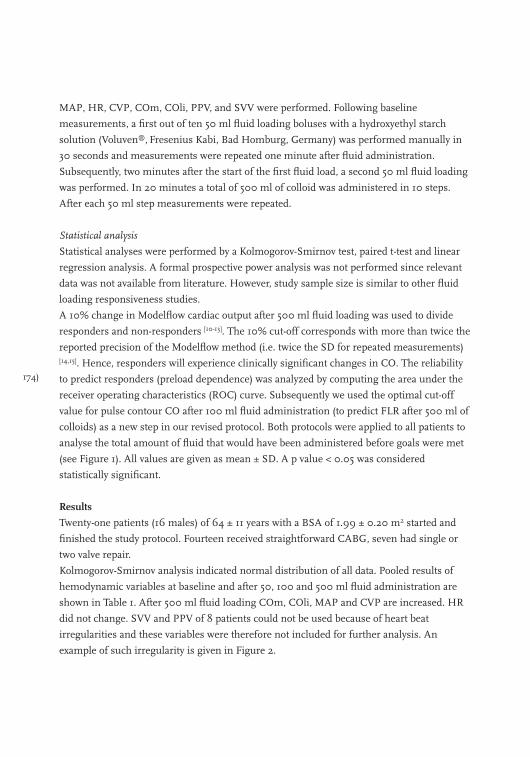
174)
MAP, HR, CVP, COm, COli, PPV, and SVV were performed. Following baseline
measurements, a first out of ten 50 ml fluid loading boluses with a hydroxyethyl starch
solution (Voluven®, Fresenius Kabi, Bad Homburg, Germany) was performed manually in
30 seconds and measurements were repeated one minute after fluid administration.
Subsequently, two minutes after the start of the first fluid load, a second 50 ml fluid loading
was performed. In 20 minutes a total of 500 ml of colloid was administered in 10 steps.
After each 50 ml step measurements were repeated.
Statistical analysis
Statistical analyses were performed by a Kolmogorov-Smirnov test, paired t-test and linear
regression analysis. A formal prospective power analysis was not performed since relevant
data was not available from literature. However, study sample size is similar to other fluid
loading responsiveness studies.
A 10% change in Modelflow cardiac output after 500 ml fluid loading was used to divide
responders and non-responders [10-13]. The 10% cut-off corresponds with more than twice the
reported precision of the Modelflow method (i.e. twice the SD for repeated measurements) [14,15]. Hence, responders will experience clinically significant changes in CO. The reliability
to predict responders (preload dependence) was analyzed by computing the area under the
receiver operating characteristics (ROC) curve. Subsequently we used the optimal cut-off
value for pulse contour CO after 100 ml fluid administration (to predict FLR after 500 ml of
colloids) as a new step in our revised protocol. Both protocols were applied to all patients to
analyse the total amount of fluid that would have been administered before goals were met
(see Figure 1). All values are given as mean ± SD. A p value < 0.05 was considered
statistically significant.
Results
Twenty-one patients (16 males) of 64 ± 11 years with a BSA of 1.99 ± 0.20 m2 started and
finished the study protocol. Fourteen received straightforward CABG, seven had single or
two valve repair.
Kolmogorov-Smirnov analysis indicated normal distribution of all data. Pooled results of
hemodynamic variables at baseline and after 50, 100 and 500 ml fluid administration are
shown in Table 1. After 500 ml fluid loading COm, COli, MAP and CVP are increased. HR
did not change. SVV and PPV of 8 patients could not be used because of heart beat
irregularities and these variables were therefore not included for further analysis. An
example of such irregularity is given in Figure 2.
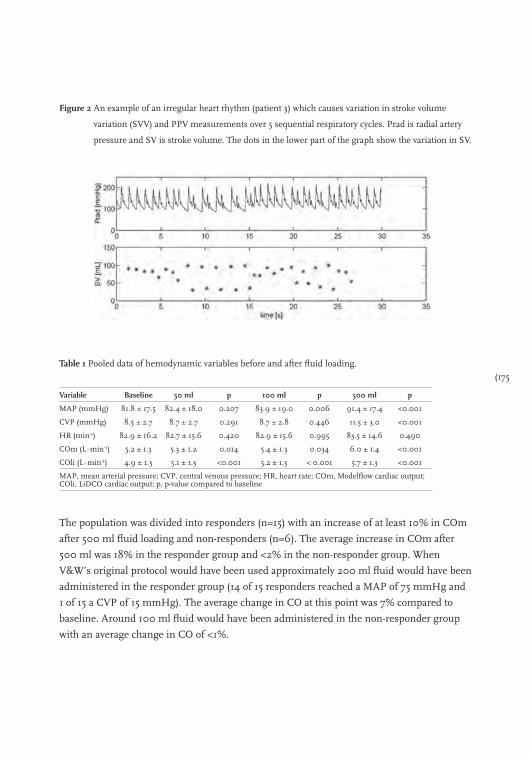
(175
Figure 2 An example of an irregular heart rhythm (patient 3) which causes variation in stroke volume
variation (SVV) and PPV measurements over 5 sequential respiratory cycles. Prad is radial artery
pressure and SV is stroke volume. The dots in the lower part of the graph show the variation in SV.
Table 1 Pooled data of hemodynamic variables before and after fluid loading.
Variable Baseline 50 ml p 100 ml p 500 ml p
MAP (mmHg) 81.8 ± 17.5 82.4 ± 18.0 0.207 83.9 ± 19.0 0.006 91.4 ± 17.4 <0.001
CVP (mmHg) 8.5 ± 2.7 8.7 ± 2.7 0.291 8.7 ± 2.8 0.446 11.5 ± 3.0 <0.001
HR (min-1) 82.9 ± 16.2 82.7 ± 15.6 0.420 82.9 ± 15.6 0.995 83.5 ± 14.6 0.490
COm (L∙min-1) 5.2 ± 1.3 5.3 ± 1.2 0.014 5.4 ± 1.3 0.034 6.0 ± 1.4 <0.001
COli (L∙min-1) 4.9 ± 1.3 5.1 ± 1.3 <0.001 5.2 ± 1.3 < 0.001 5.7 ± 1.3 <0.001
MAP, mean arterial pressure; CVP, central venous pressure; HR, heart rate; COm, Modelflow cardiac output; COli, LiDCO cardiac output; p, p-value compared to baseline
The population was divided into responders (n=15) with an increase of at least 10% in COm
after 500 ml fluid loading and non-responders (n=6). The average increase in COm after
500 ml was 18% in the responder group and <2% in the non-responder group. When
V&W’s original protocol would have been used approximately 200 ml fluid would have been
administered in the responder group (14 of 15 responders reached a MAP of 75 mmHg and
1 of 15 a CVP of 15 mmHg). The average change in CO at this point was 7% compared to
baseline. Around 100 ml fluid would have been administered in the non-responder group
with an average change in CO of <1%.
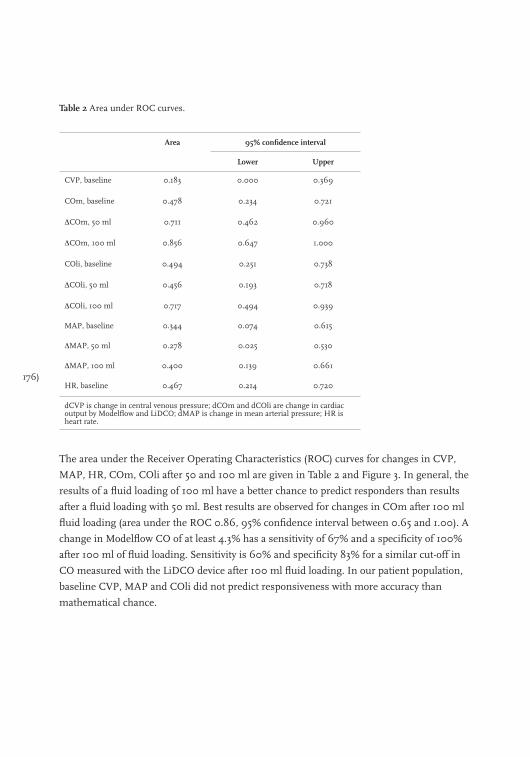
176)
Table 2 Area under ROC curves.
Area 95% confidence interval
Lower Upper
CVP, baseline 0.183 0.000 0.369
COm, baseline 0.478 0.234 0.721
∆COm, 50 ml 0.711 0.462 0.960
∆COm, 100 ml 0.856 0.647 1.000
COli, baseline 0.494 0.251 0.738
∆COli, 50 ml 0.456 0.193 0.718
∆COli, 100 ml 0.717 0.494 0.939
MAP, baseline 0.344 0.074 0.615
∆MAP, 50 ml 0.278 0.025 0.530
∆MAP, 100 ml 0.400 0.139 0.661
HR, baseline 0.467 0.214 0.720
dCVP is change in central venous pressure; dCOm and dCOli are change in cardiac output by Modelflow and LiDCO; dMAP is change in mean arterial pressure; HR is heart rate.
The area under the Receiver Operating Characteristics (ROC) curves for changes in CVP,
MAP, HR, COm, COli after 50 and 100 ml are given in Table 2 and Figure 3. In general, the
results of a fluid loading of 100 ml have a better chance to predict responders than results
after a fluid loading with 50 ml. Best results are observed for changes in COm after 100 ml
fluid loading (area under the ROC 0.86, 95% confidence interval between 0.65 and 1.00). A
change in Modelflow CO of at least 4.3% has a sensitivity of 67% and a specificity of 100%
after 100 ml of fluid loading. Sensitivity is 60% and specificity 83% for a similar cut-off in
CO measured with the LiDCO device after 100 ml fluid loading. In our patient population,
baseline CVP, MAP and COli did not predict responsiveness with more accuracy than
mathematical chance.
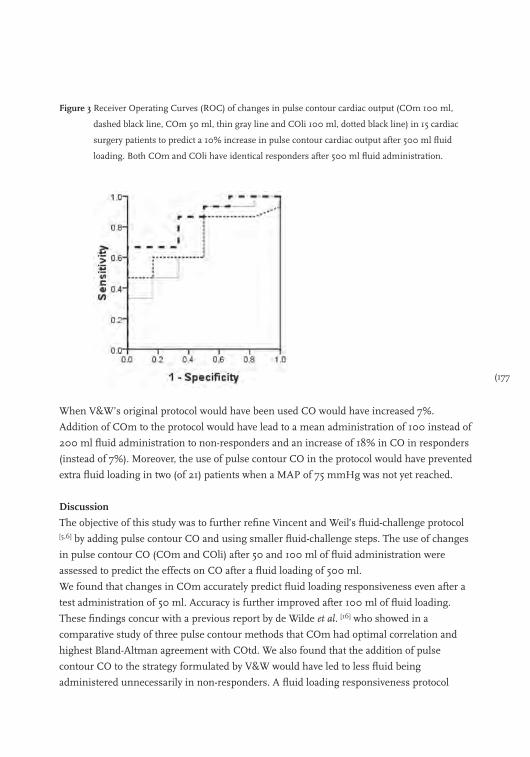
(177
Figure 3 Receiver Operating Curves (ROC) of changes in pulse contour cardiac output (COm 100 ml,
dashed black line, COm 50 ml, thin gray line and COli 100 ml, dotted black line) in 15 cardiac
surgery patients to predict a 10% increase in pulse contour cardiac output after 500 ml fluid
loading. Both COm and COli have identical responders after 500 ml fluid administration.
When V&W’s original protocol would have been used CO would have increased 7%.
Addition of COm to the protocol would have lead to a mean administration of 100 instead of
200 ml fluid administration to non-responders and an increase of 18% in CO in responders
(instead of 7%). Moreover, the use of pulse contour CO in the protocol would have prevented
extra fluid loading in two (of 21) patients when a MAP of 75 mmHg was not yet reached.
Discussion
The objective of this study was to further refine Vincent and Weil’s fluid-challenge protocol [5,6] by adding pulse contour CO and using smaller fluid-challenge steps. The use of changes
in pulse contour CO (COm and COli) after 50 and 100 ml of fluid administration were
assessed to predict the effects on CO after a fluid loading of 500 ml.
We found that changes in COm accurately predict fluid loading responsiveness even after a
test administration of 50 ml. Accuracy is further improved after 100 ml of fluid loading.
These findings concur with a previous report by de Wilde et al. [16] who showed in a
comparative study of three pulse contour methods that COm had optimal correlation and
highest Bland-Altman agreement with COtd. We also found that the addition of pulse
contour CO to the strategy formulated by V&W would have led to less fluid being
administered unnecessarily in non-responders. A fluid loading responsiveness protocol
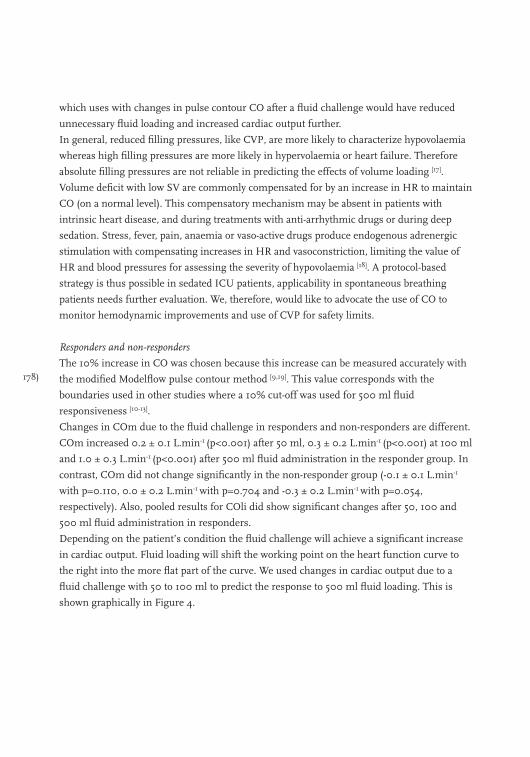
178)
which uses with changes in pulse contour CO after a fluid challenge would have reduced
unnecessary fluid loading and increased cardiac output further.
In general, reduced filling pressures, like CVP, are more likely to characterize hypovolaemia
whereas high filling pressures are more likely in hypervolaemia or heart failure. Therefore
absolute filling pressures are not reliable in predicting the effects of volume loading [17].
Volume deficit with low SV are commonly compensated for by an increase in HR to maintain
CO (on a normal level). This compensatory mechanism may be absent in patients with
intrinsic heart disease, and during treatments with anti-arrhythmic drugs or during deep
sedation. Stress, fever, pain, anaemia or vaso-active drugs produce endogenous adrenergic
stimulation with compensating increases in HR and vasoconstriction, limiting the value of
HR and blood pressures for assessing the severity of hypovolaemia [18]. A protocol-based
strategy is thus possible in sedated ICU patients, applicability in spontaneous breathing
patients needs further evaluation. We, therefore, would like to advocate the use of CO to
monitor hemodynamic improvements and use of CVP for safety limits.
Responders and non-responders
The 10% increase in CO was chosen because this increase can be measured accurately with
the modified Modelflow pulse contour method [9,19]. This value corresponds with the
boundaries used in other studies where a 10% cut-off was used for 500 ml fluid
responsiveness [10-13].
Changes in COm due to the fluid challenge in responders and non-responders are different.
COm increased 0.2 ± 0.1 L.min-1 (p<0.001) after 50 ml, 0.3 ± 0.2 L.min-1 (p<0.001) at 100 ml
and 1.0 ± 0.3 L.min-1 (p<0.001) after 500 ml fluid administration in the responder group. In
contrast, COm did not change significantly in the non-responder group (-0.1 ± 0.1 L.min-1
with p=0.110, 0.0 ± 0.2 L.min-1 with p=0.704 and -0.3 ± 0.2 L.min-1 with p=0.054,
respectively). Also, pooled results for COli did show significant changes after 50, 100 and
500 ml fluid administration in responders.
Depending on the patient’s condition the fluid challenge will achieve a significant increase
in cardiac output. Fluid loading will shift the working point on the heart function curve to
the right into the more flat part of the curve. We used changes in cardiac output due to a
fluid challenge with 50 to 100 ml to predict the response to 500 ml fluid loading. This is
shown graphically in Figure 4.
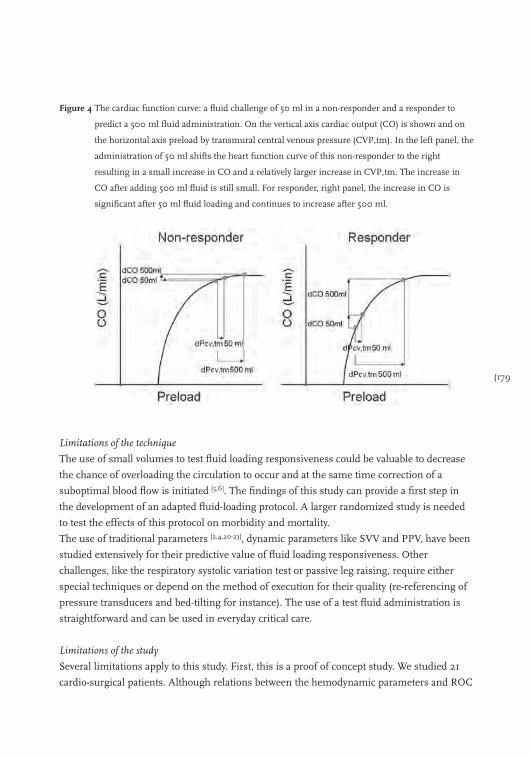
(179
Figure 4 The cardiac function curve: a fluid challenge of 50 ml in a non-responder and a responder to
predict a 500 ml fluid administration. On the vertical axis cardiac output (CO) is shown and on
the horizontal axis preload by transmural central venous pressure (CVP,tm). In the left panel, the
administration of 50 ml shifts the heart function curve of this non-responder to the right
resulting in a small increase in CO and a relatively larger increase in CVP,tm. The increase in
CO after adding 500 ml fluid is still small. For responder, right panel, the increase in CO is
significant after 50 ml fluid loading and continues to increase after 500 ml.
Limitations of the technique
The use of small volumes to test fluid loading responsiveness could be valuable to decrease
the chance of overloading the circulation to occur and at the same time correction of a
suboptimal blood flow is initiated [5,6]. The findings of this study can provide a first step in
the development of an adapted fluid-loading protocol. A larger randomized study is needed
to test the effects of this protocol on morbidity and mortality.
The use of traditional parameters [2,4,20-23], dynamic parameters like SVV and PPV, have been
studied extensively for their predictive value of fluid loading responsiveness. Other
challenges, like the respiratory systolic variation test or passive leg raising, require either
special techniques or depend on the method of execution for their quality (re-referencing of
pressure transducers and bed-tilting for instance). The use of a test fluid administration is
straightforward and can be used in everyday critical care.
Limitations of the study
Several limitations apply to this study. First, this is a proof of concept study. We studied 21
cardio-surgical patients. Although relations between the hemodynamic parameters and ROC
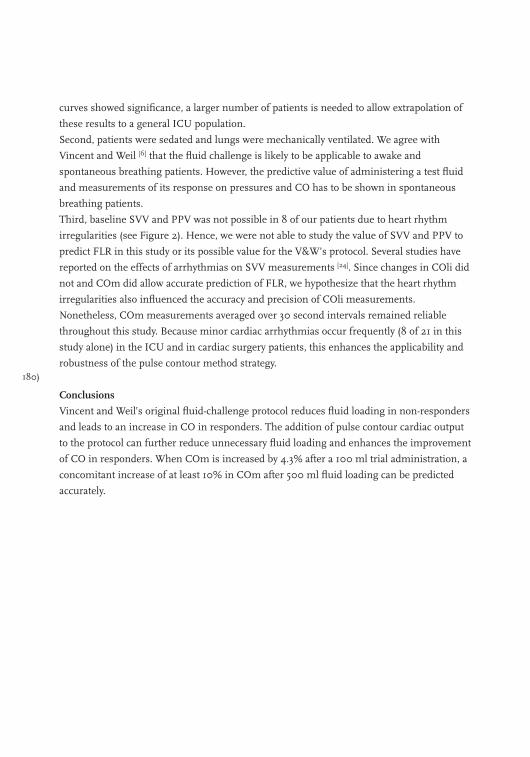
180)
curves showed significance, a larger number of patients is needed to allow extrapolation of
these results to a general ICU population.
Second, patients were sedated and lungs were mechanically ventilated. We agree with
Vincent and Weil [6] that the fluid challenge is likely to be applicable to awake and
spontaneous breathing patients. However, the predictive value of administering a test fluid
and measurements of its response on pressures and CO has to be shown in spontaneous
breathing patients.
Third, baseline SVV and PPV was not possible in 8 of our patients due to heart rhythm
irregularities (see Figure 2). Hence, we were not able to study the value of SVV and PPV to
predict FLR in this study or its possible value for the V&W’s protocol. Several studies have
reported on the effects of arrhythmias on SVV measurements [24]. Since changes in COli did
not and COm did allow accurate prediction of FLR, we hypothesize that the heart rhythm
irregularities also influenced the accuracy and precision of COli measurements.
Nonetheless, COm measurements averaged over 30 second intervals remained reliable
throughout this study. Because minor cardiac arrhythmias occur frequently (8 of 21 in this
study alone) in the ICU and in cardiac surgery patients, this enhances the applicability and
robustness of the pulse contour method strategy.
Conclusions
Vincent and Weil’s original fluid-challenge protocol reduces fluid loading in non-responders
and leads to an increase in CO in responders. The addition of pulse contour cardiac output
to the protocol can further reduce unnecessary fluid loading and enhances the improvement
of CO in responders. When COm is increased by 4.3% after a 100 ml trial administration, a
concomitant increase of at least 10% in COm after 500 ml fluid loading can be predicted
accurately.

(181
References
1. Hamilton MA. Perioperative fluid management: progress despite lingering controversies. Cleve Clin J Med
2009; 76 Suppl 4: S28-S31.
2. Kumar A, Anel R, Bunnell E, et al. Pulmonary artery occlusion pressure and central venous pressure fail to
predict ventricular filling volume, cardiac performance, or the response to volume infusion in normal
subjects. Crit Care Med 2004; 32: 691-9.
3. Michard F, Teboul JL. Predicting Fluid Responsiveness in ICU Patients* : A Critical Analysis of the
Evidence. Chest 2002; 121: 2000-8.
4. Reuse C, Vincent JL, Pinsky MR. Measurements of right ventricular volumes during fluid challenge. Chest
1990; 98: 1450-4.
5. Weil MH, Henning RJ. New concepts in the diagnosis and fluid treatment of circulatory shock. Thirteenth
annual Becton, Dickinson and Company Oscar Schwidetsky Memorial Lecture. Anest Analg 1979; 58:
124-32.
6. Vincent JL, Weil MH. Fluid challenge revisited. Crit Care Med 2006; 34: 1333-7.
7. de Wilde RB, Schreuder JJ, van den Berg PC, Jansen JR. An evaluation of cardiac output by five arterial pulse
contour techniques during cardiac surgery. Anaesthesia 2007; 62: 760-8.
8. Jansen JR, Schreuder JJ, Bogaard JM, van Rooyen W, Versprille A. Thermodilution technique for
measurement of cardiac output during artificial ventilation. J Appl Physiol 1981; 51: 584-91.
9. Jansen JR, Schreuder JJ, Settels, Kloek JJ, Versprille A. An adequate strategy for the thermodilution technique
in patients during mechanical ventilation. Intensive Care Med 1990; 16: 422-5.
10. Lee JH, Kim JT, Yoon SZ, et al. Evaluation of corrected flow time in oesophageal Doppler as a predictor of
fluid responsiveness. Br J Anaesth 2007; 99: 343-8.
11. Perner A, Faber T. Stroke volume variation does not predict fluid responsiveness in patients with septic shock
on pressure support ventilation. Acta Anaesthesiol Scand 2006; 50: 1068-73.
12. Solus-Biguenet H, Fleyfel M, Tavernier B, et al. Non-invasive prediction of fluid responsiveness during major
hepatic surgery. Br J Anaesth 2006; 97: 808-16.
13. Wagner JG, Leatherman JW. Right ventricular end-diastolic volume as a predictor of the hemodynamic
response to a fluid challenge. Chest 1998; 113: 1048-54.
14. Jansen JR, Schreuder JJ, Mulier JP, et al. A comparison of cardiac output derived from the arterial pressure
wave against thermodilution in cardiac surgery patients. Br J Anaesth 2001; 87: 212-22.
15. Critchley LA, Critchley JA. A meta-analysis of studies using bias and precision statistics to compare cardiac
output measurement techniques. J Clin Monit Comput 1999; 15: 85-91.
16. de Wilde RB, Schreuder JJ, van den Berg PC, Jansen JR. An evaluation of cardiac output by five arterial pulse
contour techniques during cardiac surgery. Anaesthesia 2007; 62: 760-8.
17. Pinsky MR. Heart-lung interactions. Curr Opin Crit Care 2007; 13: 528-31.
18. Blake DW, Wright CE, Scott DA, Angus JA. Cardiovascular reflex responses after intrathecal omega-
conotoxins or dexmedetomidine in the rabbit. Clin Exp Pharmacol Physiol 2003; 30: 82-7.
19. Jansen JR. The thermodilution method for the clinical assessment of cardiac output. Intensive Care Med
1995; 21: 691-7.
20. Calvin JE, Driedger AA, Sibbald WJ. The hemodynamic effect of rapid fluid infusion in critically ill patients.
Surgery 1981; 90: 61-76.
21. Michard F, Boussat S, Chemla D, et al. Relation between respiratory changes in arterial pulse pressure and
fluid responsiveness in septic patients with acute circulatory failure. Am J Respir Crit Care Med 2000; 162:
134-8.

182)
22. Squara P, Journois D, Estagnasie P, et al. Elastic energy as an index of right ventricular filling. Chest 1997;
111: 351-8.
23. Shippy CR, Appel PL, Shoemaker WC. Reliability of clinical monitoring to assess blood volume in critically
ill patients. Crit Care Med 1984; 12: 107-12.
24. Michard F, Teboul JL. Using heart-lung interactions to assess fluid responsiveness during mechanical
ventilation. Crit Care 2000; 4: 282-9.

(183
Chapter 12
Pulse contour cardiac output and passive leg raising to assess fluid loading responsiveness in cardiac-surgery patients
Bart Geerts, Rob de Wilde, Leon Aarts and Jos Jansen
Journal of Cardiothoracic and Vascular Anesthesia 2011; 25(1): 48-52.
184)
The selection of patients that will benefit from fluid loading is important since unnecessary
fluid loading in a non-responsive subject may potentially cause pulmonary and general
oedema. Passive leg raising (PLR) is a routinely-applied bedside method that accurately
predicts volume responsiveness [1-6]. However, its clinical application requires dynamic
assessment of cardiac output (CO). Transient increases in transthoracic and oesophageal
Doppler CO and left ventricular stroke area by ultrasound during PLR predict preload
responsiveness. However, ultrasound measurements are neither routinely performed,
consistent among operators nor easy to perform continuously [7]. Furthermore, the
HemoSonic ultrasound device most frequently used in PLR research [1-6] is currently
withdrawn from the market. Recently, DeBacker and Pinsky hypothesized that other CO
measurement techniques such as pulse power or pulse contour analysis could provide
similar results and supplant Doppler ultrasound monitoring [8]. This approach is attractive,
as it would provide the clinician with a simple, readily available and robust measure that can
be obtained at the bedside.
The aim of our study is to evaluate the applicability of two different radial artery pulse
contour CO devices, one using pulse power (COli, LiDCO, London, UK) and the other using
Modelflow arterial pulse contour analysis (COm, FMS, Amsterdam, the Netherlands) in
prediction fluid loading responsiveness by tracking CO changes due to a PLR manoeuvre.
The changes in cardiac output by these two methods are compared to changes in CO by
thermodilution (COtd).
Methods
Twenty patients undergoing elective coronary artery bypass (CABG) and, or valvular
reconstruction surgery were included into the study after approval of the University Medical
Ethics Committee of the University of Leiden. All patients signed informed consent to be
part of this study. Subjects were included in the study during their initial post-operative
period once hemodynamically stable with a mean arterial pressure (MAP) > 70 mmHg,
central venous pressure (CVP) between 5-10 mmHg and a cardiac index > 2.5 L∙min-1.
Exclusion criteria included severe arrhythmias, advanced congestive heart failure (ejection
fraction <20%), intra-cardiac shunts, symptomatic peripheral vascular disease, symptomatic
pulmonary disease, aortic aneurysm and significant valvular regurgitation after surgery.
Anaesthesia during surgery was with propofol and sufentanil infusions according to
institutional standards. Upon arrival in the ICU sedation was continued. The lungs were
mechanically ventilated in a volume-control mode with settings aimed to achieve
normocapnia with a tidal volume of 8-12 ml∙kg-1 and a respiratory frequency of 12-14
breaths∙min-1. Fraction of inspired oxygen was 0.4 and PEEP 5 cmH2O. During the
(185
observation period, ventilator settings, sedation and vasoactive medication, when used, were
continued unchanged.
All subjects had a pulmonary artery catheter (Intellicath; Edwards Lifesciences; Irvine, CA,
USA) inserted into the right jugular vein and a radial arterial catheter (20 G) inserted prior
to ICU admission. COtd measurement was performed with an automated system under
computer control. COtd was measured in triplicate (with 10 ml saline solution at room
temperature) in two minutes, with the measurements equally spread over the ventilatory
cycle. The three individual COtd measurements were averaged [9]. Blood pressure
transducers were referenced to the level of the tricuspid valve and zeroed to atmospheric
pressure. Arterial pressure, heart rate (HR) and CVP data were continuously recorded with a
sample frequency of 100 Hertz and stored on a personal computer for documentation and
offline analysis. MAP, systolic arterial pressure (SP), pulse pressure (PP) and pulse pressure
variation (PPV) were calculated from arterial pressure. Stroke volume variation (SVV) and
CO was averaged over 30 second intervals using pulse power (SVVli and COli) and
Modelflow (COm). The LiDCO system was calibrated. The Modelflow was used uncalibrated.
A detailed description of the two methods can be found elsewhere [10-12].
Measurements were carried out within two hours after arrival in the ICU following MAP
stabilization (85.0 ± 12.0 mmHg) and restoration of central body temperature (36.6 ± 0.7
°C). Characteristics and treatment data of each patient were collected. Passive leg raising was
performed from the supine position by lifting both legs at a 30° angle and holding them
there for 5 minutes. Measurements of HR, MAP, PP, SP, CVP, COtd, COm, COli, PPV and
SVV were performed 5 minutes before, 2 minutes after initial elevation of the legs with legs
still elevated, and 5 minutes after return from passive leg raising.
We used a Kolmogorov-Smirnov test, paired t-test and linear regression analysis. The
reliability to track changes in CO was analyzed by computing the area under the receiver
operating characteristics (ROC) curve, with responders related to 7% COtd increase during
PLR [13]. Usually, responders are characterized by an increase of 10-15% in CO after rapid
fluid loading with 500 ml [14]. Lafanechere et al. [3] showed that the effect of PLR on CO of
patients in supine position was equal to 250 ml fluid loading. We reasoned that in the same
group of responders a PLR-induced auto-transfusion of 250 ml should result in an increase
of CO of 5 to 7.5%. Our thermodilution technique with automated triplicate measurements
equally spread over the respiratory cycle has shown a precision of 3.5% [9,11]. Therefore, this
technique should detect changes in CO induced by PLR larger then 7% (2SD precision)
accurately and identifying responders by a >7% increase in CO by PLR reliable. All values
are given as mean ± SD. Differences corresponding to a p value < 0.05 were considered
significant.
186)
Results
Twenty patients met the inclusion criteria and were enrolled in the study. All finished the
study. Clinical patient data is shown in Table 1. An example of the effects of PLR on
haemodynamics in one patient is given in Figure 1. Beat-to-beat systolic, mean and diastolic
blood pressures increase and modulation of the variables by mechanical ventilation decrease
during PLR, associated with no change in HR, an increase in SV and decrease in SVV.
Table 1 Demographic data of the patients.
Patient Gender Type of surgery Ageyears
Weightkg
Lengthcm
Propofolmg.h-1
Inotropic supportμg.kg-1.min-1
1 m AVR 52 80 160 250 0.25 nitroprusside
2 m AVR 79 82 178 140
3 m AVR 61 73 186 1504,0 dobutamin, 0,02 norepinephrine
4 m CABG 72 97 178 200
5 f AVR 35 86 169 350
6 m CABG 65 69 170 220
7 m CABG 78 103 182 200
8 m CABG 56 118 178 250
9 m AVR 58 88 178 150
10 f CABG 69 73 158 200 3 dopamine
11 m CABG 53 95 178 300
12 m CABG 67 83 175 200 2 dobutamine
13 m CABG 75 88 178 250
14 m CABG, MVP, TVP 54 100 187 200 0.75 nitroprusside
15 f CABG, AVR 59 59 158 150
16 m CABG 80 74 172 200 0.3 norepinephrine
17 m CABG 66 72 183 200
18 m CABG 63 66 160 220
19 m AVR 62 106 176 250 0.25 nitroprusside
20 m CABG, MVP, TVP 73 71 175 200 0.5 enoximone
Mean ± SD 64 ± 11 84 ± 15 174 ± 9 214 ± 52
Abbreviations: CABG is coronary artery by-pass grafting; AVR is aortic valve replacement, TVP is tricuspid valve replacement; MVP; mitral valve replacement.

(187
Figure 1 Beat-to-beat changes in hemodynamic variables by passive leg raising (PLR). Syst, MAP and Dias are
systolic, mean and diastolic arterial blood pressure respectively; HR, heart rate; SV stroke volume
A Kolmogorov-Smirnov test indicated normal distributions of all hemodynamic data.
Compared to baseline (Table 2), PLR increased COtd, COm, COli, MAP, PP, SP and CVP,
decreased SVV and PPV, and had no effect on HR. All 20 subjects behaved in a qualitatively
similar fashion to the one subject’s example, Figure 1. Although COtd increased in all
patients, COm increased in 19 of 20, COli increased in 15 of 20. Furthermore, MAP
increased in 19 of 20, SP in 19 of 20, PP in 18 of 20, CVP in 18 of 20, HR increased in 5 and
decreased in 7 out of 20 subjects. SVVm and SVVli decreased in 16 and 17 out of 20,
respectively whereas PPV decreased in 18 out of 20.
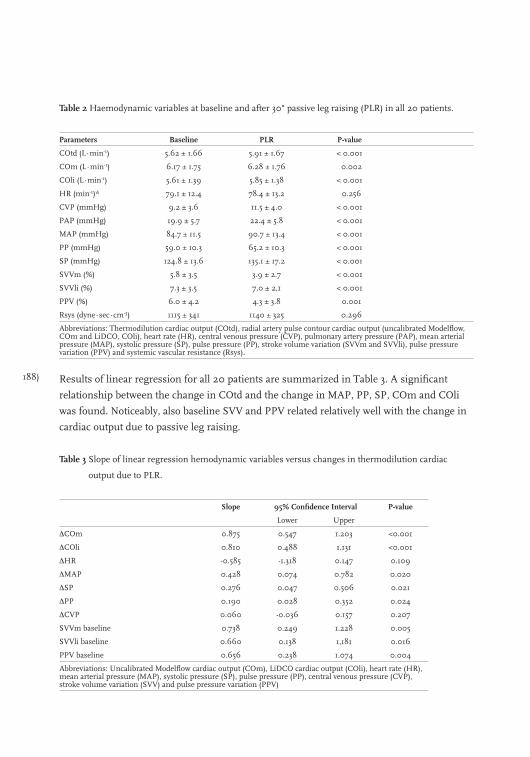
188)
Table 2 Haemodynamic variables at baseline and after 30° passive leg raising (PLR) in all 20 patients.
Parameters Baseline PLR P-value
COtd (L∙min-1) 5.62 ± 1.66 5.91 ± 1.67 < 0.001
COm (L∙min-1) 6.17 ± 1.75 6.28 ± 1.76 0.002
COli (L∙min-1) 5.61 ± 1.39 5.85 ± 1.38 < 0.001
HR (min-1)* 79.1 ± 12.4 78.4 ± 13.2 0.256
CVP (mmHg) 9.2 ± 3.6 11.5 ± 4.0 < 0.001
PAP (mmHg) 19.9 ± 5.7 22.4 ± 5.8 < 0.001
MAP (mmHg) 84.7 ± 11.5 90.7 ± 13.4 < 0.001
PP (mmHg) 59.0 ± 10.3 65.2 ± 10.3 < 0.001
SP (mmHg) 124.8 ± 13.6 135.1 ± 17.2 < 0.001
SVVm (%) 5.8 ± 3.5 3.9 ± 2.7 < 0.001
SVVli (%) 7.3 ± 3.5 7,0 ± 2,1 < 0.001
PPV (%) 6.0 ± 4.2 4.3 ± 3.8 0.001
Rsys (dyne∙sec∙cm-5) 1115 ± 341 1140 ± 325 0.296
Abbreviations: Thermodilution cardiac output (COtd), radial artery pulse contour cardiac output (uncalibrated Modelflow, COm and LiDCO, COli), heart rate (HR), central venous pressure (CVP), pulmonary artery pressure (PAP), mean arterial pressure (MAP), systolic pressure (SP), pulse pressure (PP), stroke volume variation (SVVm and SVVli), pulse pressure variation (PPV) and systemic vascular resistance (Rsys).
Results of linear regression for all 20 patients are summarized in Table 3. A significant
relationship between the change in COtd and the change in MAP, PP, SP, COm and COli
was found. Noticeably, also baseline SVV and PPV related relatively well with the change in
cardiac output due to passive leg raising.
Table 3 Slope of linear regression hemodynamic variables versus changes in thermodilution cardiac
output due to PLR.
Slope 95% Confidence Interval P-value
Lower Upper
∆COm 0.875 0.547 1.203 <0.001
∆COli 0.810 0.488 1.131 <0.001
∆HR -0.585 -1.318 0.147 0.109
∆MAP 0.428 0.074 0.782 0.020
∆SP 0.276 0.047 0.506 0.021
∆PP 0.190 0.028 0.352 0.024
∆CVP 0.060 -0.036 0.157 0.207
SVVm baseline 0.738 0.249 1.228 0.005
SVVli baseline 0.660 0.138 1,181 0.016
PPV baseline 0.656 0.238 1.074 0.004
Abbreviations: Uncalibrated Modelflow cardiac output (COm), LiDCO cardiac output (COli), heart rate (HR), mean arterial pressure (MAP), systolic pressure (SP), pulse pressure (PP), central venous pressure (CVP), stroke volume variation (SVV) and pulse pressure variation (PPV)
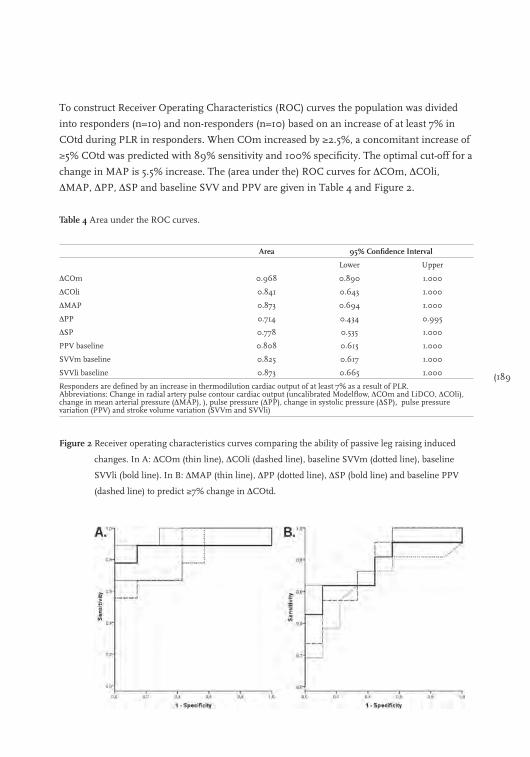
(189
To construct Receiver Operating Characteristics (ROC) curves the population was divided
into responders (n=10) and non-responders (n=10) based on an increase of at least 7% in
COtd during PLR in responders. When COm increased by ≥2.5%, a concomitant increase of
≥5% COtd was predicted with 89% sensitivity and 100% specificity. The optimal cut-off for a
change in MAP is 5.5% increase. The (area under the) ROC curves for ∆COm, ∆COli,
∆MAP, ∆PP, ∆SP and baseline SVV and PPV are given in Table 4 and Figure 2.
Table 4 Area under the ROC curves.
Area 95% Confidence Interval
Lower Upper
∆COm 0.968 0.890 1.000
∆COli 0.841 0.643 1.000
∆MAP 0.873 0.694 1.000
∆PP 0.714 0.434 0.995
∆SP 0.778 0.535 1.000
PPV baseline 0.808 0.615 1.000
SVVm baseline 0.825 0.617 1.000
SVVli baseline 0.873 0.665 1.000
Responders are defined by an increase in thermodilution cardiac output of at least 7% as a result of PLR.Abbreviations: Change in radial artery pulse contour cardiac output (uncalibrated Modelflow, ∆COm and LiDCO, ∆COli), change in mean arterial pressure (∆MAP), ), pulse pressure (∆PP), change in systolic pressure (∆SP), pulse pressure variation (PPV) and stroke volume variation (SVVm and SVVli)
Figure 2 Receiver operating characteristics curves comparing the ability of passive leg raising induced
changes. In A: ∆COm (thin line), ∆COli (dashed line), baseline SVVm (dotted line), baseline
SVVli (bold line). In B: ∆MAP (thin line), ∆PP (dotted line), ∆SP (bold line) and baseline PPV
(dashed line) to predict ≥7% change in ∆COtd.
190)
Discussion
We showed that PLR with 30° of both legs produced a rapid increase of COtd associated with
a proportional increase in COm, COli, MAP, PP and SP (Table 2). Furthermore, we found
significant relationships between the change in COtd and the change in COm, COli, MAP,
PP and SP. Our PP results confirm and extend the results of Boulain et al. and support their
conclusion that PLR induced changes in PP predict the response to fluid loading [1]. Our
results also support the hypothesis of DeBacker and Pinsky that changes in pulse contour
derived cardiac output due to PLR can be used to assess preload in cardiothoracic surgery
patients [8]. Changes in COm tend to a slightly better predictive value than changes in MAP
and COli, or baseline SVV and PPV, these differences are not statistically significant.
Our findings concur with data previously reported by de Wilde et al. [10]. who showed that
Modelflow pulse contour has lower limits of agreement and a better correlation coefficient
for the regression of changes in CO with changes in thermodilution CO compared to the
LiDCO’s technique. Furthermore, in another report de Wilde et al.[15] showed superior results
of uncalibrated Modelflow compared to auto-calibrated FloTrac-Vigileo and HemoSonic in
tracking changes in cardiac output.
Continuous measurements of COm are more feasible than oesophageal Doppler CO and left
ventricular stroke area since these methods are not routinely performed and the quality of
measurement is dependant on the expertise of the observer. Also passive raising of the legs
may interfere with the echocardiographic image.
To compare the effects of PLR on MAP, PP, SP, COm, COli and baseline SVVm, SVVli and
PPV we separated responders from non-responders by setting the cut-off level for COtd
change to 7%, considering the described effect of PLR from supine position [3] and the
precision of our thermodilution method. Next, the reliability to predict preload dependency
by changes in COm, COli, MAP, PP, SP due to PLR and baseline SVV and PPV was
evaluated by calculating the area under the ROC curves. No statistical differences between
the the AUC of the ROC curves for COm, COli, PPV and SVV were found. This uniformity
might be explained by the fact that all predictors have the same radial arterial pressure
source. However, the COm and COli techniques use different algorithms, therefore, some of
the agreement must reflect similar accuracy of the two techniques.
In a large two-center study Monnet and co-authors [2] included 71 general ICU patients of
which 31 had spontaneous breathing activity and/or arrhythmias. In the group of ventilator
dependent patients they showed, by using the HemoSonic ultrasound system, that a PLR
induced increase of aortic blood flow ≥ 10% predicted the effect of a 500 ml fluid load
responsiveness with a 97% sensitivity and 94% specificity. Whereas a PLR induced increase
in PP ≥ 12% had a 60% sensitivity and 85% specificity. In the patients with spontaneous

(191
breathing activity the sensitivity and specificity were 88% and 93% for the aortic blood flow
and as poor as 75% and 46% for PP. Other studies [3,5,6] confirmed that PLR predicts fluid
responsiveness. Essential to the use of the PLR procedure to assess preload responsiveness
is the need of a fast responding cardiac output method during the manoeuvre (Figure 1). The
studies mentioned above used Doppler ultrasound techniques, however, these techniques
may not be routinely performed or widely available. In addition, the quality of measurement
is dependant on the expertise of the observer. Our results with beat-to-beat pulse contour
cardiac output in patients after cardiac surgery agree with the results of Monnet et al.
obtained with HemoSonic Doppler aortic blood flow (ABF) [2]. Therefore, measurement of
pulse contour CO seems interchangeable with ultrasound ABF and may supplant it as was
hypothesized by DeBacker and Pinsky [8].
We showed that various hemodynamic changes in response to PLR, such as COli, PP, MAP,
COm can predict a positive CO response to PLR. The response to PLR can probably, in most
circumstances, be used as a surrogate for response to fluid loading, because of its high
sensitivity and specificity. We expected PLR to mimic a reversible fluid loading of
approximately 250-300 ml. However, it is unsure whether the volemic status of a patient will
change the volume of autotransfusion by PLR. We did not follow our initial measures with
volume challenges because all the patients were deemed to be haemodynamically stable, and
thus not needed further fluid resuscitation.
Our study confirms that baseline SVV and change in COm and COli by PLR can be used to
predict preload dependence in patients receiving mechanical ventilation. Since COm and
COli can also be measured in normal breathing patients, we expect that COm and COli are
more appropriate candidates to predict preload dependence during PLR in these patients.
However, further study is needed into the reliability in spontaneous breathing patients.
Differences exist in the implementation of the PLR procedure between studies [2,3,6]. These
differences could interfere with a direct comparison of our results with beat-to-beat pulse
contour and Doppler ultrasound cardiac output measurements. In our study, patients
remain in a supine position throughout the protocol and only the legs are raised. The heart
and baroreceptors are in-level and do not change, thus, blood pressure transducers do not
have to be re-referenced resulting in a constant quality for pulse contour cardiac
measurement. In half of the Doppler ultrasound studies [2,5,6], the patient moved from a
semi-recumbent position (45o) to a position with the lower limbs raised to 45o while the
patient’s trunk was lowered to supine position. This approach was probably chosen to keep
the ultrasound probe in position but it changes the position of the baroreceptors in relation
to the heart. Since heart rate was unchanged, this change in position may be considered as
unimportant. Although, these differences may influence the comparability between studies
we did not observed large differences.

192)
Conclusions
In stable CABG patients under mechanical ventilation after cardiac surgery a correlation was
observed between changes in method of the arterial pulse contour and thermodilution
techniques. Preload reserve or responsiveness could therefore be determined. Further
studies are necessary to determine the usefulness of these techniques in situations of shock
or hemodynamic instability.

(193
References
1. Boulain T, Achard JM, Teboul JL, et al. Changes in BP induced by passive leg raising predict response to
fluid loading in critically ill patients. Chest 2002; 121(4): 1245-1252.
2. Monnet X, Rienzo M, Osman D, et al. Passive leg raising predicts fluid responsiveness in the critically ill.
Crit Care Med 2006; 34(5): 1402-1407.
3. Lafanechere A, Pene F, Goulenok C, et al. Changes in aortic blood flow induced by passive leg raising predict
fluid responsiveness in critically ill patients. Crit Care 2006; 10(5): R132.
4. Cannesson M, Slieker J, Desebbe O, et al. Prediction of fluid responsiveness using respiratory variations in
left ventricular stroke area by transesophageal echocardiographic automated border detection in
mechanically ventilated patients. Crit Care 2006; 10(6): R171.
5. Maizel J, Airapetian N, Lorne E, et al. Diagnosis of central hypovolemia by using passive leg raising.
Intensive Care Med 2007; 33(7): 1133-1138.
6. Lamia B, Ochagavia A, Monnet X, et al. Echocardiographic prediction of volume responsiveness in critically
ill patients with spontaneously breathing activity. Intensive Care Med 2007; 33(7): 1125-1132.
7. de Vaal JB, de Wilde RB, van den Berg PC, et al. Less invasive determination of cardiac output from the
arterial pressure by aortic diameter-calibrated pulse contour. Br J Anaesth 2005; 95(3): 326-331.
8. De Backer D, Pinsky MR. Can one predict fluid responsiveness in spontaneously breathing patients?
Intensive Care Med 2007; 33(7): 1111-1113.
9. Jansen JR, Schreuder JJ, Settels JJ, et al. An adequate strategy for the thermodilution technique in patients
during mechanical ventilation. Intensive Care Med 1990; 16(7): 422-425.
10. de Wilde RB, Schreuder JJ, van den Berg PC, et al. An evaluation of cardiac output by five arterial pulse
contour techniques during cardiac surgery. Anaesthesia 2007; 62(8): 760-768.
11. Linton NW, Linton RA. Estimation of changes in cardiac output from the arterial blood pressure waveform
in the upper limb. Br J Anaesth 2001; 86(4): 486-496.
12. Wesseling KH, Jansen JR, Settels JJ, et al. Computation of aortic flow from pressure in humans using a
nonlinear, three-element model. J Appl Physiol 1993; 74(5): 2566-2573.
13. Lasko TA, Bhagwat JG, Zou KH, et al. The use of receiver operating characteristic curves in biomedical
informatics. J Biomed Inform 2005; 38(5): 404-415.
14. Reuter DA, Bayerlein J, Goepfert MS, et al. Influence of tidal volume on left ventricular stroke volume
variation measured by pulse contour analysis in mechanically ventilated patients. Intensive Care Med 2003;
29(3): 476-480.
15. de Wilde RB, Geerts BF, Cui J, et al. Performance of three minimally invasive cardiac output monitoring
systems. Anaesthesia 2009; 64(7): 762-769.

194)

(195
Chapter 13
The Respiratory Systolic Variation Test to predict fluid loading responsiveness
Bart Geerts, Rob de Wilde, Leon Aarts and Jos Jansen
196)
Especially in cardiac surgery patients, unnecessary fluid loading can lead to general and
pulmonary oedema, and prolong hospitalization [1]. Several traditional and dynamic
parameters have been studied for the predictive value to fluid loading responsiveness (FLR,
i.e. an increase in CO) but no gold standard exists.
Preisman and colleagues studied a Respiratory Systolic Variation Test (RSVT) in 18
mechanically-ventilated patients undergoing cardiac surgery to predict FLR with a increase
in CO of at least 15% after 250 ml fluid loading [2]. The RSVT consists of three successive
incremental-pressure-controlled inspiratory breaths (10, 20 and 30 cmH2O) of 1.5 seconds [2].
The lowest systolic blood pressure for each breath is plotted against their respective airway
pressure, Figure 1. The slope of this plot is the RSVT-value, and is suggested to increase with
hypovolaemia and decrease with fluid loading [2,3]. RSVT is reported to predict FLR with high
sensitivity and specificity [2]. However, the RSVT were applied manually and no control group
was used. We developed a semi-automated RSVT procedure and tested transferability of the
RSVT with a threshold of 0.51 mmHg∙cmH2O-1 in independent group of patients to predict
FLR.
Methods
Fourteen patients undergoing elective-cardiac surgery were included after approval of the
institutional ethics committee and personal informed consent was obtained. Prior to surgery,
each patient received a pulmonary artery catheter (Intellicath; Edwards Lifesciences; Irvine,
CA, USA) to measure CO and CVP, and a 20 G radial artery catheter to measure arterial
pressure (Prad).
Patient’s anaesthesia was continued with propofol-target-control infusion and sufentanil in
the ICU. The lungs were mechanically ventilated (Draeger, Evita 4, Lubeck, Germany) in a
pressure-control mode with standard settings (12 breaths∙min-1, tidal volume 8-10 ml∙kg-
1∙min-1, FiO2 40%, PEEP 5 cmH2O). To perform the RSVT semi-automatic we putted the
ventilator under computer control. Airway pressure (Paw) was measured at the proximal end
of the endotracheal tube.
The radial artery pressure (Prad) was analysed with the Modelflow program (FMS,
Amsterdam, the Netherlands) to provide beat-to-beat values of systolic blood pressure (Psys),
MAP, HR and to determine pulse pressure variation (PPV) over 30 second intervals [4].
Thermodilution cardiac output (COtd) was obtained as averaged value of three
thermodilution measurements performed equally spread over the ventilatory cycle [5].
During the observation period the patients maintained the supine position. Use of sedative
and vascular medication remained unchanged. No fluids were administered during the
observation period outside the study protocol.
The 1.5 second RSVT procedure and COtd, MAP, Psys, PPV, HR and CVP measurements
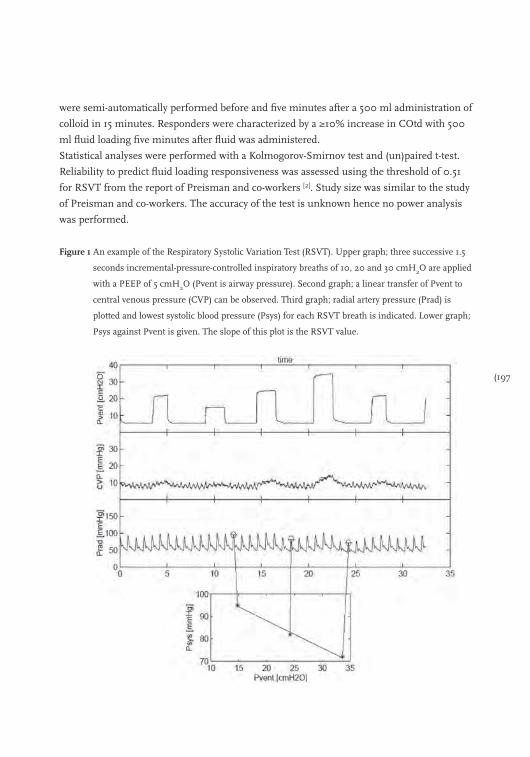
(197
were semi-automatically performed before and five minutes after a 500 ml administration of
colloid in 15 minutes. Responders were characterized by a ≥10% increase in COtd with 500
ml fluid loading five minutes after fluid was administered.
Statistical analyses were performed with a Kolmogorov-Smirnov test and (un)paired t-test.
Reliability to predict fluid loading responsiveness was assessed using the threshold of 0.51
for RSVT from the report of Preisman and co-workers [2]. Study size was similar to the study
of Preisman and co-workers. The accuracy of the test is unknown hence no power analysis
was performed.
Figure 1 An example of the Respiratory Systolic Variation Test (RSVT). Upper graph; three successive 1.5
seconds incremental-pressure-controlled inspiratory breaths of 10, 20 and 30 cmH2O are applied
with a PEEP of 5 cmH2O (Pvent is airway pressure). Second graph; a linear transfer of Pvent to
central venous pressure (CVP) can be observed. Third graph; radial artery pressure (Prad) is
plotted and lowest systolic blood pressure (Psys) for each RSVT breath is indicated. Lower graph;
Psys against Pvent is given. The slope of this plot is the RSVT value.

198)
Results
Fourteen patients (10 male) of 63 ± 10 years, 86 ± 15 kg and 175 ± 9 cm were included.
Eleven patients received straightforward CABG and three received single valve repair with or
without CABG.
Data was normally distributed. CO, CVP and MAP increased due to fluid administration. HR
did not change and PPV and RSVT-values decreased (Table 1). CO increased with 34% in
responders (n=9) and did not change in non-responders (n=5). An RSVT with a threshold of
0.51 predicted responders and non-responders correctly in 78% of the patients (sensitivity
78%, specificity 60%, positive predictive value 78%, and negative predictive value 60%). A
PPV of 10% (conform Preisman’s 9.4%) would have missed one responder; sensitivity 90%,
specificity 100%, positive predictive value 100% and negative predictive value 80%.
Table 1 Changes in hemodynamic parameters from baseline to after 500 ml fluid loading for all patients,
responders and non-responders.
Parameters All patients Responders Non-responders
Baseline 500 ml P value Baseline 500 ml P value Baseline 500 ml P value
COtd (L∙min-1) 5.6 ± 1.5 6.8 ± 1.6 0.002 5.3 ± 1.1 7.0 ± 1.4 0.001 6.3 ± 1.9 6.4 ± 2.1 0.384
MAP (mmHg) 84.1 ± 22.3 94.3 ± 18.1 0.021 86.0 ± 27.0 97.3 ± 21.1 0.074 80.7 ± 11.7 89.0 ± 10.6 0.187
HR (min-1) 81 ± 16 78 ± 14 0.075 86 ± 16 82 ± 12 0.120 72 ± 14 71 ± 15 0.313
CVP (mmHg) 9.2 ± 3.2 11.4 ± 2.8 0.001 9.6 ± 1.8 11.6 ± 1.6 0.007 8.4 ± 5.0 11.0 ± 4.4 0.107
RSVT (mmHg∙cmH2O
-1) 0.96 ± 1.02 0.57 ± 0.80 0.003 0.86 ± 0.47 0.41 ± 0.33 0.007 1.15 ± 1.69 0.86 ± 1.30 0.229
PPV (%) 14.8 ± 9.2 7.2 ± 4.9 0.004 17.4 ± 8.5 7.0 ± 3.4 0.007 10.0 ± 9.3 7.6 ± 7.4 0.136
Thermodilution cardiac output (COtd), mean arterial pressure (MAP), heart rate (HR), central venous pressure (CVP), Respiratory Systolic Variation Test (RSVT) and pulse pressure variation (PPV).
Discussion
In response to earlier publications of Preisman and co-workers [2], we evaluated the RSVT in
an independent group of post cardiac surgery patients and found RSVT with a threshold of
0.51 reliable in predicting responders and non-responders. To perform semi-automated
RSVT manoeuvres we put the ventilator under computer control. Preisman and colleague’s
characterized responders by a ≥15% change in CO after 250 ml of fluid loading [2]. We used
500 ml since this is more broadly used in FLR research [6-9]. Apparently, this difference in
characterizing responders has no impact on the RSVT threshold of 0.51.
Several considerations have to be mentioned. First, RSVTs can only be measured in patients
on mechanical ventilation with an arterial catheter and without arrhythmias [10]. Second, it is
not unimaginable that pathologic states of the lung like COPD or ARDS influence the
reliability of the test because the change in lung compliance may have an impact on the

(199
transmission of alveolar to intra-thoracic pressure [11]. Third, changes in vasomotor tone
during progression of sepsis, brain injury and peripheral vascular disease could influence
clinical use of the RSVT as a hemodynamic monitoring tool. Fourth, one can imagine that
during very low cardiac output states application of an RSVT can cause a brief reduction in
venous return and hence further reduce CO. Fifth, only a small number of patients have
been studied. The RSVT technique has to be further evaluated in other subgroups.
Conclusions
We showed that the RSVT procedure is transferable and feasible to predict fluid loading
responsiveness. The advantage of the RSVT is that it is not affected by tidal volume and
breathing frequency like PVV.

200)
References
1. Chappell D, Jacob M, Hofmann-Kiefer K, Conzen P, Rehm M. A rational approach to perioperative fluid
management. Anesthesiology 2008; 109: 723-40.
2. Preisman S, Kogan S, Berkenstadt H, Perel A. Predicting fluid responsiveness in patients undergoing
cardiac surgery: functional haemodynamic parameters including the Respiratory Systolic Variation Test and
static preload indicators. Br J Anaesth 2005; 95: 746-55.
3. Perel A, Minkovich L, Preisman S, et al. Assessing fluid-responsiveness by a standardized ventilatory
maneuver: the respiratory systolic variation test. Anesth Analg 2005; 100: 942-5.
4. Jansen JR, Schreuder JJ, Mulier JP, et al. A comparison of cardiac output derived from the arterial pressure
wave against thermodilution in cardiac surgery patients. Br J Anaesth 2001; 87: 212-22.
5. Jansen JR, Schreuder JJ, Settels JJ, Kloek JJ, Versprille A. An adequate strategy for the thermodilution
technique in patients during mechanical ventilation. Intensive Care Med 1990; 16: 422-5.
6. Lee JH, Kim JT, Yoon SZ, et al. Evaluation of corrected flow time in oesophageal Doppler as a predictor of
fluid responsiveness. Br J Anaesth 2007; 99: 343-8.
7. Wagner JG, Leatherman JW. Right ventricular end-diastolic volume as a predictor of the hemodynamic
response to a fluid challenge. Chest 1998; 113: 1048-54.
8. Solus-Biguenet H, Fleyfel M, Tavernier B, et al. Non-invasive prediction of fluid responsiveness during major
hepatic surgery. Br J Anaesth 2006; 97: 808-16.
9. Kumar A, Anel R, Bunnell E, et al. Pulmonary artery occlusion pressure and central venous pressure fail to
predict ventricular filling volume, cardiac performance, or the response to volume infusion in normal
subjects. Crit Care Med 2004; 32: 691-9.
10. Guz A, Innes JA, Murphy K. Respiratory modulation of left ventricular stroke volume in man measured
using pulsed Doppler ultrasound. J Physiol 1987; 393: 499-512.
11. Chemla D, Hebert JL, Coirault C, et al. Total arterial compliance estimated by stroke volume-to-aortic pulse
pressure ratio in humans. Am J Physiol 1998; 274: H500-H505.

(201

202)
Section 5
Discussion and conclusions

(203
Chapter 14
Discussion; fluid loading responsiveness and how can we use it?
Bart Geerts, Johan Groeneveld, Leon Aarts and Jos Jansen
204)
A wide array of variables is available to the ICU and OR physician to assess the
hemodynamic state of a patient. Urinary output, skin colour, capillary refill, mean arterial
pressure, central venous pressure, heart rate, mixed venous oxygen saturation and pulse
pressure are just a few of these variables and their number keeps rising [1,2]. However, it is
still not possible to accurately detect hypovolaemia or hypervolaemia [3]. Overzealous fluid
administration can increase the incidence of infections, anastomosal leakage, general and
pulmonary oedema. This complicates hemodynamic management since unnecessary fluid
loading can increase hospital stay and even mortality [4,5] Several strategies exist to decrease
the likelihood of hypervolaemia and at the same time select patients that may require fluid
loading, pharmacological support or both.
Fluid loading responsiveness
No gold standard exists to guide hemodynamic management. Fluid loading responsiveness
(FLR) is a relatively novel strategy and has received wide attention. In general, fluid loading
responsiveness can be described as the response of cardiac output (CO) on an intra-vascular
administration of a certain amount of fluid. Responders are defined as those patients that
increase their cardiac output above a threshold value after this volume loading [6]. It is
assumed that increasing cardiac output will lead to an increase in flow and oxygen transport
to vital organs consequently. Thus, FLR aims to optimize perfusion and oxygen delivery to
vital organs like brain, heart and kidneys. FLR does not specifically lead to the diagnosis of
strict hypovolaemia or normovolaemia. Fluid loading responsiveness is more likely to signal
that a patient is functioning on or near the flat part of the Frank Starling curve. Identifying a
responder with FLR indicates that fluid will likely cause an improvement of the
hemodynamics of the patient with less chance of overfilling.
The working point of the circulation of an ICU patient can be described by the intersection
of both the venous return curve and the Frank Starling curve. The venous return curve of a
patient shifts upward during hypervolaemia and shifts parallel downwards during
hypovolaemia. Whereas, the Frank Starling curve is influenced by neurological and humoral
control mechanisms, vascular and cardiac function. Hence, the working point of the
circulation changes continuously due to changes in the administration of parenteral fluids,
airway pressure and changing renal, cardiac and vascular function [7]. This stresses the need
for a continuous or repeated determination of fluid-requirements.
However, a practical consensus over the definition of fluid loading responsiveness is missing
and therefore the definition of FLR differs widely in the available literature. Even more
important is the ability to predict FLR, i.e. responders and non-responders without the
administration of fluids. The idea behind predicting FLR is that overall fluid administration
will decrease. To our knowledge no study exists to date that studies the impact of FLR or
(205
prediction of FLR on outcome. Thus, more elaborate research is needed. But first we have to
develop a uniform definition of FLR to be able to compare the results of FLR research.
Second, we will need to come up with a workable algorithm to predict FLR and to guide fluid
management in a patient followed by a study of its effect on outcome. In this manuscript we
will discuss different dimensions to fluid loading responsiveness and its possible use in
everyday practice.
Pitfalls in Determining Fluid Loading Responsiveness
No consensus exists how to assess FLR. The amount of fluid used to assess FLR varies
between 7 ml∙kg-1 [8] and 20 ml∙kg-1 [9], or 250 ml [10] and 1000 ml [11]. It is easy to imagine
that if instead of 250 ml 1000 ml is administered the change in CO can be expected to be
larger. The amount of fluid administrated to determine FLR should be weight adjusted to
allow for comparison of inter-individual and inter-study results. A 5 ml∙kg-1 bolus should
illicit a significant change in CO in responders. For instance this would be a 500 ml bolus in
a 100 kg man or a 250 ml in a 50 kg fragile elderly lady.
Directly related to this, is the type of fluid that is used for administration. The composition
of a fluid does not only determine the time that it will be present in the intravascular
compartment but also the amount of fluid recruited from the extra-vascular compartment.
Prather et al. [12] showed that colloids remain in the intravascular compartment for more than
two hours and even attract fluids from the extravascular compartments where crystalloids
tend to disappear within 80 minutes in dogs. Consequently, we have to point out the
importance of the duration of the administration of fluid and timing of the measurement of
CO. This directly influences the number of responders, i.e. the number of responders is
expected to be larger if CO is measured directly after fluid bolus administration instead of
60 minutes after a 60 minute infusion. This issue will be less relevant when fluids are
administered within 5 minutes and CO is measured within several minutes.
Different parameters are used to define (non)responders; cardiac output, stroke volume,
stroke volume index, left ventricular end-diastolic area index, cardiac index and aortic blood
flow velocity. The effect of fluid loading can be described as a move of the working point to
the right on the Frank-Starling curve. When the heart operates on the ascending part of the
curve cardiac output will increase more in response to fluid loading (responder) than if the
heart already operates near the flat part of the curve. We advocate the use of the change in
cardiac output to determine (non)responders since it is one of few parameters likely to
correlate to (vital) organ perfusion, it is a robust parameter, and CO is one of two factors to
describe the Frank-Starling curve. The Frank Starling principle is based on the fiberlength-
contractility relationship within the ventricle. If ventricular end-diastolic volume (preload) is
increased ventricular fiberlength is also increased, resulting in an increased ‘tension’ of the
206)
muscle and an increased contraction length.
Another factor directly influencing the number of responders is the cut-off value. The cut-off
to discriminate between responders and non-responders after a fluid challenge varies
between 5% and 25% change in CO [10,13]. Since the precision and accuracy of cardiac output
measurement technique directly determines the clinical significance, we would like to relate
the technique to measure CO to the cut-off value and the amount of administered fluid [14].
Previously, Critchley and Critchley [15] concluded that a new method was allowed to replace
the gold standard when repeatability was within twice the standard deviation (2SD) of the
gold standard method. Cecconi et al. discussed that the coefficient of variance (CV) was to be
used [16]. They advised only to use a new CO method clinically when CV is below 10% (or
clinically significant in their words). However, studies on the accuracy of different CO
methods to determine changes (after an intervention) are scarce or lacking. Moreover, it is
disputable that the assessment of agreement of CO methods as put forth by Critchley and
Cecconi can be used for this purpose. Data by de Wilde and co-workers suggest that pulse
contour methods (Modelflow and possibly LidCO) track changes in thermodilution cardiac
output more accurately than suggested by earlier repeatability data [17]. We found that a 4.3%
change in Modelflow CO after 100 ml fluid administration accurately predicts fluid loading
responsiveness.
Jansen et al. reported a precision of 3.5% for thermodilution cardiac output to determine
(genuine) CO [18]. Henceforth, a cut-off for triplicate thermodilution CO would be between
3.5% and 7%. Thus, our data indicates that lower cut-off values can be used (or more fluid
has to be administered than with thermodilution) than the previously used 20%. We,
therefore, advocate the use of different cut-off values based on the methods used to assess
CO and their accuracy to track changes in cardiac output. We also advocate the use of a
limited number of CO measurement techniques in FLR research. Only those measurement
techniques that (have) prove(n) to be precise and accurate can be used.
Prediction of FLR
The aim of predicting FLR is to achieve the most adequate or optimal cardiac output with the
least amount of fluids. In the prediction of FLR three major shortcomings are to be solved.
First, an unambiguous definition of FLR is needed (see the discussion above). Second, errors
related to the calculation and use of various predictors like LVEDA, SVV, PVV and changes
on challenges like PLR and PEEP need to be quantified. Third, patient characteristics have to
be taken into consideration to select a suitable parameter for FLR prediction. Forth,
reliability of statistical analysis to compute the sensitivity, specificity and the threshold value
to define responders and non-responders must be defined.
(207
Echographic and Dynamic Parameters to Predict FLR
In theory, echographically determined volume parameters of the heart are supposed to be
highly reliable predictors of FLR. The volume changes within the heart or vena cava are
directly linked to cardiac function; when wall movement is limited inotropic assistance is
warranted. And when filling of the ventricles is not optimal, fluid administration is
indicated. Study results are very promising [19]. Several factors may, however, frustrate these
results. Operator-related factors, like level of experience, changes in probe position and
intermittent application, greatly influence the reliability and robustness of echographic
monitoring [20]. The predictive value for FLR of echographic parameters in patients receiving
mechanical ventilation seems to outscore the results for these parameters in spontaneously-
breathing patients [21].
These operator- and patient-bound factors influence the accuracy to predict FLR. We
highlight the results of the most studied parameters here; results for left ventricular
end-diastolic area (LVEDA) [22-26] vary with sensitivity reported to be between 60 to 89%,
specificity between 58 and 91% and the AUC of the ROC curve between 0.24 ± 0.11 and 0.78
(95% CI between 0.59 and 0.97) [23,26]. For global end-diastolic volume index (GEDVI) [13,27-29]
the AUC of the ROC curves is between 0.23 and 0.70 (0.46-0.94) [28,29].
In recent years, new variables based on heart-lung interaction, i.e. respiratory-induced stroke
volume variation (SVV) and pulse pressure variation (PPV) have been introduced in the ICU.
Pulse pressure (PP) is defined as the beat-to-beat difference between the systolic and the
diastolic pressure. PPV is the amplitude of cyclic changes induced by mechanical ventilation.
The variations in PP and stroke volume induced by mechanical ventilation have been linked to
volume status [30]. PPV is thought to be directly proportional to stroke volume variation [31]. The
reliability for SVV and PPV varies from lower sensitivity and specificity of 70% to over 90% to
predict FLR. Although SVV is a direct measure of variation in cardiac output, results for SVV
show a wider spread [13,32,33]. Even though PPV is used as an indirect measure for SVV, results
for PPV seem superior which may be especially true in septic patients [34], where vasoplegia is
less likely to cause a reliable SVV measurement result. We need to consider that the calculation
of SVV requires beat-to-beat SV measurements using a pulse contour analysis algorithm
whereas PPV is measured directly from the arterial waveform. SVV will require an ongoing
validation in clinic conditions as algorithms are developing with time [35]. In that context it is
noteworthy that more recent publications report lower area under the ROC curves than older
publications. Whether this depends on publication bias, a decrease in the accuracy of newer
pulse-contour methods to determine SVV or more frequent improper use remains uncertain.
Several restrictions apply to the use of dynamic parameters. Cardiac arrhythmias
significantly decrease the reliability of SVV and PPV [20]. The use of these dynamic
parameters has been validated in sedated and mechanically ventilated patients without
208)
spontaneous breathing activity. Third, SVV, and probably PPV, is not only influenced by
intravascular volume but also by the depth of the tidal volume used in mechanical
ventilation of the lungs [26].
Patient Characteristics, Challenges and FLR
When FLR is assessed patient (co)morbidity is of importance to select the most reliable
parameter. For SVV, PPV and LVEDA determinations the limitations are reasonably well
described (see above). For several disease states, however, we do not know yet how they
influence the reliability of a parameter to predict FLR. For instance, we do not know what the
influence of right ventricular dysfunction has on the accuracy of dynamic variables to predict
FLR. In these cases, the use of a challenge could be helpfull.
Reversible autotransfusion by passive leg raising (PLR) and a provocation method with the
application of increased PEEP have also become the subject of intense interest. Particularly,
the groups of Boulain, Monnet and Teboul studied the reliability of parameters during PLR
to predict FLR [36,37]. The robustness and reliability of the “static parameters” during the
challenge can be explained by the direct use of the Starling curve. The working point on the
Frank Starling curve of each individual patient (with its own pathophysiological constitution)
is determined and FLR can be assessed. The amplitude of the change in CO after the
challenge can be used to predict FLR. These challenges are reversible, standardized and
easily performed.
Statistical Testing
Overall receiver operating characteristics (ROC) are used to describe the precision of the
prediction of fluid loading responsiveness. Sensitivity and specificity and threshold values to
identify responders and non-responders on fluid loading are determined for several variables
in a specific population. However, the application of ROC curves also requires secondary
testing in a control population with the earlier found cut-off values in order to determine
reproducibility in similar and different sub-populations. Since reproducibility is only rarely
assessed, straightforward extrapolation of study results is not possible. This also hinders
formulation of a department protocol for bedside use.
A second issue related to statistical analysis in FLR research is related to the size of the study
populations; population size varies between 8 [38] and 60 [39] in reports up to 2010. However,
no study reports on power analysis. Moreover, rarely the significance of the found area under
the ROC curve (AUROC) is reported. Hanley et al. demonstrated the value of statistical
testing between ROC curves [40]. We advocate the use of this test to compare AUROC with
mathematical chance (Test: AUROC ≠ 0.500) and to allow comparison of ROC curves for
different parameters, especially when power analysis are absent.
(209
Conclusions
The restricted use of fluids in the intensive care and operating theatre reduces risk of
complications like pulmonary edema. Targeted infusion strategies have shown to benefit
patients. Fluid loading responsiveness is a novel strategy that aims to optimize perfusion
and oxygen delivery to vital organs. This strategy is likely to signal that a patient is
functioning on or near the flat part of the Frank Starling curve. Predicting fluid loading
responsiveness is described as the use of a hemodynamic variable to predict the effect of a
fluid bolus administration.
FLR research has shown promising results but no consensus exists on the exact definition of
FLR. The amount of fluid, type of fluid, the parameter used to define responders, timing of
the measurement of CO after fluid loading, the cut-off value to define responders and the
cardiac output measurement technique vary widely. Based on these pitfalls and current
knowledge, we propose to define FLR is the use of (a set of) baseline hemodynamic variables
(or a change in a variable after a challenge manoeuvre) to predict a clinically significant
change in cardiac output within 5 minutes after a 5 ml∙kg-1 bolus of a crystalloid or colloid
fluid is administered within 5 minutes. Moreover, the use of an accurate and precise cardiac
output measurement technique to assess FLR is desirable. We advise a cut-off for triplicate
thermodilution CO of 3,5% and for pulse contour CO around 5% change. Consequently, we
can use this explicit classification to define responders and integrate results of different FLR
studies. Until major morbidity and mortality studies have been performed into the LFR
strategy, we advise the use of pulse pressure variation and challenges like passive leg raising
to assess FLR in critically ill patients. Baseline PPV and changes in static filing pressure after
PEEP and PLR challenges have repeatedly shown to predict FLR with high sensitivity and
specificity in different patient populations. However, it remains important to recognize a
patients specific pathophysiology to select the most reliable parameter to predict FLR.

210)
References
1. Michard F, Teboul JL. Using heart-lung interactions to assess fluid responsiveness during mechanical
ventilation. Crit Care 2000; 4: 282-9.
2. Cannesson M, Attof Y, Rosamel P, et al. Respiratory variations in pulse oximetry plethysmographic
waveform amplitude to predict fluid responsiveness in the operating room. Anesthesiology 2007;
106: 1105-11.
3. Hamilton MA. Perioperative fluid management: progress despite lingering controversies. Cleve Clin J Med
2009; 76: S28-S31.
4. Weil MH, Henning RJ. New concepts in the diagnosis and fluid treatment of circulatory shock. Thirteenth
annual Becton, Dickinson and Company Oscar Schwidetsky Memorial Lecture. Anesth Analg 1979;
58: 124-32.
5. Chappell D, Jacob M, Hofmann-Kiefer K, Conzen P, Rehm M. A rational approach to perioperative fluid
management. Anesthesiology 2008; 109: 723-40.
6. Magder S. Fluid status and fluid responsiveness. Curr.Opin.Crit Care 2010; 16: 289-96.
7. Guyton AC, Lindsey AW, Kaufmann BN. Effect of Mean Circulatory Filling Pressure and Other Peripheral
Circulatory Factors on Cardiac Output. AJP - Legacy 1955; 180: 463-8.
8. Barbier C, Loubieres Y, Schmit C, et al. Respiratory changes in inferior vena cava diameter are helpful in
predicting fluid responsiveness in ventilated septic patients. Intensive Care Med 2004; 30: 1740-6.
9. Auler JO, Jr., Galas F, Hajjar L, et al. Online monitoring of pulse pressure variation to guide fluid therapy
after cardiac surgery. Anesth Analg 2008; 106: 1201-6.
10. Breukers RM, Trof RJ, de Wilde RB, et al. Relative value of pressures and volumes in assessing fluid
responsiveness after valvular and coronary artery surgery. Eur J Cardiothorac Surg 2009; 35: 62-8.
11. Heenen S, De Backer D, Vincent JL. How can the response to volume expansion in patients with
spontaneous respiratory movements be predicted? Crit Care 2006; 10: R102.
12. Prather JW, Taylor AE, Guyton AC. Effect of blood volume, mean circulatory pressure, and stress relaxation
on cardiac output. AJP - Legacy 1969; 216: 467-72.
13. Hofer CK, Senn A, Weibel L, Zollinger A. Assessment of stroke volume variation for prediction of fluid
responsiveness using the modified FloTrac and PiCCOplus system. Crit Care 2008; 12: R82.
14. Squara P, Cecconi M, Rhodes A, Singer M, Chiche JD. Tracking changes in cardiac output: methodological
considerations for the validation of monitoring devices. Intensive Care Med. 2009; 35: 1801-8.
15. Critchley LA, Critchley JA. A meta-analysis of studies using bias and precision statistics to compare cardiac
output measurement techniques. J Clin Monit Comput 1999; 15: 85-91.
16. Cecconi M, Rhodes A. Validation of continuous cardiac output technologies: consensus still awaited. Crit
Care 2009; 13: 159.
17. de Wilde RB, Geerts BF, Cui J, van den Berg PC, Jansen JR. Performance of three minimally invasive cardiac
output monitoring systems. Anaesthesia 2009; 64: 762-9.
18. Jansen JR, Schreuder JJ, Settels JJ, Kloek JJ, Versprille A. An adequate strategy for the thermodilution
technique in patients during mechanical ventilation. Intensive Care Med. 1990; 16: 422-5.
19. Poelaert JI, Schupfer G. Hemodynamic monitoring utilizing transesophageal echocardiography: the
relationships among pressure, flow, and function. Chest 2005; 127: 379-90.
20. Michard F, Teboul JL. Predicting Fluid Responsiveness in ICU Patients* : A Critical Analysis of the
Evidence. Chest 2002; 121: 2000-8.
21. Lamia B, Ochagavia A, Monnet X, et al. Echocardiographic prediction of volume responsiveness in critically
ill patients with spontaneously breathing activity. Intensive Care Med 2007; 33: 1125-32.
(211
22. Charron C, Fessenmeyer C, Cosson C, et al. The influence of tidal volume on the dynamic variables of fluid
responsiveness in critically ill patients. Anesth Analg 2006; 102: 1511-7.
23. Cannesson M, Slieker J, Desebbe O, et al. Prediction of fluid responsiveness using respiratory variations in
left ventricular stroke area by transesophageal echocardiographic automated border detection in
mechanically ventilated patients. Crit Care 2006; 10: R171.
24. Solus-Biguenet H, Fleyfel M, Tavernier B, et al. Non-invasive prediction of fluid responsiveness during major
hepatic surgery. Br J Anaesth 2006; 97: 808-16.
25. Lee JH, Kim JT, Yoon SZ, et al. Evaluation of corrected flow time in oesophageal Doppler as a predictor of
fluid responsiveness. Br J Anaesth 2007; 99: 343-8.
26. Reuter DA, Kirchner A, Felbinger TW, et al. Usefulness of left ventricular stroke volume variation to assess
fluid responsiveness in patients with reduced cardiac function. Crit Care Med 2003; 31: 1399-404.
27. Hofer CK, Muller SM, Furrer L, et al. Stroke volume and pulse pressure variation for prediction of fluid
responsiveness in patients undergoing off-pump coronary artery bypass grafting. Chest 2005; 128: 848-54.
28. Huang CC, Fu JY, Hu HC, et al. Prediction of fluid responsiveness in acute respiratory distress syndrome
patients ventilated with low tidal volume and high positive end-expiratory pressure. Crit Care Med 2008;
36: 2810-6.
29. de Waal EE, Rex S, Kruitwagen CL, et al. Dynamic preload indicators fail to predict fluid responsiveness in
open-chest conditions (R3). Crit Care Med. 2009.
30. Versprille A, Jansen JR. Tidal variation of pulmonary blood flow and blood volume in piglets during
mechanical ventilation during hyper-, normo- and hypovolaemia. Pflugers Arch 1993; 424: 255-65.
31. Guyton AC. Textbook of medical physiology. Philidelphia, USA, W.B. Saunders Company, 1996.
32. de Wilde RB, Geerts BF, van den Berg PC, Jansen JR. A comparison of stroke volume variation measured by
the LiDCOplus and FloTrac-Vigileo system. Anaesthesia 2009; 64: 1004-9.
33. Biais M, Nouette-Gaulain K, Cottenceau V, Revel P, Sztark F. Uncalibrated pulse contour-derived stroke
volume variation predicts fluid responsiveness in mechanically ventilated patients undergoing liver
transplantation. Br J Anaesth 2008; 101: 761-8.
34. Perner A, Faber T. Stroke volume variation does not predict fluid responsiveness in patients with septic
shock on pressure support ventilation. Acta Anaesthesiol.Scand. 2006; 50: 1068-73.
35. de Wilde RB, Schreuder JJ, van den Berg PC, Jansen JR. An evaluation of cardiac output by five arterial pulse
contour techniques during cardiac surgery. Anaesthesia 2007; 62: 760-8
36. Monnet X, Rienzo M, Osman D, et al. Passive leg raising predicts fluid responsiveness in the critically ill.
Crit Care Med 2006; 34: 1402-7.
37. Boulain T, Achard JM, Teboul JL, et al. Changes in BP induced by passive leg raising predict response to
fluid loading in critically ill patients. Chest 2002; 121: 1245-52.
38. Bendjelid K, Suter PM, Romand JA. The respiratory change in preejection period: a new method to predict
fluid responsiveness. J Appl Physiol 2004; 96: 337-42.
39. De Backer D, Heenen S, Piagnerelli M, Koch M, Vincent JL. Pulse pressure variations to predict fluid
responsiveness: influence of tidal volume. Intensive Care Med 2005; 31: 517-23.
40. Hanley JA, McNeil BJ. The meaning and use of the area under a receiver operating characteristic (ROC)
curve. Radiology 1982; 143: 29-36.

212)

(213
Chapter 15
Summary
214)
Patients in the intensive care unit (ICU) and in the peri-operative phase are dependent on
physicians and nurses for their fluid intake. Volume status optimization is required to
maximize oxygen delivery to vital organs. Unnecessary fluid administration can, however,
lead to general and pulmonary oedema, cardiac failure, infections, prolonged hospitalization
and death. Besides signs like skin turgor, diuresis and skin colour, hemodynamic
measurements like central venous pressure (CVP) and mean arterial pressure (MAP) are
most often used for hemodynamic management. These parameters, however, often fail to
accurately predict the response of a patient to fluid loading.
Cardiac output (CO) is the amount of blood pumped through the circulation by the heart per
minute. The general conception is that an increase in cardiac output will improve perfusion
of vital organs. Increased flow might also imply improved oxygen delivery to the tissues. This
is the basis of the fluid loading responsiveness strategy (FLR). This strategy aims to prevent
fluid overloading by an accurate prediction of the response in cardiac output to fluid loading.
Arthur Guyton’s work provided an important step forward to the determination of volume
status directly. Together with the shape of cardiac output function curve, dimensions of the
vascular system, blood viscosity and mean systemic filling pressure (MSFP) can be
considered as a primary determinant of venous return and thus cardiac output. Ultimately,
MSFP can be used to calculate stressed volume and, hence, quantify effective volume status
in a specific patient.
In this thesis, we review literature on fluid loading responsiveness research, we try to assess the
impact of literature on hemodynamic management in Dutch ICU’s, we discuss a novel method
to assess mean systemic filling pressure and last we discuss studies performed to assess the
reliability of several challenges to predict FLR; +10 cmH2O PEEP, the fluid challenge, passive
leg raising, the respiratory ventilator manoeuvre and the measurement of baseline MSFP. The
manoeuvres are aimed at determining the working point of the circulation on the Frank-
Starling curve. It is assumed that when the patient is on the ascending portion of the Frank-
Starling curve an (auto)transfusion will increase cardiac output.
Chapter 1
Many methods of cardiac output measurement have been developed, but the number of
methods useful for human studies is limited. The “holy grail” for the measurement of
cardiac output would be a method that is accurate, precise, operator independent, fast
responding, non-invasive, continuous, easy to use, cheap and safe. This method does not
exist today. In chapter one, we reviewed methods to measure cardiac output; the Fick
principle, indicator dilution techniques, arterial pulse contour analysis, ultrasound and
bio-impedance.
(215
Chapter 2
We evaluated cardiac output using three new methods – the auto-calibrated FloTrac–Vigileo
(COed), the non-calibrated Modelflow (COmf) pulse contour method and the ultra-sound
HemoSonic system (COhs) – with thermodilution (COtd) as the reference. In 13
postoperative cardiac surgical patients, 104 paired CO values were assessed before, during
and after four interventions: (1) an increase of tidal volume by 50%; (2) a 10 cmH2O increase
in positive end-expiratory pressure; (3) passive leg raising and (4) head up position. With the
pooled data the difference (bias (2SD)) between COed and COtd, COmf and COtd and COhs
and COtd was 0.33 (0.90), 0.30 (0.69) and 0.41 (1.11) L∙min-1, respectively. Thus, Modelflow
had the lowest mean squared error, suggesting that it had the best performance. COed
significantly overestimates changes in cardiac output while COmf and COhs values are not
significantly different from those of COtd. Directional changes in cardiac output by
thermodilution were detected with a high score by all three methods.
Chapter 3
The aim of this study was to compare the accuracy of stroke volume variation (SVV) as
measured by the LiDCOplus system (SVVli) and by the FloTrac-Vigileo system (SVVed). We
measured SVVli and SVVed in 15 postoperative cardiac surgical patients following five study
interventions; a 50% increase in tidal volume, an increase of PEEP by 10 cmH2O passive leg
raising, a head-up tilt procedure and fluid loading. Between each intervention, baseline
measurements were performed. 136 data pairs were obtained. SVVli ranged from 1.4% to
26.8% (average 8.7% ± 4.6%); SVVed from 2.0% to 26.0% (average 10.2% ± 4.7%). The bias
was found to be significantly different from zero at 1.5% ± 2.5%, p < 0.001, (95% confidence
interval 1.1-1.9). The upper and lower limits of agreement were found to be 6.4% and 3.5%
respectively. The coefficient of variation for the differences between SVVli and SVVed was
26%. This results in a relative large range for the percentage limits of agreement of 52%.
Analysis in repeated measures showed coefficients of variation of 21% for SVVli and 22% for
SVVed. The LiDCOplus and FloTrac- Vigileo system are not interchangeable. Furthermore,
the determination of SVVli and SVVed are too ambiguous, as can be concluded from the
high values of the coefficient of variation for repeated measures. These findings underline
Pinsky’s warning of caution in the clinical use of SVV by pulse contour techniques.
Chapter 4
Selection of patients who will benefit from fluid loading is critical since unnecessary fluid
administration can lead to parameters and challenges in daily practice in Dutch intensive
care units. We sent 446 questionnaires to ICU physicians in the Netherlands. 39% of
questionnaires were returned. In the initial assessment of pulmonary oedema and cardiac
216)
failure. Filling pressures such as CVP, MAP, cardiac output and clinical signs have
traditionally been at the centre of haemodynamic monitoring. We performed a survey to
evaluate the impact of recently introduced volume status urine production and capillary refill
were found most important. To estimate need for volume expansion; CVP was used by 70%,
stroke volume variation (SVV) or pulse pressure variation (PPV) by 47%, and CO by 20%.
Seventy-five percent used a fluid challenge to predict responsiveness. Changes in heart rate,
MAP, CVP and CO were used most in characterizing responders and non-responders. The
presence of guidelines to characterize hypo- or hypervolaemia was indicated by 25% and only
half of these respondents indicated they used these guidelines. Many Dutch ICU physicians
use the recently developed variables SVV and PPV as well as fluid challenges to predict the
effects of fluid loading on CO, although, CVP is still used by the majority.
Chapter 5
Unnecessary fluid administration increases morbidity, mortality and intensive care stay.
Fluid loading responsiveness (FLR) is a strategy used to select patients that will benefit from
fluid administration. We summarized recent publications on FLR to provide the physician
working with critically-ill patients with an overview of parameters most frequently used in
FLR and we evaluated their reliability to predict the response in cardiac output to fluid
loading. Measurements of dynamic parameters, like pulse pressure variation (PPV) and
stroke volume variation, have consistently shown to be more reliable than central venous
pressure and pulmonary artery occlusion pressure (PAOP) to predict FLR. Changes in MAP,
CVP or CO as a result of different challenges (passive leg raising) are also more accurate
predictors of FLR. However, the definition of FLR lacks consensus as the quantity of
administered fluids and the cut-off to discriminate (non)responders vary largely. Dynamic
parameters, and especially PPV, are likely candidates to predict FLR in an everyday ICU
setting in different patient populations. Moreover, changes in CVP, MAP and CO after
passive leg raising can be used with equal reliability.
Chapter 6
Hypovolaemia is a common clinical problem. The Trendelenburg position and passive leg
raising (PLR) are routinely used in the initial treatment awaiting fluid resuscitation. We
evaluated the hemodynamic effects of PLR and Trendelenburg. Which position has the
optimal effect on cardiac output (CO)? Databases were searched for prospective studies in
normo- or hypovolaemic humans investigating the hemodynamic effects within 10 minutes
after postural change from supine position published between 1960 and 2010. 21 studies
were included for PLR (n=431) and 13 for Trendelenburg (n=246) position. Trendelenburg
position increased mean arterial pressure (MAP). CO increased 9% or 0.4 L∙min-1 after one
(217
minute of head down tilt. Between two to ten minutes this increase in CO declined to 4%
or 0.1 L∙min-1. PLR showed no increase in MAP or heart rate. Central venous pressure
increased. CO increased after one minute of leg elevation with 6% or 0.2 L∙min-1.
This effect persisted after this period with 6% or 0.2 L∙min-1. We found that although both
Trendelenburg and PLR significantly increase cardiac output only PLR seems able to sustain
this effect after one minute. Since fluid resuscitation during hypovolaemia is not achieved
within minutes, we advocate the use of autotransfusion with PLR. Studies that directly
compare effects of the two manoeuvres that are still needed for one of the most often used
therapies in medicine.
Chapter 7
We presented a new physiological model that discriminated between changes in the systemic
arterial and venous circulation. To test our model, we studied the effects of dobutamine and
hypovolemia in intact pentabarbitol- anesthetized piglets. Aorta pressure (Pao), central
venous pressure (CVP), mean systemic filling pressure (MSFP) and cardiac output were
measured in 10 piglets, before, during and after dobutamine infusion (6 μg∙kg-1∙min-1), as
well as during hypovolemia (-10 ml∙kg-1), and after fluid resuscitation to normovolemia.
Venous (Rv) and total systemic (Rsys) resistance were determined from Pao, PCV, MSFP and
CO. The quotient of Rv/ Rsys was used to determine the predominant location of vascular
changes (i.e. vasoconstriction or dilatation on either venous or arterial side). Administration
of dobutamine increased heart rate and CO, whereas it decreased MSFP, Rsys, Rv and
Rv/Rsys. The decrease in Rv was significantly greater than Rsys. Pao and Pcv did not change.
Hypovolemia decreased CO, CVP, MSFP, Rv and Rv/Rsys, but kept Rsys constant and
increased heart rate. Hypovolemia and dobutamine differentially alter MSFP, Rsys, Rv and
Rv/Rsys ratio. The increase in CO during dobutamine infusion was attributed to the
combined increased cardiac function and decreased Rv. The decrease in CO with
hypovolemia was due to a decrease MSFP but was partly compensated for by a decrease in
Rv tending to preserve venous return and thus CO.
Chapter 8
We aimed to measure the relationship between blood flow and central venous pressure and
to estimate mean systemic filling pressure (MSFP), circulatory compliance, and stressed
volume in twelve mechanically ventilated postoperative cardiac surgery patients in the
intensive care unit. Inspiratory holds were performed during normovolaemia in supine
position (baseline), relative hypovolemia by placing the patients in 30° head-up position
(hypo), and relative hypervolaemia by volume loading with 0.5 L colloid (hyper). We
measured the relationship between blood flow and CVP using 12-second inspiratory-hold
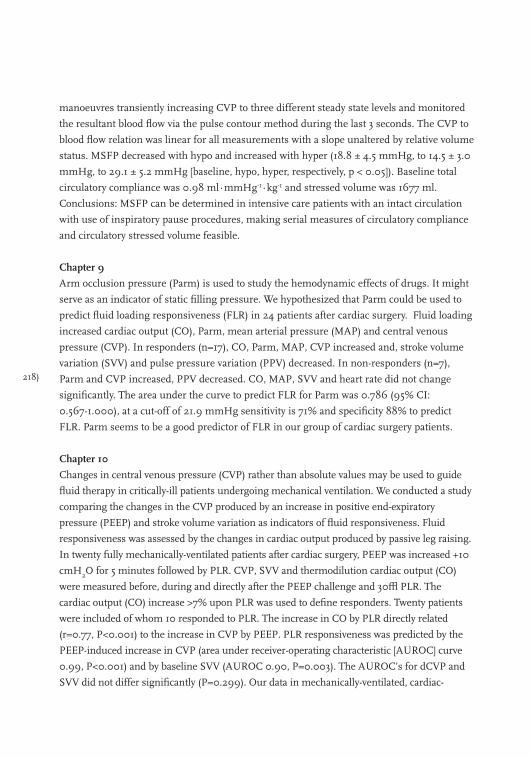
218)
manoeuvres transiently increasing CVP to three different steady state levels and monitored
the resultant blood flow via the pulse contour method during the last 3 seconds. The CVP to
blood flow relation was linear for all measurements with a slope unaltered by relative volume
status. MSFP decreased with hypo and increased with hyper (18.8 ± 4.5 mmHg, to 14.5 ± 3.0
mmHg, to 29.1 ± 5.2 mmHg [baseline, hypo, hyper, respectively, p < 0.05]). Baseline total
circulatory compliance was 0.98 ml∙mmHg-1∙kg-1 and stressed volume was 1677 ml.
Conclusions: MSFP can be determined in intensive care patients with an intact circulation
with use of inspiratory pause procedures, making serial measures of circulatory compliance
and circulatory stressed volume feasible.
Chapter 9
Arm occlusion pressure (Parm) is used to study the hemodynamic effects of drugs. It might
serve as an indicator of static filling pressure. We hypothesized that Parm could be used to
predict fluid loading responsiveness (FLR) in 24 patients after cardiac surgery. Fluid loading
increased cardiac output (CO), Parm, mean arterial pressure (MAP) and central venous
pressure (CVP). In responders (n=17), CO, Parm, MAP, CVP increased and, stroke volume
variation (SVV) and pulse pressure variation (PPV) decreased. In non-responders (n=7),
Parm and CVP increased, PPV decreased. CO, MAP, SVV and heart rate did not change
significantly. The area under the curve to predict FLR for Parm was 0.786 (95% CI:
0.567-1.000), at a cut-off of 21.9 mmHg sensitivity is 71% and specificity 88% to predict
FLR. Parm seems to be a good predictor of FLR in our group of cardiac surgery patients.
Chapter 10
Changes in central venous pressure (CVP) rather than absolute values may be used to guide
fluid therapy in critically-ill patients undergoing mechanical ventilation. We conducted a study
comparing the changes in the CVP produced by an increase in positive end-expiratory
pressure (PEEP) and stroke volume variation as indicators of fluid responsiveness. Fluid
responsiveness was assessed by the changes in cardiac output produced by passive leg raising.
In twenty fully mechanically-ventilated patients after cardiac surgery, PEEP was increased +10
cmH2O for 5 minutes followed by PLR. CVP, SVV and thermodilution cardiac output (CO)
were measured before, during and directly after the PEEP challenge and 30º PLR. The
cardiac output (CO) increase >7% upon PLR was used to define responders. Twenty patients
were included of whom 10 responded to PLR. The increase in CO by PLR directly related
(r=0.77, P<0.001) to the increase in CVP by PEEP. PLR responsiveness was predicted by the
PEEP-induced increase in CVP (area under receiver-operating characteristic [AUROC] curve
0.99, P<0.001) and by baseline SVV (AUROC 0.90, P=0.003). The AUROC’s for dCVP and
SVV did not differ significantly (P=0.299). Our data in mechanically-ventilated, cardiac-

(219
surgery patients suggest that the newly defined parameter, PEEP-induced CVP changes, like
SVV, appears to be a good parameter to predict fluid responsiveness.
Chapter 11
In 2006, Vincent and Weil (V&W) reintroduced the fluid-challenge protocol. We studied the
value of adding pulse contour cardiac output to V&W’s protocol to reduce the amount of
unnecessary administered fluid and compared it to a fluid loading responsiveness protocol
with pulse contour CO. We measured the effects of the administration of 10 sequential 50
ml bolus colloid infusions on CO [Modelflow (COm) and LiDCO (COli)], central venous
pressure (CVP) and mean arterial pressure (MAP) in twenty-one patients on mechanical
ventilation after elective cardiothoracic surgery. COli and COm increased after 50, 100 and
500 ml fluid loading. When COm is increased ≥4.3% after a 100 ml trial administration,
fluid loading responsiveness with a 10% increase in CO after 500 ml fluid administration
can be predicted with a sensitivity 67% and specificity of 100%. Addition of COm to V&W’s
original protocol would have lead to a mean administration of 100 instead of 200 ml fluid to
non-responders and an increase of 7% in CO. A fluid responsiveness protocol would have
lead to a 18% increase in CO. The addition of pulse contour CO can improve the reliability
and robustness of the V&W’s fluid-challenge protocol. It resulted in an increase of cardiac
output in responders and a decrease of unnecessary fluid loading in non-responders.
Chapter 12
We evaluated the ability of two pulse contour cardiac output techniques to track cardiac
output changes during 30° passive leg raising (PLR) to assess fluid loading responsiveness in
twenty mechanical-ventilated post-operative cardiac surgery patients. We estimated cardiac
output by three techniques: thermodilution (COtd), arterial pulse power (COli, LiDCO) and
pulse contour method (COm) based on uncalibrated Modelflow. We measured heart rate
(HR), central venous pressure, arterial pulse pressure (PP), systolic pressure (SP) and mean
arterial pressure. Stroke volume (SV), SP, PP and SV variation (PPV and SVV, respectively)
were calculated over 5 breaths. SVV was measured by both LiDCO (SVVli) and Modelfow
(SVVm) devices. PLR-induced changes in COtd correlated with COli (p<0.001) and COm
(p<0.001). Preload dependence was predicted with an area under the ROC curve of 0.968
for ∆COm, 0.841 for ∆COli, 0.825 for SVVm, 0.873 for SVVli, 0.808 for PPV, 0.778 for ∆SP,
0.714 for ∆PP and 0.873 for ∆MAP. Changes in COm, COli, SVV and PPV track COtd
changes during PLR with a high degree of accuracy in sedated ventilated post-operative
cardiac surgery patients. Changes in pulse contour CO after PLR can be used to predict fluid
loading responsiveness.
220)
Chapter 13
In response to publications by Preisman and co-workers, we evaluated transferability of an
automated ventilator manoeuvre of successive incremental-pressure-controlled 1.5-second
breaths, Respiratory Systolic Variation Test (RSVT), in an independent group of 14 patients
after cardiac surgery to predict fluid loading responsiveness (FLR). Cardiac output, central
venous pressure and mean arterial pressure increased after 500 ml colloid administration.
Pulse pressure variation and RSVT-values decreased. CO increased 34% in responders (n=9)
and did not change in non-responders (n=5). An RSVT-threshold of 0.51 predicted FLR
correctly in 78% of the patients. Prediction of FLR with an automated RSVT is feasible and
reliable.
Discussion
No gold standard exists to guide hemodynamic management. Fluid loading responsiveness
is a relatively novel strategy. In general, fluid loading responsiveness can be described as the
response of CO on an intra-vascular administration of a certain amount of fluid. Even more
important is the ability to predict FLR, i.e. responders and non-responders without the
administration of fluids. This strategy could reduce unnecessary fluid administration
henceforth decreasing related complications and mortality. The idea behind predicting FLR
is that overall fluid administration will decrease. To our knowledge no study exists to date
that evaluates the impact of FLR (prediction) on fluid administration or outcome. More
elaborate research is needed. Consequently a workable algorithm needs to be developed to
predict FLR and to guide fluid management in a patient followed by a study of its effect on
outcome. We advocate the use of a single definition to allow comparison of different studies
in order to ultimately formulate a FLR-protocol and to assess the effect of FLR on mortality
and morbidity. Moreover, statistical testing needs to improve; receiver operating curve
characteristics alone are not sufficient and secondary testing in a control population or
reproducibility testing is necessary.
The most important issue, however, is the lack of a practical consensus over the definition of
fluid loading responsiveness; the amount of fluid, type of fluid, timing of the measurement,
the choice of parameter to define responders, the technique to measure this parameter and
its cut-off value vary widely in literature. We propose to define fluid loading responsiveness.
as a clinically significant increase in cardiac output within 5 minutes after a bolus 5 ml∙kg-1
administration of a colloid or crystalloid solution.

(221
Chapter 16
Samenvatting
222)
Patiënten op een intensivecare-afdeling en in de periode gedurende en rondom een operatie,
zijn afhankelijk van medisch personeel voor hun vloeistofinname. Het optimaliseren van de
vullingtoestand is noodzakelijk voor een maximaal zuurstofaanbod aan vitale organen.
Overmatige toediening van vloeistof leidt tot gegeneraliseerd oedeem, longoedeem,
hartfalen, infecties, verlengde ziekenhuisopnames en zelfs overlijden. Symptomen als
huidturgor, urineproductie, kleur van de huid, en hemodynamische metingen, zoals centraal
veneuze druk (CVD) en gemiddelde slagaderlijke bloeddruk (MAP), worden meestal
gebruikt in het beleid. Deze parameters zijn echter in veel situaties onbetrouwbare
voorspellers van de effecten van het toedienen van vloeistof.
Cardiac output (CO) is de hoeveelheid bloed die door het hart per minuut in de bloedsomloop
wordt rondgepompt. Men is er van overtuigd dat een toename in cardiac output ook een
verbeterde doorbloeding van de vitale organen geeft. Een toegenomen doorbloeding houdt in
dat het zuurstofaanbod aan deze organen waarschijnlijk verbetert. Dit is de basis van de
vloeistofresponsiviteitstrategie (FLR). Deze strategie heeft als doel cardiac output te optimali-
seren, de hoeveelheid vloeistoftoediening te minimaliseren en de kans op overvulling te
verkleinen.
In het verleden heeft Arthur Guyton een belangrijke stap gezet waardoor het direct meten van
de vullingtoestand mogelijk zou moeten worden. De weerstand van de bloedvaten, centraal
veneuze druk (CVD) en statische vullingdruk (MSFP) zijn de primaire determinanten van
veneuze terugvloed van bloed naar het hart en dus ook cardiac output. Uiteindelijk kan MSFP
gebruikt worden om het (actieve of) circulerend bloedvolume te bepalen in patiënten. MSFP
is de druk die in de bloedvaten (aders en slagaders) ontstaat als er geen bloed stroomt dus als
het hart stil zou staan.
In dit proefschrift, hebben we een overzicht gemaakt van de publicaties over FLR en we
hebben getracht het effect van deze publicaties op de Nederlandse intensivecarepraktijk in
kaart te brengen. Wij bespreken de resultaten van twee onderzoeken naar de nauwkeurigheid
van pulscontouranalyse om CO en slagvolumevariatie (SVV) te bepalen. Vervolgens
presenteren we de resultaten van een nieuwe methode om MSFP in mensen te kunnen
bepalen zonder dat stilstand van het hart noodzakelijk is. Als laatste bediscussiëren wij vijf
studies waarin de betrouwbaarheid is onderzocht om FLR te voorspellen door middel van een
manoeuvre met +10 cmH2O piek eind-expiratiedruk (PEEP), een proeftoediening van
vloeistof, passief benen heffen, een mechanische beademingmanoeuvre en het meten van
baseline MSFP. De manoeuvres hebben als doel het werkpunt op de hartfunctiecurve te
bepalen en te kijken of er “ruimte” is voor toediening van vloeistof.
Hoofdstuk 1
Er zijn meerdere technieken ontwikkeld om de pompkracht van het hart, ofwel cardiac
output, te meten. Het aantal technieken dat voor onderzoek in mensen is te gebruiken, is
(223
echter beperkt. De ‘heilige graal’ voor het meten van cardiac output zou een techniek zijn die
nauwkeurig, precies, gebruikeronafhankelijk, snel reagerend, continue, makkelijk in
gebruik, goedkoop en veilig is. Zo’n methode bestaat momenteel nog niet. In hoofdstuk één
van dit proefschrift hebben wij een overzicht gemaakt van de meest gebruikte en de
bruikbare technieken om cardiac output te meten: de Fick, indicatorverdunning, puls-
contouranalyse (waarbij de pulscontour wordt gebruikt om CO te berekenen), echografie en
bio-impedantiemethoden.
Hoofdstuk 2
We hebben de nauwkeurigheid en precisie van drie methoden om cardiac output te meten
bestudeerd - autogekalibreerde FloTrac–Vigileo (COed) en niet-gekalibreerde Modelflow
(COmf) drukgolfmethoden en een echografische (HemoSonic, COhs) techniek - in
vergelijking met de thermodilutietechniek (COtd). Bij 13 postoperatieve, mechanisch
beademde, cardiochirurgische patiënten werden 104 gepaarde CO-waarden beoordeeld voor,
tijdens en na vier interventies (1) een 50% toename in teugvolume; (2) een 10 cmH2O
toename in PEEP; (3) 30° benen heffen en (4) hoofd-omhoog-positie. Het verschil
(bias (2SD)) tussen COed en COtd, COmf en COtd, en COhs en COtd was 0.33 (0.90), 0.30
(0.69) en (0.41 (1.11) L∙min-1, respectievelijk. Modelflow had de laagste gemiddelde fout, wat
suggereert dat deze techniek de meest precieze prestaties levert. COed overschat de
veranderingen in cardiac output terwijl COmf- en COhs-waarden niet significant verschillen
van COtd. De richting van de veranderingen in thermodilutie cardiac output komt in zeer
hoge mate overeen met de richting van veranderingen waargenomen met de drie methoden.
Hoofdstuk 3
Het doel van de studie beschreven in hoofdstuk drie is het vergelijken van de nauwkeurig-
heid van stroke volume variatie gemeten door het LiDCOplus-systeem (SVVli) en het
FloTrac-Vigileo-systeem (SVVed). We hebben SVVli en SVVed in 15 postoperatieve cardiochi-
rurgische patiënten geregistreerd tijdens vijf interventies; (1) een 50% toename in teugvo-
lume; (2) een 10 cmH2O toename in positieve eind-expiratoire druk; (3) 30° benen heffen,
(4) hoofd-omhoog-positie en (5) toediening van vloeistof. Tussen de interventies door zijn
basismetingen uitgevoerd. 136 gepaarde SVV-waarden werden verzameld. SVVli-waarden
varieerden van 1.4% tot 26.8% (gemiddeld 8.7% ± 4.6%); SVVed van 2.0% tot 26.0%
(gemiddeld 10.2% ± 4.7%). De gemiddelde bias bleek significant te verschillen van nul met
1.5% ± 2.5%, p < 0.001, (95% betrouwbaarheidsinterval 1.1–1.9%). De bovenste en onderste
grenzen van het betrouwbaarheidsinterval waren 6.4% en 3.5% respectievelijk. De variatieco-
efficiënt voor de verschillen tussen SVVli en SVVed was 26%. Dit resulteert in een relatief
grote spreiding van de betrouwbaarheidsintervallen van 52%. Analyse van de herhaalde
224)
metingen liet een variatiecoëfficiënt van 21% voor SVVli en 22% voor SVVed zien. De
SVV-waarden van de LiDCOplus en FloTrac- Vigileo-systemen zijn niet uitwisselbaar.
Daarnaast zijn de metingen van SVVli en SVVed niet eenduidig. Dit kan geconcludeerd
worden uit de hoge variatiecoëfficiënt bij herhaalde metingen. Deze bevindingen onderstre-
pen de waarschuwing van Michael Pinsky om voorzichtig te zijn om SVV-waarden die via
pulscontouranalyse verkregen zijn in de kliniek te gebruiken.
Hoofdstuk 4
De selectie van patiënten die baat zullen hebben bij het toedienen van vloeistof is essentieel
voor een verantwoord vullingbeleid. Het onnodig toedienen van vloeistof kan leiden tot het
ontstaan van longoedeem en hartfalen. Vullingdrukken zoals CVD en MAP, cardiac output
en klinische symptomen hebben altijd centraal gestaan bij de hemodynamische bewaking
van patiënten. Wij hebben een enquête afgenomen om de gevolgen van publicaties over
nieuwe parameters op de dagelijkse praktijkvoering in Nederlandse intensivecareafdelingen
te bekijken. Enquêtes werden verstuurd naar alle (446) intensivecare-artsen in Nederland.
39% Van de enquêtes werd ingevuld en teruggezonden.
In de eerste beoordeling van de vullingtoestand worden de productie van urine en capillary
refill als meest belangrijk gevonden. De CVD wordt door 70% van de artsen gebruikt om de
behoefte aan extra vloeistof in te schatten. SVV werd door 47% van de respondenten
gebruikt, en CO door 20%. 75% Procent gebruikt een proeftoediening van vloeistof om
vloeistofresponsiviteit in te schatten. Veranderingen in hartslag, MAP, CVD en CO na
vloeistoftoediening worden vaak gebruikt om vloeistofresponsiviteit te beoordelen. Slechts
een kwart van alle respondenten geeft aan dat er een protocol beschikbaar is in het
ziekenhuis om onder- of overvulling te beschrijven/behandelen en slechts de helft van deze
respondenten zegt dat protocol ook te gebruiken. Relatief veel intensivecare-artsen
gebruiken recent ontwikkelde variabelen als SVV en polsdrukvariatie (PPV) evenals een
proeftoediening van vloeistof om te trachten de effecten van vloeistoftoediening te voorspel-
len. Daarentegen wordt door de meerderheid nog een ‘ouderwetse’ variabele als CVD
gebruikt.
Hoofdstuk 5
De onnodige toediening van vloeistof verhoogt de kans op complicaties en sterfte, en
verlengt het verblijf op de intensive care. FLR is een strategie om patiënten te selecteren die
baat zullen hebben bij het toedienen van vloeistof. Wij hebben recente publicaties over dit
onderwerp op een rij gezet. We hebben een overzicht gemaakt van de meest gebruikte
parameters voor FLR en we hebben de nauwkeurigheid om het effect van vloeistoftoediening
op CO van deze parameters bekeken. Dynamische parameters zoals PPV en SVV hebben
(225
veelvuldig en consequent laten zien dat zij meer betrouwbare voorspellers van FLR zijn dan
centraal veneuze druk en pulmonaal arterie wiggedruk. Veranderingen in MAP, CVD en CO
ten gevolge van verschillende manoeuvres zoals passief benen heffen (PLR), zijn ook
voorspellers van FLR. Dynamische parameters, en met name PPV, zijn aan te raden om in
de praktijk te gebruiken om FLR te voorspellen. Tevens zijn veranderingen in CVD, MAP en
CO na benen heffen met een zelfde mate van betrouwbaarheid te gebruiken.
Hoofdstuk 6
Ondervulling is een veelvoorkomend klinisch probleem. De Trendelenburg (i.e. bed
gekanteld met hoofd omlaag en benen omhoog) positie en benen heffen worden routinema-
tig gebruikt in afwachting van definitieve behandeling van het probleem en het toedienen
van vloeistof of bloedproducten. Wij hebben de hemodynamische effecten van PLR en de
Trendelenburgpositie onderzocht door een literatuur studie over de periode 1960 tot 2010
naar prospectieve onderzoeken in mensen gedurende de eerste 10 minuten na positieveran-
dering. Welke positie heeft het meest effect op CO? 21 Studies over PLR waren relevant
(n patiënten=431) en 13 over Trendelenburg (n patiënten=246). Trendelenburgpositionering
deed MAP toenemen. CO steeg 9% of 0.4 L∙min-1 na 1 minuut Trendelenburg. In de periode
hierna (2-10 min) daalde deze toename tot 4% of 0.1 L∙min-1. PLR deed noch MAP noch de
hartslag veranderen. CVD nam toe. CO steeg met 6% of 0.2 L∙min-1 na één minuut.
Alhoewel zowel Trendelenburg als PLR CO significant doet stijgen, is het alleen PLR dat dit
effect langer dan enkele minuten laat duren. Wij zouden dus het gebruik van PLR willen
aanraden voor de eerste behandeling van ondervulling
Hoofdstuk 7
Wij introduceren een nieuw fysiologisch model dat onderscheid mogelijk maakt tussen de
slagaderlijke en aderlijke bloedsomloop. Om ons model te testen hebben we de effecten van
dobutamine en ondervulling in biggen onder barbituratennarcose onderzocht. Lichaams-
slagaderdruk (Pao), CVD, MSFP en CO werden gemeten in 10 biggen voor, tijdens en na
dobutamine-infusie (6 μg∙kg-1∙min-1), tijdens hypovolemie (-10 ml∙kg-1), en na herstel van
normale vullingstatus. Aderlijke (Rv) en systemische (Rsys) vaatweerstanden werden bepaald
uit Pao, CVD, MSFP en CO. Het quotiënt van Rv/Rsys werd gebruikt om de voornaamste
verandering van vaatweerstanden te bepalen (verwijden of vernauwen van de aderlijke of
slagaderlijke kant van de bloedsomloop). Infusie van dobutamine verhoogde de hartslag en
CO. MSFP, Rsys, Rv en Rv/Rsys daalden. De daling in Rv was significant kleiner dan Rsys.
Pao en CVD veranderden niet. Ondervulling verminderde CO, CVD, MSFP, Rv en Rv/Rsys,
maar Rsys bleef onveranderd en de frequentie van de hartslag nam toe. Ondervulling en
dobutamine veranderen MSFP, Rsys Rv en de Rv/Rsys-ratio variërend. De stijging in CO
226)
tijdens dobutamine-infusie wordt geweten aan de gecombineerde verhoging van hartfunctie
en afgenomen Rv. De afname in CO tijdens ondervulling wordt veroorzaakt door een
afname in MSFP maar wordt ook deels gecompenseerd door de afname in Rv.
Hoofdstuk 8
Het doel van deze studie was de relatie tussen CO en CVD te bepalen, en om statische
vullingdruk en effectief circulerend bloedvolume te berekenen in twaalf mechanisch
beademde, postoperatieve, cardiochirurgische patiënten. Inademingpauzes met verschil-
lende drukken werden verricht bij normale vulling (rugligging, baseline), relatieve ondervul-
ling door 30° hoofd-omhoog-positie (hypo) en relatieve overvulling (500 ml colloid toedie-
ning, hyper). De relatie tussen CO en CVD werd gemeten m.b.v. deze twaalf seconden
durende inademingpauzes die de CVD verhoogde en CO verlaagde. De cardiac output werd
middels pulscontouranalyse gemeten gedurende de laatste drie seconden van de adempauze.
De relatie tussen CVD en CO was lineair voor alle metingen met een helling die gelijk bleef
voor de verschillende vullingtoestanden. MSFP verminderde van baseline naar hypovolemie
en nam toe tijdens hypervolemie (van 18.8 ± 4.5 mmHg naar 14.5 ± 3.0 mmHg, naar
29.1 ± 5.2 mmHg (p < 0.05)). De baselinecompliantie van de bloedsomloop was
0.98 ml∙mmHg-1∙kg-1 en het effectief circulerend bloedvolume was 1677 ml. Concluderend:
statische vullingdruk kan bepaald worden bij ic-patiënten met een intacte bloedsomloop
door gebruik te maken van de inademingpauzeprocedure met het beademingsapparaat.
Deze procedure maakt het mogelijk de compliantie van de bloedsomloop en het effectief
circulerend bloedvolume te volgen bij beademde patiënten.
Hoofdstuk 9
De druk gemeten met de armocclusiemethode is in het verleden gebruikt om de effecten van
medicijnen op de bloedsomloop te bestuderen. Wij stellen dat deze armocclusiedruk (Parm)
ook gebruikt zou kunnen worden als een indirecte indicatie van de vullingstatus. We hebben
de waarde van Parm bestudeert om FLR te voorspellen in 24 patiënten na cardiochirurgie.
Vloeistoftoediening vergrootte CO, Parm, MAP en CVD. In responders (n=17) namen CO,
Parm, MAP en CVD toe en SVV en PPV af. In non-responders (n=7), namen alleen Parm en
CVD toe. PPV daalde. CO, MAP, SVV en hartslag veranderden niet significant. De
oppervlakte onder de voorspellingcurve (AUROC) voor Parm was 0.786 (95% betrouwbaar-
heidsinterval 0.567-1.000). Een Parm < 21.9 mmHg had een sensitiviteit van 71% en een
specificiteit van 88% om FLR te voorspellen. Hiermee lijkt Parm een goede voorspeller van
FLR in onze bestudeerde groep van patiënten na cardiochirurgie.
(227
Hoofdstuk 10
Niet de absolute waarde maar de verandering in CVD zou wel eens een goede basis kunnen
zijn voor het vloeistofbeleid bij kritisch zieke patiënten. We hebben een studie uitgevoerd om
de CO-verandering ten gevolge van 30° PLR te voorspellen op basis van veranderingen in CVD
na verhoging van PEEP. Twintig mechanische beademde patiënten na cardiochirurgie werden
bestudeerd. PEEP werd verhoogd met 10 cmH2O gedurende vijf minuten gevolgd door vijf
minuten benen heffen. CVD, SVV en thermodilution CO werden bepaald voor, gedurende en
na de PEEP-manoeuvre en PLR. Een toename in thermodilutie CO van >7% na PLR werd
gebruikt om responders te identificeren. De toename in CO door PLR was direct gerelateerd
aan de toename in CVD na +10 PEEP (r=0.77, P<0.001). PLR-responsiviteit werd voorspeld
door de +10 PEEP veranderingen in CVD (AUROC 0.99, P<0.001) en door baseline
slagvolumevariatie (AUROC 0.90, P=0.003). De resultaten van ons onderzoek suggereren dat
door PEEP geïnduceerde veranderingen in CVD FLR met ongeveer dezelfde betrouwbaarheid
als baseline SVV kan voorspellen.
Hoofdstuk 11
In 2006, herintroduceerde Vincent en Weil (V&W) de proeftoediening van vloeistof in een
protocol voor hemodynamisch beleid. In ons onderzoek hebben wij de waarde van de
toevoeging van CO (middels pulscontourmeting) aan het V&W-protocol geëvalueerd om
onnodige vloeistoftoediening te reduceren. We hebben in 21 mechanisch beademde
patiënten na electieve cardiochirurgie de hemodynamische effecten gemeten van de
toediening van een serie van 10 achtereenvolgende toedieningen van 50 ml colloïde
oplossing op CO (Modelflow (COm) en LiDCO (COli)), CVD en MAP. COli en COm namen
toe na 50, 100 en 500 ml vloeistoftoediening. Indien COm ≥4.3% toenam na 100 ml
proeftoediening dan werd vloeistof responsiviteit (CO > 10% gestegen na 500 ml vloeistof-
toediening) met een sensitiviteit van 67% en specificiteit van 100% voorspeld. Toevoeging
van COm aan het V&W protocol zou hebben geleid tot een gemiddelde toediening van 100
in plaats van 200 ml vloeistof in non-responders en een toename van 18% in CO bij
responders (i.p.v. 7%). De toevoeging van pulscontour-CO zal de betrouwbaarheid en
robuustheid van het V&W-protocol verbeteren. Samenvattend: de toevoeging resulteerde in
een grotere stijging in CO in responders en een verminderde onnodige vloeistoftoediening
bij non-responders.
Hoofdstuk 12
We hebben de mogelijkheid van twee pulscontourtechnieken onderzocht om veranderingen
in CO door 30° PLR om vloeistofresponsiviteit te beoordelen in twintig beademde post-
cardiochirurgie patiënten. CO werd gemeten met thermodilutie COtd, pulscontourpower
228)
(COli, LiDCO) en pulscontouranalyse (ongekalibreerde modelflow, COm). Verder zijn
gemeten: hartslag, CVD, slagaderlijke polsdruk (PP), systolische bloeddruk (SP), diastolische
bloeddruk (DP) en MAP. Slagvolume (SV), SP, PP, PPV, SVV werden berekend over vijf
ademhalingcycli. SVV werd bepaald met de LiDCO (SVVli) en Modelfowapparaten (SVVm).
PLR geïnduceerde veranderingen in COtd correleerden met veranderingen in COli
(p<0.001) en COm (p<0.001). COtd-verandering werd voorspeld met een AUROC van
0.968 door ∆COm, 0.841 door ∆COli, 0.825 door SVVm, 0.873 door SVVli, 0.808 door PPV,
0.778 door ∆SP, 0.714 door ∆PP en 0.873 door ∆MAP. Dus: veranderingen in COm, COli,
SVV en PPV volgen de veranderingen in COtd gedurende PLR met een hoge graad van
nauwkeurigheid in gesedeerde en beademde patiënten na cardiochirurgie. Veranderingen in
pulse contour CO na PLR kan worden gebruikt om vloeistofresponsiviteit te voorspellen.
Hoofdstuk 13
Als reactie op de publicaties van Preisman et al. hebben wij de herhaalbaarheid onderzocht
van een beademingsapparaatmanoeuvre met drukgecontroleerde 1.5 seconde durende
ademteugen met toenemende druk. Deze ‘Respiratory Systolic Variation Test (RSVT)’
hebben wij bovendien geautomatiseerd. In een onafhankelijke groep van 14 patiënten na
cardiochirurgie hebben wij de waarde van RSVT om vloeistofresponsiviteit te voorspellen
onderzocht. CO, CVD en MAP namen toe na 500 ml colloïdeoplossing was toegediend.
PPV- en RSVT-waarden daalden. CO steeg 34% in responders (n=9) en veranderde niet in
non-responders (n=5). Een RSVT-drempelwaarde van 0.51 voorspelde FLR in 78% of de
patiënten. Voorspellen van FLR met de RSVT lijkt betrouwbaar, herhaalbaar en geautomati-
seerd goed uit te voeren.
Discussie
Er is geen goudstandaard voor hemodynamisch beleid. Vloeistofresponsiviteit is een
relatieve nieuwe strategie. In het algemeen kan FLR beschreven worden als het effect van
cardiac output op een intraveneuze toediening van een bepaalde hoeveelheid vocht. Nog
belangrijker is het om dit effect te kunnen voorspellen. Dit betekent dat men responders en
non-responders op een vloeistoftoediening van tevoren zou kunnen onderscheiden. Deze
strategie heeft als doel onnodige vloeistoftoediening te voorkomen en dientengevolge de
kans aan overvulling gerelateerde complicaties en sterfte te verminderen. Tot op heden
bestaat er nog geen studie die de gevolgen op een systematische toepassing van FLR in de
praktijk op totale vloeistoftoediening of complicaties heeft onderzocht. Meer onderzoek is
nodig. Het nog niet gelukt om een praktisch en uitvoerbaar protocol vast te stellen om FLR
te voorspellen en als leidraad te dienen voor vloeistofbeleid. Bovendien dient de analyse van
FLR studies meer diepte te krijgen. Het bepalen van de AUROC lijkt niet afdoende. Ook

(229
dient de herhaalbaarheid van studieresultaten onderzocht te worden in een controlegroep.
Het belangrijkste probleem blijft dat er geen consensus is over de definitie van vloeistofres-
ponsiviteit; de hoeveelheid vloeistof, de samenstelling van de vloeistof, het tijdstip van de
metingen, de parameter om responders te definiëren, de techniek om deze parameter te
meten en de afkapwaarde voor responders variëren enorm in de literatuur. Wij willen de
definitie van vloeistofresponsiviteit definiëren als een klinisch relevante toename in cardiac
output (afkap waarde dus gerelateerd aan de nauwkeurigheid van de meetmethode) binnen
vijf minuten na een snelle toediening van 5 ml∙kg-1 van een colloïde (zetmeel) of fysiologi-
sche zoutoplossing (crystalloïde).

230)
List of abbreviations
A Area under the systolic part of the pressure curve
ABF Aortic blood flow
ARDS Adult respiratory distress syndrome
AUC Area under the curve
AVR Aortic valve replacement
BP Blood pressure
BSA Body surface area
C Velocity of ultra-sound in blood
CABG Coronary artery bypass grafting
CaCO2 Arterial carbon dioxide content in blood
CaO2 Oxygen content of arterial blood
CBV Circulating blood volume
Cc Computation constant
CCO Continuous cardiac output
CI Cardiac index
CO Cardiac output
CO2 Carbon dioxide
COed Cardiac output measured with the Flo-trac Vigileo system
COem Cardiac output measured with an electromagnetic flow probe
COhs Cardiac output measured with the hemosonic syste
COm Cardiac output measured with the modelflow system
COmf Cardiac output measured with the modelflow system
COpi Cardiac output measured with the PiCCO system
COPD Chronic obstructive pulmonary disease
Cosθ Angle between the direction of the ultra-sound beam and blood flow
COtd Thermodilution cardiac output
C(P) Pressure dependent arterial compliance
C(t) Concentration as a function of time.
CSA Cross sectional area
CvCO2 Mixed venous carbon dioxide content in blood.
CvO2 Oxygen content of venous blood
CVP Central venous pressure
Dia Diastolic arterial blood pressure
Dobu Dobutamine
ECG Electrocardiogram
(231
Enox Enoximone
EtCO2 End-tidal carbon dioxide
Fd Change in frequency (i.e. Doppler shift)
FLR Fluid loading responsiveness
Fo Transmitted frequency
GEDVI Global end-diastolic volume index
Hb Haemoglobin
HR Heart rate
HUT Head-up tilt
ICU Intensive care unit
K A calibration factor
Khi Conversion factor
LiCl Lithium chloride solution
LVEDA Left ventricular end-diastolic area
LVEDAI Left ventricular end diastolic area index
MAP Mean arterial pressure
Mi Amount of indicator injected
MSFP Mean systemic filling pressure
MVP Mitral valve plastique
Nor Norepinephrine
NPN Nitroprusside sodium
NVIC Dutch Society of Intensive Care
NYHA New York Heart Association
O2 Oxygen
OR Operating room
P Pressure
Pa Arterial pressure
PAC Pulmonary artery catheter
PaCO2 Arterial carbon dioxide pressure
PAP Pulmonary artery pressure
Pao Aorta pressure
PAOP Pulmonary artery occlusion pressure
Parm Arm equilibrium pressure
Paw Airway pressure
PAWP Pulmonary artery wedge pressure
PEEP Positive end-expiratory pressure
PLR Passive leg raising
232)
MSFP Mean systemic filling pressure
Prad Radial artery pressure
PRAM Pressure recording analytical method
PP Pulse pressure
Ppa Pulmonary artery pressure
PPV Pulse pressure variation
PPVli Pulse pressure variation with LiDCO system
Pra Radial artery pressure
Pvent Ventilator pressure
Pvr Pressure difference between MSFP and CVP
Q(t) Instantaneous blood flow
Ra Arterial resistance
ROC Receiver operating curve
RSVT Respiratory systolic variation test
Rsys Total systemic resistance
Rv Venous resistance
RVEDAI Right ventricular end diastolic area index
Rvr Resistance for venous return
S A constant
SA Left ventricular stroke area
SD Standard deviation
SE Standard error
SV Stroke volume
SVI Stroke volume index
SVR Systemic vascular resistance
SVV Stroke volume variation
Sys Systolic arterial blood pressure
SP Systolic arterial pressure
SPV Systolic pressure variation
SVVli Stroke volume variation measured with LiDCO system
SVVed Stroke volume variation measured with FloTrac-Vigileo system
Temp Body temperature
Tb Temperature of blood in the pulmonary artery before injection of injectate
Ti Temperature of injectate
TI Tricuspid insufficiency
TOD Transoesophageal Doppler
TTD Transthoracic Doppler

(233
TVP Tricuspid valve plastique
V Velocity of blood
VCO2 Carbon dioxide production
VO2 Oxygen production
Vt Tidal volume
V Arterial volume
V&W Vincent and Weil
Vload Amount of fluid administrated
VR Venous return
V(s) Stressed vascular volume
V&W Vincent and Weil
Z Characteristic impedance

234)
Curriculum vitae
Bart Franciscus Geerts was born on August 29th 1979 in Amsterdam. He attended the
dr. Rijk Kramerschool and the Fons Vitae Lyceum in Amsterdam. He obtained his
Atheneum high school diploma at the Leeuwenhorst College in Noordwijkerhout in 1997.
From 1997 he attended Biomedical Sciences at Leiden University and received his master in
2006. From 1999 he also attended medical school and received his medical degree in 2005.
As a student, he worked one year full-time for the board of directors of the Leiden University
Medical Centre. He was an advisor to the dean of the medical faculty, prof. dr. Vermeer, on
student and educational affairs. He also performed extra-curricular internships at the
Catholic Hospital in Battor Ghana and at the department of Health Action in Crises at the
World Health Organisation in Geneva Switzerland. In 2011, he was certified in clinical
pharmacology after attending a training program and working as a project leader in diabetes
research at the Centre for Human Drug Research of prof. dr. Adam Cohen in Leiden. From
2006 to 2011 he performed several studies with dr. Jos Jansen, dr. Rob de Wilde and Jacinta
Maas in the department of intensive care in the LUMC and worked on this dissertation. In
2008, he started specialty-training in the department of anaesthesiology of prof. dr. Leon
Aarts at the Leiden University Medical Centre.

(235
Dankwoord
Een heleboel mensen ben ik dank verschuldigd voor hun hulp bij het tot stand komen van dit
proefschrift. Hierbij wil ik speciaal bedanken en aandacht besteden aan:
Jos Jansen voor de ontelbare uren corrigeren, becommentariëren, reviseren, discussiëren,
motiveren en het aandragen van ideeën; kortom de inhoud van dit boekje. Betty Jansen voor
het dulden dat haar man ondanks zijn pensioen praktisch fulltime is blijven werken.
Rob de Wilde voor alle hulp en de goede samenwerking. Er zijn weinig mensen die zoveel
over hebben voor anderen.
Leon Aarts voor de goede begeleiding, adviezen en het bieden van alle mogelijkheden.
Jacinta Maas, Micheal Pinsky en Johan Groeneveld voor hun medewerking en kritische
commentaren.
De maatschap anesthesie van het Rijnland ziekenhuis voor het bieden van tijd om naast
klinisch werk aan dit proefschrift te kunnen werken.
Abbott Pharmaceuticals en Philips Healthcare N.V. voor hun financiële steun.
De medewerkers van het secretariaat van de afdelingen intensive care en anesthesiologie;
Ingrid van Leijden, Anneke Vuijk, Simone Langezaal-de Groot, Margo Donkers-Jagers en
Monique Mauer.
Willem Bisseling voor zijn hulp en adviezen.
Mijn paranimfen Geerten Geerts en Ward van Beers.
Ik wil mijn vader Jo, mijn moeder Frederike en mijn broertjes en zusje danken voor alles.
Altijd een thuis, een warm “nest”.
In het bijzonder wil ik mijn verloofde Charlotte danken voor haar liefde. Ik wil haar danken
voor haar geloof in mij en mijn kunnen.
236)
Publications
1. A comparison of stroke volume variation measured by the LiDCOplus and FloTrac-
Vigileo system. de Wilde RB, Geerts BF, van den Berg PC, Jansen JR. Anaesthesia
2009; 64(9): 1004-9.
2. Performance of three minimally invasive cardiac output monitoring systems. de Wilde
RB, Geerts BF, Cui J, van den Berg PC, Jansen JR. Anaesthesia 2009; 64(7): 762-9.
3. Assessment of venous return curve and mean systemic filling pressure in postoperative
cardiac surgery patients. Maas JJ, Geerts BF, van den Berg PC, Pinsky MR, Jansen JR.
Crit Care Med 2009; 37(3): 912-8.
4. Hemodynamic assessment in the Dutch Intensive Care Unit. Geerts BF, Maas JJ, de
Wilde RBP, Harinck HIJ, Jansen JRC. Neth Journal of Critical Care 2009; 13(4):
178-184.
5. Dairy peptides in effective blood glucose management. Bosscher D, Rijken P, Geerts
BF, an Dongen MGJ, de Kam ML, Cohen AF, Burggraag J, Gerhardt C, Kloek J. Aus J
Dairy Tech 2009; 64(1): 54-57
6. Methods in pharmacology: measurement of cardiac output. Geerts BF, Aarts LP, Jansen
JR. Br J Clin Pharmacol 2011; 71(3): 316-30.
7. Partitioning the resistances along the vascular tree: effects of dobutamine and
hypovolemia in piglets with an intact circulation. Geerts BF, Maas JJ, Aarts LP, Pinsky
MR, Jansen JR. J Clin Monit Comput 2010; 24(5): 377-84.
8. Predicting cardiac output responses to passive leg raising by a PEEP-induced increase
in central venous pressure, in cardiac surgery patients Bart Geerts, Leon Aarts, Johan
Groeneveld and Jos Jansen. British Journal of Anaesthesia 2011.
9. Pulse contour analysis to assess hemodynamic response to passive leg raising. Geerts
B, de Wilde R, Aarts L, Jansen J. J Cardiothorac Vasc Anesth 2011; 25(1): 48-52.
10. Improving the quality of drug research or simply increasing its cost? An evidence-based
study of the cost for data monitoring in clinical trials. Pronker E, Geerts BF, Cohen A,
Pieterse H. Br J Clin Pharmacol 2011; 71(3): 467-70.

Fluid loadin
g responsiven
ess Bart Fran
ciscus G
eerts
Fluid loading responsivenessBart Franciscus Geerts