fluid milk processing and - university of minnesota
TRANSCRIPT

STATION BULLETIN 530-1979
FLUID MILK PROCESSING AND DISTRIBU~ COSTS d fgtI
Martin Fischer Jerome Hammond and Wallace Hardie
AGRICULTURAL EXPERIMENT STATION bull UNIVERSITY OF MINNESOTA
Martin Fischer is a graduate research assistant Jerome Hammond is a professor and Wallace Hardie is a former research associate all in the Department of Agricultural and Applied Economics of the University of Minnesota
Acknowledgements The authors gratefully acknowledge the assistance
of the many corporations and individuals who proshyvided price and technical data used in this study Speshycial assistance was provided by Ammonia House Inc DeLaval Separator Company Environmental Process Inc Excello Corporation Land OLakes Inc and Hershycules Inc Errors remain the responsibility of the aushythors
Contents Page
I Introduction 3
II Economic-Engineering Analysis of Fluid Milk Processing Costs 3 Method of Analysis 3 Capital Investments 5
Land 5 Buildings 6 Equipment 6 Summary of Investments 10
Plant Operating Costs 11 Interest 11 Direct Labor 11 Administrative and Clerical Labor 11 Equipment Depreciation 11 Building Depreciation 11 Containers 12 Supplies 12 Repairs and Maintenance 12 Case Expense 12 Electricity 12 Fuel 12 Water and Sewage 12 Taxes and Insurance 13 Product Loss 13 Total Fluid Milk Processing Cost 13
Effects of Seasonality on Processing Costs 13
III Fluid Milk Distribution Costs in Minnesota 14 Vehicle Costs 14
Acquisition Costs 14 Operating Costs 17
Comparison of Costs for Diesel and Gas Operated Vans 17 Predicting Equations for Vehicle Costs 17 Labor Expenses 18 Selling Expenses 19 Distribution Facility Expenses 20 Total Fluid Milk Distribution Costs 21 Impact of Distribution Costs on Optimum Plant Size 24
IV Summary 24 Appendix Tables 25 Bibliography 27
The University of Minnesota including the Agricultural Experiment Station is committed to the policy that all persons shall have equal access to its programs facilities and employment without regard to race creed color sex national origin or handicap 60 cents
Figures Page Assumed Tuesday equipment operating schedule for Plant I 8
2 Assumed Tuesday equipment operating schedule for Plant II 9
3 Assumed Tuesday equipment operating schedule for Plant III 10
4 Effects of plant size and utilization level on fluid milk processing costs for three model fluid milk proshycessing plants 14
5 Comparison of total annual operating costs for 20 foot gasoline and diesel operated vans 17
6 Fluid milk distribution costs on metropolitan and nonmetropolitan wholesale routes 22
7 Effect of number of stops on metropolitan area wholesale milk distribution costs 22
8 Effect of route length on metropolitan area wholesale milk distribution costs 23
9 Costs of distributing milk on fully loaded over-theshyroad routes to a satellite distribution facility 23
Tables 1 Number of fluid milk plants in Minnesota by volume
processed 1956-77 3 2 Product mix of model fluid milk plants 4 3 Weekly container use for three model fluid milk
plants 4 4 Inventory and processing schedule for model plant
processing 50000 gallons per week 4 5 Inventory and processing schedule for model plant
processing 200000 gallons per week 5 6 Inventory and processing schedule for model plant
processing 400000 gallons per week 5 7 Comparison of space requirements and building inshy
vestment for three model milk processing plants 6 8 Summary of equipment costs for three model fluid
milk plants 7 9 Investment in land buildings and equipment for
three model fluid milk plants 11 10 Estimated weekly labor requirements for three
modelfluid milk plants 11 11 Total direct labor cost for three model fluid milk
plants 11 12 Weekly container cost for three model fluid milk
plants 12 13 Weekly operating costs for three model fluid milk
plants 13 14 Cost of fluid milk distribution vehicles and composhy
nents 1977 15 15 Cost of tractor-trailer components used in fluid milk
distribution 1977 15 16 EstImated fixed and variable costs for vans used to
distribute milk 15 17 Estimated fixed and variable costs for tractor-trailers
used to distribute milk 16 18 Predicting equations for vehicle cost per gallon of
milk distributed 18 19 Labor cost for milk distribution drivers 1977 19 20 Characteristics of 130 fluid milk distribution routes
in Minnesota 19 21 Predicting equations for labor cost per gallon of milk
distributed by type of route 20 22 Selling costs of fluid milk processors Minnesota
1977 20 23 Land buildings and equipment investment for a satshy
ellite fluid milk distribution facility 20 24 Operating expenses for a 60000-gallons-per-week
satellite fluid milk distribution facility 20 25 Predicting equations for fluid milk distribution
costs by type of route 21 26 Summary of distribution costs by type of route 24
A-1 Itemized equipment requirements for Plant I 25 A-2 Itemized equipment requirements for Plant II 25 A-3 Itemized equipment requirements for Plant III 26
Introduction Adoption of new technology in fluid milk processshy
ing and distribution continues to generate changes in the structure of this industry throughout the US Larger and more efficient processing equipment and the develshyopment of lightweight containers have increased the optimum size of processing plants and expanded distrishybution routes 1 Small plants and firms have found it increasingly difficult to compete successfully in the market In Minnesota fluid milk processing plants deshyclined from 289 in 1956 to 29 in 1976 (table 1) Seventyshyseven percent (222 plants) processed less than 25 milshylion pounds of milk in 1956 By 1976 27 percent (8 plants) processed less than 25 million pounds of milk while 16 of the 29 plants were processing more than 10 million pounds annually
Changes in milk packaging have been a factor in increased firm size and have had significant impacts on channels of milk distribution Glass containers were the most widely used containers until after World War II The paper container used as early as 1906 was adopted widely in the late 1930s and became the most common type of milk container in the 1950s2 Use of paper containers expanded from 5 percent of fluid milk marketings in 1940 to 39 percent in 19523 Their use continued to expand until it represented 78 percent of fluid milk sales in all federal order milk markets in 19714 The paper containers also made fluid milk more attractive to retail food stores because stores no longer had to handle returnable bottles Additionally the weight reduction achieved by shifting from glass bot- I
ties to paper containers increased the payload for any given truck by about one third These two factors stimushy
Sheldon W Williams et al Organization and Competition in the Midwest Dairy Industries Iowa State University Press Ames Iowa 1970 ch 2
2Roland Bartlett et aI Outer Market Distribution of Milk in Paper Conshytainers in the North Central Region North Central Regional Publication No 39 Purdue University Agricultural Experiment Station Lafayette Indiana October 1953 p 11
lIbido Agricultural Marketing Service Packaged Fluid Milk Sales in Federal Orshy
der Markets during November 1973AMS-553 US Department of Agriculture Washington DC July 1977 p 7
Table 1 Number of fluid milk plants in Minnesota by volshyume processed1956-17
Percentage change
Annual volume 1956 1966 1977 1956-66 1966-77
(1000 pounds) --------n u m be r-------shyUnder500 77 19 1 -75 -94 500-999 73 13 2 -82 -85 1000-2499 72 25 5 -65 -80 2500-4999 27 11 1 -59 -91 5000-9999 21 10 4 -52 -60 10000 and over ~ 26 16 37 -38
All plant sizes 289 104 29 -64 -72 Sources RD Knutson Price and Trade Practice Regulation in the Minnesota
Dairy Industry unpublished PhD thesis University of Minnesota 1967 p 82 and Minnesota Department of Agriculture Division of Dairy Practices
lated a shift from predominantly home delivery distrishybution to distribution to retail stores
Changes in numbers and sizes of fluid milk processshying plants were accompanied by changes in distribution methods In Minnesota we have observed a shift to satshyellite distribution of fluid milk Le distribution from bottling plants located in the Twin Cities area to satellite distribution facilities located in out-state regions Typishycally satellite distribution facilities are former bottling plants equipped to receive semi-trailer loads of bottled milk and to distribute milk on regular wholesale and reshytail routes
This study focuses on the estimation of fluid milk processing and distribution costs Processing costs are estimated using the economic-engineering method for alternative sizes of processing plants in Section II Estishymates of milk distribution costs for various types of disshytribution routes are presented in Section III This inforshymation should prove useful to milk processing firms in planning expansion of existing plants and scale and loshycation of new plants and in determining least cost distrishybution practices It also should indicate the factors that are likely to influence changes in numbers and sizes of fluid milk processing plants in the future
Economic-Engineering Analysis of Fluid Milk Processing Costs Method of Analysis ifications provided by architects engineering firms
equipment manufacturers and industry personnel The economic-engineering approach was used to esshy These specifications include plant layouts equipment
timate costs of fluid milk processing With this proceshy needs operating supplies energy needs labor requireshydure hypothetical plants are designed using plant spec- ments and management needs Costs of constructing
3
and operating these plants are computed with prices Table 2 Product mix of model fluid milk plants and wages for a given period of time usually a recent Weekly productionyear Depreciation and interest charges are standardized Percentage (gallons) for all model plants To estimate economies of scale sevshy Product distribution Plant I Plant II Plant III eral different size model plants can be constructed rangshy
Homogenizeding from small to maximum feasible size of operation whole milk 28 14000 56000 112000
Among the advantages of the economic-engineering Two percent milk 42 21000 84000 168000approach in determining optimum plant size and econoshy One percent milk 8 4000 16000 32000mies of scale for processing are Skim milk 13 6500 26000 52000
(1) All costs are evaluted at the same price level Chocolate milk 5 2500 10000 20000(2) Rates of plant utilization can be held constant Half-and-half 4 2000 8000 16000
for all plant sizes Total 100 50000 200000 400000(3) Product mix may be held constant for all plant
sizes Table 3 Weekly container use for three model fluid milk(4) The technology embodied in equipment and fashy
plantscilities is the most modern or recent Plant I Plant II Plant III (50000 (200000 (400000 PercentComparison may show existing plant costs to be galwk) galwk) galwk) of milk
lower than costs for the hypothetical optimums The reason for this is that existing plants usually will be Gallon 26520 106080 212160 530 calculating depreciation and paying interest on capital Half gallon 29800 119200 238400 300 purchased at a much lower price and interest rate Quart 3000 12000 24000 15
240 1920 In this section we estimate in-plant costs for three Pint 960 Half pint 96800 387200 774400 120model fluid milk plants Plant I processing 50000 Five gallon 350 1400 2800 35gallons of milk per week Plant II processing 200000
gallons per week and Plant III processing 400000 Less than 1 percent gallons per week This represents the size range of most fluid milk processing plants currently operating in Each model plant is assumed to package 965 pershyMinnesota cent in paperboard containers and 35 percent in fiveshy
The product mix in each plant was a standardized gallon disposable bag containers (Costs of packaging combination of fluid milk items (table 2) Product mix milk in alternative containers are investigated in anshywas standardized to eliminate cost differences caused other report S) Table 3 shows the breakdown by conshyby variations in proportions of products handled The tainer size The container size mix was based on producshyspecified product mix was based on production records tion records of local processing firms for May 1977 The of several local milk processors for May 1977 Although processing firms reported that sales in gallon containers the impact of product mix on costs was not investigated were growing relative to sales in half-gallon containers6 it is anticipated that probable plant variations from proshy
5Martin L Fischer and Jerome W HammondCoss and Impacts of Alternashyportions of the products specified in table 2 will have tive Milk Packaging Systems Economic Report ER78-7 Department of Agriculshyvery little impact on total processing costs tural and Applied Economics University of Minnesota November 1978
Table 4 Inventory and processing schedule for model plant processing 50000 gallons per week
Milk inventory Monday Tuesday Wednesday Thursday Friday Saturday Sunday
-------------------------------------------------------9 a lion s ------------------------------------------------------shyBeginning raw milk inventory 5715 430 deg 5715 2100 2340 0 Raw milk receiptsmiddot 5715 10570 5715 ~ 9570 7000 5715
TOTAL 11430 11000 5715 11430 11670 9340 5715
Milk processed Whole (35) 3630 2530 0 3070 1681 3089 0 2 bullbullbullbullbullbullbullbullbullbullbullbullbullbullbullbullbullbullbullbullbullbullbullbull 4620 4620 0 3922 3919 3919 0 100 880 880 0 748 746 746 0 Skim 1430 1430 deg 1214 1213 1213 0 Chocolate 0 1100 0 0 1400 0 0 Half and half 440 440 __0 ~ 371 373 0
TOTAL 11000 11000 0 9330 9330 9340 0
Raw milk holdover 430 0 5715 2100 2340 0 5715 Finished product sales 8330 8330 8330 8330 8330 8330 0 Finished product holdover 13990 16660 b 8330 9330 10330 11320 11320
Raw milk received from market associations by days Tuesday 4855 gallons Friday 3855 gallons Saturday 1285 gallons bSufficient to meet Wednesday and Thursday demand
4
For comparability with actual plants in this region model plants In the following sections the cost comshythe model plants were assumed to process milk 5 days ponents are developed for the hypothetical plants All per week distribute milk 6 days per week and receive costs are calculated at late 1977 and early 1978 price milk from producers 7 days per week Daily raw milk levels receipts from producers were assumed to account for 80 percent of milk requirements with the remaining 20 percent from milk supply plants Tables 4 5 and 6 Capital Investments show inventory and processing schedules for the model plants These data were used to determine Capital investments are required for processing inshyequipment size and space requirements for the three puts with a useful life greater than 1 year These include
land buildings and equipment
6The trend toward more sales in gallon containers relative to half gallons LAND also exists in the national market See Agricultural Marketing Service Packaged Fluid Milk Sales in Federal Milk Order Markets op cit Us Department of The model plants require sufficient space to (1) acshyAgriculture p 2
7Based on criteria in USDA Agricultural Marketing Service Layouts and commodate buildings (2) maneuver trucks into place Operating Criteria for Automation of Dairy Plants Processing Milk Half-andshy for loading and unloading (3) allow ample parking andHalf Cream Chocolate Drink and Buttermilk Marketing Research Report No 591 Washington DCbull September 1963 (4) allow for plant expansion The cost including land
Table 5 Inventory and processing schedule for model plant processing 200000 gallons per week
Milk inventory Monday Tuesday Wednesday Thursday Friday Saturday Sunday
------------------------------------------------------- 9 a lion s ------------------------------------------------------shyBeginning raw milk inventory 22855 17150 0 22855 7610 7610 0 Raw milk receipts 37145 25700 22855 22855 38100 30490 22855
TOTAL 60000 42850 22855 45710 45710 38100 22855 -- shy
Milk processed Whole (35) 11998 11998 0 10668 10668 10668 0 200 bull 17997 17997 0 16002 16002 16002 0 1 bullbull 3428 3428 0 3048 3048 3048 0 Skim 5571 5571 0 4953 4953 4953 0 Chocolate 2140 2140 0 1905 1905 1905 0 Half and half 1716 1716 __0 1524 1524 1524 0-- shy
TOTAL 42850 42850 0 38100 38100 38100 = 0
Raw milk holdover 17150 0 22855 7610 7610 0 22855 Finished product sales 33330 33330 33330 33330 33330 33350 0 Finished product holdover 57140 66660b 33330 38100 42870 47620 47620
Milk received from market associations by days Monday 14290 gallonsTuesday 2845 gallons Friday 15245 gallons Saturday 7634 gallons bSufficient to meet Wednesday and Thursday demand
Table 6 Inventory and processing schedule for model plant processing 400000 gallons per week
Milk inventory Monday Tuesday Wednesday Thursday Friday Saturday Sunday
-------------------------------------------------------9 a lion s ------------------------------------------------------shyBeginning raw milk inventory 45710 25000 0 45710 15230 9040 0 Raw milk receipts 65000 60710 45710 45710 70000 67160 45710
TOTAL 110710 85710 45710 91420 85230 76200 45710
Milk processed Whole (35) 24000 24000 0 21330 21330 21340 0 2 bull 35997 35997 0 32000 32000 32000 0 100 bullbullbull 6857 6857 0 6095 6095 6095 0 Skim 11142 11142 0 9905 9905 9905 0 Chocolate 4285 4285 0 3810 3810 3810 0 Half and half 3429 3429 0 3050 3050 3050 0
TOTAL 85710 85710 0 76190 76190 76200 0
Raw milk holdover 25000 0 45710 15230 9040 0 45710 Finished product sales 66665 66665 66665 66665 66665 66675 0 Finished product holdover 114285 133330b 66665 76190 85715 95240 95240
Milk received from market associations by days Monday 19290 gallonsTuesday 15000 gallons Friday 24290 gallons Saturday 21450 gallons bSufficientto meet Wednesday and Thursday demand
5
acquisition roadway and site development (blacktop driveways and parking areas) and engineering fees is $13500 per acre This is based on an architectural firms estimate for industrial land outside metropolitan areas Land cost would be considerably higher within a metroshypolitan area Total land investment for alternative plant sizes are
Acres Cost Plant I 3 $40500 Plant II 4 $54000 Plant III 5 $67500
BUILDINGS
Buildings were designed according to engineers recommendations and to meet the recommendations in USDA Layouts and Operating Criteria8 They meet state standards for food processing plants and new energy use requirements specified in the states uniform building code The major components of each plant are (1) tanker receiving and cleaning area (2) raw milk storage area (3) processing area (4) filling area (5) cold storage room (6) container storage room (7) dry storage room (8) laboshyratories (9) boiler room (10) refrigeration room (11) clean-in-place (CIP) equipment room (12) locker rooms (13) offices and (14) truck maintenance garage
Components were arranged to provide short and direct paths of flow of products and containers Space requirements for various storage rooms were based on the number and size of items stored the method of stacking and the length of storage period Table 7 shows space requirements for the model plants
Construction costs for this type of building were $33 per square foot in early 1978 according to a consulting firm specializing in milk plant design This figure inshycludes general building costs mechanical costs (heating ducts plumbing ventilation etc) electrical costs and architectural and engineering fees Total building inshyvestment ranges from $446490 for Plant I to $1612017 for Plant III On a per gallon processed weekly basis building investment declines from $893 in Plant I to $403 in Plant III (table 7)
EQUIPMENT
Plant equipment was selected to meet efficiently and economically the requirements of daily processing schedules and to allow for a 10 percent growth in output without substantial alterations in the equipment stock
Plant I Equipment Receiving equipment in the 50000-gallon-per-week plant includes a 100-gallonshyper-minute receiving pump a receiving control panel a two-tank automatic CIP system and a transport-tanker washer The three raw milk storage tanks for Plant I have a combined storage capacity of 14000 gallons
Milk is standardized on fat content and clarified cold in Plant I with a 15000-pounds-per-hour separator Standardized milk is returned to the appropriate raw storage tank or pumped directly to the high temperature
8Agricultural Marketing Service Layouts and Operating Criteria for Autoshymation ofDairy Plants Processing Milk Half-and-Half Cream Chocolate Drink and Buttermilk Marketing Research Report No 591 US Department of Agriculshyture Washington DCbull September 1963
Table 7 Comparison of space requirements and building investment for three model milk processing plants
Plant I Plant II Plant III (50000 (200000 (400000
Room or area galwk) galwk) galwk)
---------------- square feet --------------shyRaw milk receiving 1792 2244 2692 Processing area 860 1200 1720 Filling area 1505 3010 4034 Laboratory 72 267 267 CIProom 220 309 309 Cold room 1787 5715 10000 Case storage 1032 4126 8254 Dry warehouse 830 3078 3800 Container storage 858 1855 3185 Refrigeration
equipment room 633 1155 2310 Boiler room 462 924 1100 Mechanical and
electrical 475 627 834 Truck maintenance
garage 1353 2706 2706 Mens locker room 205 205 272 Womens locker
room 96 205 272 Corridor 122 245 326 Offices lunchroom
reception area 1228 5700 6768 Total space 13530 33571 48849
Total building investment $446490 $1107843 $1612017
Building investment per gallon processed weekly $893 $554 $403
short time processing system The HTST system consists of a balance tank a 15000-pounds-per-hour plate heat exchanger with 85 percent heat regeneration capability a 15000-pounds-per-hour homogenizer a positive disshyplacement timing pump a flow diversion valve a vashycuumizer and a control panel Pasteurized homoshygenized milk flows to one of three surge tanks which have a combined storage capacity of 7000 gallons
Surplus cream is pumped by the standardizer to a 2000-gallon cream storage tank Half-and-half and chocolate products are pasteurized in insulated mixing and blending vats
Filling equipment in Plant I consists of a 30-cartonshyper-minute (CPM) gallon filler and handle applicator a 33 CPM half-gallon filler a 75 CPM half-pint to quart filler and a 5-gallon bag filler Each paperboard filler is equipped with a carton conveyor a loop case inverter and an automatic caser
Cleaning equipment in Plant I includes a two-tank automatic CIP system and two clean-out-of-place (COP) portable wash tanks
Case handling equipment includes one automatic step-down case stacker for each paperboard filling mashychine a 20-case-per-minute case washer in-floor conshyveyors from filling area to the cold room from the cold room to the load-out area and from the load-in area to
6
the case storage room and an overhead conveyor from case storage to filling area
Refrigeration requirements in Plant I were estimated to be 10 tons of refrigeration (TR) for cold room and 16 TR for milk cooling in process Refrigeration equipment including an ammonia receiver compressor condenshysor glycol pumps and cold room cooling units was recommended by a local refrigeration equipment firm specializing in dairy plants on the basis of these refrigershyation needs
Product and water heating requirements on peak days are estimated at 33 million British thermal units (BTUs) per hour in Plant 1 Two 75 boiler horsepower (BHP) boilers were recommended by a local boiler manufacturing firm This combination gives 150 pershycent of peak product and water heating requirements to enable continued plant operation if one boiler malfuncshytions and to provide for plant heating requirements
Figure 1 shows operating schedules for major items of processing equipment in Plant 1This shows the times required for receiving separating clarifying pasteurizshying homogenizing filling and cleaning operations on peak operating days
Plant II Equipment Plant II receiving equipment operates at 200 gallons per minute The four raw milk storage tanks for Plant II give a combined storage capacshyity of 50000 gallons
The standardizer and HTST system for Plant II opershyate at 50000-pounds-per-hour Chocolate products and half-and-half are vat-pasteurized in plant II
Filling equipment in Plant II includes a 60 CPM galshylon a 75 CPM half-gallon filler a 170 CPM twin-line half-pint to quart filler and a 5-gallon bag filler (The twin-line has two 85 CPM half-pint to quart fillers joined by a single control panel The twin-line unit costs less than two single-line fillers but its major advantage is that only one operator is required as opposed to two operators for two single-line fillers) The twin-line filler is equipped with a carton combiner Each paperboard filler is equipped with a carton conveyor an automatic caser and a loop case inverter
Cleaning equipment in Plant II includes a three-tank automatic CIP system and two COP portable wash tanks The case washer and automatic case unstacker operate at 40 cases per minute in Plant II
Refrigeration equipment was selected on the basis of an estimated 63 TR needed for milk cooling in process and 313 TR needed for the cold room
Two 200 BHP boilers were selected based on an esshytimated 95 million BTUs peak water and product heatshying requirements This combination gives 150 percent of peak product and water heating requirements and should be sufficient for plant heating
Figure 2 shows Plant IIs peak day operating schedshyules for major items of equipment This illustrates the time periods required for major operations within the plant
Plant III Equipment Receiving equipment in the 400000-gallon-per-week plant includes a 300-gallonshyper-minute positive displacement receiving pump a
two-tank automatic CIP system two transport-tanker washers and a receiving control panel The four raw milk storage tanks selected for Plant III give a combined storage capacity of 90000 gallons
Plant III is equipped with two 50000-pounds-pershyhour HTST systems The standardizer is located downshystream from the plate heat regenerator Chocolate prodshyucts are prepared from pasteurized milk in a tri-blender
Filling equipment in Plant III includes two 60 CPM gallon fillers and handle applicators a 125 CPMhalfshygallon filler two twin-line 170 CPM half-pint to quart fillers equipped with carton combiners and two 5-galshyIon bag fillers Paperboard fillers are equipped with carton conveyors loop case inverters and automatic casers
Plant III has two three-tank automatic CIP systems and a single COP portable wash tank Two 40-case-pershyminute washers and automatic case unstackers are reshyquired in this plant
Refrigeration equipment was selected based on an estimated 129 TR needed for milk cooling and 596 TR needed for the cold room
Two 300 BHP boilers were incorporated into Plant III based on an estimated 136 million BTUs per hour peak water and product heating requirements This combination is sufficient to enable continued plant opshyeration if one boiler malfunctions and to provide for plant heating
Figure 3 shows Plant III operating schedules for mashyjor items of equipment on peak operating days
Table 8 summarizes equipment costs for the three model plants Total equipment investment ranges from $1009690 in Plant I to $3211110 in Plant III Equipshyment cost per gallon processed weekly declines sharply from $2019 for the 50000-gallons-per-week plant to $952 for the 200OOO-gallons-per-week plant for the 400OOO-gallons-per-week plant equipment cost per
Table 8 Summary of equipment costs for three model fluid milk plants
Egui~ment cost Plant I Plant II Plant III
Operation or function
(50000 galwk)
(200000 galwk)
(400000 galwk)
Receiving $ 27500 $ 27860 $ 32450 Rawmilkand
cream storage 65900 118440 159600 Processing 213555 412530 708030 Surge tanks 37800 49800 102600 Filling and casing 282825 555455 1120110 Milk testing
CIP COP 20800 83100 91400 Case handling 203450 289900 474200 Refrigeration 77560 131420 190920 MechanicaL 70500 223200 316000 Miscellaneous 9800 12800 15800
TotaL $1009690 $1904505 $3211110
Equipment investshyment per gallon processed weekly $2019 $952 $803
7
Equipment ------------------------- Hours of day ------------------------ shy
Sam 6 7 8 9 10 11 12 1 2 3 4 5 6 7pm
II I I II I I 1111111111 III d II II I I I II I I II I I I 111111111111 A I N H CC5000 gal storage (a)
5000 gal storage (b) I A D A F I E CC
2000 gal storage -N D Icc IA GI CC
2000 gal cream storage U GI u 15000 separatorclarifier D C FIE DD
15000 HTST I H K I J BB
1500 gal pasteurizing vat P 1 ~ BB
1000 gal pasteurizing vat G M BB
4000 gal surge P W I IR yl CC
2000 gal surge 01 V lolx cc 1000 gal surge S AA CC
Gallon filler W V T yTIx cc - gal filler w V 1 y IIx AA CC
Ouart - pint filler W IV Z AA CC
5 - gal filler Iwivi Ix AAI 1DD Sanitary lines I BB CC I
A Receive 38raw milk K Process 01 skim U Hold cream
B Receive 01 skim L Process 20 chocolate V Fill 35 whole
C Standardize for 35 whole M Process half-and-half W Fill 20
D Standardize for 20 N Hold 38 raw milk X Fill 10
E Standard ize for 10 O Hold 35 whole milk y Fill 01 skim
F Standardize for 01 skim P Hold 20 Z Fill half-and-half
G Standardize for half-and-half O Hold 10 AA Fill 20 chocolate
H Process 35 whole R Hold 01 skim BB Clean in place (hot)
I Process 20 S Hold 20 chocolate CC Clean in place (cold)
J Process 10 T Hold half-and-half DD Clean manual
Output (gallons) Gal - gal Ot - pt 5 - gal Total
Skim 830 500 100 1430 1 500 320 60 880 2 2696 1300 624 4620 Whole 1804 380 186 60 2530
Half-and-half 440 440 Chocolate 800 235 65 100
Total 5830 3300 1485 385 1000
Figure 1 Assumed Tuesday equipment operating schedule for Plant I
8
Equipment ------------------------- Hours of day ------------------------ shy
5am 6 7 8 9 10 11 12 2 3 4 5 6 7pm
I I I I I I I I I I I I I I II I I I I II I II II I II I I I I I I I II I I I I I I I I ll~ J I I IU
N20000 gal silo (a) 20000 gal silo (b)
5000 gal storage (a) 5000 gal storage (b)
5000 gal cream storage 50000 separatorclarifier
50000 HTST 2500 gal pasteurizing vat
2000 gal pasteurizing vat 10000 gal surge 5000 gal surge 2000 gal surge
Gallon filler y - gal filler Quart - Y pint filler 5 - gal filler
Sanitary lines
A Receive 38 raw milk
B Receive 01 skim
C Standardize for 35 whole
D Standardize for 20 E_ Standardize for 10 F Standardize for 01 skim
G Standardize for half-and-half H Process 35 whole
I Process 20 J Process 1 0
Output (gallons)
Skim
1
2 Whole Half-and-half Chocolate
Total
D CC I A I FIE I CC
A N D C CC
I B R G CC
A N FI CC
U G u D C F I E I DD
I I H K I J I BB P L I BB
M Z BB I P I w P I L r AA II cci
0 V TQ X T cc R Y
w V Y X w V Y X
I
I I I w V I Z
Iv Iy xl
K Process 01 skim
L Process 20 chocolate
M Process half-and-half
N Hold 38 raw milk
O Hold 35 whole milk
P- Hold 20 Q Hold 10 R Hold 01 skim S Hold 20 chocolate
T Hold half-and-half
Gal Y - gal
3301 1680
1809 1204
10540 5729
7060 3600
642
22710 12855
Figure 2 Assumed Tuesday equipment operating schedule for Plant II
9
U V W X
Y Z
AA BB CC DD
Qt - Y pt
1728
918
1716 1423 5785
CC
I cc IAA CC
AA CC I IAAI DD
BB CC
Hold cream Fill 35 whole
Fill 20 Fill 10 FillOlskim Fill half-and-half Fill 20 chocolate Clean in place (hot) Clean in place (cold) Clean manual
5 - gal Total
590 5571 415 3428
17997 420 11998
1716 75 2140
1500 42850
gallon processed weekly is $803 An itemized list of $4890627 in Plant III (table 9) Investment per gallon equipment costs is in Appendix tables A-I to A-3 processed weekly declines sharply from $2993 with a
weekly output of 50000 gallons to $1533 with a weekly SUMMARY OF INVESTMENTS output of 200000 gallons When weekly output rises to
400000 gallons investment per gallon processedTptal investment in land buildings and equipment weekly falls still further to $1223 is $1496680 in Plant 1 $3066348 in Plant II and
Equipment -------------------------- Hours of day ------------------------ shy
5am 6 7 8 9 10 11 12 1 2 3 4 5 6 7pm
I I I II I I II I I II I III I I I I I I I I I I I I I I I I I I I I I I I I I I I I I I I I II I II I ll~ -N I I AI N I J I cc30000 gal silo (a)
A I H I cc30000 gal silo (b) N CC20000 gal silo I A KI
B R K CC10000 gal silo I I I
10000 gal cream storage I ccll u MI u bull 50000 HTST (a) I I I J I BB 50000 HTST (b) I H MI K r BB
L BBTri-blender T
15000 gal surge (a) Ip I w I BB V L AA15000 gal surge (b) 101 I T I BB
X BB10000 gal surge loT 5000 gal surge (a) T RT Y BB 5000 gal surge (b) T Z I BB
W X CCGallon filler (a) I T Galion filler (b) I V I I Y CC
h - gal filler I V I W I Y X AA T CC W T y -I z CCOuart - h pint filler (a) I T I AA I
Ouart - h pint filler (b) I IW V Z AA CC
5 - gal filler (a) Iv wi AA DD 5 - gal filler (b) Iv wT AA DD
BB CCSanitary lines
A Receive 38 raw milk K Process 01 skim U Hold cream
B Receive 01 skim L Process 20 chocolate V Fill 35 whole
C Standardize for 35 whole M Process halfmiddotand-half W Fill 20
D Standardize for 20 N Hold 38 raw milk X Fill 10
E Standardize for 10 O Hold 35 whole milk Y Fill 01 skim
F Standardize for 01 skim P Hold 20 Z Fill half-and-half
G Standardize for halfmiddotand-half O Hold 10 AA Fill 20 chocolate
H Process 35 whole R Hold 01 skim BB Clean in place (hot)
I Process 20 S Hold 20 chocolate CC Clean in place (cold)
J Process 10 T Hold half-and-half DD Clean manual
Output (gallons) Gal h - gal Qt - h pt 5 - gal Total
Skim 6685 3900 557 11142 1 4114 2743 6857 2 19000 9600 5397 2000 35997 Whole 15627 7270 273 830 24000 Half-and-half 3429 3429 Chocolate 2200 1915 170 4285
Total 45426 25713 11571 3000 85710
Figure 3 Assumed Tuesday equipment operating schedule for Plant III
10
Table 9 Investment in land buildings and equipment for three model fluid milk plants
Cost Plant I Plant II Plant III (50000 (200000 (400000
Item galwkl galwkl galwkl
Land $ 40500 $ 54000 $ 67500 Building 446490 1107843 1612017 Equipment 1009690 1904505 3211110
TotaL $1496680 $3066348 $4890627
Investment per gallon processed weekly $2993 $1533 $1223
Plant Operating Costs Processing costs include all costs incurred from the
moment raw milk enters the plant until the finished product leaves the cold storage room Costs of acquiring raw milk andor distributing finished products are not included For purposes of cost estimation plants were assumed to achieve 93 percent of machine-rated output per hour in standardizing and processing operations and 85 percent of machine-rated output per hour in fillshying operations The remaining 7 percent processing and 15 percent filling time represent an allowance for time required in machine startups product changeovers container changeovers and machine malfunctions These efficiencies are the maximum that can be achieved under actual operating conditions according to local plant managers
INTEREST
Interest represents the cost of borrowed funds For the analysis we assumed that all capital funds were borshyrowed although this need not be the situation for actual plants At the time the study was conducted commershycial interest rates for special purpose plant and equipshyment financing ranged from 9-34 to 10-12 percent annushyally For the analysis a rate of 10 percent was used and applied to the average value of buildings and equipment over their expected lifetimes Weekly interest charges amounted to $1400 in Plant I $2896 in Plant II and $4638 in Plant III
DIRECT LABOR
Labor requirements were estimated fat each activity from information provided by a local engineering firm (table 10) Excluding office workers and route drivers seven employees are needed in Plant 119 employees in Plant II and 34 employees in Plant III9 The labor proshyductivity ratio in Plant I is 177 gallons per manhour Plant II 254 gallons per manhour and Plant III 282 galshylons per manhour
The base wage for hourly employees was $750 per hour Employee benefits including payroll taxes workmans compensation unemployment insurance
9-fter adjusting for differences in product and container mix machine operating rates and weekly output these labor requirements are consistent with those estimated by the USDA inLayouts and Operating Criteria op cit pp 26shy2739-40
pensions and uniforms added 25 percent to the base wage Table 11 shows the computation of weekly labor cost Table 10 Estimated weekly labor requirements for three
model fluid milk plants
Plant I Plant II Plant III (50000 (200000 (400000
Operation galwk) galwkl galwkl
--------------m a n hours-------------shyReceiving cleaning
tankers 30 40 80 Separate HTST 40 120 200 Filling 80 130 230 Cold storage 30 140 240 Case storage 10 40 80 Warehouse and supply
handling 20 80 160 Cleanup and janitorial 20 80 160 Maintenance 40 80 120 Relief 40 80
Total regular hours 270 750 1350 Overtime hours 5 13 ~ ~
Total hours 283 788 1418
Table 11 Total direct labor cost for three model fluid milk plants
Plant I Plant II Plant III
Weekly base wage ($750hr) $2025 $5625 $10125
Weekly overtime wages ($1125hr) 146 428 765
Total wages $2171 $6053 $10890 Cost of benefits 2723~ JampJl
Total direct labor costs $2714 $7566 $13613
ADMINISTRATIVE AND CLERICAL LABOR
Administrative and clerical personnel include ofshyfice workers and clerical workers associated primarily with in-plant activities Payroll expense plus cost of benefits for administrative and clerical labor was comshyputed at 83 percent of total direct labor cost for the three model plants This computation was based on adminisshytrative and clerical labor expenses reported by several plant managers
EQUIPMENT DEPRECIATION
All equipment was depreciated on a straight-line bashysis according to expected useful operating life Accordshying to equipment sales personnel storage tanks surge tanks and case handling equipment have an expected useful operating life of 25 years The remaining equipshyment is expected to last 15 years This measure ignores possible variations caused by equipment being used with different intensity ie for different numbers of hours per year
BUILDING DEPRECIATION
Buildings were depreciated on a straight-line basis over 33 years
11
CONTAINERS
Volume discounts on containers are available Weekly container costs were based on manufacturers prices under the 3-month plan and on the container mix shown in table 3 Under the 3-month plan a dairy purshychases a 3-month supply of each container at a savings over the cost if purchased more frequently Table 12 shows container cost by size of container Container cost per gallon packaged declines from $1049 for the 50000shygallons-per-week plant to $1031 for the 400000-galshylons-per-week plant a reduction of 17 percent
Table 12 Weekly container cost for three model fluid milk plantsmiddot
Container size Plant I Plant II Plant III
One gallon $2259 $ 8998 $17996 Half-gallon 1296 5148 10204 Quart 78 305 606 Pint 5 18 36 Half-pint 1202 4724 9448 Five-gallon 140 560 1120 Handles and
staples 265 938 11823 TotaL $5245 $20691 $41233
Container cost per gallon $1049 $1035 $1031
Based on two-color paperboard containers
SUPPLIES
The three model plants use a wide assortment of cleaning laboratory janitorial and office supplies The cost of these items is relatively constant for all plant sizes For this reason cost estimates for supplies are based on the expense records of existing plants
REPAIRS AND MAINTENANCE
Cost of building and equipment repairs and mainteshynance are based on the expense records of existing plants Estimated weekly costs for specialized repair lashybor andfor supplies used in repairs and maintenance are $201 in Plant I $1572 in Plant II and $3528 in Plant III (These figures exclude the cost of regular repair labor which is included above with direct labor cost)
CASE EXPENSE
For every milk case loaded daily approximately six empty cases await pickup at various points along distrishybution routes and in the case storage room Assuming an average of 425 gallons per case plants must maintain an inventory of 165 cases per gallon of daily output At a cost of $3 per case and a 12 percent annual replacement rate the weekly case expense is $114 in Plant I $457 in Plant II and $914 in Plant III
ELECTRICITY
Electricity rates were those quoted by a local electric company Its rates include a demand charge and enshy
ergy charge The demand charge is based on peak avershyage kilowatt load during any 15-minute interval The enshyergy charge is based on the total number of kilowatt hours (KWH) used Both demand and energy charges are priced on a decreasing block rate basis leading to lower electricity cost per KWH as quantity of energy used inshycreases
Electricity used in milk processing packaging case handling and refrigeration was calculated by (1) multishyplying motor horsepower by weekly operating hours for each motor (2) adding to get total weekly horsepower hours (Hp-Hrs) (3) adding 20 percent for heat loss due to motor inefficiency and (4) converting to kilowatt hours with the factor 1 Hp-Hr = 7456 KWH To calculate enshyergy used for lighting an architectural consulting firms recommendation of an average 3 watts per square foot of plant space was assumed and applied to the total numshyber of hours per week for which the plants operate Peak load and energy use for the three model plants are
Plant I Plant II Plant III Peak load (KW) 245 6375 11355 Weekly energy use (KWH) 11052 36803 70487
The breakdown by operation for electrical energy is Operation Plant I Plant II Plant III
(kilowatt hours per week) Processing 1091 6914 13970 Filling and casing 517 1690 3523 Case handling 1475 3270 5360 Refrigerations 5655 17557 36342 Lighting 1640 6060 8880 Other ~~ 2412
Total bull 11052 36803 70487
Includes electrical energy used in cooling milk loaded on refrigerashyted trucks
For summer electricity rates electricity cost per week is $519 in Plant I $1472 in Plant II and $2671 in Plant III Costs would be slightly lower with winter elecshytrical rates
FUEL
Plants use natural gas for sealing containers and for water product and plant heating Although boilers are equipped to operate on fuel oil in case natural gas supshyplies are interrupted fuel cost estimates are for natural gas Gas consumption estimates were calculated for two boilers operating at 70 percent of capacity for 33 hours in Plant I 39 hours in Plant II and 42 hours in Plant III and on the actual operating times and gas requirements for filling equipment Estimated weekly gas consumption is 1595 MCF (thousand cubic feet) in Plant 15048 MCF in Plant II and 8386 MCF in Plant III Total natural gas costs were calculated with the current gas price of $22472 per MCF
WATER AND SEWAGE
The weekly cost for water and sewage disposal was based on the costs incurred by existing plants of size comparable to the model plants
12
Table 13 Weekly operating costs for three model fluid milk plants
Plant I (50000 galwk)
Item Weekly cost Costgallon
Interest $ 1400 $0280 Direct labor 2714 0543 Administrative and
clerical labor 225 0045 Equipment depreciation 1137 0227 Building depreciation 260 0052 Containers and handles 5245 1049 Supplies 335 0067 Repairs and maintenance 201 0040 Case expense 114 0023 Electricity 519 0104 Fuel 358 0072 Water and sewage 128 0026 Taxes and insurance 434 0087 Product loss 271 0054
Total abullbullbullbullbullbullbullbullbull $13341 $2668
aNumbers in cost per gallon columns may not add to totals due to rounding
TAXES AND INSURANCE
Property taxes were applied to 43 percent of the avshyerage value of land and buildings over the expected useshyful operating life of the buildings (In Minnesota taxes apply to 43 percent of the assessed market value of land and buildings) No adjustments were made for land inshyflation The mill rate used was 130 representative for urban locations Weekly property taxes amounted to $284 in Plant I $654 in Plant II and $939 in Plant III
Boiler fire and refrigeration system insurance based on premiums suggested by a local insurance agency was $150 per week in Plant I $161 in Plant II and $237 in Plant III
PRODUCT LOSS
Product loss was computed at 06 percent of weekly production in all plants A milk price of $1050 per hunshydredweight was used to compute this cost
TOTAL FLUID MILK PROCESSING COSTS
Table 13 summarizes fluid milk processing costs for the three model fluid milk plants Estimated cost per galshylon declines from $2668 in Plant I to $2145 in Plant II and $2025 in Plant III These results suggest that modshyern fluid milk processing operations are characterized by economies of size but that these economies tend to level out rapidly for plants with output of more than 200000 gallons per week Costs decline by $0523 per ~allon (20 percent) as plant size increases from 50000 to 200000 gallons per week but by only $0120 per gallon (56 pershycent) when plant size is increased from 200000 to 400000 gallons per week
the major savings for large-scale operations ate in labor and capital costs Labor cost declines by $0203 per gallon when output grows from 50000 to 400000 gallons per week Higher labor productivity in the large-scale plants resulting from the use of high-speed
Plant II Plant III (200000 galwk) (400000 gallwk)
Weekly cost Costgallon Weekly cost Costgallon
$ 2896 $0145 $ 4638 $0116 7566 0378 13613 0340
628 0031 1130 0028 2207 0110 3739 0093
646 0032 939 0023 20691 1035 41233 1031
1340 0067 2680 0067 1572 0079 3528 0088
457 0023 914 0023 1472 0074 2671 0067 1134 0057 1885 0047
383 0019 670 0017 815 0041 1176 0029
1086 0054 2172 0054 $42893 $2145 $80988 $2025
processing and filling equipment is the source of lower labor cost per gallon
Interest and depreciation costs decline by $0327 per gallon as weekly output increases from 50000 to 400000 gallons This savings results from substantially lower investment requirements per gallon of weekly output for large plants
The most important category of total processing cost is containers accounting for 39 to 51 percent of weekly costs Labor costs account for 18 to 22 percent of total costs for the model plants Capital costs interest and depreciation contribute 11 to 21 percent to total cost
Effects of Seasonality on Processing Costs
Because of seasonal variations in fluid milk sales all fluid milk firms experience variation in plant utilization levels Generally peak daily sales occur in October or November and sales bottom out in June Daily fluid milk sales in June average 80 to 83 percent of daily sales during October and November10
To determine how seasonality influences processshying costs we estimated weekly operating costs for the three model plants at 80 90 and 100 percent of planned output Interest taxes insurance depreciation and adshyministrative costs were h~ld constant Costs for hourly labor containers supplies and other variable items were reduced in proportion to output Figure 4 shows the effects of seasonality on per-gallon operating costs Costs per gallon are 4 to 6 percent higher when plants operate with 20 percent excess capacity than when they operate at planned capacity Note that the impact of seasonality is greater for small than for large plants
10Agricultural Marketing Service Federal Milk Order Market Statistics Annual Summary for 1976 Statistical Bulletin No 575 US Department of Agri culture June 1977
13
29
28
Processing cost (cents per gallon)
PIn1 Plant util ization level 80 bull
27 90 X 100 bull
26
25
24
23
22
21
20
-Weekly-------rl-~~~~I~~~~I~~~I-+I~I~~-rl~~~I-I~I~~-+~~-I~I~~~~I~I~I~~-+------production
40 80 120 160 200 240 280 320 360 400 (1000 gals)
Figure 4 Effects of plant size and utilization level on fluid milk processing costs for three model fluid milk processing plants
Fluid Milk Distribution Costs in Minnesota
Fluid milk distribution costs -- essentially the costs of selling transporting and delivering milk -- comprise an important part of the total cost of fluid milk firms In this section milk distribution costs are estimated for several kinds of distribution routes including retail (home delivery) wholesale and long-distance overshythe-road routes The latter are routes on which milk is transported from a central bottling plant to a distribushytion facility and from the distribution facility to wholeshysale outlets The economic-engineering approach also was used for these cost estimates Equipment firms proshyvided equipment costs Labor requirements and route characteristics were determined from a survey of milk routes Wages and prices used in this study are those prevailing in Minnesota during 1977-78
Vehicle Costs ACQUISITION COSTS
Milk distribution vehicles consist of an insulated van body or trailer a refrigeration unit and a chassis truck or diesel tractor Tables 14 and 15 show prices for components and for appropriately matched combinashytions of components Prices for vans range from $10100 for a 10-foot unit to $53555 for a 22-foot unit with a dieshysel engine Prices for tractor-trailer units range from $41351 for a 3D-foot unit to $65450 for a 42-foot unit Vehicle cost is an increasing function of payload The cost of diesel vans is about double the cost of comparable gasoline units
llIn fact for many Minnesota dairies as well as for dairies in other states distribution costs exceed processing costs See the Federal Trade Commissions study Economic Report on the Dairy Industry Staff Report to the Federal Trade Commission Washington DC March 19 1973 pp 90-94
14
Table 14 Cost offluid milk distribution vehicles and components 1977
Refrigeration Total Chassis Van bodymiddot unitb Payload vehicleVan length
(feet) Model Cost Model Cost Model Cost (cases) cost
10 Ford F-350 $ 4500 BDW-l0 $3300 TNT-20 $2300 100 $10100
12 Ford F-600 7488 BDW-12 3600 TNT-20 2300 175 13388 14 Ford F-751 9788 BDW-14 4000 XMT-50 3500 250 17288 16 (i) Ford LT-800 15722 BDW-16 4300 XMT-50 3500 325 23522 16 (ii) IH Cargo Star 15901 BDW-16 4300 XMT-50 3500 325 23701 18 (i) Ford L T-800 15722 BDW-18 4700 XKW-20 4650 400 25072 18 (ii) IH Fleetstar 19780 BDW-18 4700 XKW-20 4650 425 29130 20 (i) Ford LT-800 15722 BDW-20 5000 XKW-20 4650 425 25372 20 (ii) IH Transtar 4270 with
8V71 Detroit Diesel 35860 BDW-20 5000 XKW-20 4650 500 45510
22 IH Transtar F-4270 with 3208 Cat Diesel 40618 BDW-22 5200 TWO-50 7737 575 53555
aAIl van bodies are Freuhauf brand with 3-inch insulation bAli refrigeration units are Thermo King brand with electric standby Based on 45-pound cases
Table 15 Cost of tractor-trailer components used in fluid milk distribution 1977
Trailer Total Tractor Trailera Refrigeration unitb Payload vehiclelength
(feet) Model Cost Model Cost Model Cost (cases) cost
30 (i) Ford LNT-8000 Great Dane with 3208 Cat Diesel $22351 701 Tl1 $13000 XROL-50 $6000 600 $41351
30 OJ) IH Fleetstar 2050 Great Dane with IHD190 Diesel 23982 701 Tl1 Tandem 14000 XROL-50 6000 700 43982
35 IH Fleetstar F2070A Great Dane with 671 N Detroit Diesel 27000 701 Tll Tandem 14200 Super NWD-50 8450 850 49650
42 Ford CLT-9000 42000 Highway Super NWD-50 8450 1000 65450 901 R-42-6-3T 15000
aAIl trailers are insulated bAli refrigeration units are Thermo King brand with electric standby cBased on 45-pound cases
Table 16 Estimated fixed and variable costs for vans used to distribute milk
Vehicle size (van length in feet) 10 12 14 16 (i) 16 (ii) 18(i) 18 (ii) 20 (i) 20(ii) 22
----------------------------------------------------------------1 977 dolla rs ---------------------------------------------------------------shyFixed costs
(annual) Interest on
investment 66660 88360 114100 155245 156427 164527 192258 167455 300366 353463 Federal highway
usetaxb 8100 8100 8100 9000 9000 12000 12000 12000 12000 12000 Licensee 6200 9100 12600 23000 42000 23000 42000 23000 42000 54000 Insuranced
Metro area 50430 57470 65550 70950 70950 81500 81500 81500 105100 101800 Nonmetro area 26800 31500 31600 34900 34900 41400 41400 41400 55400 52100
Variable costs (per mile)
Depreciation8 101 13288 1383 18818 18961 20058 23304 20298 22755 26778 Repairs and
maintenance 1069 1069 1069 1069 1114 1069 1114 1069 07985 07985
15
22
Table 16 Estimated fixed and variable costs for vans used to distribute milk (continued)
Vehicle size (van length in feet)
10 12 14 16 (i) 16 (ij) 18 (i) 18 (ii) 20 (i) 20 (ii)
--------------------------------------------------------------- 1977 doll a rs ------ -- -- ----------------------------------------------------shy
Fuel 9
Tires h
09
0093 105 0093
1733
012 1733 0175
1733
0175 1840 0175
1840
0175 1840 0175
1185
0175 1058 0175
Total fixed cost per year
Metropolitan Nonmetropolitan
131390 107760
163020 137060
200350 166400
258195 222145
278377 242327
281075 240975
369158 329058
283955 243855
459465 409766
521263 471563
Total variable cost per mile 3072 3541 4305 4859 4918 5090 5459 5114 4434 4703
See footnotes following table 17
Table 17 Estimated fixed and variable costs for tractor-trailers used to distribute milk
Vehicle size (in feet) 30 (i) 30 (ii) 35 42
-------------------------------------------- 1977 do II ars -------------------------------------------shyFixed costs (annual)
Interest on investmentabullbullbullbull 256417 283681 323670 432887 Federal highway use taxbbullbullbullbullbullbull 19500 21000 22200 22200 Licensee 42000 54000 83000 105000 Insuranced
Metropolitan area 97500 95600 85900 92300 Nonmetropolitan area 47800 55400 41900 48300
Variable costs (per mile) Depreciationebullbullbullbullbull 1118 1132 1075 1468 Repairs and maintenance 0805 0805 0805 0720 FueI9bullbullbullbullbullbullbullbullbullbullbull 1168 1168 1102 1102 Tires hbullbullbullbullbullbullbullbullbullbullbullbullbullbullbullbullbullbullbullbullbullbull 0187 0187 0240 0240
Total fixed cost per year Metropolitan area 415417 454281 517480 652387 Nonmetropolitan area 365717 414081 473470 608387
Total variable cost per mile 3278 3292 3288 3530
Calculated at a rate of 12 percent on an average investment of 50 percent of initial vehicle cost bFrom IRS Form 2290 Federal Use Tax Return on Highway Motor Vehicles From Minnesota Department of Transportation dlncludes liability property damage personal injury protection and physical damage and comprehensive coverages based on an average vehicle age of 2 to
3 years Source Drew Agency of St Paul Based on expected lifetime mileages of
100000 miles for 10 to 12 foot vans 125000 miles for 14 to 20 foot vans with gasoline engines 200000 miles for 20 to 22 foot vans with diesel engines 300000 miles for smaller diesel tractors used with 30 foot trailers and 750000 miles for trailers
Refrigeration units were depreciated at the same rate as chassis or tractor IBased on information provided by International Harvester of St Paul gBased on 60 cents per gallon for diesel 63 cents per gallon for regular gasoline and mileage per gallon as follows
7 mpg for 10 foot vans 6 mpg for 12 foot vans 4 mpg for 14 to 20 foot vans with gasoline engines 65 mpg for 20 to 22 foot vans with diesel engines and 6 mpg for diesel tractors
Also included is fuel consumption by refrigeration units Estimated fuel consumption per mile for refrigeration units is Model Fuel consumption per mHe (gallons) TNT-20 0 (runs off fan belt) XMTmiddot50 025 XKWmiddot20 042 TWDmiddot50 021 XROL-50 028 Super NWD-50 017
hBased on six tires for 10 to 14foot vans 10tires for 16 to 22 foot vans (these have tandem rear axles) 14tires on the single axle 30 foot trailer-tractor unit and 18 tires on other trailermiddottractor units with an average mileage per tire of 45000 for tires used on vans and 150000 for tires used on tractors or trailers Tire prices were furnished by Brad Ragen Tires Incorporated of St Paul
16
OPERATING COSTS
Operating expenses for distribution vehicles inshyclude those fixed on an annual basis (interest insurshyance license fees and highway use taxes) and those varying with mileage driven (depreciation repairs and maintenance fuel and tires) Tables 16 and 17 show fixed and variable operating expenses for 14 distribushytion vehicles
License costs shown are for vehicles up to 5 years old For older vehicles license costs are approximately 60 percent of the amounts shown
Insurance coverage includes liability property damage personal injury protection and comprehenshysive Insurance costs shown are for vehicles 2 to 3 years old Insurance on older vehicles is somewhat less costly Note that insurance costs are substantially higher in the metropolitan area than in nonmetropolitan areas
Depreciation was calculated on a straight-line basis over the expected lifetime for each vehicle Expected lifetime mileage estimates reported by dairy transportashytion managers reflect mileage expected under normal operating conditions Depreciation cost per mile varies from 10 cents for a 10-foot van to 27 cents for a 22-foot van with a diesel engine For tractor-trailer combinashytions depreciation per mile varies from 11 cents for a 30shyfoot unit to 15 cents for a 42-foot unit
Repair and maintenance cost per mile was based on the rate schedule of a local firm that offers contracted repair service to dairies Repair and maintenance costs are substantially lower for diesel vans than for comparashyble gasoline vans
Fuel costs were based on mileage estimates proshyvided by local dairy transportation managers and on reshyfrigeration unit fuel requirements indicated by refrigera-
Total annual cost (in thousands of dollars)
185 180 175 170 165 160 155 150 145 140 135 130
tion equipment manufacturers Fuel prices for regular gasoline ranged from 549 to 689 cents per gallon at the time of the study Diesel fuel priCes showed similar varishyability but averaged approximately 3 cents per gallon less than regular gasoline For our fuel cost estimates we used prices of 63 cents for regular gasoline and 60 cents for diesel fuel
Tire costs per mile were based on tire prices and exshypected lifetime mileage estimates provided by a local tire distributor
Comparison of Costs for Diesel- and Gas-Operated Vans
Because of higher purchase price fixed costs and depreciation are higher for diesel vans than for comshyparably sized gasoline-operated vans However diesel units use less fuel per mile and less expensive fuel Also repair and maintenance costs are lower for diesel units Consequently total variable costs for diesel unit~ are lower than for gas units Total annual costs for 20-foot diesel and gasoline operated units are shown in relation to annual mileage in figure 5 This graph shows that when annual mileage exceeds approximately 25000 miles the diesel unit has lower total costs For annual mileage less than 25000 miles the gasoline unit is less costly to operate
Predicting Equations for Vehicle Costs Using the cost data in tables 16 and 17 and the payshy
load data III tables 14 and 15 we developed equations to predict vehicle cost per gallon of milk distributed The
L Total I annual
20000 22000 24000 26000 28000 30000 mHeage
Figure 5 Comparison of total annual operating costs for 20-foot gasoline- and diesel-operated vans
17
Table 18 Predicting equations for vehicle cost per gallon of milk distributed
Equation form AVe = ex + amp(IQ) + i32(RL) Estimated coefficient(standard error)
Equation number and type of route C amp amp2 R2 Restrictions
1 Metropolitan wholesale -01165 2261 or retail (00301 ) (176)
2 Nonmetropolitan wholesale -01216 2193 or retail (00302) (176)
3 Over-the-road -01265 7156 (00335) (981)
AII coefficients are significant atthe 99 percent confidence level
factors determining vehicle cost per gallon are the quanshytity of milk distributed and the length of the distribution route For each type of route predicting equations for unit vehicle costs took the form1z
Ave = a + B1 (1Q)+ Bz(RL) where
Ave = vehicle cost in dollars per gallon of milk deshylivered
Q = quantity delivered in gallons and RL = route length in miles
The range of quantities and route lengths used in estimashytion were those reported for each type of route by fluid milk firm transportation managers The equation should yield positive coefficients on lQ and RL reflecting lower vehicle expense on large-volume routes but higher vehicle expense on long-distance routes
To estimate equations for unit vehicle costs fixed annual costs were allocated for 260 route days for wholesale and retail routes and 160 route days for overshythe-road routes Table 18 shows the estimated equashytions The column labeled restrictions shows the range of quantities and route lengths over which the equations are expected to be valid Wholesale route veshyhicle costs are predicted to fall from $0925 to $0228 per gallon as quantity delivered increases from 300 to 4000 gallons on metropolitan routes 80 miles long (equation 1) For an over-the-road route carrying 4300 gallons costs rise from $01499 to $04799 per gallon as round trip mileage increases from 100 to 400 miles (equation 3)
Labor Expenses The direct labor associated primarily with milk disshy
tribution includes route drivers route supervisors and loading and unloading dock workers Labor costs inshyclude employees base salaries commissions on sales health and life insurance contributions to pension funds unemployment insurance social security and uniforms Table 19 shows annual costs for route drivers Note that route drivers are generally paid by the hour while over-the-road drivers are paid by the mile In addishy
I2This form was selected because it yields results that are (1) consistent with prior expectations and (2) statistically satisfactory
00036 (00003) 91
Valid for quantishyties 50-4000 galshylons and route
00036 91 lengths 30-200 (00003) miles
Valid for quanti shy
00011 (00001 )
96 ) ties 2000-4300 gallons and route length from 50-500 miles
tion to base wages route drivers are paid sales commisshysions Horne delivery drivers usually are paid a straight commission but dairy managers report that annual salashyries for horne delivery drivers tend to be nearly equal to those of wholesale route drivers
Wages benefits and payroll taxes for route drivers account for 80 to 85 percent of total distribution labor costs The remaining distribution labor costs include salaries benefits and payroll taxes for route supervisors and supplementary dock workers
To estimate unit labor costs for retail and wholesale milk distribution it first was necessary to estimate the relationships between labor time per gallon delivered and the quantity delivered route length and number of stops per route Labor cost per minute then was estima~ ted and the coefficients on the labor-time-per-gallon equations were multiplied by the cost-per-minute facshytors for labor employed in retail and wholesale delivery Data on labor time quantity route length and number of stops were obtained in a survey of milk distribution practices for 118 retail and wholesale routes Table 20 summarizes characteristics of these routes The relationshyships between labor time quantity route length and number of stops (standard errors are in parentheses) are 13
wholesale ALT =
3859 + 52877[I1Q] + 0022[RL] + 0121[S] (0425) (1793) (0004) (0009)
retail ALT = 1171 + 16510[I1Q] + 0094[RL] (245) (1341) (0030)
where ALT = labor time in minutes per gallon delivered Q = quantity delivered in gallons RL = route length in miles and S = the number of stops on the route
Labor cost per minute was estimated under the asshysumption that home delivery drivers work an average of 50 hours per week while wholesale route drivers work 42 hours per week Drivers were assumed to work an
The coefficient on S in the retail labor time equation was insignificant The equations have R2 values of 96 and 92 respectively
18
Table 19 Labor costfor milk distribution drivers 1978 Metropolitan area Nonmetro area
route drivers route drivers Over-the-road drivers
Payratea $833hr $1200hr $535hr $780hr 1625 centsmile plus $580 for overtime for overtime for loading and unloading
Annual base salaryb $1732640 for $1112800 for $1160250 for 25000 miles 40-hr week 40-hr week $1566500 for 50000 miles
$1972700 for 75000 miles $2044640 for $1315600 for 45-hr week 45-hr week
Benefits and payroll taxesC $431567 $311510 $283984
Annual direct plus indirect drivers cost d $2289007 $1505440 $1850484
New wage rates were negotiated in 1978 Hourly pay rates for route drivers include commissions as specified by local fluid milk firm managers bAnnual base salaries for over-the-road drivers include 25 hours per week load and unload pay clncludes pension contributions health and life insurance federal and state unemployment insurance (06 percent on first $4200 for federal and 29 percent
on first $7000 for state unemployment insurance) workmens compensation (423 percent of base salary) FICA (585 percent of first $16500) and uniforms For over-the-road drivers an allowance for meals is also included
d8ased on an average workweek of 42 hours for route drivers and 50000 annual miles for over-the-road drivers
average of 50 weeks per year These assumptions were verified by local plant managers
Route length rather than labor time is the determinshying factor in labor cost on over-the-road routes Dairy transportation managers say that nearly all over-theshyroad routes are comprised of fully loaded (1000-1100 cases or 4300 gallons) semi-trailers Because quantity is virtually constant on over-the-road routes labor cost on this type of route can be expressed solely as a function of the route length
Table 20 Characteristics of 118 fluid milk distribution routes in Minnesota
Numberof Type of route observations Low High Average
Home delivery 18 Quantity (gallons) 50 340 2232 Route length (miles) 25 100 617
Number of stops 40 230 1519 Labor time (hours) 4 12 97
Wholesale 100 Quantity (gallons) 250 4000 18310 Route length (miles) 20 200 814 Number of stops 2 40 200 Labor time (hours) 55 135 88
Based on the annual salaries presented in table 19 labor cost was $1526 per minute on home delivery routes $1817 per minute on metropolitan area wholeshysale routes and $1195 per minute on nonmetropolitan routes The cost per mile for over-the-road drivers was $3701 Expense records of existing plants indicate that 20 percent of driver labor cost must be added to cover the expense for route supervisors and supplemental dock workers Therefore the total distribution labor cost per minute was $1831 for home delivery routes $2180
for metropolitan wholesale routes and $1434 for nonshymetropolitan wholesale routes Total distribution labor cost per mile on over-the-road routes was $4441
Table 21 shows the equations derived by multiplyshying the coefficients of the labor time equations by the appropriate cost-per-minute figures for retail and whblesale routes Also shown is the relationship beshytween route length and cost per gallon delivered on over-the-road routes On a typical home delivery route carrying 223 gallons to 152 stops in 62 miles labor cost is predicted to be $4553 per gallon (equation 4) On a typical metropolitan area wholesale route carrying 1800 gallons to 20 stops in 80 miles distribution labor expense is predicted to be $0711 per gallon (equation 5) The same route located in the nonmetropolitan area would have labor costs of only $0472 per gallon (equashytion 6) This reflects the difference in wages between metropolitan and nonmetropolitan areas Distribution labor costs on over-the-road routes increase from $0206 to $0412 per gallon as round trip mileage increases from 200 to 400 miles (equation 7)
Selling Expenses We include selling expenses in distribution costs
Selling expenses are salaries and benefits for marketing staff accountants bookkeepers and clerical workers rent and depreciation on office machinery and equipshyment data processing costs telephone and telegraph costs postage costs costs of office supplies used for billshying and record keeping and advertising expenses From information proVided by several Minnesota dairies it was determined that selling expenses amountto approxshyimately $0370 per gallon14 Table 22 shows a breakshydown of selling expenses by major components
14Unfortunately available data were not sufficient to investigate whether this important component of costs exhibits economies of scale
19
Table 21 Predicting equations for labor cost per gallon of milk distributed by type of route
Equation form ALC = amp + amp(IIQ) + amp2(RL) + amp3(5) Estimated coefficient
Equation number and type of route ( amp amp2
4 Metropolitan home delivery 2144 3023 0017
5 Metropolitan wholesale -0841 11529 00048
6 Nonmetropolitan wholesale -0553 7583 00032
7 Over-the-road 0 0 000103
Table 22 Selling costs of fluid milk processors Minnesota 1977
Cost Cost as percentage of Expense per gallon total selling cost
Advertising $00162 438 Payroll salaries 00120 324 Payroll benefits 00025 68 Telephone telegraph
and postage 00015 41 Bad debts 00022 59 General supplies 00026 70
Total $00370 1000
Includes pension payroll taxes health and welfare insurance and other fringe benefits
Distribution Facility Expense Several large Minnesota milk firms distribute a subshy
stantial portion of their products through distribution facilities located in out-state regions The milk is hauled over the road to the distribution facility and delivered from there on ordinary wholesale routes In some cases the distribution facility is owned and operated by the parent bottling company in others the facility is indeshypendently owned and operated by a jobber Ordinarily the distribution facility is a former bottling plant
The costs of operating such a facility will depend on many factors including the size and location of the facilshyity To estimate distribution facility costs we have conshyducted an economic-engineering analysis similar to that used in determining in-plant costs for model fluid milk processing facilities The model distribution facility was based on recommendations found in the USDA publication A Dairy Products Distribution Facility Layshyout and Operating Methods15 The facility has a storage capacity of 12000 gallons and is designed to handle 60000 gallons of fluid milk per week
Table 23 shows capital costs for the land buildings and equipment required by the distribution facility Toshytal investment amounted to $352470
Operating costs for the facility include interest depreshyciation maintenance utilities taxes insurance and lashybor Table 24 shows total annual costs and costs per galshylon for this facility Interest was computed at 10 percent
amp3 Restrictions
Valid for quantities from 50 to 350 gallons 0 route lengths from 25 to 100 miles and
number of stops from 40 to 230
Valid for quantities from 400 to 3500 gallons002641 route length from 50 to 500 miles and
00174 number of stops from 5 to 40
Valid for fully-loaded semis and for all0 route lengths from 50 to 500 miles
of the average value of buildings and equipment over their expected lifetimes Depreciation was calculated on a straight-line basis over 33 years for the bUilding and 25 years for equipment Maintenance cost was calculated at 05 percent of initial building and equipment cost
Table 23 Land buildings and equipment investment for a satellite fluid milk distribution facility
Item Description Cost
Land 2 acres $27000
Building Cooler 1800 square feet Refrigeration equipment 200 square feet Boiler room 200 square feet Truck maintenance 1750 square feet Offices and drivers room 1 320 sq u a re feet Lavatories and locker
rooms 400 square feet Corridor and stairways 120 square feet Receiving and load-out 1 800 s9 u a re feet
Total 7590 square feet 250470
Equipment Refrigeration and mechanical 75000
Calculated at $13500 per acre for developed industrial land and $33 per square foot of building space
Table 24 Operating expenses for a 60OOO-gallons-pershyweek satellite fluid milk distribution facility
Item Annual cost Cost per gallon
Interest $16273 $0052 Depreciation 10590 0034 Maintenance 1627 0005 Utilities 10518 0034 Taxes 5891 0019 Insurance 1645 0005 Production labor 36400 0117 Administrative labor 3021 0010
Total $85965 $0276
Agricultural Research Service A Dairy Products Distribution Facility Layout and Operating Methods Marketing Research Report No 990 US Deshypartment of Agriculture Washington DCbull April 1974
20
In computing taxes for the facility a mill rate of 90 was applied to 43 percent of the average value of the buildings and land This mill rate is appropriate for land and buildings located in out-state regions
Insurance for the facility based on premiums sugshygested by a local insurance agency amounted to $1645 per year
The cost of utilities including water sewage elecshytricity and fuel was estimated to be $10518 per year
Two laborers are needed for receiving products arshyranging products in route loads placing stacks on conshyveyors maintaining equipment and cleaning Costs of these laborers including salaries benefits and payroll taxes amount to $36400 per year This figure is based on a wage of $700 per hour a 40-hour work week and 25 percent additional for benefits and payroll taxes
Commonly a satellite facility employs an adminisshytrator and clerical workers Their responsibilities inshyclude directing the activities of laborers maintaining records billing securing accounts route supervision and selling These activities supplant some work which would otherwise be performed by administrators and clerical workers engaged in these activities at the proshycessing plant To avoid double counting of these costs we calculated satellite facility administrative costs at 83 percent of production labor expense This represents the increment in administrative costs necessitated by the satellite facility
Total cost of operating the 60000-gallons-per-week distribution facility was $85965 per year or $0276 per gallon of milk handled
Total Fluid Milk Distribution Costs By building on the above analysis equations were
developed for predicting total distribution costs for varishy0us types of routes Total distribution costs include veshyhicle expense labor expense and selling expense In adshydition for milk delivered to a satellite distribution facilshyity the cost of operating the facility must be included
An equation for estimating total distribution costs on metropolitan area wholesale routes was constructed by adding the appropriate coefficients for vehicle cost (equation 1 table 18) labor cost (equation 5 table 21)
and the selling expense (table 22) Similar equations can be constructed for other types of routes Table 25 shows equations for total distribution cost per gallon Equashytions 8 9 and 10 can be used to estimate unit distribushytion costs for retail and wholesale routes from the bottlshying plant To calculate costs of distributing through a satellite distribution facility costs from the processing plant to the satellite facility must be calculated using equation 11 and added to wholesale route distribution costs from the satellite facility computed from equation 12 Operating costs for the satellite distribution facility are included in equation 11
Costs on typical wholesale distribution routes carryshying 1800 gallons to 20 stops in 80 miles are predicted to be $1379 in the metropolitan area Metropolitan area wholesale milk distribution costs are extremely sensishytive to volume falling from $3031 to $0867 when volshyume increases from 400 to 3500 gallons (equation 9) Figure 6 shows the dramatic impacts of route location and quantity delivered on wholesale routes Costs deshycline rapidly as volume increases to 1200 gallons and continue to decline gradually thereafter
On a typical home delivery route carrying 223 galshylons to 152 stops in 62 miles unit distribution costs are $5674 (equation 8) Low volume is responsible for the relatively high distribution costs incurred in home delivery
On most types of distribution routes unit costs inshycrease with the number of customer stops and the length of the route Figure 7 shows the effect of number of stops on unit distribution costs Costs per gallon rise by $0264 for each additional 10 customer stops on metropolitan wholesale routes
Figure 8 shows the effects of route length on unit distribution costs On metropolitan area wholesale routes distribution costs rise by $0084 per gallon for each additional 10 miles of route length
On fully loaded over-the-road routes to a satellite distribution facility distribution costs rise from $0529 to $1381 per gallon as round-trip mileage increases from 100 to 500 miles This includes $0276 per gallon operating expense for the distribution facility Figure 9 shows the impact of route length on costs of distribution to satellite distribution facilities
Table 25 Predicting equations for fluid milk distribution costs by type of route
Equation form cost per gallon = ~ + B(1Q) + amp2(RL) + B3(S)
Equation number and type of route
8 Metropolitan area home deliverymiddot
9 Metropolitan area wholesale
10 Nonmetropolitan wholesale
Via satellite distribution facility
11 Costs of distribution from processing plant to satellite facility plus satellite costsb
12 Wholesale routes from satellite facility
Includes labor vehicle and selling expenses
amp
20275
-05875
-03046
Estimated coefficient Is ~2
5284
13790
9776
00206
00084
00068
00264
00174
01500 7156 000213
-03046 9776 00068 00174
blncludes labor vehicle and satellite distribution facility operating expenses
21
Cost (cents per gallon)
40
35
30
25
Metropolitan area 20
15
10 Nonmetropolitan-------=============
5 area
________________________________________ Quantity (gallons)400 800 1200 1600 2000 2400 2800 3200 3600 4000
Figure 6 Fluid milk distribution costs on metropolitan and non metropolitan wholesale routes (based on route length of 80 miles and 20 stops per route)
Cost (cents per gallon)
45 shy
40
35
30 shy
25 shy
30 stops per route 20 shy
15 shy
10 shy
10 stops per route 5-
________________________________________ Quantity
400 800 1200 1600 2000 2400 2800 3200 3600 4000 (gallons)
Figure 7 Effect of number of stops on metropolitan area wholesale milk distribution costs (based on route length of 80 miles)
22
--- ---------- -- - - - - - - ---- ---------- ----
Cost (cents per gallon)
45
40
35
30
25 Route length 120 miles
20
15
10
Route length 40 miles7 ----------------shy5
________________________________________ Quantity (gallons)400 800 1200 1600 2000 2400 2800 3200 3600 4000
Figure 8 Effect of route length on metropolitan area wholesale milk distribution costs (based on 20 stops per route)
Cost (cents per gallon)
13 shy
12 shy
11 shy
10 shy
9shy
8shy
7shy
6shyTransportation cost 5shy
4shy
3shy
2shy
JDistribution facility operating cost
- Round ----------------------------------------- trip
50 100 150 200 250 300 350 400 450 500 mileage
Figure 9 Costs of distributing milk on fully loaded over-the-road routes to a satellite distribution facility
23
Impact of Distribution Costs on Optimum Plant Size
On the most common types of wholesale milk distrishybution routes distribution costs predicted by the equashytions developed in this section will be between $1100 and $1700 per gallon delivered In contrast processing costs minus packaging materials expense were $0994 to $1619 per gallon according to the estimates presented earlier Distribution costs are an important determinant of the total costs incurred by milk processors For many milk processing firms distribution costs exceed the costs of processing milk This is true for firms distributshying a substantial portion of their product on low-volume routes eg home delivery or to widely dispersed retail stores such as those in rural areas For larger plants disshytributing a substantial portion of milk through distribushytion facilities distribution costs are likely to exceed proshycessing costs
Processing costs decline rapidly when plant scale increases up to 100000 to 200000 gallons per week and may continue to decline when output increases beyond 200000 gallons per week However savings to processhysors gained through the realization of economies of size will be offset if the added volume is delivered over a wider geographic area to new customers For example unit processing costs will fall from $2145 to $2025 when volume processed increases from 200000 to 400000 gallons per week But this $0120 reduction in unit processing costs could easily be eliminated by an increase maverage route length of 15 miles This route length increase would cause unit distribution costs to rise by $0126 (on metropolitan area wholesale routes) more than offsetting the savings from economies of size in processing The fact that increased volume generally must be distributed over wider geographic areas serves as a deterrent to increased plant size In markets where outlets are widely dispersed the- least-cost structure of the processing sector is likely to be a combination of geoshygraphically dispersed intermediate-sized plants rather than a single large processor Consequently the presshysure for increased plant size is less than would be indishycated by an analysis based solely on in-plant costs
Summary
The fluid milk processing industry in Minnesota has evolved since 1956 from 289 to 30 processing plants Major factors in this change are economies of size for plants that process and distribute large volumes of milk A major objective of this study was to measure these economies
An economic-engineering approach was used to calculate processing costs for three sizes of milk plants These estimates show that economies of size are signifishycant as plant size is expanded to 200000 gallons per week but when output grows beyond 200000 gallons per week these economies level off Costs decline from 267 to 215 cents per gallon as volume is increased from 50000 to 200000 gallons per week Expanding plant size to 400000 gallons reduces costs to 203 cents per gallon We conclude that economies of size beyond 200000 gallons per week are relatively minor
Distribution costs were estimated for alternative truck sizes lengths of routes and number of stops These costs included vehicle labor and selling expenses and for milk distributed through a satellite distribution facility operating expenses for the facility Equations were constructed for predicting unit costs on individual routes Unit costs decreased when volume delivered increased but costs rose when either the numshyber of stops or the length of the distribution route inshycreased Table 26 shows unit costs for various routes Distribution costs for the entire operation depend on the combination of truck sizes and on whether satellite disshytribution facilities are used For many fluid milk firms it appears that distribution costs will equal or exceed proshycessing costs
Table 26 Summary of distribution costs by type of route
Route Distribution
Type of route Gallons
delivered length (miles)
Number of stops
cost per gallon
Home delivery 200 50 150 $5680 300 100 150 5848 300 50 150 4819
Metropolitan wholesale 1200 80 20 1762
1200 120 20 2098 2000 80 20 1302 2000 120 20 1638
To distribution facility 4300 150 0635
4300 300 0955
From distribution facility 1200 80 20 1402
Nonmetropolitan wholesale 1200 120 20 1674
2000 80 20 1076 2000 120 20 1348
Enlarging the distribution areas without increased volume per stop will increase distribution costs If added production must be distributed over a wider geoshygraphic area average route length will increase causing an increase in unit distribution costs Thus economies of size in fluid milk processing are offset by diseconoshymies of size in distribution For this reason there may be less pressure for additional consolidation of processing operations in Minnesota than in other regions of the United States where dense population exists over wide geographic areas
24
Table A-1 Itemized equipment requirements for Plant I
Item Cost Item Cost
100 GPM receiving pump $ 1650 75 cpm 12 pt-qt filler $ 85000 2 tank CIP unita (2) 26000 Handle applicator 7500 CIP transport tank washer 2400 4min 5-gal filler 3350 COP portable tank (2) 3000 Carton conveyors (120) 14400 5000 gal raw storage tank b(2) 30000 Automatic casers (3) 39000 2000 gal raw storage tankb 11000 Case stackers (3) 30000 2000 gal cream storageb 11000 Case inserters (3) 6000 4000 gal cold wall surge 13000 20 per min case washer 7000 2000 gal cold wall surge 10000 20 per min case unstacker 10000 1000 gal cold wall surge 8500 Case conveyors and drives (400) 60000 1500 gal pasteurizing vat 16500 Conveyor hydraulic unit 4500 1000 gal pasteurizing vat 13500 Process control panel 1045 Storage tank mounts (7) 3500 Receiving control panel 2600 Hot water set for HTST 5900 Sanitary lines and valves 15000 Transfer pumps (2) 900 Boilers - 75 bhp (2) 32000 Clarifierseparator 39500 Ammonia receiver compressor 13410 60 gal balance tank 1100 Condensor pumps piping 15340 Plate heat exchanger 85 regen 17500 Ice builder 16100 Timing pump 4600 Cooling units - cold room 8040 Flow diversion valve 1300 Cooling units - tanks 3355 Holding tube 2323 Controls 3400 Vacuumizer 9200 Mechanical cbullbullbullbullbullbullbullbullbullbullbullbullbullbullbullbull 38500 Tailer sensor and controls 2917 Installation dbullbullbullbullbullbullbullbullbullbullbullbullbullbullbullbullbullbullbullbullbullbullbullbullbull 162810 15000 hr homogenizer 21250 Miscellaneous 9800 30 cpm gal filler 90000 33 cpm gal 12 gal filler 75000 Total equipment cost $1009690
Includes pumps valves and control panels blncludes liquid scale gauges clncludes air compressors refrigerators electrical cost for running power to motors and mechanical cost for utility hookup of machines dCalculated at 20 percent of cost of storage and surge tanks 40 percent of cost of processing and CIP equipment and 30 percent of cost of mechanical
refrigeration and case handling equipment Filling equipment prices include installation
Table A-2 Itemized equipment requirements for Plant II
Item Cost Item Cost
200 GPM receiving pump $ 1700 75 CPM 112 gal filler $ 99000 2 tank CIP unita 13000 160 CPM 12 pt-qt filler 229000 3 tank CIP unit 17500 4min 5-~al filler 3350 COP portable tank (2) 3000 Handle applicator 9000 CIP transport tank washer 2400 Carton combiner 4000 20000 gal cold wall silo (2)b 46200 Carton conveyor (200) 24000 5000 gal raw storageb(2) 30000 Automatic casers (3) 47000 5000 gal cream storageb 15000 Case stackers (3) 30000 10000 gal cold wall surge silo 17500 Case inverters (3) 6000 5000 gal cold wall surge 14000 40min case washer 15000 2000 gal cold wall surge 10000 40min case unstacker 12000 2500 gal pasteurizing vat 21000 Case conveyors and drivers (700) 105000 2000 gal pasteurizing vat 19000 Conveyor hydraulic unit 8000 Storage tank mounts (7) 3500 Process control panel 1045 Silo mounts (3) 9000 Receiving control panel 2800 HTSTfeed pump 450 Sanitary lines and valves 25000 Hot water set for HTST 5900 Boilers 200 bhp (2) 44000 Transfer pumps (2) 1100 Ammonia receiver compressors 30155
Clarifierseparator 118500 Condensor pumps piping 24535 60 gal balance tank 1100 Ice builder 26200 Flow diversion valve 1900 Cooling units 24400 Plate heat exchanger 85 regen 35000 Controls 4200 Holding tube 3803 Mechanical c bullbullbullbullbullbullbullbullbullbullbullbullbullbullbullbullbullbullbullbullbullbullbull 179200 Homogenizer 38450 Installationd bullbullbullbullbullbullbullbullbullbullbullbullbullbullbullbullbullbullbullbullbullbullbullbullbullbullbullbull 315900
25
Table A-2 Itemized equipment requirements for Plant (continued)
Item Cost Item Cost
Vacuumizer Tailer controls and sensors
16000 2917
Miscellaneous 12800
60 CPM galion filler 175000 Total equipment cost $1904505
alncludes pumps valves and control panels blncludes liquid scale gauges clncludes air compressors refrigerators electrical cost for running power to motors and mechanical cost for utility hookup of machines dCalculated at 20 percent of cost of storage and surge tanks 40 percent of cost of processing and CIP equipment and 30 percent of cost of mechanical
refrigeration and case handling equipment Filling equipment prices include installation
Table A-3 Itemized equipment requirements for Plant III
Item Cost Item Cost
Positive displacement receiving pump $ 6445 125 CPM 12 gal filler $ 215000 2 tank CIP unitmiddot 13000 160 CPM 12 pt-qt filler (2) 458000 CIP transport tank washer (2) 4800 Handle applicators (2) 18000 3 tank CIP unitsmiddot (2) 35000 4min 5 gal filler (2) 6700 COP portable wash tank 1500 Carton combiners (2) 8000 30000 gal cold wall silob bullbullbullbullbullbullbullbullbullbullbull 60200 Carton conveyors (350) 42000 20000 gal cold wall silob bullbullbullbullbullbullbullbullbullbullbullbullbullbullbull 23100 Automatic casers (5) 80000 10000 gal cold wall silo b bullbullbullbullbullbullbullbullbullbullbullbull 18600 Case stackers (5) 50000 10000 gal cold wall cream silob bullbullbull bullbullbullbullbullbullbullbull 18600 Case inverters (5) 10000 15000 gal cold wall surge silo (2) 40000 40min case washers (2) 30000 10000 gal cold wall surge silo 17500 40lmin case unstackers (2) 24000 5000 gal surge (2) 28000 Case conveyor and drivers (1000) 150000 Storage tank and silo mounts 25000 Conveyor hydraulic unit 24000 HTSTfeed pumps (2) 900 Process control panel 3000 Hot water sets for HTST (2) 11800 Receiving control panel 2800 Transfer pumps (3) 1950 Sanitary lines and valves 45000 Clarifierseparator (2) 237000 Boilers 300 bhp (2) 56000 60 gal balance tanks (2) 2200 Ammonia receiver compressors 42305 Flow diversion valves (2) 3800 Condensor pumps piping 33430 Holding tubes (2) 11454 Ice builder 30300 Plate heat exchangers 85 regen (2) 70000 Cooling units 36655 Homogenizers (2) 76900 Controls 4700 Vacuumizers (2) 32000 Mechanical c bullbullbullbullbullbull 260000 Tailer controls and sensors (2) 5831 Installation dbullbullbullbullbullbullbullbullbullbullbullbullbullbullbullbullbullbullbullbullbullbullbullbullbullbullbullbull 464940 Tri-blender 5000 Miscellaneous 15700 60 CPM gal filler (2) 350000
Total equipment cost $3211110
Includes pumps valves and control panels blncludes liquid scale gauges clncludes air compressors refrigerators electrical cost for running power to motors and mechanical cost for utility hookup of machines dCalculated at 20 percent of cost of storage and surge tanks 40 percent of cost of processing and CIP equipment and 30 percent of cost of mechanical
refrigeration and case handling equipment Filling equipment prices include installation
26
Bibliography
PUBLICATIONS
Articles of Agreement between Minneapolis and st Paul Milk Dealers and Milk Drivers and Dairy Emshyployees Union Local 471 May 1 1975-April 30 1978
Bartlett Roland et al Outer Market Distribution of Milk in Paper Containers in the North Central Region North Central Regional Publication No 39 Purdue University Agricultural Experiment Station Lafayshyette Indiana October 1953
Federal Trade Cmnmission Economic Report on the Dairy Industry US Government Printing Office Washington DC March 19 1973
Knutson RD Price and Trade Practice Regulation in the Minnesota Dairy Industry unpublished PhD thesis University of Minnesota 1967
Midwest Research Institute Resource and Environmenshytal Profile Analysis of Five Milk Container Systems with Selected Health and Economic Considershyations Final Draft Report MRI Project No 4003-D June 18 1976
USDA Agricultural Marketing Service Transportation and Facilities Research Division Layouts and Operating Criteria for Automation of Dairy Plants Processing Milk Half-and-Half Cream Chocolate Drink and Buttermilk Marketing Research Report No 591 US Government Printing Office Washingshyton DC September 1963
---------------------------------------Packaged Fluid Milk Sales in Federal Milk Order Markets by Size and Type of Containers and Distrishybution Method during November 1975 AMS-553 July 1977
___ Agricultural Research Service A Dairy Products Distribution Facility Layouts and Operating Methods Marketing Research Report No 990 Washington DC April 1974
US Department of Health Education and Welfare Pubshylic Health Service Food and Drug Administration Milk Pasteurization Controls and Tests Cincinnati Training Facility Course Manual 1977
US Department of the Treasury Internal Revenue Sershyvice Federal Highway Use Tax on Trucks TruckshyTractors and Buses Publication 349 (revised)
Williams Sheldon W et aI Organization and Comshypetition in the Midwest Dairy Industries Iowa State University Press Ames Iowa 1970
INDUSTRY CONTACTS
Ammonia House Inc 712 W 77-12 St Minneapolis Minnesota
B-Bar-B Inc Bag-N-Box Packaging Systems 10th and McBeth St New Albany Indiana
Bill Boyer Ford 2811 NE Broadway Minneapolis Minshynesota
Blackhawk Molding Co 109 Commercial Road Addishyson Illinois
Blesi Evans Co 2533 24th Ave South Minneapolis Minnesota
Clover Leaf Creamery Co 420 W Broadway Minneapshyolis Minnesota
Continental Equipment Corp 6103 N 76th St Milwaushykee Wisconsin
Dairy Craft Inc 600 N 54th Ave St Cloud Minnesota DeLaval Separator Co 2950 Metro Drive St Paul Minshy
nesota Drew Agency Inc Griggs Midway Building St Paul
Minnesota Edmeyer Inc 750 S Plaza Drive st Paul Minnesota Environmental Process Inc 1220 Glenwood Ave Minshy
neapolis Minnesota Ex-Cell-O Corp Packaging Systems Group 10212
Xerxes Avenue South Bloomington Minnesota Fogg Filler Co 37 Van Dyke Ave Holland Missouri Freuhauf Corp 1717 W County Road C St Paul Minshy
nesota Graham Poly trip Co 1420 6th Ave York Pennsylvashy
nia Hercules Inc 2285 University Ave St Paul Minneshy
sota International Harvester Co 3000 NE Broadway Minneshy
apolis Minnesota International Paper Co 6100 Olsen Memorial Highway
Minneapolis Minnesota Land OLakes Inc 415 Grove St St Paul Minnesota Meyer Brothers Dairy 105 E Lake St Wayzata Minneshy
sota Pitcher Pak Corp 67 Cummings Park WobuJm Massashy
chusetts Smith-Lee Co 537 Fitch St Oneida New York Sturm Sales Inc 355 21st St Newport Minnesota Superior Dairy Fresh Co 2112 NE Broadway Minneapshy
olis Minnesota Tapemark Co 223 Marie Ave E S1 Paul Minnesota Thermo King Sales and Service Inc 2645 Fairway Ave
N St Paul Minnesota Winscott Glass Co Box I Clarion Pennsylvania
27

Equipment ------------------------- Hours of day ------------------------ shy
5am 6 7 8 9 10 11 12 2 3 4 5 6 7pm
I I I I I I I I I I I I I I II I I I I II I II II I II I I I I I I I II I I I I I I I I ll~ J I I IU
N20000 gal silo (a) 20000 gal silo (b)
5000 gal storage (a) 5000 gal storage (b)
5000 gal cream storage 50000 separatorclarifier
50000 HTST 2500 gal pasteurizing vat
2000 gal pasteurizing vat 10000 gal surge 5000 gal surge 2000 gal surge
Gallon filler y - gal filler Quart - Y pint filler 5 - gal filler
Sanitary lines
A Receive 38 raw milk
B Receive 01 skim
C Standardize for 35 whole
D Standardize for 20 E_ Standardize for 10 F Standardize for 01 skim
G Standardize for half-and-half H Process 35 whole
I Process 20 J Process 1 0
Output (gallons)
Skim
1
2 Whole Half-and-half Chocolate
Total
D CC I A I FIE I CC
A N D C CC
I B R G CC
A N FI CC
U G u D C F I E I DD
I I H K I J I BB P L I BB
M Z BB I P I w P I L r AA II cci
0 V TQ X T cc R Y
w V Y X w V Y X
I
I I I w V I Z
Iv Iy xl
K Process 01 skim
L Process 20 chocolate
M Process half-and-half
N Hold 38 raw milk
O Hold 35 whole milk
P- Hold 20 Q Hold 10 R Hold 01 skim S Hold 20 chocolate
T Hold half-and-half
Gal Y - gal
3301 1680
1809 1204
10540 5729
7060 3600
642
22710 12855
Figure 2 Assumed Tuesday equipment operating schedule for Plant II
9
U V W X
Y Z
AA BB CC DD
Qt - Y pt
1728
918
1716 1423 5785
CC
I cc IAA CC
AA CC I IAAI DD
BB CC
Hold cream Fill 35 whole
Fill 20 Fill 10 FillOlskim Fill half-and-half Fill 20 chocolate Clean in place (hot) Clean in place (cold) Clean manual
5 - gal Total
590 5571 415 3428
17997 420 11998
1716 75 2140
1500 42850
gallon processed weekly is $803 An itemized list of $4890627 in Plant III (table 9) Investment per gallon equipment costs is in Appendix tables A-I to A-3 processed weekly declines sharply from $2993 with a
weekly output of 50000 gallons to $1533 with a weekly SUMMARY OF INVESTMENTS output of 200000 gallons When weekly output rises to
400000 gallons investment per gallon processedTptal investment in land buildings and equipment weekly falls still further to $1223 is $1496680 in Plant 1 $3066348 in Plant II and
Equipment -------------------------- Hours of day ------------------------ shy
5am 6 7 8 9 10 11 12 1 2 3 4 5 6 7pm
I I I II I I II I I II I III I I I I I I I I I I I I I I I I I I I I I I I I I I I I I I I I II I II I ll~ -N I I AI N I J I cc30000 gal silo (a)
A I H I cc30000 gal silo (b) N CC20000 gal silo I A KI
B R K CC10000 gal silo I I I
10000 gal cream storage I ccll u MI u bull 50000 HTST (a) I I I J I BB 50000 HTST (b) I H MI K r BB
L BBTri-blender T
15000 gal surge (a) Ip I w I BB V L AA15000 gal surge (b) 101 I T I BB
X BB10000 gal surge loT 5000 gal surge (a) T RT Y BB 5000 gal surge (b) T Z I BB
W X CCGallon filler (a) I T Galion filler (b) I V I I Y CC
h - gal filler I V I W I Y X AA T CC W T y -I z CCOuart - h pint filler (a) I T I AA I
Ouart - h pint filler (b) I IW V Z AA CC
5 - gal filler (a) Iv wi AA DD 5 - gal filler (b) Iv wT AA DD
BB CCSanitary lines
A Receive 38 raw milk K Process 01 skim U Hold cream
B Receive 01 skim L Process 20 chocolate V Fill 35 whole
C Standardize for 35 whole M Process halfmiddotand-half W Fill 20
D Standardize for 20 N Hold 38 raw milk X Fill 10
E Standardize for 10 O Hold 35 whole milk Y Fill 01 skim
F Standardize for 01 skim P Hold 20 Z Fill half-and-half
G Standardize for halfmiddotand-half O Hold 10 AA Fill 20 chocolate
H Process 35 whole R Hold 01 skim BB Clean in place (hot)
I Process 20 S Hold 20 chocolate CC Clean in place (cold)
J Process 10 T Hold half-and-half DD Clean manual
Output (gallons) Gal h - gal Qt - h pt 5 - gal Total
Skim 6685 3900 557 11142 1 4114 2743 6857 2 19000 9600 5397 2000 35997 Whole 15627 7270 273 830 24000 Half-and-half 3429 3429 Chocolate 2200 1915 170 4285
Total 45426 25713 11571 3000 85710
Figure 3 Assumed Tuesday equipment operating schedule for Plant III
10
Table 9 Investment in land buildings and equipment for three model fluid milk plants
Cost Plant I Plant II Plant III (50000 (200000 (400000
Item galwkl galwkl galwkl
Land $ 40500 $ 54000 $ 67500 Building 446490 1107843 1612017 Equipment 1009690 1904505 3211110
TotaL $1496680 $3066348 $4890627
Investment per gallon processed weekly $2993 $1533 $1223
Plant Operating Costs Processing costs include all costs incurred from the
moment raw milk enters the plant until the finished product leaves the cold storage room Costs of acquiring raw milk andor distributing finished products are not included For purposes of cost estimation plants were assumed to achieve 93 percent of machine-rated output per hour in standardizing and processing operations and 85 percent of machine-rated output per hour in fillshying operations The remaining 7 percent processing and 15 percent filling time represent an allowance for time required in machine startups product changeovers container changeovers and machine malfunctions These efficiencies are the maximum that can be achieved under actual operating conditions according to local plant managers
INTEREST
Interest represents the cost of borrowed funds For the analysis we assumed that all capital funds were borshyrowed although this need not be the situation for actual plants At the time the study was conducted commershycial interest rates for special purpose plant and equipshyment financing ranged from 9-34 to 10-12 percent annushyally For the analysis a rate of 10 percent was used and applied to the average value of buildings and equipment over their expected lifetimes Weekly interest charges amounted to $1400 in Plant I $2896 in Plant II and $4638 in Plant III
DIRECT LABOR
Labor requirements were estimated fat each activity from information provided by a local engineering firm (table 10) Excluding office workers and route drivers seven employees are needed in Plant 119 employees in Plant II and 34 employees in Plant III9 The labor proshyductivity ratio in Plant I is 177 gallons per manhour Plant II 254 gallons per manhour and Plant III 282 galshylons per manhour
The base wage for hourly employees was $750 per hour Employee benefits including payroll taxes workmans compensation unemployment insurance
9-fter adjusting for differences in product and container mix machine operating rates and weekly output these labor requirements are consistent with those estimated by the USDA inLayouts and Operating Criteria op cit pp 26shy2739-40
pensions and uniforms added 25 percent to the base wage Table 11 shows the computation of weekly labor cost Table 10 Estimated weekly labor requirements for three
model fluid milk plants
Plant I Plant II Plant III (50000 (200000 (400000
Operation galwk) galwkl galwkl
--------------m a n hours-------------shyReceiving cleaning
tankers 30 40 80 Separate HTST 40 120 200 Filling 80 130 230 Cold storage 30 140 240 Case storage 10 40 80 Warehouse and supply
handling 20 80 160 Cleanup and janitorial 20 80 160 Maintenance 40 80 120 Relief 40 80
Total regular hours 270 750 1350 Overtime hours 5 13 ~ ~
Total hours 283 788 1418
Table 11 Total direct labor cost for three model fluid milk plants
Plant I Plant II Plant III
Weekly base wage ($750hr) $2025 $5625 $10125
Weekly overtime wages ($1125hr) 146 428 765
Total wages $2171 $6053 $10890 Cost of benefits 2723~ JampJl
Total direct labor costs $2714 $7566 $13613
ADMINISTRATIVE AND CLERICAL LABOR
Administrative and clerical personnel include ofshyfice workers and clerical workers associated primarily with in-plant activities Payroll expense plus cost of benefits for administrative and clerical labor was comshyputed at 83 percent of total direct labor cost for the three model plants This computation was based on adminisshytrative and clerical labor expenses reported by several plant managers
EQUIPMENT DEPRECIATION
All equipment was depreciated on a straight-line bashysis according to expected useful operating life Accordshying to equipment sales personnel storage tanks surge tanks and case handling equipment have an expected useful operating life of 25 years The remaining equipshyment is expected to last 15 years This measure ignores possible variations caused by equipment being used with different intensity ie for different numbers of hours per year
BUILDING DEPRECIATION
Buildings were depreciated on a straight-line basis over 33 years
11
CONTAINERS
Volume discounts on containers are available Weekly container costs were based on manufacturers prices under the 3-month plan and on the container mix shown in table 3 Under the 3-month plan a dairy purshychases a 3-month supply of each container at a savings over the cost if purchased more frequently Table 12 shows container cost by size of container Container cost per gallon packaged declines from $1049 for the 50000shygallons-per-week plant to $1031 for the 400000-galshylons-per-week plant a reduction of 17 percent
Table 12 Weekly container cost for three model fluid milk plantsmiddot
Container size Plant I Plant II Plant III
One gallon $2259 $ 8998 $17996 Half-gallon 1296 5148 10204 Quart 78 305 606 Pint 5 18 36 Half-pint 1202 4724 9448 Five-gallon 140 560 1120 Handles and
staples 265 938 11823 TotaL $5245 $20691 $41233
Container cost per gallon $1049 $1035 $1031
Based on two-color paperboard containers
SUPPLIES
The three model plants use a wide assortment of cleaning laboratory janitorial and office supplies The cost of these items is relatively constant for all plant sizes For this reason cost estimates for supplies are based on the expense records of existing plants
REPAIRS AND MAINTENANCE
Cost of building and equipment repairs and mainteshynance are based on the expense records of existing plants Estimated weekly costs for specialized repair lashybor andfor supplies used in repairs and maintenance are $201 in Plant I $1572 in Plant II and $3528 in Plant III (These figures exclude the cost of regular repair labor which is included above with direct labor cost)
CASE EXPENSE
For every milk case loaded daily approximately six empty cases await pickup at various points along distrishybution routes and in the case storage room Assuming an average of 425 gallons per case plants must maintain an inventory of 165 cases per gallon of daily output At a cost of $3 per case and a 12 percent annual replacement rate the weekly case expense is $114 in Plant I $457 in Plant II and $914 in Plant III
ELECTRICITY
Electricity rates were those quoted by a local electric company Its rates include a demand charge and enshy
ergy charge The demand charge is based on peak avershyage kilowatt load during any 15-minute interval The enshyergy charge is based on the total number of kilowatt hours (KWH) used Both demand and energy charges are priced on a decreasing block rate basis leading to lower electricity cost per KWH as quantity of energy used inshycreases
Electricity used in milk processing packaging case handling and refrigeration was calculated by (1) multishyplying motor horsepower by weekly operating hours for each motor (2) adding to get total weekly horsepower hours (Hp-Hrs) (3) adding 20 percent for heat loss due to motor inefficiency and (4) converting to kilowatt hours with the factor 1 Hp-Hr = 7456 KWH To calculate enshyergy used for lighting an architectural consulting firms recommendation of an average 3 watts per square foot of plant space was assumed and applied to the total numshyber of hours per week for which the plants operate Peak load and energy use for the three model plants are
Plant I Plant II Plant III Peak load (KW) 245 6375 11355 Weekly energy use (KWH) 11052 36803 70487
The breakdown by operation for electrical energy is Operation Plant I Plant II Plant III
(kilowatt hours per week) Processing 1091 6914 13970 Filling and casing 517 1690 3523 Case handling 1475 3270 5360 Refrigerations 5655 17557 36342 Lighting 1640 6060 8880 Other ~~ 2412
Total bull 11052 36803 70487
Includes electrical energy used in cooling milk loaded on refrigerashyted trucks
For summer electricity rates electricity cost per week is $519 in Plant I $1472 in Plant II and $2671 in Plant III Costs would be slightly lower with winter elecshytrical rates
FUEL
Plants use natural gas for sealing containers and for water product and plant heating Although boilers are equipped to operate on fuel oil in case natural gas supshyplies are interrupted fuel cost estimates are for natural gas Gas consumption estimates were calculated for two boilers operating at 70 percent of capacity for 33 hours in Plant I 39 hours in Plant II and 42 hours in Plant III and on the actual operating times and gas requirements for filling equipment Estimated weekly gas consumption is 1595 MCF (thousand cubic feet) in Plant 15048 MCF in Plant II and 8386 MCF in Plant III Total natural gas costs were calculated with the current gas price of $22472 per MCF
WATER AND SEWAGE
The weekly cost for water and sewage disposal was based on the costs incurred by existing plants of size comparable to the model plants
12
Table 13 Weekly operating costs for three model fluid milk plants
Plant I (50000 galwk)
Item Weekly cost Costgallon
Interest $ 1400 $0280 Direct labor 2714 0543 Administrative and
clerical labor 225 0045 Equipment depreciation 1137 0227 Building depreciation 260 0052 Containers and handles 5245 1049 Supplies 335 0067 Repairs and maintenance 201 0040 Case expense 114 0023 Electricity 519 0104 Fuel 358 0072 Water and sewage 128 0026 Taxes and insurance 434 0087 Product loss 271 0054
Total abullbullbullbullbullbullbullbullbull $13341 $2668
aNumbers in cost per gallon columns may not add to totals due to rounding
TAXES AND INSURANCE
Property taxes were applied to 43 percent of the avshyerage value of land and buildings over the expected useshyful operating life of the buildings (In Minnesota taxes apply to 43 percent of the assessed market value of land and buildings) No adjustments were made for land inshyflation The mill rate used was 130 representative for urban locations Weekly property taxes amounted to $284 in Plant I $654 in Plant II and $939 in Plant III
Boiler fire and refrigeration system insurance based on premiums suggested by a local insurance agency was $150 per week in Plant I $161 in Plant II and $237 in Plant III
PRODUCT LOSS
Product loss was computed at 06 percent of weekly production in all plants A milk price of $1050 per hunshydredweight was used to compute this cost
TOTAL FLUID MILK PROCESSING COSTS
Table 13 summarizes fluid milk processing costs for the three model fluid milk plants Estimated cost per galshylon declines from $2668 in Plant I to $2145 in Plant II and $2025 in Plant III These results suggest that modshyern fluid milk processing operations are characterized by economies of size but that these economies tend to level out rapidly for plants with output of more than 200000 gallons per week Costs decline by $0523 per ~allon (20 percent) as plant size increases from 50000 to 200000 gallons per week but by only $0120 per gallon (56 pershycent) when plant size is increased from 200000 to 400000 gallons per week
the major savings for large-scale operations ate in labor and capital costs Labor cost declines by $0203 per gallon when output grows from 50000 to 400000 gallons per week Higher labor productivity in the large-scale plants resulting from the use of high-speed
Plant II Plant III (200000 galwk) (400000 gallwk)
Weekly cost Costgallon Weekly cost Costgallon
$ 2896 $0145 $ 4638 $0116 7566 0378 13613 0340
628 0031 1130 0028 2207 0110 3739 0093
646 0032 939 0023 20691 1035 41233 1031
1340 0067 2680 0067 1572 0079 3528 0088
457 0023 914 0023 1472 0074 2671 0067 1134 0057 1885 0047
383 0019 670 0017 815 0041 1176 0029
1086 0054 2172 0054 $42893 $2145 $80988 $2025
processing and filling equipment is the source of lower labor cost per gallon
Interest and depreciation costs decline by $0327 per gallon as weekly output increases from 50000 to 400000 gallons This savings results from substantially lower investment requirements per gallon of weekly output for large plants
The most important category of total processing cost is containers accounting for 39 to 51 percent of weekly costs Labor costs account for 18 to 22 percent of total costs for the model plants Capital costs interest and depreciation contribute 11 to 21 percent to total cost
Effects of Seasonality on Processing Costs
Because of seasonal variations in fluid milk sales all fluid milk firms experience variation in plant utilization levels Generally peak daily sales occur in October or November and sales bottom out in June Daily fluid milk sales in June average 80 to 83 percent of daily sales during October and November10
To determine how seasonality influences processshying costs we estimated weekly operating costs for the three model plants at 80 90 and 100 percent of planned output Interest taxes insurance depreciation and adshyministrative costs were h~ld constant Costs for hourly labor containers supplies and other variable items were reduced in proportion to output Figure 4 shows the effects of seasonality on per-gallon operating costs Costs per gallon are 4 to 6 percent higher when plants operate with 20 percent excess capacity than when they operate at planned capacity Note that the impact of seasonality is greater for small than for large plants
10Agricultural Marketing Service Federal Milk Order Market Statistics Annual Summary for 1976 Statistical Bulletin No 575 US Department of Agri culture June 1977
13
29
28
Processing cost (cents per gallon)
PIn1 Plant util ization level 80 bull
27 90 X 100 bull
26
25
24
23
22
21
20
-Weekly-------rl-~~~~I~~~~I~~~I-+I~I~~-rl~~~I-I~I~~-+~~-I~I~~~~I~I~I~~-+------production
40 80 120 160 200 240 280 320 360 400 (1000 gals)
Figure 4 Effects of plant size and utilization level on fluid milk processing costs for three model fluid milk processing plants
Fluid Milk Distribution Costs in Minnesota
Fluid milk distribution costs -- essentially the costs of selling transporting and delivering milk -- comprise an important part of the total cost of fluid milk firms In this section milk distribution costs are estimated for several kinds of distribution routes including retail (home delivery) wholesale and long-distance overshythe-road routes The latter are routes on which milk is transported from a central bottling plant to a distribushytion facility and from the distribution facility to wholeshysale outlets The economic-engineering approach also was used for these cost estimates Equipment firms proshyvided equipment costs Labor requirements and route characteristics were determined from a survey of milk routes Wages and prices used in this study are those prevailing in Minnesota during 1977-78
Vehicle Costs ACQUISITION COSTS
Milk distribution vehicles consist of an insulated van body or trailer a refrigeration unit and a chassis truck or diesel tractor Tables 14 and 15 show prices for components and for appropriately matched combinashytions of components Prices for vans range from $10100 for a 10-foot unit to $53555 for a 22-foot unit with a dieshysel engine Prices for tractor-trailer units range from $41351 for a 3D-foot unit to $65450 for a 42-foot unit Vehicle cost is an increasing function of payload The cost of diesel vans is about double the cost of comparable gasoline units
llIn fact for many Minnesota dairies as well as for dairies in other states distribution costs exceed processing costs See the Federal Trade Commissions study Economic Report on the Dairy Industry Staff Report to the Federal Trade Commission Washington DC March 19 1973 pp 90-94
14
Table 14 Cost offluid milk distribution vehicles and components 1977
Refrigeration Total Chassis Van bodymiddot unitb Payload vehicleVan length
(feet) Model Cost Model Cost Model Cost (cases) cost
10 Ford F-350 $ 4500 BDW-l0 $3300 TNT-20 $2300 100 $10100
12 Ford F-600 7488 BDW-12 3600 TNT-20 2300 175 13388 14 Ford F-751 9788 BDW-14 4000 XMT-50 3500 250 17288 16 (i) Ford LT-800 15722 BDW-16 4300 XMT-50 3500 325 23522 16 (ii) IH Cargo Star 15901 BDW-16 4300 XMT-50 3500 325 23701 18 (i) Ford L T-800 15722 BDW-18 4700 XKW-20 4650 400 25072 18 (ii) IH Fleetstar 19780 BDW-18 4700 XKW-20 4650 425 29130 20 (i) Ford LT-800 15722 BDW-20 5000 XKW-20 4650 425 25372 20 (ii) IH Transtar 4270 with
8V71 Detroit Diesel 35860 BDW-20 5000 XKW-20 4650 500 45510
22 IH Transtar F-4270 with 3208 Cat Diesel 40618 BDW-22 5200 TWO-50 7737 575 53555
aAIl van bodies are Freuhauf brand with 3-inch insulation bAli refrigeration units are Thermo King brand with electric standby Based on 45-pound cases
Table 15 Cost of tractor-trailer components used in fluid milk distribution 1977
Trailer Total Tractor Trailera Refrigeration unitb Payload vehiclelength
(feet) Model Cost Model Cost Model Cost (cases) cost
30 (i) Ford LNT-8000 Great Dane with 3208 Cat Diesel $22351 701 Tl1 $13000 XROL-50 $6000 600 $41351
30 OJ) IH Fleetstar 2050 Great Dane with IHD190 Diesel 23982 701 Tl1 Tandem 14000 XROL-50 6000 700 43982
35 IH Fleetstar F2070A Great Dane with 671 N Detroit Diesel 27000 701 Tll Tandem 14200 Super NWD-50 8450 850 49650
42 Ford CLT-9000 42000 Highway Super NWD-50 8450 1000 65450 901 R-42-6-3T 15000
aAIl trailers are insulated bAli refrigeration units are Thermo King brand with electric standby cBased on 45-pound cases
Table 16 Estimated fixed and variable costs for vans used to distribute milk
Vehicle size (van length in feet) 10 12 14 16 (i) 16 (ii) 18(i) 18 (ii) 20 (i) 20(ii) 22
----------------------------------------------------------------1 977 dolla rs ---------------------------------------------------------------shyFixed costs
(annual) Interest on
investment 66660 88360 114100 155245 156427 164527 192258 167455 300366 353463 Federal highway
usetaxb 8100 8100 8100 9000 9000 12000 12000 12000 12000 12000 Licensee 6200 9100 12600 23000 42000 23000 42000 23000 42000 54000 Insuranced
Metro area 50430 57470 65550 70950 70950 81500 81500 81500 105100 101800 Nonmetro area 26800 31500 31600 34900 34900 41400 41400 41400 55400 52100
Variable costs (per mile)
Depreciation8 101 13288 1383 18818 18961 20058 23304 20298 22755 26778 Repairs and
maintenance 1069 1069 1069 1069 1114 1069 1114 1069 07985 07985
15
22
Table 16 Estimated fixed and variable costs for vans used to distribute milk (continued)
Vehicle size (van length in feet)
10 12 14 16 (i) 16 (ij) 18 (i) 18 (ii) 20 (i) 20 (ii)
--------------------------------------------------------------- 1977 doll a rs ------ -- -- ----------------------------------------------------shy
Fuel 9
Tires h
09
0093 105 0093
1733
012 1733 0175
1733
0175 1840 0175
1840
0175 1840 0175
1185
0175 1058 0175
Total fixed cost per year
Metropolitan Nonmetropolitan
131390 107760
163020 137060
200350 166400
258195 222145
278377 242327
281075 240975
369158 329058
283955 243855
459465 409766
521263 471563
Total variable cost per mile 3072 3541 4305 4859 4918 5090 5459 5114 4434 4703
See footnotes following table 17
Table 17 Estimated fixed and variable costs for tractor-trailers used to distribute milk
Vehicle size (in feet) 30 (i) 30 (ii) 35 42
-------------------------------------------- 1977 do II ars -------------------------------------------shyFixed costs (annual)
Interest on investmentabullbullbullbull 256417 283681 323670 432887 Federal highway use taxbbullbullbullbullbullbull 19500 21000 22200 22200 Licensee 42000 54000 83000 105000 Insuranced
Metropolitan area 97500 95600 85900 92300 Nonmetropolitan area 47800 55400 41900 48300
Variable costs (per mile) Depreciationebullbullbullbullbull 1118 1132 1075 1468 Repairs and maintenance 0805 0805 0805 0720 FueI9bullbullbullbullbullbullbullbullbullbullbull 1168 1168 1102 1102 Tires hbullbullbullbullbullbullbullbullbullbullbullbullbullbullbullbullbullbullbullbullbullbull 0187 0187 0240 0240
Total fixed cost per year Metropolitan area 415417 454281 517480 652387 Nonmetropolitan area 365717 414081 473470 608387
Total variable cost per mile 3278 3292 3288 3530
Calculated at a rate of 12 percent on an average investment of 50 percent of initial vehicle cost bFrom IRS Form 2290 Federal Use Tax Return on Highway Motor Vehicles From Minnesota Department of Transportation dlncludes liability property damage personal injury protection and physical damage and comprehensive coverages based on an average vehicle age of 2 to
3 years Source Drew Agency of St Paul Based on expected lifetime mileages of
100000 miles for 10 to 12 foot vans 125000 miles for 14 to 20 foot vans with gasoline engines 200000 miles for 20 to 22 foot vans with diesel engines 300000 miles for smaller diesel tractors used with 30 foot trailers and 750000 miles for trailers
Refrigeration units were depreciated at the same rate as chassis or tractor IBased on information provided by International Harvester of St Paul gBased on 60 cents per gallon for diesel 63 cents per gallon for regular gasoline and mileage per gallon as follows
7 mpg for 10 foot vans 6 mpg for 12 foot vans 4 mpg for 14 to 20 foot vans with gasoline engines 65 mpg for 20 to 22 foot vans with diesel engines and 6 mpg for diesel tractors
Also included is fuel consumption by refrigeration units Estimated fuel consumption per mile for refrigeration units is Model Fuel consumption per mHe (gallons) TNT-20 0 (runs off fan belt) XMTmiddot50 025 XKWmiddot20 042 TWDmiddot50 021 XROL-50 028 Super NWD-50 017
hBased on six tires for 10 to 14foot vans 10tires for 16 to 22 foot vans (these have tandem rear axles) 14tires on the single axle 30 foot trailer-tractor unit and 18 tires on other trailermiddottractor units with an average mileage per tire of 45000 for tires used on vans and 150000 for tires used on tractors or trailers Tire prices were furnished by Brad Ragen Tires Incorporated of St Paul
16
OPERATING COSTS
Operating expenses for distribution vehicles inshyclude those fixed on an annual basis (interest insurshyance license fees and highway use taxes) and those varying with mileage driven (depreciation repairs and maintenance fuel and tires) Tables 16 and 17 show fixed and variable operating expenses for 14 distribushytion vehicles
License costs shown are for vehicles up to 5 years old For older vehicles license costs are approximately 60 percent of the amounts shown
Insurance coverage includes liability property damage personal injury protection and comprehenshysive Insurance costs shown are for vehicles 2 to 3 years old Insurance on older vehicles is somewhat less costly Note that insurance costs are substantially higher in the metropolitan area than in nonmetropolitan areas
Depreciation was calculated on a straight-line basis over the expected lifetime for each vehicle Expected lifetime mileage estimates reported by dairy transportashytion managers reflect mileage expected under normal operating conditions Depreciation cost per mile varies from 10 cents for a 10-foot van to 27 cents for a 22-foot van with a diesel engine For tractor-trailer combinashytions depreciation per mile varies from 11 cents for a 30shyfoot unit to 15 cents for a 42-foot unit
Repair and maintenance cost per mile was based on the rate schedule of a local firm that offers contracted repair service to dairies Repair and maintenance costs are substantially lower for diesel vans than for comparashyble gasoline vans
Fuel costs were based on mileage estimates proshyvided by local dairy transportation managers and on reshyfrigeration unit fuel requirements indicated by refrigera-
Total annual cost (in thousands of dollars)
185 180 175 170 165 160 155 150 145 140 135 130
tion equipment manufacturers Fuel prices for regular gasoline ranged from 549 to 689 cents per gallon at the time of the study Diesel fuel priCes showed similar varishyability but averaged approximately 3 cents per gallon less than regular gasoline For our fuel cost estimates we used prices of 63 cents for regular gasoline and 60 cents for diesel fuel
Tire costs per mile were based on tire prices and exshypected lifetime mileage estimates provided by a local tire distributor
Comparison of Costs for Diesel- and Gas-Operated Vans
Because of higher purchase price fixed costs and depreciation are higher for diesel vans than for comshyparably sized gasoline-operated vans However diesel units use less fuel per mile and less expensive fuel Also repair and maintenance costs are lower for diesel units Consequently total variable costs for diesel unit~ are lower than for gas units Total annual costs for 20-foot diesel and gasoline operated units are shown in relation to annual mileage in figure 5 This graph shows that when annual mileage exceeds approximately 25000 miles the diesel unit has lower total costs For annual mileage less than 25000 miles the gasoline unit is less costly to operate
Predicting Equations for Vehicle Costs Using the cost data in tables 16 and 17 and the payshy
load data III tables 14 and 15 we developed equations to predict vehicle cost per gallon of milk distributed The
L Total I annual
20000 22000 24000 26000 28000 30000 mHeage
Figure 5 Comparison of total annual operating costs for 20-foot gasoline- and diesel-operated vans
17
Table 18 Predicting equations for vehicle cost per gallon of milk distributed
Equation form AVe = ex + amp(IQ) + i32(RL) Estimated coefficient(standard error)
Equation number and type of route C amp amp2 R2 Restrictions
1 Metropolitan wholesale -01165 2261 or retail (00301 ) (176)
2 Nonmetropolitan wholesale -01216 2193 or retail (00302) (176)
3 Over-the-road -01265 7156 (00335) (981)
AII coefficients are significant atthe 99 percent confidence level
factors determining vehicle cost per gallon are the quanshytity of milk distributed and the length of the distribution route For each type of route predicting equations for unit vehicle costs took the form1z
Ave = a + B1 (1Q)+ Bz(RL) where
Ave = vehicle cost in dollars per gallon of milk deshylivered
Q = quantity delivered in gallons and RL = route length in miles
The range of quantities and route lengths used in estimashytion were those reported for each type of route by fluid milk firm transportation managers The equation should yield positive coefficients on lQ and RL reflecting lower vehicle expense on large-volume routes but higher vehicle expense on long-distance routes
To estimate equations for unit vehicle costs fixed annual costs were allocated for 260 route days for wholesale and retail routes and 160 route days for overshythe-road routes Table 18 shows the estimated equashytions The column labeled restrictions shows the range of quantities and route lengths over which the equations are expected to be valid Wholesale route veshyhicle costs are predicted to fall from $0925 to $0228 per gallon as quantity delivered increases from 300 to 4000 gallons on metropolitan routes 80 miles long (equation 1) For an over-the-road route carrying 4300 gallons costs rise from $01499 to $04799 per gallon as round trip mileage increases from 100 to 400 miles (equation 3)
Labor Expenses The direct labor associated primarily with milk disshy
tribution includes route drivers route supervisors and loading and unloading dock workers Labor costs inshyclude employees base salaries commissions on sales health and life insurance contributions to pension funds unemployment insurance social security and uniforms Table 19 shows annual costs for route drivers Note that route drivers are generally paid by the hour while over-the-road drivers are paid by the mile In addishy
I2This form was selected because it yields results that are (1) consistent with prior expectations and (2) statistically satisfactory
00036 (00003) 91
Valid for quantishyties 50-4000 galshylons and route
00036 91 lengths 30-200 (00003) miles
Valid for quanti shy
00011 (00001 )
96 ) ties 2000-4300 gallons and route length from 50-500 miles
tion to base wages route drivers are paid sales commisshysions Horne delivery drivers usually are paid a straight commission but dairy managers report that annual salashyries for horne delivery drivers tend to be nearly equal to those of wholesale route drivers
Wages benefits and payroll taxes for route drivers account for 80 to 85 percent of total distribution labor costs The remaining distribution labor costs include salaries benefits and payroll taxes for route supervisors and supplementary dock workers
To estimate unit labor costs for retail and wholesale milk distribution it first was necessary to estimate the relationships between labor time per gallon delivered and the quantity delivered route length and number of stops per route Labor cost per minute then was estima~ ted and the coefficients on the labor-time-per-gallon equations were multiplied by the cost-per-minute facshytors for labor employed in retail and wholesale delivery Data on labor time quantity route length and number of stops were obtained in a survey of milk distribution practices for 118 retail and wholesale routes Table 20 summarizes characteristics of these routes The relationshyships between labor time quantity route length and number of stops (standard errors are in parentheses) are 13
wholesale ALT =
3859 + 52877[I1Q] + 0022[RL] + 0121[S] (0425) (1793) (0004) (0009)
retail ALT = 1171 + 16510[I1Q] + 0094[RL] (245) (1341) (0030)
where ALT = labor time in minutes per gallon delivered Q = quantity delivered in gallons RL = route length in miles and S = the number of stops on the route
Labor cost per minute was estimated under the asshysumption that home delivery drivers work an average of 50 hours per week while wholesale route drivers work 42 hours per week Drivers were assumed to work an
The coefficient on S in the retail labor time equation was insignificant The equations have R2 values of 96 and 92 respectively
18
Table 19 Labor costfor milk distribution drivers 1978 Metropolitan area Nonmetro area
route drivers route drivers Over-the-road drivers
Payratea $833hr $1200hr $535hr $780hr 1625 centsmile plus $580 for overtime for overtime for loading and unloading
Annual base salaryb $1732640 for $1112800 for $1160250 for 25000 miles 40-hr week 40-hr week $1566500 for 50000 miles
$1972700 for 75000 miles $2044640 for $1315600 for 45-hr week 45-hr week
Benefits and payroll taxesC $431567 $311510 $283984
Annual direct plus indirect drivers cost d $2289007 $1505440 $1850484
New wage rates were negotiated in 1978 Hourly pay rates for route drivers include commissions as specified by local fluid milk firm managers bAnnual base salaries for over-the-road drivers include 25 hours per week load and unload pay clncludes pension contributions health and life insurance federal and state unemployment insurance (06 percent on first $4200 for federal and 29 percent
on first $7000 for state unemployment insurance) workmens compensation (423 percent of base salary) FICA (585 percent of first $16500) and uniforms For over-the-road drivers an allowance for meals is also included
d8ased on an average workweek of 42 hours for route drivers and 50000 annual miles for over-the-road drivers
average of 50 weeks per year These assumptions were verified by local plant managers
Route length rather than labor time is the determinshying factor in labor cost on over-the-road routes Dairy transportation managers say that nearly all over-theshyroad routes are comprised of fully loaded (1000-1100 cases or 4300 gallons) semi-trailers Because quantity is virtually constant on over-the-road routes labor cost on this type of route can be expressed solely as a function of the route length
Table 20 Characteristics of 118 fluid milk distribution routes in Minnesota
Numberof Type of route observations Low High Average
Home delivery 18 Quantity (gallons) 50 340 2232 Route length (miles) 25 100 617
Number of stops 40 230 1519 Labor time (hours) 4 12 97
Wholesale 100 Quantity (gallons) 250 4000 18310 Route length (miles) 20 200 814 Number of stops 2 40 200 Labor time (hours) 55 135 88
Based on the annual salaries presented in table 19 labor cost was $1526 per minute on home delivery routes $1817 per minute on metropolitan area wholeshysale routes and $1195 per minute on nonmetropolitan routes The cost per mile for over-the-road drivers was $3701 Expense records of existing plants indicate that 20 percent of driver labor cost must be added to cover the expense for route supervisors and supplemental dock workers Therefore the total distribution labor cost per minute was $1831 for home delivery routes $2180
for metropolitan wholesale routes and $1434 for nonshymetropolitan wholesale routes Total distribution labor cost per mile on over-the-road routes was $4441
Table 21 shows the equations derived by multiplyshying the coefficients of the labor time equations by the appropriate cost-per-minute figures for retail and whblesale routes Also shown is the relationship beshytween route length and cost per gallon delivered on over-the-road routes On a typical home delivery route carrying 223 gallons to 152 stops in 62 miles labor cost is predicted to be $4553 per gallon (equation 4) On a typical metropolitan area wholesale route carrying 1800 gallons to 20 stops in 80 miles distribution labor expense is predicted to be $0711 per gallon (equation 5) The same route located in the nonmetropolitan area would have labor costs of only $0472 per gallon (equashytion 6) This reflects the difference in wages between metropolitan and nonmetropolitan areas Distribution labor costs on over-the-road routes increase from $0206 to $0412 per gallon as round trip mileage increases from 200 to 400 miles (equation 7)
Selling Expenses We include selling expenses in distribution costs
Selling expenses are salaries and benefits for marketing staff accountants bookkeepers and clerical workers rent and depreciation on office machinery and equipshyment data processing costs telephone and telegraph costs postage costs costs of office supplies used for billshying and record keeping and advertising expenses From information proVided by several Minnesota dairies it was determined that selling expenses amountto approxshyimately $0370 per gallon14 Table 22 shows a breakshydown of selling expenses by major components
14Unfortunately available data were not sufficient to investigate whether this important component of costs exhibits economies of scale
19
Table 21 Predicting equations for labor cost per gallon of milk distributed by type of route
Equation form ALC = amp + amp(IIQ) + amp2(RL) + amp3(5) Estimated coefficient
Equation number and type of route ( amp amp2
4 Metropolitan home delivery 2144 3023 0017
5 Metropolitan wholesale -0841 11529 00048
6 Nonmetropolitan wholesale -0553 7583 00032
7 Over-the-road 0 0 000103
Table 22 Selling costs of fluid milk processors Minnesota 1977
Cost Cost as percentage of Expense per gallon total selling cost
Advertising $00162 438 Payroll salaries 00120 324 Payroll benefits 00025 68 Telephone telegraph
and postage 00015 41 Bad debts 00022 59 General supplies 00026 70
Total $00370 1000
Includes pension payroll taxes health and welfare insurance and other fringe benefits
Distribution Facility Expense Several large Minnesota milk firms distribute a subshy
stantial portion of their products through distribution facilities located in out-state regions The milk is hauled over the road to the distribution facility and delivered from there on ordinary wholesale routes In some cases the distribution facility is owned and operated by the parent bottling company in others the facility is indeshypendently owned and operated by a jobber Ordinarily the distribution facility is a former bottling plant
The costs of operating such a facility will depend on many factors including the size and location of the facilshyity To estimate distribution facility costs we have conshyducted an economic-engineering analysis similar to that used in determining in-plant costs for model fluid milk processing facilities The model distribution facility was based on recommendations found in the USDA publication A Dairy Products Distribution Facility Layshyout and Operating Methods15 The facility has a storage capacity of 12000 gallons and is designed to handle 60000 gallons of fluid milk per week
Table 23 shows capital costs for the land buildings and equipment required by the distribution facility Toshytal investment amounted to $352470
Operating costs for the facility include interest depreshyciation maintenance utilities taxes insurance and lashybor Table 24 shows total annual costs and costs per galshylon for this facility Interest was computed at 10 percent
amp3 Restrictions
Valid for quantities from 50 to 350 gallons 0 route lengths from 25 to 100 miles and
number of stops from 40 to 230
Valid for quantities from 400 to 3500 gallons002641 route length from 50 to 500 miles and
00174 number of stops from 5 to 40
Valid for fully-loaded semis and for all0 route lengths from 50 to 500 miles
of the average value of buildings and equipment over their expected lifetimes Depreciation was calculated on a straight-line basis over 33 years for the bUilding and 25 years for equipment Maintenance cost was calculated at 05 percent of initial building and equipment cost
Table 23 Land buildings and equipment investment for a satellite fluid milk distribution facility
Item Description Cost
Land 2 acres $27000
Building Cooler 1800 square feet Refrigeration equipment 200 square feet Boiler room 200 square feet Truck maintenance 1750 square feet Offices and drivers room 1 320 sq u a re feet Lavatories and locker
rooms 400 square feet Corridor and stairways 120 square feet Receiving and load-out 1 800 s9 u a re feet
Total 7590 square feet 250470
Equipment Refrigeration and mechanical 75000
Calculated at $13500 per acre for developed industrial land and $33 per square foot of building space
Table 24 Operating expenses for a 60OOO-gallons-pershyweek satellite fluid milk distribution facility
Item Annual cost Cost per gallon
Interest $16273 $0052 Depreciation 10590 0034 Maintenance 1627 0005 Utilities 10518 0034 Taxes 5891 0019 Insurance 1645 0005 Production labor 36400 0117 Administrative labor 3021 0010
Total $85965 $0276
Agricultural Research Service A Dairy Products Distribution Facility Layout and Operating Methods Marketing Research Report No 990 US Deshypartment of Agriculture Washington DCbull April 1974
20
In computing taxes for the facility a mill rate of 90 was applied to 43 percent of the average value of the buildings and land This mill rate is appropriate for land and buildings located in out-state regions
Insurance for the facility based on premiums sugshygested by a local insurance agency amounted to $1645 per year
The cost of utilities including water sewage elecshytricity and fuel was estimated to be $10518 per year
Two laborers are needed for receiving products arshyranging products in route loads placing stacks on conshyveyors maintaining equipment and cleaning Costs of these laborers including salaries benefits and payroll taxes amount to $36400 per year This figure is based on a wage of $700 per hour a 40-hour work week and 25 percent additional for benefits and payroll taxes
Commonly a satellite facility employs an adminisshytrator and clerical workers Their responsibilities inshyclude directing the activities of laborers maintaining records billing securing accounts route supervision and selling These activities supplant some work which would otherwise be performed by administrators and clerical workers engaged in these activities at the proshycessing plant To avoid double counting of these costs we calculated satellite facility administrative costs at 83 percent of production labor expense This represents the increment in administrative costs necessitated by the satellite facility
Total cost of operating the 60000-gallons-per-week distribution facility was $85965 per year or $0276 per gallon of milk handled
Total Fluid Milk Distribution Costs By building on the above analysis equations were
developed for predicting total distribution costs for varishy0us types of routes Total distribution costs include veshyhicle expense labor expense and selling expense In adshydition for milk delivered to a satellite distribution facilshyity the cost of operating the facility must be included
An equation for estimating total distribution costs on metropolitan area wholesale routes was constructed by adding the appropriate coefficients for vehicle cost (equation 1 table 18) labor cost (equation 5 table 21)
and the selling expense (table 22) Similar equations can be constructed for other types of routes Table 25 shows equations for total distribution cost per gallon Equashytions 8 9 and 10 can be used to estimate unit distribushytion costs for retail and wholesale routes from the bottlshying plant To calculate costs of distributing through a satellite distribution facility costs from the processing plant to the satellite facility must be calculated using equation 11 and added to wholesale route distribution costs from the satellite facility computed from equation 12 Operating costs for the satellite distribution facility are included in equation 11
Costs on typical wholesale distribution routes carryshying 1800 gallons to 20 stops in 80 miles are predicted to be $1379 in the metropolitan area Metropolitan area wholesale milk distribution costs are extremely sensishytive to volume falling from $3031 to $0867 when volshyume increases from 400 to 3500 gallons (equation 9) Figure 6 shows the dramatic impacts of route location and quantity delivered on wholesale routes Costs deshycline rapidly as volume increases to 1200 gallons and continue to decline gradually thereafter
On a typical home delivery route carrying 223 galshylons to 152 stops in 62 miles unit distribution costs are $5674 (equation 8) Low volume is responsible for the relatively high distribution costs incurred in home delivery
On most types of distribution routes unit costs inshycrease with the number of customer stops and the length of the route Figure 7 shows the effect of number of stops on unit distribution costs Costs per gallon rise by $0264 for each additional 10 customer stops on metropolitan wholesale routes
Figure 8 shows the effects of route length on unit distribution costs On metropolitan area wholesale routes distribution costs rise by $0084 per gallon for each additional 10 miles of route length
On fully loaded over-the-road routes to a satellite distribution facility distribution costs rise from $0529 to $1381 per gallon as round-trip mileage increases from 100 to 500 miles This includes $0276 per gallon operating expense for the distribution facility Figure 9 shows the impact of route length on costs of distribution to satellite distribution facilities
Table 25 Predicting equations for fluid milk distribution costs by type of route
Equation form cost per gallon = ~ + B(1Q) + amp2(RL) + B3(S)
Equation number and type of route
8 Metropolitan area home deliverymiddot
9 Metropolitan area wholesale
10 Nonmetropolitan wholesale
Via satellite distribution facility
11 Costs of distribution from processing plant to satellite facility plus satellite costsb
12 Wholesale routes from satellite facility
Includes labor vehicle and selling expenses
amp
20275
-05875
-03046
Estimated coefficient Is ~2
5284
13790
9776
00206
00084
00068
00264
00174
01500 7156 000213
-03046 9776 00068 00174
blncludes labor vehicle and satellite distribution facility operating expenses
21
Cost (cents per gallon)
40
35
30
25
Metropolitan area 20
15
10 Nonmetropolitan-------=============
5 area
________________________________________ Quantity (gallons)400 800 1200 1600 2000 2400 2800 3200 3600 4000
Figure 6 Fluid milk distribution costs on metropolitan and non metropolitan wholesale routes (based on route length of 80 miles and 20 stops per route)
Cost (cents per gallon)
45 shy
40
35
30 shy
25 shy
30 stops per route 20 shy
15 shy
10 shy
10 stops per route 5-
________________________________________ Quantity
400 800 1200 1600 2000 2400 2800 3200 3600 4000 (gallons)
Figure 7 Effect of number of stops on metropolitan area wholesale milk distribution costs (based on route length of 80 miles)
22
--- ---------- -- - - - - - - ---- ---------- ----
Cost (cents per gallon)
45
40
35
30
25 Route length 120 miles
20
15
10
Route length 40 miles7 ----------------shy5
________________________________________ Quantity (gallons)400 800 1200 1600 2000 2400 2800 3200 3600 4000
Figure 8 Effect of route length on metropolitan area wholesale milk distribution costs (based on 20 stops per route)
Cost (cents per gallon)
13 shy
12 shy
11 shy
10 shy
9shy
8shy
7shy
6shyTransportation cost 5shy
4shy
3shy
2shy
JDistribution facility operating cost
- Round ----------------------------------------- trip
50 100 150 200 250 300 350 400 450 500 mileage
Figure 9 Costs of distributing milk on fully loaded over-the-road routes to a satellite distribution facility
23
Impact of Distribution Costs on Optimum Plant Size
On the most common types of wholesale milk distrishybution routes distribution costs predicted by the equashytions developed in this section will be between $1100 and $1700 per gallon delivered In contrast processing costs minus packaging materials expense were $0994 to $1619 per gallon according to the estimates presented earlier Distribution costs are an important determinant of the total costs incurred by milk processors For many milk processing firms distribution costs exceed the costs of processing milk This is true for firms distributshying a substantial portion of their product on low-volume routes eg home delivery or to widely dispersed retail stores such as those in rural areas For larger plants disshytributing a substantial portion of milk through distribushytion facilities distribution costs are likely to exceed proshycessing costs
Processing costs decline rapidly when plant scale increases up to 100000 to 200000 gallons per week and may continue to decline when output increases beyond 200000 gallons per week However savings to processhysors gained through the realization of economies of size will be offset if the added volume is delivered over a wider geographic area to new customers For example unit processing costs will fall from $2145 to $2025 when volume processed increases from 200000 to 400000 gallons per week But this $0120 reduction in unit processing costs could easily be eliminated by an increase maverage route length of 15 miles This route length increase would cause unit distribution costs to rise by $0126 (on metropolitan area wholesale routes) more than offsetting the savings from economies of size in processing The fact that increased volume generally must be distributed over wider geographic areas serves as a deterrent to increased plant size In markets where outlets are widely dispersed the- least-cost structure of the processing sector is likely to be a combination of geoshygraphically dispersed intermediate-sized plants rather than a single large processor Consequently the presshysure for increased plant size is less than would be indishycated by an analysis based solely on in-plant costs
Summary
The fluid milk processing industry in Minnesota has evolved since 1956 from 289 to 30 processing plants Major factors in this change are economies of size for plants that process and distribute large volumes of milk A major objective of this study was to measure these economies
An economic-engineering approach was used to calculate processing costs for three sizes of milk plants These estimates show that economies of size are signifishycant as plant size is expanded to 200000 gallons per week but when output grows beyond 200000 gallons per week these economies level off Costs decline from 267 to 215 cents per gallon as volume is increased from 50000 to 200000 gallons per week Expanding plant size to 400000 gallons reduces costs to 203 cents per gallon We conclude that economies of size beyond 200000 gallons per week are relatively minor
Distribution costs were estimated for alternative truck sizes lengths of routes and number of stops These costs included vehicle labor and selling expenses and for milk distributed through a satellite distribution facility operating expenses for the facility Equations were constructed for predicting unit costs on individual routes Unit costs decreased when volume delivered increased but costs rose when either the numshyber of stops or the length of the distribution route inshycreased Table 26 shows unit costs for various routes Distribution costs for the entire operation depend on the combination of truck sizes and on whether satellite disshytribution facilities are used For many fluid milk firms it appears that distribution costs will equal or exceed proshycessing costs
Table 26 Summary of distribution costs by type of route
Route Distribution
Type of route Gallons
delivered length (miles)
Number of stops
cost per gallon
Home delivery 200 50 150 $5680 300 100 150 5848 300 50 150 4819
Metropolitan wholesale 1200 80 20 1762
1200 120 20 2098 2000 80 20 1302 2000 120 20 1638
To distribution facility 4300 150 0635
4300 300 0955
From distribution facility 1200 80 20 1402
Nonmetropolitan wholesale 1200 120 20 1674
2000 80 20 1076 2000 120 20 1348
Enlarging the distribution areas without increased volume per stop will increase distribution costs If added production must be distributed over a wider geoshygraphic area average route length will increase causing an increase in unit distribution costs Thus economies of size in fluid milk processing are offset by diseconoshymies of size in distribution For this reason there may be less pressure for additional consolidation of processing operations in Minnesota than in other regions of the United States where dense population exists over wide geographic areas
24
Table A-1 Itemized equipment requirements for Plant I
Item Cost Item Cost
100 GPM receiving pump $ 1650 75 cpm 12 pt-qt filler $ 85000 2 tank CIP unita (2) 26000 Handle applicator 7500 CIP transport tank washer 2400 4min 5-gal filler 3350 COP portable tank (2) 3000 Carton conveyors (120) 14400 5000 gal raw storage tank b(2) 30000 Automatic casers (3) 39000 2000 gal raw storage tankb 11000 Case stackers (3) 30000 2000 gal cream storageb 11000 Case inserters (3) 6000 4000 gal cold wall surge 13000 20 per min case washer 7000 2000 gal cold wall surge 10000 20 per min case unstacker 10000 1000 gal cold wall surge 8500 Case conveyors and drives (400) 60000 1500 gal pasteurizing vat 16500 Conveyor hydraulic unit 4500 1000 gal pasteurizing vat 13500 Process control panel 1045 Storage tank mounts (7) 3500 Receiving control panel 2600 Hot water set for HTST 5900 Sanitary lines and valves 15000 Transfer pumps (2) 900 Boilers - 75 bhp (2) 32000 Clarifierseparator 39500 Ammonia receiver compressor 13410 60 gal balance tank 1100 Condensor pumps piping 15340 Plate heat exchanger 85 regen 17500 Ice builder 16100 Timing pump 4600 Cooling units - cold room 8040 Flow diversion valve 1300 Cooling units - tanks 3355 Holding tube 2323 Controls 3400 Vacuumizer 9200 Mechanical cbullbullbullbullbullbullbullbullbullbullbullbullbullbullbullbull 38500 Tailer sensor and controls 2917 Installation dbullbullbullbullbullbullbullbullbullbullbullbullbullbullbullbullbullbullbullbullbullbullbullbullbull 162810 15000 hr homogenizer 21250 Miscellaneous 9800 30 cpm gal filler 90000 33 cpm gal 12 gal filler 75000 Total equipment cost $1009690
Includes pumps valves and control panels blncludes liquid scale gauges clncludes air compressors refrigerators electrical cost for running power to motors and mechanical cost for utility hookup of machines dCalculated at 20 percent of cost of storage and surge tanks 40 percent of cost of processing and CIP equipment and 30 percent of cost of mechanical
refrigeration and case handling equipment Filling equipment prices include installation
Table A-2 Itemized equipment requirements for Plant II
Item Cost Item Cost
200 GPM receiving pump $ 1700 75 CPM 112 gal filler $ 99000 2 tank CIP unita 13000 160 CPM 12 pt-qt filler 229000 3 tank CIP unit 17500 4min 5-~al filler 3350 COP portable tank (2) 3000 Handle applicator 9000 CIP transport tank washer 2400 Carton combiner 4000 20000 gal cold wall silo (2)b 46200 Carton conveyor (200) 24000 5000 gal raw storageb(2) 30000 Automatic casers (3) 47000 5000 gal cream storageb 15000 Case stackers (3) 30000 10000 gal cold wall surge silo 17500 Case inverters (3) 6000 5000 gal cold wall surge 14000 40min case washer 15000 2000 gal cold wall surge 10000 40min case unstacker 12000 2500 gal pasteurizing vat 21000 Case conveyors and drivers (700) 105000 2000 gal pasteurizing vat 19000 Conveyor hydraulic unit 8000 Storage tank mounts (7) 3500 Process control panel 1045 Silo mounts (3) 9000 Receiving control panel 2800 HTSTfeed pump 450 Sanitary lines and valves 25000 Hot water set for HTST 5900 Boilers 200 bhp (2) 44000 Transfer pumps (2) 1100 Ammonia receiver compressors 30155
Clarifierseparator 118500 Condensor pumps piping 24535 60 gal balance tank 1100 Ice builder 26200 Flow diversion valve 1900 Cooling units 24400 Plate heat exchanger 85 regen 35000 Controls 4200 Holding tube 3803 Mechanical c bullbullbullbullbullbullbullbullbullbullbullbullbullbullbullbullbullbullbullbullbullbullbull 179200 Homogenizer 38450 Installationd bullbullbullbullbullbullbullbullbullbullbullbullbullbullbullbullbullbullbullbullbullbullbullbullbullbullbullbull 315900
25
Table A-2 Itemized equipment requirements for Plant (continued)
Item Cost Item Cost
Vacuumizer Tailer controls and sensors
16000 2917
Miscellaneous 12800
60 CPM galion filler 175000 Total equipment cost $1904505
alncludes pumps valves and control panels blncludes liquid scale gauges clncludes air compressors refrigerators electrical cost for running power to motors and mechanical cost for utility hookup of machines dCalculated at 20 percent of cost of storage and surge tanks 40 percent of cost of processing and CIP equipment and 30 percent of cost of mechanical
refrigeration and case handling equipment Filling equipment prices include installation
Table A-3 Itemized equipment requirements for Plant III
Item Cost Item Cost
Positive displacement receiving pump $ 6445 125 CPM 12 gal filler $ 215000 2 tank CIP unitmiddot 13000 160 CPM 12 pt-qt filler (2) 458000 CIP transport tank washer (2) 4800 Handle applicators (2) 18000 3 tank CIP unitsmiddot (2) 35000 4min 5 gal filler (2) 6700 COP portable wash tank 1500 Carton combiners (2) 8000 30000 gal cold wall silob bullbullbullbullbullbullbullbullbullbullbull 60200 Carton conveyors (350) 42000 20000 gal cold wall silob bullbullbullbullbullbullbullbullbullbullbullbullbullbullbull 23100 Automatic casers (5) 80000 10000 gal cold wall silo b bullbullbullbullbullbullbullbullbullbullbullbull 18600 Case stackers (5) 50000 10000 gal cold wall cream silob bullbullbull bullbullbullbullbullbullbullbull 18600 Case inverters (5) 10000 15000 gal cold wall surge silo (2) 40000 40min case washers (2) 30000 10000 gal cold wall surge silo 17500 40lmin case unstackers (2) 24000 5000 gal surge (2) 28000 Case conveyor and drivers (1000) 150000 Storage tank and silo mounts 25000 Conveyor hydraulic unit 24000 HTSTfeed pumps (2) 900 Process control panel 3000 Hot water sets for HTST (2) 11800 Receiving control panel 2800 Transfer pumps (3) 1950 Sanitary lines and valves 45000 Clarifierseparator (2) 237000 Boilers 300 bhp (2) 56000 60 gal balance tanks (2) 2200 Ammonia receiver compressors 42305 Flow diversion valves (2) 3800 Condensor pumps piping 33430 Holding tubes (2) 11454 Ice builder 30300 Plate heat exchangers 85 regen (2) 70000 Cooling units 36655 Homogenizers (2) 76900 Controls 4700 Vacuumizers (2) 32000 Mechanical c bullbullbullbullbullbull 260000 Tailer controls and sensors (2) 5831 Installation dbullbullbullbullbullbullbullbullbullbullbullbullbullbullbullbullbullbullbullbullbullbullbullbullbullbullbullbull 464940 Tri-blender 5000 Miscellaneous 15700 60 CPM gal filler (2) 350000
Total equipment cost $3211110
Includes pumps valves and control panels blncludes liquid scale gauges clncludes air compressors refrigerators electrical cost for running power to motors and mechanical cost for utility hookup of machines dCalculated at 20 percent of cost of storage and surge tanks 40 percent of cost of processing and CIP equipment and 30 percent of cost of mechanical
refrigeration and case handling equipment Filling equipment prices include installation
26
Bibliography
PUBLICATIONS
Articles of Agreement between Minneapolis and st Paul Milk Dealers and Milk Drivers and Dairy Emshyployees Union Local 471 May 1 1975-April 30 1978
Bartlett Roland et al Outer Market Distribution of Milk in Paper Containers in the North Central Region North Central Regional Publication No 39 Purdue University Agricultural Experiment Station Lafayshyette Indiana October 1953
Federal Trade Cmnmission Economic Report on the Dairy Industry US Government Printing Office Washington DC March 19 1973
Knutson RD Price and Trade Practice Regulation in the Minnesota Dairy Industry unpublished PhD thesis University of Minnesota 1967
Midwest Research Institute Resource and Environmenshytal Profile Analysis of Five Milk Container Systems with Selected Health and Economic Considershyations Final Draft Report MRI Project No 4003-D June 18 1976
USDA Agricultural Marketing Service Transportation and Facilities Research Division Layouts and Operating Criteria for Automation of Dairy Plants Processing Milk Half-and-Half Cream Chocolate Drink and Buttermilk Marketing Research Report No 591 US Government Printing Office Washingshyton DC September 1963
---------------------------------------Packaged Fluid Milk Sales in Federal Milk Order Markets by Size and Type of Containers and Distrishybution Method during November 1975 AMS-553 July 1977
___ Agricultural Research Service A Dairy Products Distribution Facility Layouts and Operating Methods Marketing Research Report No 990 Washington DC April 1974
US Department of Health Education and Welfare Pubshylic Health Service Food and Drug Administration Milk Pasteurization Controls and Tests Cincinnati Training Facility Course Manual 1977
US Department of the Treasury Internal Revenue Sershyvice Federal Highway Use Tax on Trucks TruckshyTractors and Buses Publication 349 (revised)
Williams Sheldon W et aI Organization and Comshypetition in the Midwest Dairy Industries Iowa State University Press Ames Iowa 1970
INDUSTRY CONTACTS
Ammonia House Inc 712 W 77-12 St Minneapolis Minnesota
B-Bar-B Inc Bag-N-Box Packaging Systems 10th and McBeth St New Albany Indiana
Bill Boyer Ford 2811 NE Broadway Minneapolis Minshynesota
Blackhawk Molding Co 109 Commercial Road Addishyson Illinois
Blesi Evans Co 2533 24th Ave South Minneapolis Minnesota
Clover Leaf Creamery Co 420 W Broadway Minneapshyolis Minnesota
Continental Equipment Corp 6103 N 76th St Milwaushykee Wisconsin
Dairy Craft Inc 600 N 54th Ave St Cloud Minnesota DeLaval Separator Co 2950 Metro Drive St Paul Minshy
nesota Drew Agency Inc Griggs Midway Building St Paul
Minnesota Edmeyer Inc 750 S Plaza Drive st Paul Minnesota Environmental Process Inc 1220 Glenwood Ave Minshy
neapolis Minnesota Ex-Cell-O Corp Packaging Systems Group 10212
Xerxes Avenue South Bloomington Minnesota Fogg Filler Co 37 Van Dyke Ave Holland Missouri Freuhauf Corp 1717 W County Road C St Paul Minshy
nesota Graham Poly trip Co 1420 6th Ave York Pennsylvashy
nia Hercules Inc 2285 University Ave St Paul Minneshy
sota International Harvester Co 3000 NE Broadway Minneshy
apolis Minnesota International Paper Co 6100 Olsen Memorial Highway
Minneapolis Minnesota Land OLakes Inc 415 Grove St St Paul Minnesota Meyer Brothers Dairy 105 E Lake St Wayzata Minneshy
sota Pitcher Pak Corp 67 Cummings Park WobuJm Massashy
chusetts Smith-Lee Co 537 Fitch St Oneida New York Sturm Sales Inc 355 21st St Newport Minnesota Superior Dairy Fresh Co 2112 NE Broadway Minneapshy
olis Minnesota Tapemark Co 223 Marie Ave E S1 Paul Minnesota Thermo King Sales and Service Inc 2645 Fairway Ave
N St Paul Minnesota Winscott Glass Co Box I Clarion Pennsylvania
27
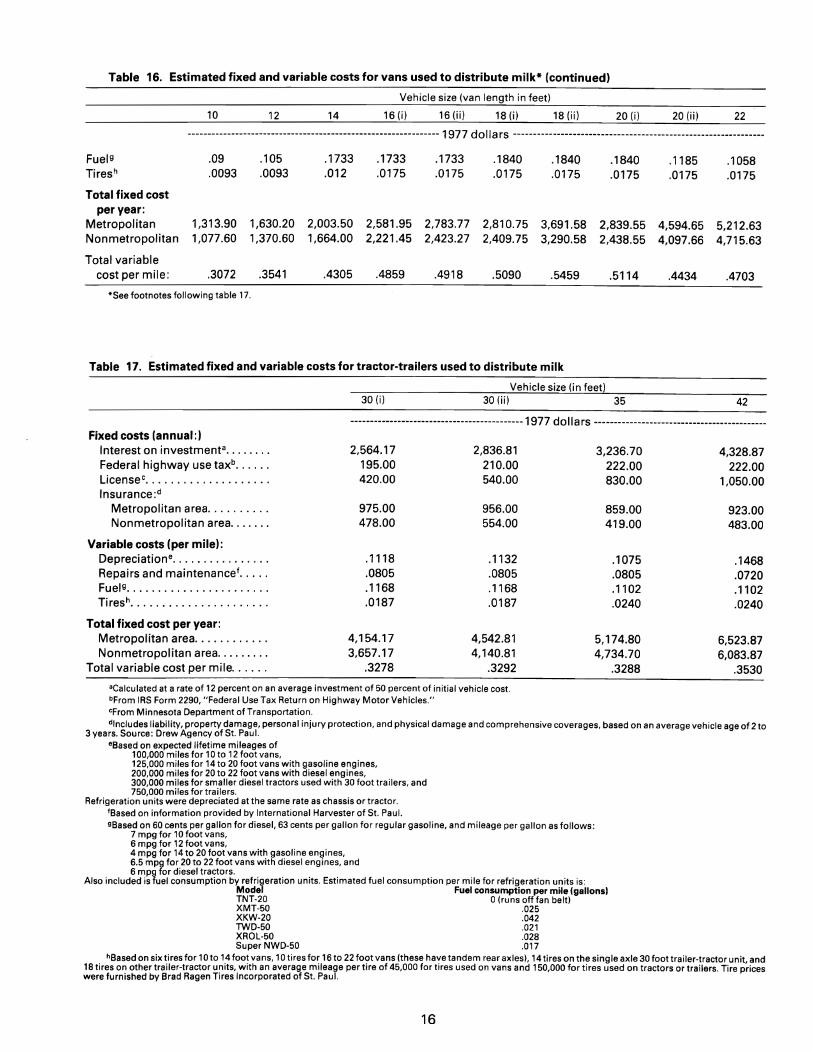
22
Table 16 Estimated fixed and variable costs for vans used to distribute milk (continued)
Vehicle size (van length in feet)
10 12 14 16 (i) 16 (ij) 18 (i) 18 (ii) 20 (i) 20 (ii)
--------------------------------------------------------------- 1977 doll a rs ------ -- -- ----------------------------------------------------shy
Fuel 9
Tires h
09
0093 105 0093
1733
012 1733 0175
1733
0175 1840 0175
1840
0175 1840 0175
1185
0175 1058 0175
Total fixed cost per year
Metropolitan Nonmetropolitan
131390 107760
163020 137060
200350 166400
258195 222145
278377 242327
281075 240975
369158 329058
283955 243855
459465 409766
521263 471563
Total variable cost per mile 3072 3541 4305 4859 4918 5090 5459 5114 4434 4703
See footnotes following table 17
Table 17 Estimated fixed and variable costs for tractor-trailers used to distribute milk
Vehicle size (in feet) 30 (i) 30 (ii) 35 42
-------------------------------------------- 1977 do II ars -------------------------------------------shyFixed costs (annual)
Interest on investmentabullbullbullbull 256417 283681 323670 432887 Federal highway use taxbbullbullbullbullbullbull 19500 21000 22200 22200 Licensee 42000 54000 83000 105000 Insuranced
Metropolitan area 97500 95600 85900 92300 Nonmetropolitan area 47800 55400 41900 48300
Variable costs (per mile) Depreciationebullbullbullbullbull 1118 1132 1075 1468 Repairs and maintenance 0805 0805 0805 0720 FueI9bullbullbullbullbullbullbullbullbullbullbull 1168 1168 1102 1102 Tires hbullbullbullbullbullbullbullbullbullbullbullbullbullbullbullbullbullbullbullbullbullbull 0187 0187 0240 0240
Total fixed cost per year Metropolitan area 415417 454281 517480 652387 Nonmetropolitan area 365717 414081 473470 608387
Total variable cost per mile 3278 3292 3288 3530
Calculated at a rate of 12 percent on an average investment of 50 percent of initial vehicle cost bFrom IRS Form 2290 Federal Use Tax Return on Highway Motor Vehicles From Minnesota Department of Transportation dlncludes liability property damage personal injury protection and physical damage and comprehensive coverages based on an average vehicle age of 2 to
3 years Source Drew Agency of St Paul Based on expected lifetime mileages of
100000 miles for 10 to 12 foot vans 125000 miles for 14 to 20 foot vans with gasoline engines 200000 miles for 20 to 22 foot vans with diesel engines 300000 miles for smaller diesel tractors used with 30 foot trailers and 750000 miles for trailers
Refrigeration units were depreciated at the same rate as chassis or tractor IBased on information provided by International Harvester of St Paul gBased on 60 cents per gallon for diesel 63 cents per gallon for regular gasoline and mileage per gallon as follows
7 mpg for 10 foot vans 6 mpg for 12 foot vans 4 mpg for 14 to 20 foot vans with gasoline engines 65 mpg for 20 to 22 foot vans with diesel engines and 6 mpg for diesel tractors
Also included is fuel consumption by refrigeration units Estimated fuel consumption per mile for refrigeration units is Model Fuel consumption per mHe (gallons) TNT-20 0 (runs off fan belt) XMTmiddot50 025 XKWmiddot20 042 TWDmiddot50 021 XROL-50 028 Super NWD-50 017
hBased on six tires for 10 to 14foot vans 10tires for 16 to 22 foot vans (these have tandem rear axles) 14tires on the single axle 30 foot trailer-tractor unit and 18 tires on other trailermiddottractor units with an average mileage per tire of 45000 for tires used on vans and 150000 for tires used on tractors or trailers Tire prices were furnished by Brad Ragen Tires Incorporated of St Paul
16
OPERATING COSTS
Operating expenses for distribution vehicles inshyclude those fixed on an annual basis (interest insurshyance license fees and highway use taxes) and those varying with mileage driven (depreciation repairs and maintenance fuel and tires) Tables 16 and 17 show fixed and variable operating expenses for 14 distribushytion vehicles
License costs shown are for vehicles up to 5 years old For older vehicles license costs are approximately 60 percent of the amounts shown
Insurance coverage includes liability property damage personal injury protection and comprehenshysive Insurance costs shown are for vehicles 2 to 3 years old Insurance on older vehicles is somewhat less costly Note that insurance costs are substantially higher in the metropolitan area than in nonmetropolitan areas
Depreciation was calculated on a straight-line basis over the expected lifetime for each vehicle Expected lifetime mileage estimates reported by dairy transportashytion managers reflect mileage expected under normal operating conditions Depreciation cost per mile varies from 10 cents for a 10-foot van to 27 cents for a 22-foot van with a diesel engine For tractor-trailer combinashytions depreciation per mile varies from 11 cents for a 30shyfoot unit to 15 cents for a 42-foot unit
Repair and maintenance cost per mile was based on the rate schedule of a local firm that offers contracted repair service to dairies Repair and maintenance costs are substantially lower for diesel vans than for comparashyble gasoline vans
Fuel costs were based on mileage estimates proshyvided by local dairy transportation managers and on reshyfrigeration unit fuel requirements indicated by refrigera-
Total annual cost (in thousands of dollars)
185 180 175 170 165 160 155 150 145 140 135 130
tion equipment manufacturers Fuel prices for regular gasoline ranged from 549 to 689 cents per gallon at the time of the study Diesel fuel priCes showed similar varishyability but averaged approximately 3 cents per gallon less than regular gasoline For our fuel cost estimates we used prices of 63 cents for regular gasoline and 60 cents for diesel fuel
Tire costs per mile were based on tire prices and exshypected lifetime mileage estimates provided by a local tire distributor
Comparison of Costs for Diesel- and Gas-Operated Vans
Because of higher purchase price fixed costs and depreciation are higher for diesel vans than for comshyparably sized gasoline-operated vans However diesel units use less fuel per mile and less expensive fuel Also repair and maintenance costs are lower for diesel units Consequently total variable costs for diesel unit~ are lower than for gas units Total annual costs for 20-foot diesel and gasoline operated units are shown in relation to annual mileage in figure 5 This graph shows that when annual mileage exceeds approximately 25000 miles the diesel unit has lower total costs For annual mileage less than 25000 miles the gasoline unit is less costly to operate
Predicting Equations for Vehicle Costs Using the cost data in tables 16 and 17 and the payshy
load data III tables 14 and 15 we developed equations to predict vehicle cost per gallon of milk distributed The
L Total I annual
20000 22000 24000 26000 28000 30000 mHeage
Figure 5 Comparison of total annual operating costs for 20-foot gasoline- and diesel-operated vans
17
Table 18 Predicting equations for vehicle cost per gallon of milk distributed
Equation form AVe = ex + amp(IQ) + i32(RL) Estimated coefficient(standard error)
Equation number and type of route C amp amp2 R2 Restrictions
1 Metropolitan wholesale -01165 2261 or retail (00301 ) (176)
2 Nonmetropolitan wholesale -01216 2193 or retail (00302) (176)
3 Over-the-road -01265 7156 (00335) (981)
AII coefficients are significant atthe 99 percent confidence level
factors determining vehicle cost per gallon are the quanshytity of milk distributed and the length of the distribution route For each type of route predicting equations for unit vehicle costs took the form1z
Ave = a + B1 (1Q)+ Bz(RL) where
Ave = vehicle cost in dollars per gallon of milk deshylivered
Q = quantity delivered in gallons and RL = route length in miles
The range of quantities and route lengths used in estimashytion were those reported for each type of route by fluid milk firm transportation managers The equation should yield positive coefficients on lQ and RL reflecting lower vehicle expense on large-volume routes but higher vehicle expense on long-distance routes
To estimate equations for unit vehicle costs fixed annual costs were allocated for 260 route days for wholesale and retail routes and 160 route days for overshythe-road routes Table 18 shows the estimated equashytions The column labeled restrictions shows the range of quantities and route lengths over which the equations are expected to be valid Wholesale route veshyhicle costs are predicted to fall from $0925 to $0228 per gallon as quantity delivered increases from 300 to 4000 gallons on metropolitan routes 80 miles long (equation 1) For an over-the-road route carrying 4300 gallons costs rise from $01499 to $04799 per gallon as round trip mileage increases from 100 to 400 miles (equation 3)
Labor Expenses The direct labor associated primarily with milk disshy
tribution includes route drivers route supervisors and loading and unloading dock workers Labor costs inshyclude employees base salaries commissions on sales health and life insurance contributions to pension funds unemployment insurance social security and uniforms Table 19 shows annual costs for route drivers Note that route drivers are generally paid by the hour while over-the-road drivers are paid by the mile In addishy
I2This form was selected because it yields results that are (1) consistent with prior expectations and (2) statistically satisfactory
00036 (00003) 91
Valid for quantishyties 50-4000 galshylons and route
00036 91 lengths 30-200 (00003) miles
Valid for quanti shy
00011 (00001 )
96 ) ties 2000-4300 gallons and route length from 50-500 miles
tion to base wages route drivers are paid sales commisshysions Horne delivery drivers usually are paid a straight commission but dairy managers report that annual salashyries for horne delivery drivers tend to be nearly equal to those of wholesale route drivers
Wages benefits and payroll taxes for route drivers account for 80 to 85 percent of total distribution labor costs The remaining distribution labor costs include salaries benefits and payroll taxes for route supervisors and supplementary dock workers
To estimate unit labor costs for retail and wholesale milk distribution it first was necessary to estimate the relationships between labor time per gallon delivered and the quantity delivered route length and number of stops per route Labor cost per minute then was estima~ ted and the coefficients on the labor-time-per-gallon equations were multiplied by the cost-per-minute facshytors for labor employed in retail and wholesale delivery Data on labor time quantity route length and number of stops were obtained in a survey of milk distribution practices for 118 retail and wholesale routes Table 20 summarizes characteristics of these routes The relationshyships between labor time quantity route length and number of stops (standard errors are in parentheses) are 13
wholesale ALT =
3859 + 52877[I1Q] + 0022[RL] + 0121[S] (0425) (1793) (0004) (0009)
retail ALT = 1171 + 16510[I1Q] + 0094[RL] (245) (1341) (0030)
where ALT = labor time in minutes per gallon delivered Q = quantity delivered in gallons RL = route length in miles and S = the number of stops on the route
Labor cost per minute was estimated under the asshysumption that home delivery drivers work an average of 50 hours per week while wholesale route drivers work 42 hours per week Drivers were assumed to work an
The coefficient on S in the retail labor time equation was insignificant The equations have R2 values of 96 and 92 respectively
18
Table 19 Labor costfor milk distribution drivers 1978 Metropolitan area Nonmetro area
route drivers route drivers Over-the-road drivers
Payratea $833hr $1200hr $535hr $780hr 1625 centsmile plus $580 for overtime for overtime for loading and unloading
Annual base salaryb $1732640 for $1112800 for $1160250 for 25000 miles 40-hr week 40-hr week $1566500 for 50000 miles
$1972700 for 75000 miles $2044640 for $1315600 for 45-hr week 45-hr week
Benefits and payroll taxesC $431567 $311510 $283984
Annual direct plus indirect drivers cost d $2289007 $1505440 $1850484
New wage rates were negotiated in 1978 Hourly pay rates for route drivers include commissions as specified by local fluid milk firm managers bAnnual base salaries for over-the-road drivers include 25 hours per week load and unload pay clncludes pension contributions health and life insurance federal and state unemployment insurance (06 percent on first $4200 for federal and 29 percent
on first $7000 for state unemployment insurance) workmens compensation (423 percent of base salary) FICA (585 percent of first $16500) and uniforms For over-the-road drivers an allowance for meals is also included
d8ased on an average workweek of 42 hours for route drivers and 50000 annual miles for over-the-road drivers
average of 50 weeks per year These assumptions were verified by local plant managers
Route length rather than labor time is the determinshying factor in labor cost on over-the-road routes Dairy transportation managers say that nearly all over-theshyroad routes are comprised of fully loaded (1000-1100 cases or 4300 gallons) semi-trailers Because quantity is virtually constant on over-the-road routes labor cost on this type of route can be expressed solely as a function of the route length
Table 20 Characteristics of 118 fluid milk distribution routes in Minnesota
Numberof Type of route observations Low High Average
Home delivery 18 Quantity (gallons) 50 340 2232 Route length (miles) 25 100 617
Number of stops 40 230 1519 Labor time (hours) 4 12 97
Wholesale 100 Quantity (gallons) 250 4000 18310 Route length (miles) 20 200 814 Number of stops 2 40 200 Labor time (hours) 55 135 88
Based on the annual salaries presented in table 19 labor cost was $1526 per minute on home delivery routes $1817 per minute on metropolitan area wholeshysale routes and $1195 per minute on nonmetropolitan routes The cost per mile for over-the-road drivers was $3701 Expense records of existing plants indicate that 20 percent of driver labor cost must be added to cover the expense for route supervisors and supplemental dock workers Therefore the total distribution labor cost per minute was $1831 for home delivery routes $2180
for metropolitan wholesale routes and $1434 for nonshymetropolitan wholesale routes Total distribution labor cost per mile on over-the-road routes was $4441
Table 21 shows the equations derived by multiplyshying the coefficients of the labor time equations by the appropriate cost-per-minute figures for retail and whblesale routes Also shown is the relationship beshytween route length and cost per gallon delivered on over-the-road routes On a typical home delivery route carrying 223 gallons to 152 stops in 62 miles labor cost is predicted to be $4553 per gallon (equation 4) On a typical metropolitan area wholesale route carrying 1800 gallons to 20 stops in 80 miles distribution labor expense is predicted to be $0711 per gallon (equation 5) The same route located in the nonmetropolitan area would have labor costs of only $0472 per gallon (equashytion 6) This reflects the difference in wages between metropolitan and nonmetropolitan areas Distribution labor costs on over-the-road routes increase from $0206 to $0412 per gallon as round trip mileage increases from 200 to 400 miles (equation 7)
Selling Expenses We include selling expenses in distribution costs
Selling expenses are salaries and benefits for marketing staff accountants bookkeepers and clerical workers rent and depreciation on office machinery and equipshyment data processing costs telephone and telegraph costs postage costs costs of office supplies used for billshying and record keeping and advertising expenses From information proVided by several Minnesota dairies it was determined that selling expenses amountto approxshyimately $0370 per gallon14 Table 22 shows a breakshydown of selling expenses by major components
14Unfortunately available data were not sufficient to investigate whether this important component of costs exhibits economies of scale
19
Table 21 Predicting equations for labor cost per gallon of milk distributed by type of route
Equation form ALC = amp + amp(IIQ) + amp2(RL) + amp3(5) Estimated coefficient
Equation number and type of route ( amp amp2
4 Metropolitan home delivery 2144 3023 0017
5 Metropolitan wholesale -0841 11529 00048
6 Nonmetropolitan wholesale -0553 7583 00032
7 Over-the-road 0 0 000103
Table 22 Selling costs of fluid milk processors Minnesota 1977
Cost Cost as percentage of Expense per gallon total selling cost
Advertising $00162 438 Payroll salaries 00120 324 Payroll benefits 00025 68 Telephone telegraph
and postage 00015 41 Bad debts 00022 59 General supplies 00026 70
Total $00370 1000
Includes pension payroll taxes health and welfare insurance and other fringe benefits
Distribution Facility Expense Several large Minnesota milk firms distribute a subshy
stantial portion of their products through distribution facilities located in out-state regions The milk is hauled over the road to the distribution facility and delivered from there on ordinary wholesale routes In some cases the distribution facility is owned and operated by the parent bottling company in others the facility is indeshypendently owned and operated by a jobber Ordinarily the distribution facility is a former bottling plant
The costs of operating such a facility will depend on many factors including the size and location of the facilshyity To estimate distribution facility costs we have conshyducted an economic-engineering analysis similar to that used in determining in-plant costs for model fluid milk processing facilities The model distribution facility was based on recommendations found in the USDA publication A Dairy Products Distribution Facility Layshyout and Operating Methods15 The facility has a storage capacity of 12000 gallons and is designed to handle 60000 gallons of fluid milk per week
Table 23 shows capital costs for the land buildings and equipment required by the distribution facility Toshytal investment amounted to $352470
Operating costs for the facility include interest depreshyciation maintenance utilities taxes insurance and lashybor Table 24 shows total annual costs and costs per galshylon for this facility Interest was computed at 10 percent
amp3 Restrictions
Valid for quantities from 50 to 350 gallons 0 route lengths from 25 to 100 miles and
number of stops from 40 to 230
Valid for quantities from 400 to 3500 gallons002641 route length from 50 to 500 miles and
00174 number of stops from 5 to 40
Valid for fully-loaded semis and for all0 route lengths from 50 to 500 miles
of the average value of buildings and equipment over their expected lifetimes Depreciation was calculated on a straight-line basis over 33 years for the bUilding and 25 years for equipment Maintenance cost was calculated at 05 percent of initial building and equipment cost
Table 23 Land buildings and equipment investment for a satellite fluid milk distribution facility
Item Description Cost
Land 2 acres $27000
Building Cooler 1800 square feet Refrigeration equipment 200 square feet Boiler room 200 square feet Truck maintenance 1750 square feet Offices and drivers room 1 320 sq u a re feet Lavatories and locker
rooms 400 square feet Corridor and stairways 120 square feet Receiving and load-out 1 800 s9 u a re feet
Total 7590 square feet 250470
Equipment Refrigeration and mechanical 75000
Calculated at $13500 per acre for developed industrial land and $33 per square foot of building space
Table 24 Operating expenses for a 60OOO-gallons-pershyweek satellite fluid milk distribution facility
Item Annual cost Cost per gallon
Interest $16273 $0052 Depreciation 10590 0034 Maintenance 1627 0005 Utilities 10518 0034 Taxes 5891 0019 Insurance 1645 0005 Production labor 36400 0117 Administrative labor 3021 0010
Total $85965 $0276
Agricultural Research Service A Dairy Products Distribution Facility Layout and Operating Methods Marketing Research Report No 990 US Deshypartment of Agriculture Washington DCbull April 1974
20
In computing taxes for the facility a mill rate of 90 was applied to 43 percent of the average value of the buildings and land This mill rate is appropriate for land and buildings located in out-state regions
Insurance for the facility based on premiums sugshygested by a local insurance agency amounted to $1645 per year
The cost of utilities including water sewage elecshytricity and fuel was estimated to be $10518 per year
Two laborers are needed for receiving products arshyranging products in route loads placing stacks on conshyveyors maintaining equipment and cleaning Costs of these laborers including salaries benefits and payroll taxes amount to $36400 per year This figure is based on a wage of $700 per hour a 40-hour work week and 25 percent additional for benefits and payroll taxes
Commonly a satellite facility employs an adminisshytrator and clerical workers Their responsibilities inshyclude directing the activities of laborers maintaining records billing securing accounts route supervision and selling These activities supplant some work which would otherwise be performed by administrators and clerical workers engaged in these activities at the proshycessing plant To avoid double counting of these costs we calculated satellite facility administrative costs at 83 percent of production labor expense This represents the increment in administrative costs necessitated by the satellite facility
Total cost of operating the 60000-gallons-per-week distribution facility was $85965 per year or $0276 per gallon of milk handled
Total Fluid Milk Distribution Costs By building on the above analysis equations were
developed for predicting total distribution costs for varishy0us types of routes Total distribution costs include veshyhicle expense labor expense and selling expense In adshydition for milk delivered to a satellite distribution facilshyity the cost of operating the facility must be included
An equation for estimating total distribution costs on metropolitan area wholesale routes was constructed by adding the appropriate coefficients for vehicle cost (equation 1 table 18) labor cost (equation 5 table 21)
and the selling expense (table 22) Similar equations can be constructed for other types of routes Table 25 shows equations for total distribution cost per gallon Equashytions 8 9 and 10 can be used to estimate unit distribushytion costs for retail and wholesale routes from the bottlshying plant To calculate costs of distributing through a satellite distribution facility costs from the processing plant to the satellite facility must be calculated using equation 11 and added to wholesale route distribution costs from the satellite facility computed from equation 12 Operating costs for the satellite distribution facility are included in equation 11
Costs on typical wholesale distribution routes carryshying 1800 gallons to 20 stops in 80 miles are predicted to be $1379 in the metropolitan area Metropolitan area wholesale milk distribution costs are extremely sensishytive to volume falling from $3031 to $0867 when volshyume increases from 400 to 3500 gallons (equation 9) Figure 6 shows the dramatic impacts of route location and quantity delivered on wholesale routes Costs deshycline rapidly as volume increases to 1200 gallons and continue to decline gradually thereafter
On a typical home delivery route carrying 223 galshylons to 152 stops in 62 miles unit distribution costs are $5674 (equation 8) Low volume is responsible for the relatively high distribution costs incurred in home delivery
On most types of distribution routes unit costs inshycrease with the number of customer stops and the length of the route Figure 7 shows the effect of number of stops on unit distribution costs Costs per gallon rise by $0264 for each additional 10 customer stops on metropolitan wholesale routes
Figure 8 shows the effects of route length on unit distribution costs On metropolitan area wholesale routes distribution costs rise by $0084 per gallon for each additional 10 miles of route length
On fully loaded over-the-road routes to a satellite distribution facility distribution costs rise from $0529 to $1381 per gallon as round-trip mileage increases from 100 to 500 miles This includes $0276 per gallon operating expense for the distribution facility Figure 9 shows the impact of route length on costs of distribution to satellite distribution facilities
Table 25 Predicting equations for fluid milk distribution costs by type of route
Equation form cost per gallon = ~ + B(1Q) + amp2(RL) + B3(S)
Equation number and type of route
8 Metropolitan area home deliverymiddot
9 Metropolitan area wholesale
10 Nonmetropolitan wholesale
Via satellite distribution facility
11 Costs of distribution from processing plant to satellite facility plus satellite costsb
12 Wholesale routes from satellite facility
Includes labor vehicle and selling expenses
amp
20275
-05875
-03046
Estimated coefficient Is ~2
5284
13790
9776
00206
00084
00068
00264
00174
01500 7156 000213
-03046 9776 00068 00174
blncludes labor vehicle and satellite distribution facility operating expenses
21
Cost (cents per gallon)
40
35
30
25
Metropolitan area 20
15
10 Nonmetropolitan-------=============
5 area
________________________________________ Quantity (gallons)400 800 1200 1600 2000 2400 2800 3200 3600 4000
Figure 6 Fluid milk distribution costs on metropolitan and non metropolitan wholesale routes (based on route length of 80 miles and 20 stops per route)
Cost (cents per gallon)
45 shy
40
35
30 shy
25 shy
30 stops per route 20 shy
15 shy
10 shy
10 stops per route 5-
________________________________________ Quantity
400 800 1200 1600 2000 2400 2800 3200 3600 4000 (gallons)
Figure 7 Effect of number of stops on metropolitan area wholesale milk distribution costs (based on route length of 80 miles)
22
--- ---------- -- - - - - - - ---- ---------- ----
Cost (cents per gallon)
45
40
35
30
25 Route length 120 miles
20
15
10
Route length 40 miles7 ----------------shy5
________________________________________ Quantity (gallons)400 800 1200 1600 2000 2400 2800 3200 3600 4000
Figure 8 Effect of route length on metropolitan area wholesale milk distribution costs (based on 20 stops per route)
Cost (cents per gallon)
13 shy
12 shy
11 shy
10 shy
9shy
8shy
7shy
6shyTransportation cost 5shy
4shy
3shy
2shy
JDistribution facility operating cost
- Round ----------------------------------------- trip
50 100 150 200 250 300 350 400 450 500 mileage
Figure 9 Costs of distributing milk on fully loaded over-the-road routes to a satellite distribution facility
23
Impact of Distribution Costs on Optimum Plant Size
On the most common types of wholesale milk distrishybution routes distribution costs predicted by the equashytions developed in this section will be between $1100 and $1700 per gallon delivered In contrast processing costs minus packaging materials expense were $0994 to $1619 per gallon according to the estimates presented earlier Distribution costs are an important determinant of the total costs incurred by milk processors For many milk processing firms distribution costs exceed the costs of processing milk This is true for firms distributshying a substantial portion of their product on low-volume routes eg home delivery or to widely dispersed retail stores such as those in rural areas For larger plants disshytributing a substantial portion of milk through distribushytion facilities distribution costs are likely to exceed proshycessing costs
Processing costs decline rapidly when plant scale increases up to 100000 to 200000 gallons per week and may continue to decline when output increases beyond 200000 gallons per week However savings to processhysors gained through the realization of economies of size will be offset if the added volume is delivered over a wider geographic area to new customers For example unit processing costs will fall from $2145 to $2025 when volume processed increases from 200000 to 400000 gallons per week But this $0120 reduction in unit processing costs could easily be eliminated by an increase maverage route length of 15 miles This route length increase would cause unit distribution costs to rise by $0126 (on metropolitan area wholesale routes) more than offsetting the savings from economies of size in processing The fact that increased volume generally must be distributed over wider geographic areas serves as a deterrent to increased plant size In markets where outlets are widely dispersed the- least-cost structure of the processing sector is likely to be a combination of geoshygraphically dispersed intermediate-sized plants rather than a single large processor Consequently the presshysure for increased plant size is less than would be indishycated by an analysis based solely on in-plant costs
Summary
The fluid milk processing industry in Minnesota has evolved since 1956 from 289 to 30 processing plants Major factors in this change are economies of size for plants that process and distribute large volumes of milk A major objective of this study was to measure these economies
An economic-engineering approach was used to calculate processing costs for three sizes of milk plants These estimates show that economies of size are signifishycant as plant size is expanded to 200000 gallons per week but when output grows beyond 200000 gallons per week these economies level off Costs decline from 267 to 215 cents per gallon as volume is increased from 50000 to 200000 gallons per week Expanding plant size to 400000 gallons reduces costs to 203 cents per gallon We conclude that economies of size beyond 200000 gallons per week are relatively minor
Distribution costs were estimated for alternative truck sizes lengths of routes and number of stops These costs included vehicle labor and selling expenses and for milk distributed through a satellite distribution facility operating expenses for the facility Equations were constructed for predicting unit costs on individual routes Unit costs decreased when volume delivered increased but costs rose when either the numshyber of stops or the length of the distribution route inshycreased Table 26 shows unit costs for various routes Distribution costs for the entire operation depend on the combination of truck sizes and on whether satellite disshytribution facilities are used For many fluid milk firms it appears that distribution costs will equal or exceed proshycessing costs
Table 26 Summary of distribution costs by type of route
Route Distribution
Type of route Gallons
delivered length (miles)
Number of stops
cost per gallon
Home delivery 200 50 150 $5680 300 100 150 5848 300 50 150 4819
Metropolitan wholesale 1200 80 20 1762
1200 120 20 2098 2000 80 20 1302 2000 120 20 1638
To distribution facility 4300 150 0635
4300 300 0955
From distribution facility 1200 80 20 1402
Nonmetropolitan wholesale 1200 120 20 1674
2000 80 20 1076 2000 120 20 1348
Enlarging the distribution areas without increased volume per stop will increase distribution costs If added production must be distributed over a wider geoshygraphic area average route length will increase causing an increase in unit distribution costs Thus economies of size in fluid milk processing are offset by diseconoshymies of size in distribution For this reason there may be less pressure for additional consolidation of processing operations in Minnesota than in other regions of the United States where dense population exists over wide geographic areas
24
Table A-1 Itemized equipment requirements for Plant I
Item Cost Item Cost
100 GPM receiving pump $ 1650 75 cpm 12 pt-qt filler $ 85000 2 tank CIP unita (2) 26000 Handle applicator 7500 CIP transport tank washer 2400 4min 5-gal filler 3350 COP portable tank (2) 3000 Carton conveyors (120) 14400 5000 gal raw storage tank b(2) 30000 Automatic casers (3) 39000 2000 gal raw storage tankb 11000 Case stackers (3) 30000 2000 gal cream storageb 11000 Case inserters (3) 6000 4000 gal cold wall surge 13000 20 per min case washer 7000 2000 gal cold wall surge 10000 20 per min case unstacker 10000 1000 gal cold wall surge 8500 Case conveyors and drives (400) 60000 1500 gal pasteurizing vat 16500 Conveyor hydraulic unit 4500 1000 gal pasteurizing vat 13500 Process control panel 1045 Storage tank mounts (7) 3500 Receiving control panel 2600 Hot water set for HTST 5900 Sanitary lines and valves 15000 Transfer pumps (2) 900 Boilers - 75 bhp (2) 32000 Clarifierseparator 39500 Ammonia receiver compressor 13410 60 gal balance tank 1100 Condensor pumps piping 15340 Plate heat exchanger 85 regen 17500 Ice builder 16100 Timing pump 4600 Cooling units - cold room 8040 Flow diversion valve 1300 Cooling units - tanks 3355 Holding tube 2323 Controls 3400 Vacuumizer 9200 Mechanical cbullbullbullbullbullbullbullbullbullbullbullbullbullbullbullbull 38500 Tailer sensor and controls 2917 Installation dbullbullbullbullbullbullbullbullbullbullbullbullbullbullbullbullbullbullbullbullbullbullbullbullbull 162810 15000 hr homogenizer 21250 Miscellaneous 9800 30 cpm gal filler 90000 33 cpm gal 12 gal filler 75000 Total equipment cost $1009690
Includes pumps valves and control panels blncludes liquid scale gauges clncludes air compressors refrigerators electrical cost for running power to motors and mechanical cost for utility hookup of machines dCalculated at 20 percent of cost of storage and surge tanks 40 percent of cost of processing and CIP equipment and 30 percent of cost of mechanical
refrigeration and case handling equipment Filling equipment prices include installation
Table A-2 Itemized equipment requirements for Plant II
Item Cost Item Cost
200 GPM receiving pump $ 1700 75 CPM 112 gal filler $ 99000 2 tank CIP unita 13000 160 CPM 12 pt-qt filler 229000 3 tank CIP unit 17500 4min 5-~al filler 3350 COP portable tank (2) 3000 Handle applicator 9000 CIP transport tank washer 2400 Carton combiner 4000 20000 gal cold wall silo (2)b 46200 Carton conveyor (200) 24000 5000 gal raw storageb(2) 30000 Automatic casers (3) 47000 5000 gal cream storageb 15000 Case stackers (3) 30000 10000 gal cold wall surge silo 17500 Case inverters (3) 6000 5000 gal cold wall surge 14000 40min case washer 15000 2000 gal cold wall surge 10000 40min case unstacker 12000 2500 gal pasteurizing vat 21000 Case conveyors and drivers (700) 105000 2000 gal pasteurizing vat 19000 Conveyor hydraulic unit 8000 Storage tank mounts (7) 3500 Process control panel 1045 Silo mounts (3) 9000 Receiving control panel 2800 HTSTfeed pump 450 Sanitary lines and valves 25000 Hot water set for HTST 5900 Boilers 200 bhp (2) 44000 Transfer pumps (2) 1100 Ammonia receiver compressors 30155
Clarifierseparator 118500 Condensor pumps piping 24535 60 gal balance tank 1100 Ice builder 26200 Flow diversion valve 1900 Cooling units 24400 Plate heat exchanger 85 regen 35000 Controls 4200 Holding tube 3803 Mechanical c bullbullbullbullbullbullbullbullbullbullbullbullbullbullbullbullbullbullbullbullbullbullbull 179200 Homogenizer 38450 Installationd bullbullbullbullbullbullbullbullbullbullbullbullbullbullbullbullbullbullbullbullbullbullbullbullbullbullbullbull 315900
25
Table A-2 Itemized equipment requirements for Plant (continued)
Item Cost Item Cost
Vacuumizer Tailer controls and sensors
16000 2917
Miscellaneous 12800
60 CPM galion filler 175000 Total equipment cost $1904505
alncludes pumps valves and control panels blncludes liquid scale gauges clncludes air compressors refrigerators electrical cost for running power to motors and mechanical cost for utility hookup of machines dCalculated at 20 percent of cost of storage and surge tanks 40 percent of cost of processing and CIP equipment and 30 percent of cost of mechanical
refrigeration and case handling equipment Filling equipment prices include installation
Table A-3 Itemized equipment requirements for Plant III
Item Cost Item Cost
Positive displacement receiving pump $ 6445 125 CPM 12 gal filler $ 215000 2 tank CIP unitmiddot 13000 160 CPM 12 pt-qt filler (2) 458000 CIP transport tank washer (2) 4800 Handle applicators (2) 18000 3 tank CIP unitsmiddot (2) 35000 4min 5 gal filler (2) 6700 COP portable wash tank 1500 Carton combiners (2) 8000 30000 gal cold wall silob bullbullbullbullbullbullbullbullbullbullbull 60200 Carton conveyors (350) 42000 20000 gal cold wall silob bullbullbullbullbullbullbullbullbullbullbullbullbullbullbull 23100 Automatic casers (5) 80000 10000 gal cold wall silo b bullbullbullbullbullbullbullbullbullbullbullbull 18600 Case stackers (5) 50000 10000 gal cold wall cream silob bullbullbull bullbullbullbullbullbullbullbull 18600 Case inverters (5) 10000 15000 gal cold wall surge silo (2) 40000 40min case washers (2) 30000 10000 gal cold wall surge silo 17500 40lmin case unstackers (2) 24000 5000 gal surge (2) 28000 Case conveyor and drivers (1000) 150000 Storage tank and silo mounts 25000 Conveyor hydraulic unit 24000 HTSTfeed pumps (2) 900 Process control panel 3000 Hot water sets for HTST (2) 11800 Receiving control panel 2800 Transfer pumps (3) 1950 Sanitary lines and valves 45000 Clarifierseparator (2) 237000 Boilers 300 bhp (2) 56000 60 gal balance tanks (2) 2200 Ammonia receiver compressors 42305 Flow diversion valves (2) 3800 Condensor pumps piping 33430 Holding tubes (2) 11454 Ice builder 30300 Plate heat exchangers 85 regen (2) 70000 Cooling units 36655 Homogenizers (2) 76900 Controls 4700 Vacuumizers (2) 32000 Mechanical c bullbullbullbullbullbull 260000 Tailer controls and sensors (2) 5831 Installation dbullbullbullbullbullbullbullbullbullbullbullbullbullbullbullbullbullbullbullbullbullbullbullbullbullbullbullbull 464940 Tri-blender 5000 Miscellaneous 15700 60 CPM gal filler (2) 350000
Total equipment cost $3211110
Includes pumps valves and control panels blncludes liquid scale gauges clncludes air compressors refrigerators electrical cost for running power to motors and mechanical cost for utility hookup of machines dCalculated at 20 percent of cost of storage and surge tanks 40 percent of cost of processing and CIP equipment and 30 percent of cost of mechanical
refrigeration and case handling equipment Filling equipment prices include installation
26
Bibliography
PUBLICATIONS
Articles of Agreement between Minneapolis and st Paul Milk Dealers and Milk Drivers and Dairy Emshyployees Union Local 471 May 1 1975-April 30 1978
Bartlett Roland et al Outer Market Distribution of Milk in Paper Containers in the North Central Region North Central Regional Publication No 39 Purdue University Agricultural Experiment Station Lafayshyette Indiana October 1953
Federal Trade Cmnmission Economic Report on the Dairy Industry US Government Printing Office Washington DC March 19 1973
Knutson RD Price and Trade Practice Regulation in the Minnesota Dairy Industry unpublished PhD thesis University of Minnesota 1967
Midwest Research Institute Resource and Environmenshytal Profile Analysis of Five Milk Container Systems with Selected Health and Economic Considershyations Final Draft Report MRI Project No 4003-D June 18 1976
USDA Agricultural Marketing Service Transportation and Facilities Research Division Layouts and Operating Criteria for Automation of Dairy Plants Processing Milk Half-and-Half Cream Chocolate Drink and Buttermilk Marketing Research Report No 591 US Government Printing Office Washingshyton DC September 1963
---------------------------------------Packaged Fluid Milk Sales in Federal Milk Order Markets by Size and Type of Containers and Distrishybution Method during November 1975 AMS-553 July 1977
___ Agricultural Research Service A Dairy Products Distribution Facility Layouts and Operating Methods Marketing Research Report No 990 Washington DC April 1974
US Department of Health Education and Welfare Pubshylic Health Service Food and Drug Administration Milk Pasteurization Controls and Tests Cincinnati Training Facility Course Manual 1977
US Department of the Treasury Internal Revenue Sershyvice Federal Highway Use Tax on Trucks TruckshyTractors and Buses Publication 349 (revised)
Williams Sheldon W et aI Organization and Comshypetition in the Midwest Dairy Industries Iowa State University Press Ames Iowa 1970
INDUSTRY CONTACTS
Ammonia House Inc 712 W 77-12 St Minneapolis Minnesota
B-Bar-B Inc Bag-N-Box Packaging Systems 10th and McBeth St New Albany Indiana
Bill Boyer Ford 2811 NE Broadway Minneapolis Minshynesota
Blackhawk Molding Co 109 Commercial Road Addishyson Illinois
Blesi Evans Co 2533 24th Ave South Minneapolis Minnesota
Clover Leaf Creamery Co 420 W Broadway Minneapshyolis Minnesota
Continental Equipment Corp 6103 N 76th St Milwaushykee Wisconsin
Dairy Craft Inc 600 N 54th Ave St Cloud Minnesota DeLaval Separator Co 2950 Metro Drive St Paul Minshy
nesota Drew Agency Inc Griggs Midway Building St Paul
Minnesota Edmeyer Inc 750 S Plaza Drive st Paul Minnesota Environmental Process Inc 1220 Glenwood Ave Minshy
neapolis Minnesota Ex-Cell-O Corp Packaging Systems Group 10212
Xerxes Avenue South Bloomington Minnesota Fogg Filler Co 37 Van Dyke Ave Holland Missouri Freuhauf Corp 1717 W County Road C St Paul Minshy
nesota Graham Poly trip Co 1420 6th Ave York Pennsylvashy
nia Hercules Inc 2285 University Ave St Paul Minneshy
sota International Harvester Co 3000 NE Broadway Minneshy
apolis Minnesota International Paper Co 6100 Olsen Memorial Highway
Minneapolis Minnesota Land OLakes Inc 415 Grove St St Paul Minnesota Meyer Brothers Dairy 105 E Lake St Wayzata Minneshy
sota Pitcher Pak Corp 67 Cummings Park WobuJm Massashy
chusetts Smith-Lee Co 537 Fitch St Oneida New York Sturm Sales Inc 355 21st St Newport Minnesota Superior Dairy Fresh Co 2112 NE Broadway Minneapshy
olis Minnesota Tapemark Co 223 Marie Ave E S1 Paul Minnesota Thermo King Sales and Service Inc 2645 Fairway Ave
N St Paul Minnesota Winscott Glass Co Box I Clarion Pennsylvania
27
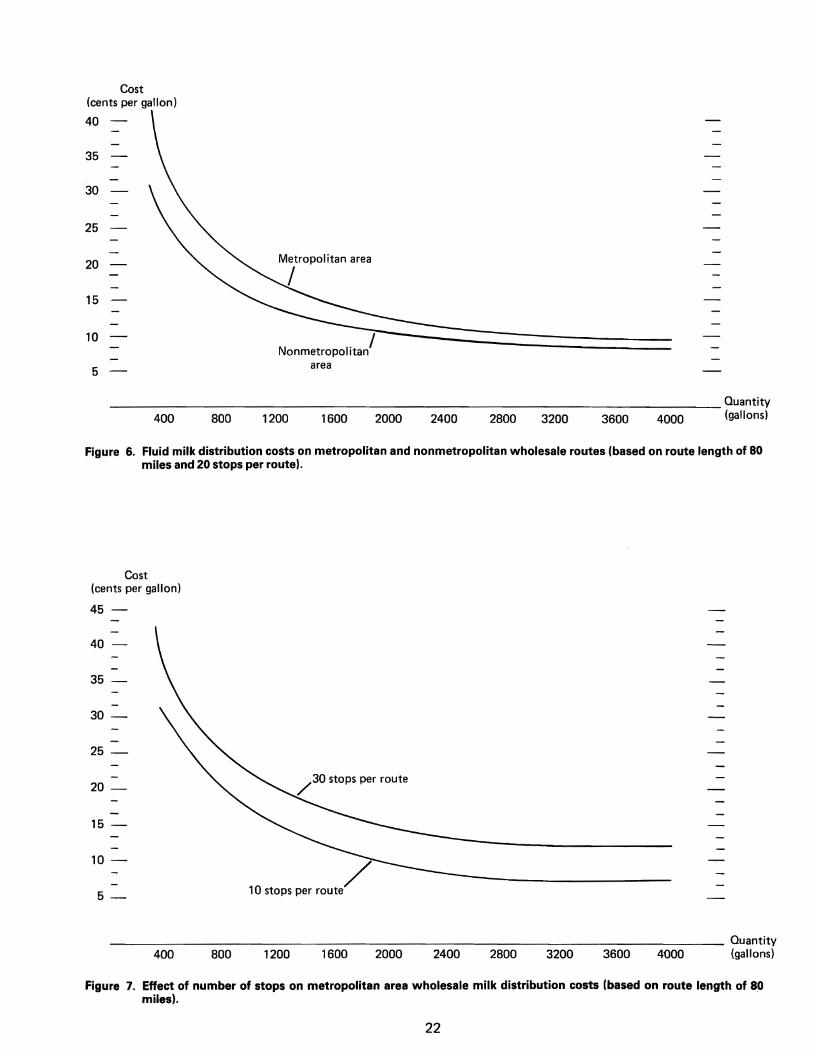
Cost (cents per gallon)
40
35
30
25
Metropolitan area 20
15
10 Nonmetropolitan-------=============
5 area
________________________________________ Quantity (gallons)400 800 1200 1600 2000 2400 2800 3200 3600 4000
Figure 6 Fluid milk distribution costs on metropolitan and non metropolitan wholesale routes (based on route length of 80 miles and 20 stops per route)
Cost (cents per gallon)
45 shy
40
35
30 shy
25 shy
30 stops per route 20 shy
15 shy
10 shy
10 stops per route 5-
________________________________________ Quantity
400 800 1200 1600 2000 2400 2800 3200 3600 4000 (gallons)
Figure 7 Effect of number of stops on metropolitan area wholesale milk distribution costs (based on route length of 80 miles)
22
--- ---------- -- - - - - - - ---- ---------- ----
Cost (cents per gallon)
45
40
35
30
25 Route length 120 miles
20
15
10
Route length 40 miles7 ----------------shy5
________________________________________ Quantity (gallons)400 800 1200 1600 2000 2400 2800 3200 3600 4000
Figure 8 Effect of route length on metropolitan area wholesale milk distribution costs (based on 20 stops per route)
Cost (cents per gallon)
13 shy
12 shy
11 shy
10 shy
9shy
8shy
7shy
6shyTransportation cost 5shy
4shy
3shy
2shy
JDistribution facility operating cost
- Round ----------------------------------------- trip
50 100 150 200 250 300 350 400 450 500 mileage
Figure 9 Costs of distributing milk on fully loaded over-the-road routes to a satellite distribution facility
23
Impact of Distribution Costs on Optimum Plant Size
On the most common types of wholesale milk distrishybution routes distribution costs predicted by the equashytions developed in this section will be between $1100 and $1700 per gallon delivered In contrast processing costs minus packaging materials expense were $0994 to $1619 per gallon according to the estimates presented earlier Distribution costs are an important determinant of the total costs incurred by milk processors For many milk processing firms distribution costs exceed the costs of processing milk This is true for firms distributshying a substantial portion of their product on low-volume routes eg home delivery or to widely dispersed retail stores such as those in rural areas For larger plants disshytributing a substantial portion of milk through distribushytion facilities distribution costs are likely to exceed proshycessing costs
Processing costs decline rapidly when plant scale increases up to 100000 to 200000 gallons per week and may continue to decline when output increases beyond 200000 gallons per week However savings to processhysors gained through the realization of economies of size will be offset if the added volume is delivered over a wider geographic area to new customers For example unit processing costs will fall from $2145 to $2025 when volume processed increases from 200000 to 400000 gallons per week But this $0120 reduction in unit processing costs could easily be eliminated by an increase maverage route length of 15 miles This route length increase would cause unit distribution costs to rise by $0126 (on metropolitan area wholesale routes) more than offsetting the savings from economies of size in processing The fact that increased volume generally must be distributed over wider geographic areas serves as a deterrent to increased plant size In markets where outlets are widely dispersed the- least-cost structure of the processing sector is likely to be a combination of geoshygraphically dispersed intermediate-sized plants rather than a single large processor Consequently the presshysure for increased plant size is less than would be indishycated by an analysis based solely on in-plant costs
Summary
The fluid milk processing industry in Minnesota has evolved since 1956 from 289 to 30 processing plants Major factors in this change are economies of size for plants that process and distribute large volumes of milk A major objective of this study was to measure these economies
An economic-engineering approach was used to calculate processing costs for three sizes of milk plants These estimates show that economies of size are signifishycant as plant size is expanded to 200000 gallons per week but when output grows beyond 200000 gallons per week these economies level off Costs decline from 267 to 215 cents per gallon as volume is increased from 50000 to 200000 gallons per week Expanding plant size to 400000 gallons reduces costs to 203 cents per gallon We conclude that economies of size beyond 200000 gallons per week are relatively minor
Distribution costs were estimated for alternative truck sizes lengths of routes and number of stops These costs included vehicle labor and selling expenses and for milk distributed through a satellite distribution facility operating expenses for the facility Equations were constructed for predicting unit costs on individual routes Unit costs decreased when volume delivered increased but costs rose when either the numshyber of stops or the length of the distribution route inshycreased Table 26 shows unit costs for various routes Distribution costs for the entire operation depend on the combination of truck sizes and on whether satellite disshytribution facilities are used For many fluid milk firms it appears that distribution costs will equal or exceed proshycessing costs
Table 26 Summary of distribution costs by type of route
Route Distribution
Type of route Gallons
delivered length (miles)
Number of stops
cost per gallon
Home delivery 200 50 150 $5680 300 100 150 5848 300 50 150 4819
Metropolitan wholesale 1200 80 20 1762
1200 120 20 2098 2000 80 20 1302 2000 120 20 1638
To distribution facility 4300 150 0635
4300 300 0955
From distribution facility 1200 80 20 1402
Nonmetropolitan wholesale 1200 120 20 1674
2000 80 20 1076 2000 120 20 1348
Enlarging the distribution areas without increased volume per stop will increase distribution costs If added production must be distributed over a wider geoshygraphic area average route length will increase causing an increase in unit distribution costs Thus economies of size in fluid milk processing are offset by diseconoshymies of size in distribution For this reason there may be less pressure for additional consolidation of processing operations in Minnesota than in other regions of the United States where dense population exists over wide geographic areas
24
Table A-1 Itemized equipment requirements for Plant I
Item Cost Item Cost
100 GPM receiving pump $ 1650 75 cpm 12 pt-qt filler $ 85000 2 tank CIP unita (2) 26000 Handle applicator 7500 CIP transport tank washer 2400 4min 5-gal filler 3350 COP portable tank (2) 3000 Carton conveyors (120) 14400 5000 gal raw storage tank b(2) 30000 Automatic casers (3) 39000 2000 gal raw storage tankb 11000 Case stackers (3) 30000 2000 gal cream storageb 11000 Case inserters (3) 6000 4000 gal cold wall surge 13000 20 per min case washer 7000 2000 gal cold wall surge 10000 20 per min case unstacker 10000 1000 gal cold wall surge 8500 Case conveyors and drives (400) 60000 1500 gal pasteurizing vat 16500 Conveyor hydraulic unit 4500 1000 gal pasteurizing vat 13500 Process control panel 1045 Storage tank mounts (7) 3500 Receiving control panel 2600 Hot water set for HTST 5900 Sanitary lines and valves 15000 Transfer pumps (2) 900 Boilers - 75 bhp (2) 32000 Clarifierseparator 39500 Ammonia receiver compressor 13410 60 gal balance tank 1100 Condensor pumps piping 15340 Plate heat exchanger 85 regen 17500 Ice builder 16100 Timing pump 4600 Cooling units - cold room 8040 Flow diversion valve 1300 Cooling units - tanks 3355 Holding tube 2323 Controls 3400 Vacuumizer 9200 Mechanical cbullbullbullbullbullbullbullbullbullbullbullbullbullbullbullbull 38500 Tailer sensor and controls 2917 Installation dbullbullbullbullbullbullbullbullbullbullbullbullbullbullbullbullbullbullbullbullbullbullbullbullbull 162810 15000 hr homogenizer 21250 Miscellaneous 9800 30 cpm gal filler 90000 33 cpm gal 12 gal filler 75000 Total equipment cost $1009690
Includes pumps valves and control panels blncludes liquid scale gauges clncludes air compressors refrigerators electrical cost for running power to motors and mechanical cost for utility hookup of machines dCalculated at 20 percent of cost of storage and surge tanks 40 percent of cost of processing and CIP equipment and 30 percent of cost of mechanical
refrigeration and case handling equipment Filling equipment prices include installation
Table A-2 Itemized equipment requirements for Plant II
Item Cost Item Cost
200 GPM receiving pump $ 1700 75 CPM 112 gal filler $ 99000 2 tank CIP unita 13000 160 CPM 12 pt-qt filler 229000 3 tank CIP unit 17500 4min 5-~al filler 3350 COP portable tank (2) 3000 Handle applicator 9000 CIP transport tank washer 2400 Carton combiner 4000 20000 gal cold wall silo (2)b 46200 Carton conveyor (200) 24000 5000 gal raw storageb(2) 30000 Automatic casers (3) 47000 5000 gal cream storageb 15000 Case stackers (3) 30000 10000 gal cold wall surge silo 17500 Case inverters (3) 6000 5000 gal cold wall surge 14000 40min case washer 15000 2000 gal cold wall surge 10000 40min case unstacker 12000 2500 gal pasteurizing vat 21000 Case conveyors and drivers (700) 105000 2000 gal pasteurizing vat 19000 Conveyor hydraulic unit 8000 Storage tank mounts (7) 3500 Process control panel 1045 Silo mounts (3) 9000 Receiving control panel 2800 HTSTfeed pump 450 Sanitary lines and valves 25000 Hot water set for HTST 5900 Boilers 200 bhp (2) 44000 Transfer pumps (2) 1100 Ammonia receiver compressors 30155
Clarifierseparator 118500 Condensor pumps piping 24535 60 gal balance tank 1100 Ice builder 26200 Flow diversion valve 1900 Cooling units 24400 Plate heat exchanger 85 regen 35000 Controls 4200 Holding tube 3803 Mechanical c bullbullbullbullbullbullbullbullbullbullbullbullbullbullbullbullbullbullbullbullbullbullbull 179200 Homogenizer 38450 Installationd bullbullbullbullbullbullbullbullbullbullbullbullbullbullbullbullbullbullbullbullbullbullbullbullbullbullbullbull 315900
25
Table A-2 Itemized equipment requirements for Plant (continued)
Item Cost Item Cost
Vacuumizer Tailer controls and sensors
16000 2917
Miscellaneous 12800
60 CPM galion filler 175000 Total equipment cost $1904505
alncludes pumps valves and control panels blncludes liquid scale gauges clncludes air compressors refrigerators electrical cost for running power to motors and mechanical cost for utility hookup of machines dCalculated at 20 percent of cost of storage and surge tanks 40 percent of cost of processing and CIP equipment and 30 percent of cost of mechanical
refrigeration and case handling equipment Filling equipment prices include installation
Table A-3 Itemized equipment requirements for Plant III
Item Cost Item Cost
Positive displacement receiving pump $ 6445 125 CPM 12 gal filler $ 215000 2 tank CIP unitmiddot 13000 160 CPM 12 pt-qt filler (2) 458000 CIP transport tank washer (2) 4800 Handle applicators (2) 18000 3 tank CIP unitsmiddot (2) 35000 4min 5 gal filler (2) 6700 COP portable wash tank 1500 Carton combiners (2) 8000 30000 gal cold wall silob bullbullbullbullbullbullbullbullbullbullbull 60200 Carton conveyors (350) 42000 20000 gal cold wall silob bullbullbullbullbullbullbullbullbullbullbullbullbullbullbull 23100 Automatic casers (5) 80000 10000 gal cold wall silo b bullbullbullbullbullbullbullbullbullbullbullbull 18600 Case stackers (5) 50000 10000 gal cold wall cream silob bullbullbull bullbullbullbullbullbullbullbull 18600 Case inverters (5) 10000 15000 gal cold wall surge silo (2) 40000 40min case washers (2) 30000 10000 gal cold wall surge silo 17500 40lmin case unstackers (2) 24000 5000 gal surge (2) 28000 Case conveyor and drivers (1000) 150000 Storage tank and silo mounts 25000 Conveyor hydraulic unit 24000 HTSTfeed pumps (2) 900 Process control panel 3000 Hot water sets for HTST (2) 11800 Receiving control panel 2800 Transfer pumps (3) 1950 Sanitary lines and valves 45000 Clarifierseparator (2) 237000 Boilers 300 bhp (2) 56000 60 gal balance tanks (2) 2200 Ammonia receiver compressors 42305 Flow diversion valves (2) 3800 Condensor pumps piping 33430 Holding tubes (2) 11454 Ice builder 30300 Plate heat exchangers 85 regen (2) 70000 Cooling units 36655 Homogenizers (2) 76900 Controls 4700 Vacuumizers (2) 32000 Mechanical c bullbullbullbullbullbull 260000 Tailer controls and sensors (2) 5831 Installation dbullbullbullbullbullbullbullbullbullbullbullbullbullbullbullbullbullbullbullbullbullbullbullbullbullbullbullbull 464940 Tri-blender 5000 Miscellaneous 15700 60 CPM gal filler (2) 350000
Total equipment cost $3211110
Includes pumps valves and control panels blncludes liquid scale gauges clncludes air compressors refrigerators electrical cost for running power to motors and mechanical cost for utility hookup of machines dCalculated at 20 percent of cost of storage and surge tanks 40 percent of cost of processing and CIP equipment and 30 percent of cost of mechanical
refrigeration and case handling equipment Filling equipment prices include installation
26
Bibliography
PUBLICATIONS
Articles of Agreement between Minneapolis and st Paul Milk Dealers and Milk Drivers and Dairy Emshyployees Union Local 471 May 1 1975-April 30 1978
Bartlett Roland et al Outer Market Distribution of Milk in Paper Containers in the North Central Region North Central Regional Publication No 39 Purdue University Agricultural Experiment Station Lafayshyette Indiana October 1953
Federal Trade Cmnmission Economic Report on the Dairy Industry US Government Printing Office Washington DC March 19 1973
Knutson RD Price and Trade Practice Regulation in the Minnesota Dairy Industry unpublished PhD thesis University of Minnesota 1967
Midwest Research Institute Resource and Environmenshytal Profile Analysis of Five Milk Container Systems with Selected Health and Economic Considershyations Final Draft Report MRI Project No 4003-D June 18 1976
USDA Agricultural Marketing Service Transportation and Facilities Research Division Layouts and Operating Criteria for Automation of Dairy Plants Processing Milk Half-and-Half Cream Chocolate Drink and Buttermilk Marketing Research Report No 591 US Government Printing Office Washingshyton DC September 1963
---------------------------------------Packaged Fluid Milk Sales in Federal Milk Order Markets by Size and Type of Containers and Distrishybution Method during November 1975 AMS-553 July 1977
___ Agricultural Research Service A Dairy Products Distribution Facility Layouts and Operating Methods Marketing Research Report No 990 Washington DC April 1974
US Department of Health Education and Welfare Pubshylic Health Service Food and Drug Administration Milk Pasteurization Controls and Tests Cincinnati Training Facility Course Manual 1977
US Department of the Treasury Internal Revenue Sershyvice Federal Highway Use Tax on Trucks TruckshyTractors and Buses Publication 349 (revised)
Williams Sheldon W et aI Organization and Comshypetition in the Midwest Dairy Industries Iowa State University Press Ames Iowa 1970
INDUSTRY CONTACTS
Ammonia House Inc 712 W 77-12 St Minneapolis Minnesota
B-Bar-B Inc Bag-N-Box Packaging Systems 10th and McBeth St New Albany Indiana
Bill Boyer Ford 2811 NE Broadway Minneapolis Minshynesota
Blackhawk Molding Co 109 Commercial Road Addishyson Illinois
Blesi Evans Co 2533 24th Ave South Minneapolis Minnesota
Clover Leaf Creamery Co 420 W Broadway Minneapshyolis Minnesota
Continental Equipment Corp 6103 N 76th St Milwaushykee Wisconsin
Dairy Craft Inc 600 N 54th Ave St Cloud Minnesota DeLaval Separator Co 2950 Metro Drive St Paul Minshy
nesota Drew Agency Inc Griggs Midway Building St Paul
Minnesota Edmeyer Inc 750 S Plaza Drive st Paul Minnesota Environmental Process Inc 1220 Glenwood Ave Minshy
neapolis Minnesota Ex-Cell-O Corp Packaging Systems Group 10212
Xerxes Avenue South Bloomington Minnesota Fogg Filler Co 37 Van Dyke Ave Holland Missouri Freuhauf Corp 1717 W County Road C St Paul Minshy
nesota Graham Poly trip Co 1420 6th Ave York Pennsylvashy
nia Hercules Inc 2285 University Ave St Paul Minneshy
sota International Harvester Co 3000 NE Broadway Minneshy
apolis Minnesota International Paper Co 6100 Olsen Memorial Highway
Minneapolis Minnesota Land OLakes Inc 415 Grove St St Paul Minnesota Meyer Brothers Dairy 105 E Lake St Wayzata Minneshy
sota Pitcher Pak Corp 67 Cummings Park WobuJm Massashy
chusetts Smith-Lee Co 537 Fitch St Oneida New York Sturm Sales Inc 355 21st St Newport Minnesota Superior Dairy Fresh Co 2112 NE Broadway Minneapshy
olis Minnesota Tapemark Co 223 Marie Ave E S1 Paul Minnesota Thermo King Sales and Service Inc 2645 Fairway Ave
N St Paul Minnesota Winscott Glass Co Box I Clarion Pennsylvania
27
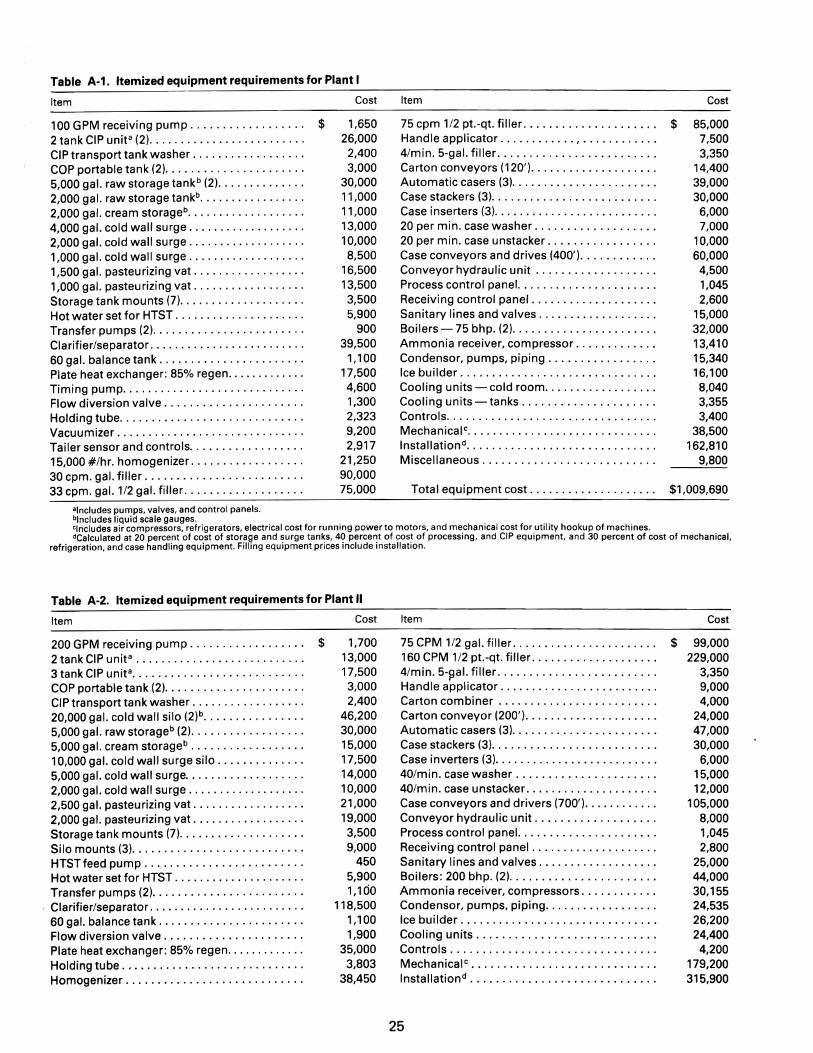
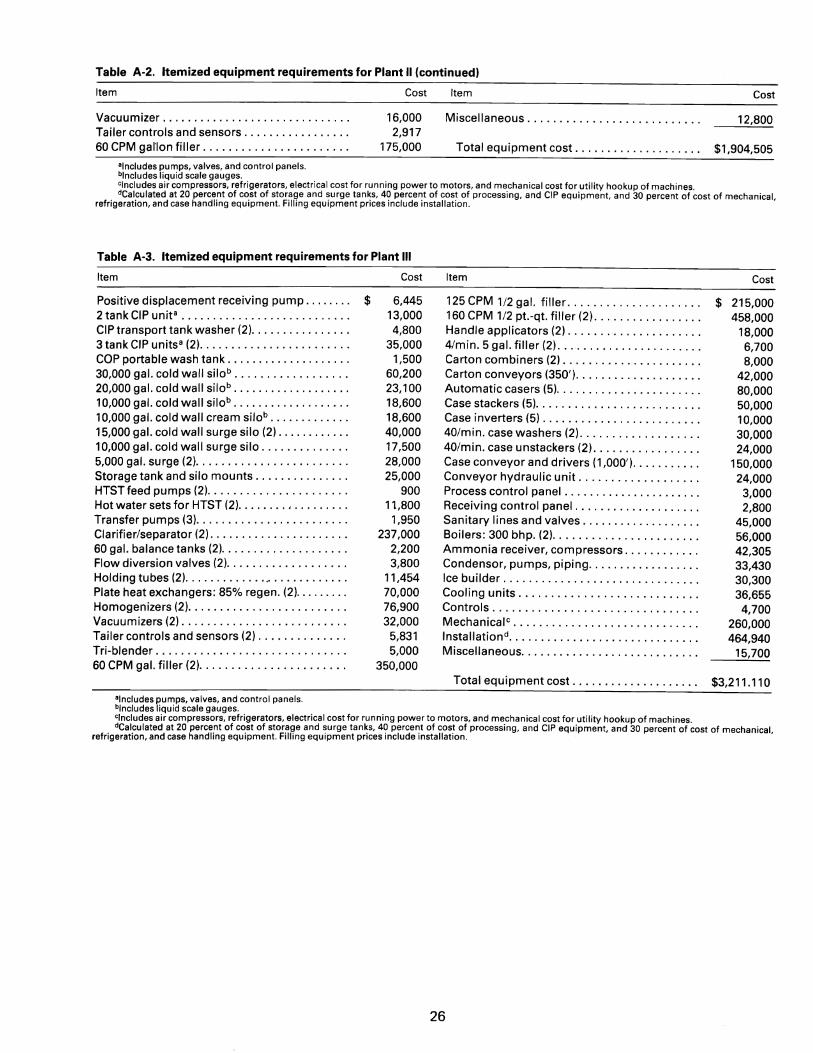
