fluid-rock interaction under conditions pertinent to hdr ... · fluid-rock interaction under...
TRANSCRIPT

Proceedings World Geothermal Congress 2015
Melbourne, Australia, 19-25 April 2015
1
Fluid-Rock Interaction under Reservoir Conditions Pertinent to Hot Dry Rock-Engineered
Geothermal Systems
Alvin I. Remoroza1, Behdad Moghtaderi
2 and Elham Doroodchi
2
1Energy Development Corporation, Ortigas Center, Pasig City, Philippines
2Newcastle Institute for Energy and Resources, University of Newcastle, Australia
Keywords: CO2-EGS, fluid-rock interaction, hydrothermal apparatus
ABSTRACT
A hydrothermal apparatus capable of operating at up to 50 MPa and up to 400oC was designed and fabricated to conduct flow-
through and batch fluid-rock interaction experiments. Granite samples of varying mineral compositions were sourced from three
different locations. H2O and CO2 flow-through fluid-rock interaction experiments were conducted at 20 MPa and 250oC and
various flow rates. Effluent fluids collected were analyzed using ICP-OES whilst pulverized granite samples were analyzed using
XRF, XRD, and SEM. The results showed that, in general, H2O-rock interaction experiments dissolved more rock materials
compared with CO2. Moreover, the presence of H2O in CO2-rock interaction experiments made the fluid reactive and enhanced the
dissolution of rock. However, for both H2O and CO2 flow-through experiments, the equilibrium conditions were not reached even
after 15 days of exposure. XRD analysis showed that the bulk composition of rock samples did not change for both H2O and CO2
flow-through experiments except in CO2 experiment with very high H2O content. In addition, SEM analysis of granite samples
from CO2-H2O flow-through experiments showed formation of pits and cavities in some of the mineral surfaces which was
associated with the dissolution and precipitation of carbonate minerals.
1. INTRODUCTION
In the EGS-HDR concept, fractures are generated from an injection well, and production wells are drilled into the created fractures.
“Geofluid” is used to mine the heat from the hot dry crystalline basement rocks. The “geofluid” could be H2O or CO2 that has
thermodynamic and transport properties suitable for geothermal application. Studies have recognized the following advantages of
CO2 over H2O based EGS:
1. CO2 is supercritical at geothermal reservoir conditions. The higher compressibility and expansivity at supercritical
conditions enable the thermosiphon effect to drive the circulation of fluid in an EGS reservoir. In addition, the lower CO2
viscosity enables higher mass flow rates.
2. CO2 is relatively inert and therefore has lower scaling potential than H2O.
3. CO2 based EGS offers limited carbon sequestration and storage.
However, CO2 based EGS also has disadvantages over H2O:
1. CO2's lower specific enthalpy translates to lower heat extraction per kg of fluid.
2. CO2's lower density increases frictional losses in the wellbore and pipeline.
Studies of fluid-rock interaction under conditions pertinent to a typical HDR EGS reservoir are presented in this paper. The
experimental set-up and the fluid-rock interaction apparatus used for batch and flow-through experiments are described.
2. EXPERIMENTAL SET-UP
2.1 Fluid-Rock Interaction Apparatus
A fluid-rock interaction apparatus was designed and fabricated to experimentally determine CO2-H2O-rock interactions under EGS
HDR reservoir conditions. This customized apparatus enabled flow-through experimental studies of unconsolidated rock samples
with CO2 and saturated brines at pressures of up to 50 MPa and temperatures of up to 400oC Figure 1. Batch and flow-through
experiments at 20 MPa and 200-250oC were conducted using granite samples sourced from three different locations in New South
Wales, Australia.
The apparatus consists of: (a) a single non-rocking furnace with heater to maintain the temperature; (b) a pressure vessel to house
the flexible titanium cell; (c) a titanium cell assembly to contain the unconsolidated rock sample and fluid; (d) a digital back
pressure regulator to maintain the system pressure inside the reaction cell; (e) a pneumatic confining pressure controller to maintain
the pressure inside the pressure vessel; (f) a piston accumulator with re-circulating chiller to store liquid CO2 at constant
temperature; (g) a high pressure pump to operate and maintain the pressure in the piston accumulator; and (h) a data monitoring and
acquisition system. The piston accumulator used water as the hydraulic fluid to pressurize the CO2. The fluid and rock were
contained in a double-ended, all-titanium flexible reaction cell (160 ml) or double-ended, all-titanium rigid reaction cell (18 ml)
with 10 micron frit filters at both ends.

Remoroza et al.
2
Figure 1: The actual unit (left) and schematic diagram (right) of the fluid-rock interaction apparatus.
2.2 Rock Samples
The HDR geothermal reservoir formation was simulated using granite samples collected at the surface from a granite outcrop at
Moonbi near the New England Highway in NSW, Australia and drill core samples intersected from Mossgiel 1 and Nambucurra 1
boreholes at Murray-Darling Basin, NSW, Australia. The Mossgiel samples were collected from fragmented drill cores at depths of
1793-1796 meters and the Nambucurra 1 samples from the drill core sample at depths of 260.9-261.4 meters. The Mossgiel and
Nambucurra 1 drill core samples were acquired from WB Clarke Geoscience Centre at Londonderry Core Library.
The granite samples were cleaned, crushed, and pulverized using a tungsten carbide ring mill (N.V. Tema Ring Mill) for 3 minutes.
The pulverized samples were then analyzed for particle size distribution using MALVERN Instruments Mastersizer E. Figure 2
shows the particle size distributions of Nambucurra, Mossgiel, and Moonbi pulverized samples. The average particle sizes of the
pulverized samples were 51.8, 16.1, and 5.7 µm for Nambucurra, Moonbi and Mossgiel, respectively. The observed differences are
deemed due to apparent different mineral compositions of the granite samples.
Figure 2: Particle size distribution of pulverized granites: Nambucurra 1 (left), Moonbi (middle), and Mossgiel (right).
The major oxide compositions of the pulverized granites samples were analyzed using fused bead X-ray fluorescence (XRF) and
are presented in Table 1. The samples consisted mainly of SiO2 and Al2O3 with the Moonbi sample having twice as much CaO than
the Mossgiel and Nambucurra samples.
The approximate mineral compositions of the granite samples were determined using Rietveld quantitative X-ray diffraction (XRD)
analysis and SIROQUANT™ V3 commercial software. It can be seen in Table 2 that quartz, plagioclase feldspar, alkali feldspar,
mica, and amorphous compounds (most likely silica) are common to all the granite samples. Amphibole is present in the Moonbi
sample but is absent in the Mossgiel and Nambucurra samples while chlorite is present in the Mossgiel and Nambucurra samples
but is absent in the Moonbi sample. The Moonbi sample has the highest concentration of plagioclase feldspar while the Mossgiel
and Nambucurra samples have the highest concentration of amorphous compounds. The pulverized granite samples were oven
dried at 120oC for at least 24 hours before loading into the reaction cell.
Table 1: Major oxide compositions of the granite samples.
Major
Oxides Moonbi Mossgiel Nambucurra
Wt % Error Wt % Error Wt % Error
SiO2 67.01 0.100 65.53 0.100 72.73 0.100
Al2O3 15.06 0.050 14.56 0.050 13.85 0.050
K2O 4.31 0.013 3.77 0.012 4.24 0.012
Fe2O3 3.73 0.015 5.56 0.018 2.51 0.012
Na2O 3.14 0.051 2.94 0.050 2.97 0.048
CaO 3.12 0.009 1.70 0.007 1.30 0.006
MgO 1.88 0.019 1.96 0.019 0.71 0.012

Remoroza et al.
3
Major
Oxides Moonbi Mossgiel Nambucurra
Wt % Error Wt % Error Wt % Error
TiO2 0.53 0.003 0.77 0.003 0.31 0.002
P2O5 0.24 0.004 0.20 0.004 0.18 0.003
MnO 0.07 0.000 0.08 0.000 0.05 0.000
SO3 0.01 0.001 0.09 0.002 0.01 0.001
Ignition
loss 0.69 2.68 1.03
Total 99.79 99.85 99.90
Table 2: Mineral compositions of the granite samples in wt % based on quantitative XRD analysis
Composition Moonbi Mossgiel Nambucurra
Amorphous Dis-ordered atoms 2 30 25
Quartz SiO2 15 16 24
Plagioclase Feldspar* NaAlSi3O8 30 23 23
Alkali Feldspar# KAlSi3O8 14 12 5
Mica** X2Y4-6Z8O20(OH2F)2 17 8 20
Amphibole## XY2Z5(Si,Al,Ti)8O22(OH,F)2 22
Chlorite^ (X5Al)(AlSi3)O10(OH)8 11 3
Total 100 100 100 *Plagioclase best match of Albite #Alkali feldspar possible match of Microline in Moonbi, possible mixture of Microline and Sanidine in the Mossgiel and
Nambaccuara samples **Mica in which X is K, Na, Ca or less commonly Ba, Rb or Cs; Y is Al, Mg, Fe or less commonly Mn, Cr, Ti, li, etc.; Z is chiefly Si
or Al but also may include Fe3+ ot Ti **Mica is most likely Muscovite ##Amphibole where X=Na, K, vacant; Y=Na,Ca, Fe2+, Li, Mn2+, 3+, Al, Mg; Z = Fe3+, Mn3+, Al, Ti4+, Fe2+, Li ##Amphibole possible match to Hornblende ^Chlorite where X=Mg, Fe, Ni, and Mn ^Chlorite possible match with Clinochlore-ferroan
2.3 Experimental procedure
Batch CO2-rock interaction experiments that ran up to 15 days at simulated reservoir pressures of 20 MPa and 35 MPa temperatures
of 200oC and 250oC were conducted to determine possible interactions of CO2 with the rock.
Flow-through fluid-rock interaction experiments were conducted at 20 MPa and 250oC pressure and temperature, respectively. The
flow-through experiments ran for 15 days at different volumetric flow rates.
During the CO2 experiments, the so called “reacted” CO2 was allowed to bubble in a 2% nitric acid solution to capture materials
dissolved in supercritical CO2. The weight of the 2% nitric acid solution was measured before and after each sample collection to
detect any abnormal changes due to contamination or solid particle carryover. For H2O-rock interaction experiments, however, the
fluid sample collected were weighted and preserved by adding nitric acid to make a 4% solution. The higher nitric acid
concentration for the H2O-rock interaction experiments was due to the expected higher silica concentration. The 4% nitric acid
concentration is the common preservation method for hydrothermal samples.
The fluid samples collected were analyzed using Varian 710/715-ES ICP-OES for cations and anions dissolved in the solution. The
pulverized granites used in the experiments were analyzed using x-ray fluorescence (Spectro X'Lab 2000 Polarised ED-XRF) for
major oxide composition and trace elements, x-ray diffraction (Philips Diffractometer PW1710) for qualitative mineral analysis,
and scanning electron microscopy (Philips XL30 SEM + Oxford ISIS EDS + Gatan Mini Cathodoluminescence Detector) for image
analysis of the mineral surfaces. Approximately 25 g of pulverized granite sample packed in the double ended rigid titanium reactor
was used in each run of the fluid-rock interaction experiments.
The pressure loss in the system was monitored by measuring the inlet and outlet pressures of the reactor during the flow-through
fluid-rock interaction experiments. Temperature data were also collected to monitor and check the stability of the experiments.
3. RESULTS AND DISCUSSION
3.1 Batch CO2-rock interaction experiments
Figure 3 shows that minute amounts of Ca, Fe, Mg, Al, and Si were dissolved in a batch CO2 experiment at 35 MPa and 200oC.
Theoretically, granite should not have dissolved in water-free scCO2 as reported by Lin et al. (2008). The most probable
explanation for this discrepancy is the presence of H2O in the reaction. H2O may have leaked through the o-rings into the system
through the piston accelerator where CO2 is stored and transferred to the reactor. Alternatively, the pore H2O content or mineral
bound H2O in the granite sample may have also played a role (Hongfei Lin et al., 2007; Hongfei Lin, et al., 2008). H2O is highly
soluble in scCO2 at high temperatures and pressures. The studies done by Takenouchi and Kennedy (1964) showed that at 35 MPa
and 200oC, H2O is soluble up to 18% by mole or ~8.24 % by weight in scCO2.

Remoroza et al.
4
Figure 3: Element concentration dissolved in supercritical CO2 after 200°C and 35 MPa batch experiments.
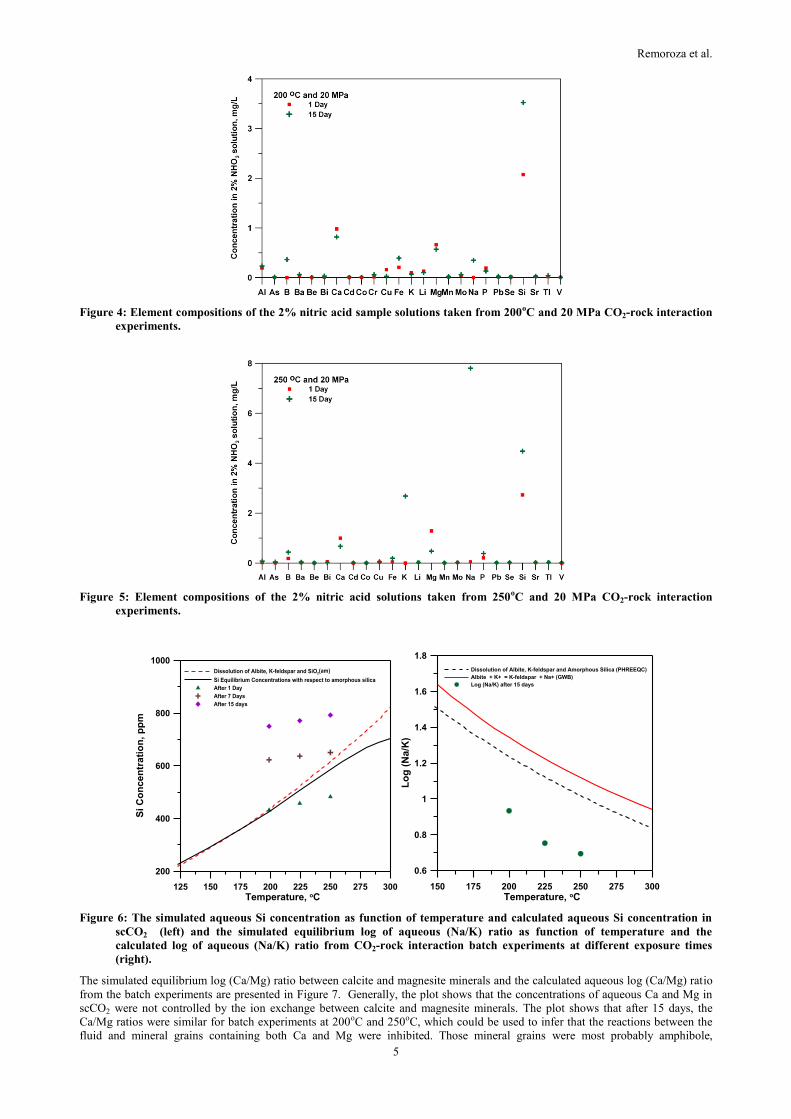
The composition of the 2% nitric acid capture solutions used in the batch CO2-rock interaction experiments carried out at 20 MPa
and 200oC and 250oC are presented in Figure 4 and Figure 5, respectively. These results show that Si, Ca, Mg, Na, and K were
dissolved in CO2. The results contradict previous studies that showed that granite, quartz, and biotite absolutely do not dissolve in
water-free scCO2 (Hongfei Lin, et al., 2007; Hongfei Lin, et al., 2008). As stated earlier, it was possible that H2O was present in the
CO2 pumped from the piston accumulator. The CO2 in the piston accumulator was kept at constant 20 MPa and 20oC. At this
pressure and temperature, the experimental data from the literature give 2.9% H2O molar solubility (~1.2% by weight) in CO2
(Spycher, Pruess, & Ennis-King, 2003). In addition, the mutual solubility of scCO2 and H2O increases as the temperature and
pressure increases.
To verify the presence of H2O in the scCO2 stream, geochemical simulations were conducted to determine the theoretical
concentrations of Si, Na, and K in an aqueous solution saturated with CO2 in contact with the rock minerals using PHREEQC for
Windows Version 2 (Parkhurst and Appelo, 1999) and Geochemist's Workbench (Bethke and Yeakel, 2011). Due to the non-
availability of thermodynamic and kinetic data of amphibole (particularly hornblende) in the literature, its contribution to Si
aqueous concentrations was ignored. Instead, the geochemical simulations only allowed possible dissolution of quartz, albite, k-
felspar, mica, and amorphous silica, which were the other major mineral compositions of the Moonbi granite used in the batch
experiment.
On the basis of 25 g pulverized granite (assumed 2.7g/cc density) inside the 18 ml reactor and considering the solubility of H2O in
CO2 at 20 MPa and 20oC, the volume occupied by the fluid was 8.74 ml from which ~0.096 g was H2O and the rest was CO2. The
concentration of Si analyzed from the 2% nitric acid solution was then recalculated assuming that it was all dissolved in the H2O
present in CO2. Figure 6 presents the calculated aqueous Si concentration dissolved in scCO2 (symbols) at different exposure times
and the simulated equilibrium aqueous Si concentrations as a function of temperature (lines). The plot shows that at 200oC, the
aqueous Si concentration was in equilibrium with the rock minerals after 1 day and apparently became oversaturated after 7 days.
At 250oC, the aqueous Si concentration was still unsaturated after 1 day and became oversaturated after 7 days. Interestingly, the
set of data points from different exposure times had the same trends. It was highly probable that H2O from the piston accumulator
accumulated in the reactor during day 7 until day 15 of the batch reaction. The high pressure CO2 pump was intermittently operated
to keep the system pressure constant. Theoretically, the dissolved H2O in 20oC CO2 fluid in the piston accumulator may have been
transported through diffusion to the high temperature CO2 fluid, which is unsaturated with respect to H2O content. The H2O
solubility in CO2 at 20 MPa and 200-250oC was 6.7% or more by weight compared with 1.2% by weight at 20oC. The extra H2O in
the reactor could bring the 7 and 15 days data points within the simulated equilibrium lines. In general, the aqueous solution
"suspended" in scCO2 was in local equilibrium with respect to Si concentration at 200oC and near equilibrium at 250oC. The
aqueous Si content primarily came from the dissolution of amorphous silica based on the PHREEQC and GWB simulations.
Ion exchange between albite and k-feldspar may control the aqueous Na and K concentrations in scCO2. Figure 6 shows the
simulated log (Na/K) ratio and the calculated aqueous log (Na/K) ratios from the batch experiments. The calculated aqueous log
(Na/K) ratios from 200oC and 250oC batch experiments were unsaturated even after 15 days exposure time. The data points shown
in the figure implied the preferred dissolution of albite.
Remoroza et al.
5
Figure 4: Element compositions of the 2% nitric acid sample solutions taken from 200oC and 20 MPa CO2-rock interaction
experiments.
Figure 5: Element compositions of the 2% nitric acid solutions taken from 250oC and 20 MPa CO2-rock interaction
experiments.
Figure 6: The simulated aqueous Si concentration as function of temperature and calculated aqueous Si concentration in
scCO2 (left) and the simulated equilibrium log of aqueous (Na/K) ratio as function of temperature and the
calculated log of aqueous (Na/K) ratio from CO2-rock interaction batch experiments at different exposure times
(right).
The simulated equilibrium log (Ca/Mg) ratio between calcite and magnesite minerals and the calculated aqueous log (Ca/Mg) ratio
from the batch experiments are presented in Figure 7. Generally, the plot shows that the concentrations of aqueous Ca and Mg in
scCO2 were not controlled by the ion exchange between calcite and magnesite minerals. The plot shows that after 15 days, the
Ca/Mg ratios were similar for batch experiments at 200oC and 250oC, which could be used to infer that the reactions between the
fluid and mineral grains containing both Ca and Mg were inhibited. Those mineral grains were most probably amphibole,
125 150 175 200 225 250 275 300
Temperature, oC
200
400
600
800
1000
Si C
on
cen
trati
on
, p
pm
Dissolution of Albite, K-feldspar and SiO2(am)
Si Equilibrium Concentrations with respect to amorphous silica
After 1 Day
After 7 Days
After 15 days
150 175 200 225 250 275 300
Temperature, oC
0.6
0.8
1
1.2
1.4
1.6
1.8
Lo
g (
Na/K
)
Dissolution of Albite, K-feldspar and Amorphous Silica (PHREEQC)
Albite + K+ = K-feldspar + Na+ (GWB)
Log (Na/K) after 15 days

Remoroza et al.
6
particularly hornblende. It was possible that the by-products of the initial fluid-rock interactions formed a passive layer, effectively
inhibiting further reactions (Sugama, Ecker, & Butcher, 2010, 2011).
Figure 7: The simulated equilibrium log of aqueous (Ca/Mg) ratio as function of temperature and the calculated log of
aqueous (Ca/Mg) ratio from the batch CO2-rock interaction experiments.
The wet carbonation of granite at 250oC and 17.3 MPa conducted by Sugama et al. (2010, 2011) showed formation of K2CO3,
Na2CO3, kaolinite-like clay compound, and amorphous SiO2. In the same studies, the wet carbonation of hornblende formed
MgCO3, CaCO3, and FeCO3 as observed through XRD and FT-IR analyses. K2CO3 and Na2CO3 are highly soluble in H2O while
MgCO3, CaCO3, and FeCO3 are less susceptible to dissolve in H2O. The results from this study show that in fact, Na, K, Ca, Mg,
and Si elements were present in the 2% nitric acid solution from the batch experiments. The presence of H2O in scCO2 used to react
with the pulverized granite in the present study was therefore partly validated. The presence of H2O in the scCO2 was later
confirmed with greater certainty in the flow-through experiments that will be discussed in the succeeding section.
With the presence of H2O in the scCO2, a reactive species intermediate was formed to facilitate carbonation of rocks as expressed in
the following reactions (Sugama, et al., 2010, 2011)
2HCOHHCOOH CO
-2
3
-
322 (1)
2146232
-2
383 (OH)OSiAlCONa2HCOONaAlSi2 (2)
2146232
-2
383 (OH)OSiAlCOK2HCOOKAlSi2 (3)
2HFOSiAl5FeCO5MgCO2CaCO2H12COOH)(F,OSi)(Al,Al)Fe,(Mg,Ca 22813333
-2
3222852 (4)
An SEM analysis of the pulverized granite after the batch CO2 interaction experiments at 20 MPa and 200oC showed signs of
erosion in the surfaces of some of the minerals. Figure 8 shows the SEM images of the pulverized granite before the batch
experiments: rough edges and rough mineral surfaces typical of unaltered and unreacted pulverized solid samples. Conversely,
Figure 9 shows SEM images of pulverized granite after the batch experiments: rounded edges and pebble- like surfaces, which are
typical signs of erosion. These were possibly due to the formation of carbonates in the surfaces and the subsequent erosion and
dissolution of the carbonates, particularly Na2CO3 and K2CO3 (Sugama, et al., 2010, 2011).
150 200 250 300
Temperature, oC
-0.4
-0.2
0
0.2
0.4
0.6
0.8
1
Lo
g (
Ca/M
g)
Calcite + Mg++ = Magnesite + Ca++
Day 1
Day 7
Day 15

Remoroza et al.
7
Figure 8: SEM images of the untreated pulverized granite samples.
Figure 9: SEM images of pulverized Moonbi granite after 23 days of exposure in the batch CO2-rock interaction
experiments at 20 MPa and 200oC.
3.2 Flow-through Fluid-Rock Interaction Experiments
Flow-through fluid-rock interaction experiments using CO2 and H2O and pulverized Moonbi granite were conducted at reservoir
conditions of 20 MPa and 250oC. The Si, Na, K, and Al concentrations of the fluid samples as a function of time are presented in
Figure 10. The results indicate possible reactions between the H2O and CO2 streams and amorphous silica, albite, and k-feldspar.
H2O consistently dissolved more rock minerals compared with CO2 stream as evidenced by higher Si, Na, K, and Al element
concentrations.
The Si concentrations at 0.05 ml H2O/min flow rate was about 182 ppm after 10 days and about 172 ppm at a flow rate of 0.20 ml
H2O/min. CO2 streams, on the other hand, recorded a maximum Si concentration of about 5 ppm on 0.20 ml CO2/min flow rate.
Figure 11 shows that the average Si concentration decreased as H2O flow rate increased. This was due to the fact that at a higher
H2O flow rate, the residence time was shorter and therefore had less time for the fluid and the rock mineral to interact. Moreover,
H2O was found to dissolve more K and less Na as its flow rate increased from 0.05 ml/min to 0.20 ml/min. Al concentration also
decreased as H2O flow rate increased. These observations could be used to infer that at a higher mass flow rate, H2O dissolves more
k-feldspar and less albite.
In the case of CO2 flow, Na and K decreased while Al increased as the flow rate increased from 0.20 ml/min to 0.50 ml/min. As
discussed earlier, the dissolution of Si, Na, K, Al, and other species in the CO2 flow-through experiments is believed to be driven
by the presence of H2O in the CO2 stream. This suspicion was confirmed by an increase in the weight of the 2% HNO3 solution
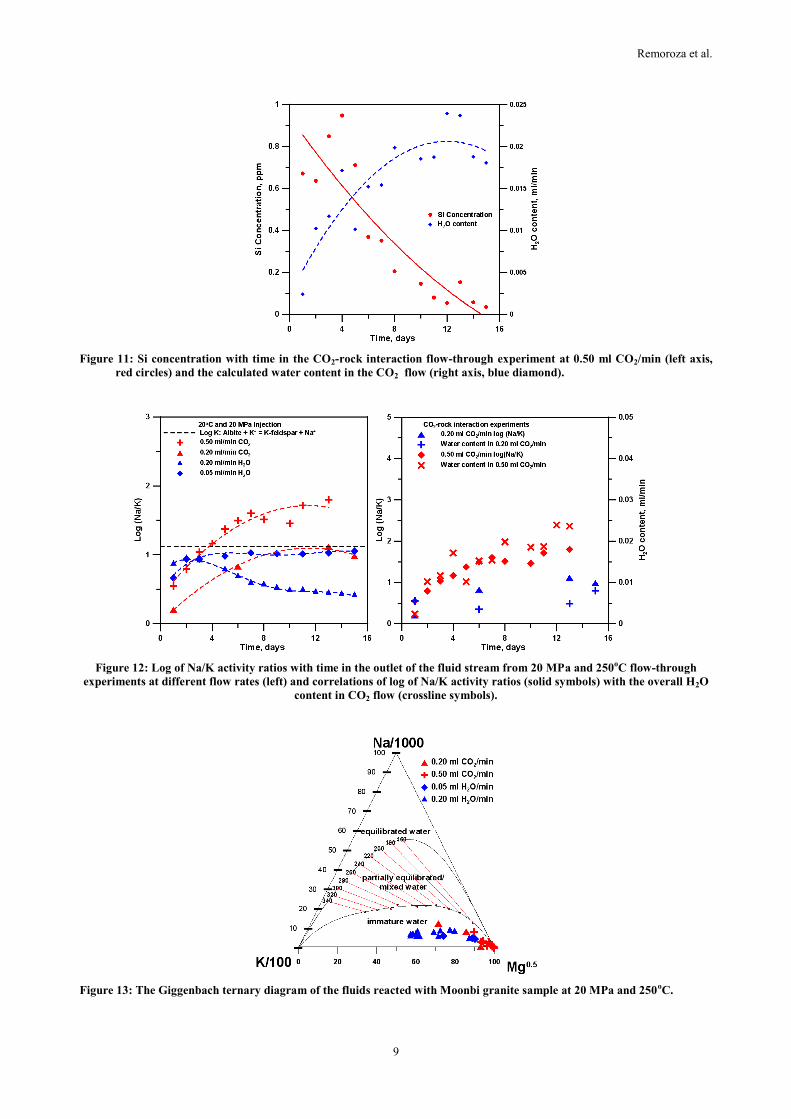
which is associated with H2O leaked into the CO2 stream from the piston accumulator. Figure 11 shows Si concentrations at CO2
flow rate of 0.50 ml/min and the measured H2O content (secondary y-axis) in ml/min. It can be seen that H2O content varied from
0.5% to 5% of the total volumetric flow. Also, Si concentration in the fluid decreased as H2O content in the flow increased. The
latter behavior could be explained considering the inverse relationship between the flow rate and effective residence time of H2O
inside the reactor.
In addition, the presence of Na, K, and Al cations in the fluid samples suggested dissolution of albite (release of Na and Al) and k-
feldspar (release of K and Al) in the reacting fluid. Figure 12 shows the simulated log of (Na/K) ratios and that of the fluids from
the flow-through experiments. These results suggest that the fluid-rock interactions primarily favoured reaction with albite because
Na/K is greater than 1. The H2O-rock interaction was consistently below that of albite/k-feldspar ion-exchange equilibrium line.
Moreover, the log of (Na/K) ratio at 0.05 ml H2O/min approached the albite/k-feldspar ion-exchange equilibrium after 3 days while

Remoroza et al.
8
the 0.2 ml H2O/min started near the equilibrium line and stabilized at well below the equilibrium line after 10 days. In the CO2-rock
interaction, the log of (Na/K) ratio was greater at higher flow rates and crossed the albite/k-feldspar ion-exchange equilibrium faster
compared with that of the lower flow rates. The log (Na/K) ratio from the CO2-rock interaction experiments and H2O content in the
CO2 streams is presented in Figure 12. It shows that the log of (Na/K) ratios increased as the H2O content increased. This direct
relationship between the log of (Na/K) ratio and H2O content indicates that the higher the H2O content in the CO2 stream, the
greater the amount of albite reacted with the fluid compared with k-feldspar.
To gain a better insight into the thermodynamic state of fluid-mineral equilibria, the above data were plotted in the Na-K-Mg
ternary diagram proposed by Giggenbach (1988) as presented in Figure 13. The Na-K-Mg ternary diagram is based on the
thermodynamically stable feldspar end-member equilibrium reactions expressed as
2Mg water 1.6 feldspar -k 0.8 albite 2Na 2 silica 5.4 eclinochlor 0.2 muscovite 8.0 (5)
2Mg water 1.6 feldspar -k .82K 2 silica 5.4 eclinochlor 0.2 muscovite 8.0 (6)
Figure 13 shows that the fluids from the flow-through experiments are far from the equilibrium. The data from the H2O-rock
interaction experiments showed similar high Na levels consistent with the postulated preferential dissolution of albite. In the case of
CO2-rock interaction experiments, Na concentration levels increased while Mg concentration levels decreased, approaching the
concentration levels of H2O-only experiments. The above findings are consistent with the literature data reported by Kuncoro et al.
(2010). Kuncoro et al. (2010) performed batch Na-Cl-H2O-rock interaction experiments using 0.70 grams of drill cutting from the
Habanero 3 wells (Cooper Basin EGS project) and 90 ml 250 ppm NaCl solution. Their results showed preferential dissolution of
albite and k-felspar over quartz and other minerals indicating that albite and k-feldspar were the most reactive phase in the granite
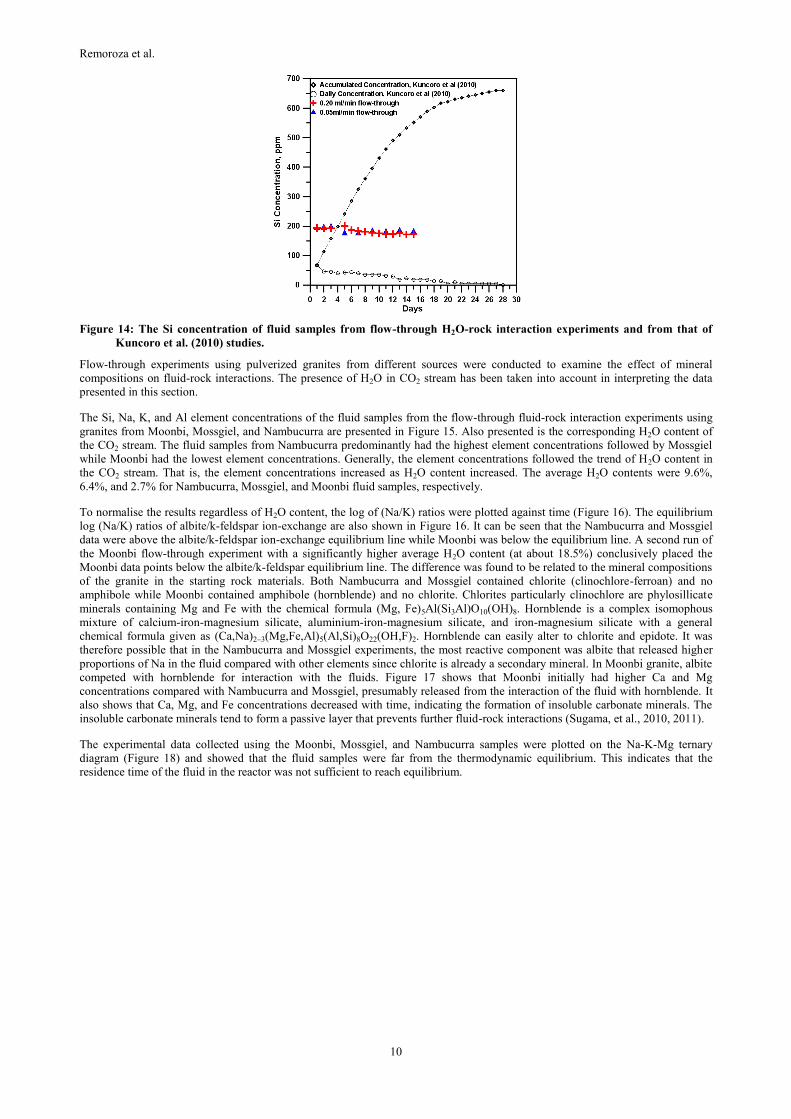
samples. However, as shown in Figure 14, Si concentrations levels reported by Kuncoro et al. (2010)were much lower (maximum
of 67 ppm) than the flow-through experiments conducted in this study with an average of 175 ppm. That is because in Kuncoro's
experiment, the circulation fluid was being replaced with fresh 250 ppm NaCl solution every 24 hours. Other factors contributing to
the discrepancy include a higher mass ratio of H2O to rock sample (i.e. 90 g H2O/0.70 g rock) used by Kuncoro et al. (2010)
compared to the current study, which is 9 g H2O to 25 g rock sample with total reactor volume of 18 ml. The ratio used in this study
is more realistic as it represents a geothermal system in which the amount of rock available for the reaction is large compared with
the flowing fluid. Figure 14 also shows that the Si concentration level declines over time. The slight decline in Si concentration is
associated with the depletion of the starting rock materials. As the rock is being depleted, the surface area available for the reaction
diminishes; therefore, less and less of the rock samples are dissolved.
Figure 10: Average elemental Si, Na, K, and Al concentrations in the outlet fluid stream of the 20 MPa and 250oC flow-
through experiments at different flow rates.
Remoroza et al.
9
Figure 11: Si concentration with time in the CO2-rock interaction flow-through experiment at 0.50 ml CO2/min (left axis,
red circles) and the calculated water content in the CO2 flow (right axis, blue diamond).
Figure 12: Log of Na/K activity ratios with time in the outlet of the fluid stream from 20 MPa and 250oC flow-through
experiments at different flow rates (left) and correlations of log of Na/K activity ratios (solid symbols) with the overall H2O
content in CO2 flow (crossline symbols).
Figure 13: The Giggenbach ternary diagram of the fluids reacted with Moonbi granite sample at 20 MPa and 250oC.
Remoroza et al.
10
Figure 14: The Si concentration of fluid samples from flow-through H2O-rock interaction experiments and from that of
Kuncoro et al. (2010) studies.
Flow-through experiments using pulverized granites from different sources were conducted to examine the effect of mineral
compositions on fluid-rock interactions. The presence of H2O in CO2 stream has been taken into account in interpreting the data
presented in this section.
The Si, Na, K, and Al element concentrations of the fluid samples from the flow-through fluid-rock interaction experiments using
granites from Moonbi, Mossgiel, and Nambucurra are presented in Figure 15. Also presented is the corresponding H2O content of
the CO2 stream. The fluid samples from Nambucurra predominantly had the highest element concentrations followed by Mossgiel
while Moonbi had the lowest element concentrations. Generally, the element concentrations followed the trend of H2O content in
the CO2 stream. That is, the element concentrations increased as H2O content increased. The average H2O contents were 9.6%,
6.4%, and 2.7% for Nambucurra, Mossgiel, and Moonbi fluid samples, respectively.
To normalise the results regardless of H2O content, the log of (Na/K) ratios were plotted against time (Figure 16). The equilibrium
log (Na/K) ratios of albite/k-feldspar ion-exchange are also shown in Figure 16. It can be seen that the Nambucurra and Mossgiel
data were above the albite/k-feldspar ion-exchange equilibrium line while Moonbi was below the equilibrium line. A second run of
the Moonbi flow-through experiment with a significantly higher average H2O content (at about 18.5%) conclusively placed the
Moonbi data points below the albite/k-feldspar equilibrium line. The difference was found to be related to the mineral compositions
of the granite in the starting rock materials. Both Nambucurra and Mossgiel contained chlorite (clinochlore-ferroan) and no
amphibole while Moonbi contained amphibole (hornblende) and no chlorite. Chlorites particularly clinochlore are phylosillicate
minerals containing Mg and Fe with the chemical formula (Mg, Fe)5Al(Si3Al)O10(OH)8. Hornblende is a complex isomophous
mixture of calcium-iron-magnesium silicate, aluminium-iron-magnesium silicate, and iron-magnesium silicate with a general
chemical formula given as (Ca,Na)2–3(Mg,Fe,Al)5(Al,Si)8O22(OH,F)2. Hornblende can easily alter to chlorite and epidote. It was
therefore possible that in the Nambucurra and Mossgiel experiments, the most reactive component was albite that released higher
proportions of Na in the fluid compared with other elements since chlorite is already a secondary mineral. In Moonbi granite, albite
competed with hornblende for interaction with the fluids. Figure 17 shows that Moonbi initially had higher Ca and Mg
concentrations compared with Nambucurra and Mossgiel, presumably released from the interaction of the fluid with hornblende. It
also shows that Ca, Mg, and Fe concentrations decreased with time, indicating the formation of insoluble carbonate minerals. The
insoluble carbonate minerals tend to form a passive layer that prevents further fluid-rock interactions (Sugama, et al., 2010, 2011).
The experimental data collected using the Moonbi, Mossgiel, and Nambucurra samples were plotted on the Na-K-Mg ternary
diagram (Figure 18) and showed that the fluid samples were far from the thermodynamic equilibrium. This indicates that the
residence time of the fluid in the reactor was not sufficient to reach equilibrium.

Remoroza et al.
11
Figure 15: Si, Na, K, and Al concentrations of the fluid samples from the flow-through experiments using granite from
different sources. The H2O content of the 0.20 ml/min fluid flow is shown at the bottom of the plot.
Figure 16: The log of (Na/K) ratio of the fluid samples from the flow-through experiments using granite from different
sources.

Remoroza et al.
12
Figure 17: Aqueous Ca, Mg, and Fe concentrations of the fluid samples from the flow-through experiments using granite
from different sources.
Figure 18: Na-K-Mg ternary diagram of the fluid samples from the flow-through experiments using granite from different
sources.
The XRD trace of “reacted” Moonbi granite samples collected at the inlet, middle, and outlet of the titanium reactor from the CO2
flow-through experiment with high H2O content were compared with the unreacted granite sample in Figure 20. It shows that
samples first in contact with the fluid mixture in the inlet section of the reaction cell were altered into different minerals; amphibole
(hornblende) was most likely converted to chlorite. These observations was also consistent with the fluid's ICP-OES analysis where
the Moonbi granite experiments showed initially high Ca and Mg concentrations, which is considered to be the artefact of the
reaction of hornblende with CO2-H2O mixture and its alteration or conversion into chlorite. Furthermore, the SEM analysis of the
Moonbi granites from the CO2 flow-through experiment with high H2O content (Figure 21) shows that cavities and pits formed on
the mineral surfaces. These changes in the mineral surfaces were inferred to be due to the dissolution and precipitation of carbonate
minerals.

Remoroza et al.
13
Figure 19: XRD trace of pulverized Moonbi granites before (blue line) and after flow-through experiments at 20 MPa and
250oC and 0.2ml/min CO2 flow rate (green, pink and orange lines show the XRD trace of granites from different
sections of the reactor). The CO2 stream contains an average of 18.5% H2O content.
Figure 20: SEM image of unreacted (left) and reacted (middle and right) Moonbi granite from 20 MPa and 250oC flow-
through experiments.
3.3 Transport Properties
The pressure and temperature data collected from the flow-through experiments using Moonbi granites at CO2 flow rate of 0.20
ml/min and 0.50 ml/min as well as the H2O flow rates of 0.20 ml/min and 0.05 ml/min are presented in Figure 21 and Figure 22,
respectively. Moreover, the pressure and temperature data collected from the flow-through experiments using Nambucurra and
Mossgiel granites at CO2 flow rate of 0.20 ml/min are presented in Figure 23.
At 0.20 ml/min the pressure drop from CO2 flow was 276 kPa (40 psi) which is almost half compared with the 620 kPa (90 psi)
from H2O run. In fact, for the same pressure gradient, CO2 volumetric flow rate was four times greater than the H2O flow rate. In
the flow-through experiments, pressure fluctuations were encountered as the flow was stopped intermittently to refill liquid CO2 in
the piston accumulator (1 litre volume). This in turn caused a drop in pressure during the refilling process. Analysis of the inlet and
outlet pressures of the reactor and temperature data validated the prediction that CO2 flow has a lower reservoir pressure loss than
H2O.
In general, the pressure drop initially increased and then dropped due to a gradual compaction of the unconsolidated granite
samples. The fall in pressure continued until the flow stabilized and/or the dissolution of some rock minerals enhanced the
permeability. Analysis of the pressure data also shows that as the flow rate increases the pressure drop increases. For example, the
pressure increased from 276 kPa to 310 kPa as the CO2 flow increased from 0.2 ml/min to 0.50 ml/min. The pressure drop from the
Nambucurra experiment initially increased then declined to a level below that of the Moonbi experiments after 4 days while the
trend from the Mossgiel experiment showed a higher pressure drop compared with that of the Moonbi experiment. The Nambucurra
granite sample had an average particle size of 52 microns, which was larger than the Moonbi pulverized granite particles (16
microns). The Mossgiel sample had the smallest average size of 6 microns. It follows that the larger the particle sizes, the lower the
pressure drop. The relationship between the particle size (grain size) and the intrinsic permeability developed by Shepherd (1989)
could explain the above trend
ecdk (7)
where k is the intrinsic permeability, d is the particle diameter, c is a dimensionless constant, and e is between 1.65 to 1.85,
inclusive. Equation 7 demonstrates that at a given fluid mass flow rate, the higher the permeability, the lower the pressure drop.

Remoroza et al.
14
Figure 21: The inlet and back pressures, and temperature of the reactor (secondary y-axis) plotted against time from the
0.20 ml CO2/min flow (left) and 0.50 ml CO2/min (right) Moonbi experiments.
Figure 22: The inlet and back pressures, and temperature of the reactor (secondary y-axis) plotted against time from the
0.20 ml H2O/min flow (left) and 0.05 ml H2O/min (right) Moonbi experiments.
Figure 23: The actual inlet and back pressures, and temperature of the reactor (secondary y-axis) plotted against time from
the 0.20 ml CO2/min flows of Nambucurra (left) and Mossgiel (right) experiments.

Remoroza et al.
15
4 CONCLUDING REMARKS
The batch and flow-through CO2-rock interaction experiments were influenced by the H2O content in the fluid stream. The H2O
content was found to have leaked from the piston accumulator, which used H2O as hydraulic fluid. The presence of H2O in the
CO2-rock interaction experiments made the fluid reactive and dissolved minute amounts of granite materials as evidenced by the
existence of Si, Na, K, Al, and other elements in the fluid samples. It was observed that as the H2O content increases, the
concentrations of elements in the fluid sample also increase. The high H2O content in the CO2-rock interaction experiments
enhanced the alteration or conversion of amphibole (particularly hornblende) into chlorite. The H2O-rock interaction experiments,
on the other hand, dissolved a higher amount of the granite material than that of CO2-rock interaction experiments (i.e., about 175
ppm Si from H2O-rock experiments versus less than 5 ppm Si from CO2-rock experiments at 20 MPa and 250oC). The decrease of
Ca, Mg, and Fe concentrations over time was considered to be due to the formation of insoluble carbonate minerals and formation
of a passive layer that prevented further fluid-rock interactions. Generally, both CO2 and H2O flow-through experiments did not
reach aqueous equilibrium concentrations. Also, the bulk weight and compositions of the granite material remained unchanged. An
x-ray diffraction analysis of the pulverized granites showed that the bulk compositions before and after the flow-through
experiments remained unchanged except in CO2 flow-through experiments with high H2O content. An SEM analysis of the
pulverized granites from the CO2-H2O-rock experiments showed formation of pits and cavities in some of the mineral surfaces
which was associated with the dissolution and precipitation of carbonate minerals.
Development of CO2 and H2O based EGS will encounter reservoir conditions similar to those that were studied here. In H2O based
EGS, dissolution of rock minerals in the reservoir cannot be avoided, and precipitation of minerals in other parts of the reservoir
formation and/or in the wells and piping system, therefore, should be addressed. The techniques used to address this issue are 1)
inject H2O at high temperature and/or 2) use chemical technique (i.e., use of scale inhibitors or addition of acids). In CO2 based
EGS, H2O in the reservoir will eventually be displaced with anhydrous CO2; therefore, the problem associated with
dissolution/precipitation of rock minerals is critical during the initial development of the field. However, the effect of CO2-H2O
mixtures in carbon steel pipes and cements used in the wellbore assembly must be investigated to ensure the integrity of the
injection and production wells.
The dynamic dissolution and precipitation of minerals in the reservoir will affect the overall performance and operational efficiency
of EGS. Dissolution of minerals in the reservoir formation will enhance porosity/permeability, which will increase mass circulation,
heat extraction, and ultimately power generation. Too much dissolution of minerals in fluid channels could also lead to fluid flow
short circuiting, which in turn could result to lower heat extraction rates and lower power generation. Precipitation of minerals in
the reservoir, on the other hand, will impede fluid flow and therefore eventually decrease power generation. However, if
precipitation happens in the outer periphery of the reservoir beyond the production-injection areal coverage, it will actually seal the
reservoir and minimize the overall fluid loss of the EGS operation. This will favor H2O based EGS where the availability of H2O
resource is limited while it will minimize the ancillary benefit of carbon geosequestration for CO2 based EGS.
REFERENCES
Bethke, C. M. and S. Yeakel (2011). GWB Essentials Guide. Champaign, Illinois, Aqueous Solutions, LLC.
Giggenbach, W. F. (1988). "Geothermal solute equilibria. Derivation of Na-K-Mg-Ca geoindicators." Geochimica et
Cosmochimica Acta 52(12): 2749-2765.
Lin, H., et al. (2007). "Investigation of Interactions in a Simulated Geologic CO2/rock Minerals System for CO2 Underground
Sequestration." AIP Conference Proceedings 898(1): 17-21.
Lin, H., et al. (2008). "Experimental evaluation of interactions in supercritical CO2/water/rock minerals system under geologic
CO2 sequestration conditions." Journal of Materials Science 43(7): 2307-2315.
Kuncoro, G. B., et al. (2010). A Preliminary Study on Na-Cl-H2O-Rock Interactions of Hot Fractured Rock Geothermal System in
Cooper Basin, South Australia. Australian Geothermal Conference 2010, Adelaide Convention Centre, Adelaide, South
Australia.
Parkhurst, D. L. and C. A. J. Appelo (1999). User’s guide to PHREEQC (Version2)-A computer program forspeciation, batch-
reaction, one-dimensional transport, and inversegeochemical calculations U.S.Geological Survey Water-Resources
Investigations Report 99-4259: 310.
Spycher, N., et al. (2003). "CO2-H2O mixtures in the geological sequestration of CO2. I. Assessment and calculation of mutual
solubilities from 12 to 100°C and up to 600 bar." Geochimica et Cosmochimica Acta 67(16): 3015-3031.
Sugama, T., et al. (2010). Carbonation of Rock Minerals by Supercritical Carbon Dioxide at 250 oC. New York, Brookhaven
National Laboratory.
Sugama, T., et al. (2011). Susceptibility of Granite Rock to scCO2/Water at 200°C and 250°C, Brookhaven National Laboratory.
Takenouchi, S. and G. C. Kennedy (1964). "The binary system H2O–CO2 at high temperatures and pressures." Am. J. Sci. 262: 19.