fluor annual reports 1999
TRANSCRIPT

A N e w d i r e c t i o n f o r
F L U O R
1999 Annual Report
FLUOR
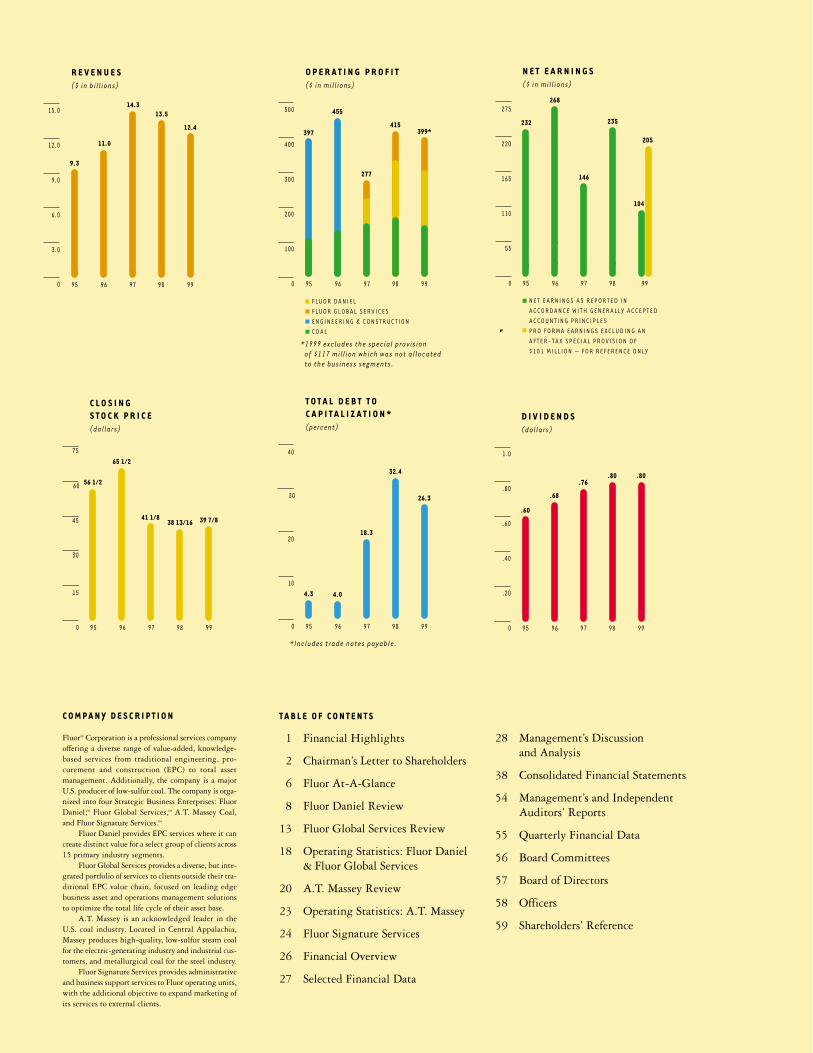
C O M P A N Y D E S C R I P T I O N
Fluor® Corporation is a professional services companyoffering a diverse range of value-added, knowledge-based services from traditional engineering, pro-curement and construction (EPC) to total asset management. Additionally, the company is a majorU.S. producer of low-sulfur coal. The company is orga-nized into four Strategic Business Enterprises: FluorDaniel,™ Fluor Global Services,™ A.T. Massey Coal,and Fluor Signature Services.™
Fluor Daniel provides EPC services where it cancreate distinct value for a select group of clients across15 primary industry segments.
Fluor Global Services provides a diverse, but inte-grated portfolio of services to clients outside their tra-ditional EPC value chain, focused on leading edgebusiness asset and operations management solutionsto optimize the total life cycle of their asset base.
A.T. Massey is an acknowledged leader in theU.S. coal industry. Located in Central Appalachia,Massey produces high-quality, low-sulfur steam coalfor the electric-generating industry and industrial cus-tomers, and metallurgical coal for the steel industry.
Fluor Signature Services provides administrativeand business support services to Fluor operating units,with the additional objective to expand marketing ofits services to external clients.
T A B L E O F C O N T E N T S
1 Financial Highlights
2 Chairman’s Letter to Shareholders
6 Fluor At-A-Glance
8 Fluor Daniel Review
13 Fluor Global Services Review
18 Operating Statistics: Fluor Daniel& Fluor Global Services
20 A.T. Massey Review
23 Operating Statistics: A.T. Massey
24 Fluor Signature Services
26 Financial Overview
27 Selected Financial Data
3.0
0 95 96 97 98 99
6.0
9.0
12.0
12.4
15.0
96 97 98 99
13.514.3
11.0
9.3
�R E V E N U E S �($ in billions)�
�
0
30
95 96 97 98 99
45
60
39 7/8
75
38 13/1641 1/8
65 1/2
56 1/2
15
�C L O S I N G �S T O C K P R I C E �(dollars)�
�
0
.20
95 96 97 98 99
.40
.60
.80
.80.80.76
.68
.60
1.0
�D I V I D E N D S �(dollars)�
�
0
100
95 96 97 98 99
200
300
400
399*415
277
455
397
500
�O P E R A T I N G P R O F I T �($ in millions)�
�
F LU O R DA N I E L �F LU O R G LO B A L S E R V I C E S �E N G I N E E R I N G & C O N ST R U C T I O N �C O A L
*1999 excludes the special provision� of $117 million which was not allocated� to the business segments.
0
10
95 96 97 98 99
20
30 26.3
32.4
18.3
4.04.3
40
�T O T A L D E B T T O �C A P I T A L I Z A T I O N * �(percent)�
�
*Includes trade notes payable.
0
55
95 96 97 98 99
110
165
220 205
275
104
96 97 98 99
235
146
98 99
268
232
�N E T E A R N I N G S �($ in millions)�
�
N E T E A R N I N G S A S R E P O R T E D I N �A C C O R DA N C E W I T H G E N E R A L LY A C C E P T E D �A C C O U N T I N G P R I N C I P L E S �P R O F O R M A E A R N I N G S E XC LU D I N G A N �A F T E R - TA X S P E C I A L P R O V I S I O N O F �$ 1 0 1 M I L L I O N — F O R R E F E R E N C E O N LY ��
28 Management’s Discussion and Analysis
38 Consolidated Financial Statements
54 Management’s and Independent Auditors’ Reports
55 Quarterly Financial Data
56 Board Committees
57 Board of Directors
58 Officers
59 Shareholders’ Reference
F l u o r C o r p o r a t i o n 19 9 9 A n n u a l R e p o r t
Page 1
Note: The information contained in this annual report contains forward-looking statements regarding projected future earnings levels, return on assets, cost reductions, market outlook, newawards, backlog levels, competition, Year 2000 readiness, outsourcing trends, the adequacy of funds to service debt and the implementation of new strategic initiatives. These forward-looking statements reflect the company’s current analysis of existing information as of the date of this annual report. As a result, caution must be exercised in relying on forward-looking statements. Due to unknown risks, the company’s actual results may differ materially from its expectations or projections. The factors potentially contributing to such differences include,among others:
• Changes in global business, economic, political and social conditions;
• The company’s failure to receive anticipated new contract awards;
• Customer cancellations of, or scope adjustments to, existing contracts;
• Difficulties or delays incurred in the execution of construction contracts resulting in cost overruns or liabilities;
• Customer delays or defaults in making payments;
• Fluctuations in the demand for, and price of, coal and other natural resource commodities;
• The impact of judicial, legislative and administrative decisions impacting coal mining operations;
• Difficulties or delays incurred in the implementation of strategic initiatives; and
• Competition in the global engineering, procurement and construction industry.
The forward-looking statements are also based on various operating assumptions regarding, among other things, overhead costs and employment levels that may not be realized. In addition,while most risks affect only future costs or revenues that the company anticipates it will receive, some risks may relate to accruals that have already been reflected in earnings. The company’sfailure to receive payments of these accrued earnings could result in charges against future earnings.
Additional information concerning these and other factors that may influence the company’s results can be found in its press releases and periodic filings with the Securities and ExchangeCommission, including the discussion under the heading “Item 1. Business – Other Matters – Company Business Risks” in the company’s Form 10-K filed January 27, 2000. These filingsare available publicly and upon request from Fluor’s Investor Relations Department: (949) 349-3909. The company disclaims any intent or obligation to update its forward-looking statements.
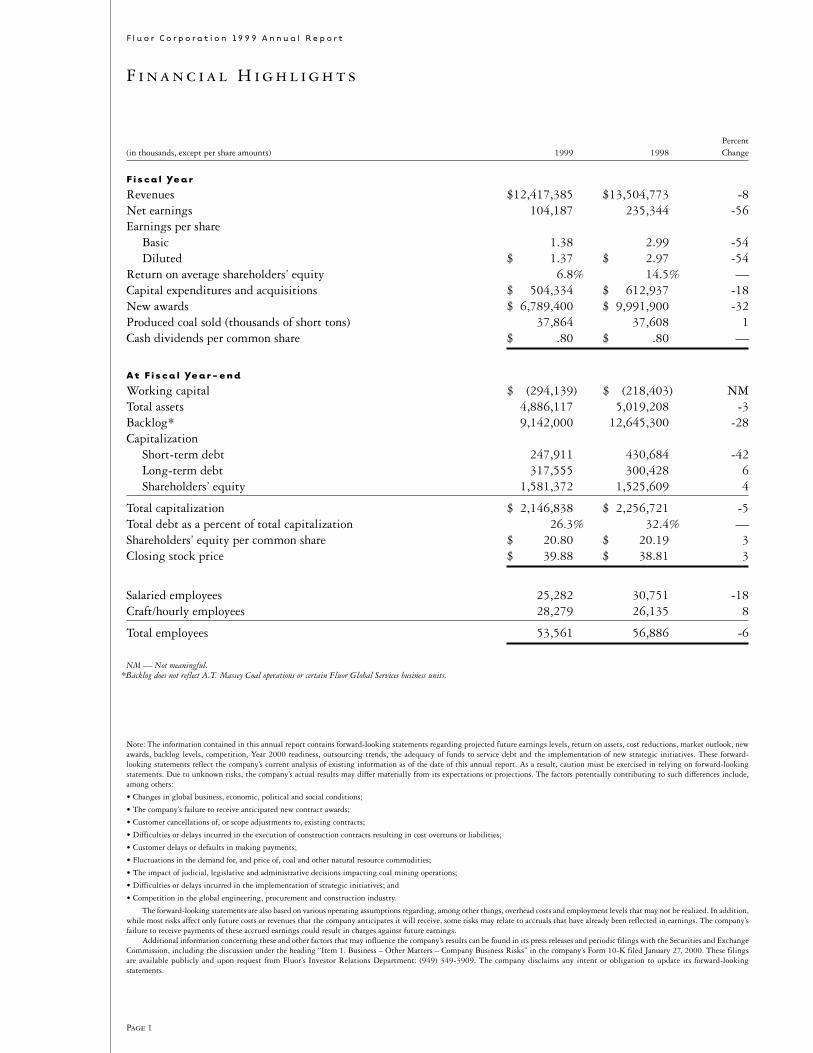
F i n a n c i a l H i g h l i g h t s
Percent(in thousands, except per share amounts) 1999 1998 Change
F i s c a l Ye a r
Revenues $12,417,385 $13,504,773 -8Net earnings 104,187 235,344 -56Earnings per share
Basic 1.38 2.99 -54Diluted $ 1.37 $ 2.97 -54
Return on average shareholders’ equity 6.8% 14.5% —Capital expenditures and acquisitions $ 504,334 $ 612,937 -18New awards $ 6,789,400 $ 9,991,900 -32Produced coal sold (thousands of short tons) 37,864 37,608 1Cash dividends per common share $ .80 $ .80 —
A t F i s c a l Ye a r - e n d
Working capital $ (294,139) $ (218,403) NMTotal assets 4,886,117 5,019,208 -3Backlog* 9,142,000 12,645,300 -28Capitalization
Short-term debt 247,911 430,684 -42Long-term debt 317,555 300,428 6Shareholders’ equity 1,581,372 1,525,609 4
Total capitalization $ 2,146,838 $ 2,256,721 -5Total debt as a percent of total capitalization 26.3% 32.4% —Shareholders’ equity per common share $ 20.80 $ 20.19 3Closing stock price $ 39.88 $ 38.81 3
Salaried employees 25,282 30,751 -18Craft/hourly employees 28,279 26,135 8
Total employees 53,561 56,886 -6
NM — Not meaningful.*Backlog does not reflect A.T. Massey Coal operations or certain Fluor Global Services business units.
Fiscal 1999 marked significant progress
towards achieving a number of impor-
tant objectives. We steered Fluor in a
new strategic direction to reposition the company as a knowledge-based
professional services and engineering, procurement and construction (EPC)
company, with a significant investment in low-sulfur coal.
R E P O S I T I O N I N G Fluor for enhanc ed
shar eho ld e r VALUE
Page 2
F l u o r C o r p o r a t i o n 19 9 9 A n n u a l R e p o r t
TO OUR SHAREHOLDERS
Fiscal 1999 was a disappointing year in terms of achieving earnings growth and
improving our return on investment. The environment was unfavorable for many
of our EPC and global services businesses and for Massey Coal. Initiatives to mit-
igate this difficult environment were successful and allowed us to achieve profit
expectations for the year. Net earnings, excluding the effect in total of a
special provision, were $204.7 million, or $2.70 per share, compared with $235.3
million, or $2.97 per share in 1998.
N e w S t r a t e g i c D i r e c t i o n
Our new strategic direction, which was announced in March, included a number
of components. The company has been realigned into four principal Strategic
Business Enterprises (SBE’s), each with clear performance accountability. Specific
actions included clarifying roles and responsibilities as we implemented our new
strategy, substantially reducing our costs, enhancing our project execution, and
increasing selectivity in the projects and customers we serve.
The company’s engineering and construction segment is now managed as
two distinct SBE’s: Fluor Daniel, which will focus purely on EPC opportunities;
and Fluor Global Services, a diverse, but integrated portfolio of services designed
to capitalize on increasing growth opportunities outside the traditional EPC value
chain. Fluor Constructors, Inc. continues in its role as the union craft arm of Fluor
Corporation. A.T. Massey, our Coal SBE, continues to focus on leveraging its
exceptional management and market position to enhance shareholder value through
emphasis on stronger cash flow and return on investment. Another SBE was cre-
ated with the formation of Fluor Signature Services (FSS). This new enterprise is
an important element of our new strategic direction and represents a new approach
to providing business and administrative support services to Fluor operating
units. By assigning responsibility for the delivery of these important services to
FSS, operating units are now able to devote their full
energies on their core business activities. Additionally,
the consolidation of business services within FSS
will reduce costs, improve quality standards, and over
time, provide an incremental earnings stream to the
corporation.
Other key milestones achieved in 1999 included
a reduction in gross overhead expenses by $160 million
annually which is expected to result in cost savings
beginning in 2000 of $100-120 million annually.
Accomplishing this goal required closure of non-
strategic offices and a reduction in personnel of
approximately 5,000. This cost reduction is expected
to translate into higher profit margins as our strategies
and more selective market focus begin to stimulate
renewed volume growth. A detailed business model
process was implemented throughout the company
to set priorities, assure financial discipline, enhance
accountability and establish a culture of financial
transparency. Meaningful progress was also achieved
in driving increased selectivity towards higher-margin
business opportunities. Selectivity is a continuing
strategy across the company and will be supported
by the recently formed global account management
organization, reporting directly to me. Their primary
objective is to broaden and strengthen relationships
with our most important clients.
We also launched two important initiatives that will
significantly impact our businesses in the coming years:
Knowledge@WorkSM
— a major revamping of our work
processes and information management systems that will
improve access to and use of company knowledge and
the timeliness of financial and operating information;
and a new brand architecture to create a visual identity
for our new company structure and competitive strat-
egy, linking our diverse range of services under the
Fluor name, while creating individual identities for
each of our Strategic Business Enterprises.
While much has been accomplished in 1999,
further improvement is required to achieve our goals
for sustained long-term earnings growth and higher
levels of profitability, leading to enhanced shareholder
value. We remain committed to our goals of achieving
a return on assets above our cost of capital and deliv-
ering earnings per share growth of at least 10 percent
annually. We are also committed to growing the capa-
bility of our organization individually and collectively
so that we can more profitably serve customer needs.
F i n a n c i a l C o n d i t i o n
Fluor’s financial condition remains strong, with both
our debt ratio and interest coverage supporting a solid
“A” investment grade credit rating. We significantly
reduced short-term debt during the year which lowered
our total debt to capitalization ratio to 26 percent from
32 percent a year ago. We are aggressively working to
reduce the level of assets employed in our businesses to
further enhance returns.
As a sign of our improving business outlook and
continuing financial strength, Fluor’s Board of Directors
declared a 25 percent increase in the quarterly divi-
dend for 2000 to 25 cents per share, compared with 20
cents in 1999. Additionally, our dividend policy was
changed for the first time in many years. The payout
Page 3
F l u o r C o r p o r a t i o n 19 9 9 A n n u a l R e p o r t
Page 4
offer attractive incremental revenue growth and
earnings for Fluor as the result of changing client
needs and the continuing trend toward outsourcing.
Importantly, Fluor Global Services has the potential
to significantly broaden our participation in our clients’
total spending across the entire life cycle of their asset
base. The majority of the services provided by Fluor
Global Services have a more stable and predictable earn-
ings pattern which should help mitigate the more cycli-
cal nature of our traditional EPC business.
We are particularly encouraged by the outstand-
ing growth potential for Fluor Global Services’
Telecommunications unit, which was awarded several
key contracts in 1999, with significant additional work
anticipated in 2000. The Operations & Maintenance unit
is also benefiting from its new strategic approach to
delivering value in this large and growing market.
A . T. M a s s e y C o a l
A.T. Massey delivered commendable performance in
1999 despite an extremely challenging coal market.
They are an acknowledged leader in the U.S. coal
industry and continue to outperform industry peers
on virtually every criteria, from financial results to
safety performance.
Global economic conditions, unfavorable currency
exchange rates, and mild weather created difficult con-
ditions in both Massey’s steam coal and higher-margin
metallurgical coal markets. This resulted in softened
demand and deteriorating prices for coal. To offset these
conditions, Massey implemented a number of opera-
tional changes to reduce costs and maintain operating
margins, as well as optimize return on assets. As the
lowest cost producer in its geographic market, Massey
is much better positioned to withstand these difficult
times than its competition.
F l u o r C o r p o r a t i o n 19 9 9 A n n u a l R e p o r t
guideline was increased to 30-35 percent of earnings
from the previous 25-30 percent, and will now be based
on long-term operating performance expectations.
Previously, our dividend payout was based on the
company’s prior year’s earnings performance.
F l u o r D a n i e l
Faced with continuing weakness in several global
economic markets and abnormally low oil prices at the
beginning of 1999, Fluor Daniel implemented actions
to mitigate the effects of a deteriorating business envi-
ronment, as well as steps to reposition the company
for long-term profitability and growth. Marketing and
sales efforts were focused on a narrower client base
where differentiated value could be delivered, offering
higher margin potential. Backlog and new awards
declined in 1999, as expected from a year ago, pri-
marily reflecting the market slow down experienced
over the past two years, along with our emphasis on
improving margins. However, increased selectivity,
accompanied by cost reductions and increased account-
ability, began to produce positive results. Reported
gross margin, along with new awards and backlog gross
margins, all achieved meaningful improvement in 1999.
Continuing improvement in global economic conditions
which are favorable to increased capital spending by
clients is creating growing optimism for new business
in 2000 and beyond.
F l u o r G l o b a l S e r v i c e s
Formed in 1999, Fluor Global Services brings together
a variety of non-EPC services capabilities. These services

I am confident that we are moving well down the
path to realize the potential we envision from our new
strategic direction.
Lastly, let me add my appreciation for the support
and confidence of our shareholders who have stayed
with us through our transition to a new Fluor in the
new millennium.
Philip J. Carroll, Jr.
Chairman and Chief Executive OfficerJanuary 13, 2000
Page 5
F l u o r C o r p o r a t i o n 19 9 9 A n n u a l R e p o r t
F l u o r S i g n a t u r e S e r v i c e s
Fluor Signature Services is our newest Strategic Business
Enterprise. It officially began operations at the start of
2000. Created as a distinct enterprise with profit-and-
loss accountability, its charter is to provide business
and administration support services to Fluor’s operat-
ing units. Their immediate goal is to help the corpo-
ration further reduce costs, streamline work processes
and to identify and measure where value is created
within the company.
M a n a g e m e n t C h a n g e s
As part of the organizational restructuring, Alan
Boeckmann has assumed leadership of Fluor Daniel,
Jim Stein is now leading Fluor Global Services, and
Don Blankenship continues to lead A.T. Massey Coal.
Jim Rollans, our former chief financial officer, is head-
ing up Fluor Signature Services.
In June, we were pleased to welcome Ralph Hake
as executive vice president and chief financial officer, suc-
ceeding Jim Rollans. Ralph joins us from Whirlpool
where he served since 1987, overseeing various global
business and financial operations, most recently as senior
executive vice president and chief financial officer.
T h a n k Yo u
I would like to extend my personal appreciation to our
board of directors and employees for the tremendous
effort that has been undertaken to reposition our
company and achieve our goal to deliver improved
shareholder value in the years to come.
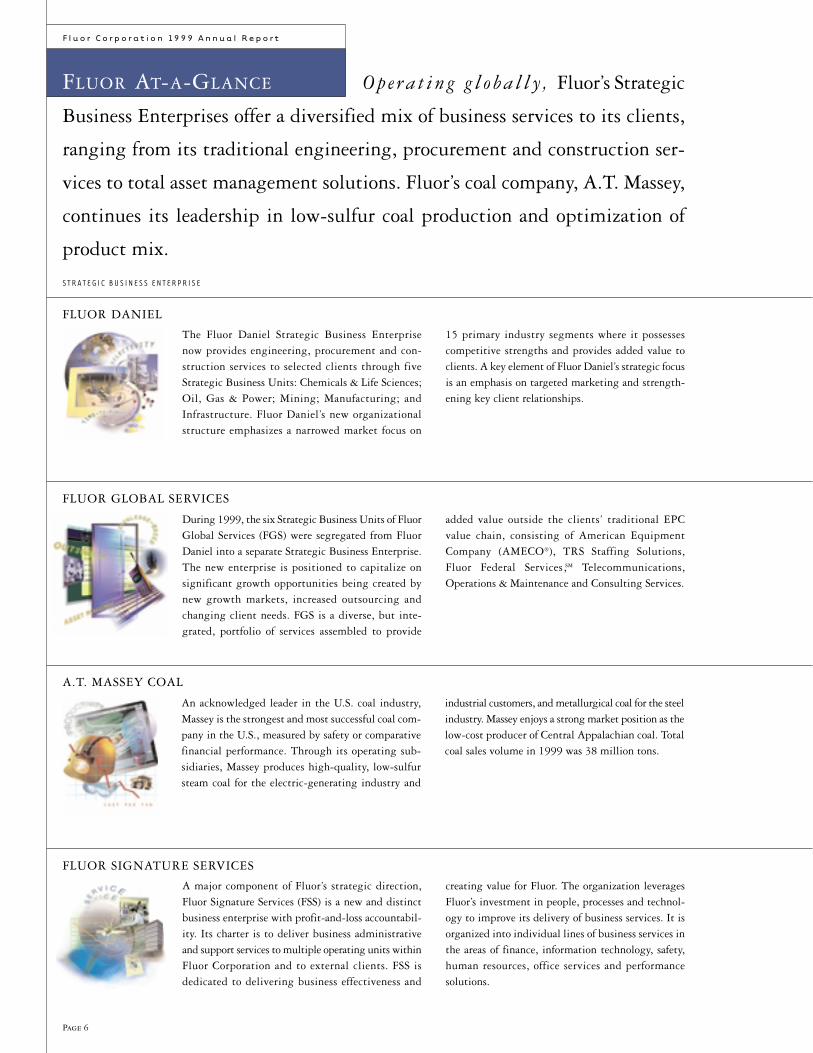
Op e ra t i n g g l o ba l l y, Fluor’s Strategic
Business Enterprises offer a diversified mix of business services to its clients,
ranging from its traditional engineering, procurement and construction ser-
vices to total asset management solutions. Fluor’s coal company, A.T. Massey,
continues its leadership in low-sulfur coal production and optimization of
product mix.
Page 6
F l u o r C o r p o r a t i o n 19 9 9 A n n u a l R e p o r t
The Fluor Daniel Strategic Business Enterprise now provides engineering, procurement and con-struction services to selected clients through fiveStrategic Business Units: Chemicals & Life Sciences;Oil, Gas & Power; Mining; Manufacturing; andInfrastructure. Fluor Daniel’s new organizational structure emphasizes a narrowed market focus on
15 primary industry segments where it possesses competitive strengths and provides added value toclients. A key element of Fluor Daniel’s strategic focusis an emphasis on targeted marketing and strength-ening key client relationships.
FLUOR AT-A-GLANCE
FLUOR DANIEL
During 1999, the six Strategic Business Units of FluorGlobal Services (FGS) were segregated from FluorDaniel into a separate Strategic Business Enterprise.The new enterprise is positioned to capitalize on significant growth opportunities being created bynew growth markets, increased outsourcing and changing client needs. FGS is a diverse, but inte-grated, portfolio of services assembled to provide
added value outside the clients’ traditional EPC value chain, consisting of American EquipmentCompany (AMECO®), TRS Staffing Solutions, Fluor Federal Services,SM Telecommunications,Operations & Maintenance and Consulting Services.
FLUOR GLOBAL SERVICES
An acknowledged leader in the U.S. coal industry,Massey is the strongest and most successful coal com-pany in the U.S., measured by safety or comparativefinancial performance. Through its operating sub-sidiaries, Massey produces high-quality, low-sulfursteam coal for the electric-generating industry and
industrial customers, and metallurgical coal for the steelindustry. Massey enjoys a strong market position as thelow-cost producer of Central Appalachian coal. Totalcoal sales volume in 1999 was 38 million tons.
A.T. MASSEY COAL
A major component of Fluor’s strategic direction,Fluor Signature Services (FSS) is a new and distinctbusiness enterprise with profit-and-loss accountabil-ity. Its charter is to deliver business administrativeand support services to multiple operating units withinFluor Corporation and to external clients. FSS is dedicated to delivering business effectiveness and
creating value for Fluor. The organization leveragesFluor’s investment in people, processes and technol-ogy to improve its delivery of business services. It isorganized into individual lines of business services inthe areas of finance, information technology, safety,human resources, office services and performance solutions.
FLUOR SIGNATURE SERVICES
S T R A T E G I C B U S I N E S S E N T E R P R I S E
F l u o r C o r p o r a t i o n 19 9 9 A n n u a l R e p o r t
Page 7
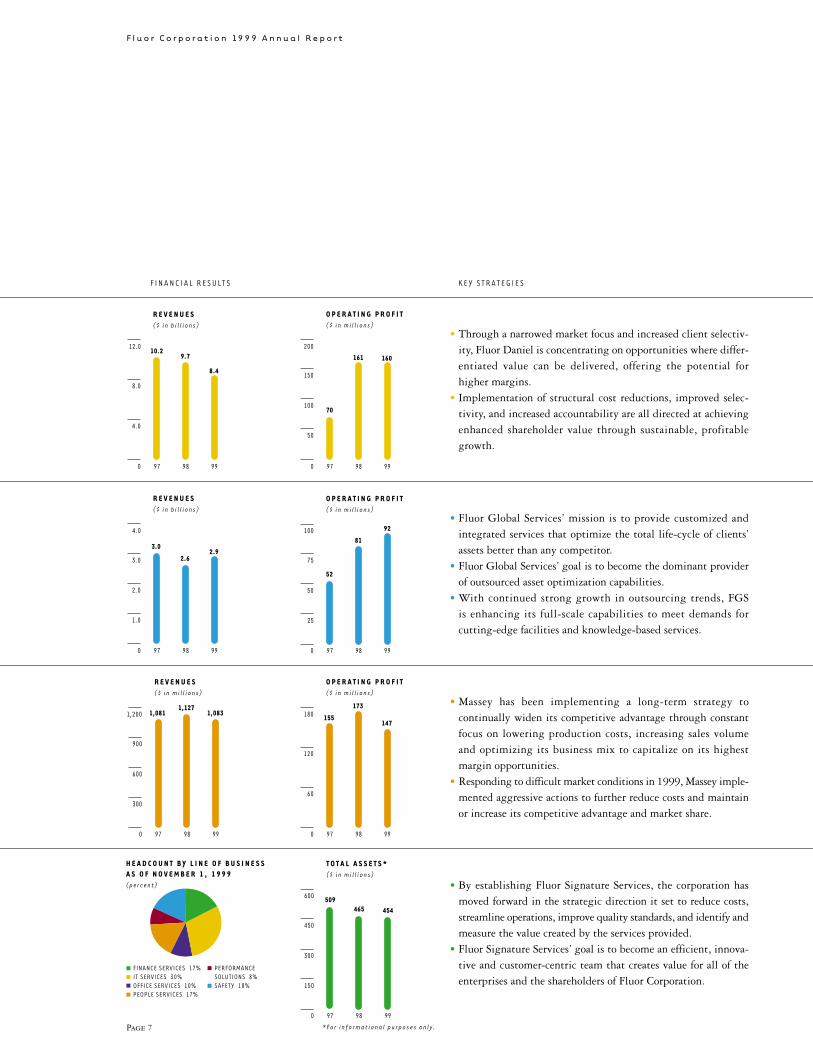
• Fluor Global Services’ mission is to provide customized and integrated services that optimize the total life-cycle of clients’ assets better than any competitor.
• Fluor Global Services’ goal is to become the dominant providerof outsourced asset optimization capabilities.
• With continued strong growth in outsourcing trends, FGS is enhancing its full-scale capabilities to meet demands for cutting-edge facilities and knowledge-based services.
• Through a narrowed market focus and increased client selectiv-ity, Fluor Daniel is concentrating on opportunities where differ-entiated value can be delivered, offering the potential for higher margins.
• Implementation of structural cost reductions, improved selec-tivity, and increased accountability are all directed at achievingenhanced shareholder value through sustainable, profitable growth.
• Massey has been implementing a long-term strategy to continually widen its competitive advantage through constant focus on lowering production costs, increasing sales volume and optimizing its business mix to capitalize on its highest margin opportunities.
• Responding to difficult market conditions in 1999, Massey imple-mented aggressive actions to further reduce costs and maintainor increase its competitive advantage and market share.
• By establishing Fluor Signature Services, the corporation hasmoved forward in the strategic direction it set to reduce costs,streamline operations, improve quality standards, and identify andmeasure the value created by the services provided.
• Fluor Signature Services’ goal is to become an efficient, innova-tive and customer-centric team that creates value for all of the enterprises and the shareholders of Fluor Corporation.
R E V E N U E S �( $ i n b i l l i o n s ) �
�
970
4.0
8.0
12.0
8.4
9.710.2
98 99
�O P E R A T I N G P R O F I T �( $ i n m i l l i o n s ) �
�
970
50
100
150
200
160161
70
98 99
R E V E N U E S �( $ i n b i l l i o n s ) �
�
970
2.0
1.0
3.0
4.0
2.92.6
3.0
98 99
�O P E R A T I N G P R O F I T �( $ i n m i l l i o n s ) �
�
970
50
25
75
100 92
81
52
98 99
�R E V E N U E S �( $ i n m i l l i o n s ) �
�
970
600
300
900
1,200 1,0831,127
1,081
98 99
�O P E R A T I N G P R O F I T �( $ i n m i l l i o n s ) �
�
970
60
120
180147
173
155
98 99
�H E A D C O U N T B Y L I N E O F B U S I N E S S �A S O F N O V E M B E R 1 , 1 9 9 9 �( p e r c e n t ) �
�
FINANCE SERVICES 17%�IT SERVICES 30%�OFFICE SERVICES 10%�PEOPLE SERVICES 17%��
PERFORMANCE�SOLUTIONS 8%�SAFETY 18%��
�T O T A L A S S E T S * �( $ i n m i l l i o n s ) �
�
970
300
150
450
600
465509
454
98 99
* F o r i n f o r m a t i o n a l p u r p o s e s o n l y.
F I N A N C I A L R E S U LT S K E Y S T R A T E G I E S

F l u o r C o r p o r a t i o n 19 9 9 A n n u a l R e p o r t
Page 8
During f i s ca l 1999, Fluor Daniel,
Fluor’s engineering, procurement and construction business, underwent
significant change with the implementation of a new strategic direction
to enhance its long-term earnings power and growth potential. Extensive
analysis of clients’ changing needs, historical profitability of individual client
relationships and Fluor Daniel’s competitive strengths led the company
to narrow its market focus and concentrate on fewer clients but with greater
value-added potential for improved profitability.
FLUOR DANIEL
F l u o r C o r p o r a t i o n 19 9 9 A n n u a l R e p o r t
Page 9
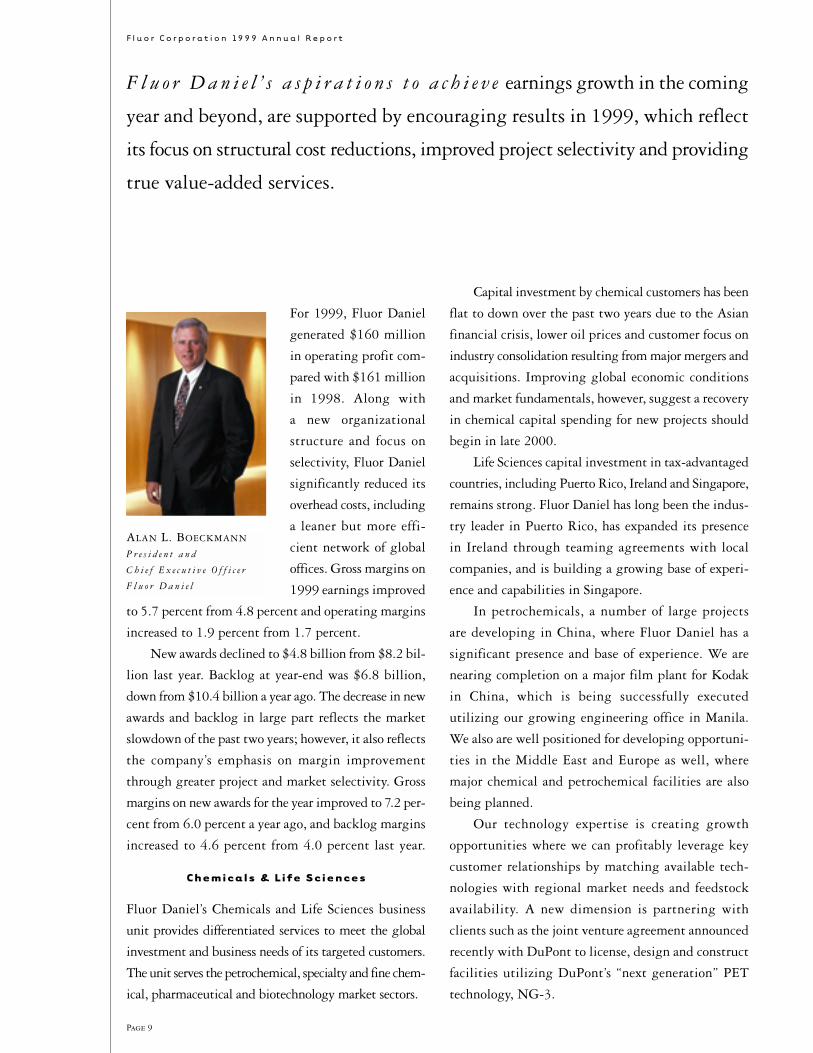
For 1999, Fluor Daniel
generated $160 million
in operating profit com-
pared with $161 million
in 1998. Along with
a new organizational
structure and focus on
selectivity, Fluor Daniel
significantly reduced its
overhead costs, including
a leaner but more effi-
cient network of global
offices. Gross margins on
1999 earnings improved
to 5.7 percent from 4.8 percent and operating margins
increased to 1.9 percent from 1.7 percent.
New awards declined to $4.8 billion from $8.2 bil-
lion last year. Backlog at year-end was $6.8 billion,
down from $10.4 billion a year ago. The decrease in new
awards and backlog in large part reflects the market
slowdown of the past two years; however, it also reflects
the company’s emphasis on margin improvement
through greater project and market selectivity. Gross
margins on new awards for the year improved to 7.2 per-
cent from 6.0 percent a year ago, and backlog margins
increased to 4.6 percent from 4.0 percent last year.
C h e m i c a l s & L i f e S c i e n c e s
Fluor Daniel’s Chemicals and Life Sciences business
unit provides differentiated services to meet the global
investment and business needs of its targeted customers.
The unit serves the petrochemical, specialty and fine chem-
ical, pharmaceutical and biotechnology market sectors.
F l u o r D a n i e l ’ s a s p i r a t i o n s t o a c h i e v e earnings growth in the coming
year and beyond, are supported by encouraging results in 1999, which reflect
its focus on structural cost reductions, improved project selectivity and providing
true value-added services.
ALAN L. BOECKMANN
P r e s i d e n t a n d
C h i e f E x e c u t i v e O f f i c e r
F l u o r D a n i e l
Capital investment by chemical customers has been
flat to down over the past two years due to the Asian
financial crisis, lower oil prices and customer focus on
industry consolidation resulting from major mergers and
acquisitions. Improving global economic conditions
and market fundamentals, however, suggest a recovery
in chemical capital spending for new projects should
begin in late 2000.
Life Sciences capital investment in tax-advantaged
countries, including Puerto Rico, Ireland and Singapore,
remains strong. Fluor Daniel has long been the indus-
try leader in Puerto Rico, has expanded its presence
in Ireland through teaming agreements with local
companies, and is building a growing base of experi-
ence and capabilities in Singapore.
In petrochemicals, a number of large projects
are developing in China, where Fluor Daniel has a
significant presence and base of experience. We are
nearing completion on a major film plant for Kodak
in China, which is being successfully executed
utilizing our growing engineering office in Manila.
We also are well positioned for developing opportuni-
ties in the Middle East and Europe as well, where
major chemical and petrochemical facilities are also
being planned.
Our technology expertise is creating growth
opportunities where we can profitably leverage key
customer relationships by matching available tech-
nologies with regional market needs and feedstock
availability. A new dimension is partnering with
clients such as the joint venture agreement announced
recently with DuPont to license, design and construct
facilities utilizing DuPont’s “next generation” PET
technology, NG-3.
F l u o r C o r p o r a t i o n 19 9 9 A n n u a l R e p o r t
Page 10
O i l , G a s & Po w e r
Fluor Daniel’s Oil, Gas and Power business is an inte-
grated services supplier to a broad spectrum of energy
industries, ranging from upstream production and refin-
ing to power generation, and all of the business activ-
ities which increasingly link these related areas.
While soft market conditions existed in early 1999
for the traditional energy business due to low oil prices
and an uncertain global economic outlook, the domes-
tic power market gained momentum. Increasing global
demand for energy, coupled with a recovery in oil prices
and increasing demand for power, are creating good
growth prospects.
There are signs of recovery in the upstream mar-
ket for new oil and gas production. For example, we
were awarded a contract to provide engineering and
procurement services for the Bayu Undan offshore oil
facilities in the Timor Sea. Additionally, our work
continues on various pipeline projects in the Caspian
Sea region. Advancements in technologies have
improved the economics for development of oil sands,
and we are in various stages of work with most of the
major oil sands producers in Canada.
Our strong technology expertise in clean fuels also
offers near-term opportunities. Significant experience
on prior clean fuels projects with California refineries
is providing a distinct advantage as the U.S. federal
government, Canada and various European environ-
mental protection agencies follow California’s early
lead. Additionally, we have been selected by Phillips
Petroleum to build the pilot plant for its new clean-fuels
technology process.
Pent-up demand and deregulation has created a
robust market for new power generation facilities in the
U.S. and selected international markets. Duke/Fluor
Daniel, our joint venture company serving this market,
is well established with a strong record of experience
and a growing list of repeat clients. Duke/Fluor
Daniel was awarded seven new power generation
facilities in 1999, and was released to proceed on a
454-megawatt coal-fired power plant in Puerto Rico
shortly after fiscal year-end.
M i n i n g
Fluor Daniel’s business unit serving the mining indus-
try implemented significant change in 1999 to address
disappointing performance in recent years and a severe
cyclical downturn in its global market. The organiza-
tion has been restructured, overhead costs substantially
reduced and a more selective approach to future busi-
ness opportunities has been implemented.
A key objective is to cultivate and strengthen
relationships with selected clients and to broaden our
services to meet their asset management needs. Utilizing
an account management approach and increasing the
depth of our understanding of the business needs
of a select customer group, we can increase our
opportunities to deliver knowledge-based solutions.
Our goal is to become a full-service partner for our
best clients.
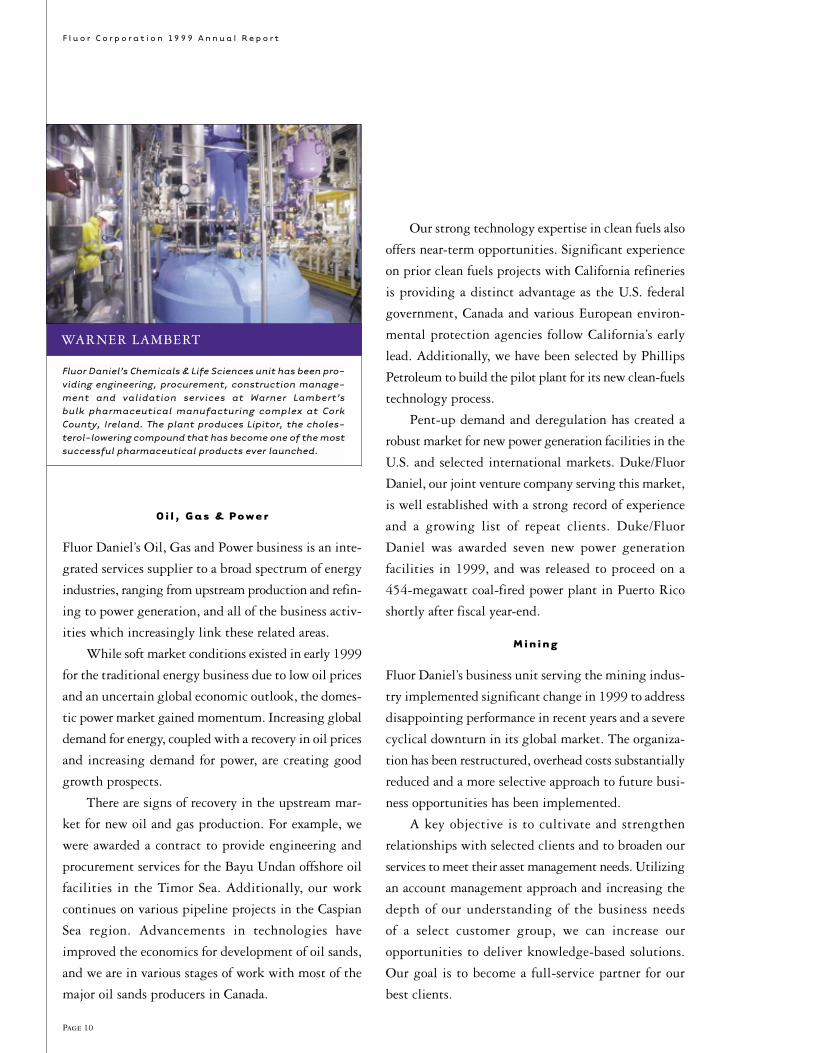
WARNER LAMBERT
Fluor Daniel’s Chemicals & Life Sciences unit has been pro-viding engineering, procurement, construction manage-ment and validation services at Warner Lambert’s bulk pharmaceutical manufacturing complex at CorkCounty, Ireland. The plant produces Lipitor, the choles-terol-lowering compound that has become one of the mostsuccessful pharmaceutical products ever launched.
construction management for pharmaceutical and
biotechnology facilities.
The Manufacturing unit offers a value proposition
to targeted clients which is focused on being the
lowest total cost supplier of services with certainty of
function, cost and schedule. Fluor Daniel is particularly
well positioned to assist clients who are moving to a
global production platform and are striving to improve
their productivity and return on assets by operating
under a total cost of ownership business model.
A key challenge for many manufacturing customers
is to deliver continuing revenue growth in an increas-
ingly competitive environment. They can leverage
Fluor Daniel’s global reach and differentiated skill
sets to capitalize on growth opportunities in emerging
markets and reduce schedules to bring new products
to market more rapidly. The Manufacturing unit is
investing in the development of methodologies and
technologies, which focus on compressing traditional
project schedules, increasing yield and facilitating
modifications to existing facilities to produce new
products.
The microelectronics market offers particularly
strong growth potential. Demand has now caught up
with supply, prices are firming and advances in tech-
nology are fueling new investment. Fluor Daniel is
recognized as a major supplier of services to this attrac-
tive, high-growth market, and is working closely with
a number of large, key customers. During 1999, Fluor
Daniel was awarded contracts for a major wafer fabri-
cation facility in Malaysia, and for a major micro-
electronics facility in the Philippines. Significant new
project opportunities are developing worldwide with
the outlook for strong investment by microelectronics
manufacturers over the next several years.
F l u o r C o r p o r a t i o n 19 9 9 A n n u a l R e p o r t
Page 11
The highly cyclical mining industry has been in a
significant downturn, exacerbated by the dramatic drop
in Asian demand, while significant new production
capacity was coming onstream. Improving metals prices
suggest a long-term recovery is now beginning which
is resulting in an increased level of studies and overall
proposal activity. Unlike many Fluor Daniel markets,
there remain relatively few global competitors, partic-
ularly with the capability to handle large, complex and
frequently remote mining projects.
The prospects for new business opportunities is
encouraging with renewed development of copper, gold
and silver projects in South America and iron ore and
laterite-nickel projects in Australia, both markets where
Fluor Daniel has recognized experience and market
presence. Another area of emerging opportunity is
southern Africa, where Fluor Daniel recently was
awarded a contract for a small gold mine project.
M a n u f a c t u r i n g
Fluor Daniel provides engineering and construction
services to manufacturing clients around the world,
primarily in the consumer products, food and bever-
age and microelectronics industries. Additionally, the
Manufacturing unit has specialized expertise in
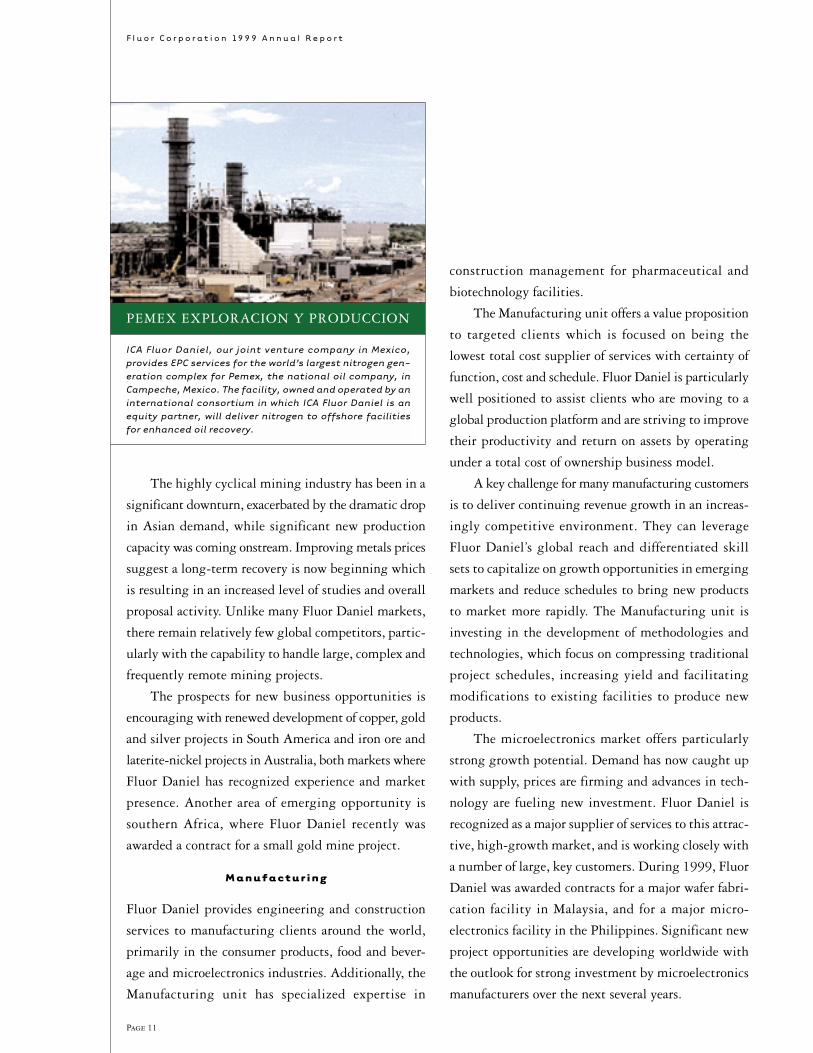
PEMEX EXPLORACION Y PRODUCCION
ICA Fluor Daniel, our joint venture company in Mexico, provides EPC services for the world’s largest nitrogen gen-eration complex for Pemex, the national oil company, inCampeche, Mexico. The facility, owned and operated by aninternational consortium in which ICA Fluor Daniel is anequity partner, will deliver nitrogen to offshore facilitiesfor enhanced oil recovery.
F l u o r C o r p o r a t i o n 19 9 9 A n n u a l R e p o r t
Page 12
I n f r a s t r u c t u r e
Fluor Daniel’s Infrastructure business unit has estab-
lished a strong reputation and market presence work-
ing on large, highly selective projects. Fluor Daniel’s
program management, financing expertise, problem
solving and partnership management skills have added
considerable value to these projects.
In the U.S., funding from the $200+ billion federal
transportation bill, known as TEA 21, is now begin-
ning to stimulate new programs and projects across
the country. During 1999, Fluor Daniel was awarded
the second phase of the Conway Bypass project in South
Carolina, and was also selected by the South Carolina
Department of Transportation to provide construction
and resource management support for the statewide
highway development program. South Carolina’s inno-
vative approach to road construction is a model being
emulated by several other states.
Additionally, a number of significant rail projects,
utilizing the public/private partnering model, are now
being aggressively developed in Europe. Fluor Daniel
is focused on opportunities which fit its selectivity
criteria in the United Kingdom and The Netherlands,
where we have a strong local presence. A Fluor Daniel
joint venture with Mott MacDonald has been prelim-
inarily selected by Britain’s Railtrack as one of three pri-
mary suppliers of program management services for a
more than $2 billion performance improvement pro-
ject on one of the U.K.’s most heavily traveled rail lines.
These sizable and complex rail projects are long-term
in nature and include operations and maintenance
opportunities which offer the potential of a predictable
earnings stream over many years.
Additional opportunities are developing for expan-
sions at major international airports where continued
increases in global air traffic has taxed capacity. Fluor
Daniel is program manager for a major expansion pro-
ject at JFK International airport and is tracking a num-
ber of possible new prospects.
F l u o r C o n s t r u c t o r s I n t e r n a t i o n a l
Fluor Constructors International, Inc. (FCII) is the
union craft arm of Fluor Corporation, providing con-
struction management and direct-hire construction
expertise to Fluor Daniel and other companies in North
America. Additionally, FCII staffs international pro-
jects and has employees working around the world.
FCII has executed projects in virtually every busi-
ness sector, performing stand-alone construction and pro-
viding maintenance services to clients in the United
States and Canada. The company has served a diverse
range of government agencies as well. FCII is one of only
a few construction and maintenance contractors to be
ISO-9002 certified.
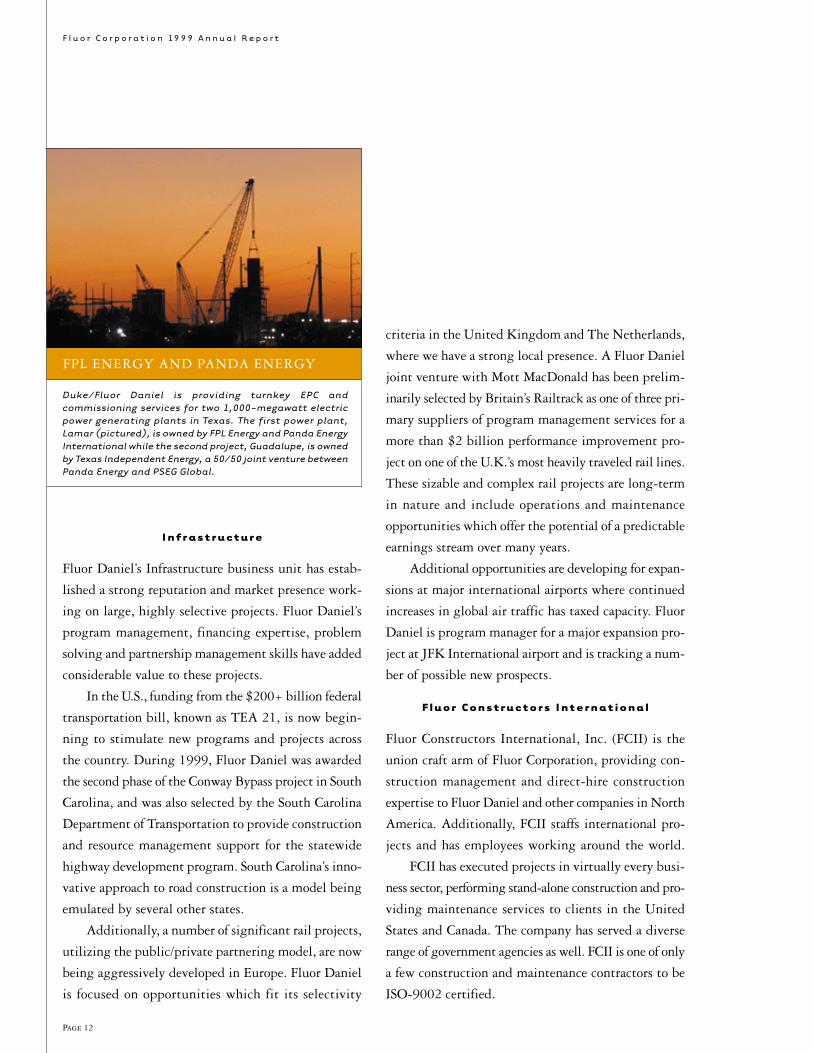
Duke/Fluor Daniel is providing turnkey EPC and commissioning services for two 1,000-megawatt electricpower generating plants in Texas. The first power plant,Lamar (pictured), is owned by FPL Energy and Panda EnergyInternational while the second project, Guadalupe, is ownedby Texas Independent Energy, a 50/50 joint venture betweenPanda Energy and PSEG Global.
FPL ENERGY AND PANDA ENERGY

Page 13
Work i n g c l o s e l y with its clients,
Fluor Global Services provides a full range of leading edge business asset and
operations management solutions – including operations, maintenance and
consulting services; construction and industrial equipment; contract and
direct-hire personnel and training; and program and asset management ser-
vices to industries around the world – with the goal of becoming the dom-
inant provider of outsourced asset optimization capabilities.
F l u o r C o r p o r a t i o n 19 9 9 A n n u a l R e p o r t
FLUOR GLOBAL SERVICES
F l u o r C o r p o r a t i o n 19 9 9 A n n u a l R e p o r t
Page 14
During 1999, Fluor
Daniel’s Diversified Serv-
ices Group underwent a
significant restructuring
and transitioned from
being a division of Fluor
Daniel to a separate Stra-
tegic Business Enterprise.
Renamed Fluor Global
Services (FGS), the new
enterprise is well posi-
tioned to capitalize on
significant growth oppor-
tunities being created
by new and changing client needs. FGS is a diverse, but
integrated, services portfolio of six Strategic Business
Units assembled to provide value-added services out-
side the clients’ traditional EPC value chain, consist-
ing of American Equipment Company, TRS Staffing
Solutions, Fluor Federal Services, Telecommunications,
Operations & Maintenance and Consulting Services.
Operating profits for FGS increased 13 percent in
1999 to $92 million compared to $81 million in 1998.
Annual new awards grew 12 percent over last year,
with gross margins increasing to 7.8 percent from 7.6
percent in 1998. Backlog increased by 6 percent, with
gross margins declining slightly to 6.1 percent from 6.4
percent a year ago.
The future offers significant opportunity at a time
when outsourcing non-core activities by clients is gain-
ing increased momentum, as they focus on their core
businesses and look for creative and cost-competitive
approaches to improve productivity and return on assets.
As clients restructure their in-house capabilities, Fluor
Global Services’ ability to deliver tailored solutions to
The Mis s i on o f Fluor Global S e rv i c e s is to assist every client in achiev-
ing a sustainable competitive advantage and profit growth by providing
customized and integrated services that optimize the total life-cycle of their
assets better than any competitor.
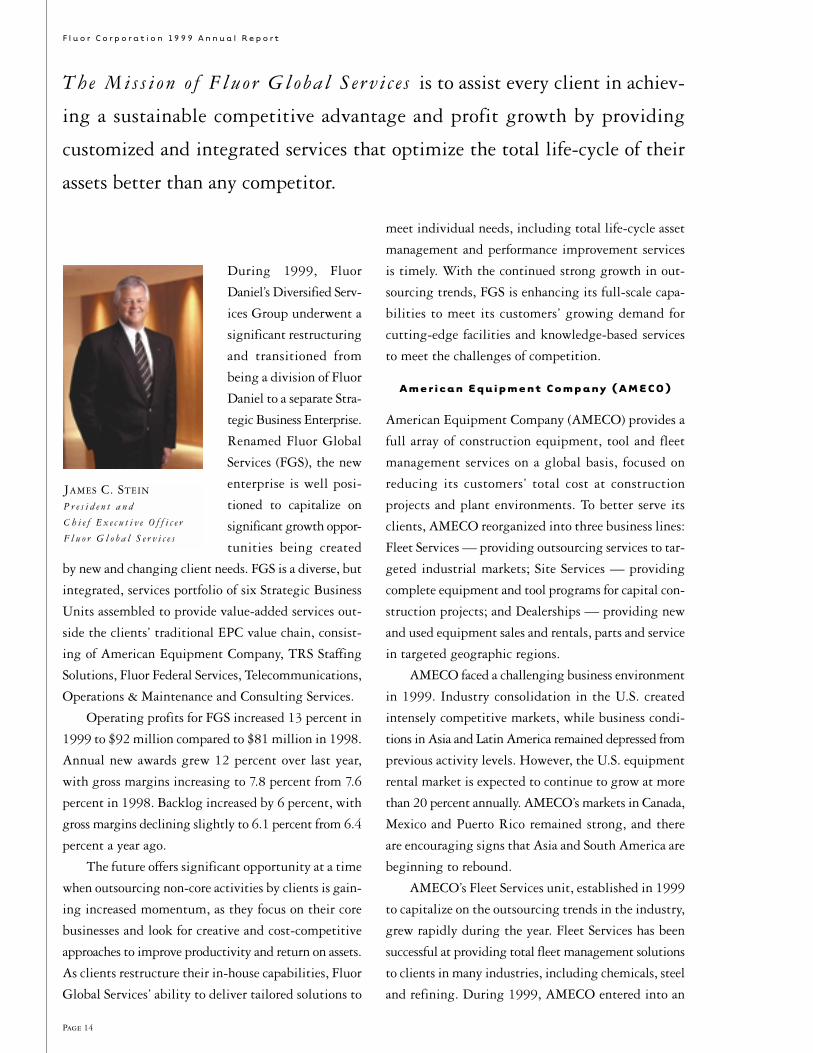
JAMES C. STEIN
P r e s i d e n t a n d
C h i e f E x e c u t i v e O f f i c e r
F l u o r G l o b a l S e r v i c e s
meet individual needs, including total life-cycle asset
management and performance improvement services
is timely. With the continued strong growth in out-
sourcing trends, FGS is enhancing its full-scale capa-
bilities to meet its customers’ growing demand for
cutting-edge facilities and knowledge-based services
to meet the challenges of competition.
A m e r i c a n E q u i p m e n t C o m p a n y ( A M E C O )
American Equipment Company (AMECO) provides a
full array of construction equipment, tool and fleet
management services on a global basis, focused on
reducing its customers’ total cost at construction
projects and plant environments. To better serve its
clients, AMECO reorganized into three business lines:
Fleet Services — providing outsourcing services to tar-
geted industrial markets; Site Services — providing
complete equipment and tool programs for capital con-
struction projects; and Dealerships — providing new
and used equipment sales and rentals, parts and service
in targeted geographic regions.
AMECO faced a challenging business environment
in 1999. Industry consolidation in the U.S. created
intensely competitive markets, while business condi-
tions in Asia and Latin America remained depressed from
previous activity levels. However, the U.S. equipment
rental market is expected to continue to grow at more
than 20 percent annually. AMECO’s markets in Canada,
Mexico and Puerto Rico remained strong, and there
are encouraging signs that Asia and South America are
beginning to rebound.
AMECO’s Fleet Services unit, established in 1999
to capitalize on the outsourcing trends in the industry,
grew rapidly during the year. Fleet Services has been
successful at providing total fleet management solutions
to clients in many industries, including chemicals, steel
and refining. During 1999, AMECO entered into an
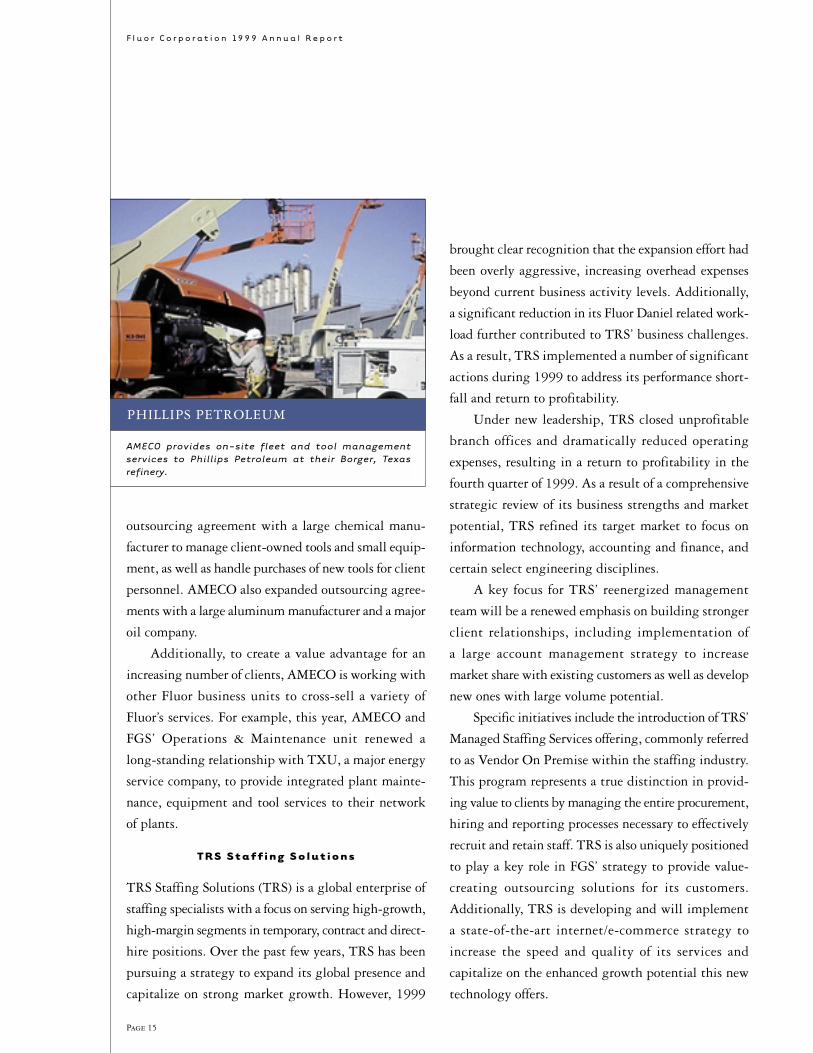
F l u o r C o r p o r a t i o n 19 9 9 A n n u a l R e p o r t
Page 15
outsourcing agreement with a large chemical manu-
facturer to manage client-owned tools and small equip-
ment, as well as handle purchases of new tools for client
personnel. AMECO also expanded outsourcing agree-
ments with a large aluminum manufacturer and a major
oil company.
Additionally, to create a value advantage for an
increasing number of clients, AMECO is working with
other Fluor business units to cross-sell a variety of
Fluor’s services. For example, this year, AMECO and
FGS’ Operations & Maintenance unit renewed a
long-standing relationship with TXU, a major energy
service company, to provide integrated plant mainte-
nance, equipment and tool services to their network
of plants.
T R S S t a f f i n g S o l u t i o n s
TRS Staffing Solutions (TRS) is a global enterprise of
staffing specialists with a focus on serving high-growth,
high-margin segments in temporary, contract and direct-
hire positions. Over the past few years, TRS has been
pursuing a strategy to expand its global presence and
capitalize on strong market growth. However, 1999
PHILLIPS PETROLEUM
AMECO provides on-site fleet and tool management services to Phillips Petroleum at their Borger, Texas refinery.
brought clear recognition that the expansion effort had
been overly aggressive, increasing overhead expenses
beyond current business activity levels. Additionally,
a significant reduction in its Fluor Daniel related work-
load further contributed to TRS’ business challenges.
As a result, TRS implemented a number of significant
actions during 1999 to address its performance short-
fall and return to profitability.
Under new leadership, TRS closed unprofitable
branch offices and dramatically reduced operating
expenses, resulting in a return to profitability in the
fourth quarter of 1999. As a result of a comprehensive
strategic review of its business strengths and market
potential, TRS refined its target market to focus on
information technology, accounting and finance, and
certain select engineering disciplines.
A key focus for TRS’ reenergized management
team will be a renewed emphasis on building stronger
client relationships, including implementation of
a large account management strategy to increase
market share with existing customers as well as develop
new ones with large volume potential.
Specific initiatives include the introduction of TRS’
Managed Staffing Services offering, commonly referred
to as Vendor On Premise within the staffing industry.
This program represents a true distinction in provid-
ing value to clients by managing the entire procurement,
hiring and reporting processes necessary to effectively
recruit and retain staff. TRS is also uniquely positioned
to play a key role in FGS’ strategy to provide value-
creating outsourcing solutions for its customers.
Additionally, TRS is developing and will implement
a state-of-the-art internet/e-commerce strategy to
increase the speed and quality of its services and
capitalize on the enhanced growth potential this new
technology offers.
F l u o r C o r p o r a t i o n 19 9 9 A n n u a l R e p o r t
Page 16
F l u o r F e d e r a l S e r v i c e s
Fluor Federal Services (FFS) provides a range of
services to the United States Federal Government that
include project management execution, business
management systems, architectural and engineering
services, construction and construction management.
Through FFS, federal clients receive innovative
solutions such as concept to closure planning and
execution, unique cost effective approaches to contract
structuring, best commercial practices, outsourcing
and economic transition expertise.
FFS is a major contractor for the Department of
Energy (DOE) including prime contractor roles at the
DOE’s Hanford, Washington and Fernald, Ohio sites
where remediation of these former nuclear weapons
plants is taking place. FFS is now a recognized leader
in this market because of its experiences and success on
these two key projects. The national need for manage-
ment of the DOE sites contributes to a large market that
has more predictability and level budgets than many
other markets. The unit intends to increase its share of
the $10 billion DOE market.
FFS also works with the Department of Defense
through its Logistical Civil Augmentation contract,
where FFS was called upon to help build installations
in East Timor, and with the Federal Emergency
Management Agency through a Technical Assistance
Contract. Successful experience with these govern-
ment agencies has demonstrated the unit’s capacity
to respond to clients’ needs and has helped validate
FFS’ strategy of selling its services to these and other
federal customers on a greatly expanded level.
FFS will maintain a focus on prime contract
management along with traditional engineering,
procurement, construction and operational opportuni-
ties in carefully selected situations. Participation as a
team member in strategic alliances is also pursued to
address specific project opportunities.
Te l e c o m m u n i c a t i o n s
FGS’ Telecommunications unit is establishing itself as
a leading provider of program management services
for the rapidly expanding global telecommunications
market. Following a comprehensive restructuring of
its sales and marketing strategy, Telecommunications
delivered outstanding performance in 1999, winning
more than $600 million in new awards compared with
an average of $150 million for the previous three years.
These results were achieved by limiting bid and pro-
posal activity in favor of a strategic account manage-
ment process, which focused on selected key clients to
build a sustainable, profitable business.
The Telecommunications unit has been encour-
aged by its results from being selective, as world-class
clients have chosen the unit as their implementation
management partner of choice. Level 3 Communications
selected Telecommunications for a $320 million pro-
ject to manage its Local Loop IP Network buildout of
fiber-optic cable and point-of-presence units, which
has been primarily fueled by the growth of the Internet.
The unit also expanded its involvement with AT&T
to include a broad service offering to AT&T Fixed
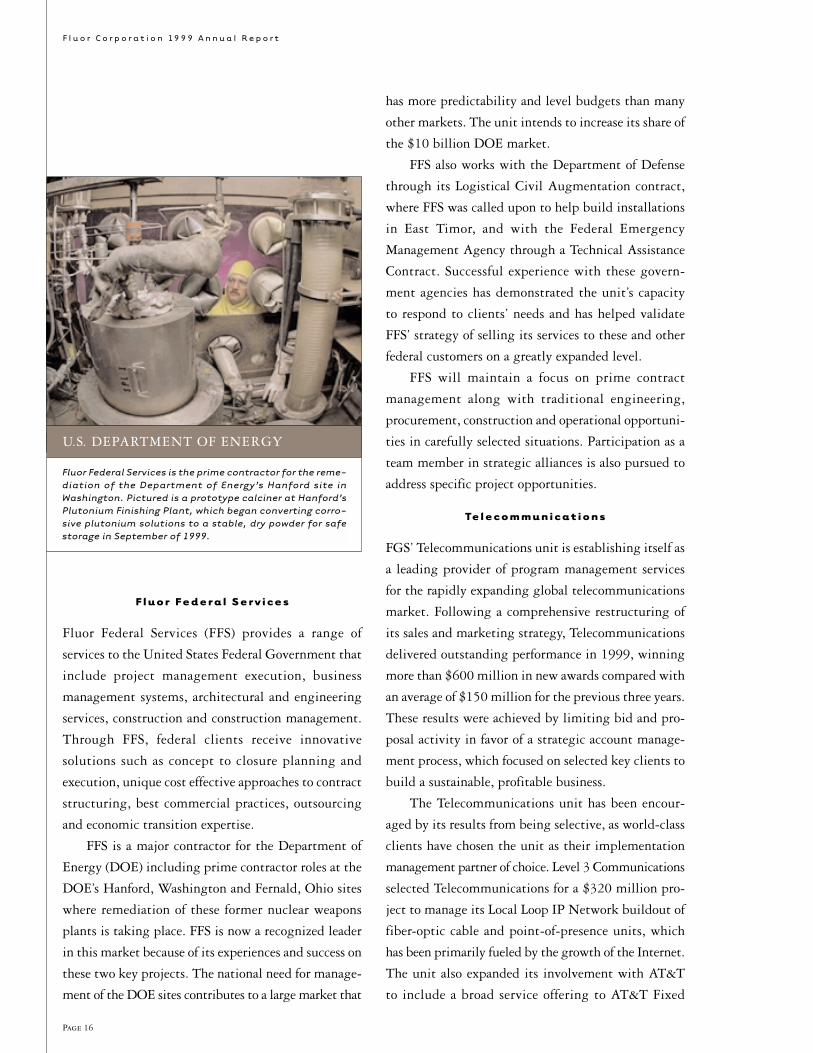
U.S. DEPARTMENT OF ENERGY
Fluor Federal Services is the prime contractor for the reme-diation of the Department of Energy’s Hanford site inWashington. Pictured is a prototype calciner at Hanford’sPlutonium Finishing Plant, which began converting corro-sive plutonium solutions to a stable, dry powder for safestorage in September of 1999.I
F l u o r C o r p o r a t i o n 19 9 9 A n n u a l R e p o r t
Page 17
Wireless Services, AT&T Broadband and Internet
Services and AT&T Local Services. Signifying a strong
start in FY2000, Telecommunications was recently
named program manager of a $500 million project to
provide a new integrated radio and transmission
communications network for the London Underground
subway system. These strategically significant pro-
grams are propelling this unit to a clear leadership role
in this high-growth and dynamic market.
The telecommunications market is tremendous in
size and continues to grow at a phenomenal rate. The
Telecommunications unit is challenged to selectively
penetrate this market and be positioned with strategic
clients to capture new project opportunities as waves
of new technology drive the market and expand geo-
graphically. Time to market is crucial. The emerging
and incumbent wireless and wireline carrier market,
along with North America and Western Europe,
are all high-growth, high-revenue markets where
Telecommunications is focusing its time and resources.
O p e r a t i o n s & M a i n t e n a n c e
Operations & Maintenance (O&M) provides
innovative and competitive asset management services
across a wide range of industries including manu-
facturing; fossil and nuclear power; oil and gas; and
chemicals and life sciences. O&M’s strategy is to
continually migrate up the clients’ value chain from
providing maintenance and operations services to total
asset management, offering the opportunity to deliver
significant value to our customers through reduced
operating costs and improved performance. This in
turn can create further opportunities utilizing an inte-
grated package of Fluor capabilities.
The market for O&M services is large and contin-
ues to grow steadily as companies focus on their core
competencies and outsource non-core services. Fluor
has a strong base of expertise and experience in the
O&M services market, including world-class people,
technologies, processes and management skills, which
can be leveraged against its broad cross-industry expo-
sure to achieve significant long-term growth.
Key to capitalizing on the market growth poten-
tial, as well as increasing market share, will be client
focus and differentiated value. O&M’s approach is to
structure its compensation to be strongly performance
related, sharing in savings achieved for clients in their
total operating costs. Client receptivity to this value
proposition has been encouraging.
C o n s u l t i n g S e r v i c e s
The Consulting Services unit, with a major presence in
the United States and Western Europe, provides clients
with professional advisory services and operational diag-
nostics to reach optimum business performance.
Consulting Services also improves the positioning
of other Fluor units for the implementation of actions
recommended by this unit. Synergies are especially
evident with Operations & Maintenance as clients
worldwide move towards outsourcing and asset opti-
mization. Through the Consulting Services unit, FGS
can help assess a client’s needs, provide strategies and
tactical approaches and offer long-term solutions in
asset management.
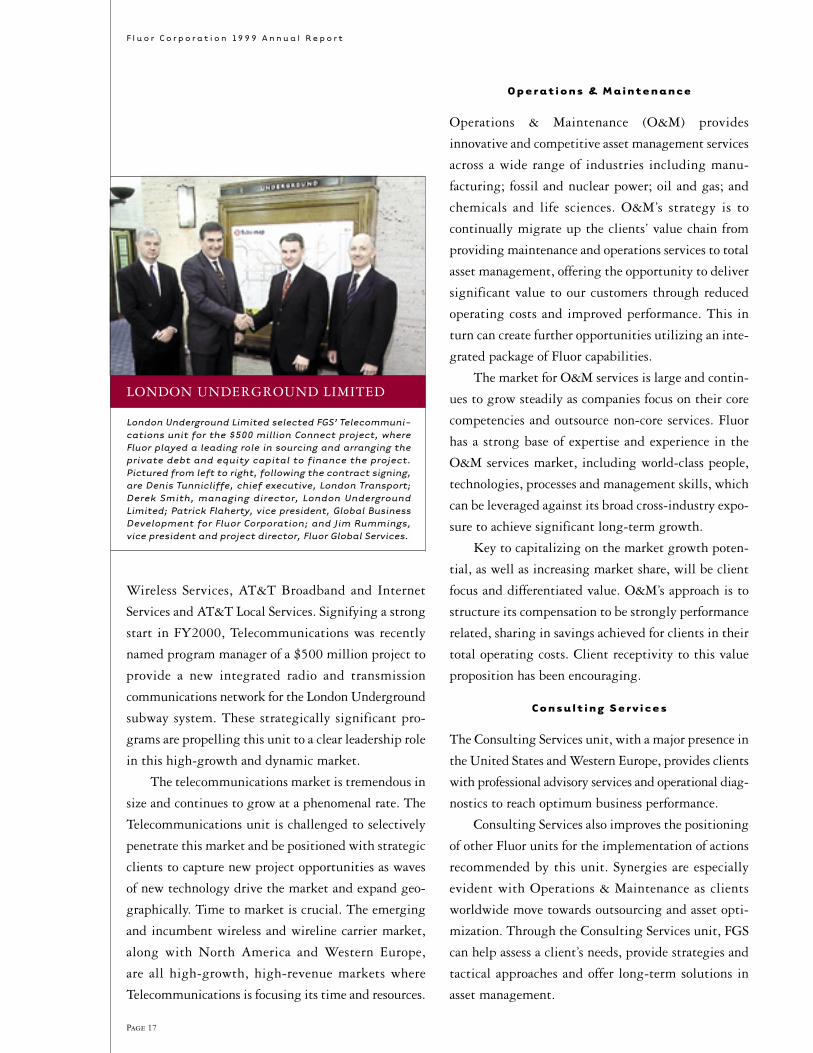
LONDON UNDERGROUND LIMITED
London Underground Limited selected FGS’ Telecommuni-cations unit for the $500 million Connect project, whereFluor played a leading role in sourcing and arranging theprivate debt and equity capital to finance the project.Pictured from left to right, following the contract signing,are Denis Tunnicliffe, chief executive, London Transport;Derek Smith, managing director, London UndergroundLimited; Patrick Flaherty, vice president, Global BusinessDevelopment for Fluor Corporation; and Jim Rummings,vice president and project director, Fluor Global Services.
F l u o r C o r p o r a t i o n 19 9 9 A n n u a l R e p o r t
Page 18
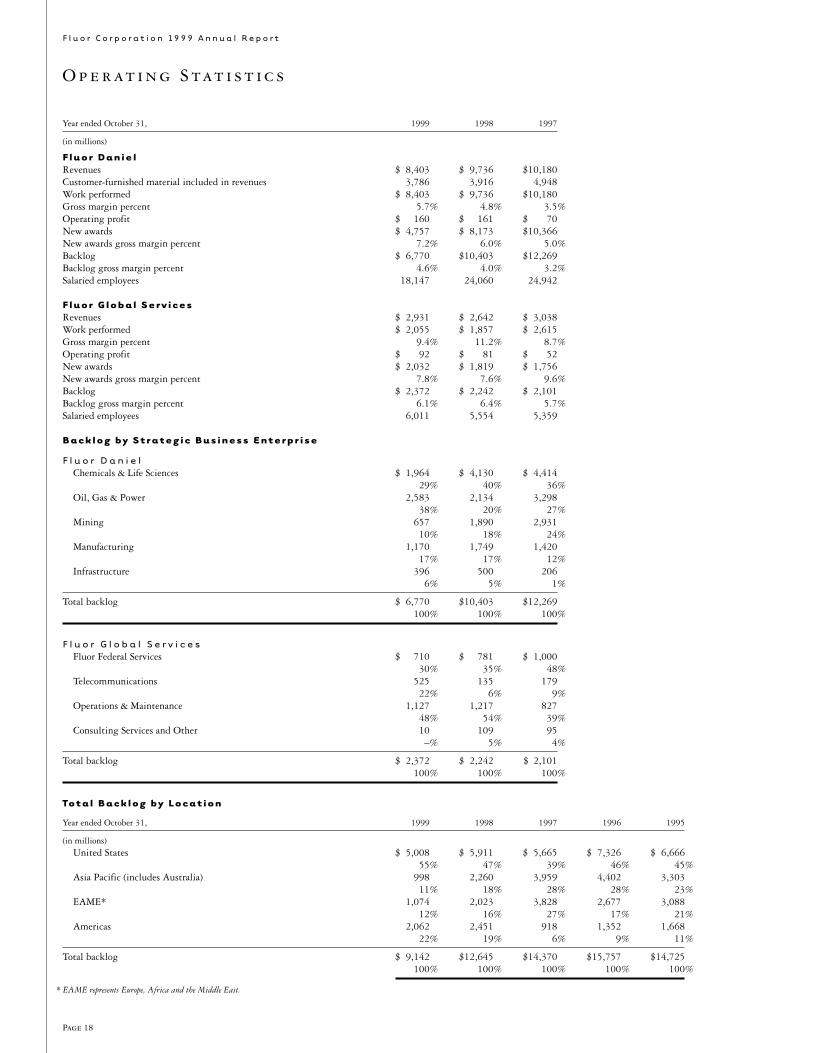
O p e r at i n g S tat i s t i c s
Year ended October 31, 1999 1998 1997
(in millions)
F l u o r D a n i e lRevenues $ 8,403 $ 9,736 $10,180Customer-furnished material included in revenues 3,786 3,916 4,948Work performed $ 8,403 $ 9,736 $10,180Gross margin percent 5.7% 4.8% 3.5%Operating profit $ 160 $ 161 $ 70New awards $ 4,757 $ 8,173 $10,366New awards gross margin percent 7.2% 6.0% 5.0%Backlog $ 6,770 $10,403 $12,269Backlog gross margin percent 4.6% 4.0% 3.2%Salaried employees 18,147 24,060 24,942
F l u o r G l o b a l S e r v i c e sRevenues $ 2,931 $ 2,642 $ 3,038Work performed $ 2,055 $ 1,857 $ 2,615Gross margin percent 9.4% 11.2% 8.7%Operating profit $ 92 $ 81 $ 52New awards $ 2,032 $ 1,819 $ 1,756New awards gross margin percent 7.8% 7.6% 9.6%Backlog $ 2,372 $ 2,242 $ 2,101Backlog gross margin percent 6.1% 6.4% 5.7%Salaried employees 6,011 5,554 5,359
B a c k l o g b y S t r a t e g i c B u s i n e s s E n t e r p r i s e
F l u o r D a n i e lChemicals & Life Sciences $ 1,964 $ 4,130 $ 4,414
29% 40% 36%Oil, Gas & Power 2,583 2,134 3,298
38% 20% 27%Mining 657 1,890 2,931
10% 18% 24%Manufacturing 1,170 1,749 1,420
17% 17% 12%Infrastructure 396 500 206
6% 5% 1%
Total backlog $ 6,770 $10,403 $12,269100% 100% 100%
F l u o r G l o b a l S e r v i c e sFluor Federal Services $ 710 $ 781 $ 1,000
30% 35% 48%Telecommunications 525 135 179
22% 6% 9%Operations & Maintenance 1,127 1,217 827
48% 54% 39%Consulting Services and Other 10 109 95
–% 5% 4%
Total backlog $ 2,372 $ 2,242 $ 2,101100% 100% 100%
To t a l B a c k l o g b y L o c a t i o n
Year ended October 31, 1999 1998 1997 1996 1995
(in millions)United States $ 5,008 $ 5,911 $ 5,665 $ 7,326 $ 6,666
55% 47% 39% 46% 45%Asia Pacific (includes Australia) 998 2,260 3,959 4,402 3,303
11% 18% 28% 28% 23%EAME* 1,074 2,023 3,828 2,677 3,088
12% 16% 27% 17% 21%Americas 2,062 2,451 918 1,352 1,668
22% 19% 6% 9% 11%
Total backlog $ 9,142 $12,645 $14,370 $15,757 $14,725100% 100% 100% 100% 100%
* EAME represents Europe, Africa and the Middle East.

F l u o r C o r p o r a t i o n 19 9 9 A n n u a l R e p o r t
Page 19
�F L U O R �1 9 9 9 B A C K L O G B Y R E G I O N �( p e r c e n t ) �
�
ASIA PACIFIC 7%�AUSTRALIA 4%�CANADA 14%�EUROPE 8%��
LATIN AMERICA 8%�MIDDLE EAST 4%�UNITED STATES 55%��
�F L U O R �1 9 9 9 B A C K L O G B Y I N D U S T R Y �( p e r c e n t ) �
�
INFRASTRUCTURE 4%�MANUFACTURING 13%�MINING 7%�OIL, GAS & POWER 28%��
CHEMICALS & � LIFE SCIENCES 22%�FLUOR �GLOBAL SERVICES 26%��
�F L U O R �S A F E T Y P E R F O R M A N C E �( l o s t w o r k d a y i n c i d e n c e r a t e s ) �
�
0.00
0.05
0.10
0.15
950
.03
.09
.06
.12
.06*.06
.08.07
.10
96 97 98 99
* S i x t y t i m e s b e t t e r t h a n t h e n a t i o n a l �
i n d u s t r y a v e r a g e .
�T O T A L N E W A W A R D S �( $ i n b i l l i o n s ) �
�
950
5.0
10.0
15.0
6.8
10.0
12.112.5
10.3
96 97 98 99
FLUOR DANIEL�FLUOR GLOBAL SERVICES�ENGINEERING & CONSTRUCTION
�T O T A L B A C K L O G �($ in billions)�
�
950
5.0
10.0
15.0
20.0
9.1
12.6
14.415.8
14.7
96 97 98 99
FLUOR DANIEL�FLUOR GLOBAL SERVICES�ENGINEERING & CONSTRUCTION
F L U O R D A N I E L �G R O S S M A R G I N A N D �O P E R A T I N G M A R G I N �( p e r c e n t ) �
�
0
2.0
4.0
6.05.7
4.8
3.5
1.91.7
0.7
97 98 99
GROSS MARGIN�OPERATING MARGIN
�F L U O R D A N I E L �N E W A W A R D S �G R O S S M A R G I N �( p e r c e n t ) ��
0
4.0
2.0
8.0
6.0
10.0
7.2
6.0
5.0
97 98 99
�F L U O R D A N I E L �B A C K L O G �G R O S S M A R G I N �( p e r c e n t ) �
�
0
2.0
1.0
4.0
3.0
5.0 4.6
4.0
3.2
97 98 99
�F L U O R G L O B A L S E R V I C E S �G R O S S M A R G I N A N D �O P E R A T I N G M A R G I N �( p e r c e n t ) �
�
0
3.0
9.0
6.0
12.09.4
11.2
8.7
3.13.1
1.7
97 98 99
GROSS MARGIN�OPERATING MARGIN
�F L U O R G L O B A L S E R V I C E S �N E W A W A R D S �G R O S S M A R G I N �( p e r c e n t ) �
�
0
4.0
2.0
8.0
6.0
10.0
7.87.6
9.6
97 98 99
�F L U O R G L O B A L S E R V I C E S �B A C K L O G �G R O S S M A R G I N �( p e r c e n t ) �
�
970
2.0
4.0
6.0
8.0
6.16.45.7
98 99
�T O T A L B A C K L O G �U . S . v s . I N T E R N A T I O N A L �($ in billions)�
�
950
5.0
10.0
15.0
20.0
9.1
12.6
14.415.8
14.7
96 97 98 99
INTERNATIONAL�U.S.
F l u o r C o r p o r a t i o n 19 9 9 A n n u a l R e p o r t
Page 20
A.T.Mas s e y i s an a cknowl edg ed
l eader in the U.S. coal industry. Measured by safety or comparative finan-
cial performance, Massey is the strongest and most successful coal company
in the U.S. Through its operating subsidiaries, Massey produces high-
quality, low-sulfur steam coal for the electric-generating industry and
industrial customers, and metallurgical coal for the steel industry.
A.T. MASSEY
F l u o r C o r p o r a t i o n 19 9 9 A n n u a l R e p o r t
Page 21
For the year, Massey gen-erated operating profit of$147 million, consistentwith our expectations,but down from $173million in 1998. Masseyimplemented aggressiveactions to reduce costs in1999 to offset unfavor-able market conditionsand continues to focus on strategies that willmaintain or increase itscompetitive advantage.Total coal sales volume of37.9 million tons in 1999
was essentially flat compared with the previous year, butlower realized prices and a less favorable sales mix morethan offset continued productivity improvements andcost reduction.
Global economic conditions in 1999 created unfa-vorable currency exchange rates which caused U.S. met-allurgical exports to be non-competitive and alsoattracted increased imports of cheap foreign steel. Thisreduced sales volumes for U.S. steel producers, lower-ing domestic demand for metallurgical coal and caus-ing Massey’s export sales to decline to 4 million tonsin 1999 from 5.6 million tons last year. As a result,Massey’s metallurgical coal sales declined 18 percent to14.9 million tons. Realized prices for metallurgicalcoal sales declined 2 percent to $32.34 per ton in 1999.Volume and price declines in higher-margin metallur-gical coal were the most significant factors in loweringMassey’s operating margin in 1999 to 13.6 percent,compared with 15.3 percent last year.
Despite diminished export opportunities, Masseysuccessfully increased its metallurgical coal shipmentsto Canada and concentrated on the European steel producer market where its high-volatile metallurgicalcoal retains a distinct quality advantage.
Signs of economic recovery in Asia, along withstrengthening foreign currency exchange rates, sug-gests the flow of cheap steel into the U.S. market maydiminish and demand should begin to recover in tra-ditional geographic markets. As a result, near-termdemand for U.S. metallurgical coal is expected to sta-bilize and prices appear to be firming. Renewed growthwill be a function of continued improvement in globaleconomic conditions and Massey’s ability to increase itsmarket share through its product quality, service, relia-bility of supply, and price.
Massey faced significant challenges in the domes-tic market for steam coal as well. Deregulation of theelectric-generating industry and implementation ofPhase II of the Clean Air Act have been widely antic-ipated to create additional demand for low-sulfur steamcoal. Unfortunately, increased pressure to switch toalternative fuel sources such as gas, significant increasesin Central Appalachian coal production capacity inanticipation of demand growth, mild weather that haslimited demand for electricity, and greater-than-expectedpenetration of Eastern coal markets by Western coal pro-ducers, all have combined to produce a flat market withdeclining prices. Within this market environment,Massey increased its steam coal sales by 18 percent to22.9 million tons, while realized prices declined 4 per-cent to $25.83 per ton.
DON L. BLANKENSHIP
P r e s i d e n t a n d
C h i e f E x e c u t i v e O f f i c e r
A . T. M a s s e y C o a l
T h r o u g h M a s s e y ’s s t r a t e g y of investment in new high-quality reserves and
modern mining equipment and procedures, it has delivered an enviable record of
consistent double-digit earnings growth for a number of years. However, extremely
difficult market conditions prevailed in 1999, which resulted in an earnings decline
for the first time in many years. Nevertheless, Massey continued to significantly
outperform its industry peers on virtually every measurable criteria.
F l u o r C o r p o r a t i o n 19 9 9 A n n u a l R e p o r t
Page 22
the U.S. coal market, Massey’s significant cost advan-tage over its Central Appalachian competitors posi-tions it not only to withstand hard times, but poten-tially to capitalize on them. With the exception ofMassey, most Central Appalachian coal producers are heavily in debt and are delivering poor financialperformance. The prospect that many of these pro-ducers will not be able to continue to sell coal belowtheir production costs will likely result in reduced supply and create opportunities for Massey to increaseits market share.
Massey has widened its substantial cost advantageover the past several years through a highly focusedstrategy of reserve acquisitions and investment to con-tinually lower production costs. Given the difficult andrapidly changing market environment, Massey hasundertaken additional actions to further reduce costsand maintain or increase its competitive advantage.
Anticipating reduced near-term market demand,Massey curtailed its capital investment plans for newproduction capacity in 1999 and expects to furtherreduce its capital spending in 2000. Current efforts aredirected at optimizing production from existing mineswith the lowest production costs.
Although reserve acquisitions in 1999 consisted of relatively small properties, total reserves increased 14 percent to 2.1 billion tons, as additional reserves were proven up on existing properties. Two significantmine projects were completed in 1999, which con-tinued the strategy to develop previously acquired high-value reserves.
Massey achieved startup of the Justice longwallduring the year, its second state-of-the-art longwalloperation. Justice has an annual capacity of 4 milliontons. A longwall mining system greatly increases pro-ductivity and reserve recovery in large undergroundcoal seams. Additionally, production from the new AlexEnergy surface mine began in 1999, with an annualproduction capacity of approximately 3 million tons peryear. Surface mines offer the advantage of lower costscompared with traditional underground mines, and
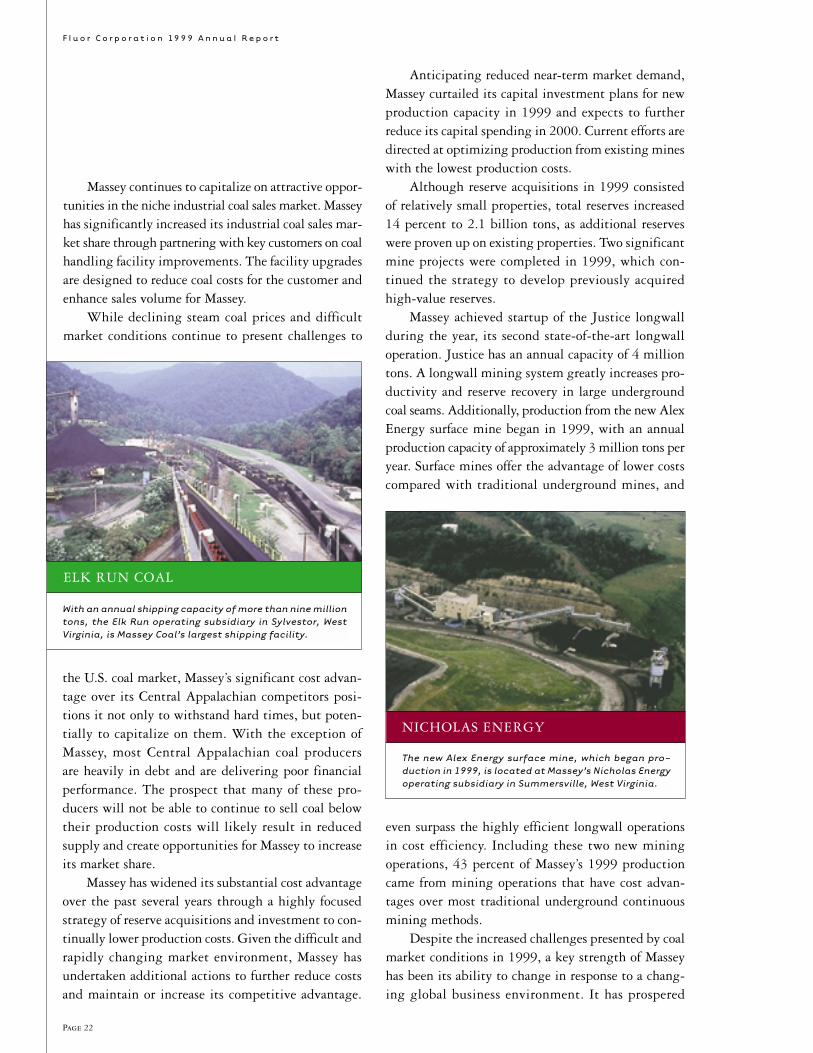
NICHOLAS ENERGY
The new Alex Energy surface mine, which began pro-duction in 1999, is located at Massey’s Nicholas Energyoperating subsidiary in Summersville, West Virginia.
ELK RUN COAL
With an annual shipping capacity of more than nine milliontons, the Elk Run operating subsidiary in Sylvestor, WestVirginia, is Massey Coal’s largest shipping facility.
Massey continues to capitalize on attractive oppor-tunities in the niche industrial coal sales market. Masseyhas significantly increased its industrial coal sales mar-ket share through partnering with key customers on coalhandling facility improvements. The facility upgradesare designed to reduce coal costs for the customer andenhance sales volume for Massey.
While declining steam coal prices and difficultmarket conditions continue to present challenges to
even surpass the highly efficient longwall operations in cost efficiency. Including these two new miningoperations, 43 percent of Massey’s 1999 productioncame from mining operations that have cost advan-tages over most traditional underground continuousmining methods.
Despite the increased challenges presented by coalmarket conditions in 1999, a key strength of Masseyhas been its ability to change in response to a chang-ing global business environment. It has prospered
F l u o r C o r p o r a t i o n 19 9 9 A n n u a l R e p o r t
Page 23
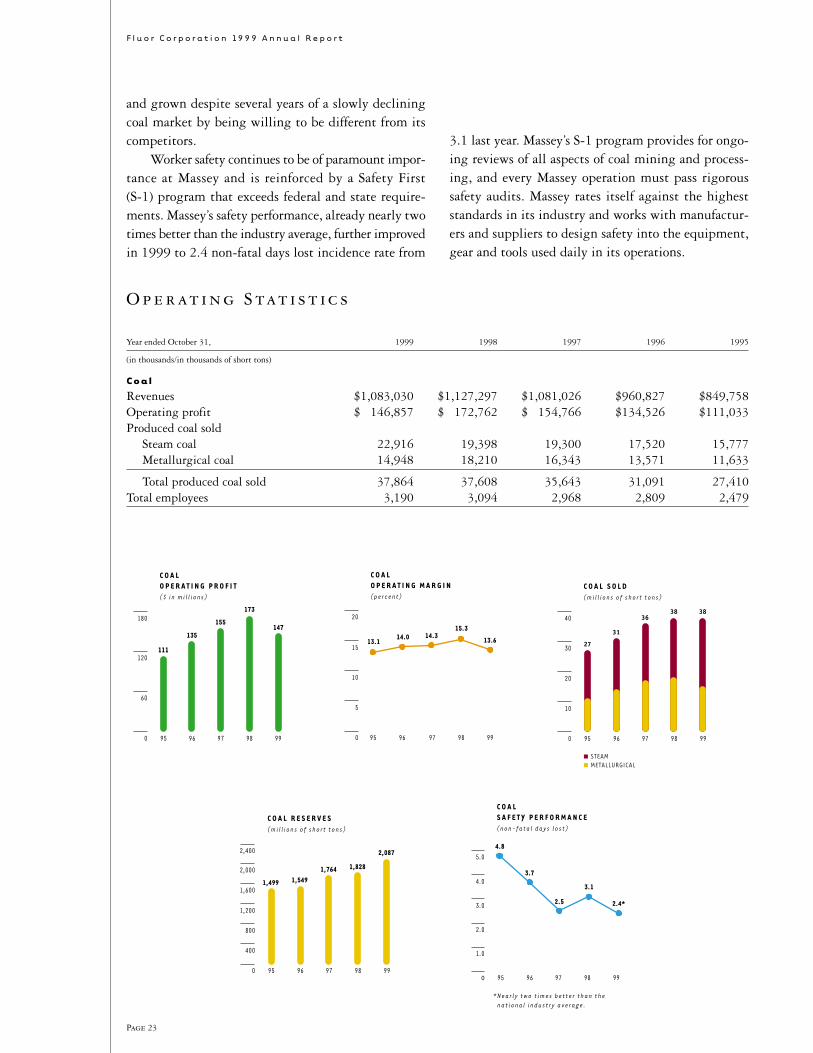
O p e r at i n g S tat i s t i c s
Year ended October 31, 1999 1998 1997 1996 1995
(in thousands/in thousands of short tons)
C o a l
Revenues $1,083,030 $1,127,297 $1,081,026 $960,827 $849,758Operating profit $ 146,857 $ 172,762 $ 154,766 $134,526 $111,033Produced coal sold
Steam coal 22,916 19,398 19,300 17,520 15,777Metallurgical coal 14,948 18,210 16,343 13,571 11,633
Total produced coal sold 37,864 37,608 35,643 31,091 27,410Total employees 3,190 3,094 2,968 2,809 2,479
�C O A L �O P E R A T I N G P R O F I T �( $ i n m i l l i o n s ) �
�
970
60
120
180147
173
155
98 9996
135
95
111
�C O A L �O P E R A T I N G M A R G I N �( p e r c e n t ) �
�
950
5
15
10
20
13.6
15.314.314.0
13.1
96 97 98 99
�C O A L S O L D �( m i l l i o n s o f s h o r t t o n s ) �
�
950
10
20
30
403838
36
31
27
96 97 98 99
STEAM�METALLURGICAL
�C O A L R E S E R V E S �( m i l l i o n s o f s h o r t t o n s ) �
�
950
400
800
1,200
2,000
1,600
2,400 2,087
1,8281,7641,5491,499
96 97 98 99
�C O A L �S A F E T Y P E R F O R M A N C E �( n o n - f a t a l d a y s l o s t ) �
�
950
2.0
1.0
4.0
3.0
5.0
2.4*
3.1
2.5
3.7
4.8
96 97 98 99
* N e a r l y t w o t i m e s b e t t e r t h a n t h e � n a t i o n a l i n d u s t r y a v e r a g e .
and grown despite several years of a slowly decliningcoal market by being willing to be different from itscompetitors.
Worker safety continues to be of paramount impor-tance at Massey and is reinforced by a Safety First (S-1) program that exceeds federal and state require-ments. Massey’s safety performance, already nearly twotimes better than the industry average, further improvedin 1999 to 2.4 non-fatal days lost incidence rate from
3.1 last year. Massey’s S-1 program provides for ongo-ing reviews of all aspects of coal mining and process-ing, and every Massey operation must pass rigoroussafety audits. Massey rates itself against the higheststandards in its industry and works with manufactur-ers and suppliers to design safety into the equipment,gear and tools used daily in its operations.

Page 24
F l u o r C o r p o r a t i o n 19 9 9 A n n u a l R e p o r t
Page 24
Fis cal 1999 marked the creation of
a shared services organization within Fluor Corporation. A major component
of Fluor’s strategic direction, Fluor Signature Services is a new and distinct
business enterprise with profit-and-loss accountability. Its primary charter
is to deliver business administrative and support services to multiple
operating units within Fluor Corporation, with the additional objective to
expand marketing of its services to external clients.
FLUOR SIGNATURE SERVICES

F l u o r C o r p o r a t i o n 19 9 9 A n n u a l R e p o r t
Page 25
By establishing FluorSignature Services, thecorporation has movedforward in the strategicdirection it set to reducecosts, streamline opera-tions, improve qualitystandards, and identifyand measure the valuecreated by the servicesprovided.
This new enterprisebrings a new approach to doing business. Byassuming responsibilityfor the delivery of busi-
ness and support services, Fluor Signature Services willallow the operating units to focus on their core busi-nesses. Business leaders will define and choose to pur-chase services needed to achieve peak performance intheir organizations. Consolidating business services inone organization should reduce costs and improve qual-ity standards.
Fluor Signature Services is dedicated to deliveringbusiness effectiveness and creating value for Fluor. Theorganization leverages Fluor’s investment in people,processes and technology to improve its delivery ofbusiness services. It is organized into individual linesof business services in the areas of finance, informationtechnology, safety, human resources, office services andperformance solutions.
Accomplishments for FY1999 include:• A successful transition was achieved from an overhead
administrative structure, largely integrated withoperating entities, to a separate organization account-able for profit and loss. Establishing this enterprisein terms of structure, services and business infra-structure in eight months required a great deal ofeffort. Fluor Signature Services’ members are to becongratulated for its successful beginning.
• Customer needs and expectations were met with noservice interruption during the transition period.
• Cost-reduction efforts in FY1999 resulted in a significant savings. Cost effectiveness will be an ongoing effort while providing customers with thelevel of service required.
Fluor Signature Services has a unique opportunityto provide its customers with a distinct competitiveadvantage by providing and managing business and
JAMES O. ROLLANS
P r e s i d e n t a n d
C h i e f E x e c u t i v e O f f i c e r
F l u o r S i g n a t u r e S e r v i c e s
administrative services on their behalf. Priorities forFY2000 will result in substantial reductions in costsand assets employed while improving satisfaction inthose areas most important to customers.
Objectives for FY2000 include:• Achieving the goal of operating as a self-sustaining
organization with break-even performance for thefirst year of operation.
• Improving customer satisfaction and exceeding theirexpectations. Customer satisfaction measures will be implemented including a quarterly monitoringprocess.
• Delivering services more cost effectively and devel-oping new ways to deliver services more efficiently.
• Improving the financial returns on the corporation’sreal estate and information systems assets and certaininvestments. Real estate, a major asset area, will beaddressed with the objective of obtaining a higher rateof return. Fluor’s real estate investment has a bookvalue of $270 million and a current return on thoseassets well below our cost of capital. Reducing own-ership of real estate holdings and defining and meet-ing the long-term real estate needs of the corporationis a key objective.
• Piloting the deployment of the Enterprise ResourceManagement system, and championing its use incustomer organizations.
• Providing training and development opportunities to build the skill base of our people.
The organization’s goal is to become an efficient,innovative and customer-centric team which createsvalue for all of the enterprises and the shareholders ofFluor Corporation. As a growing and successful pro-fessional organization, it will create new and expandedcareer opportunities for its members.
The company’s transition to a shared services con-cept in providing business services is a major changefor Fluor Corporation. Fluor Signature Services willhave the opportunity to redefine itself and demonstrateareas in which it excels and provides measurable added value. The organization is very appreciative of its customers’ support during the transition period.Through the building of an effective customer/supplierrelationship, Fluor Corporation and Fluor SignatureServices’ members and customers will benefit from the shared objective of improving costs, quality andresponsiveness.
Fluor Signature Services is looking forward to anexciting, rewarding year and creating a measurable andpositive impact on Fluor Corporation’s performance.
As evidenced in thisannual report, the Fluormanagement team iscommitted to deliver-ing improved financialperformance to ourshareholders. In 1999,we developed a businessmodel process to clearlydefine goals for eachstrategic business unit.With this process,accountability residesthroughout all levels ofthe organization, so that
all members of the Fluor team understand — and areaccountable for — pursuing higher margins andaggressively managing investment levels to achieveimproved returns. We will continue to grow ourorganizational capability and financial expertise todeliver results that will benefit our shareholders. Aswe look to the future, the management team shares aclear view of what is required to create value:
• Earnings per share and revenue growth that consis-tently exceed our benchmark of at least 10 percentannual improvement.
• Improve returns to levels that exceed our risk-adjusted cost of capital for each business in whichwe choose to participate.
• Improved transparency and financial disclosure tobetter educate our investors about our businessesand to strengthen and reinforce management’scredibility.
Along with these goals, we realize that there arekey disciplines and beliefs we must instill in our orga-nization. Fluor Corporation will be successful onlywhen we manage our businesses and their cost struc-tures to create value in all economic environments.
Page 26
F l u o r C o r p o r a t i o n 19 9 9 A n n u a l R e p o r t
D e a r S h a r e h o l d e r
RALPH F. HAKE
E x e c u t i v e Vi c e P r e s i d e n t
a n d C h i e f F i n a n c i a l O f f i c e r
Further, we must objectively evaluate and scrutinizeour investments on a risk/reward basis to ensure thatour shareholders’ interests are paramount.
One of the strengths of our business portfolio isstrong cash flow. We must, however, more aggres-sively manage our balance sheet and continue toimprove our ability to identify investments that cre-ate value and justify management’s use of cash.
Fortunately, this change process is being initiatedfrom a very solid platform. We generated $90 millionin cash flow before financing activities in 1999, andcash generation is projected to be increasingly strongin the near term. Our debt-to-capital ratio wasreduced to 26 percent at fiscal year-end, below ourtargeted range of 30 to 35 percent, with the pay downof $183 million in short-term debt. The strength of our balance sheet and coverage ratios enabled us to retain a solid “A” investment grade rating with the credit agencies during challenging environmentsin both our engineering and construction and coal businesses.
Thus, we look forward to the year 2000 as bothone of continued change and increased opportunity.While we will only succeed as an enterprise by serv-ing our customers and clients superbly well, ourrelentless focus on financial disciplines and clearlydefined elements of value creation are essential tocreating the company we all envision.
Ralph F. Hake
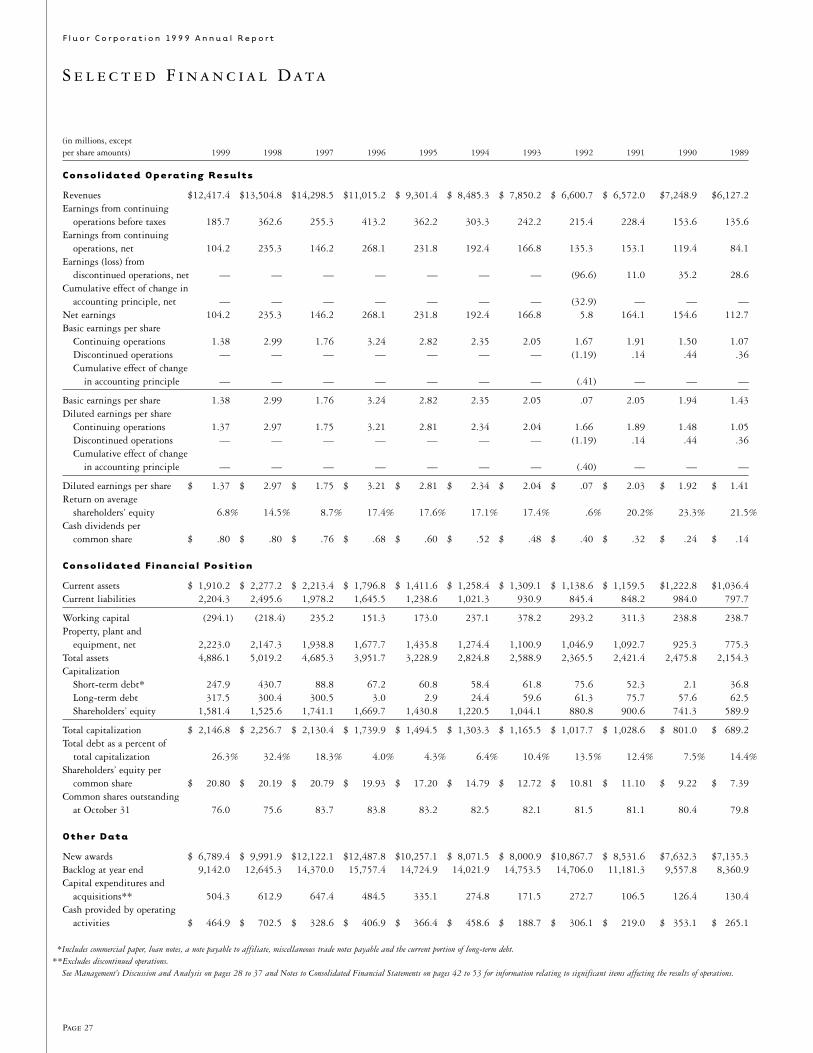
Page 27
F l u o r C o r p o r a t i o n 19 9 9 A n n u a l R e p o r t
S e l e c t e d F i n a n c i a l D ata
(in millions, except per share amounts) 1999 1998 1997 1996 1995 1994 1993 1992 1991 1990 1989
Consolidated Operating Results
Revenues $12,417.4 $13,504.8 $14,298.5 $11,015.2 $ 9,301.4 $ 8,485.3 $ 7,850.2 $ 6,600.7 $ 6,572.0 $7,248.9 $6,127.2Earnings from continuing
operations before taxes 185.7 362.6 255.3 413.2 362.2 303.3 242.2 215.4 228.4 153.6 135.6Earnings from continuing
operations, net 104.2 235.3 146.2 268.1 231.8 192.4 166.8 135.3 153.1 119.4 84.1Earnings (loss) from
discontinued operations, net — — — — — — — (96.6) 11.0 35.2 28.6Cumulative effect of change in
accounting principle, net — — — — — — — (32.9) — — —Net earnings 104.2 235.3 146.2 268.1 231.8 192.4 166.8 5.8 164.1 154.6 112.7Basic earnings per share
Continuing operations 1.38 2.99 1.76 3.24 2.82 2.35 2.05 1.67 1.91 1.50 1.07Discontinued operations — — — — — — — (1.19) .14 .44 .36Cumulative effect of change
in accounting principle — — — — — — — (.41) — — —
Basic earnings per share 1.38 2.99 1.76 3.24 2.82 2.35 2.05 .07 2.05 1.94 1.43Diluted earnings per share
Continuing operations 1.37 2.97 1.75 3.21 2.81 2.34 2.04 1.66 1.89 1.48 1.05Discontinued operations — — — — — — — (1.19) .14 .44 .36Cumulative effect of change
in accounting principle — — — — — — — (.40) — — —
Diluted earnings per share $ 1.37 $ 2.97 $ 1.75 $ 3.21 $ 2.81 $ 2.34 $ 2.04 $ .07 $ 2.03 $ 1.92 $ 1.41Return on average
shareholders’ equity 6.8% 14.5% 8.7% 17.4% 17.6% 17.1% 17.4% .6% 20.2% 23.3% 21.5%Cash dividends per
common share $ .80 $ .80 $ .76 $ .68 $ .60 $ .52 $ .48 $ .40 $ .32 $ .24 $ .14
Consolidated Financial Position
Current assets $ 1,910.2 $ 2,277.2 $ 2,213.4 $ 1,796.8 $ 1,411.6 $ 1,258.4 $ 1,309.1 $ 1,138.6 $ 1,159.5 $1,222.8 $1,036.4Current liabilities 2,204.3 2,495.6 1,978.2 1,645.5 1,238.6 1,021.3 930.9 845.4 848.2 984.0 797.7
Working capital (294.1) (218.4) 235.2 151.3 173.0 237.1 378.2 293.2 311.3 238.8 238.7Property, plant and
equipment, net 2,223.0 2,147.3 1,938.8 1,677.7 1,435.8 1,274.4 1,100.9 1,046.9 1,092.7 925.3 775.3Total assets 4,886.1 5,019.2 4,685.3 3,951.7 3,228.9 2,824.8 2,588.9 2,365.5 2,421.4 2,475.8 2,154.3Capitalization
Short-term debt* 247.9 430.7 88.8 67.2 60.8 58.4 61.8 75.6 52.3 2.1 36.8Long-term debt 317.5 300.4 300.5 3.0 2.9 24.4 59.6 61.3 75.7 57.6 62.5Shareholders’ equity 1,581.4 1,525.6 1,741.1 1,669.7 1,430.8 1,220.5 1,044.1 880.8 900.6 741.3 589.9
Total capitalization $ 2,146.8 $ 2,256.7 $ 2,130.4 $ 1,739.9 $ 1,494.5 $ 1,303.3 $ 1,165.5 $ 1,017.7 $ 1,028.6 $ 801.0 $ 689.2Total debt as a percent of
total capitalization 26.3% 32.4% 18.3% 4.0% 4.3% 6.4% 10.4% 13.5% 12.4% 7.5% 14.4%Shareholders’ equity per
common share $ 20.80 $ 20.19 $ 20.79 $ 19.93 $ 17.20 $ 14.79 $ 12.72 $ 10.81 $ 11.10 $ 9.22 $ 7.39Common shares outstanding
at October 31 76.0 75.6 83.7 83.8 83.2 82.5 82.1 81.5 81.1 80.4 79.8
Other Data
New awards $ 6,789.4 $ 9,991.9 $12,122.1 $12,487.8 $10,257.1 $ 8,071.5 $ 8,000.9 $10,867.7 $ 8,531.6 $7,632.3 $7,135.3Backlog at year end 9,142.0 12,645.3 14,370.0 15,757.4 14,724.9 14,021.9 14,753.5 14,706.0 11,181.3 9,557.8 8,360.9Capital expenditures and
acquisitions** 504.3 612.9 647.4 484.5 335.1 274.8 171.5 272.7 106.5 126.4 130.4Cash provided by operating
activities $ 464.9 $ 702.5 $ 328.6 $ 406.9 $ 366.4 $ 458.6 $ 188.7 $ 306.1 $ 219.0 $ 353.1 $ 265.1
*Includes commercial paper, loan notes, a note payable to affiliate, miscellaneous trade notes payable and the current portion of long-term debt.**Excludes discontinued operations.
See Management’s Discussion and Analysis on pages 28 to 37 and Notes to Consolidated Financial Statements on pages 42 to 53 for information relating to significant items affecting the results of operations.
Page 28
F l u o r C o r p o r a t i o n 19 9 9 A n n u a l R e p o r t
M a n a g e m e n t ’ s D i s c u s s i o n a n d A n a l y s i s
The following discussion and analysis is provided toincrease understanding of, and should be read in conjunc-tion with, the consolidated financial statements andaccompanying notes. For purposes of reviewing this docu-ment “operating profit” is calculated as revenues less costof revenues excluding: corporate administrative and gen-eral expense; interest expense; interest income; domesticand foreign income taxes; gain or loss on discontinuedoperations; the cumulative effect of a change in accountingprinciples; and certain other miscellaneous non-operatingincome and expense items which are immaterial.
Results of Operations
As a result of a strategic reorganization, during 1999 thecompany realigned its operating units into four businesssegments (which the company refers to as StrategicBusiness Enterprises): Fluor Daniel, Fluor Global Services,Coal and Fluor Signature Services. The Fluor Daniel seg-ment provides design, engineering, procurement and con-struction services on a worldwide basis to an extensiverange of industrial, commercial, utility, natural resourcesand energy clients. The Fluor Global Services segment,which includes American Equipment Company, TRS Staffing Solutions, Fluor Federal Services,Telecommunications, Operations & Maintenance andConsulting Services, provides outsourcing and asset man-agement solutions to its customers. The Coal segment pro-duces, processes and sells high-quality, low-sulfur steamcoal for the utility industry as well as industrial customers,and metallurgical coal for the steel industry. FluorSignature Services, which commenced operations onNovember 1, 1999, was created to provide business admin-istration and support services for the benefit of the com-pany and ultimately, to unaffiliated customers.
To implement the reorganization, the companyrecorded a special provision of $117.2 million – seeStrategic Reorganization Costs elsewhere in Management’sDiscussion and Analysis. The provision was not allocatedto the business segments.
Fluor Daniel Segment
Total 1999 new awards were $4.8 billion compared with$8.2 billion in 1998 and $10.4 billion in 1997. The fol-lowing table sets forth new awards for each of the seg-ment’s business units:
Year ended October 31, 1999 1998 1997
(in millions)
Chemicals & Life Sciences $1,211 $3,053 $ 4,16625% 37% 40%
Oil, Gas & Power 2,599 2,302 2,81455% 28% 27%
Mining 26 464 1,5951% 6% 15%
Manufacturing 785 1,856 1,74116% 23% 17%
Infrastructure 136 498 503% 6% 1%
Total new awards $4,757 $8,173 $10,366100% 100% 100%
United States $2,267 $4,112 $ 3,88547% 50% 37%
International 2,490 4,061 6,48153% 50% 63%
Total new awards $4,757 $8,173 $10,366100% 100% 100%
New awards in 1999 were lower compared with 1998,reflecting both the lingering impact of deferred capitalspending by clients, primarily in the petrochemical andmining industries, and the company’s continuing emphasison greater project selectivity. The large size and uncertaintiming of complex, international projects can create vari-ability in the company’s award pattern; consequently,future award trends are difficult to predict with certainty.However, given the improving global economic condi-tions, including significantly higher oil prices and therecent stabilizing of commodity prices, the company isoptimistic about the level of new awards in 2000.
Since 1997 the trend in new awards activity withineach business unit reflects the impact of the economic conditions and operating strategies noted above. Therewere no individual new awards in excess of $550 million in either 1999 or 1998. New awards for the Chemicals &Life Sciences business unit in 1997 included the $1.9 bil-lion Yanpet project, a petrochemical complex in SaudiArabia. The Mining business unit’s new awards are down significantly from 1997 primarily due to depressedcommodity prices, thereby limiting new projects, as well as this unit’s focus on project selectivity. The decreasein new awards in 1999 compared with 1998 and 1997 forthe Manufacturing business unit is primarily the result of an increased focus on project selectivity.
Backlog at October 31, 1999, 1998 and 1997 was$6.8 billion, $10.4 billion and $12.3 billion, respectively.
Page 29
F l u o r C o r p o r a t i o n 19 9 9 A n n u a l R e p o r t
(See page 18 in this annual report for information relatingto backlog by business unit.) The decrease in total backlogis consistent with the downward trend in new awards.Work performed on existing projects has exceeded newawards in both 1999 and 1998. The decrease in backlogfrom projects located outside the United States at October31, 1999, resulted from work performed on internationalprojects such as a copper and gold mine in Indonesia andthe aforementioned petrochemical project in Saudi Arabia,in addition to a 39 percent decrease in international-relatednew awards. Although backlog reflects business which isconsidered to be firm, cancellations or scope adjustmentsmay occur. Backlog is adjusted to reflect any known pro-ject cancellations, deferrals and revised project scope andcost, both upward and downward.
Fluor Daniel revenues decreased to $8.4 billion in1999 compared with $9.7 billion in 1998 and $10.2 bil-lion in 1997, primarily due to a continuing decline in thevolume of work performed. The decline in revenues is con-sistent with the downward trend in new awards, reflectingboth deferred capital spending by clients as well as thecompany’s emphasis on project selectivity. Fluor Danieloperating profit was $160 million in 1999, $161 millionin 1998 and $70 million in 1997. Despite a 14 percentdecline in revenues, operating margins for the year endedOctober 31, 1999 improved over the same period in 1998,primarily due to improved project execution. Operatingresults for the year ended October 31, 1997, reflect provi-sions totaling $118.2 million recorded for estimated losseson certain contracts and adjustments to project-relatedinvestments and accounts receivable. Results for 1997 alsoincluded charges totaling $25.4 million related to imple-mentation of certain cost reduction initiatives.
Results for the year ended October 31, 1999 for FluorDaniel include a provision totaling $84 million for process design problems which arose on its Murrin MurrinNickel Cobalt project located in Western Australia. Thecompany anticipates recovering a portion of this amountand, accordingly, has recorded $64 million in expectedinsurance recoveries. The result on operating profit was anegative $20 million impact which reflects costs in excessof contract maximums and which are not otherwise recov-erable from any insurance coverage. During the fourthquarter of 1999, Fluor Daniel completed a more definitiveestimate of costs required to address the design problemsand potential insurance recoveries. As a result of this effort,both the estimated cost and expected insurance recoveryamounts discussed above include an upward revision of$20 million.
The majority of Fluor Daniel’s engineering and construction contracts provide for reimbursement of costsplus a fixed or percentage fee. In the highly competitivemarkets served by this segment, there is an increasingtrend for cost-reimbursable contracts with incentive-feearrangements and fixed or unit price contracts. In certaininstances, Fluor Daniel has provided guaranteed comple-tion dates and/or achievement of other performance crite-ria. Failure to meet schedule or performance guarantees orincreases in contract costs can result in non-recoverablecosts, which could exceed revenues realized from the project. Fluor Daniel continues to focus on improvingoperating margins by enhancing selectivity in the pro-jects it pursues, lowering overhead costs and improvingproject execution.
The Fluor Daniel segment made no significant busi-ness acquisitions during 1999, 1998 or 1997.
Fluor Global Services Segment
Total 1999 new awards were $2.0 billion compared with $1.8 billion in both 1998 and 1997. The followingtable sets forth new awards for each of the segment’s busi-ness units:
Year ended October 31, 1999 1998 1997
(in millions)
Fluor Federal Services $ 582 $ 451 $ 49729% 25% 28%
Telecommunications 646 30 27732% 2% 16%
Operations & Maintenance 772 1,106 71338% 61% 41%
Consulting Services and Other 32 232 2691% 12% 15%
Total new awards $2,032 $1,819 $1,756100% 100% 100%
United States $1,928 $1,524 $1,55895% 84% 89%
International 104 295 1985% 16% 11%
Total new awards $2,032 $1,819 $1,756100% 100% 100%
New awards in 1999 were higher compared with 1998,as a result of an increase in telecommunications projects.New awards in 1998 were slightly higher than 1997 pri-marily due to the renewal of facility management servicecontracts for IBM at various facilities located throughout
Page 30
F l u o r C o r p o r a t i o n 19 9 9 A n n u a l R e p o r t
the United States. Because of the nature of the servicesperformed by Fluor Global Services, primarily related toAmerican Equipment Company (AMECO) and TRSStaffing Solutions, a significant portion of this segment’sactivities are not includable in backlog.
Backlog at October 31, 1999, 1998 and 1997 was$2.4 billion, $2.2 billion and $2.1 billion, respectively.(See page 18 in this annual report for information relatingto backlog by business unit.) The increase in total backlogis consistent with the increasing trend in new awards. Thebacklog of Fluor Global Services is concentrated in theUnited States, representing approximately 90 percent, 88percent and 92 percent of the total backlog at the end of 1999, 1998 and 1997, respectively. Although backlogreflects business that is considered to be firm, cancellationsor scope adjustments may occur. Backlog is adjusted to reflect any known project cancellations, deferrals and revised project scope and cost, both upward anddownward.
Fluor Global Services revenues increased to $2.9 bil-lion in 1999 compared with $2.6 billion in 1998, as the result of higher revenues in its AMECO, Fluor FederalServices and Telecommunications business units. Thedecline in Fluor Global Services revenues from $3.0 billionin 1997 to $2.6 billion in 1998 was primarily due to areduction in revenues related to its environmental strate-gies business which was phased out during 1998.Operating profit for the segment was $92 million in 1999,$81 million in 1998 and $52 million in 1997. Gross mar-gin in 1999 declined to 9.4 percent from 11.2 percent in1998 primarily due to the AMECO business unit, which isbeing adversely impacted by the increasingly competitiveequipment sale and rental industry. Despite the lower grossmargin, operating profit increased in 1999 compared with1998 primarily due to the elimination of certain unprof-itable operations which negatively impacted 1998. Theimprovement in operating results in 1998 as comparedwith 1997 is due primarily to losses incurred during 1997by various unprofitable business units that were eliminatedin 1998.
The majority of Fluor Global Services’ contracts pro-vide for reimbursement of costs plus a fixed or percentagefee. Due to intense competitive market conditions, there is an increasing trend for contracts with incentive-feearrangements or fixed or unit price contracts. In certaininstances, contracts provide guaranteed completion datesand/or achievement of other performance criteria. Failure
to meet schedule or performance guarantees or increases incontract costs can result in non-recoverable costs, whichcould exceed revenues realized from the project.
In December 1996, TRS Staffing Solutions, thesegment’s temporary personnel services business unit,acquired the ConSol Group; in May 1997, AMECOacquired the SMA Companies; and, in June 1997, AMECOacquired J.W. Burress, Inc. These businesses, in addition toother smaller acquisitions, were purchased for a total of$142 million.
All acquisitions have been accounted for under thepurchase method of accounting and their results of opera-tions have been included in the company’s consolidatedfinancial statements from the respective acquisition dates.If these acquisitions had been made at the beginning of1997, pro forma consolidated results of operations wouldnot have differed materially from actual results.
In October 1998, the company entered into an agree-ment to sell its ownership interest in Fluor Daniel GTI,Inc. (“FD/GTI”), an environmental services company.Under terms of the agreement, the company sold its4,400,000 shares in FD/GTI for $8.25 per share, or $36.3million in cash, on December 3, 1998. This transaction didnot have a material impact on the company’s results ofoperations or financial position. In August 1997, the com-pany completed the sale of ACQUION, a global providerof supply chain management services, for $12 million incash, resulting in a pre-tax gain of $7 million.
Coal Segment
Revenues and operating profit from Coal operations in1999 were $1.08 billion and $147 million, respectively,compared with $1.13 billion and $173 million in 1998.Revenues and operating profit in 1997 were $1.08 billionand $155 million, respectively.
Revenues decreased $44 million in 1999 comparedwith 1998 primarily due to the combination of a reduction in volume of the higher priced metallurgical coal and a decline in prices. Metallurgical coal volume decreasednearly 18 percent during 1999 compared with 1998. Thisdecrease was more than offset by an increase in lower pricedsteam coal volume. Also contributing to the decline in coalrevenues were lower realized prices for both steam andmetallurgical coal. Steam coal prices declined 4 percentwhile metallurgical coal prices declined 2 percent. Themetallurgical coal market continues to be adverselyaffected by steel imports from outside the United Statesand a weak U.S. coal export market. The imports havereduced demand for steel produced in the U.S. and thereby
Page 31
F l u o r C o r p o r a t i o n 19 9 9 A n n u a l R e p o r t
reduced U.S. demand for metallurgical coal, which is usedin steel production. Demand is weak for U.S. coal exportedto foreign markets as the U.S. Dollar remains strong andthe Asian economies slowly recover from their financialcrises. Additionally, the market for steam coal, which isused to fire electric-generating plants, continues to beimpacted by high customer inventory levels resulting fromlast year’s mild winter and competition from western coals,which continue to penetrate the traditional eastern coalmarket areas. Gross profit for the year ended October 31,1999 is down slightly from the same period in 1998 as aresult of lower metallurgical coal sales volume and lowerprices for both metallurgical and steam coal. Operatingprofit for 1999 is lower than 1998 due to higher fixedcosts, primarily depreciation, depletion and amortization,as volume levels have remained relatively flat.
The market conditions described above have placedpressure on both the sales volume and pricing outlook for2000. The company continues to focus on reducing miningproduction costs through expansion of its surface miningcapabilities and utilization of longwall mining.
Revenues increased $46 million in 1998 comparedwith 1997 primarily due to increased sales volume of met-allurgical coal, partially offset by lower steam coal prices.Metallurgical coal revenues increased 11 percent primarilydue to higher demand by steel producers. Steam coal rev-enues were flat on steady volume in 1998 as compared with1997, while steam coal prices declined approximately 3percent as overall demand was down due to both a mildwinter and summer in 1998. Gross profit increased by 15percent and operating profit increased by 12 percent in1998 compared with 1997, primarily due to reduced production costs and an increased proportion of highermargin metallurgical coal sales, partially offset by lowersteam coal prices.
Coal segment acquisitions during the three yearsended October 31, 1999 were primarily focused on thepurchase of additional low-sulfur coal reserves in areasadjacent to existing mine and mill operations. All acquisi-tions have been accounted for under the purchase methodof accounting and their results of operations have beenincluded in the company’s consolidated financial state-ments from the respective acquisition dates. If these acqui-sitions had been made at the beginning of the respectiveyear acquired, pro forma consolidated results of operationswould not have differed materially from actual results.
Strategic Reorganization Costs
As noted above, during 1999 the company reorganized itsengineering and construction operations. The companyrecorded a special provision of $117.2 million ($100.5 mil-lion after-tax) to cover direct and other reorganizationrelated costs, primarily for personnel, facilities and assetimpairment adjustments. The provision was initiallyrecorded during the second quarter at the then estimatedamount of $136.5 million ($119.8 million after-tax). Totalestimated personnel costs associated with the reorganiza-tion were reduced during the fourth quarter as both theactual number of employee terminations as well as the cost per employee termination were lower than originallyestimated.
Under the reorganization plan, approximately 5,000jobs are expected to be eliminated. The provision includesamounts for personnel costs for certain affected employeesthat are entitled to receive severance benefits under estab-lished severance policies or by government regulations.Additionally, outplacement services may be provided on alimited basis to some affected employees. The provisionalso reflects amounts for asset impairment, primarily forproperty, plant and equipment; intangible assets (good-will); and certain investments. The asset impairments wererecorded primarily because of the company’s decision toexit certain non-strategic geographic locations and busi-nesses. The carrying values of impaired assets were adjustedto their current market values based on estimated sale pro-ceeds, using either discounted cash flows or contractualamounts. Lease termination costs were also included in thespecial provision. The company anticipates closing 15 non-strategic offices worldwide as well as consolidating anddownsizing other office locations. The closure or rational-ization of these facilities is expected to be substantiallycomplete by the end of fiscal year 2000.
As of October 31, 1999, the company has reducedheadcount by approximately 5,000 employees and hasclosed 13 offices. The company anticipates closing twoadditional offices within the next six months. The specialprovision liability as of October 31, 1999 totaled $58.5million. The remaining liability for personnel costs ($25.2million) and asset impairments ($23.3 million) will besubstantially utilized by April 30, 2000. The remainingliability associated with abandoned lease space ($9.7 mil-lion) will be amortized as an offset to lease expense over theremaining life of the respective leases starting on the dateof abandonment.
Overhead beginning in 2000 is expected to be reducedby approximately $100 to $120 million annually as aresult of the personnel reductions and office closures.

Page 32
F l u o r C o r p o r a t i o n 19 9 9 A n n u a l R e p o r t
Other
Net interest expense for 1999 increased by $8.4 millioncompared with 1998 primarily due to an increase in inter-est expense resulting from higher average outstandingshort-term borrowings used to fund the company’s sharerepurchase program, which was completed in 1998. Inaddition, interest income declined as a result of lower aver-age cash balances outstanding during the year. Net interestexpense for 1998 increased compared with 1997 primarilydue to an increase in short-term borrowings required tofund the company’s share repurchase program and a fullyear of interest related to the $300 million in long-termdebt issued in March 1997.
Corporate administrative and general expense for theyear ended October 31, 1999 was $55.4 million comparedwith $22.6 million for the same period in 1998. Theincrease is due to higher stock-based compensation planexpense and an increase in consulting costs related to thedevelopment and implementation of the company’s newstrategic direction. Also included in corporate administra-tive and general expense for 1999 is approximately $8 mil-lion for the development of the company’s EnterpriseResource Management system, Knowledge@Work. In addi-tion, the year ended October 31, 1998 included a credit ofapproximately $10 million related to a long-term incen-tive compensation plan. The company accrues for certainlong-term incentive awards whose ultimate cost is depen-dent on attainment of various performance targets set by the Organization and Compensation Committee (the“Committee”) of the Board of Directors. Under the long-term incentive compensation plan referred to above, theperformance target expired, without amendment or exten-sion by the Committee, on December 31, 1997. Corporateadministrative and general expense for the year endedOctober 31, 1998, increased as compared with 1997 due tocosts associated with the company’s strategic business plan-ning effort, executive severance and recruiting costs. Alsoincluded was the $10 million credit noted above.
The effective tax rate for year ended October 31, 1999is significantly higher than the amount reported for thesame period in 1998 primarily due to certain non-U.S.items included in the special provision which did notreceive full tax benefit. The effective tax rate for the yearended October 31, 1998 was essentially the same as theU.S. federal statutory rate. In 1997, the effective tax rate
was materially higher than the U.S. federal statutory taxrate primarily due to foreign-based project losses, otherproject-related investment losses and certain implementa-tion costs for cost reduction initiatives incurred during theyear which did not receive full tax benefit.
Discontinued Operations
In October 1997, the company received $60 million repre-senting a negotiated prepayment of the remaining amountsoutstanding stemming from the 1994 sale of its Lead busi-ness. The amount received slightly exceeded the recordeddiscounted value of the receivable.
Financial Position and Liquidity
The decrease in cash provided by operating activities in1999, compared with 1998, is primarily due to lower netearnings (adjusted for the non-cash and unexpendedamounts of the special provision in 1999) and an increasein project-related operating assets and liabilities. Also con-tributing to the decline was an increase in inventories, forboth equipment for sale/rental and coal. The increase ininventories is the result of slowing markets. The receipt ofa $30 million tax refund also positively impacted operatingcash flow in 1998. The increase in cash provided by oper-ating activities in 1998, compared with 1997, is primarilydue to a net decrease in operating assets and liabilities(excluding the effects of business acquisitions and disposi-tions), primarily related to a decrease in the volume ofwork performed on engineering and construction con-tracts, and the aforementioned tax refund. Changes inoperating assets and liabilities vary from year to year andare affected by the mix, stage of completion and commer-cial terms of engineering and construction projects.
Cash utilized by investing activities totaled $375.2million in 1999 compared with $563.3 million in 1998.The decrease resulted primarily from lower capital expen-ditures and acquisitions, net of proceeds from the sale ofproperty, plant and equipment. Capital expenditures in1999 were primarily for the Fluor Global Services segment,specifically for AMECO and directed toward acquiringmachinery and equipment for its rental business, and forthe Coal segment, which were directed toward developingexisting reserves. In addition, capital expenditures in 1999include approximately $26 million of costs associated withKnowledge@Work. The company also completed the sale ofits ownership interest in FD/GTI during 1999 andreceived proceeds totaling $36.3 million. The increase in
cash utilized by investing activities in 1998 compared with1997, is primarily attributable to monies received in 1997from notes receivable related to the ongoing collection ofdeferred amounts associated with the company’s 1994 saleof its Lead business. Capital expenditures, net of proceedsfrom the sale of property, plant and equipment, increasedin 1998 compared with 1997, primarily in the FluorGlobal Services and Coal segments. Offsetting this increasewas a significant decline in acquisitions, again primarily inthe Fluor Global Services and Coal segments.
Cash utilized by financing activities totaled $220.6million in 1999 compared with $98.0 million in 1998.During 1999 the company reduced commercial paper andloan notes by $299.2 million partially offset by theissuance of a $113.4 million note payable to an affiliate. Inaddition, the company became obligated with respect to$17.6 million in long-term municipal bonds. Cash utilizedby financing activities totaled $98.0 million in 1998 com-pared with 1997 during which time the company providedcash from financing activities of $235.7 million. In 1998,the company had short-term borrowings of $341.8 millionto fund its 1997/1998 share repurchase program. Underthis program, the company repurchased 8.3 million sharesof its common stock for a total of $379.0 million. In 1997,the company issued $300 million of 6.95 percent seniornotes due March 1, 2007. Proceeds were used to fund oper-ating working capital, capital expenditures and the com-pany’s share repurchase program. During 1997, thecompany purchased .6 million shares of its common stockfor a total of $34 million.
Cash dividends decreased in 1999 to $60.7 million($.80 per share) from $63.5 million ($.80 per share) in1998 and $63.8 million ($.76 per share) in 1997 as a con-sequence of the reduced number of shares outstanding thatresulted from the company’s share repurchase program. InDecember 1999, the company announced an increase in itsquarterly cash dividend from $.20 per share to $.25 pershare in 2000.
The total debt to capitalization ratio at October 31,1999, was 26.3 percent compared with 32.4 percent atOctober 31, 1998.
The company has on hand and access to sufficientsources of funds to meet its anticipated operating needs.Significant short- and long-term lines of credit are main-tained with banks which, along with cash on hand, provideadequate operating liquidity. Liquidity is also provided bythe company’s commercial paper program under which
there was $113.7 million outstanding at October 31, 1999,compared with $245.5 million at October 31, 1998. InDecember 1998, the company expanded both its revolvingcredit facility and its commercial paper program from$400 million to $600 million. During January 1999, thecompany filed a shelf registration statement with theSecurities and Exchange Commission for the sale of up to$500 million in debt securities.
Although the company is affected by inflation and thecyclical nature of the industry, its engineering and con-struction operations are generally protected by the abilityto fix costs at the time of bidding or to recover costincreases in most contracts. Coal operations produce a com-modity that is internationally traded at prices establishedby market factors outside the control of the company.However, commodity prices generally tend over the longterm to correlate with inflationary trends, and the com-pany’s substantial coal reserves provide a hedge against thelong-term effects of inflation. Although the company hastaken actions to reduce its dependence on external eco-nomic conditions, management is unable to predict withcertainty the amount and mix of future business.
Financial Instruments
In connection with its 1997/1998 share repurchase pro-gram, the company entered into a forward purchase con-tract for 1,850,000 shares of its common stock at a price of$49 per share. The contract matures in October 2000 andgives the company the ultimate choice of settlementoption, either physical settlement or net share settlement.As of October 31, 1999, the contract settlement cost pershare exceeded the current market price per share by $11.44.
Although the ultimate choice of settlement optionresides with the company, if the price of the company’scommon stock falls to certain levels, as defined in the con-tract, the holder of the contract has the right to require thecompany to settle the contract.
The company’s investment securities and substantiallyall of its debt instruments carry fixed rates of interest overtheir respective maturity terms. The company does notcurrently use derivatives, such as swaps, to alter the inter-est characteristics of its investment securities or its debtinstruments. The company’s exposure to interest rate risk
Page 33
F l u o r C o r p o r a t i o n 19 9 9 A n n u a l R e p o r t

Page 34
F l u o r C o r p o r a t i o n 19 9 9 A n n u a l R e p o r t
on its $300 million senior notes, due in 2007, is not mate-rial given the company’s strong balance sheet and credit-worthiness which provides the ability to refinance.
The company utilizes forward exchange contracts tohedge foreign currency transactions entered into in theordinary course of business and not to engage in currencyspeculation. At October 31, 1999 and 1998, the companyhad forward foreign exchange contracts of less than eighteen months duration, to exchange principallyAustralian Dollars, Canadian Dollars, Korean Won, DutchGuilders and German Marks for U.S. Dollars. In addition,the company has a forward foreign currency contract toexchange U.S. Dollars for British Pounds Sterling to hedgeannual lease commitments which expired December 1999.The total gross notional amount of these contracts atOctober 31, 1999 and 1998 was $124 million and $106million, respectively. Forward contracts to purchase foreign currency represented $122 million and $102 million, and forward contracts to sell foreign currency rep-resented $2 million and $4 million, at October 31, 1999and 1998, respectively.
The Year 2000 Issue — Readiness Disclosure
The Year 2000 issue is the result of computer systems andother equipment with processors that use only two digitsto identify a year rather than four. If not corrected, manycomputer applications and date sensitive equipment couldfail or create erroneous results before, during and after theYear 2000. The company utilizes information technology(“IT”) systems, such as computer networking systems andnon-IT devices, which may contain embedded circuits,such as those which may be found in building securityequipment. Both IT systems and non-IT devices are sub-ject to potential failure due to the Year 2000 issue.
The company has developed and implemented a planto achieve Year 2000 readiness (the “Y2K Program”).Progress reports on the Y2K Program are presentedregularly to the company’s senior management and peri-odically to the Audit Committee of the company’s Board of Directors.
The company identified and assigned priority to cer-tain mission critical systems. The company defines missioncritical systems as those that might have a significantadverse effect in one or more of the following areas: safety,environmental, legal or financial exposure and companycredibility and image.
The company’s Y2K Program has been implementedin the following three phases: (1) Identification Phase –includes the identification and assessment of Year 2000problems requiring systems modifications or replacements;(2) Remediation Phase – includes the remediation and test-ing of systems having Year 2000 problems and the identi-fication of compliant systems’ installation scheduledduring 1999; and (3) Contingency Planning Phase –includes the development of contingency and business con-tinuity plans to mitigate the effect of any system or equip-ment failure. The timeframe for each phase of the Y2KProgram are represented in the following table:
Start Date End Date
Identification Phase Early 1996 December 31, 1998Remediation Phase Late 1996 October 31, 1999Contingency Planning Phase Late 1998 Ongoing into 2000
As of October 31, 1999, the company’s software appli-cations are Year 2000 compliant, although a small numberof systems have a November installation date to accom-modate user system schedules. As of October 31, 1999, the company’s hardware is Year 2000 compliant with the exception of the phone system at one business unitwhere a compliant system is scheduled for installation inearly December. Transitioning into Year 2000, the com-pany did not experience any material issues and all of itscomputer systems are operating normally. The companywill continue to monitor its systems on an ongoing basisfor the immediate future. As of January 13, 2000, the com-pany has not been made aware of any Year 2000 disrup-tions for which it is responsible at any of its various projectsites throughout the world.
With respect to systems acquired by the company forits own account or the account of customers, the companyuses standard compliance processes to certify Year 2000compliance. The company requires that all suppliers certifyand, where appropriate, guarantee that the systems andequipment they provide to the company for its ownaccount and the account of its customers are Year 2000compliant. In addition to requiring such certifications, thecompany also has completed a process of reviewing theYear 2000 compliance of critical suppliers. Actionsincluded the review of remediation and testing of specificequipment, review of suppliers’ corporate Year 2000progress and confirmation of electronic exchange formats.Where appropriate, the company has followed up itsreview of supplier information with telephone interviews
Page 35
F l u o r C o r p o r a t i o n 19 9 9 A n n u a l R e p o r t
and on-site visits. Where a supplier has not, or cannot, sat-isfy the company’s Year 2000 requirements, the companyhas sought alternate suppliers, subject to customer require-ments and contract specifications. Although initial reviewsand the results following the company’s transition intoYear 2000 indicate that Year 2000 compliance by the com-pany’s suppliers should not have a material adverse affecton the company’s operations, there can be no assurance thatall Year 2000 issues have been resolved in a timely manner.
With respect to Engineering Systems, the companyhas retired approximately 38 percent of its engineeringapplications software to streamline its operations, reducesupport costs and avoid costs of Year 2000 remediation.The cost of such software, to the extent originally capital-ized, has been fully amortized and the company does notexpect any significant write off as the result of such retire-ment. The implementation of compliant versions of allremaining Engineering Systems is complete, with theremediation of those remaining applications largely beingaddressed via upgrades.
All Project Site Specific Systems are Year 2000 ready,including the Department of Energy’s projects and thecontrol systems in use at the company’s coal plants.
With respect to Customer Systems and current cus-tomer projects generally, the company has evaluated thosesystems and projects to determine whether or not anyaction is required to ensure Year 2000 readiness. The com-pany has reviewed projects where it has ongoing warrantyor performance obligations for Year 2000 issues. It targetedapproximately 1,600 projects for additional Year 2000assessment, all of which have been reviewed. At those pro-jects where Year 2000 issues may exist, the company hasevaluated what further action is required and any requiredremediation and contingency planning is complete. Thecompany relies directly and indirectly on external systemsutilized by its suppliers and on equipment and materialsprovided by those suppliers and used for the company’sbusiness. As discussed above, the company has imple-mented a procedure for reviewing Year 2000 complianceby its suppliers, which will be ongoing into year 2000.
With respect to systems and equipment provided toclients, the company does not control the upgrades, addi-tions and/or changes made by its clients, or by others for itsclients, to those systems and equipment. Accordingly, thecompany does not provide any assurances, nor currentinformation about Year 2000 capabilities, nor potential
Year 2000 problems, with respect to past projects. Eachproject is performed under an agreement with the com-pany’s client. Those agreements specifically outline theextent of the company’s obligations and warranties and thelimitations that may apply.
The company has investments in various joint ven-tures and has monitored the Year 2000 efforts of such jointventures. Based on available information, the companybelieves business systems used in such joint ventures areYear 2000 ready.
The company uses both internal and external resourcesin its Y2K Program. The company estimates that, from1996 to date, it has spent approximately $25 million onthe Year 2000 issue. It anticipates spending an additional$.6 million during the first quarter of fiscal year 2000. The estimate of additional spending was derived utilizingnumerous assumptions, including the assumption that thecompany has already identified and completed its most significant Year 2000 issues and that plans of its thirdparty suppliers will be fulfilled in a timely manner withoutcost to the company.
The company estimates that 44 percent of the totalcosts incurred for the Y2K Program have been incurred to remediate systems (including software upgrades); theremaining 56 percent of the total costs incurred have beenincurred to replace systems and equipment. The companyestimates its direct costs for the Y2K Program (costs nec-essary to assess and remediate existing systems) are approx-imately $14 million. In addition to the direct costs of theY2K Program, the company has accelerated its program ofreplacing out-of-date personal computers and operatingsystems, regardless of whether or not such computers andsystems were Year 2000 compliant. All replacement equip-ment and systems are Y2K compliant. The costs associatedwith those replacements are estimated at $11 million. Thecompany estimates it has spent $14 million to date andwill spend an additional $.3 million in connection withreplacing equipment and systems.
The Y2K Program has been funded under the com-pany’s general IT and operating budgets. In 1999, Y2KProgram costs were 11 percent of the IT budget. The Year2000 expenditures have been and will continue to beexpensed and deducted from income when incurred, exceptfor costs incurred to acquire new software developed or obtained to replace old software which may be capital-ized and amortized under generally accepted accountingprinciples. No significant internal systems projects weredeferred due to the Y2K Program efforts. The aboveamounts are the company’s best estimate given other

Page 36
F l u o r C o r p o r a t i o n 19 9 9 A n n u a l R e p o r t
systems initiatives that were ongoing irrespective of the Y2K Program (such as the migration to Windows NT andrelated hardware upgrades). However, there can be noguarantee that these assumptions are accurate, and actualresults could differ materially from those anticipated.
The company has developed contingency plans toaddress the Year 2000 issues that may pose a significantrisk to its ongoing operations and existing projects, includ-ing an early warning system developed for the millenniumtransition. Such plans include the implementation of alter-nate procedures to compensate for any system and equip-ment malfunctions or deficiencies with the company’sinternal systems and equipment, with systems and equip-ment utilized at the company’s project sites, with systemsand equipment provided to clients and with systems andequipment supplied by third parties. Due to the largenumber of variables involved with estimating resultant lostrevenues should there be a third party failure, the companycannot provide an estimate of damage if any of the scenar-ios were to occur. There can be no assurance that any con-tingency plans implemented by the company would beadequate to meet the company’s needs without materiallyimpacting its operations, that any such plan would be suc-cessful or that the company’s results of operations wouldnot be materially and adversely affected by the delays andinefficiencies inherent in conducting operations in an alter-native manner.
The company’s Y2K Program is subject to a variety ofrisks and uncertainties, some of which are beyond the com-pany’s control. Those risks and uncertainties include, butare not limited to, the Year 2000 readiness of third partiesand the Year 2000 compliance of systems and equipmentprovided by suppliers.
The company believes that its most reasonably likelyworst case Year 2000 scenarios would relate to problemswith the systems of third parties, rather than with the company’s internal systems. At this time, the companybelieves that risks are greatest in the area of third party sys-tem and equipment suppliers. Each of the company’s loca-tions relies on suppliers for basic utility service as well asthe timely provision of project services and equipment. Ifthe supply of such necessary services and equipment wereto fail at any location, the company’s operations at thatlocation, whether consisting of engineering, design or con-struction activities, maintenance services or coal mining
and processing, would essentially be shut down or disrupted until such services and equipment deliverieswere restored. Depending on the location, the companycould suffer delays in performing contracts and in other-wise fulfilling its commitments. Such delays could materi-ally adversely impact the company’s receipt of paymentsdue from customers upon its tender of contract deliverablesor upon achievement of contract milestones. The companybelieves that the geographical dispersion of the company’sfacilities mitigates the risk that such failures in any localeor at any project site will result in the simultaneous closureof, or sustained suspension of operations at, multiple com-pany facilities or at project sites. Consequently, to theextent practical, the company expects to mitigate anyinterruption in its business operations in one location byshifting the performance of the constrained activity to afunctioning office or facility. There may be instances, how-ever, where the activity cannot be performed elsewhere oron a timely basis given the disruption caused by the Year2000 problems in any location. In such instances, the com-pany will assess the relevant provisions of its contracts and,where it deems appropriate, work with its customers toresolve performance and schedule delays and any resultingfinancial consequences on a mutually satisfactory basis tothe extent possible under then prevailing circumstances.
No assurance can be given that the company willachieve all aspects of Year 2000 readiness. Further, there isthe possibility that significant litigation may occur due tobusiness and equipment failures caused by the Year 2000issue. It is uncertain whether, or to what extent, the com-pany may be affected by such litigation. The failure of thecompany, its clients (including governmental agencies),suppliers of computer systems and equipment, joint ven-ture partners and other third parties upon whom the com-pany relies, to achieve Year 2000 readiness could materiallyand adversely affect the company’s results from operations.
Euro Conversion
Given the nature and size of the company’s European oper-ations, the company does not perceive the conversion to theEuro as a significant risk. The company’s businesses oper-ate under long-term contracts, typically denominated inU.S. Dollars, compared with more traditional retail ormanufacturing environments. If required, the company iscurrently able to bid, price and negotiate contracts usingthe Euro. The company’s treasury function is also capableof operating with the Euro. Specifically, the company isable to: establish bank accounts; obtain financing; obtain
Page 37
F l u o r C o r p o r a t i o n 19 9 9 A n n u a l R e p o r t
bank guarantees or letters of credit; trade foreign currency; and hedge transactions. The company’s ongoing Euroconversion effort will be primarily concentrated in the sys-tems area.
Conversion to the Euro impacts the company’s sub-sidiaries in The Netherlands, Germany, Belgium andSpain. All subsidiaries use a standard accounting systemand all reside in the same database. The company’s conver-sion plan is to maintain the legacy database for historicalreference and to create a new database with the Euro as thebase currency. The new database will permit transactions totake place in both legacy currencies and the Euro as well asperform prescribed rounding calculations. The new Euro-based database is available and testing is in progress. Fullconversion is anticipated to be complete by the start of fis-cal year 2001.
The company has not incurred and it does not expectto incur any significant costs from the continued conver-sion to the Euro, including any currency risk, which couldsignificantly affect the company’s business, financial condi-tion and results of operations.
The company has not experienced any significantoperational disruptions to date and does not currentlyexpect the continued conversion to the Euro to cause anysignificant operational disruptions, including the impactof systems operated by others.
New Accounting Pronouncements
In June 1998, the Financial Accounting Standards Boardissued Statement of Financial Accounting Standards No.133, “Accounting for Derivative Instruments and HedgingActivities” (SFAS No. 133). SFAS No. 133 establishes newstandards for recording derivatives in interim and annualfinancial statements. This statement, as amended, is effec-tive for the company’s fiscal year 2001. Management doesnot anticipate that the adoption of the new statement willhave a significant impact on the results of operations or thefinancial position of the company.

Page 38
F l u o r C o r p o r a t i o n 19 9 9 A n n u a l R e p o r t
C o n s o l i d at e d B a l a n c e S h e e t
At October 31, 1999 1998
(in thousands)
AssetsC u r r e n t A s s e t sCash and cash equivalents $ 209,614 $ 340,544Accounts and notes receivable 850,557 959,416Contract work in progress 416,285 596,983Inventories 248,118 198,645Deferred taxes 105,502 81,155Other current assets 80,095 64,108Net assets held for sale — 36,300
Total current assets 1,910,171 2,277,151
P r o p e r t y , P l a n t a n d E q u i p m e n tLand 71,664 69,779Buildings and improvements 352,883 352,653Machinery and equipment 2,103,663 2,012,539Mining properties and mineral rights 858,965 788,978Construction in progress 81,422 56,282
3,468,597 3,280,231Less accumulated depreciation, depletion and amortization 1,245,644 1,132,923
Net property, plant and equipment 2,222,953 2,147,308
O t h e r A s s e t sGoodwill, net of accumulated amortization of $32,458 and $33,766, respectively 116,045 139,091Investments 167,891 137,562Other 469,057 318,096
Total other assets 752,993 594,749
$4,886,117 $5,019,208
Liabil ities and Shareholders’ EquityC u r r e n t L i a b i l i t i e sTrade accounts and notes payable $ 798,751 $ 972,096Commercial paper, loan notes and a note payable to affiliate of $113,379 in 1999 242,625 428,458Advance billings on contracts 565,373 546,816Accrued salaries, wages and benefit plan liabilities 321,148 324,412Other accrued liabilities 276,413 223,596Current portion of long-term debt — 176
Total current liabilities 2,204,310 2,495,554
L o n g - Te r m D e b t D u e A f t e r O n e Ye a r 317,555 300,428N o n c u r r e n t L i a b i l i t i e sDeferred taxes 162,210 105,515Other 620,670 592,102
Total noncurrent liabilities 782,880 697,617
C o n t i n g e n c i e s a n d C o m m i t m e n t sS h a r e h o l d e r s ’ E q u i t yCapital stock
Preferred — authorized 20,000,000 shares without par value, none issuedCommon — authorized 150,000,000 shares of $.625 par value; issued and
outstanding in 1999 — 76,034,296 shares and in 1998 — 75,572,537 shares 47,521 47,233Additional capital 217,844 199,077Retained earnings 1,375,338 1,331,843Unamortized executive stock plan expense (21,579) (22,633)Accumulated other comprehensive income (37,752) (29,911)
Total shareholders’ equity 1,581,372 1,525,609
$4,886,117 $5,019,208
See Notes to Consolidated Financial Statements.
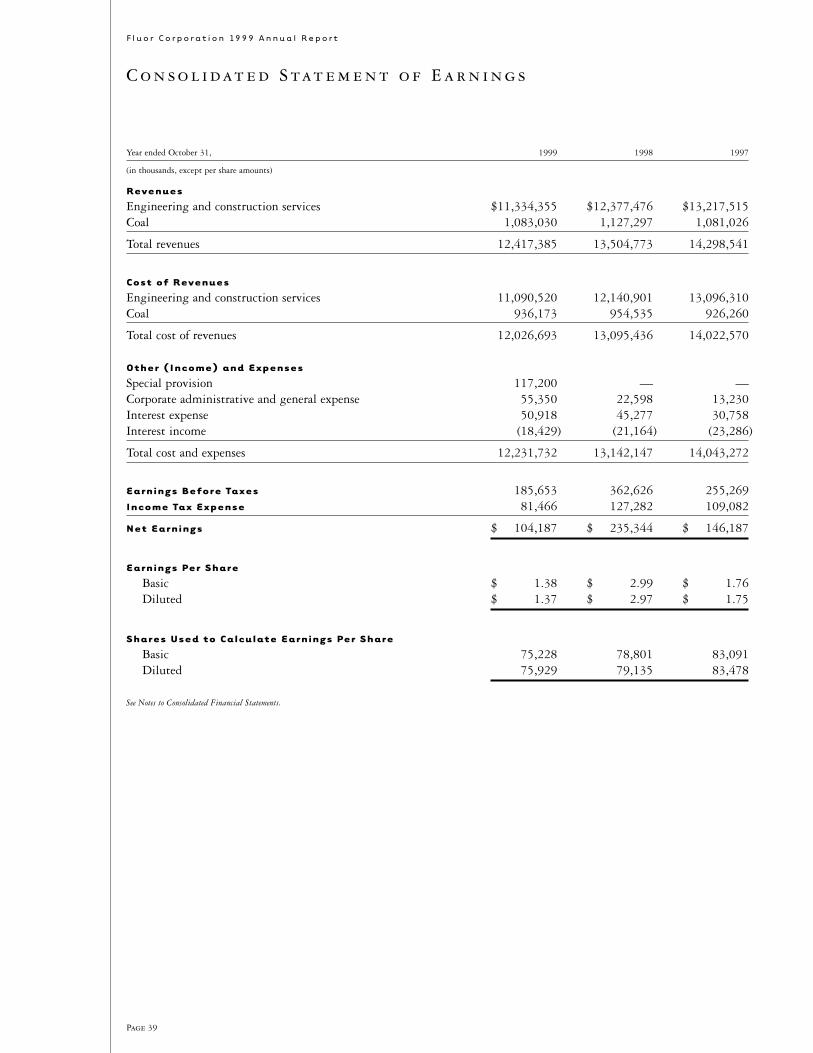
Page 39
F l u o r C o r p o r a t i o n 19 9 9 A n n u a l R e p o r t
C o n s o l i d at e d S tat e m e n t o f E a r n i n g s
Year ended October 31, 1999 1998 1997
(in thousands, except per share amounts)
Revenues
Engineering and construction services $11,334,355 $12,377,476 $13,217,515Coal 1,083,030 1,127,297 1,081,026
Total revenues 12,417,385 13,504,773 14,298,541
Cost of Revenues
Engineering and construction services 11,090,520 12,140,901 13,096,310Coal 936,173 954,535 926,260
Total cost of revenues 12,026,693 13,095,436 14,022,570
Other (Income) and Expenses
Special provision 117,200 — —Corporate administrative and general expense 55,350 22,598 13,230Interest expense 50,918 45,277 30,758Interest income (18,429) (21,164) (23,286)
Total cost and expenses 12,231,732 13,142,147 14,043,272
Earnings Before Taxes 185,653 362,626 255,269Income Tax Expense 81,466 127,282 109,082
Net Earnings $ 104,187 $ 235,344 $ 146,187
Earnings Per Share
Basic $ 1.38 $ 2.99 $ 1.76Diluted $ 1.37 $ 2.97 $ 1.75
Shares Used to Calculate Earnings Per Share
Basic 75,228 78,801 83,091Diluted 75,929 79,135 83,478
See Notes to Consolidated Financial Statements.
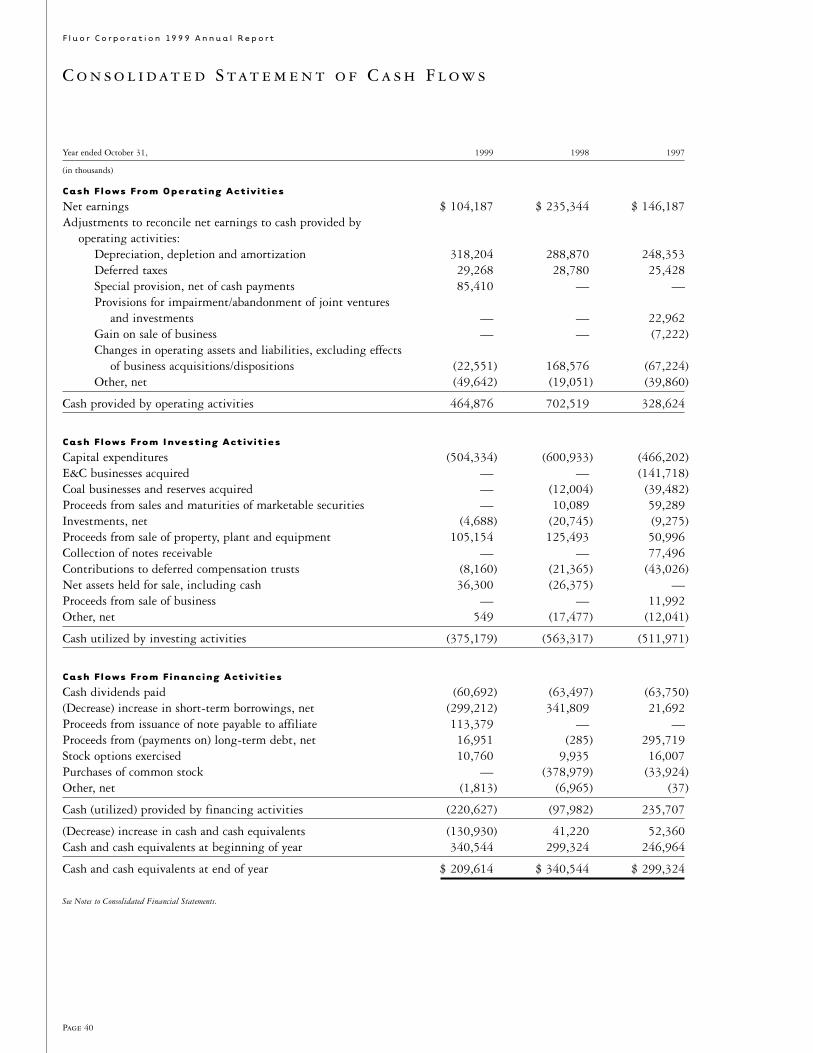
Page 40
F l u o r C o r p o r a t i o n 19 9 9 A n n u a l R e p o r t
C o n s o l i d at e d S tat e m e n t o f C a s h F l o w s
Year ended October 31, 1999 1998 1997
(in thousands)
Cash Flows From Operating Activities
Net earnings $ 104,187 $ 235,344 $ 146,187Adjustments to reconcile net earnings to cash provided by
operating activities:Depreciation, depletion and amortization 318,204 288,870 248,353Deferred taxes 29,268 28,780 25,428Special provision, net of cash payments 85,410 — —Provisions for impairment/abandonment of joint ventures
and investments — — 22,962Gain on sale of business — — (7,222)Changes in operating assets and liabilities, excluding effects
of business acquisitions/dispositions (22,551) 168,576 (67,224)Other, net (49,642) (19,051) (39,860)
Cash provided by operating activities 464,876 702,519 328,624
Cash Flows From Investing Activities
Capital expenditures (504,334) (600,933) (466,202)E&C businesses acquired — — (141,718)Coal businesses and reserves acquired — (12,004) (39,482)Proceeds from sales and maturities of marketable securities — 10,089 59,289Investments, net (4,688) (20,745) (9,275)Proceeds from sale of property, plant and equipment 105,154 125,493 50,996Collection of notes receivable — — 77,496Contributions to deferred compensation trusts (8,160) (21,365) (43,026)Net assets held for sale, including cash 36,300 (26,375) —Proceeds from sale of business — — 11,992Other, net 549 (17,477) (12,041)
Cash utilized by investing activities (375,179) (563,317) (511,971)
Cash Flows From Financing Activities
Cash dividends paid (60,692) (63,497) (63,750)(Decrease) increase in short-term borrowings, net (299,212) 341,809 21,692Proceeds from issuance of note payable to affiliate 113,379 — —Proceeds from (payments on) long-term debt, net 16,951 (285) 295,719Stock options exercised 10,760 9,935 16,007Purchases of common stock — (378,979) (33,924)Other, net (1,813) (6,965) (37)
Cash (utilized) provided by financing activities (220,627) (97,982) 235,707
(Decrease) increase in cash and cash equivalents (130,930) 41,220 52,360Cash and cash equivalents at beginning of year 340,544 299,324 246,964
Cash and cash equivalents at end of year $ 209,614 $ 340,544 $ 299,324
See Notes to Consolidated Financial Statements.
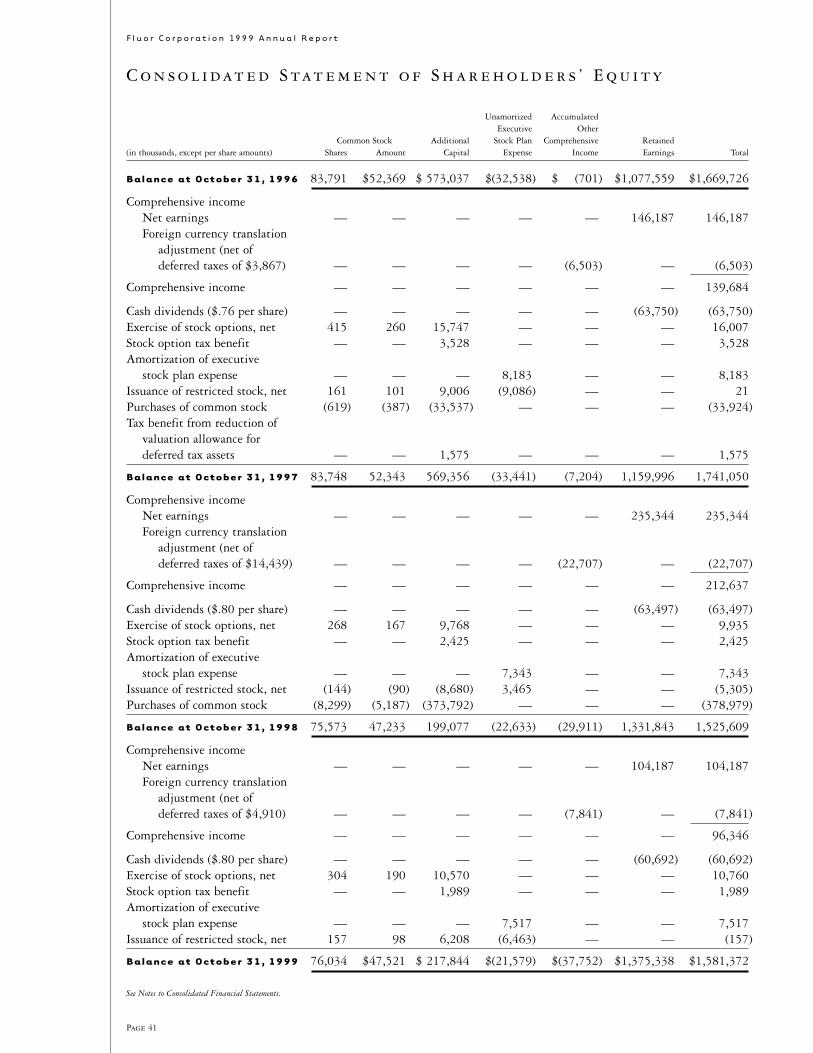
Page 41
F l u o r C o r p o r a t i o n 19 9 9 A n n u a l R e p o r t
C o n s o l i d at e d S tat e m e n t o f S h a r e h o l d e r s ’ E q u i t y
Unamortized AccumulatedExecutive Other
Common Stock Additional Stock Plan Comprehensive Retained(in thousands, except per share amounts) Shares Amount Capital Expense Income Earnings Total
Balance at October 31, 1996 83,791 $52,369 $ 573,037 $(32,538) $ (701) $1,077,559 $1,669,726
Comprehensive incomeNet earnings — — — — — 146,187 146,187Foreign currency translation
adjustment (net of deferred taxes of $3,867) — — — — (6,503) — (6,503)
Comprehensive income — — — — — — 139,684
Cash dividends ($.76 per share) — — — — — (63,750) (63,750)Exercise of stock options, net 415 260 15,747 — — — 16,007Stock option tax benefit — — 3,528 — — — 3,528Amortization of executive
stock plan expense — — — 8,183 — — 8,183Issuance of restricted stock, net 161 101 9,006 (9,086) — — 21Purchases of common stock (619) (387) (33,537) — — — (33,924)Tax benefit from reduction of
valuation allowance for deferred tax assets — — 1,575 — — — 1,575
Balance at October 31, 1997 83,748 52,343 569,356 (33,441) (7,204) 1,159,996 1,741,050
Comprehensive incomeNet earnings — — — — — 235,344 235,344Foreign currency translation
adjustment (net of deferred taxes of $14,439) — — — — (22,707) — (22,707)
Comprehensive income — — — — — — 212,637
Cash dividends ($.80 per share) — — — — — (63,497) (63,497)Exercise of stock options, net 268 167 9,768 — — — 9,935Stock option tax benefit — — 2,425 — — — 2,425Amortization of executive
stock plan expense — — — 7,343 — — 7,343Issuance of restricted stock, net (144) (90) (8,680) 3,465 — — (5,305)Purchases of common stock (8,299) (5,187) (373,792) — — — (378,979)
Balance at October 31, 1998 75,573 47,233 199,077 (22,633) (29,911) 1,331,843 1,525,609
Comprehensive incomeNet earnings — — — — — 104,187 104,187Foreign currency translation
adjustment (net of deferred taxes of $4,910) — — — — (7,841) — (7,841)
Comprehensive income — — — — — — 96,346
Cash dividends ($.80 per share) — — — — — (60,692) (60,692)Exercise of stock options, net 304 190 10,570 — — — 10,760Stock option tax benefit — — 1,989 — — — 1,989Amortization of executive
stock plan expense — — — 7,517 — — 7,517Issuance of restricted stock, net 157 98 6,208 (6,463) — — (157)
Balance at October 31, 1999 76,034 $47,521 $ 217,844 $(21,579) $(37,752) $1,375,338 $1,581,372
See Notes to Consolidated Financial Statements.
Page 42
F l u o r C o r p o r a t i o n 19 9 9 A n n u a l R e p o r t
N o t e s t o C o n s o l i d at e d F i n a n c i a l S tat e m e n t s
Major Accounting Policies
P r i n c i p l e s o f C o n s o l i d a t i o n
The financial statements include the accounts of the com-pany and its subsidiaries. The equity method of accountingis used for investment ownership ranging from 20 percentto 50 percent. Investment ownership of less than 20 per-cent is accounted for on the cost method. All significantintercompany transactions of consolidated subsidiaries areeliminated. Certain 1998 and 1997 amounts have beenreclassified to conform with the 1999 presentation.
U s e o f E s t i m a t e s
The preparation of the financial statements of the companyrequires management to make estimates and assumptionsthat affect reported amounts. These estimates are based on information available as of the date of the financialstatements. Therefore, actual results could differ fromthose estimates.
E n g i n e e r i n g a n d C o n s t r u c t i o n C o n t r a c t s
The company recognizes engineering and constructioncontract revenues using the percentage-of-completionmethod, based primarily on contract costs incurred to datecompared with total estimated contract costs. Customer-furnished materials, labor and equipment, and in certaincases subcontractor materials, labor and equipment, areincluded in revenues and cost of revenues when manage-ment believes that the company is responsible for the ulti-mate acceptability of the project. Contracts are segmentedbetween types of services, such as engineering and con-struction, and accordingly, gross margin related to eachactivity is recognized as those separate services are ren-dered. Changes to total estimated contract costs or losses,if any, are recognized in the period in which they are deter-mined. Revenues recognized in excess of amounts billed areclassified as current assets under contract work in progress.Amounts billed to clients in excess of revenues recognizedto date are classified as current liabilities under advancebillings on contracts. The company anticipates that sub-stantially all incurred costs associated with contract workin progress at October 31, 1999 will be billed and col-lected in 2000.
D e p r e c i a t i o n , D e p l e t i o n a n d A m o r t i z a t i o n
Additions to property, plant and equipment are recorded at cost. Assets other than mining properties and mineralrights are depreciated principally using the straight-linemethod over the following estimated useful lives: build-ings and improvements — three to 50 years and machin-ery and equipment — two to 30 years. Mining propertiesand mineral rights are depleted on the units-of-productionmethod. Leasehold improvements are amortized over the
lives of the respective leases. Goodwill is amortized on thestraight-line method over periods not longer than 40 years.
E x p l o r a t i o n , D e v e l o p m e n t a n d R e c l a m a t i o n
Coal exploration costs are expensed as incurred. Develop-ment and acquisition costs of coal properties, when signifi-cant, are capitalized in mining properties and depleted.The company accrues for post-mining reclamation costs ascoal is mined. Reclamation of disturbed surface acreage isperformed as a normal part of the mining process.
I n c o m e Ta x e s
Deferred tax assets and liabilities are recognized for theexpected future tax consequences of events that have beenrecognized in the company’s financial statements or tax returns.
E a r n i n g s p e r S h a r e
Basic earnings per share (EPS) is calculated by dividing netearnings by the weighted average number of commonshares outstanding for the period. Diluted EPS reflects theassumed conversion of all dilutive securities, consisting ofemployee stock options and restricted stock, and equityforward contracts.
The impact of dilutive securities on the company’sEPS calculation is as follows:
Year ended October 31, 1999 1998 1997
Employee stock options/restricted stock 107,000 231,000 387,000
Equity forward contracts 594,000 103,000 –
701,000 334,000 387,000
I n v e n t o r i e s
Inventories are stated at the lower of cost or market usingspecific identification or the average cost method.Inventories comprise:
At October 31, 1999 1998
(in thousands)
Equipment for sale/rental $131,781 $ 94,179Coal 72,070 52,628Supplies and other 44,267 51,838
$248,118 $198,645
I n t e r n a l U s e S o f t w a r e
Effective for fiscal year 1999, the company adopted theAmerican Institute of Certified Public Accountants’Statement of Position (SOP) 98-1, “Accounting for theCosts of Computer Software Developed or Obtained forInternal Use.” The statement requires capitalization of cer-tain costs incurred in the development of internal-use soft-ware, including external direct material and service costs,
Page 43
F l u o r C o r p o r a t i o n 19 9 9 A n n u a l R e p o r t
employee payroll and payroll-related costs. Prior to theadoption of SOP 98-1, the company capitalized only pur-chased software which was ready for service; all other costswere expensed as incurred. The adoption of this statementdid not have a material effect on the company’s financialstatements.
F o r e i g n C u r r e n c y
The company uses forward exchange contracts to hedgecertain foreign currency transactions entered into in theordinary course of business. The company does not engagein currency speculation. The company’s forward exchangecontracts do not subject the company to significant riskfrom exchange rate movements because gains and losses onsuch contracts offset losses and gains, respectively, on theassets, liabilities or transactions being hedged.Accordingly, the unrealized gains and losses are deferredand included in the measurement of the related foreigncurrency transaction. At October 31, 1999, the companyhad approximately $124 million of foreign exchange con-tracts outstanding relating to lease commitments and con-tract obligations. The forward exchange contracts generallyrequire the company to exchange U.S. Dollars for foreigncurrencies at maturity, at rates agreed to at inception of thecontracts. If the counterparties to the exchange contracts(AA rated banks) do not fulfill their obligations to deliverthe contracted currencies, the company could be at risk forany currency related fluctuations. The amount of any gainor loss on these contracts in 1999, 1998 and 1997 wasimmaterial. The contracts are of varying duration, none ofwhich extend beyond December 2000. The company lim-its exposure to foreign currency fluctuations in most of itsengineering and construction contracts through provisionsthat require client payments in U.S. Dollars or other cur-rencies corresponding to the currency in which costs areincurred. As a result, the company generally does not needto hedge foreign currency cash flows for contract work per-formed. The functional currency of all significant foreignoperations is the local currency.
In June 1998, the Financial Accounting StandardsBoard issued Statement of Financial Accounting StandardsNo. 133, “Accounting for Derivative Instruments andHedging Activities” (SFAS No. 133). SFAS No. 133 estab-lishes new standards for recording derivatives in interimand annual financial statements. This statement, asamended, is effective for the company’s fiscal year 2001.Management does not anticipate that the adoption of thenew statement will have a significant impact on the resultsof operations or the financial position of the company.
C o n c e n t r a t i o n s o f C r e d i t R i s k
The majority of accounts receivable and all contract workin progress are from engineering and construction clientsin various industries and locations throughout the world.Most contracts require payments as the projects progress orin certain cases advance payments. The company generallydoes not require collateral, but in most cases can place liensagainst the property, plant or equipment constructed or terminate the contract if a material default occurs.Accounts receivable from customers of the company’s coaloperations are primarily concentrated in the steel and util-ity industries. The company maintains adequate reservesfor potential credit losses and such losses have been mini-mal and within management’s estimates.
S t o c k P l a n s
The company accounts for stock-based compensation usingthe intrinsic value method prescribed by AccountingPrinciples Board (APB) Opinion No. 25, “Accounting forStock Issued to Employees,” and related Interpretations.Accordingly, compensation cost for stock options is mea-sured as the excess, if any, of the quoted market price of thecompany’s stock at the date of the grant over the amountan employee must pay to acquire the stock. Compensationcost for stock appreciation rights and performance equityunits is recorded based on the quoted market price of thecompany’s stock at the end of the period.
C o m p r e h e n s i v e I n c o m e
Effective November 1, 1998, the company adoptedStatement of Financial Accounting Standards No. 130,“Reporting Comprehensive Income,” which establishesstandards for the reporting and display of total compre-hensive income and its components in financial statements.The adoption of this statement had no effect on the com-pany’s net earnings or total shareholders’ equity.
Total comprehensive income represents the net changein shareholders’ equity during a period from sources otherthan transactions with shareholders and as such, includesnet earnings. For the company, the only other componentof total comprehensive income is the change in the cumu-lative foreign currency translation adjustments recorded in shareholders’ equity. Prior period financial statementshave been reclassified to conform with the provisions of the new standard.
Consolidated Statement of Cash Flows
Securities with maturities of 90 days or less at the date ofpurchase are classified as cash equivalents. Securities withmaturities beyond 90 days, when present, are classified asmarketable securities and are carried at fair value. Thechanges in operating assets and liabilities as shown in the
Page 44
F l u o r C o r p o r a t i o n 19 9 9 A n n u a l R e p o r t
Consolidated Statement of Cash Flows comprise:Year ended October 31, 1999 1998 1997
(in thousands)
Decrease (increase) in:Accounts and notes receivable $ 25,972 $ (84,394) $(113,454)Contract work in progress 180,698 73,575 (130,257)Inventories (49,473) (23,197) (40,303)Other current assets (16,054) (192) (17,028)
(Decrease) increase in:Accounts payable (173,345) 127,229 130,992Advance billings on contracts 18,557 21,298 79,510Accrued liabilities (8,906) 54,257 23,316
(Increase) decrease in operating assets and liabilities $ (22,551) $168,576 $ (67,224)
Cash paid during the year for:Interest expense $ 47,558 $ 44,057 $ 25,491Income tax payments, net $ 52,025 $ 52,346 $ 75,967
Business Acquisitions
The following summarizes major engineering and con-struction related acquisitions completed during 1997. Allof these acquisitions were in the Fluor Global Services seg-ment. There were no major engineering and constructionrelated acquisitions in 1999 and 1998.
• ConSol Group, a privately held U.S. company headquar-tered in New Hampshire, that provides staffing person-nel in the fields of information technology and alliedhealth.
• J.W. Burress, Inc., a privately held U.S. company head-quartered in Virginia, that provides product supportservices and sells, rents and services new and usedconstruction and industrial machinery.
• SMA Companies, privately held U.S. companies head-quartered in California and Georgia. These companiessell, rent and service heavy construction and industrialequipment and provide proprietary software to otherequipment distributors throughout the U.S.
These businesses and other smaller acquisitions werepurchased for a total of $142 million. The fair value ofassets acquired, including working capital of $42 millionand goodwill of $67 million, was $196 million, and liabil-ities assumed totaled $54 million.
In 1998, the company’s coal segment, through itsMassey Coal Company (“Massey”), acquired coal reservesfor an aggregate cost of $12 million. Massey purchased twocoal mining companies during 1997. The aggregate pur-chase price was $39 million and included the fair value ofassets acquired, consisting of $55 million of property, plantand equipment, and mining rights, $13 million of work-ing capital and other assets, net of other liabilities assumedof $29 million. These acquisitions, along with capitalexpenditures, have been directed primarily towards
acquiring additional coal reserves. There were no coalrelated acquisitions in 1999.
All of the above acquisitions have been accounted forunder the purchase method of accounting and their resultsof operations have been included in the company’s con-solidated financial statements from the respective acquisi-tion dates. If these acquisitions had been made at thebeginning of the respective year acquired, pro forma resultsof operations would not have differed materially fromactual results.
From time to time, the company enters into invest-ment arrangements, including joint ventures, that arerelated to its engineering and construction business.During 1997 through 1999, the majority of these expen-ditures related to ongoing investments in an equity fundthat focuses on energy related projects and a number ofsmaller, diversified ventures.
Business Dispositions
On October 28, 1998, the company entered into an agree-ment to sell its ownership interest in Fluor Daniel GTI,Inc. (FD/GTI). Under terms of the agreement, the com-pany sold its 4,400,000 shares in FD/GTI for $8.25 pershare, or $36.3 million in cash, on December 3, 1998. Thenet assets of FD/GTI were reflected on the 1998 consoli-dated balance sheet at net realizable value and included$26.4 million in cash and cash equivalents. This trans-action did not have a material impact on the company’sresults of operations or financial position.
During 1997, the company completed the sale ofACQUION, a global provider of supply chain manage-ment services, for $12 million in cash, resulting in a pre-taxgain of $7 million.
Special Provision and Cost Reduction Initiatives
In March 1999, the company announced a new strategicdirection, including a reorganization of the operating unitsand administrative functions of its engineering and con-struction segment. In connection with this reorganization,the company recorded in the second quarter a special pro-vision of $136.5 million pre-tax to cover direct and otherreorganization related costs, primarily for personnel, facili-ties and asset impairment adjustments.
Under the reorganization plan, approximately 5,000jobs are expected to be eliminated. The provision includesamounts for personnel costs for certain affected employeesthat are entitled to receive severance benefits under estab-lished severance policies or by government regulations.Additionally, outplacement services may be provided on alimited basis to some affected employees. The provisionalso reflects amounts for asset impairment, primarily for
Page 45
F l u o r C o r p o r a t i o n 19 9 9 A n n u a l R e p o r t
property, plant and equipment; intangible assets (good-will); and certain investments. The asset impairments wererecorded primarily because of the company’s decision toexit certain non-strategic geographic locations and busi-nesses. The carrying values of impaired assets were adjustedto their current market values based on estimated sale pro-ceeds, using either discounted cash flows or contractualamounts. Lease termination costs were also included in the special provision. The company anticipates closing 15 non-strategic offices worldwide as well as consolidatingand downsizing other office locations. The closure or ration-alization of these facilities is expected to be substantiallycompleted by the end of fiscal year 2000.
As of October 31, 1999, the company has reducedheadcount by approximately 5,000 employees and hasclosed 13 offices. The company anticipates closing twoadditional offices within the next six months. In October1999, $19.3 million of the special provision was reversedinto earnings as a result of lower than anticipated severancecosts for personnel reductions in certain overseas offices.Both the actual number of employee terminations as wellas the cost per employee termination were lower than orig-inally estimated.
The following table summarizes the status of the com-pany’s reorganization plan as of October 31, 1999:
LeasePersonnel Asset Termination
Costs Impairments Costs Other Total
(in thousands)
Special provision $ 72,200 $ 48,800 $14,500 $1,000 $136,500Cash expenditures (25,089) (1,094) (4,793) (814) (31,790)Non-cash activities (2,576) (24,360) — — (26,936)Provision reversal (19,300) — — — (19,300)
Balance at October 31, 1999 $ 25,235 $ 23,346 $ 9,707 $ 186 $ 58,474
The special provision liability as of October 31, 1999is included in other accrued liabilities. The liability forpersonnel costs and asset impairments will be substantiallyutilized by April 30, 2000. The liability associated withabandoned lease space will be amortized as an offset to leaseexpense over the remaining life of the respective leasesstarting on the date of abandonment.
During 1997, the company recorded $25.4 million in charges related to the implementation of certain costreduction initiatives. These charges provided for personneland facility related costs. As of October 31, 1999, substan-tially all of these costs had been incurred.
Income Taxes
The income tax expense (benefit) included in theConsolidated Statement of Earnings is as follows:
Year ended October 31, 1999 1998 1997
(in thousands)
Current:Federal $ 5,931 $ 38,700 $ 50,906Foreign 43,012 52,021 25,801State and local 3,255 7,781 6,947
Total current 52,198 98,502 83,654
Deferred:Federal 26,872 43,369 19,972Foreign (2,641) (19,295) 3,908State and local 5,037 4,706 1,548
Total deferred 29,268 28,780 25,428
Total income tax expense $81,466 $127,282 $109,082
A reconciliation of U.S. statutory federal income taxexpense to the company’s income tax expense on earningsis as follows:
Year ended October 31, 1999 1998 1997
(in thousands)
U.S. statutory federal tax expense $64,979 $126,919 $ 89,344Increase (decrease) in taxes
resulting from:Items without tax effect, net 26,158 888 13,307State and local income taxes 5,048 7,868 5,337Depletion (9,625) (12,273) (10,051)Effect of non-U.S. tax rates (396) 3,433 10,620Other, net (4,698) 447 525
Total income tax expense $81,466 $127,282 $109,082
Deferred taxes reflect the tax effects of differencesbetween the amounts recorded as assets and liabilities forfinancial reporting purposes and the amounts recorded forincome tax purposes. The tax effects of significant tempo-rary differences giving rise to deferred tax assets and liabil-ities are as follows:
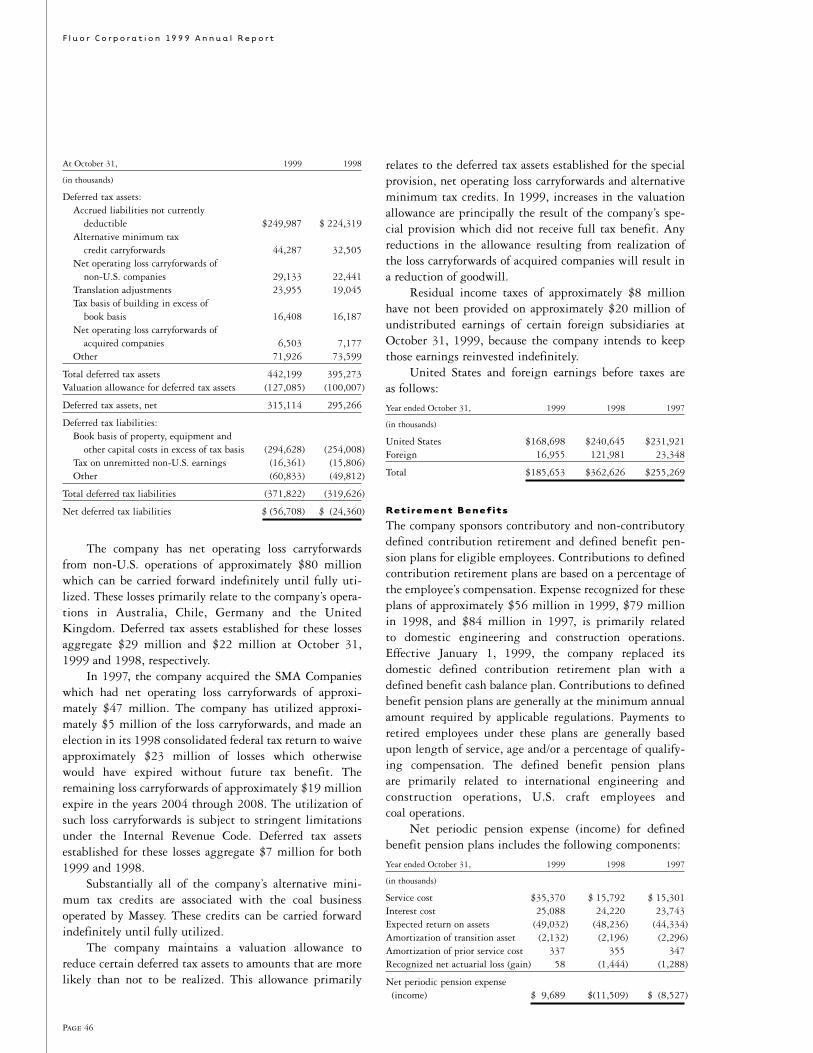
Page 46
F l u o r C o r p o r a t i o n 19 9 9 A n n u a l R e p o r t
At October 31, 1999 1998
(in thousands)
Deferred tax assets:Accrued liabilities not currently
deductible $249,987 $ 224,319Alternative minimum tax
credit carryforwards 44,287 32,505Net operating loss carryforwards of
non-U.S. companies 29,133 22,441Translation adjustments 23,955 19,045Tax basis of building in excess of
book basis 16,408 16,187Net operating loss carryforwards of
acquired companies 6,503 7,177Other 71,926 73,599
Total deferred tax assets 442,199 395,273Valuation allowance for deferred tax assets (127,085) (100,007)
Deferred tax assets, net 315,114 295,266
Deferred tax liabilities:Book basis of property, equipment and
other capital costs in excess of tax basis (294,628) (254,008)Tax on unremitted non-U.S. earnings (16,361) (15,806)Other (60,833) (49,812)
Total deferred tax liabilities (371,822) (319,626)
Net deferred tax liabilities $ (56,708) $ (24,360)
The company has net operating loss carryforwardsfrom non-U.S. operations of approximately $80 millionwhich can be carried forward indefinitely until fully uti-lized. These losses primarily relate to the company’s opera-tions in Australia, Chile, Germany and the UnitedKingdom. Deferred tax assets established for these lossesaggregate $29 million and $22 million at October 31,1999 and 1998, respectively.
In 1997, the company acquired the SMA Companieswhich had net operating loss carryforwards of approxi-mately $47 million. The company has utilized approxi-mately $5 million of the loss carryforwards, and made anelection in its 1998 consolidated federal tax return to waiveapproximately $23 million of losses which otherwisewould have expired without future tax benefit. Theremaining loss carryforwards of approximately $19 millionexpire in the years 2004 through 2008. The utilization ofsuch loss carryforwards is subject to stringent limitationsunder the Internal Revenue Code. Deferred tax assetsestablished for these losses aggregate $7 million for both1999 and 1998.
Substantially all of the company’s alternative mini-mum tax credits are associated with the coal business operated by Massey. These credits can be carried forwardindefinitely until fully utilized.
The company maintains a valuation allowance toreduce certain deferred tax assets to amounts that are morelikely than not to be realized. This allowance primarily
relates to the deferred tax assets established for the specialprovision, net operating loss carryforwards and alternativeminimum tax credits. In 1999, increases in the valuationallowance are principally the result of the company’s spe-cial provision which did not receive full tax benefit. Anyreductions in the allowance resulting from realization ofthe loss carryforwards of acquired companies will result ina reduction of goodwill.
Residual income taxes of approximately $8 millionhave not been provided on approximately $20 million ofundistributed earnings of certain foreign subsidiaries atOctober 31, 1999, because the company intends to keepthose earnings reinvested indefinitely.
United States and foreign earnings before taxes are as follows:
Year ended October 31, 1999 1998 1997
(in thousands)
United States $168,698 $240,645 $231,921Foreign 16,955 121,981 23,348
Total $185,653 $362,626 $255,269
Retirement Benefits
The company sponsors contributory and non-contributorydefined contribution retirement and defined benefit pen-sion plans for eligible employees. Contributions to definedcontribution retirement plans are based on a percentage ofthe employee’s compensation. Expense recognized for theseplans of approximately $56 million in 1999, $79 millionin 1998, and $84 million in 1997, is primarily related to domestic engineering and construction operations.Effective January 1, 1999, the company replaced itsdomestic defined contribution retirement plan with adefined benefit cash balance plan. Contributions to definedbenefit pension plans are generally at the minimum annualamount required by applicable regulations. Payments toretired employees under these plans are generally basedupon length of service, age and/or a percentage of qualify-ing compensation. The defined benefit pension plans are primarily related to international engineering and construction operations, U.S. craft employees and coal operations.
Net periodic pension expense (income) for definedbenefit pension plans includes the following components:
Year ended October 31, 1999 1998 1997
(in thousands)
Service cost $35,370 $ 15,792 $ 15,301Interest cost 25,088 24,220 23,743Expected return on assets (49,032) (48,236) (44,334)Amortization of transition asset (2,132) (2,196) (2,296)Amortization of prior service cost 337 355 347Recognized net actuarial loss (gain) 58 (1,444) (1,288)
Net periodic pension expense (income) $ 9,689 $(11,509) $ (8,527)
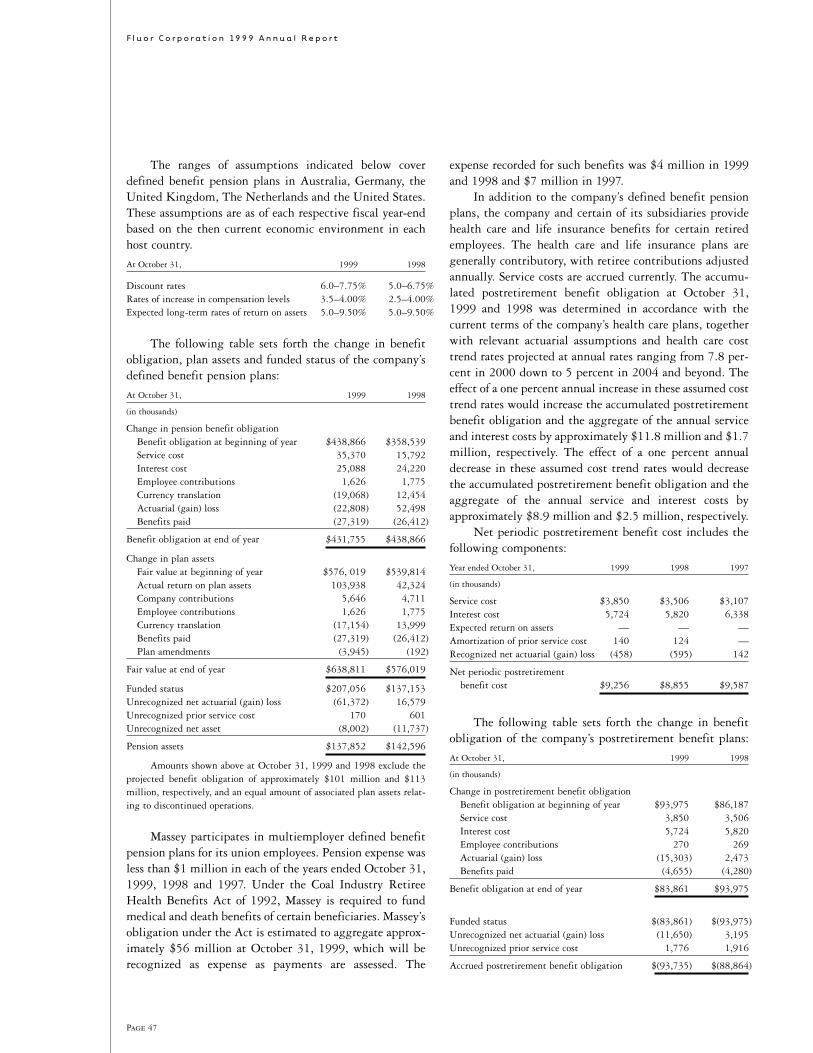
Page 47
F l u o r C o r p o r a t i o n 19 9 9 A n n u a l R e p o r t
The ranges of assumptions indicated below coverdefined benefit pension plans in Australia, Germany, theUnited Kingdom, The Netherlands and the United States.These assumptions are as of each respective fiscal year-endbased on the then current economic environment in eachhost country.
At October 31, 1999 1998
Discount rates 6.0–7.75% 5.0–6.75%Rates of increase in compensation levels 3.5–4.00% 2.5–4.00%Expected long-term rates of return on assets 5.0–9.50% 5.0–9.50%
The following table sets forth the change in benefitobligation, plan assets and funded status of the company’sdefined benefit pension plans:
At October 31, 1999 1998
(in thousands)
Change in pension benefit obligationBenefit obligation at beginning of year $438,866 $358,539Service cost 35,370 15,792Interest cost 25,088 24,220Employee contributions 1,626 1,775Currency translation (19,068) 12,454Actuarial (gain) loss (22,808) 52,498Benefits paid (27,319) (26,412)
Benefit obligation at end of year $431,755 $438,866
Change in plan assetsFair value at beginning of year $576, 019 $539,814Actual return on plan assets 103,938 42,324Company contributions 5,646 4,711Employee contributions 1,626 1,775Currency translation (17,154) 13,999Benefits paid (27,319) (26,412)Plan amendments (3,945) (192)
Fair value at end of year $638,811 $576,019
Funded status $207,056 $137,153Unrecognized net actuarial (gain) loss (61,372) 16,579Unrecognized prior service cost 170 601Unrecognized net asset (8,002) (11,737)
Pension assets $137,852 $142,596
Amounts shown above at October 31, 1999 and 1998 exclude theprojected benefit obligation of approximately $101 million and $113million, respectively, and an equal amount of associated plan assets relat-ing to discontinued operations.
Massey participates in multiemployer defined benefitpension plans for its union employees. Pension expense wasless than $1 million in each of the years ended October 31,1999, 1998 and 1997. Under the Coal Industry RetireeHealth Benefits Act of 1992, Massey is required to fundmedical and death benefits of certain beneficiaries. Massey’sobligation under the Act is estimated to aggregate approx-imately $56 million at October 31, 1999, which will berecognized as expense as payments are assessed. The
expense recorded for such benefits was $4 million in 1999and 1998 and $7 million in 1997.
In addition to the company’s defined benefit pensionplans, the company and certain of its subsidiaries providehealth care and life insurance benefits for certain retiredemployees. The health care and life insurance plans aregenerally contributory, with retiree contributions adjustedannually. Service costs are accrued currently. The accumu-lated postretirement benefit obligation at October 31,1999 and 1998 was determined in accordance with thecurrent terms of the company’s health care plans, togetherwith relevant actuarial assumptions and health care costtrend rates projected at annual rates ranging from 7.8 per-cent in 2000 down to 5 percent in 2004 and beyond. Theeffect of a one percent annual increase in these assumed costtrend rates would increase the accumulated postretirementbenefit obligation and the aggregate of the annual serviceand interest costs by approximately $11.8 million and $1.7million, respectively. The effect of a one percent annualdecrease in these assumed cost trend rates would decreasethe accumulated postretirement benefit obligation and theaggregate of the annual service and interest costs byapproximately $8.9 million and $2.5 million, respectively.
Net periodic postretirement benefit cost includes thefollowing components:
Year ended October 31, 1999 1998 1997
(in thousands)
Service cost $3,850 $3,506 $3,107Interest cost 5,724 5,820 6,338Expected return on assets — — —Amortization of prior service cost 140 124 —Recognized net actuarial (gain) loss (458) (595) 142
Net periodic postretirement benefit cost $9,256 $8,855 $9,587
The following table sets forth the change in benefitobligation of the company’s postretirement benefit plans:
At October 31, 1999 1998
(in thousands)
Change in postretirement benefit obligationBenefit obligation at beginning of year $93,975 $86,187Service cost 3,850 3,506Interest cost 5,724 5,820Employee contributions 270 269Actuarial (gain) loss (15,303) 2,473Benefits paid (4,655) (4,280)
Benefit obligation at end of year $83,861 $93,975
Funded status $(83,861) $(93,975)Unrecognized net actuarial (gain) loss (11,650) 3,195Unrecognized prior service cost 1,776 1,916
Accrued postretirement benefit obligation $(93,735) $(88,864)
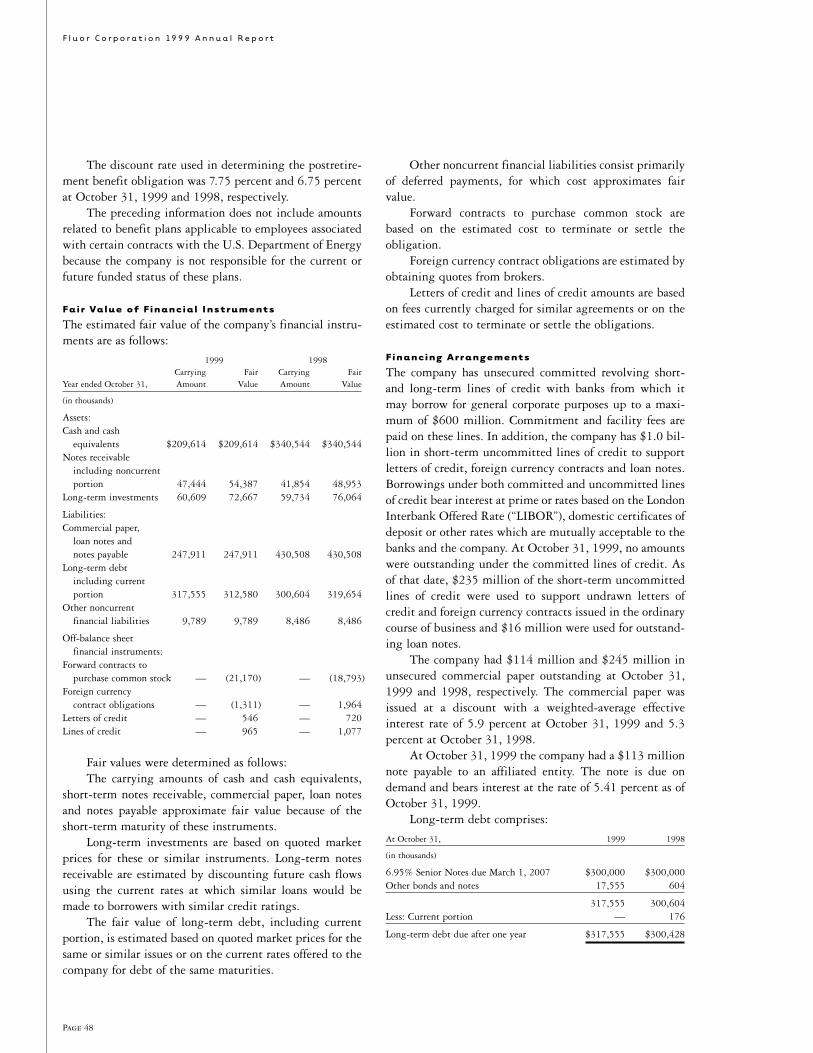
Page 48
F l u o r C o r p o r a t i o n 19 9 9 A n n u a l R e p o r t
The discount rate used in determining the postretire-ment benefit obligation was 7.75 percent and 6.75 percentat October 31, 1999 and 1998, respectively.
The preceding information does not include amountsrelated to benefit plans applicable to employees associatedwith certain contracts with the U.S. Department of Energybecause the company is not responsible for the current orfuture funded status of these plans.
Fair Value of Financial Instruments
The estimated fair value of the company’s financial instru-ments are as follows:
1999 1998Carrying Fair Carrying Fair
Year ended October 31, Amount Value Amount Value
(in thousands)
Assets:Cash and cash
equivalents $209,614 $209,614 $340,544 $340,544Notes receivable
including noncurrent portion 47,444 54,387 41,854 48,953
Long-term investments 60,609 72,667 59,734 76,064
Liabilities:Commercial paper,
loan notes and notes payable 247,911 247,911 430,508 430,508
Long-term debt including current portion 317,555 312,580 300,604 319,654
Other noncurrent financial liabilities 9,789 9,789 8,486 8,486
Off-balance sheet financial instruments:
Forward contracts to purchase common stock — (21,170) — (18,793)
Foreign currency contract obligations — (1,311) — 1,964
Letters of credit — 546 — 720Lines of credit — 965 — 1,077
Fair values were determined as follows:The carrying amounts of cash and cash equivalents,
short-term notes receivable, commercial paper, loan notesand notes payable approximate fair value because of theshort-term maturity of these instruments.
Long-term investments are based on quoted marketprices for these or similar instruments. Long-term notesreceivable are estimated by discounting future cash flowsusing the current rates at which similar loans would bemade to borrowers with similar credit ratings.
The fair value of long-term debt, including currentportion, is estimated based on quoted market prices for thesame or similar issues or on the current rates offered to thecompany for debt of the same maturities.
Other noncurrent financial liabilities consist primarilyof deferred payments, for which cost approximates fairvalue.
Forward contracts to purchase common stock arebased on the estimated cost to terminate or settle theobligation.
Foreign currency contract obligations are estimated byobtaining quotes from brokers.
Letters of credit and lines of credit amounts are basedon fees currently charged for similar agreements or on theestimated cost to terminate or settle the obligations.
Financing Arrangements
The company has unsecured committed revolving short-and long-term lines of credit with banks from which itmay borrow for general corporate purposes up to a maxi-mum of $600 million. Commitment and facility fees arepaid on these lines. In addition, the company has $1.0 bil-lion in short-term uncommitted lines of credit to supportletters of credit, foreign currency contracts and loan notes.Borrowings under both committed and uncommitted linesof credit bear interest at prime or rates based on the LondonInterbank Offered Rate (“LIBOR”), domestic certificates ofdeposit or other rates which are mutually acceptable to thebanks and the company. At October 31, 1999, no amountswere outstanding under the committed lines of credit. Asof that date, $235 million of the short-term uncommittedlines of credit were used to support undrawn letters ofcredit and foreign currency contracts issued in the ordinarycourse of business and $16 million were used for outstand-ing loan notes.
The company had $114 million and $245 million inunsecured commercial paper outstanding at October 31,1999 and 1998, respectively. The commercial paper wasissued at a discount with a weighted-average effectiveinterest rate of 5.9 percent at October 31, 1999 and 5.3percent at October 31, 1998.
At October 31, 1999 the company had a $113 millionnote payable to an affiliated entity. The note is due ondemand and bears interest at the rate of 5.41 percent as ofOctober 31, 1999.
Long-term debt comprises:
At October 31, 1999 1998
(in thousands)
6.95% Senior Notes due March 1, 2007 $300,000 $300,000Other bonds and notes 17,555 604
317,555 300,604Less: Current portion — 176
Long-term debt due after one year $317,555 $300,428
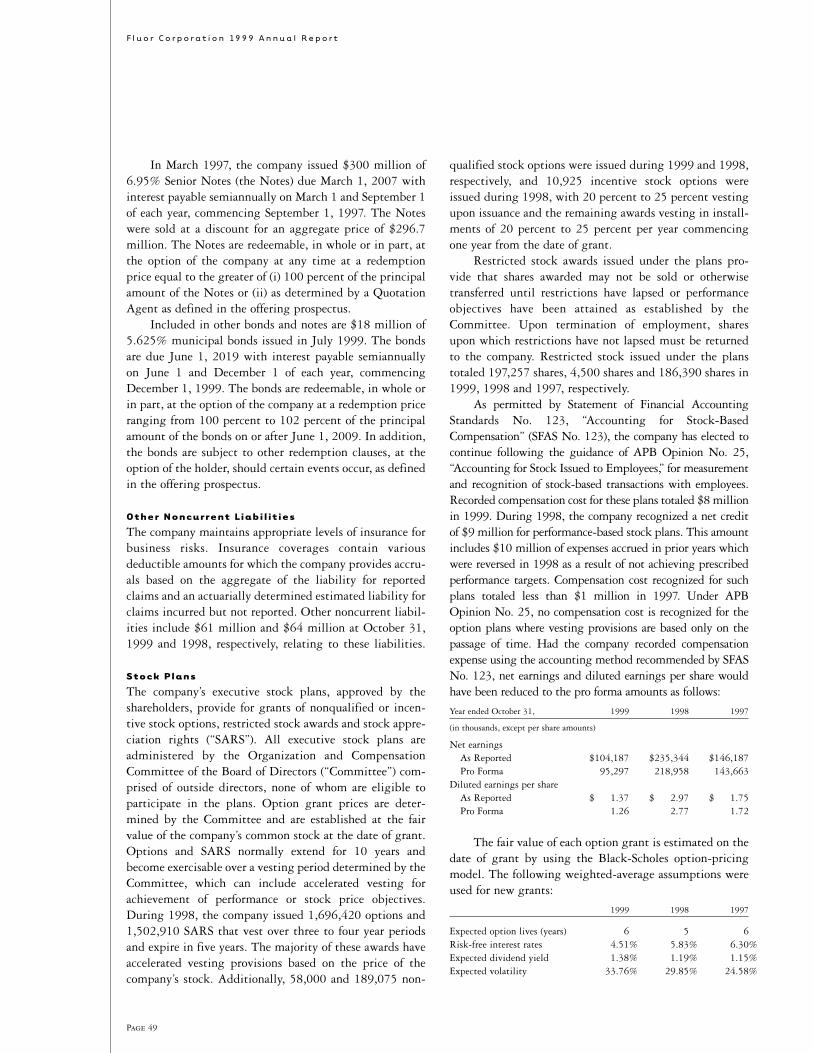
Page 49
F l u o r C o r p o r a t i o n 19 9 9 A n n u a l R e p o r t
In March 1997, the company issued $300 million of6.95% Senior Notes (the Notes) due March 1, 2007 withinterest payable semiannually on March 1 and September 1of each year, commencing September 1, 1997. The Noteswere sold at a discount for an aggregate price of $296.7million. The Notes are redeemable, in whole or in part, atthe option of the company at any time at a redemptionprice equal to the greater of (i) 100 percent of the principalamount of the Notes or (ii) as determined by a QuotationAgent as defined in the offering prospectus.
Included in other bonds and notes are $18 million of5.625% municipal bonds issued in July 1999. The bondsare due June 1, 2019 with interest payable semiannually on June 1 and December 1 of each year, commencingDecember 1, 1999. The bonds are redeemable, in whole orin part, at the option of the company at a redemption priceranging from 100 percent to 102 percent of the principalamount of the bonds on or after June 1, 2009. In addition,the bonds are subject to other redemption clauses, at theoption of the holder, should certain events occur, as definedin the offering prospectus.
Other Noncurrent Liabil ities
The company maintains appropriate levels of insurance forbusiness risks. Insurance coverages contain variousdeductible amounts for which the company provides accru-als based on the aggregate of the liability for reportedclaims and an actuarially determined estimated liability forclaims incurred but not reported. Other noncurrent liabil-ities include $61 million and $64 million at October 31,1999 and 1998, respectively, relating to these liabilities.
Stock Plans
The company’s executive stock plans, approved by theshareholders, provide for grants of nonqualified or incen-tive stock options, restricted stock awards and stock appre-ciation rights (“SARS”). All executive stock plans areadministered by the Organization and CompensationCommittee of the Board of Directors (“Committee”) com-prised of outside directors, none of whom are eligible toparticipate in the plans. Option grant prices are deter-mined by the Committee and are established at the fairvalue of the company’s common stock at the date of grant.Options and SARS normally extend for 10 years andbecome exercisable over a vesting period determined by theCommittee, which can include accelerated vesting forachievement of performance or stock price objectives.During 1998, the company issued 1,696,420 options and1,502,910 SARS that vest over three to four year periodsand expire in five years. The majority of these awards haveaccelerated vesting provisions based on the price of thecompany’s stock. Additionally, 58,000 and 189,075 non-
qualified stock options were issued during 1999 and 1998,respectively, and 10,925 incentive stock options wereissued during 1998, with 20 percent to 25 percent vestingupon issuance and the remaining awards vesting in install-ments of 20 percent to 25 percent per year commencingone year from the date of grant.
Restricted stock awards issued under the plans pro-vide that shares awarded may not be sold or otherwisetransferred until restrictions have lapsed or performanceobjectives have been attained as established by theCommittee. Upon termination of employment, sharesupon which restrictions have not lapsed must be returnedto the company. Restricted stock issued under the planstotaled 197,257 shares, 4,500 shares and 186,390 shares in1999, 1998 and 1997, respectively.
As permitted by Statement of Financial AccountingStandards No. 123, “Accounting for Stock-BasedCompensation” (SFAS No. 123), the company has elected tocontinue following the guidance of APB Opinion No. 25,“Accounting for Stock Issued to Employees,” for measurementand recognition of stock-based transactions with employees.Recorded compensation cost for these plans totaled $8 millionin 1999. During 1998, the company recognized a net creditof $9 million for performance-based stock plans. This amountincludes $10 million of expenses accrued in prior years whichwere reversed in 1998 as a result of not achieving prescribedperformance targets. Compensation cost recognized for suchplans totaled less than $1 million in 1997. Under APBOpinion No. 25, no compensation cost is recognized for theoption plans where vesting provisions are based only on thepassage of time. Had the company recorded compensationexpense using the accounting method recommended by SFASNo. 123, net earnings and diluted earnings per share wouldhave been reduced to the pro forma amounts as follows:
Year ended October 31, 1999 1998 1997
(in thousands, except per share amounts)
Net earningsAs Reported $104,187 $235,344 $146,187Pro Forma 95,297 218,958 143,663
Diluted earnings per shareAs Reported $ 1.37 $ 2.97 $ 1.75Pro Forma 1.26 2.77 1.72
The fair value of each option grant is estimated on thedate of grant by using the Black-Scholes option-pricingmodel. The following weighted-average assumptions wereused for new grants:
1999 1998 1997
Expected option lives (years) 6 5 6Risk-free interest rates 4.51% 5.83% 6.30%Expected dividend yield 1.38% 1.19% 1.15%Expected volatility 33.76% 29.85% 24.58%
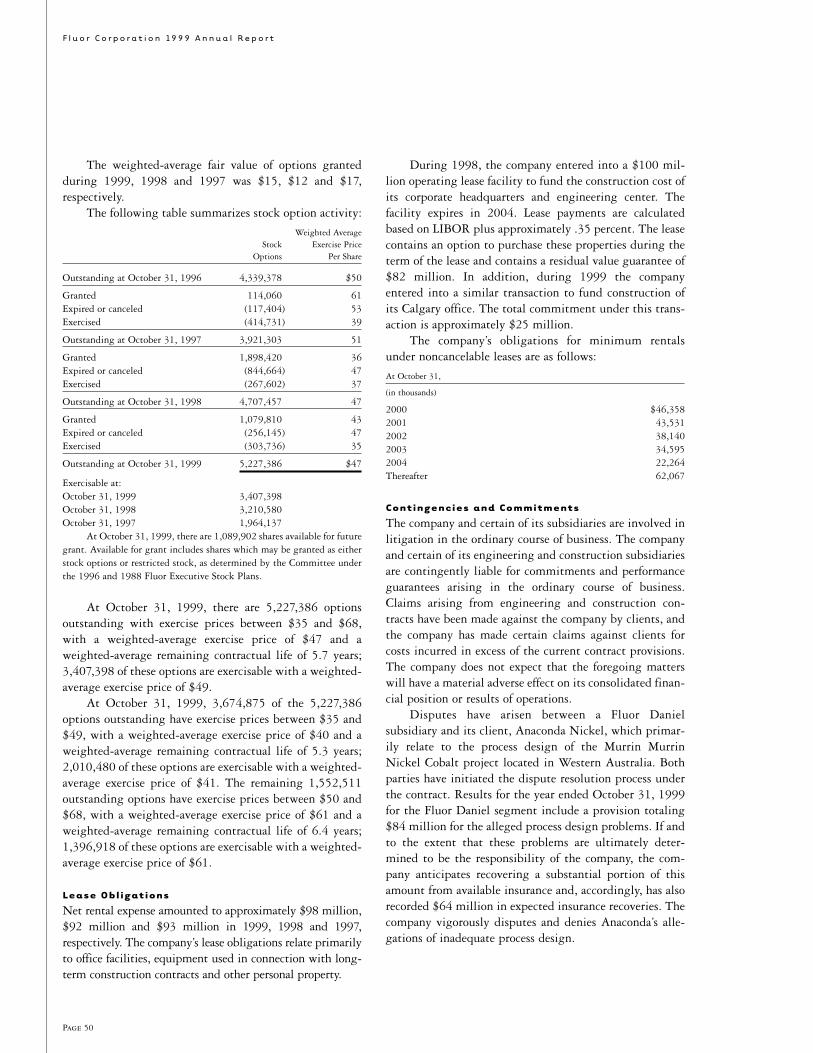
Page 50
F l u o r C o r p o r a t i o n 19 9 9 A n n u a l R e p o r t
The weighted-average fair value of options grantedduring 1999, 1998 and 1997 was $15, $12 and $17,respectively.
The following table summarizes stock option activity:
Weighted AverageStock Exercise Price
Options Per Share
Outstanding at October 31, 1996 4,339,378 $50
Granted 114,060 61Expired or canceled (117,404) 53Exercised (414,731) 39
Outstanding at October 31, 1997 3,921,303 51
Granted 1,898,420 36Expired or canceled (844,664) 47Exercised (267,602) 37
Outstanding at October 31, 1998 4,707,457 47
Granted 1,079,810 43Expired or canceled (256,145) 47Exercised (303,736) 35
Outstanding at October 31, 1999 5,227,386 $47
Exercisable at:October 31, 1999 3,407,398October 31, 1998 3,210,580October 31, 1997 1,964,137
At October 31, 1999, there are 1,089,902 shares available for futuregrant. Available for grant includes shares which may be granted as eitherstock options or restricted stock, as determined by the Committee underthe 1996 and 1988 Fluor Executive Stock Plans.
At October 31, 1999, there are 5,227,386 optionsoutstanding with exercise prices between $35 and $68,with a weighted-average exercise price of $47 and aweighted-average remaining contractual life of 5.7 years;3,407,398 of these options are exercisable with a weighted-average exercise price of $49.
At October 31, 1999, 3,674,875 of the 5,227,386options outstanding have exercise prices between $35 and$49, with a weighted-average exercise price of $40 and aweighted-average remaining contractual life of 5.3 years;2,010,480 of these options are exercisable with a weighted-average exercise price of $41. The remaining 1,552,511outstanding options have exercise prices between $50 and$68, with a weighted-average exercise price of $61 and aweighted-average remaining contractual life of 6.4 years;1,396,918 of these options are exercisable with a weighted-average exercise price of $61.
Lease Obligations
Net rental expense amounted to approximately $98 million,$92 million and $93 million in 1999, 1998 and 1997,respectively. The company’s lease obligations relate primarilyto office facilities, equipment used in connection with long-term construction contracts and other personal property.
During 1998, the company entered into a $100 mil-lion operating lease facility to fund the construction cost ofits corporate headquarters and engineering center. Thefacility expires in 2004. Lease payments are calculatedbased on LIBOR plus approximately .35 percent. The leasecontains an option to purchase these properties during theterm of the lease and contains a residual value guarantee of$82 million. In addition, during 1999 the companyentered into a similar transaction to fund construction ofits Calgary office. The total commitment under this trans-action is approximately $25 million.
The company’s obligations for minimum rentalsunder noncancelable leases are as follows:
At October 31,
(in thousands)
2000 $46,3582001 43,5312002 38,1402003 34,5952004 22,264Thereafter 62,067
Contingencies and Commitments
The company and certain of its subsidiaries are involved inlitigation in the ordinary course of business. The companyand certain of its engineering and construction subsidiariesare contingently liable for commitments and performanceguarantees arising in the ordinary course of business.Claims arising from engineering and construction con-tracts have been made against the company by clients, andthe company has made certain claims against clients forcosts incurred in excess of the current contract provisions.The company does not expect that the foregoing matterswill have a material adverse effect on its consolidated finan-cial position or results of operations.
Disputes have arisen between a Fluor Daniel subsidiary and its client, Anaconda Nickel, which primar-ily relate to the process design of the Murrin MurrinNickel Cobalt project located in Western Australia. Bothparties have initiated the dispute resolution process underthe contract. Results for the year ended October 31, 1999for the Fluor Daniel segment include a provision totaling$84 million for the alleged process design problems. If andto the extent that these problems are ultimately deter-mined to be the responsibility of the company, the com-pany anticipates recovering a substantial portion of thisamount from available insurance and, accordingly, has alsorecorded $64 million in expected insurance recoveries. Thecompany vigorously disputes and denies Anaconda’s alle-gations of inadequate process design.
Page 51
F l u o r C o r p o r a t i o n 19 9 9 A n n u a l R e p o r t
Financial guarantees, made in the ordinary course ofbusiness on behalf of clients and others in certain limitedcircumstances, are entered into with financial institutionsand other credit grantors and generally obligate the com-pany to make payment in the event of a default by the bor-rower. Most arrangements require the borrower to pledgecollateral in the form of property, plant and equipmentwhich is deemed adequate to recover amounts the companymight be required to pay. As of October 31, 1999, thecompany had extended financial guarantees on behalf ofcertain clients and other unrelated third parties totalingapproximately $29 million.
In connection with its 1997/1998 share repurchaseprogram, the company entered into a forward purchasecontract for 1,850,000 shares of its common stock at aprice of $49 per share. The contract matures in October2000 and gives the company the ultimate choice of settle-ment option, either physical settlement or net share settle-ment. As of October 31, 1999, the contract settlement costper share exceeded the current market price per share by $11.44.
Although the ultimate choice of settlement optionresides with the company, if the price of the company’scommon stock falls to certain levels, as defined in the con-tract, the holder of the contract has the right to require thecompany to settle the contract.
The company’s operations are subject to and affectedby federal, state and local laws and regulations regardingthe protection of the environment. The company maintainsreserves for potential future environmental costs wheresuch obligations are either known or considered probable,and can be reasonably estimated.
On October 20, 1999, the U.S. District Court for theSouthern District of West Virginia issued an injunctionwhich prohibits the construction of valley fills over bothintermittent and perennial stream segments as a part ofmining operations. While Massey is not a party to this lit-igation, virtually all mining operations, including Massey,utilize valley fills to dispose of excess materials. This deci-sion is now under appeal to the Fourth Circuit Court ofAppeals and the District Court has issued a stay of itsdecision pending the outcome of the appeal. Based uponthe current state of the appeal, the company does notbelieve that Massey mining operations will be materiallyaffected during the pendency of the appeal. If and to theextent that the District Court’s decision is upheld andlegislation is not passed which limits the impact of thedecision, then all or a portion of Massey’s mining opera-tions could be affected. The potential impact to Masseyarising from this proceeding is not currently estimable.
The company believes, based upon present informa-tion available to it, that its reserves with respect to future
environmental costs are adequate and such future costs willnot have a material effect on the company’s consolidatedfinancial position, results of operations or liquidity.However, the imposition of more stringent requirementsunder environmental laws or regulations, new develop-ments or changes regarding site cleanup costs or the allo-cation of such costs among potentially responsible parties,or a determination that the company is potentially respon-sible for the release of hazardous substances at sites otherthan those currently identified, could result in additionalexpenditures, or the provision of additional reserves inexpectation of such expenditures.
Operations by Business Segment and
Geographical Area
In the fourth quarter of 1999, the company adoptedStatement of Financial Accounting Standards No. 131,“Disclosures about Segments of an Enterprise and RelatedInformation” (SFAS No. 131). The statement establishesnew standards for the way that business enterprises reportinformation about operating segments as well as therelated disclosures about products and services, geographi-cal areas and major customers. The adoption of SFAS No.131 did not affect the consolidated results of operations orfinancial position of the company, but did affect the busi-ness segments that are disclosed. Prior year disclosures havebeen restated to conform to the new basis of reporting.
Fluor Daniel consists of five business units: Chemicals & Life Sciences; Oil, Gas and Power; Mining;Manufacturing; and Infrastucture. These units providedesign, engineering, procurement and construction ser-vices on a worldwide basis to an extensive range of indus-trial, commercial, utility, natural resources and energyclients. The types of services provided by Fluor Danielinclude: feasibility studies, conceptual design, detail engi-neering, procurement, project and construction manage-ment and construction.
Fluor Global Services consists of six business units:American Equipment Company; TRS Staffing Solutions;Fluor Federal Services; Telecommunications; Operations &Maintenance; and Consulting Services. These units providea variety of services to clients in a wide range of industries.The types of services provided by Fluor Global Servicesinclude: equipment sales, leasing, services and outsourcingfor construction and industrial needs; temporary technicaland non-technical staffing specializing in technical, profes-sional and administrative personnel; services to the UnitedStates government; repair, renovation, replacement, predic-tive and preventative services to commercial and industrialfacilities; and productivity consulting services and mainte-nance management to the manufacturing and processindustries.
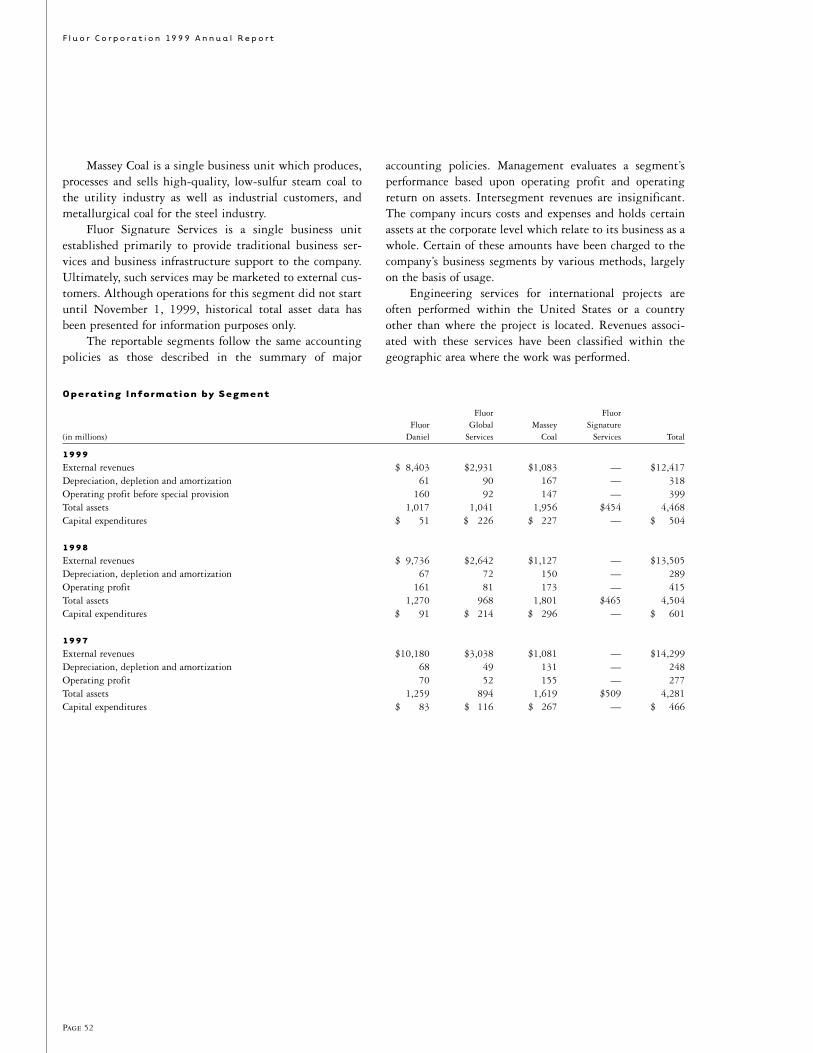
Page 52
F l u o r C o r p o r a t i o n 19 9 9 A n n u a l R e p o r t
Massey Coal is a single business unit which produces,processes and sells high-quality, low-sulfur steam coal tothe utility industry as well as industrial customers, andmetallurgical coal for the steel industry.
Fluor Signature Services is a single business unitestablished primarily to provide traditional business ser-vices and business infrastructure support to the company.Ultimately, such services may be marketed to external cus-tomers. Although operations for this segment did not startuntil November 1, 1999, historical total asset data hasbeen presented for information purposes only.
The reportable segments follow the same accountingpolicies as those described in the summary of major
Operating Information by Segment
Fluor FluorFluor Global Massey Signature
(in millions) Daniel Services Coal Services Total
1999External revenues $ 8,403 $2,931 $1,083 — $12,417Depreciation, depletion and amortization 61 90 167 — 318Operating profit before special provision 160 92 147 — 399Total assets 1,017 1,041 1,956 $454 4,468Capital expenditures $ 51 $ 226 $ 227 — $ 504
1998External revenues $ 9,736 $2,642 $1,127 — $13,505Depreciation, depletion and amortization 67 72 150 — 289Operating profit 161 81 173 — 415Total assets 1,270 968 1,801 $465 4,504Capital expenditures $ 91 $ 214 $ 296 — $ 601
1997External revenues $10,180 $3,038 $1,081 — $14,299Depreciation, depletion and amortization 68 49 131 — 248Operating profit 70 52 155 — 277Total assets 1,259 894 1,619 $509 4,281Capital expenditures $ 83 $ 116 $ 267 — $ 466
accounting policies. Management evaluates a segment’sperformance based upon operating profit and operatingreturn on assets. Intersegment revenues are insignificant.The company incurs costs and expenses and holds certainassets at the corporate level which relate to its business as awhole. Certain of these amounts have been charged to thecompany’s business segments by various methods, largelyon the basis of usage.
Engineering services for international projects areoften performed within the United States or a countryother than where the project is located. Revenues associ-ated with these services have been classified within thegeographic area where the work was performed.
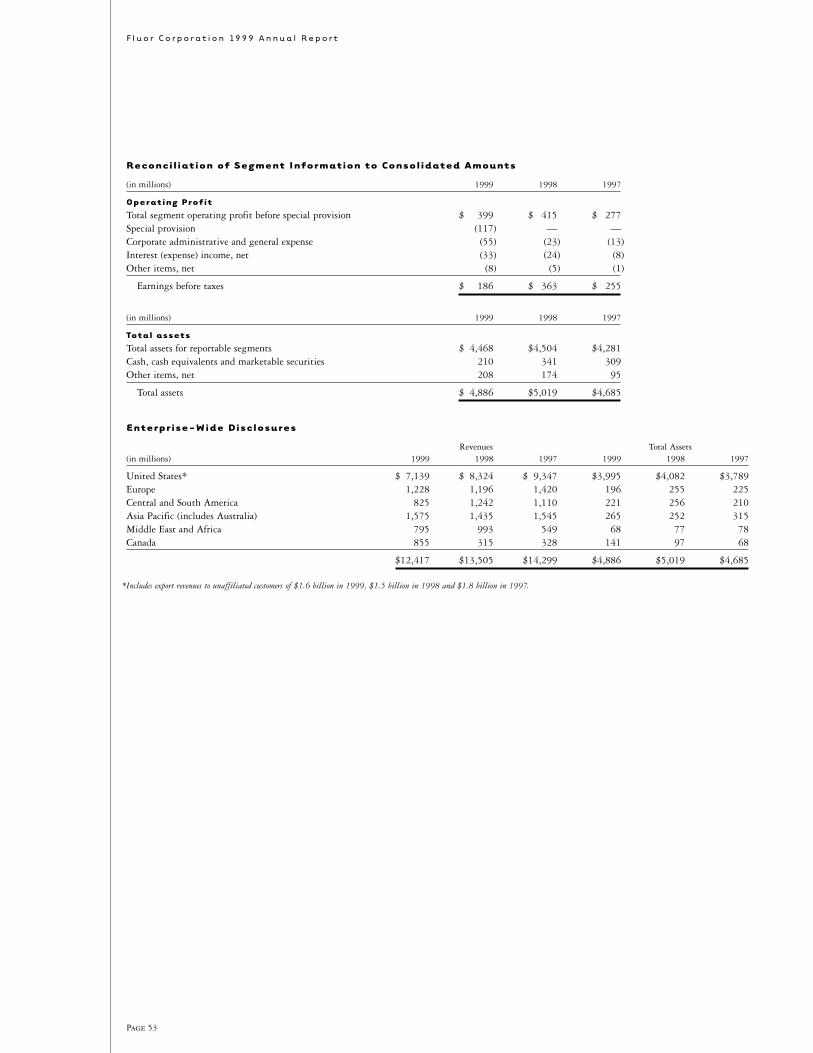
Page 53
F l u o r C o r p o r a t i o n 19 9 9 A n n u a l R e p o r t
Reconcil iation of Segment Information to Consolidated Amounts
(in millions) 1999 1998 1997
Operating ProfitTotal segment operating profit before special provision $ 399 $ 415 $ 277Special provision (117) — —Corporate administrative and general expense (55) (23) (13)Interest (expense) income, net (33) (24) (8)Other items, net (8) (5) (1)
Earnings before taxes $ 186 $ 363 $ 255
(in millions) 1999 1998 1997
Total assetsTotal assets for reportable segments $ 4,468 $4,504 $4,281Cash, cash equivalents and marketable securities 210 341 309Other items, net 208 174 95
Total assets $ 4,886 $5,019 $4,685
Enterprise-Wide Disclosures
Revenues Total Assets(in millions) 1999 1998 1997 1999 1998 1997
United States* $ 7,139 $ 8,324 $ 9,347 $3,995 $4,082 $3,789Europe 1,228 1,196 1,420 196 255 225Central and South America 825 1,242 1,110 221 256 210Asia Pacific (includes Australia) 1,575 1,435 1,545 265 252 315Middle East and Africa 795 993 549 68 77 78Canada 855 315 328 141 97 68
$12,417 $13,505 $14,299 $4,886 $5,019 $4,685
*Includes export revenues to unaffiliated customers of $1.6 billion in 1999, $1.5 billion in 1998 and $1.8 billion in 1997.

Page 54
F l u o r C o r p o r a t i o n 19 9 9 A n n u a l R e p o r t
M a n a g e m e n t ’s a n d I n d e p e n d e n t Au d i t o r s ’ R e p o r t s
Management
The company is responsible for preparation of the accom-panying consolidated balance sheet and the related consol-idated statements of earnings, cash flows and shareholders’equity. These statements have been prepared in conformitywith generally accepted accounting principles and man-agement believes that they present fairly the company’sconsolidated financial position and results of operations.The integrity of the information presented in the financialstatements, including estimates and judgments relating tomatters not concluded by fiscal year end, is the responsi-bility of management. To fulfill this responsibility, aninternal control structure designed to protect the com-pany’s assets and properly record transactions and events asthey occur has been developed, placed in operation andmaintained. The internal control structure is supported by an extensive program of internal audits and is tested and evaluated by the independent auditors in connectionwith their annual audit. The Board of Directors pursues its responsibility for financial information through anAudit Committee of Directors who are not employees. The internal auditors and the independent auditors have full and free access to the Committee. Periodically, the Committee meets with the independent auditors with-out management present to discuss the results of theiraudits, the adequacy of the internal control structure andthe quality of financial reporting.
Philip J. Carroll, Jr. Ralph F. HakeChairman of the Board and Executive Vice President andChief Executive Officer Chief Financial Officer
Independent Auditors
Board of Directors and ShareholdersFluor Corporation
We have audited the accompanying consolidated balancesheet of Fluor Corporation as of October 31, 1999 and1998, and the related consolidated statements of earnings,cash flows, and shareholders’ equity for each of the threeyears in the period ended October 31, 1999. These finan-cial statements are the responsibility of the company’smanagement. Our responsibility is to express an opinionon these financial statements based on our audits.
We conducted our audits in accordance with auditingstandards generally accepted in the United States. Thosestandards require that we plan and perform the audit toobtain reasonable assurance about whether the financialstatements are free of material misstatement. An auditincludes examining, on a test basis, evidence supportingthe amounts and disclosures in the financial statements. Anaudit also includes assessing the accounting principles usedand significant estimates made by management, as well asevaluating the overall financial statement presentation. We believe that our audits provide a reasonable basis forour opinion.
In our opinion, the financial statements referred toabove present fairly, in all material respects, the consoli-dated financial position of Fluor Corporation at October31, 1999 and 1998, and the consolidated results of itsoperations and its cash flows for each of the three years in the period ended October 31, 1999, in conformity with accounting principles generally accepted in theUnited States.
Orange County, CaliforniaNovember 19, 1999
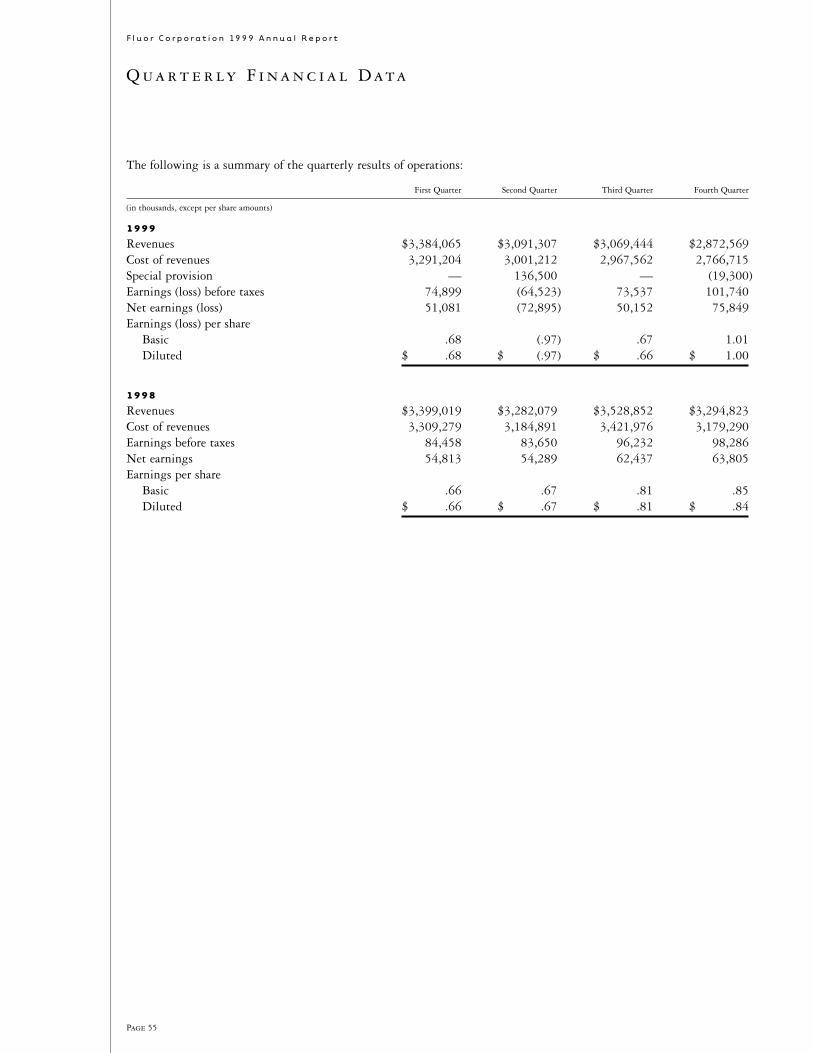
Page 55
F l u o r C o r p o r a t i o n 19 9 9 A n n u a l R e p o r t
Q u a r t e r l y F i n a n c i a l D ata
The following is a summary of the quarterly results of operations:
First Quarter Second Quarter Third Quarter Fourth Quarter
(in thousands, except per share amounts)
1999
Revenues $3,384,065 $3,091,307 $3,069,444 $2,872,569Cost of revenues 3,291,204 3,001,212 2,967,562 2,766,715Special provision — 136,500 — (19,300)Earnings (loss) before taxes 74,899 (64,523) 73,537 101,740Net earnings (loss) 51,081 (72,895) 50,152 75,849Earnings (loss) per share
Basic .68 (.97) .67 1.01Diluted $ .68 $ (.97) $ .66 $ 1.00
1998
Revenues $3,399,019 $3,282,079 $3,528,852 $3,294,823Cost of revenues 3,309,279 3,184,891 3,421,976 3,179,290Earnings before taxes 84,458 83,650 96,232 98,286Net earnings 54,813 54,289 62,437 63,805Earnings per share
Basic .66 .67 .81 .85Diluted $ .66 $ .67 $ .81 $ .84
Page 56
F l u o r C o r p o r a t i o n 19 9 9 A n n u a l R e p o r t
B o a r d C o m m i t t e e s
Fluor Corporation’s Board of Directors reflects many of the characteristics which are key to a strong, thoughtful approachto corporate governance and oversight. With 13 members comprised of four inside and nine outside directors, the Boardpossesses a good balance of both industry expertise and overall business knowledge.
There are regular quarterly meetings with numerous telephone discussions as necessary to handle matters requiringBoard approval. Altogether there are six standing committees — the Executive Committee, Audit Committee, FinanceCommittee, Governance Committee, the Organization and Compensation Committee, and the Public Policy Committee.Through work on its committees and ongoing interactions with members of executive management, the Board is involvedin practically every activity critical to the company’s success, with a particular emphasis on corporate direction, strategyand executive succession.
Executive Committee [1]
Philip J. Carroll, Jr., ChairmanThe Executive Committee acts on behalf of the Board with its fullauthority on matters which require resolution between regularBoard meetings. The committee is comprised of the chairman ofthe Board and the chairmen of the Board’s other five standingcommittees.
Audit Committee [2]
Peter J. Fluor, ChairmanThe Audit Committee, which consists solely of independent out-side directors, represents the Board in oversight of the company’sfinancial condition, reporting procedures and financial controls.Among the committee’s many responsibilities are review of thecompany’s annual report, Form 10-K and proxy statement. It alsomeets regularly with the company’s internal auditors and financialmanagement team to review accounting controls and practices. Inaddition, it meets both annually and quarterly with the company’sindependent auditors to review the scope of its work and to ensurethat appropriate policies and procedures are in place. Finally, thecommittee nominates the firm of independent auditors forappointment by the Board and ratification by shareholders.
Finance Committee [3]
Martha R. Seger, ChairmanThe Finance Committee provides the Board with oversight of,and recommendations regarding, the financial activities andneeds of the company. The committee’s specific duties includereview and recommendations regarding debt financing arrange-ments, dividend policy and acquisitions and dispositions of majorbusiness units and capital assets. The committee also has over-sight responsibility for the company’s retirement and otheremployee benefit funds, risk management, including derivativesand foreign exchange transactions and performance of the com-pany’s own investments. In carrying out its functions, thecommittee works in close liaison with the chief financial officer ofthe company.
Governance Committee [4]
David P. Gardner, ChairmanThe Governance Committee, which consists of all the outsidedirectors of the company, focuses on the membership, roles andresponsibilities of the Board of Directors. The committee recom-mends the organizational structure of the Board and the assign-ment of members to committees where much of the Board’s workis conducted. All outside directors serve on at least two commit-tees. In its search for new members, the committee looks fordiversity of gender and race, as well as diversity in experience tohelp ensure the strongest capability possible in providing over-sight and perspective. In addition, the committee facilitates par-ticipation by all directors in the affairs of the company. Theaccessibility between the Board and company management notonly provides better insight to the directors on company activi-ties but also facilitates the experience of the Board being readilyavailable to company management whenever and wherever it canbe most useful.
Organization and Compensation Committee [5]
Bobby R. Inman, ChairmanThe Organization and Compensation Committee provides guid-ance and oversight regarding the company’s organizationalstructure; the quality, diversity and depth of the executive man-agement team; and the effectiveness of the company’s compensa-tion programs for management employees. The primary focus andphilosophy of all company compensation programs is to ensurethat they are linked directly to initiatives which will yieldincreasing levels of shareholder value. It is the committee’sresponsibility to see that management compensation is properlyaligned and incentivised for further enhancement of share-holder value.
Public Policy Committee [6]
Vilma S. Martinez, ChairmanThe Public Policy Committee provides guidance and recommen-dations regarding the company’s policies and positions on signifi-cant public issues, the company’s support of business, charitableand political organizations, and the company’s workplace andemployment practices. The committee functions as a key resourceto the company in fulfilling its corporate citizenship objectivesand responsibilities.
Page 57
F l u o r C o r p o r a t i o n 19 9 9 A n n u a l R e p o r t
B o a r d o f D i r e c t o r s
Phil ip J. Carroll, Jr., 62, is chairman of the Board and chiefexecutive officer. Joining Fluor in 1998, he previously spent 37years with Shell Oil Company, serving as its president and chiefexecutive officer for the last five years. Mr. Carroll brings greatenergy, chemical and process industry experience, proven globalleadership skills and a demonstrated track record of buildingshareholder value. He also serves as a director of Boise CascadeCorporation and Vulcan Materials Company. (1998) (1)
Don L. Blankenship, 49, is president and chief executive officerof A.T. Massey Coal Company. He brings important diversifiedbusiness perspective to the Board’s deliberations, as well as valu-able expertise in the coal industry. Mr. Blankenship serves as adirector of the National Mining Association, the Governor’sMission West Virginia Board and the Norfolk Southern AdvisoryBoard. (1996) (3)
Governor Carroll Campbell, Jr., 59, is president and chiefexecutive officer of the American Council of Life Insurance. He isa former two-term Governor of South Carolina, served in the U.S.House of Representatives and was a member of the Appro-priations and Ways and Means committees. He was chairman of the National Governor’s Association 1993–94. GovernorCampbell is a director of AVX Corporation, Norfolk SouthernCorporation and Wackenhut Corporation. (1995) (2) (3) (4)
Peter J. Fluor, 52, is president and chief executive officer ofTexas Crude Energy, Inc., and served as Fluor’s non-executivechairman of the Board during fiscal 1998. Mr. Fluor brings exten-sive knowledge of the oil and gas industry, a key market for Fluor.He also serves as a director of Ocean Energy Corporation andChase Bank of Texas, N.A. (1984) (1) (2) (4) (5)
Dr. David P. Gardner, 66, recently retired as president of theWilliam and Flora Hewlett Foundation and is a former presidentof both the University of California and the University of Utah.His extensive career in education provides valuable perspective ona topic of key importance to a professional services company likeFluor. Dr. Gardner is also a director of United Funds, FirstSecurity Corporation, Digital Ventures, and Charitableway.com.(1988) (1) (4) (5) (6)
Thomas L. Gossage, 65, is the retired chairman and formerpresident and chief executive officer of Hercules Incorporated. Hebrings global business operations perspective, as well as valuableexpertise in the chemical industry. Mr. Gossage also serves as adirector of The Dial Corporation and Alliant Techsystems Inc.(1997) (3) (4) (5)
Admiral Bobby R. Inman, 68, U.S. Navy (retired), served asDirector of the National Security Agency and Deputy Director ofCentral Intelligence. Admiral Inman’s depth of political insight,awareness of global changes and understanding of technologyserves Fluor well. He is also a director of Science ApplicationsInternational Corporation, SBC Communications Inc., Temple-Inland Inc., and Xerox Corporation. (1985) (1) (4) (5) (6)
Vilma S. Martinez, 56, is a partner at the law firm of Munger,Tolles & Olson LLP, and the former president and general counsel for the Mexican-American Legal Defense and Educational Fund.Her position of national prominence in both the business andlegal communities gives her key insights on work force issues.Ms. Martinez is also a director of Anheuser-Busch Companies,Inc., Sanwa Bank California, Shell Oil Company and BurlingtonNorthern Santa Fe Corporation and serves on a variety of advisoryboards and community organizations. (1993) (1) (2) (4) (6)
Dean R. O’Hare, 57, is chairman and chief executive officer ofThe Chubb Corporation, a leading provider of insurance. He isChairman of the Coalition of Service Industries, Chairman of theU.S.-India Business Council and a member of the White HouseAdvisory Committee for Trade Policy & Negotiations and theU.S. Trade Representative’s Investment and Services PolicyAdvisory Committee. (1997) (2) (4) (5)
Lord Robin Renwick, 62, is a deputy chairman of the merchantbank, Robert Fleming, and a director of British Airways. Duringhis distinguished 30-year career in the British Foreign Service, heserved in senior posts in New Delhi, Paris and London, and wasBritish Ambassador to South Africa (1987–91) and BritishAmbassador to the United States (1991–95). He was appointed tothe House of Lords by Prime Minister Blair in 1997. (1997) (3) (4) (6)
James O. Rollans, 57, is president and chief executive officer ofFluor Signature Services. He joined Fluor in 1982 as vice presi-dent, Corporate Communications and was named senior vice pres-ident and chief financial officer in 1992. He was appointed seniorvice president and chief administrative officer in 1994, andreassumed direct responsibilities of chief financial officer from1998 to 1999. He serves as a director of Flowserve Corporation,Inovision, L.P. and the Irvine Medical Center. (1997)
Dr. Martha R. Seger, 67, is a distinguished visiting professor of Finance at Adrian College and former member of the Board of Governors of the Federal Reserve System. Dr. Seger’s careerincluded numerous positions which have yielded significant expe-rience in the fields of finance, economics and international bank-ing. She is also a director of Kroger Company, Tucson ElectricPower Company, and Xerox Corporation. (1991) (1) (3) (4) (6)
James C. Stein, 56, is president and chief executive officer ofFluor Global Services. He began his career at Fluor in 1964 andwas named vice president of the Industrial Group in 1982. Hereceived subsequent promotions, becoming group president ofDiversified Services in 1994 when the group was formed. From1997 to 1999, he served as president and chief operating officerof Fluor Daniel. He is a member of the U.S. Chamber ofCommerce, the Business Roundtable Construction Committeeand the Construction Industry Roundtable. (1997)
Years in parentheses indicate the year each director was elected to the board. Except as indi-cated, all positions are with the company.
Page 58
F l u o r C o r p o r a t i o n 19 9 9 A n n u a l R e p o r t
O f f i c e r s
Office of the Chairman
Philip J. Carroll, Jr.Chairman and Chief Executive Officer (1998)
Diana Severs FergusonVice President and Executive Director,Chairman’s Office (1980)
Enterprise Senior Officers
Fluor Daniel
Alan L. BoeckmannPresident and Chief Executive Officer (1979)
Paul E. Lewis, Jr.President, Chemicals & Life Sciences (1973)
Robert A. McNamaraPresident, Manufacturing (1978)
Ronald W. OakleyPresident, Infrastructure (1979)
Trevor J. StaffordPresident, Mining (1989)
Mark A. StevensPresident, Oil, Gas & Power (1975)
Fluor Global Services
James C. SteinPresident and Chief Executive Officer (1964)
Kirk D. GrimesPresident, Telecommunications (1980)
William J. GrubbsPresident, TRS Staffing Solutions (1999)
Ronald G. PetersonPresident, Operations & Maintenance (1995)
Thomas L. RoellVice President Operations, Fluor FederalServices (1975)
Charles H. SnyderPresident, American Equipment Company(1972)
A.T. Massey Coal Company, Inc.
Don L. BlankenshipPresident and Chief Executive Officer (1982)
Bennett K. HatfieldSenior Vice President and Chief OperatingOfficer (1979)
James L. GardnerSenior Vice President and General Counsel(1993)
Richard M. HendrickSenior Vice President, Mining and Preparation (1992)
H. Drexel ShortSenior Vice President, General Operations(1981)
Fluor Signature Services
James O. Rollans President and Chief Executive Officer (1982)
Fluor ConstructorsInternational, Inc.
Richard A. FlintonChairman (1960)
Global Development, Sales and Marketing
John L. HopkinsPresident (1984)
Senior Staff Officers
Ralph F. HakeExecutive Vice President and Chief FinancialOfficer (1999)
Lawrence N. FisherSenior Vice President-Law and Secretary(1974)
Fred J. Grigsby, Jr.Senior Vice President-Human Resources andAdministration (1998)
Dennis W. Benner Vice President and Chief Information Officer(1994)
Jake Easton IIIVice President-Strategic Planning (1975)
H. Steven GilbertVice President-Knowledge@Work (1970)
Years in parentheses indicate the year each officer or executivejoined the company.
F l u o r C o r p o r a t i o n 19 9 9 A n n u a l R e p o r t
S h a r e h o l d e r s ’ R e f e r e n c e
Common Stock InformationAt December 31, 1999, there were76,246,247 shares outstanding andapproximately 12,099 shareholders ofrecord of Fluor’s common stock.
The following table sets forth for theperiods indicated the cash dividends paidper share of common stock and the highand low sales prices of such common stockas reported in the Consolidated Trans-actions Reporting System.
Common Stock and Dividend Information
Dividends Price RangePer Share High Low
Fiscal 1999First Quarter $0.20 451⁄16 3711⁄16
Second Quarter 0.20 377⁄16 261⁄400
Third Quarter 0.20 427⁄80 351⁄400
Fourth Quarter 0.20 425⁄16 371⁄200
$0.80Fiscal 1998First Quarter $0.20 393⁄40 3315⁄16
Second Quarter 0.20 521⁄40 3713⁄16
Third Quarter 0.20 511⁄20 4011⁄16
Fourth Quarter 0.20 467⁄80 345⁄800
$0.80
Form 10-KA copy of the Form 10-K, which is filedwith the Securities and Exchange Commis-sion, is available upon request. Write to: Senior Vice President-Law & SecretaryFluor CorporationOne Enterprise DriveAliso Viejo, California 92656(949) 349-2000
Registrar and Transfer AgentChaseMellon Shareholder Services, L.L.C.400 South Hope Street, Fourth FloorLos Angeles, California 90071 and ChaseMellon Shareholder Services, L.L.C.85 Challenger RoadRidgefield Park, NJ 07660
For change of address, lost dividends, orlost stock certificates, write or telephone: ChaseMellon Shareholder Services, L.L.C.P. O. Box 3315South Hackensack, NJ 07606-1915Attn: Securityholder Relations (800) 813-2847
Requests may also be submitted via e-mail byvisiting their web site at www.chasemellon.com
Independent AuditorsErnst & Young LLP18400 Von Karman AvenueIrvine, California 92612
Annual Shareholders’ MeetingAnnual report and proxy statement aremailed on or about February 1. Fluor’sannual meeting of shareholders will beheld at 9:00 a.m. on March 8, 2000 at: The Hyatt Regency Greenville220 North Main StreetGreenville, South Carolina
Stock TradingFluor’s stock is traded on the New York,Chicago, Pacific, Amsterdam, London andSwiss Stock Exchanges. Common stockdomestic trading symbol: FLR.
Dividend Reinvestment PlanFluor’s Dividend Reinvestment Plan pro-vides shareholders of record with theopportunity to conveniently and economi-cally increase their ownership in Fluor.Through the Plan, shareholders can auto-matically reinvest their cash dividends inshares of Fluor common stock. A mini-mum balance of 50 shares is required forenrollment. Optional cash investmentsmay also be made in additional Fluorshares ranging from a minimum of $100per month to a maximum of $10,000 perquarter. For details on the Plan, contactFluor’s agent, ChaseMellon ShareholderServices (800) 813-2847.
Duplicate Mail ingsShares owned by one person but held indifferent forms of the same name result induplicate mailing of shareholder informa-tion at added expense to the company. Suchduplication can be eliminated only at thedirection of the shareholder. Please notifyChaseMellon Shareholder Services in orderto eliminate duplication.
History of Stock Dividends andSplits Since Going Public in 195008/23/57 20% Stock Dividend12/15/61 5% Stock Dividend03/11/63 5% Stock Dividend03/09/64 5% Stock Dividend03/08/65 5% Stock Dividend02/14/66 5% Stock Dividend03/24/66 2 for 1 Stock Split03/27/67 5% Stock Dividend02/09/68 5% Stock Dividend03/22/68 2 for 1 Stock Split05/16/69 5% Stock Dividend03/06/70 5% Stock Dividend03/05/71 5% Stock Dividend03/10/72 5% Stock Dividend03/12/73 5% Stock Dividend03/11/74 3 for 2 Stock Split08/13/79 3 for 2 Stock Split07/18/80 2 for 1 Stock Split
Company ContactsShareholders may call (888) 432-1745
Shareholder Services:Lawrence N. Fisher(949) 349-6961
Investor Relations:Lila J. Churney(949) 349-3909
Fluor’s investor relations activities are dedicated to providing investors with com-plete and timely information. All investorquestions are welcome.
Web Site Addresswww.fluor.com
Investor [email protected]
Printed entirely on recycled paper.
Fluor is a registered service mark of Fluor Corporation.
Fluor Daniel, Fluor Global Services, Fluor Signature
Services, Knowledge@Work and Fluor Federal Services
are service marks of Fluor Corporation. AMECO is a
registered service mark of American Equipment
Company.
Fluor CorporationOne Enterprise DriveAliso Viejo, California 92656
FLUOR
Features available to you on
http://www.fluor.com
� Review the latest news releases for Fluor as
well as a six-year archive
� Find Fluor’s latest stock price
� Compare Fluor’s historical stock performance
versus the S&P 500
� Find several years of financial publications
available for downloading or on-line view-
ing, including annual reports, fact books
and SEC filings
� Review recent presentations by manage-
ment to the investor community on-line
� Listen to conference calls live and replays
on-line
� Find fundamental financial information,
ratios and trading statistics
� Register on-line to receive alerts via e-mail
for new presentations, news releases and
publications
� Review Fluor’s event calendar and schedule
reminder notices