flush airdata sensing (fads) system calibration procedures ... · flush airdata sensing (fads)...
TRANSCRIPT
NASA/TP-1999-209012
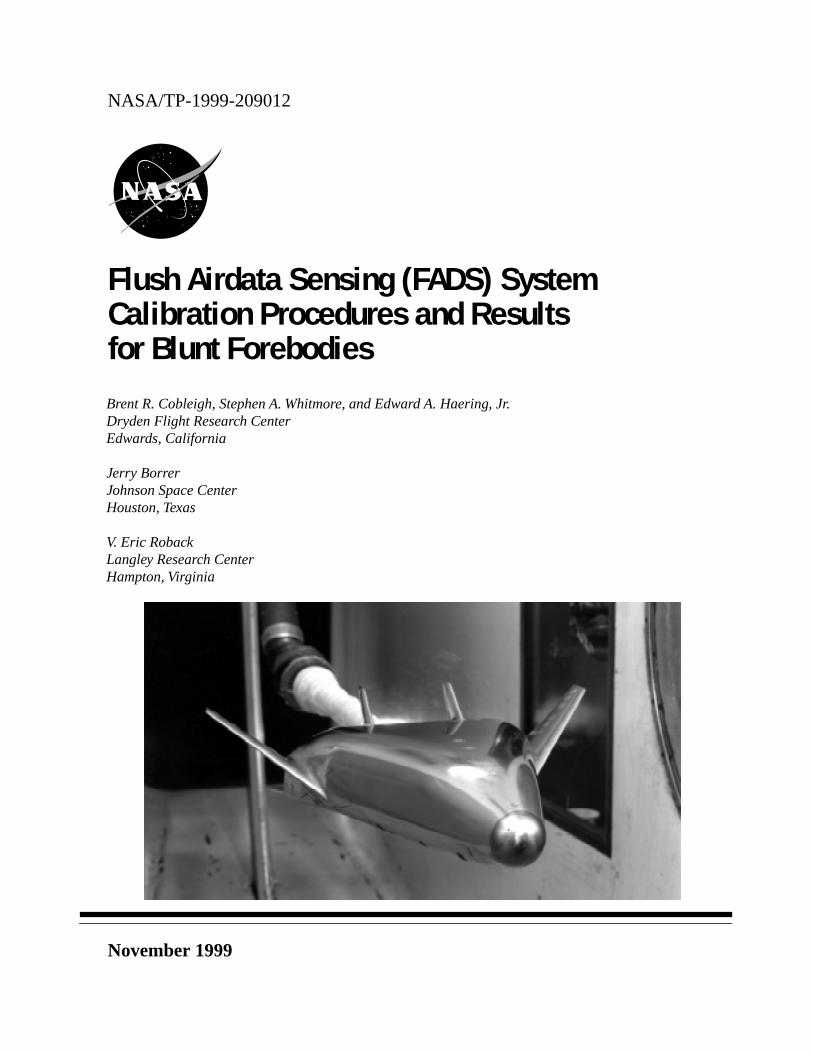
Flush Airdata Sensing (FADS) System Calibration Procedures and Resultsfor Blunt Forebodies
Brent R. Cobleigh, Stephen A. Whitmore, and Edward A. Haering, Jr.Dryden Flight Research CenterEdwards, California
Jerry BorrerJohnson Space CenterHouston, Texas
V. Eric RobackLangley Research CenterHampton, Virginia
November 1999

The NASA STI Program Office . . . in Profile
Since its founding, NASA has been dedicatedto the advancement of aeronautics and space science. The NASA Scientific and Technical Information (STI) Program Office plays a keypart in helping NASA maintain thisimportant role.
The NASA STI Program Office is operated byLangley Research Center, the lead center forNASA’s scientific and technical information.The NASA STI Program Office provides access to the NASA STI Database, the largest collectionof aeronautical and space science STI in theworld. The Program Office is also NASA’s institutional mechanism for disseminating theresults of its research and development activities. These results are published by NASA in theNASA STI Report Series, which includes the following report types:
• TECHNICAL PUBLICATION. Reports of completed research or a major significantphase of research that present the results of NASA programs and include extensive dataor theoretical analysis. Includes compilations of significant scientific and technical data and information deemed to be of continuing reference value. NASA’s counterpart of peer-reviewed formal professional papers but has less stringent limitations on manuscriptlength and extent of graphic presentations.
• TECHNICAL MEMORANDUM. Scientificand technical findings that are preliminary orof specialized interest, e.g., quick releasereports, working papers, and bibliographiesthat contain minimal annotation. Does notcontain extensive analysis.
• CONTRACTOR REPORT. Scientific and technical findings by NASA-sponsored contractors and grantees.
• CONFERENCE PUBLICATION. Collected papers from scientific andtechnical conferences, symposia, seminars,or other meetings sponsored or cosponsoredby NASA.
• SPECIAL PUBLICATION. Scientific,technical, or historical information fromNASA programs, projects, and mission,often concerned with subjects havingsubstantial public interest.
• TECHNICAL TRANSLATION. English- language translations of foreign scientific and technical material pertinent toNASA’s mission.
Specialized services that complement the STIProgram Office’s diverse offerings include creating custom thesauri, building customizeddatabases, organizing and publishing researchresults . . . even providing videos.
For more information about the NASA STIProgram Office, see the following:
• Access the NASA STI Program Home Pageat
http://www.sti.nasa.gov
• E-mail your question via the Internet to [email protected]
• Fax your question to the NASA Access HelpDesk at (301) 621-0134
• Telephone the NASA Access Help Desk at(301) 621-0390
• Write to:NASA Access Help DeskNASA Center for AeroSpace Information7121 Standard DriveHanover, MD 21076-1320
NASA/TP-1999-209012
Flush Airdata Sensing (FADS) System Calibration Procedures and Resultsfor Blunt Forebodies
Brent R. Cobleigh, Stephen A. Whitmore, and Edward A. Haering, Jr.Dryden Flight Research CenterEdwards, California
Jerry BorrerJohnson Space CenterHouston, Texas
V. Eric RobackLangley Research CenterHampton, Virginia
November 1999
National Aeronautics andSpace Administration
Dryden Flight Research CenterEdwards, California 93523-0273

NOTICE
Use of trade names or names of manufacturers in this document does not constitute an official endorsementof such products or manufacturers, either expressed or implied, by the National Aeronautics andSpace Administration.
Available from the following:
NASA Center for AeroSpace Information (CASI) National Technical Information Service (NTIS)7121 Standard Drive 5285 Port Royal RoadHanover, MD 21076-1320 Springfield, VA 22161-2171(301) 621-0390 (703) 487-4650
ACKNOWLEDGMENT
Cover photo courtesy of NASA Langley Research Center, L97-1039, “X-33 Metal Model Testing in LowTurbulence Pressure Tunnel.”
FLUSH AIRDATA SENSING (FADS) SYSTEM CALIBRATION PROCEDURES AND RESULTS FOR BLUNT FOREBODIES*
Brent R. Cobleigh,† Stephen A. Whitmore,‡ and Edward A. Haering, Jr.§
NASA Dryden Flight Research CenterEdwards, California
Jerry Borrer¶
NASA Johnson Space CenterHouston, Texas
V. Eric Roback#
NASA Langley Research CenterHampton, Virginia
Abstract
Blunt-forebody pressure data are used to study thebehavior of the NASA Dryden Flight Research Centerflush airdata sensing (FADS) pressure model andsolution algorithm. The model relates surface pressuremeasurements to the airdata state. Spliced from thepotential flow solution for uniform flow over a sphereand the modified Newtonian impact theory, the model isshown to apply to a wide range of blunt-forebody shapesand Mach numbers. Calibrations of a sphere, sphericalcones, a Rankine half-body, and the F-14, F/A-18, X-33,X-34, and X-38 configurations are shown. The threecalibration parameters are well-behaved from Mach0.25 to Mach 5.0, an angle-of-attack range extending togreater than 30°, and an angle-of-sideslip rangeextending to greater than 15°. Contrary to the sharpcalibration changes found on traditional pitot-staticsystems at transonic speeds, the FADS calibrations aresmooth, monotonic functions of Mach number andeffective angles of attack and sideslip. Because theFADS calibration is sensitive to pressure port location,detailed measurements of the actual pressure port
*Patent pending.†Aerospace Engineer, Senior member, AIAA.‡Aerospace Engineer, Senior member, AIAA.§Aerospace Engineer.¶Senior Systems Engineer.#Aerospace Technologist, Senior member, AIAA.
Copyright 1999 by the American Institute of Aeronautics andAstronautics, Inc. No copyright is asserted in the United States underTitle 17, U.S. Code. The U.S. Government has a royalty-free license toexercise all rights under the copyright claimed herein forGovernmental purposes. All other rights are reserved by the copyrightowner.
1American Institute of Aero
locations on the flight vehicle are required and the wind-tunnel calibration model should have pressure ports insimilar locations. The procedure for calibrating a FADSsystem is outlined.
Nomenclature
a, b, c angle-of-sideslip solution parameters
A, B angle-of-attack solution parameters
angle-of-sideslip solution parameters
pressure coefficient,
impact pressure coefficient,
d diameter
ESP electronic scanning pressure
f ellipsoid fineness ratio,
FADS flush airdata sensing
FPM FADS pressure model
HARV High Alpha Research Vehicle
LMVS Lockheed Martin Vought Systems
M Mach number
n number of ports
NTS National Technical Systems
p pressure
free-stream static pressure, lbf/ft2
total pressure, lbf/ft2
A' B' C',,
Cp p p∞–( ) q∞⁄
Cpcp p∞–( ) qc⁄
major axisminor axis-------------------------
p∞
pt
nautics and Astronautics
total pressure behind a normal shock wave, lbf/ft2
individual port weightings
impact pressure, lbf/ft2
(subsonic ;supersonic )
free-stream dynamic pressure, lbf/ft2
Q weighting matrix
Re Reynolds number
SRA Systems Research Aircraft
UPWT Unitary Plan Wind Tunnel
V velocity
W Taylor series parameter
x, y, z Cartesian coordinates
X, Y FADS pressure model parameters
angle of attack, deg
effective, or local, angle of attack, deg
angle of sideslip, deg
effective, or local, angle of sideslip, deg
shape and compressibility parameter
component caused by Mach number
maximum acceptable Mach error
angle-of-attack flow correction angle, deg
angle-of-sideslip flow correction angle, deg
ratio of specific heats (1.4 for air)
pressure difference, , and so forth
local flow incidence angle, deg
cone angle of a pressure port, deg
clock angle of a pressure port, deg
standard deviation
Subscripts
e effective (or local) angle
i, j, k port indices
max maximum value
ref reference value
true true value
∞ free-stream value
Superscripts
estimate
(m) iteration number
T matrix transpose
–1 matrix inverse
Introduction
The accurate measurement of airdata is critical to theflight control, guidance, and postflight analysis of mostmodern atmospheric flight vehicles. The entire airdatastate can be described by five parameters: Mach number(M), angle of attack , angle of sideslip , eitherpressure altitude or free-stream static pressure ,and the true airspeed. Using these five parameters, allother airdata parameters of interest can be calculated.
Historically, airdata have been measured through theuse of intrusive booms or probes that penetrate the flowaway from the influence of the vehicle body to measuretotal and static pressure, angle of attack, angle ofsideslip, and free-stream temperature. However,specialized requirements of advanced vehicles makeusing intrusive conventional airdata measurementsystems1 highly undesirable. Advanced vehicles includehypersonic vehicles,2 for which the heating environmentis extremely hostile; stealth vehicles, which require aminimal radar cross section; and high-performancevehicles3 that operate beyond the poststall flight regime.For example, the presence of an intrusive airdatanoseboom on the X-31 aircraft induced unsteadiness inthe primary forebody vortices, causing unwanted lateralinstabilities in the poststall flight regime.4, 5
The flush airdata sensing (FADS) system concept, inwhich airdata are inferred from nonintrusive surfacepressure measurements, was developed to circumventmany of the difficulties with intrusive airdata systems.This method does not require probing of the local flowfield to compute airdata parameters, and allows forairdata measurements in flight applications whereprobe-based systems are no longer viable.
The FADS concept relies on a mathematical modelthat relates measured forebody surface pressures to theairdata state. The current method2 uses a nonlinearpressure model and a nonlinear solution algorithm tosolve for the airdata state from the measured pressures.
pt2
q1 q2 …,,
qcqc pt p∞–=qc pt2
p∞–=
q∞
α
αe
β
βe
ε
εM ε
δMrequired
δα
δβ
γ
Γ Γ ij pi p j–=
θ
λ
φ
σ
ˆ
α( ) β( )p∞( )
2American Institute of Aeronautics and Astronautics
Although the FADS pressure model (FPM) has beenvalidated for a high-performance fighter aircraftforebody3 and several simple shapes (for example,cylinder and sphere), the suitability of the model for awide variety of vehicle shapes has not been established.
The primary objective of this study is to gather a setof forebody pressure data for a series of blunt-bodyshapes to generally characterize the behavior of theFPM calibration. A set of guidelines is developed to aidthe design of future blunt-body FADS systems.
The forebody pressure data have been obtained fromfive sources: a wind-tunnel test of three simple blunt-forebody configurations; a collection of previouslypublished wind-tunnel data for generic blunt-bodyshapes; wind-tunnel tests of the X-33, X-34, and X-38hypersonic reentry vehicles; exact potential flowsolutions for uniform flow over a cylinder, sphere, andan arbitrarily-oriented ellipsoid; and flight data from theF-14 and F/A-18 aircraft. The nature of the calibrationfor each of the configurations is evaluated as a functionof Mach number, angle of attack, and angle of sideslip.Behavior of the mathematical model is also evaluated atMach numbers much greater than have been previouslytested (a maximum of Mach 5.0), which will directlybenefit hypersonic FADS applications that are currentlyin development (the X-33, X-34, and X-38 vehicles). Inaddition, the adaptability of the FPM to nonsphericalforebody shapes is tested. The results presenteddemonstrate that the current FADS methodology isuniversally applicable to blunt-nosed configurations.
A patent has been filed on this NASA invention.Equations (10)–(16) are included in this patent. Notethat use of trade names or names of manufacturers inthis document does not constitute an officialendorsement of such products or manufacturers, eitherexpressed or implied, by the National Aeronautics andSpace Administration.
Background and Historical Perspective
The original flush airdata system prototype wasdeveloped for the X-15 program and used a steerable-ball nose that attempted to nullify upper and lowerpressure measurements to determine the stagnationpoint and the local angle of attack.6 The mechanicaldesign of this system was cumbersome, and the analog-steering concept was abandoned after the X-15 programended.
A subsequent approach, the Space Shuttle entryairdata system,7 was developed at the NASA Langley
Research Center (Hampton, Virginia) for the SpaceShuttle program. This system used a matrix of fixedstatic-pressure orifices on the orbiter nosecap. Thetechnique later was adapted to aeronautical applications,and several demonstration programs were performed inthe early 1980’s at the NASA Dryden Flight ResearchCenter (Edwards, California).8, 9 For these earlyprograms, the sensed pressures were related to thedesired airdata parameters using a nonphysicalmapping. These tests verified the feasibility of the fixed-orifice concept but did not demonstrate real time–capable algorithms for estimating the airdata from thepressure measurements.
The first estimation algorithms capable of real-timeoperation were developed at NASA Dryden during thelate 1980’s for the F/A-18 High Alpha Research Vehicle(HARV) program. The HARV flight tests alsodemonstrated that the measurement range of FADSsystems could be extended to angles of attack greaterthan 60°. The computations were performed postflightusing pressure data telemetered to the ground. Theestimation algorithms developed for the HARV programrecently were demonstrated in a real-time flightenvironment on the NASA Dryden F/A-18 SystemsResearch Aircraft (SRA).10
For the HARV and SRA FADS systems, surfacepressure measurements were related to the desiredairdata parameters using a calibrated aerodynamicmodel. The model was derived from a combination ofpotential flow over a sphere11 and modified Newtonianflow theory.12 This model, which was calibrated withflight data, captured the salient features of the local flowbut was simple enough to be invertable in real time.Nonlinear regression13 was used to invert theaerodynamic model. In this algorithm, all surfacepressure measurements were simultaneously used toinfer the airdata by linearizing the equations around theresult of the previous data frame.
The nonlinear regression algorithm developed for theF/A-18 flight test programs exhibited problems withalgorithm stability in the transonic and supersonic flightregimes and in the presence of undetected sensorfailures. These stability problems required ad hocsoftware patches to artificially aid the stability bydeleting failed or degraded port measurements from theestimation algorithm. These ad hoc additions to the codewere computationally cumbersome and did notuniversally stabilize the algorithm for all flightregimes.10 The instability problems exhibited by thenonlinear regression algorithm precluded its use in areal-time feedback mode.
3American Institute of Aeronautics and Astronautics
To avoid problems encountered using the nonlinearregression algorithm, a new solution algorithm2 hasbeen developed for the X-33, X-34, and X-38demonstration vehicles. These transatmosphericvehicles generally require airdata measurements forflight-critical tasks (such as inertial guidancestabilization and inner- and outer-loop flight control)and for terminal-area energy management. This solutionalgorithm, superior to the nonlinear regressionalgorithm, has been developed by taking strategiccombinations of three sensor readings to analyticallydecouple the angle-of-attack and angle-of-sideslipcomputations from the Mach number and static pressurecalculations.2 This innovation allows development of anestimation algorithm whose solution speed is superior tothe nonlinear regression algorithm and whose solutionstability can be analytically assured for a given portarrangement.
Flush Airdata Sensing Pressure Model
As previously mentioned, the FPM is used to relatethe observed surface pressures to the desired airdatastate. The model is postulated as a compromise betweena simple potential flow model on a sphere,11
(1)
and modified Newtonian flow theory12 for blunt objectsin hypersonic flow,
, (2)
where Cp is the pressure coefficient at a point on theforebody surface and is the incidence angle betweenthe surface normal at the pressure port and the localvelocity vector. The incidence angle is geometricallyrelated to the effective (local) angle of attack, , andeffective (local) angle of sideslip, , by10
(3)
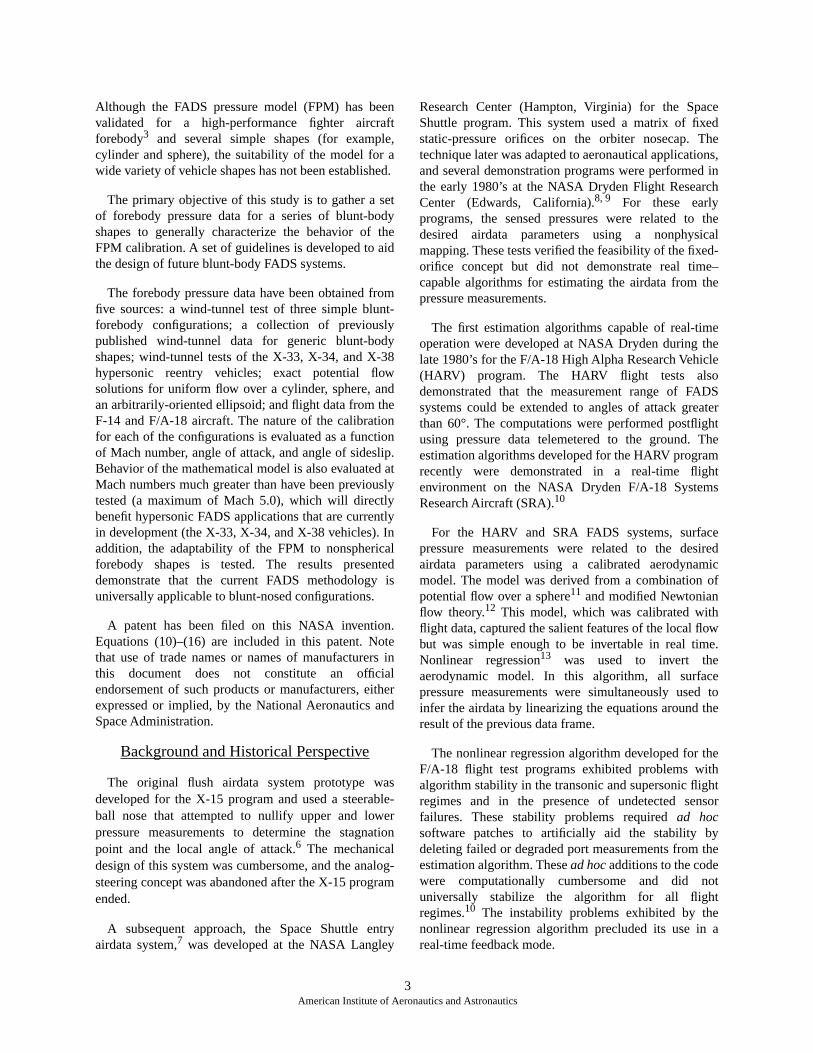
where i is a port index. In equation (3), and are thelocal surface coordinates referred to as the clock andcone angles, respectively. The clock angle is measured
clockwise around the longitudinal axis looking aftstarting from the bottom. Cone angle is the total anglethe normal to the surface makes with respect to thelongitudinal axis of the forebody. Figure 1 shows theclock and cone angle definitions.
Figure 1. Clock and cone angle definitions.
The effective angles of attack and sideslip, and, are the flow direction angles as locally sensed on the
blunt forebody. These angles have been deflected fromthe free-stream flow direction by expansion around theforebody and by upwash and sidewash induced by therest of the vehicle. The true free-stream flow incidenceangles are related to the effective angles by a set ofcalibrations2, 10 of the forms
(4)
and
. (5)
The calibrations must be empirically determined using areference airdata set obtained either in a wind tunnel orfrom flight data. Fortunately, the FADS wind-tunnelcalibration tests can be easily accomplished in parallel
Cp θ( )p θ( ) p∞–
qc------------------------ 1
94--- θ2
sin–= =
54---–=
94--- θ2
,cos+
Cp θ( )pt2
p∞–
q∞-------------------- θ2
cos Cpmaxθ2
cos= =
θ
αeβe
θi( )cos αe( ) βe( ) λ i( )coscoscos=
βe( ) φi( ) λ i( )sinsinsin+
αe( ) βe( ) φi( ) λ i( ),sincoscossin+
φ λ
λ i
φ i
y
x
z
i
i
Nosecap
990346
Nosecap
Surface normal at port i
αeβe
δα M∞ αe,[ ] α e α true–=
δβ M∞ βe,[ ] β e βtrue–=
4American Institute of Aeronautics and Astronautics
with traditional force and moment testing. Methods fordetermining these calibrations from a reference set aredescribed in detail in the “Flush Airdata SensingPressure Model Calibration Procedure” section.
Equations (1) and (2) can be spliced together to give aflow model that is applicable to a large Mach numberrange by the parameterization
, (6)
where the coefficients X and Y are a function of Machnumber and the effective flow angles. At 0° incidenceangle, equation (6) must satisfy subsonic flowconditions:
(7(a))
or supersonic flow conditions:
. (7(b))
By setting
(8)
and
, (9)
the constraints of equation (7) are satisfied for all Machnumbers and the general FPM results:
(10)
In equations (7)–(10), is the free-stream dynamicpressure and qc is the impact pressure.
Flush Airdata Sensing Solution Algorithm
Equation (10) states that the local surface pressure atany point on a spherical (blunt) forebody is a function ofthe free-stream flight conditions, the angle between the
effective flow vector and the surface normal, and acalibration parameter, . Because flow incidence angles
and are imbedded in and , equation (10) isinherently nonlinear. Usually five or more pressuremeasurements are used to solve for the minimum airdatastate ,2, 10 although the airdata can becalculated with as few as four. The minimum airdatastate is sufficient to calculate all other important airdataparameters (pressure altitude, Mach number, equivalentairspeed, and so forth) except true airspeed, whichrequires a measurement or estimate of the free-streamtemperature in order to calculate the speed of sound.
As was mentioned in the Introduction, the nonlinearregression algorithm that was applied in references 3and 10 had problems with algorithm stability. Apreferable method for estimating the airdata parametersis described in the following subsections. A detailedderivation and stability analysis has been published.2
The “Triples” Algorithm
By taking strategic combinations of three surfacesensor readings (“triples”), qc, , and are eliminatedfrom equation (10). The resulting equation is
(11(a))
Rearranging equation (11(a)) yields
(11(b))
where
(11(c))
and pi, pj, and pk are the pressures used in the data“triple.” Although equation (11(a)) is still nonlinear, has been removed, thus decoupling the local flow anglesfrom the calibration parameter.
Cp θ( ) X M∞ αe βe,,( ) Y M∞ αe βe,,( ) θ2cos+=
Cp 0( )pt∞
p∞–
q∞--------------------
qc
q∞------= =
Cp 0( )pt2
p∞–
q∞--------------------
qc
q∞------= =
X M∞ αe βe,,( )qc
q∞------ε M∞ αe βe,,( )=
Y M∞ αe βe,,( )qc
q∞------ 1 ε M∞ αe βe,,( )–[ ]=
p θ( ) =
qc θ αe βe,( ) ε M∞ αe βe,,( ) θ αe βe,( )2sin+
2cos[ ]
p∞.+
q∞
εαe βe θ ε
qc p∞ α β,,,( )
p∞ ε
pi p j–
p j pk–-----------------
qc θ2icos ε θ2
isin+{ } p∞ qc θ2jcos ε θ2
jsin+{ } p∞+[ ]–+
qc θ2jcos ε θ2
jsin+{ } p∞ qc θ2kcos ε θ2
ksin+{ } p∞+[ ]–+------------------------------------------------------------------------------------------------------------------------------------------------=
1({ ε ) θ2icos ε } 1({ ε ) θ2
jcos ε }+––+–
1({ ε ) θ2jcos ε } 1({ ε ) θ2
kcos ε }+––+–-----------------------------------------------------------------------------------------------------------=
θ2icos θ2
jcos–
θ2jcos θ2
kcos–-------------------------------------- .=
Γik θ2jcos Γji θ2
kcos Γkj θ2icos 0=+ +
Γik pi pk–( );=
Γji p j pi–( );=
Γkj pk p j–( );=
ε
5American Institute of Aeronautics and Astronautics
Angle-of-Attack Estimator
The effective angle of attack, , can be furtherdecoupled from by using only pressures alignedalong a vertical meridian (where or ). Inthis geometry arrangement, terms related to areeliminated from equation (11(b)). The result is aquadratic expression in tan of the form
(12)
As reference 2 shows, this quadratic equation can bereduced to the following mutually exclusive solutions:
, (13(a))
, (13(b))
where the parameters A and B are defined as follows:
(14)
Angle-of-Sideslip Estimator
When the effective angle of attack has been estimated,then the effective angle of sideslip may be evaluatedusing any combinations of the available ports except theset where all three ports lie on the vertical meridian. Theresult is a quadratic equation in tan ,
, (15)
where
and
Equation (15) has two solutions; however, unlike thesolution for angle of attack, these solutions are notnecessarily mutually exclusive. In general, selection ofthe correct root depends upon the port arrangement usedto determine the angle of sideslip. For most practicalarrangements, however, selection of the root ofequation (15) whose magnitude is closest to zero willgive the correct result. Reference 2 provides a detaileddiscussion of the sideslip root selection criteria.
Mach Number, Static Pressure, and Impact Pressure Estimator
When the values of and have been determined,the incidence angles at all of the ports can be evaluated,and only , , and remain unknown in the pressuremodel (eq. (10)). As described earlier, typically is afunction of Mach number, and hence is implicitlyrelated to both and . As a result, solutions for and must be iteratively extracted at each time step.The resulting estimator2 takes the form
, (16)
where
αeβe
φ 0°= 180°βe
αe( )
Γik λ2jsin Γji λ2
ksin Γkj λ2isin+ + α2
etan
2 Γik+ λ j λ j φjcossincos Γji λk λk φkcossincos+
Γkj λi λi φi αetancossincos+
Γik λ2jcos Γji λ2
kcos Γkj λ2icos+ + 0.=+
for αe 45°,≤ αe12--- A
B----
1–tan=
for αe 45°, > αe12--- π A
B----
1–tan–
=
A Γik λ2jsin Γji λ2
ksin Γkj λ2isin+ +=
B Γik φjcos λ jsin λ jcos Γji φkcos λksin λkcos+=
Γkj φicos λisin λ i .cos+
βe
A' β2etan 2B' βetan C' 0=+ +
A' Γik b j2 Γji bk
2 Γkj bi2
+ +
;=
B' Γik a jb j Γji akbk Γkj aibi+ +
;=
C' Γik a j2 Γji ak
2 Γkj ai2
+ +
;=
a ijk{ } αecos λ ijk{ }cos αesin λ ijk{ }sin φ ijk{ } ;cos+=
b ijk{ } λ ijk{ }sin φ ijk{ } .sin=
αe βe
ε p∞ qcε
p∞ qc p∞qc
q̂c
p̂∞
m 1+( )
Mm( )T
Q Mm( )
1–
Mm( )T
Q
p1
p2
·
·
·
pn
=
6American Institute of Aeronautics and Astronautics
.
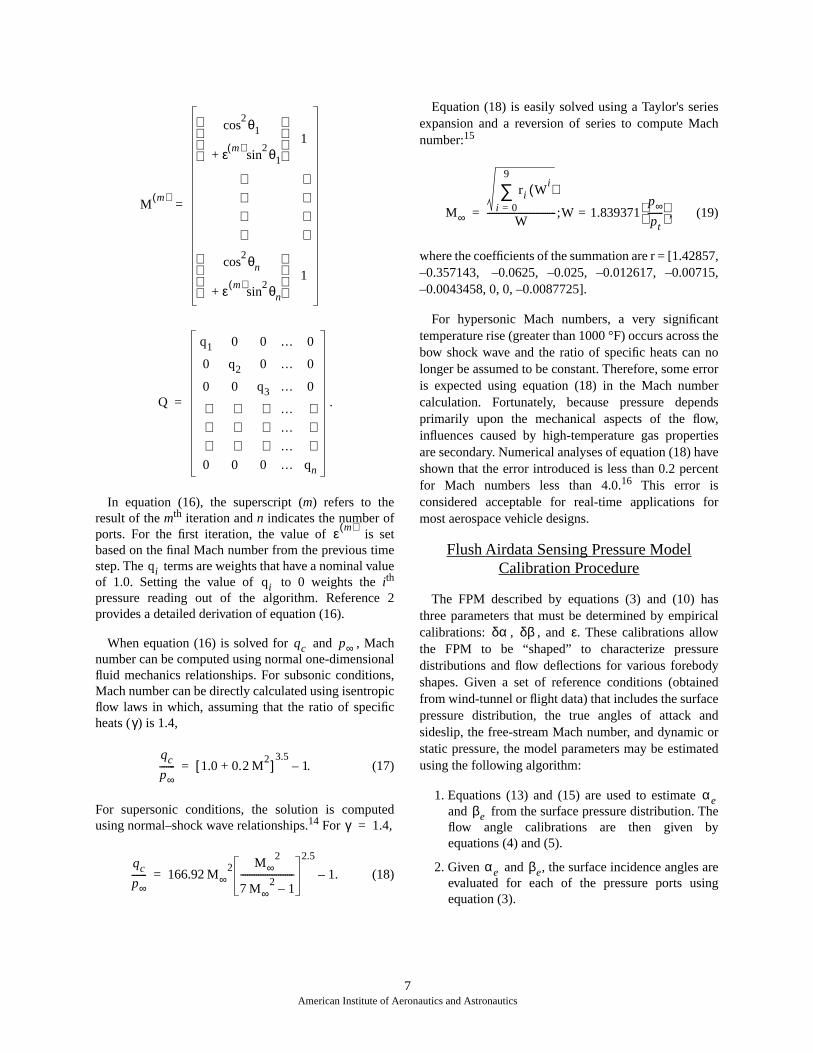
In equation (16), the superscript (m) refers to theresult of the mth iteration and n indicates the number ofports. For the first iteration, the value of is setbased on the final Mach number from the previous timestep. The terms are weights that have a nominal valueof 1.0. Setting the value of to 0 weights the ith
pressure reading out of the algorithm. Reference 2provides a detailed derivation of equation (16).
When equation (16) is solved for and , Machnumber can be computed using normal one-dimensionalfluid mechanics relationships. For subsonic conditions,Mach number can be directly calculated using isentropicflow laws in which, assuming that the ratio of specificheats ( ) is 1.4,
. (17)
For supersonic conditions, the solution is computedusing normal–shock wave relationships.14 For ,
. (18)
Equation (18) is easily solved using a Taylor's seriesexpansion and a reversion of series to compute Machnumber:15
, (19)
where the coefficients of the summation are r = [1.42857,–0.357143, –0.0625, –0.025, –0.012617, –0.00715,–0.0043458, 0, 0, –0.0087725].
For hypersonic Mach numbers, a very significanttemperature rise (greater than 1000 °F) occurs across thebow shock wave and the ratio of specific heats can nolonger be assumed to be constant. Therefore, some erroris expected using equation (18) in the Mach numbercalculation. Fortunately, because pressure dependsprimarily upon the mechanical aspects of the flow,influences caused by high-temperature gas propertiesare secondary. Numerical analyses of equation (18) haveshown that the error introduced is less than 0.2 percentfor Mach numbers less than 4.0.16 This error isconsidered acceptable for real-time applications formost aerospace vehicle designs.
Flush Airdata Sensing Pressure Model Calibration Procedure
The FPM described by equations (3) and (10) hasthree parameters that must be determined by empiricalcalibrations: , , and . These calibrations allowthe FPM to be “shaped” to characterize pressuredistributions and flow deflections for various forebodyshapes. Given a set of reference conditions (obtainedfrom wind-tunnel or flight data) that includes the surfacepressure distribution, the true angles of attack andsideslip, the free-stream Mach number, and dynamic orstatic pressure, the model parameters may be estimatedusing the following algorithm:
1. Equations (13) and (15) are used to estimate and from the surface pressure distribution. Theflow angle calibrations are then given byequations (4) and (5).
2. Given and , the surface incidence angles areevaluated for each of the pressure ports usingequation (3).
Mm( )
θ21cos
ε m( ) θ21sin+
1
⋅ ⋅⋅ ⋅⋅ ⋅⋅ ⋅
θ2ncos
ε m( ) θ2nsin+
1
=
Q
q1 0 0 … 0
0 q2 0 … 0
0 0 q3 … 0
⋅ ⋅ ⋅ … ⋅⋅ ⋅ ⋅ … ⋅⋅ ⋅ ⋅ … ⋅0 0 0 … qn
=
ε m( )
qiqi
qc p∞
γ
qc
p∞------- 1.0 0.2 M
2+[ ]
3.51–=
γ 1.4=
qc
p∞------- 166.92 M∞
2 M∞2
7 M∞2
1–------------------------
2.5
1–=
M∞
ri Wi( )
i 0=
9
∑W
-------------------------------;W 1.839371p∞pt-------
==
δα δβ ε
αeβe
αe βe
7American Institute of Aeronautics and Astronautics
3. The result of step 2 is substituted intoequation (10) and rearranged:
, (20)
where
.
4. Equation (20) is evaluated and collecting for all ofthe n pressure ports yields
. (21)
5. Equation (21) can be directly solved17 to give aleast-squares estimate of :
. (22)
6. The estimate of derived from equation (22)gives the minimum fit error with respect to thepressure distribution. The estimate, however, maynot give the minimum error with respect to thereference Mach number. If a refinement is desiredto minimize the fit error with respect to Machnumber, then a “steepest-descent” algorithm18 canbe used. For ,
. (23)
In equation (23), is the sensitivityderivative of the calibration parameter with respectto Mach number, and M(m) is the Mach numbersolution at the mth iteration. The derivative
is numerically determined byperturbing Mach number and determining thechange in .
Using the above procedures, the model calibrationsfor a new configuration can be systematically developedfrom the reference data. Typically, systematic trends inthe calibration parameters are identified by plotting theestimated calibration parameters as a function ofreference variables and visually inspecting the results.Care should be taken to ensure that adequate referencedata are generated in order to cover the desired flightenvelope. Also, calibrations with respect to differentgeometrical configurations for the vehicle (for example,gear up or down and control surface deflections) may berequired. Detailed calibration examples for variousforebody shapes are given in the “Results” section.
Blunt-Body Pressure Data Sources
Three calibration parameters must be evaluated forany FADS system: the shape and compressibilityparameter, ; the angle-of-attack flow correction angle,
; and the angle-of-sideslip flow correction angle, .As mentioned in the introduction, a general set ofguidelines regarding the structure of the calibrationcurves for various FADS systems has never beendeveloped and reported. This paper attempts to developsuch a set of rules by deriving calibrations for a varietyof shapes. The calibrations are derived from threedistinct data sources: analytical solutions for simplegeometries, wind-tunnel data, and flight data. Thefollowing subsections detail the geometricalconfigurations analyzed and the data sources. Resultsobtained by applying the FADS calibration proceduresto the data are presented in the “Results” section.
Analytical Solutions for Simple Geometries
To better understand the variations in the FADScalibration caused by configuration changes, anevaluation of exact, analytical solutions was desired.Two fixed-geometry incompressible solutions alreadyexist that exactly fit into the FPM. Incompressible,uniform crossflow over a cylinder has a pressuresolution given by:
(24)
Incompressible, uniform flow over a sphere has apressure distribution described by:
Cpcθ( ) θ2
cos– θ2sin ε M∞ αe βe,,( )⋅=
Cpcθ( )
p θ( ) p∞–
qc------------------------=
Cpcθ1( ) θ2
1cos–
⋅⋅⋅
Cpcθn( ) θ2
ncos–
θ21sin
·
·
·
θ2nsin
ε M∞ αe βe,,( )⋅=
ε
ε M∞ αe βe,,( )
θ2isin
i 1=
n
∑ Cpcθi( ) θ2
icos–
θ4isin
i 1=
n
∑-----------------------------------------------------------------------=
ε
Mref Mj( ) δMrequired>–
ε m 1+( ) ε m( ) ∂ε m( )
∂M------------- Mref M
m( )–[ ]+=
∂ε m( )( ) ∂M⁄
∂ε m( )( ) ∂M⁄
ε m( )
εδα δβ
Cp θ( )p θ( ) p∞–
qc------------------------ 1 4 θ2
sin–= =
θ2cos 3 θ2
.sin–=
8American Institute of Aeronautics and Astronautics
(25)
The FPM (eq. (10)), in which is equal to –3 for acylinder and –1.25 for a sphere, exactly models theincompressible flow solutions.
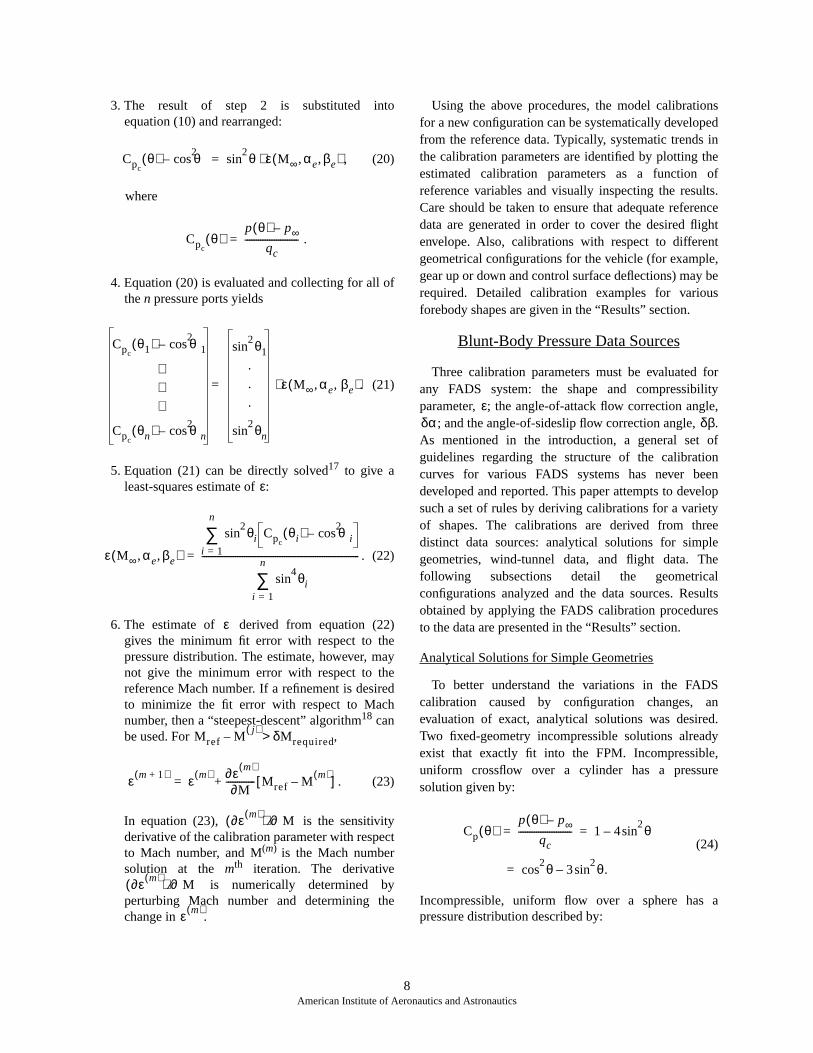
A general, analytical, potential-flow solutionalgorithm19 was developed for the three-dimensionalellipsoid shown in figure 2. This algorithm calculatesthe pressure coefficient at any point on the surface of theellipsoid, and the ellipsoid can be arbitrarily inclined tothe free stream. The ellipsoid fineness ratio, f, is definedas the ratio of the major to the minor ellipsoid axes; the
major axis is also the reference axis. Analysis must belimited to conditions where flow separation is notexpected because the incompressible solution will notpredict it.
Because the FPM was adapted from a sphericalmodel, the ellipsoid provides a strenuous test of theFPM application to nonspherical shapes. This test isnecessary if the FPM is to be generally applicable. Theanalytical ellipsoid pressure model allows the evaluationof the FADS calibration parameters with varyingforebody shape, angle of attack, and angle of sideslip.
Wind-Tunnel Data
The potential flow solutions described in the previoussection clearly do not include the effects of viscosity,Reynolds number, or compressibility. To understandthese effects in greater detail, data from a series of wind-tunnel tests were analyzed. These data cover a widerange of Mach numbers, incidence angles, and forebodyshapes. The wind-tunnel data also were used todemonstrate the sensitivity of the FADS calibration tothe port locations. The test facilities, model shapes, testconditions, and wind-tunnel instrumentation aredescribed in detail in the following subsections. Table 1shows the range of test conditions analyzed for each ofthe wind-tunnel models.
Forebody Wind-Tunnel Tests
A series of wind-tunnel tests, designed to test theadaptability of the FPM and the accompanyingcalibration procedures, was conducted in the NationalTechnical Systems (Saugus, California) 4 ft–by–4 ft
Cp θ( )p θ( ) p∞–
qc------------------------ 1
94--- θ2
sin–= =
θ2cos
54--- θ2
.sin–=
ε
V
α
990227
Fineness ratio = f =major axis
Major axis
minor axis
Minor axis
Figure 2. Ellipsoid configuration.
9American Institute of Aeronautics and Astronautics
Table 1. Wind-tunnel model test conditions.
Configuration TunnelMach number range
range, deg
range,
degLow High Low High Low High
8-deg cone NTS 0.30 4.50 –5 30 0 0
X-33forebody NTS 0.30 4.50 –5 30 –5 15
Rankinehalf-body NTS 0.30 4.50 –5 30 0 0
X-33 16-Foot 0.25 1.20 –10 24 –10 16
X-33 UPWT 1.60 4.50 –10 24 –10 10
X-34 14- by 22-Foot 0.30 0.30 –4 20 –8 8
X-38 LMVS 0.40 0.95 –5 24 –4 4
α β
blow-down-to-atmosphere wind tunnel. The facilityoperates at Mach numbers ranging from 0.25 to 5.00.High-pressure air is fed through a variable-geometrynozzle to achieve the desired test conditions. The walls,floor, and ceiling in the transonic test section are22-percent porous to minimize reflected shock waves.
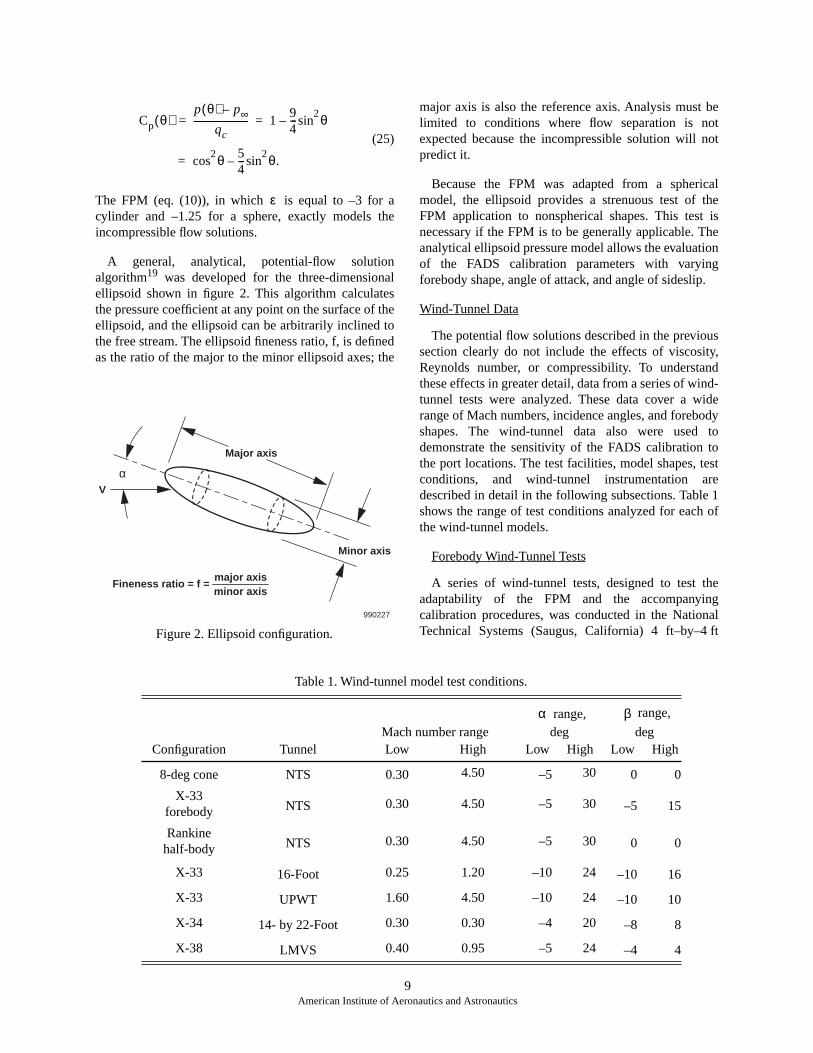
This series of wind-tunnel tests was conducted withthree models (fig. 3). The first model was a sphericallyblunted 8-deg nosecone. This shape is similar to severalsingle-stage-to-orbit launch vehicle designs and fighterforebody shapes. The second model shape was achievedby rotating a two-dimensional Rankine half-body**
along its central axis. The result was an ellipse-likeforebody that approaches a cylindrical shape at infinitedistance. The third shape accurately modeled the first20 percent of body length of the X-33 single-stage-to-orbit vehicle (Lockheed Martin Skunk Works, Palmdale,California) at a scale of approximately 4.2 percent. Asmooth boat-tail afterbody was added to the X-33forebody to move the base separation away from thenosecap region. This model representsnonaxisymmetric, lifting-body type configurations.
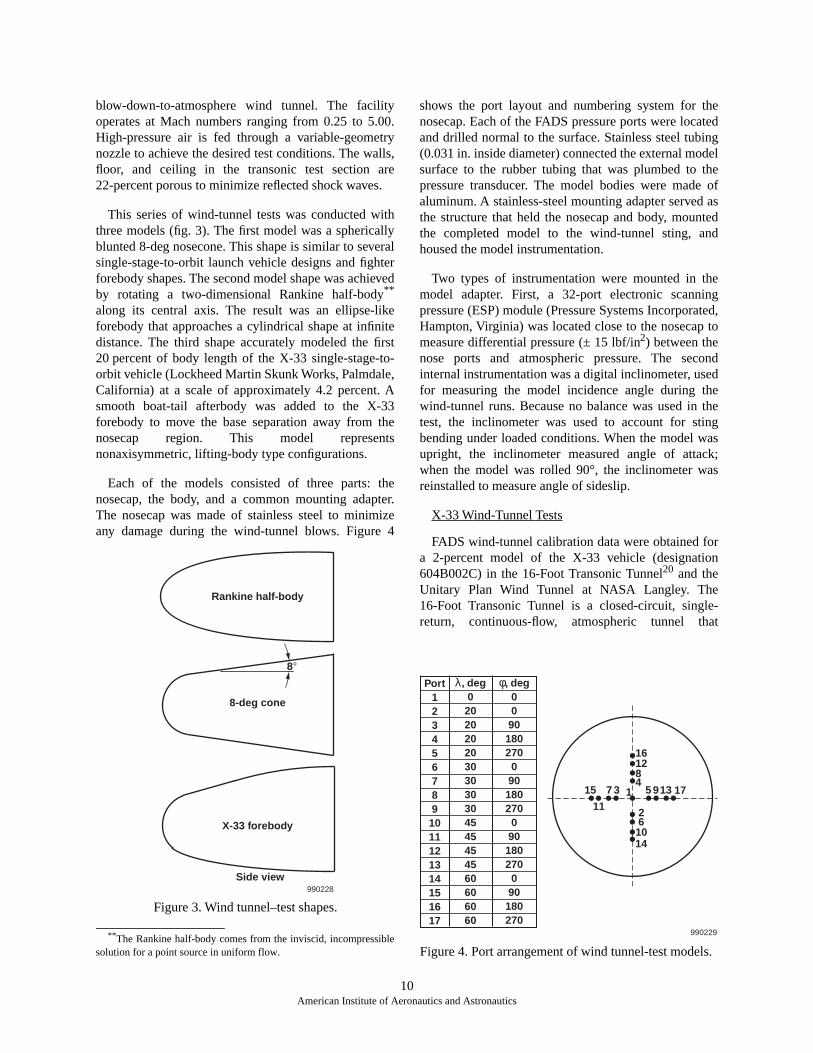
Each of the models consisted of three parts: thenosecap, the body, and a common mounting adapter.The nosecap was made of stainless steel to minimizeany damage during the wind-tunnel blows. Figure 4
shows the port layout and numbering system for thenosecap. Each of the FADS pressure ports were locatedand drilled normal to the surface. Stainless steel tubing(0.031 in. inside diameter) connected the external modelsurface to the rubber tubing that was plumbed to thepressure transducer. The model bodies were made ofaluminum. A stainless-steel mounting adapter served asthe structure that held the nosecap and body, mountedthe completed model to the wind-tunnel sting, andhoused the model instrumentation.
Two types of instrumentation were mounted in themodel adapter. First, a 32-port electronic scanningpressure (ESP) module (Pressure Systems Incorporated,Hampton, Virginia) was located close to the nosecap tomeasure differential pressure (± 15 lbf/in2) between thenose ports and atmospheric pressure. The secondinternal instrumentation was a digital inclinometer, usedfor measuring the model incidence angle during thewind-tunnel runs. Because no balance was used in thetest, the inclinometer was used to account for stingbending under loaded conditions. When the model wasupright, the inclinometer measured angle of attack;when the model was rolled 90°, the inclinometer wasreinstalled to measure angle of sideslip.
X-33 Wind-Tunnel Tests
FADS wind-tunnel calibration data were obtained fora 2-percent model of the X-33 vehicle (designation604B002C) in the 16-Foot Transonic Tunnel20 and theUnitary Plan Wind Tunnel at NASA Langley. The16-Foot Transonic Tunnel is a closed-circuit, single-return, continuous-flow, atmospheric tunnel that
**The Rankine half-body comes from the inviscid, incompressiblesolution for a point source in uniform flow.
8°
Rankine half-body
8-deg cone
X-33 forebody
Side view990228
Figure 3. Wind tunnel–test shapes.
Port1234567891011121314151617
λ, deg020202020303030304545454560606060
φ, deg0090180270090180270090180270090180270
15 7
11
3 5 139 17
2610
481216
14
1
990229
Figure 4. Port arrangement of wind tunnel-test models.
10American Institute of Aeronautics and Astronautics
operates at Mach numbers ranging from 0.2 to 1.3. Thetunnel has an octagonal, 16-ft slotted test section. Somerun limitations are sometimes imposed near transonicspeeds because of the lack of porous walls to absorbreflected shock waves. The small size of the X-33model, however, allowed testing at transonic Machnumbers without reflected shock-wave interference. TheUnitary Plan Wind Tunnel is a closed-circuit,continuous-flow, variable-density, supersonic windtunnel with two 4 ft–by–4 ft test sections. One testsection operates at a Mach number range from 1.5 to2.9, and the other operates at a range from Mach 2.3 toapproximately Mach 4.5. The Reynolds number wasnearly constant at . Results of the X-33FADS wind-tunnel tests were also previously reported.2
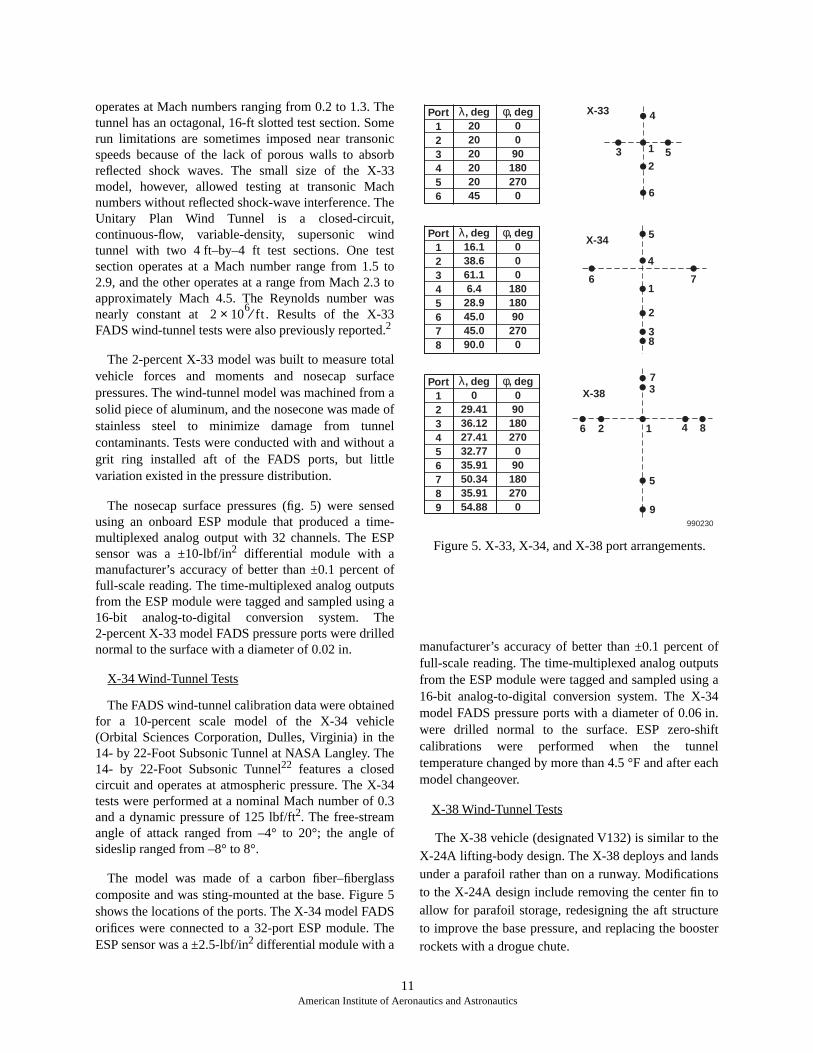
The 2-percent X-33 model was built to measure totalvehicle forces and moments and nosecap surfacepressures. The wind-tunnel model was machined from asolid piece of aluminum, and the nosecone was made ofstainless steel to minimize damage from tunnelcontaminants. Tests were conducted with and without agrit ring installed aft of the FADS ports, but littlevariation existed in the pressure distribution.
The nosecap surface pressures (fig. 5) were sensedusing an onboard ESP module that produced a time-multiplexed analog output with 32 channels. The ESPsensor was a ±10-lbf/in2 differential module with amanufacturer’s accuracy of better than ±0.1 percent offull-scale reading. The time-multiplexed analog outputsfrom the ESP module were tagged and sampled using a16-bit analog-to-digital conversion system. The2-percent X-33 model FADS pressure ports were drillednormal to the surface with a diameter of 0.02 in.
X-34 Wind-Tunnel Tests
The FADS wind-tunnel calibration data were obtainedfor a 10-percent scale model of the X-34 vehicle(Orbital Sciences Corporation, Dulles, Virginia) in the14- by 22-Foot Subsonic Tunnel at NASA Langley. The14- by 22-Foot Subsonic Tunnel22 features a closedcircuit and operates at atmospheric pressure. The X-34tests were performed at a nominal Mach number of 0.3and a dynamic pressure of 125 lbf/ft2. The free-streamangle of attack ranged from –4° to 20°; the angle ofsideslip ranged from –8° to 8°.
The model was made of a carbon fiber–fiberglasscomposite and was sting-mounted at the base. Figure 5shows the locations of the ports. The X-34 model FADSorifices were connected to a 32-port ESP module. TheESP sensor was a ±2.5-lbf/in2 differential module with a
manufacturer’s accuracy of better than ±0.1 percent offull-scale reading. The time-multiplexed analog outputsfrom the ESP module were tagged and sampled using a16-bit analog-to-digital conversion system. The X-34model FADS pressure ports with a diameter of 0.06 in.were drilled normal to the surface. ESP zero-shiftcalibrations were performed when the tunneltemperature changed by more than 4.5 °F and after eachmodel changeover.
X-38 Wind-Tunnel Tests
The X-38 vehicle (designated V132) is similar to theX-24A lifting-body design. The X-38 deploys and landsunder a parafoil rather than on a runway. Modificationsto the X-24A design include removing the center fin toallow for parafoil storage, redesigning the aft structureto improve the base pressure, and replacing the boosterrockets with a drogue chute.
2 106× ft⁄
5
4
1
2
38
6 7
X-33
X-38
4
1
2
6
3 5
X-34
7
12
3
4
5
9
86
Port12345678
λ, deg16.138.661.16.428.945.045.090.0
φ, deg000
180180902700
Port123456
λ, deg202020202045
φ, deg00901802700
Port123456789
λ, deg0
29.4136.1227.4132.7735.9150.3435.9154.88
φ, deg0901802700901802700
990230
Figure 5. X-33, X-34, and X-38 port arrangements.
11American Institute of Aeronautics and Astronautics
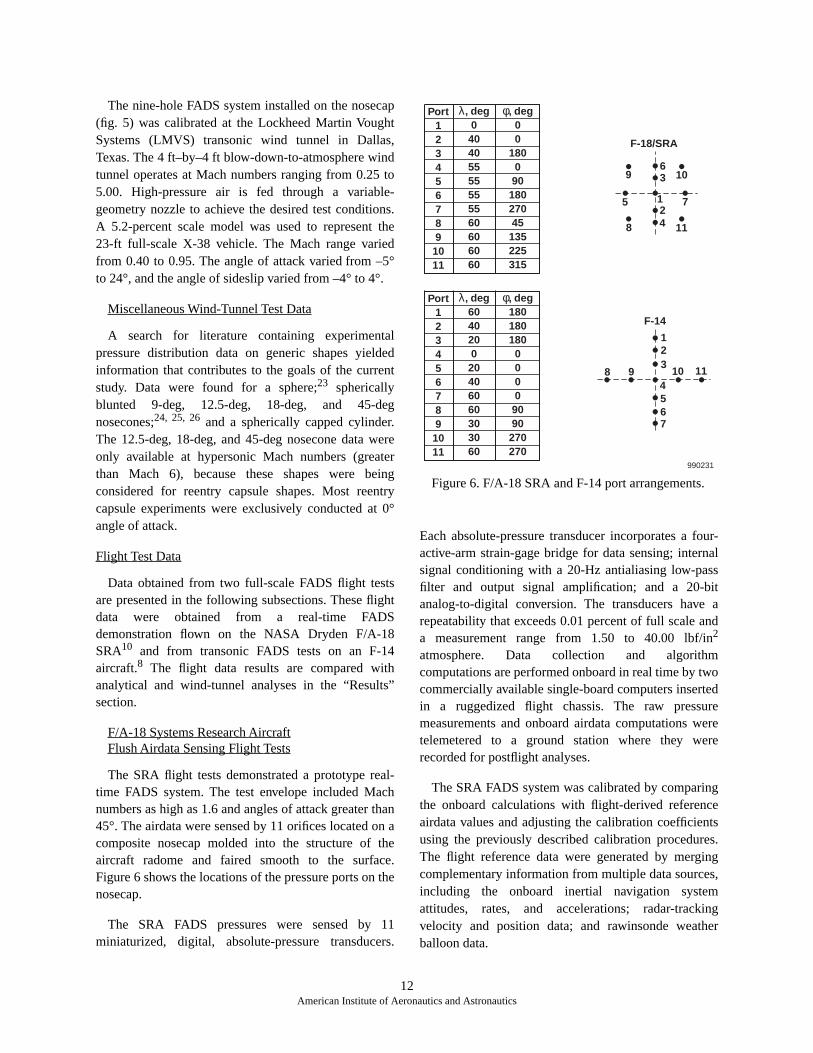
The nine-hole FADS system installed on the nosecap(fig. 5) was calibrated at the Lockheed Martin VoughtSystems (LMVS) transonic wind tunnel in Dallas,Texas. The 4 ft–by–4 ft blow-down-to-atmosphere windtunnel operates at Mach numbers ranging from 0.25 to5.00. High-pressure air is fed through a variable-geometry nozzle to achieve the desired test conditions.A 5.2-percent scale model was used to represent the23-ft full-scale X-38 vehicle. The Mach range variedfrom 0.40 to 0.95. The angle of attack varied from –5°to 24°, and the angle of sideslip varied from –4° to 4°.
Miscellaneous Wind-Tunnel Test Data
A search for literature containing experimentalpressure distribution data on generic shapes yieldedinformation that contributes to the goals of the currentstudy. Data were found for a sphere;23 sphericallyblunted 9-deg, 12.5-deg, 18-deg, and 45-degnosecones;24, 25, 26 and a spherically capped cylinder.The 12.5-deg, 18-deg, and 45-deg nosecone data wereonly available at hypersonic Mach numbers (greaterthan Mach 6), because these shapes were beingconsidered for reentry capsule shapes. Most reentrycapsule experiments were exclusively conducted at 0°angle of attack.
Flight Test Data
Data obtained from two full-scale FADS flight testsare presented in the following subsections. These flightdata were obtained from a real-time FADSdemonstration flown on the NASA Dryden F/A-18SRA10 and from transonic FADS tests on an F-14aircraft.8 The flight data results are compared withanalytical and wind-tunnel analyses in the “Results”section.
F/A-18 Systems Research AircraftFlush Airdata Sensing Flight Tests
The SRA flight tests demonstrated a prototype real-time FADS system. The test envelope included Machnumbers as high as 1.6 and angles of attack greater than45°. The airdata were sensed by 11 orifices located on acomposite nosecap molded into the structure of theaircraft radome and faired smooth to the surface.Figure 6 shows the locations of the pressure ports on thenosecap.
The SRA FADS pressures were sensed by 11miniaturized, digital, absolute-pressure transducers.
Each absolute-pressure transducer incorporates a four-active-arm strain-gage bridge for data sensing; internalsignal conditioning with a 20-Hz antialiasing low-passfilter and output signal amplification; and a 20-bitanalog-to-digital conversion. The transducers have arepeatability that exceeds 0.01 percent of full scale anda measurement range from 1.50 to 40.00 lbf/in2
atmosphere. Data collection and algorithmcomputations are performed onboard in real time by twocommercially available single-board computers insertedin a ruggedized flight chassis. The raw pressuremeasurements and onboard airdata computations weretelemetered to a ground station where they wererecorded for postflight analyses.
The SRA FADS system was calibrated by comparingthe onboard calculations with flight-derived referenceairdata values and adjusting the calibration coefficientsusing the previously described calibration procedures.The flight reference data were generated by mergingcomplementary information from multiple data sources,including the onboard inertial navigation systemattitudes, rates, and accelerations; radar-trackingvelocity and position data; and rawinsonde weatherballoon data.
12
8
5
963 10
7
114
F-18/SRA
123
4567
8 9 10 11
F-14
Port1234567891011
λ, deg040405555555560606060
φ, deg00
18009018027045135225315
Port1234567891011
λ, deg604020020406060303060
φ, deg18018018000009090270270
990231
Figure 6. F/A-18 SRA and F-14 port arrangements.
12American Institute of Aeronautics and Astronautics
F-14 Flush Airdata Sensing Flight Tests
The F-14 FADS flight tests were performed at NASADryden on an aircraft with special equipmentmodifications that were part of a program demonstrationfor new flight control techniques.27 The equipmentmodifications included a pair of deployable, canard-likesurfaces on the fuselage forebody for spin recovery anda gun fairing in the left side of the fuselage forebody.Although the canards were closed for the FADS tests,they may have some effect on the upstream flow. Thegeometric asymmetry caused by the gun fairing mayhave also influenced some of the FADS pressuremeasurements.
For the F-14 tests, 11 flush orifices (0.031 in.diameter) were installed on a spherically bluntednosecap in a cruciform pattern. The nosecap blendedwith the nose of the aircraft. Orifices along the verticalaxis were placed at angular increments of 20°; thosealong the horizontal axis were placed at increments of30°. Additional flush-mounted orifices were installed onthe nose section aft of the nosecap. These 0.125 in.–diameter orifices were located in 2 rows around thefuselage: a row of 4 orifices evenly spaced 24.0 in. aft ofthe nose apex and another row of 12 orifices 50.0 in. aftof the nose apex. The nose-section orifices wereinstalled to furnish a suitable static-pressure source to beused in conjunction with the orifices on the nosecap.Figure 6 shows the locations of the FADS ports. Detailsof the F-14 instrumentation system are reported inreference 8.
For the F-14 FADS tests, data were obtained for Machnumbers between 0.60 and 1.60, for angles of attack to amaximum of 26.0°, and for angles of sideslip to amaximum of 11.0°. The flight Reynolds numbers variedbetween and . High flowangles at high transonic speeds were limited.
Results
The suitability of various vehicle shapes for aFADS system is discussed in this section. First,analytical solutions for the incompressiblepressure field over a sphere and varying fineness-ratioellipsoids are used to validate the suitability of the FPMand calculate the appropriate FADS calibrationparameters at incompressible flowconditions. Varying the ellipsoid fineness ratio revealsthe behavior of the FPM calibration for varyingforebody shape; varying the free-stream angle of attackreveals the behavior of the calibration to changes in thevehicle orientation to the free stream.
Second, using wind-tunnel and flight data, thevariation in the calibrations is extended to a wide varietyof blunt-forebody shapes. The effect of shape andcompressibility is assessed at Mach numbers to amaximum of 5.0.
Last, the sensitivity of the FADS calibration to theport locations is addressed. The modeling suitability ofthe FPM is illustrated by plotting the impact pressurecoefficient, , as a function of the incidence angle.The is found by rearranging the FPM (eq. (10)):
. (26)
Ellipsoid Analytical Data
The ellipsoid pressure calculations provide acomprehensive data package to test the validity of theFPM. Although the data represent only incompressibleflow conditions, variations in the FADS calibrationcaused by forebody shape and angle of attack wereinvestigated.
Validation of the Flush Airdata SensingPressure Model
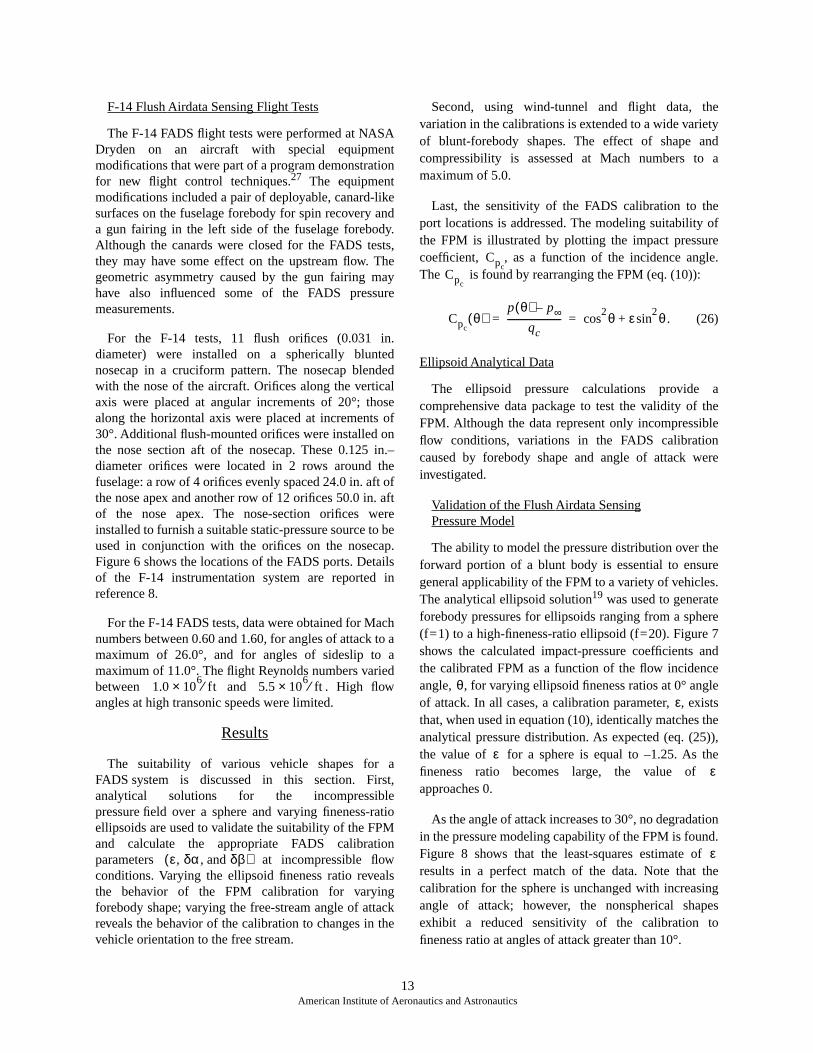
The ability to model the pressure distribution over theforward portion of a blunt body is essential to ensuregeneral applicability of the FPM to a variety of vehicles.The analytical ellipsoid solution19 was used to generateforebody pressures for ellipsoids ranging from a sphere(f=1) to a high-fineness-ratio ellipsoid (f=20). Figure 7shows the calculated impact-pressure coefficients andthe calibrated FPM as a function of the flow incidenceangle, , for varying ellipsoid fineness ratios at 0° angleof attack. In all cases, a calibration parameter, , existsthat, when used in equation (10), identically matches theanalytical pressure distribution. As expected (eq. (25)),the value of for a sphere is equal to –1.25. As thefineness ratio becomes large, the value of approaches 0.
As the angle of attack increases to 30°, no degradationin the pressure modeling capability of the FPM is found.Figure 8 shows that the least-squares estimate of results in a perfect match of the data. Note that thecalibration for the sphere is unchanged with increasingangle of attack; however, the nonspherical shapesexhibit a reduced sensitivity of the calibration tofineness ratio at angles of attack greater than 10°.
1.0 106× ft⁄ 5.5 10
6× ft⁄
ε δα and δβ,,( )
CpcCpc
Cpcθ( )
p θ( ) p∞–
qc------------------------ θ2
cos ε θ2sin+= =
θε
εε
ε
13American Institute of Aeronautics and Astronautics
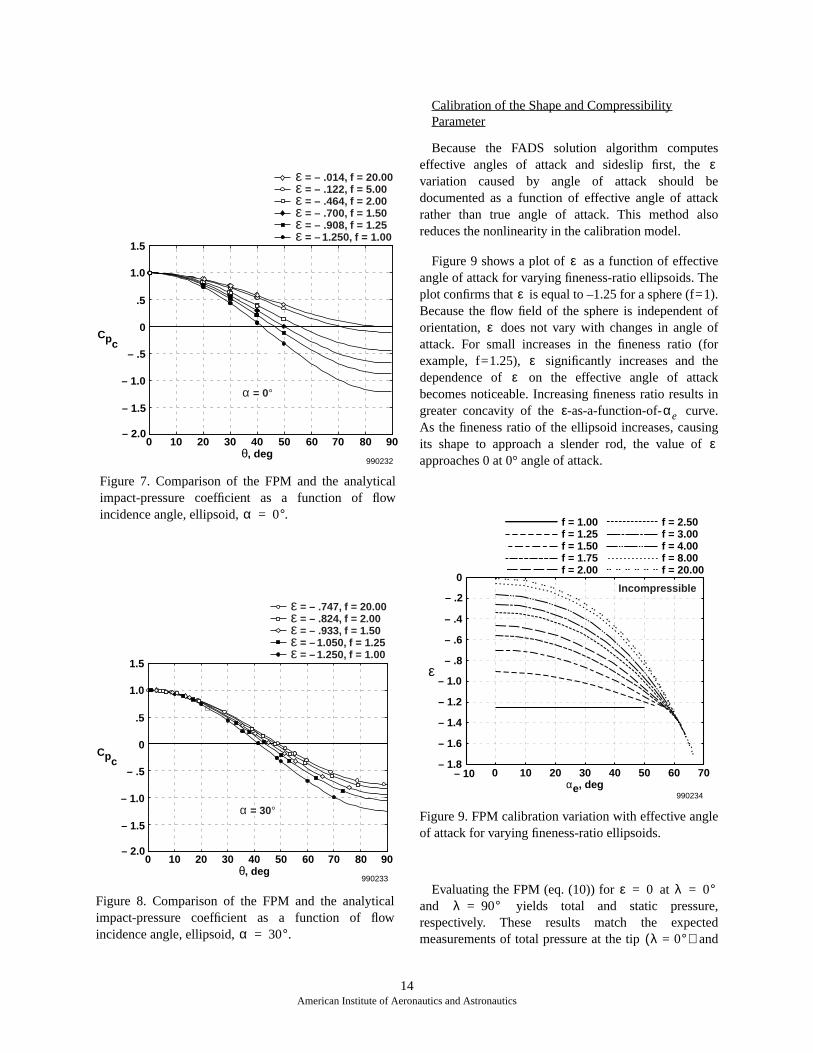
Figure 8. Comparison of the FPM and the analyticalimpact-pressure coefficient as a function of flowincidence angle, ellipsoid, .
Calibration of the Shape and CompressibilityParameter
Because the FADS solution algorithm computeseffective angles of attack and sideslip first, the variation caused by angle of attack should bedocumented as a function of effective angle of attackrather than true angle of attack. This method alsoreduces the nonlinearity in the calibration model.
Figure 9 shows a plot of as a function of effectiveangle of attack for varying fineness-ratio ellipsoids. Theplot confirms that is equal to –1.25 for a sphere (f=1).Because the flow field of the sphere is independent oforientation, does not vary with changes in angle ofattack. For small increases in the fineness ratio (forexample, f=1.25), significantly increases and thedependence of on the effective angle of attackbecomes noticeable. Increasing fineness ratio results ingreater concavity of the -as-a-function-of- curve.As the fineness ratio of the ellipsoid increases, causingits shape to approach a slender rod, the value of approaches 0 at 0° angle of attack.
Figure 9. FPM calibration variation with effective angleof attack for varying fineness-ratio ellipsoids.
Evaluating the FPM (eq. (10)) for at and yields total and static pressure,respectively. These results match the expectedmeasurements of total pressure at the tip and
0 10 20 30 40θ, deg
50 60 70 80 90– 2.0
– 1.5
– 1.0
– .5
0
.5
1.5
1.0
Cpc
990232
ε = – .014, f = 20.00ε = – .122, f = 5.00ε = – .464, f = 2.00ε = – .700, f = 1.50ε = – .908, f = 1.25ε = – 1.250, f = 1.00
α = 0°
Figure 7. Comparison of the FPM and the analyticalimpact-pressure coefficient as a function of flowincidence angle, ellipsoid, .α 0°=
0 10 20 30 40θ, deg
50 60 70 80 90– 2.0
– 1.5
– 1.0
– .5
0
.5
1.5
1.0
990233
Cpc
ε = – .747, f = 20.00ε = – .824, f = 2.00ε = – .933, f = 1.50ε = – 1.050, f = 1.25ε = – 1.250, f = 1.00
α = 30°
α 30°=
ε
ε
ε
ε
εε
ε αe
ε
– 10 0 10 20 30 40 50 60
990234
70– 1.8
– 1.6
– 1.4
– 1.2
– 1.0
– .8
– .6
– .4
– .2
0
αe, deg
ε
Incompressible
f = 2.50f = 3.00f = 4.00f = 8.00f = 20.00
f = 1.00f = 1.25f = 1.50f = 1.75f = 2.00
ε 0= λ 0°=λ 90°=
λ 0°=( )
14American Institute of Aeronautics and Astronautics

static pressure along the side of a thin rod insubsonic flow. The shape of the curve canbe approximated by a polynomial equation, allowingsimple calibration storage in a real-time airdata system.
Calibration of the Upwash Correction
Equation (4) requires an upwash correction, , tocompute true angle of attack from effective angle ofattack. Figure 10 shows a plot of the upwash correctionfor varying fineness-ratio ellipsoids in incompressibleflow. As expected for a sphere, the upwash correction is0. The upwash correction is also 0 for all axisymmetricellipsoids at 0° angle of attack.
As the angle of attack increases, the upwashcorrection becomes larger, peaking between 45° and 53°effective angle of attack (depending on fineness ratio).The upwash correction decreases beyond the peak angleof attack. As fineness ratio increases, the upwashincreases as well, reaching an apparent upper limit foran ellipsoid with a fineness ratio greater than 15. As wasthe case with , the upwash parameter can beapproximated with a polynomial in effective angle ofattack for a given Mach number.
The sensitivity of the upwash correction to variationsin angle of sideslip was investigated for ellipsoids with
varying fineness ratios. Figure 11 shows the angle-of-attack error introduced, using the calibration generatedfor 0° angle of sideslip, at a nonzero angle of sideslip at30° angle of attack. In all cases, the angle-of-attack erroris negligible. The error can be larger fornonaxisymmetric bodies, as is shown in the nextsection.
Figure 11. Angle-of-attack error introduced byneglecting the sideslip effect on the calibration.
Calibration of the Sidewash Correction
Because the ellipsoid is axisymmetric, the sidewashcorrection at 0° angle of attack is identical to the upwashcorrection at 0° angle of sideslip. The upwash correctionwas previously shown to be independent of sideslip formoderate sideslip angles. The sidewash correction,however, can be a significant function of angle of attack.
Figure 12 shows the error obtained using the ellipsoid0° angle-of-attack sidewash calibration at 30° angle ofattack. As the ellipsoid deviates from a sphere, thesideslip error increases, reaching 25 percent for afineness ratio of 3.0 at 5° angle of sideslip. As a result,most wind-tunnel calibration efforts will require bothangle-of-attack and -sideslip sweeps to gather sufficientdata.
λ 90°=( )ε ε αe( )=
δα
-10 0 10 20 30 40 50 60 70– 2
0
2
4
6
8
10
12
14
16
18
αe, deg
δα,deg
990235
Incompressible
20
f = 2.50f = 3.00f = 4.00f = 8.00f = 20.00
f = 1.00f = 1.25f = 1.50f = 1.75f = 2.00
Figure 10. Variation of upwash correction with effectiveangle of attack for varying fineness-ratio ellipsoids.
ε
f = 1.00f = 1.25f = 1.50f = 2.00f = 3.00f = 5.00f = 10.00f = 20.00
0 5 10 15
– .08
– .10
– .06
– .04
– .02
.02
.04
.06
.08
.10
0
β, deg
α error,deg
α = 30°
990236
ε
15American Institute of Aeronautics and Astronautics
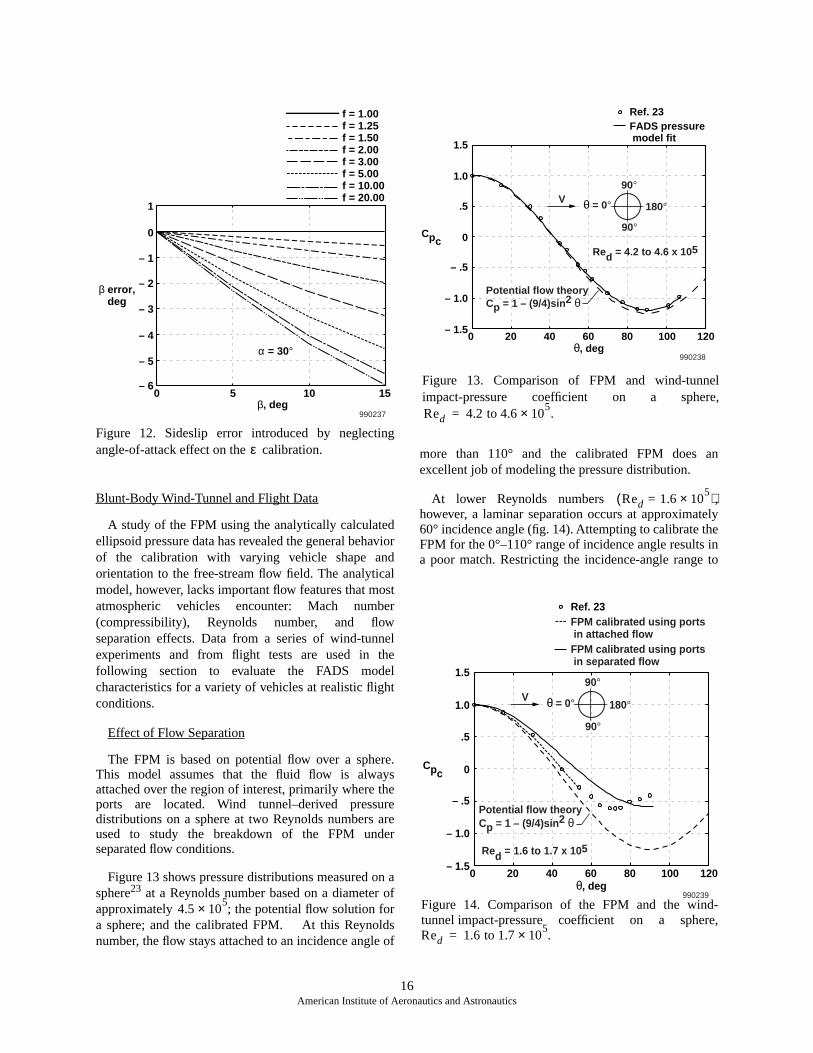
Figure 12. Sideslip error introduced by neglectingangle-of-attack effect on the calibration.
Blunt-Body Wind-Tunnel and Flight Data
A study of the FPM using the analytically calculatedellipsoid pressure data has revealed the general behaviorof the calibration with varying vehicle shape andorientation to the free-stream flow field. The analyticalmodel, however, lacks important flow features that mostatmospheric vehicles encounter: Mach number(compressibility), Reynolds number, and flowseparation effects. Data from a series of wind-tunnelexperiments and from flight tests are used in thefollowing section to evaluate the FADS modelcharacteristics for a variety of vehicles at realistic flightconditions.
Effect of Flow Separation
The FPM is based on potential flow over a sphere.This model assumes that the fluid flow is alwaysattached over the region of interest, primarily where theports are located. Wind tunnel–derived pressuredistributions on a sphere at two Reynolds numbers areused to study the breakdown of the FPM underseparated flow conditions.
Figure 13 shows pressure distributions measured on asphere23 at a Reynolds number based on a diameter ofapproximately ; the potential flow solution fora sphere; and the calibrated FPM. At this Reynoldsnumber, the flow stays attached to an incidence angle of
more than 110° and the calibrated FPM does anexcellent job of modeling the pressure distribution.
At lower Reynolds numbers ,however, a laminar separation occurs at approximately60° incidence angle (fig. 14). Attempting to calibrate theFPM for the 0°–110° range of incidence angle results ina poor match. Restricting the incidence-angle range to
f = 1.00f = 1.25f = 1.50f = 2.00f = 3.00f = 5.00f = 10.00f = 20.00
0 5 10 15– 6
– 5
– 4
– 3
– 1
0
1
– 2
β, deg
β error,deg
α = 30°
990237
ε
4.5 105×
Ref. 23FADS pressure model fit
0 20 40 60 80 100 120
1.5
1.0
.5
0
– .5
– 1.0
– 1.5
θ, deg
Cpc
Potential flow theoryCp = 1 – (9/4)sin2 θ
Red = 4.2 to 4.6 x 10⁵
V θ = 0°
90°
90°
180°
990238
Figure 13. Comparison of FPM and wind-tunnelimpact-pressure coefficient on a sphere,
.Red 4.2 to 4.6 105×=
Red 1.6 105×=( )
Ref. 23FPM calibrated using ports in attached flowFPM calibrated using ports in separated flow
0 20 40 60 80 100 120
1.5
1.0
.5
0
– .5
– 1.0
– 1.5
θ, deg
Cpc
Potential flow theoryCp = 1 – (9/4)sin2 θ
Red = 1.6 to 1.7 x 10⁵
V θ = 0°
90°
90°
180°
990239Figure 14. Comparison of the FPM and the wind-tunnel impact-pressure coefficient on a sphere,
.Red 1.6 to 1.7 105×=
16American Institute of Aeronautics and Astronautics
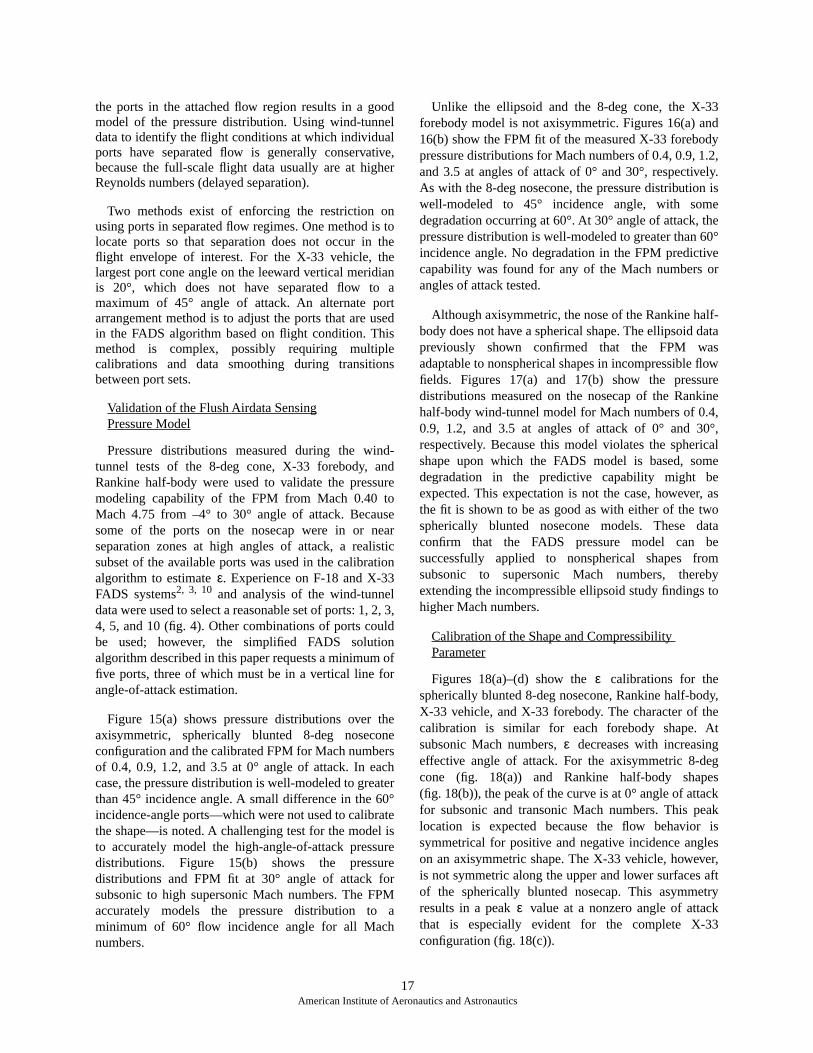
the ports in the attached flow region results in a goodmodel of the pressure distribution. Using wind-tunneldata to identify the flight conditions at which individualports have separated flow is generally conservative,because the full-scale flight data usually are at higherReynolds numbers (delayed separation).
Two methods exist of enforcing the restriction onusing ports in separated flow regimes. One method is tolocate ports so that separation does not occur in theflight envelope of interest. For the X-33 vehicle, thelargest port cone angle on the leeward vertical meridianis 20°, which does not have separated flow to amaximum of 45° angle of attack. An alternate portarrangement method is to adjust the ports that are usedin the FADS algorithm based on flight condition. Thismethod is complex, possibly requiring multiplecalibrations and data smoothing during transitionsbetween port sets.
Validation of the Flush Airdata SensingPressure Model
Pressure distributions measured during the wind-tunnel tests of the 8-deg cone, X-33 forebody, andRankine half-body were used to validate the pressuremodeling capability of the FPM from Mach 0.40 toMach 4.75 from –4° to 30° angle of attack. Becausesome of the ports on the nosecap were in or nearseparation zones at high angles of attack, a realisticsubset of the available ports was used in the calibrationalgorithm to estimate . Experience on F-18 and X-33FADS systems2, 3, 10 and analysis of the wind-tunneldata were used to select a reasonable set of ports: 1, 2, 3,4, 5, and 10 (fig. 4). Other combinations of ports couldbe used; however, the simplified FADS solutionalgorithm described in this paper requests a minimum offive ports, three of which must be in a vertical line forangle-of-attack estimation.
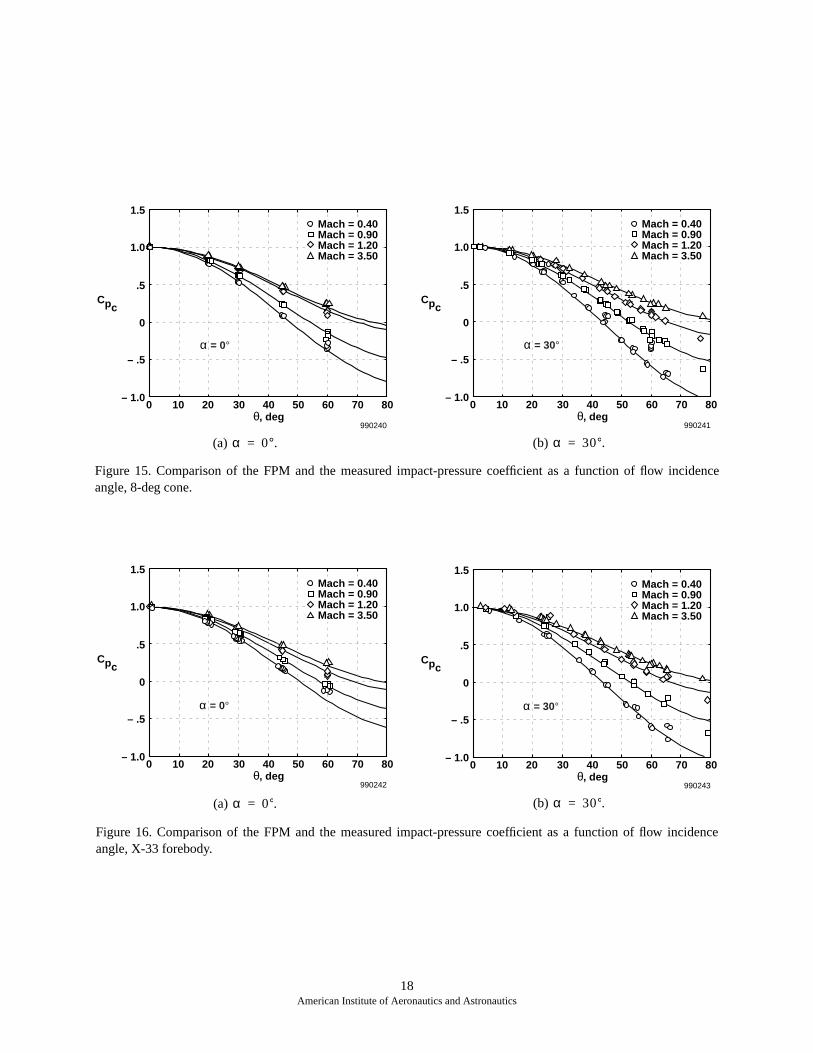
Figure 15(a) shows pressure distributions over theaxisymmetric, spherically blunted 8-deg noseconeconfiguration and the calibrated FPM for Mach numbersof 0.4, 0.9, 1.2, and 3.5 at 0° angle of attack. In eachcase, the pressure distribution is well-modeled to greaterthan 45° incidence angle. A small difference in the 60°incidence-angle ports—which were not used to calibratethe shape—is noted. A challenging test for the model isto accurately model the high-angle-of-attack pressuredistributions. Figure 15(b) shows the pressuredistributions and FPM fit at 30° angle of attack forsubsonic to high supersonic Mach numbers. The FPMaccurately models the pressure distribution to aminimum of 60° flow incidence angle for all Machnumbers.
Unlike the ellipsoid and the 8-deg cone, the X-33forebody model is not axisymmetric. Figures 16(a) and16(b) show the FPM fit of the measured X-33 forebodypressure distributions for Mach numbers of 0.4, 0.9, 1.2,and 3.5 at angles of attack of 0° and 30°, respectively.As with the 8-deg nosecone, the pressure distribution iswell-modeled to 45° incidence angle, with somedegradation occurring at 60°. At 30° angle of attack, thepressure distribution is well-modeled to greater than 60°incidence angle. No degradation in the FPM predictivecapability was found for any of the Mach numbers orangles of attack tested.
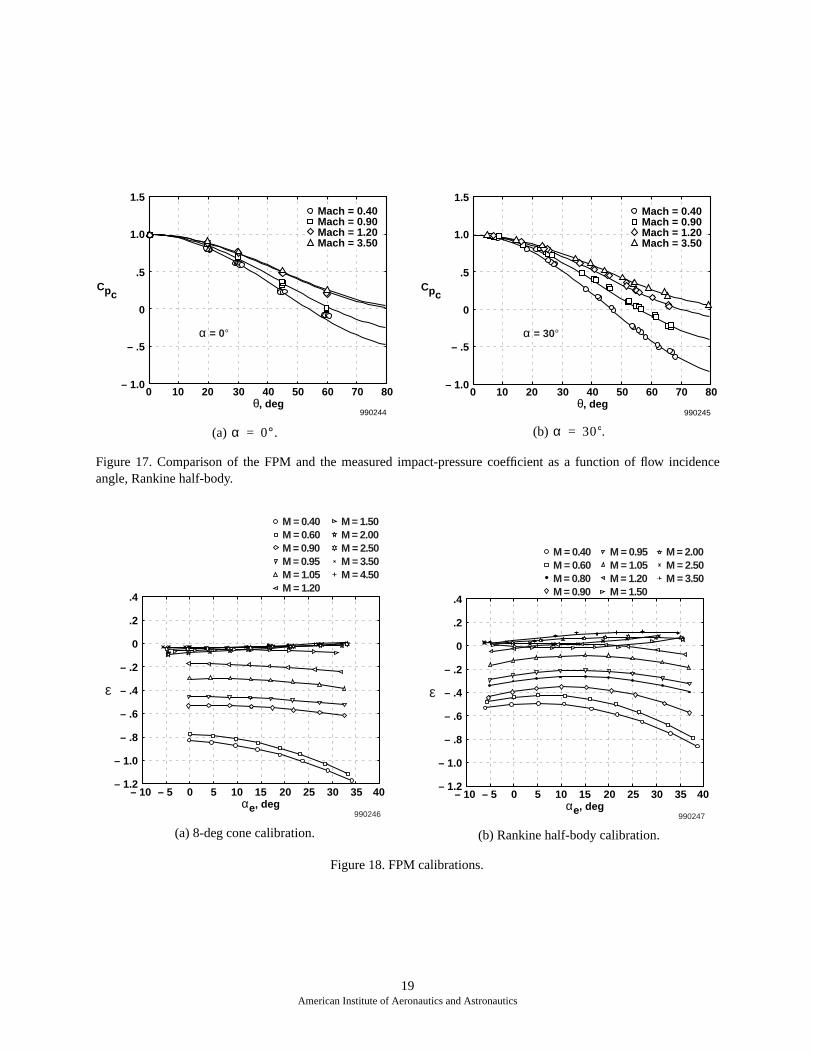
Although axisymmetric, the nose of the Rankine half-body does not have a spherical shape. The ellipsoid datapreviously shown confirmed that the FPM wasadaptable to nonspherical shapes in incompressible flowfields. Figures 17(a) and 17(b) show the pressuredistributions measured on the nosecap of the Rankinehalf-body wind-tunnel model for Mach numbers of 0.4,0.9, 1.2, and 3.5 at angles of attack of 0° and 30°,respectively. Because this model violates the sphericalshape upon which the FADS model is based, somedegradation in the predictive capability might beexpected. This expectation is not the case, however, asthe fit is shown to be as good as with either of the twospherically blunted nosecone models. These dataconfirm that the FADS pressure model can besuccessfully applied to nonspherical shapes fromsubsonic to supersonic Mach numbers, therebyextending the incompressible ellipsoid study findings tohigher Mach numbers.
Calibration of the Shape and Compressibility Parameter
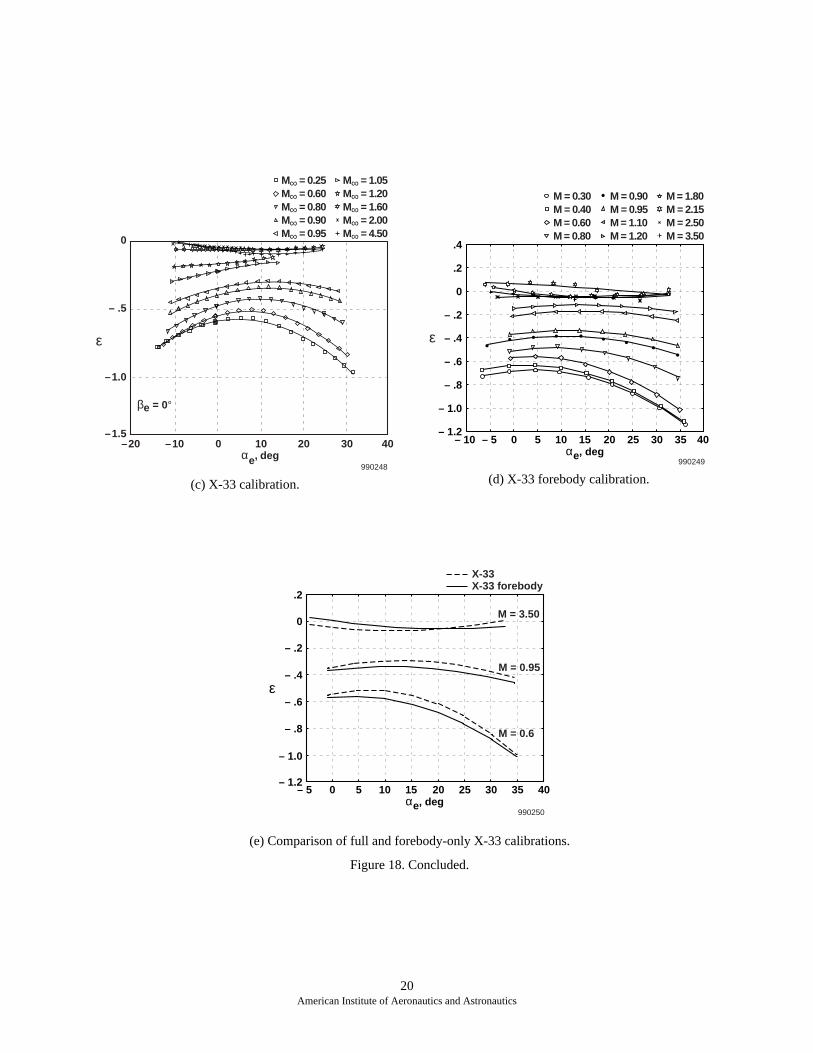
Figures 18(a)–(d) show the calibrations for thespherically blunted 8-deg nosecone, Rankine half-body,X-33 vehicle, and X-33 forebody. The character of thecalibration is similar for each forebody shape. Atsubsonic Mach numbers, decreases with increasingeffective angle of attack. For the axisymmetric 8-degcone (fig. 18(a)) and Rankine half-body shapes(fig. 18(b)), the peak of the curve is at 0° angle of attackfor subsonic and transonic Mach numbers. This peaklocation is expected because the flow behavior issymmetrical for positive and negative incidence angleson an axisymmetric shape. The X-33 vehicle, however,is not symmetric along the upper and lower surfaces aftof the spherically blunted nosecap. This asymmetryresults in a peak value at a nonzero angle of attackthat is especially evident for the complete X-33configuration (fig. 18(c)).
ε
ε
ε
ε
17American Institute of Aeronautics and Astronautics
(a) .
(a) .
(b) .
(b) .
0 10 20 30 40θ, deg
50 60 70 80– 1.0
– .5
0
.5
1.0
1.5
990240
Cpc
α = 0°
Mach = 0.40Mach = 0.90Mach = 1.20Mach = 3.50
α 0°=
0 10 20 30 40θ, deg
50 60 70 80– 1.0
– .5
0
.5
1.0
1.5
990242
Cpc
α = 0°
Mach = 0.40Mach = 0.90Mach = 1.20Mach = 3.50
α 0°=
0 10 20 30 40θ, deg
50 60 70 80– 1.0
– .5
0
.5
1.0
1.5
990241
Cpc
α = 30°
Mach = 0.40Mach = 0.90Mach = 1.20Mach = 3.50
α 30°=
0 10 20 30 40θ, deg
50 60 70 80– 1.0
– .5
0
.5
1.0
1.5
990243
Cpc
α = 30°
Mach = 0.40Mach = 0.90Mach = 1.20Mach = 3.50
α 30°=
Figure 16. Comparison of the FPM and the measured impact-pressure coefficient as a function of flow incidenceangle, X-33 forebody.
Figure 15. Comparison of the FPM and the measured impact-pressure coefficient as a function of flow incidenceangle, 8-deg cone.
18American Institute of Aeronautics and Astronautics
(a) .
(a) 8-deg cone calibration.
(b) .
(b) Rankine half-body calibration.
0 10 20 30 40θ, deg
50 60 70 80– 1.0
– .5
0
.5
1.0
1.5
990244
Cpc
α = 0°
Mach = 0.40Mach = 0.90Mach = 1.20Mach = 3.50
α 0°=
– .2
0
.2
.4
– 1.0
– 1.2
– .8
– .6
– .4ε
– 10 – 5 0 5 10 15αe, deg
20 25 30 35 40
990246
M = 1.50M = 2.00M = 2.50M = 3.50M = 4.50
M = 0.40M = 0.60M = 0.90M = 0.95M = 1.05M = 1.20
0 10 20 30 40θ, deg
50 60 70 80– 1.0
– .5
0
.5
1.0
1.5
990245
Cpc
α = 30°
Mach = 0.40Mach = 0.90Mach = 1.20Mach = 3.50
α 30°=
– .2
0
.2
.4
– 1.0
– 1.2
– .8
– .6
– .4ε
– 10 – 5 0 5 10 15αe, deg
20 25 30 35 40
990247
M = 2.00M = 2.50M = 3.50
M = 0.95M = 1.05M = 1.20M = 1.50
M = 0.40M = 0.60M = 0.80M = 0.90
Figure 17. Comparison of the FPM and the measured impact-pressure coefficient as a function of flow incidenceangle, Rankine half-body.
Figure 18. FPM calibrations.
19American Institute of Aeronautics and Astronautics
(c) X-33 calibration. (d) X-33 forebody calibration.
ε
αe, deg990248
–20 –10
M∞ = 1.05M∞ = 1.20M∞ = 1.60M∞ = 2.00M∞ = 4.50
0 10 20 30 40–1.5
–1.0
– .5
0
βe = 0°
M∞ = 0.25M∞ = 0.60M∞ = 0.80M∞ = 0.90M∞ = 0.95
– .2
0
.2
.4
– 1.0
– 1.2
– .8
– .6
– .4ε
– 10 – 5 0 5 10 15αe, deg
20 25 30 35 40
990249
M = 1.80M = 2.15M = 2.50M = 3.50
M = 0.90M = 0.95M = 1.10M = 1.20
M = 0.30M = 0.40M = 0.60M = 0.80
20American Institute of Aeronautics and Astronautics
(e) Comparison of full and forebody-only X-33 calibrations.
Figure 18. Concluded.
– 5 0 5 10 15 αe, deg
20 25 30 35 40– 1.2
– 1.0
– .8
– .6
– .4
– .2
0
.2
ε
990250
M = 3.50
M = 0.95
M = 0.6
X-33X-33 forebody
For Mach numbers less than 1.0, the angle of attack ofthe peak increases with increasing Mach number. Acomparison of figures 18(c) and 18(d) revealsdifferences between the X-33 and X-33-forebodycalibrations at subsonic and transonic Mach numbers.Figure 18(e) shows a comparison of the complete andforebody-only X-33 configurations at Mach 0.60, 0.95,and 3.50. The calibration differences indicate thatcalibration of a blunt-body FADS system requires acomplete configuration be tested to ensure that adequatedata are obtained.
Although the different forebody shapes have differentvalues of at low Mach numbers, all calibrationsconverge to a value near 0 at supersonic Mach numbers.As stated earlier, the FPM reduces to Newtonian impacttheory as approaches 0. The calibrations show thatNewtonian impact theory is an accurate predictor of thesurface pressures for these blunt bodies beginning atapproximately Mach 2.0. The second-order nature of the
calibration with angle of attack reduces such that athigh supersonic Mach numbers, is nearly independentof angle of attack.
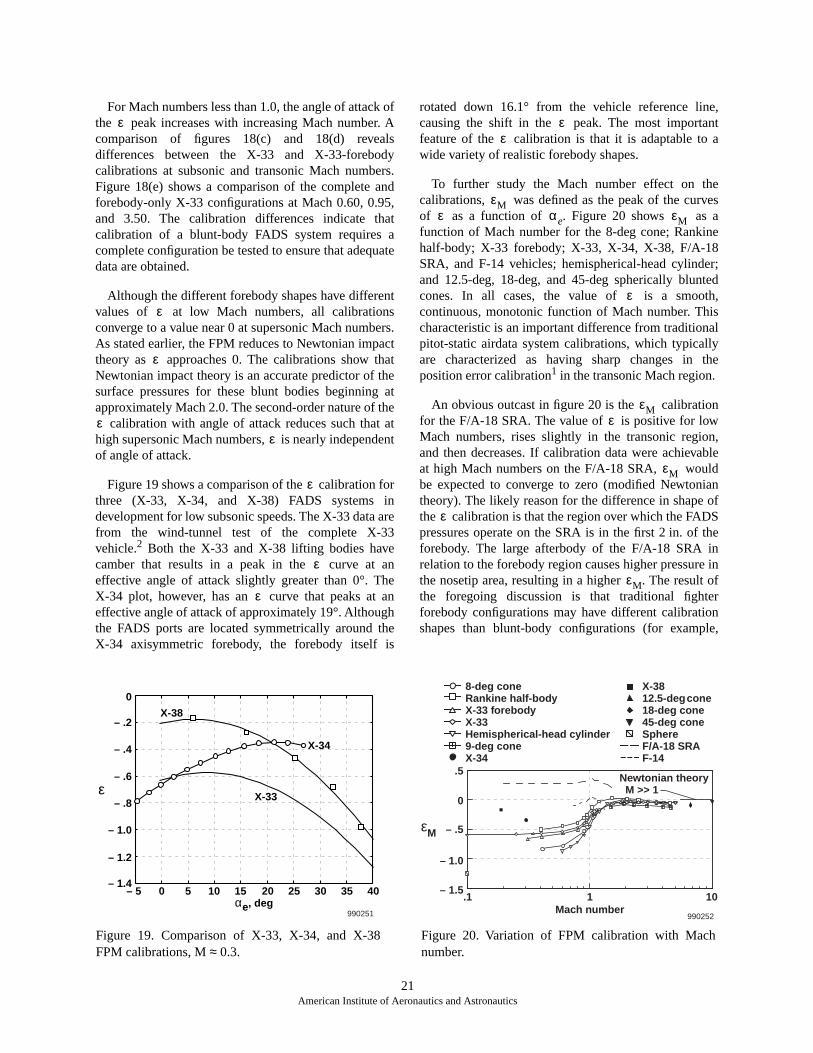
Figure 19 shows a comparison of the calibration forthree (X-33, X-34, and X-38) FADS systems indevelopment for low subsonic speeds. The X-33 data arefrom the wind-tunnel test of the complete X-33vehicle.2 Both the X-33 and X-38 lifting bodies havecamber that results in a peak in the curve at aneffective angle of attack slightly greater than 0°. TheX-34 plot, however, has an curve that peaks at aneffective angle of attack of approximately 19°. Althoughthe FADS ports are located symmetrically around theX-34 axisymmetric forebody, the forebody itself is
rotated down 16.1° from the vehicle reference line,causing the shift in the peak. The most importantfeature of the calibration is that it is adaptable to awide variety of realistic forebody shapes.
To further study the Mach number effect on thecalibrations, was defined as the peak of the curvesof as a function of . Figure 20 shows as afunction of Mach number for the 8-deg cone; Rankinehalf-body; X-33 forebody; X-33, X-34, X-38, F/A-18SRA, and F-14 vehicles; hemispherical-head cylinder;and 12.5-deg, 18-deg, and 45-deg spherically bluntedcones. In all cases, the value of is a smooth,continuous, monotonic function of Mach number. Thischaracteristic is an important difference from traditionalpitot-static airdata system calibrations, which typicallyare characterized as having sharp changes in theposition error calibration1 in the transonic Mach region.
An obvious outcast in figure 20 is the calibrationfor the F/A-18 SRA. The value of is positive for lowMach numbers, rises slightly in the transonic region,and then decreases. If calibration data were achievableat high Mach numbers on the F/A-18 SRA, wouldbe expected to converge to zero (modified Newtoniantheory). The likely reason for the difference in shape ofthe calibration is that the region over which the FADSpressures operate on the SRA is in the first 2 in. of theforebody. The large afterbody of the F/A-18 SRA inrelation to the forebody region causes higher pressure inthe nosetip area, resulting in a higher . The result ofthe foregoing discussion is that traditional fighterforebody configurations may have different calibrationshapes than blunt-body configurations (for example,
ε
ε
ε
εε
– 5 0 5 10 15 αe, deg
20 25 30 35 40– 1.4
– 1.2
– 1.0
– .8
– .6
– .4
0
– .2
ε
990251
X-33
X-34
X-38
Figure 19. Comparison of X-33, X-34, and X-38FPM calibrations, M ≈ 0.3.
ε
ε
ε
εε
εMε αe εM
ε
– 1.5
– 1.0
– .5
0
.5
.1 1Mach number
10
8-deg coneRankine half-bodyX-33 forebodyX-33Hemispherical-head cylinder9-deg coneX-34
X-3812.5-deg cone18-deg cone45-deg coneSphereF/A-18 SRAF-14
εM
990252
Newtonian theory M >> 1
Figure 20. Variation of FPM calibration with Machnumber.
εMε
εM
ε
εM
21American Institute of Aeronautics and Astronautics
X-33, X-38, and Space Shuttle configurations);however, the FPM still yields results with equivalentlevels of accuracy.
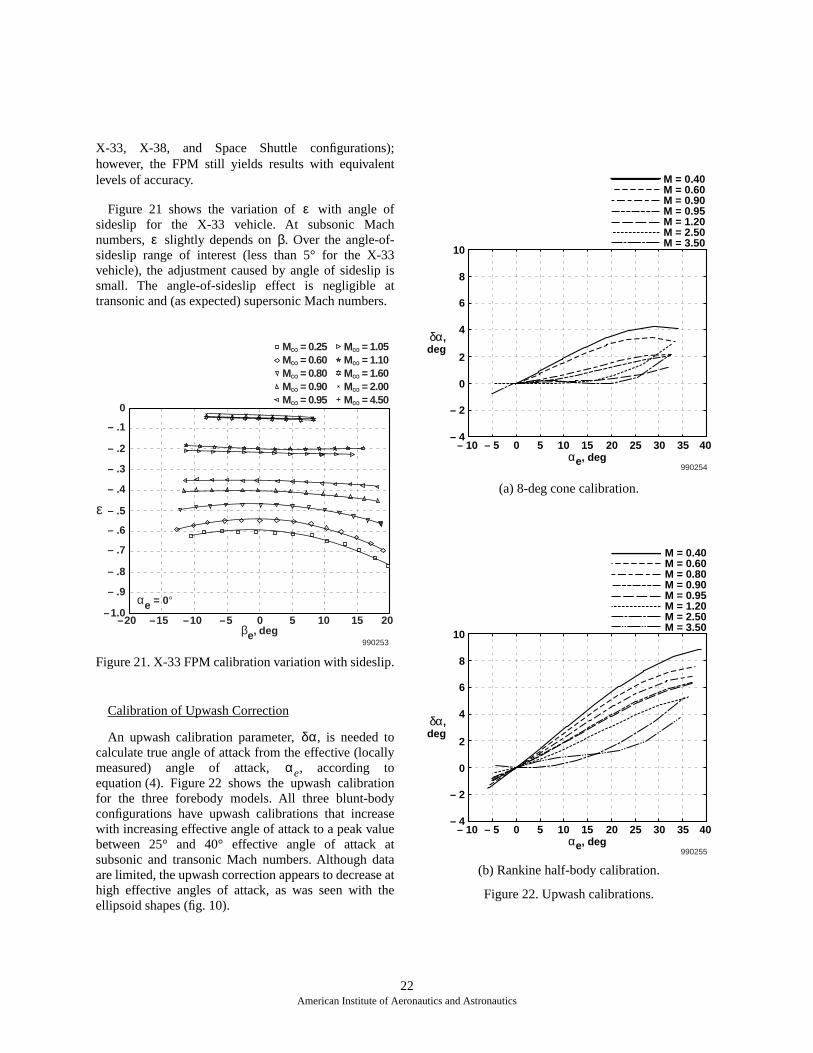
Figure 21 shows the variation of with angle ofsideslip for the X-33 vehicle. At subsonic Machnumbers, slightly depends on . Over the angle-of-sideslip range of interest (less than 5° for the X-33vehicle), the adjustment caused by angle of sideslip issmall. The angle-of-sideslip effect is negligible attransonic and (as expected) supersonic Mach numbers.
Figure 21. X-33 FPM calibration variation with sideslip.
Calibration of Upwash Correction
An upwash calibration parameter, , is needed tocalculate true angle of attack from the effective (locallymeasured) angle of attack, , according toequation (4). Figure 22 shows the upwash calibrationfor the three forebody models. All three blunt-bodyconfigurations have upwash calibrations that increasewith increasing effective angle of attack to a peak valuebetween 25° and 40° effective angle of attack atsubsonic and transonic Mach numbers. Although dataare limited, the upwash correction appears to decrease athigh effective angles of attack, as was seen with theellipsoid shapes (fig. 10).
(a) 8-deg cone calibration.
(b) Rankine half-body calibration.
Figure 22. Upwash calibrations.
ε
ε β
ε
βe, deg990253
–20 –15 –10 –5 0 5 10 15 20–1.0
– .8
– .9
– .7
– .5
– .6
– .4
– .3
– .2
– .1
0
αe = 0°
M∞ = 1.05M∞ = 1.10M∞ = 1.60M∞ = 2.00M∞ = 4.50
M∞ = 0.25M∞ = 0.60M∞ = 0.80M∞ = 0.90M∞ = 0.95
δα
αe
M = 0.40M = 0.60M = 0.90M = 0.95M = 1.20M = 2.50M = 3.50
10
8
6
4
2
0
– 2
– 4– 10 – 5 0 5 10 15
αe, deg20 25 30 35 40
990254
δα,deg
M = 0.40M = 0.60M = 0.80M = 0.90M = 0.95M = 1.20M = 2.50M = 3.50
10
8
6
4
2
0
– 2
– 4– 10 – 5 0 5 10 15
αe, deg20 25 30 35 40
990255
δα,deg
22American Institute of Aeronautics and Astronautics
(c) X-33 forebody calibration.
Figure 22. Concluded.
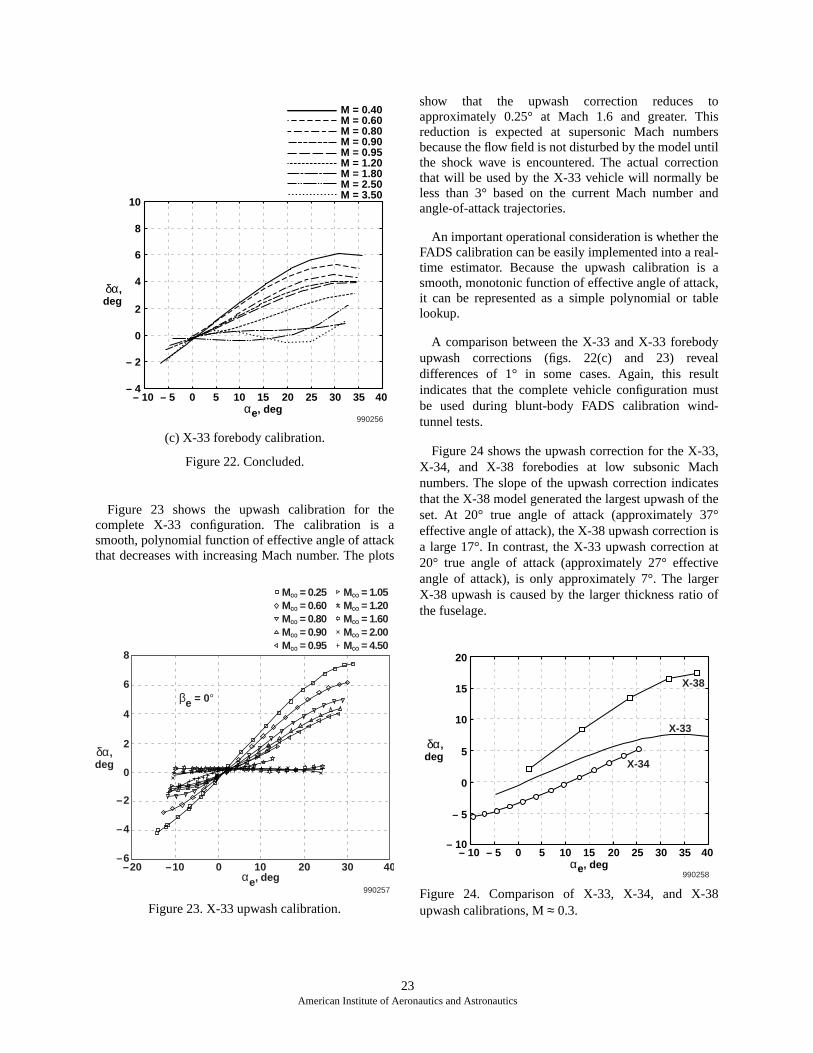
Figure 23 shows the upwash calibration for thecomplete X-33 configuration. The calibration is asmooth, polynomial function of effective angle of attackthat decreases with increasing Mach number. The plots
show that the upwash correction reduces toapproximately 0.25° at Mach 1.6 and greater. Thisreduction is expected at supersonic Mach numbersbecause the flow field is not disturbed by the model untilthe shock wave is encountered. The actual correctionthat will be used by the X-33 vehicle will normally beless than 3° based on the current Mach number andangle-of-attack trajectories.
An important operational consideration is whether theFADS calibration can be easily implemented into a real-time estimator. Because the upwash calibration is asmooth, monotonic function of effective angle of attack,it can be represented as a simple polynomial or tablelookup.
A comparison between the X-33 and X-33 forebodyupwash corrections (figs. 22(c) and 23) revealdifferences of 1° in some cases. Again, this resultindicates that the complete vehicle configuration mustbe used during blunt-body FADS calibration wind-tunnel tests.
Figure 24 shows the upwash correction for the X-33,X-34, and X-38 forebodies at low subsonic Machnumbers. The slope of the upwash correction indicatesthat the X-38 model generated the largest upwash of theset. At 20° true angle of attack (approximately 37°effective angle of attack), the X-38 upwash correction isa large 17°. In contrast, the X-33 upwash correction at20° true angle of attack (approximately 27° effectiveangle of attack), is only approximately 7°. The largerX-38 upwash is caused by the larger thickness ratio ofthe fuselage.
Figure 24. Comparison of X-33, X-34, and X-38upwash calibrations, M ≈ 0.3.
M = 0.40M = 0.60M = 0.80M = 0.90M = 0.95M = 1.20M = 1.80M = 2.50M = 3.50
10
8
6
4
2
0
– 2
– 4– 10 – 5 0 5 10 15
αe, deg20 25 30 35 40
990256
δα,deg
δα,deg
αe, deg990257
–20 –10 0 10 20 30 40–6
–4
–2
0
2
4
6
8
βe = 0°
M∞ = 1.05M∞ = 1.20M∞ = 1.60M∞ = 2.00M∞ = 4.50
M∞ = 0.25M∞ = 0.60M∞ = 0.80M∞ = 0.90M∞ = 0.95
Figure 23. X-33 upwash calibration.
– 10 – 5 0 5 10 15αe, deg
20 25 30 35 40– 10
– 5
0
5
10
15
20
δα,deg
990258
X-33
X-34
X-38
23American Institute of Aeronautics and Astronautics
Calibration of Sidewash Correction
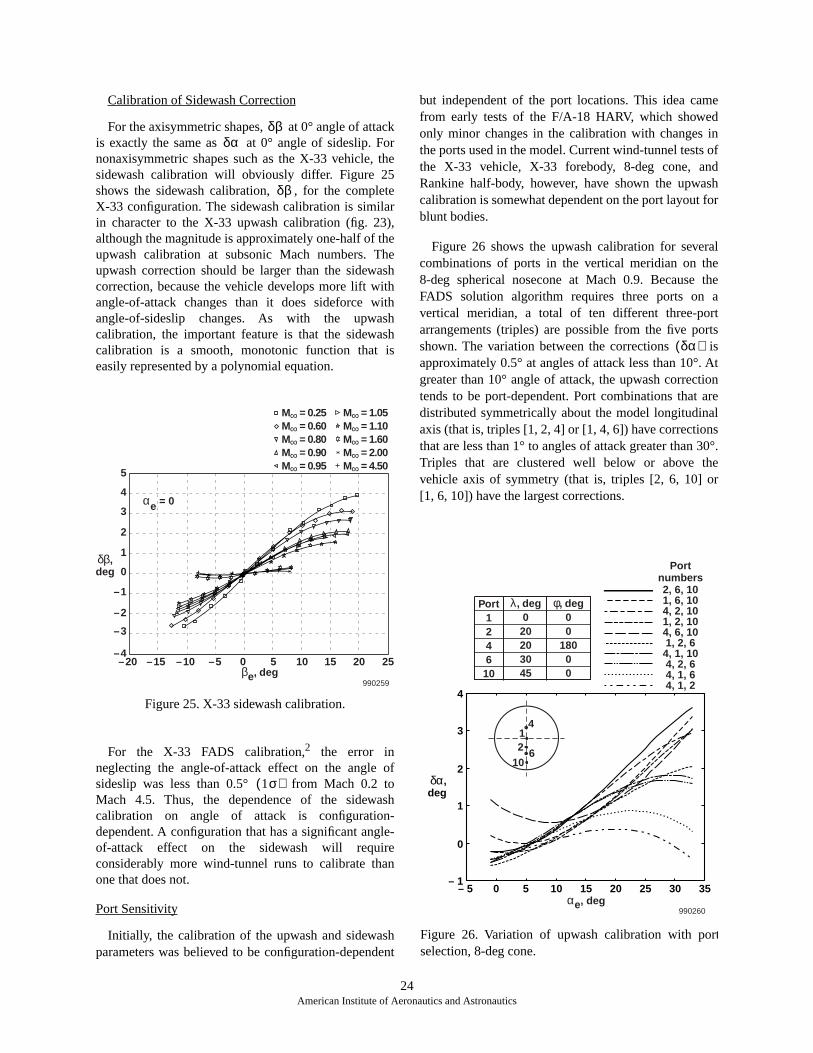
For the axisymmetric shapes, at 0° angle of attackis exactly the same as at 0° angle of sideslip. Fornonaxisymmetric shapes such as the X-33 vehicle, thesidewash calibration will obviously differ. Figure 25shows the sidewash calibration, , for the completeX-33 configuration. The sidewash calibration is similarin character to the X-33 upwash calibration (fig. 23),although the magnitude is approximately one-half of theupwash calibration at subsonic Mach numbers. Theupwash correction should be larger than the sidewashcorrection, because the vehicle develops more lift withangle-of-attack changes than it does sideforce withangle-of-sideslip changes. As with the upwashcalibration, the important feature is that the sidewashcalibration is a smooth, monotonic function that iseasily represented by a polynomial equation.
Figure 25. X-33 sidewash calibration.
For the X-33 FADS calibration,2 the error inneglecting the angle-of-attack effect on the angle ofsideslip was less than 0.5° from Mach 0.2 toMach 4.5. Thus, the dependence of the sidewashcalibration on angle of attack is configuration-dependent. A configuration that has a significant angle-of-attack effect on the sidewash will requireconsiderably more wind-tunnel runs to calibrate thanone that does not.
Port Sensitivity
Initially, the calibration of the upwash and sidewashparameters was believed to be configuration-dependent
but independent of the port locations. This idea camefrom early tests of the F/A-18 HARV, which showedonly minor changes in the calibration with changes inthe ports used in the model. Current wind-tunnel tests ofthe X-33 vehicle, X-33 forebody, 8-deg cone, andRankine half-body, however, have shown the upwashcalibration is somewhat dependent on the port layout forblunt bodies.
Figure 26 shows the upwash calibration for severalcombinations of ports in the vertical meridian on the8-deg spherical nosecone at Mach 0.9. Because theFADS solution algorithm requires three ports on avertical meridian, a total of ten different three-portarrangements (triples) are possible from the five portsshown. The variation between the corrections isapproximately 0.5° at angles of attack less than 10°. Atgreater than 10° angle of attack, the upwash correctiontends to be port-dependent. Port combinations that aredistributed symmetrically about the model longitudinalaxis (that is, triples [1, 2, 4] or [1, 4, 6]) have correctionsthat are less than 1° to angles of attack greater than 30°.Triples that are clustered well below or above thevehicle axis of symmetry (that is, triples [2, 6, 10] or[1, 6, 10]) have the largest corrections.
δβδα
δβ
δβ,deg
βe, deg990259
–20 –15 –10 –5 0 5 10 15 20 25–4
–3
–2
0
–1
1
2
3
4
5
αe = 0
M∞ = 1.05M∞ = 1.10M∞ = 1.60M∞ = 2.00M∞ = 4.50
M∞ = 0.25M∞ = 0.60M∞ = 0.80M∞ = 0.90M∞ = 0.95
1σ( )
δα( )
– 5 0 5 10 15αe, deg
20 25 30 35
4
3
2
1
0
– 1
990260
Portnumbers2, 6, 101, 6, 104, 2, 101, 2, 104, 6, 101, 2, 64, 1, 104, 2, 64, 1, 64, 1, 2
4
2 610
1
Port124610
φ, deg00
18000
λ, deg020203045
δα,deg
Figure 26. Variation of upwash calibration with portselection, 8-deg cone.
24American Institute of Aeronautics and Astronautics
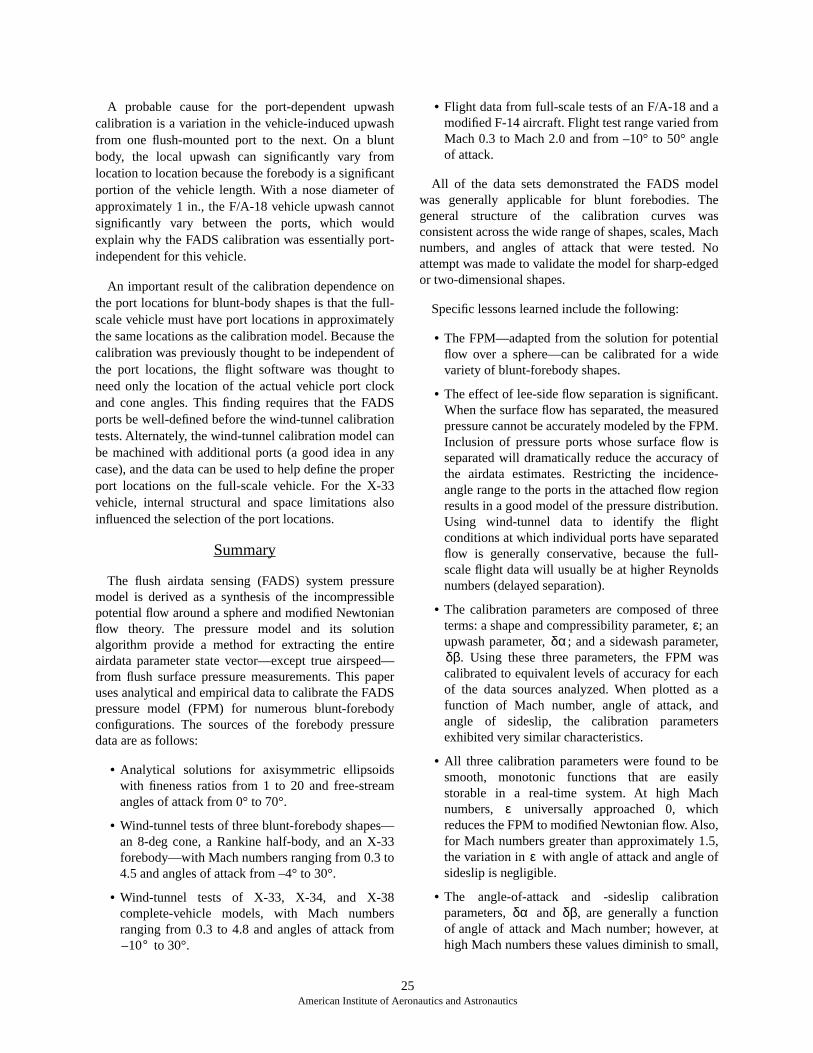
A probable cause for the port-dependent upwashcalibration is a variation in the vehicle-induced upwashfrom one flush-mounted port to the next. On a bluntbody, the local upwash can significantly vary fromlocation to location because the forebody is a significantportion of the vehicle length. With a nose diameter ofapproximately 1 in., the F/A-18 vehicle upwash cannotsignificantly vary between the ports, which wouldexplain why the FADS calibration was essentially port-independent for this vehicle.
An important result of the calibration dependence onthe port locations for blunt-body shapes is that the full-scale vehicle must have port locations in approximatelythe same locations as the calibration model. Because thecalibration was previously thought to be independent ofthe port locations, the flight software was thought toneed only the location of the actual vehicle port clockand cone angles. This finding requires that the FADSports be well-defined before the wind-tunnel calibrationtests. Alternately, the wind-tunnel calibration model canbe machined with additional ports (a good idea in anycase), and the data can be used to help define the properport locations on the full-scale vehicle. For the X-33vehicle, internal structural and space limitations alsoinfluenced the selection of the port locations.
Summary
The flush airdata sensing (FADS) system pressuremodel is derived as a synthesis of the incompressiblepotential flow around a sphere and modified Newtonianflow theory. The pressure model and its solutionalgorithm provide a method for extracting the entireairdata parameter state vector—except true airspeed—from flush surface pressure measurements. This paperuses analytical and empirical data to calibrate the FADSpressure model (FPM) for numerous blunt-forebodyconfigurations. The sources of the forebody pressuredata are as follows:
• Analytical solutions for axisymmetric ellipsoidswith fineness ratios from 1 to 20 and free-streamangles of attack from 0° to 70°.
• Wind-tunnel tests of three blunt-forebody shapes—an 8-deg cone, a Rankine half-body, and an X-33forebody—with Mach numbers ranging from 0.3 to4.5 and angles of attack from –4° to 30°.
• Wind-tunnel tests of X-33, X-34, and X-38complete-vehicle models, with Mach numbersranging from 0.3 to 4.8 and angles of attack from
to 30°.
• Flight data from full-scale tests of an F/A-18 and amodified F-14 aircraft. Flight test range varied fromMach 0.3 to Mach 2.0 and from –10° to 50° angleof attack.
All of the data sets demonstrated the FADS modelwas generally applicable for blunt forebodies. Thegeneral structure of the calibration curves wasconsistent across the wide range of shapes, scales, Machnumbers, and angles of attack that were tested. Noattempt was made to validate the model for sharp-edgedor two-dimensional shapes.
Specific lessons learned include the following:
• The FPM—adapted from the solution for potentialflow over a sphere—can be calibrated for a widevariety of blunt-forebody shapes.
• The effect of lee-side flow separation is significant.When the surface flow has separated, the measuredpressure cannot be accurately modeled by the FPM.Inclusion of pressure ports whose surface flow isseparated will dramatically reduce the accuracy ofthe airdata estimates. Restricting the incidence-angle range to the ports in the attached flow regionresults in a good model of the pressure distribution.Using wind-tunnel data to identify the flightconditions at which individual ports have separatedflow is generally conservative, because the full-scale flight data will usually be at higher Reynoldsnumbers (delayed separation).
• The calibration parameters are composed of threeterms: a shape and compressibility parameter, ; anupwash parameter, ; and a sidewash parameter,
. Using these three parameters, the FPM wascalibrated to equivalent levels of accuracy for eachof the data sources analyzed. When plotted as afunction of Mach number, angle of attack, andangle of sideslip, the calibration parametersexhibited very similar characteristics.
• All three calibration parameters were found to besmooth, monotonic functions that are easilystorable in a real-time system. At high Machnumbers, universally approached 0, whichreduces the FPM to modified Newtonian flow. Also,for Mach numbers greater than approximately 1.5,the variation in with angle of attack and angle ofsideslip is negligible.
• The angle-of-attack and -sideslip calibrationparameters, and , are generally a functionof angle of attack and Mach number; however, athigh Mach numbers these values diminish to small,10°–
εδα
δβ
ε
ε
δα δβ
25American Institute of Aeronautics and Astronautics
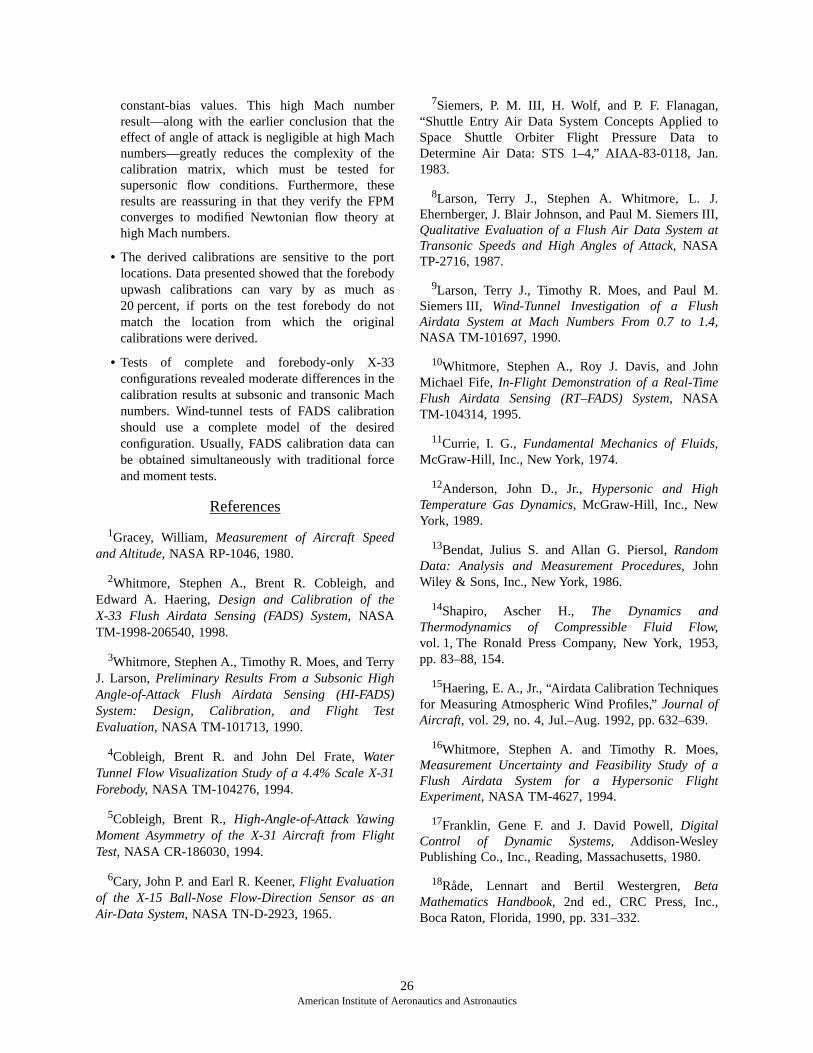
constant-bias values. This high Mach numberresult—along with the earlier conclusion that theeffect of angle of attack is negligible at high Machnumbers—greatly reduces the complexity of thecalibration matrix, which must be tested forsupersonic flow conditions. Furthermore, theseresults are reassuring in that they verify the FPMconverges to modified Newtonian flow theory athigh Mach numbers.
• The derived calibrations are sensitive to the portlocations. Data presented showed that the forebodyupwash calibrations can vary by as much as20 percent, if ports on the test forebody do notmatch the location from which the originalcalibrations were derived.
• Tests of complete and forebody-only X-33configurations revealed moderate differences in thecalibration results at subsonic and transonic Machnumbers. Wind-tunnel tests of FADS calibrationshould use a complete model of the desiredconfiguration. Usually, FADS calibration data canbe obtained simultaneously with traditional forceand moment tests.
References
1Gracey, William, Measurement of Aircraft Speedand Altitude, NASA RP-1046, 1980.
2Whitmore, Stephen A., Brent R. Cobleigh, andEdward A. Haering, Design and Calibration of theX-33 Flush Airdata Sensing (FADS) System, NASATM-1998-206540, 1998.
3Whitmore, Stephen A., Timothy R. Moes, and TerryJ. Larson, Preliminary Results From a Subsonic HighAngle-of-Attack Flush Airdata Sensing (HI-FADS)System: Design, Calibration, and Flight TestEvaluation, NASA TM-101713, 1990.
4Cobleigh, Brent R. and John Del Frate, WaterTunnel Flow Visualization Study of a 4.4% Scale X-31Forebody, NASA TM-104276, 1994.
5Cobleigh, Brent R., High-Angle-of-Attack YawingMoment Asymmetry of the X-31 Aircraft from FlightTest, NASA CR-186030, 1994.
6Cary, John P. and Earl R. Keener, Flight Evaluationof the X-15 Ball-Nose Flow-Direction Sensor as anAir-Data System, NASA TN-D-2923, 1965.
7Siemers, P. M. III, H. Wolf, and P. F. Flanagan,“Shuttle Entry Air Data System Concepts Applied toSpace Shuttle Orbiter Flight Pressure Data toDetermine Air Data: STS 1–4,” AIAA-83-0118, Jan.1983.
8Larson, Terry J., Stephen A. Whitmore, L. J.Ehernberger, J. Blair Johnson, and Paul M. Siemers III,Qualitative Evaluation of a Flush Air Data System atTransonic Speeds and High Angles of Attack, NASATP-2716, 1987.
9Larson, Terry J., Timothy R. Moes, and Paul M.Siemers III, Wind-Tunnel Investigation of a FlushAirdata System at Mach Numbers From 0.7 to 1.4,NASA TM-101697, 1990.
10Whitmore, Stephen A., Roy J. Davis, and JohnMichael Fife, In-Flight Demonstration of a Real-TimeFlush Airdata Sensing (RT–FADS) System, NASATM-104314, 1995.
11Currie, I. G., Fundamental Mechanics of Fluids,McGraw-Hill, Inc., New York, 1974.
12Anderson, John D., Jr., Hypersonic and HighTemperature Gas Dynamics, McGraw-Hill, Inc., NewYork, 1989.
13Bendat, Julius S. and Allan G. Piersol, RandomData: Analysis and Measurement Procedures, JohnWiley & Sons, Inc., New York, 1986.
14Shapiro, Ascher H., The Dynamics andThermodynamics of Compressible Fluid Flow,vol. 1, The Ronald Press Company, New York, 1953,pp. 83–88, 154.
15Haering, E. A., Jr., “Airdata Calibration Techniquesfor Measuring Atmospheric Wind Profiles,” Journal ofAircraft, vol. 29, no. 4, Jul.–Aug. 1992, pp. 632–639.
16Whitmore, Stephen A. and Timothy R. Moes,Measurement Uncertainty and Feasibility Study of aFlush Airdata System for a Hypersonic FlightExperiment, NASA TM-4627, 1994.
17Franklin, Gene F. and J. David Powell, DigitalControl of Dynamic Systems, Addison-WesleyPublishing Co., Inc., Reading, Massachusetts, 1980.
18Råde, Lennart and Bertil Westergren, BetaMathematics Handbook, 2nd ed., CRC Press, Inc.,Boca Raton, Florida, 1990, pp. 331–332.
26American Institute of Aeronautics and Astronautics

19Rohloff, Thomas John, “Development andEvaluation of Neural Network Flush Air Data SensingSystems,” Ph.D. dissertation, University of CaliforniaLos Angeles, 1998.
20Capone, Francis J., et al., The NASA Langley16-Foot Transonic Tunnel: Historical Overview,Facility Description, Calibration, Flow Characteristics,and Test Capabilities, NASA TP-3521, 1995.
21Jackson, Charles M., Jr., William A. Corlett, andWilliam L. Monta, Description and Calibration of theLangley Unitary Plan Wind Tunnel, NASA TP-1905,1981.
22Gentry, Garl L., Jr., P. Frank Quinto, Gregory M.Gatlin, and Zachary T. Applin, The Langley 14- by22-Foot Subsonic Tunnel: Description, FlowCharacteristics, and Guide for Users, NASA TP-3008,1990.
23Hoerner, Sighard F., Fluid-Dynamic Drag:Practical Information on Aerodynamic Drag andHydrodynamic Resistance, self-published, 1965.
24Nowak, Robert J., Cindy W. Albertson, and L.Roane Hunt, Aerothermal Tests of a 12.5° Cone atMach 6.7 for Various Reynolds Numbers, Angles ofAttack, and Nose Shapes, NASA TP-2345, 1985.
25Campbell, I. A., An Experimental and NumericalStudy of Hypersonic Flow Over a Spherically Blunted18° Semi-Angle Cone, Australian Defence ScientificService Aeronautical Research Laboratories,Aerodynamics Note 328, Sept. 1970.
26Passamaneck, R., Aerodynamic Characteristics ofSpherically Blunted 45-Deg Half-Angle Cones, NASATR-32-1327, 1968.
27Gera, J., R. J. Wilson, E., K. Enevoldson, and L. T.Nguyen, “Flight Test Experience with High- ControlSystem Techniques on the F-14 Airplane,” AIAA-81-2505, 1981.
α
27American Institute of Aeronautics and Astronautics
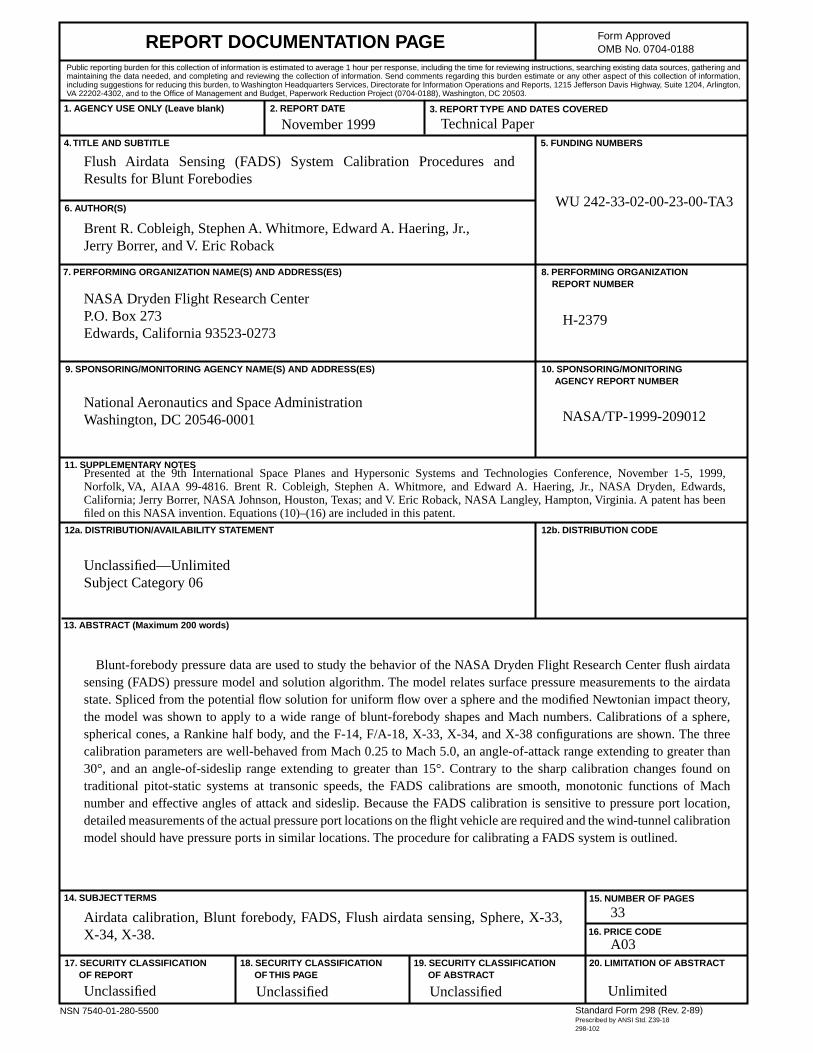
REPORT DOCUMENTATION PAGE Form ApprovedOMB No. 0704-0188
Public reporting burden for this collection of information is estimated to average 1 hour per response, including the time for reviewing instructions, searching existing data sources, gathering andmaintaining the data needed, and completing and reviewing the collection of information. Send comments regarding this burden estimate or any other aspect of this collection of information,including suggestions for reducing this burden, to Washington Headquarters Services, Directorate for Information Operations and Reports, 1215 Jefferson Davis Highway, Suite 1204, Arlington,VA 22202-4302, and to the Office of Management and Budget, Paperwork Reduction Project (0704-0188), Washington, DC 20503.
1. AGENCY USE ONLY (Leave blank) 2. REPORT DATE 3. REPORT TYPE AND DATES COVERED
4. TITLE AND SUBTITLE 5. FUNDING NUMBERS
6. AUTHOR(S)
8. PERFORMING ORGANIZATION REPORT NUMBER
7. PERFORMING ORGANIZATION NAME(S) AND ADDRESS(ES)
9. SPONSORING/MONITORING AGENCY NAME(S) AND ADDRESS(ES) 10. SPONSORING/MONITORING AGENCY REPORT NUMBER
11. SUPPLEMENTARY NOTES
12a. DISTRIBUTION/AVAILABILITY STATEMENT 12b. DISTRIBUTION CODE
13. ABSTRACT (Maximum 200 words)
14. SUBJECT TERMS 15. NUMBER OF PAGES
16. PRICE CODE
17. SECURITY CLASSIFICATION OF REPORT
18. SECURITY CLASSIFICATION OF THIS PAGE
19. SECURITY CLASSIFICATION OF ABSTRACT
20. LIMITATION OF ABSTRACT
NSN 7540-01-280-5500 Standard Form 298 (Rev. 2-89)Prescribed by ANSI Std. Z39-18298-102
Flush Airdata Sensing (FADS) System Calibration Procedures andResults for Blunt Forebodies
WU 242-33-02-00-23-00-TA3
Brent R. Cobleigh, Stephen A. Whitmore, Edward A. Haering, Jr.,Jerry Borrer, and V. Eric Roback
NASA Dryden Flight Research CenterP.O. Box 273Edwards, California 93523-0273
H-2379
National Aeronautics and Space AdministrationWashington, DC 20546-0001 NASA/TP-1999-209012
Blunt-forebody pressure data are used to study the behavior of the NASA Dryden Flight Research Center flush airdatasensing (FADS) pressure model and solution algorithm. The model relates surface pressure measurements to the airdatastate. Spliced from the potential flow solution for uniform flow over a sphere and the modified Newtonian impact theory,the model was shown to apply to a wide range of blunt-forebody shapes and Mach numbers. Calibrations of a sphere,spherical cones, a Rankine half body, and the F-14, F/A-18, X-33, X-34, and X-38 configurations are shown. The threecalibration parameters are well-behaved from Mach 0.25 to Mach 5.0, an angle-of-attack range extending to greater than30°, and an angle-of-sideslip range extending to greater than 15°. Contrary to the sharp calibration changes found ontraditional pitot-static systems at transonic speeds, the FADS calibrations are smooth, monotonic functions of Machnumber and effective angles of attack and sideslip. Because the FADS calibration is sensitive to pressure port location,detailed measurements of the actual pressure port locations on the flight vehicle are required and the wind-tunnel calibrationmodel should have pressure ports in similar locations. The procedure for calibrating a FADS system is outlined.
Airdata calibration, Blunt forebody, FADS, Flush airdata sensing, Sphere, X-33,X-34, X-38.
A03
33
Unclassified Unclassified Unclassified Unlimited
November 1999 Technical Paper
Presented at the 9th International Space Planes and Hypersonic Systems and Technologies Conference, November 1-5, 1999,Norfolk, VA, AIAA 99-4816. Brent R. Cobleigh, Stephen A. Whitmore, and Edward A. Haering, Jr., NASA Dryden, Edwards,California; Jerry Borrer, NASA Johnson, Houston, Texas; and V. Eric Roback, NASA Langley, Hampton, Virginia. A patent has beenfiled on this NASA invention. Equations (10)–(16) are included in this patent.
Unclassified—UnlimitedSubject Category 06