fluxes of volatiles (h o, co , n , cl, f) from arc volcanoes of volatiles (h 2o, co 2, n 2, cl, f)...
TRANSCRIPT

21
Geochemical Journal, Vol. 42, pp. 21 to 38, 2008
*E-mail address: [email protected]
Copyright © 2008 by The Geochemical Society of Japan.
Fluxes of volatiles (H2O, CO2, N2, Cl, F) from arc volcanoes
TOBIAS P. FISCHER*
Department of Earth and Planetary Sciences, University of New Mexico, Albuquerque, NM 87131-1116, U.S.A.
(Received June 6, 2007; Accepted September 10, 2007)
This review gives an overview of the estimates of volatile emissions from arc and mid-ocean ridge volcanoes to theatmosphere and hydrosphere with particular focus on H2O, CO2, N2, Cl and F. The gas compositions of high temperature(>500°C) fumaroles are compiled and used to derive magmatic H2O/SO2, CO2/SO2, HCl/SO2 and HF/SO2 ratios on an arc-by-arc basis to obtain new estimates of major volatile fluxes from arcs globally. The estimate of F flux from arcs is twoorders of magnitude smaller than the amount of F released from mid ocean ridges whereas the arc Cl flux exceeds theridge flux. An important observation is that globally the water budget of subduction zones seems to be balanced and theamount of water degassed through arc volcanism is within the estimates of the amount of water released from the slabbelow the volcanic front. Recent work that focused on the Central American arc shows that detailed knowledge of thesubduction input compositions, coupled with gas emission studies is critical to further constrain the fate of volatilesduring the subduction processes.
Keywords: volcanoes, fluxes, water, halogens, sources
Although a large number of SO2 flux measurementsusing the Correlation Spectrometer (COSPEC) have beenmade since the instrument was first pointed at a volcano(Mt. Mihara, Japan) by Moffat et al. (1972) and Stoiber’sfirst estimate of global volcanic SO2 (Stoiber and Jepsen,1973), there are still large data gaps particularly for vol-canoes in remote areas. This is certainly improving withbetter satellite remote sensing technology (Bluth et al.,1993; Khokhar et al., 2005) and smaller, cheaper ground-based instruments such as the mini DOAS (Galle et al.,2002). Because SO2 is the easiest gas to measure remotely(high abundance in the plume, low atmospheric back-ground and strong absorption in the UV), its global vol-canic flux has been comparatively well constrained. Thisis also true for CO2 where recent estimates generally fallwithin the range of earlier ones. The flux estimates ofother major volatiles, still vary by several orders of mag-nitude (H2O) or have not received much attention (HCl,HF).
The purpose of this review is to provide the readerwith an overview of the work that has been done in thefield of volatile flux estimates from volcanoes. Gas chem-istry from high temperature (>500°C), magmaticfumaroles world-wide (1970’s to 2002) is compiled todetermine representative, magmatic H2O/SO2, CO2/SO2,N2/SO2, HCl/SO2 and HF/SO2 ratios on an arc-by-arcbasis for new estimates of H2O, CO2, N2, HCl and HFfluxes. The water flux, in particular, is discussed in moredetail with implications for the water cycle in subduction
INTRODUCTION
Volatiles are transferred from the Earth’s mantle tothe atmosphere, the hydrosphere and crust through erup-tive and non-eruptive subaerial and submarine volcanicactivity. Volatiles are also recycled from the surface backto the Earth’s mantle via subduction. Quantification ofvolatile degassing through volcanoes and estimation oftheir source components (mantle vs. surface) bears fun-damental information on a number of issues in the Earthsciences ranging from the evolution of the Earth’s atmos-phere to the potential origin of geochemicalheterogeneities in the mantle. Noble gases are a criticalpart of estimating the fluxes of other volatiles to the at-mosphere by combining, for example, the mid-ocean ridge(MOR) 3He flux of Craig et al. (1975) with the CO2/3Heratio of oceanic basalt to arrive at MOR CO2 flux (Martyand Jambon, 1987). The application of noble gases toconstraining the sources and fluxes of volatiles from sub-duction zones has recently been reviewed by Hilton et al.(2002). Deriving subduction volatile fluxes from meltinclusion studies combined with magma emplacementrates has recently been reviewed by Wallace (2005) andKerrick (2001) reviewed the present and pastnonanthropogenic CO2 flux from the solid Earth.
INVITED REVIEW

22 T. P. Fischer
zones. After discussing global volatile emissions, the re-view focuses on some recent studies done in the CentralAmerican arc, that provide tighter constrains on both theinput into the subduction zone and the output throughvolcanoes.
GLOBAL VOLCANIC VOLATILE FLUXES
Quantifying volcanic volatile fluxes, in particular forgreenhouse gases such as CO2, is critical for studies thatare concerned with global element cycles. Berner andLasaga, (1989) note that calculating the rate of degassingof CO2 due to igneous and metamorphic process is a ma-jor problem when modeling the global carbon cycle. Al-though CO2 degassing from volcanic arcs, mid-oceanridges and to a lesser extent plumes is now relatively wellconstrained (within a factor of about two), the CO2 fluxfrom continental rifts remains largely unknown. Mostglobal volcanic volatile flux estimates rely a) on magmaemplacement rates, degrees of melting coupled withknown or estimated volatile abundances in the source re-gion of the melts or b) on sporadic point measurementsof gas emissions rates (SO2) from erupting or passivelydegassing volcanoes coupled with measured or estimated
volatile ratios to arrive at fluxes of gases other than SO2.Extrapolation of both types of estimates to global emis-sions is still burdened with large uncertainties and ac-counting for extreme point source emissions, such as the18 × 106 tons emitted from Miyakejima volcano, Japanfrom 2000 to 2003 (Kazahaya et al., 2004) remains a chal-lenge. This is true particularly for species other than SO2,CO2 and 3He which are affected by hydrothermal orseawater contributions (H2O, Cl and F), air contamina-tion (N2, Ar, Ne), or are extremely variable in volcanicemissions (H2, CH4 and CO). Despite these uncertainties,current knowledge of volcanic volatile emissions allowsfor careful incorporation of these data into global ele-ment cycles.
Volatile fluxes from volcanic arcsCorrelation spectrometers (COSPEC) are the stand-
ard instruments used to measure volcanic SO2 fluxes fromvolcanoes. These instruments were first developed in the1960s to measure pollution emitted from industrial andchemical plants (as SO2 and NO2), but their utility forvolcanic flux measurements was recognised shortly there-after. The COSPEC was first used at Mt. Mihara volcano,Japan, in April 1971. Today, COSPEC measurements re-
90° 145° 160° 105° 50°
30°
30°
60°
0°
BandaJava
Kermadec
Izu-Bonin
New Zealand
RyukuJapan
Kuril Is.
Kamchatka
AleutianAlaska Cascades
CentralAmerica Colombia
Fig. 1. Arcs that have high temperature (>400°) fumaroles with data compiled in Table 1. Italy is not shown. Modified fromHilton et al. (2002).

Volatile fluxes from volcanoes 23
Tabl
e 1.
G
as c
hem
istr
y of
hig
h te
mpe
ratu
r e f
umar
oles
wor
ld-w
ide
(mol
% t
otal
gas
) an
d ga
s ra
tios
use
d in
flu
x ca
lcul
atio
ns
Vol
cano
Mou
nt S
t Hel
ens
Aug
ustin
eM
omot
ombo
Mom
otom
boPo
asG
aler
asG
aler
asA
rcC
asca
des
Ale
utia
nsC
. A
mer
ica
C.
Am
eric
aC
. A
mer
ica
N. S
outh
Am
.N
. Sou
th A
m.
T (
°C)
710
870
844
747
940
358
642
Dat
e19
82M
ay-2
002
1981
Feb
-199
319
91R
ef.
Sym
onds
et a
l., 1
994
Sym
onds
et a
l., 1
990
Gig
genb
ach,
199
6E
lkin
s et
al.,
200
6R
owe
et a
l., 1
992
Gof
f an
d M
cMur
try,
200
0G
igge
nbac
h, 1
996
H2O
(%
)98
.984
.77
95.0
596
.25
9589
.691
.5C
O2
0.88
2.27
2.38
2.53
2349
061.
357.
8312
5.98
SO
20.
276.
980.
70.
2334
981
2.83
1.27
920.
8415
H2S
0.49
0.53
976
0.57
25H
Cl
0.15
1.01
0.35
0.52
7575
770.
380.
3848
0.71
6H
F0.
030.
086
0.02
90.
0383
8822
0.01
50.
0380
640.
062
H2
0.4
0.54
0.87
0.35
1671
640.
90.
2371
20.
285
CH
40.
0000
3<
0.00
003
0.00
040
CO
0.00
30.
016
0.02
50.
0112
1797
0.01
20.
0136
NH
37.
2133
E-0
50.
0029
744
N2
0.12
0.11
0.08
0.05
5289
180.
10.
0479
440.
041
Ar
0.00
0025
0.00
250.
0001
0983
9.36
E-0
5O
2<
0.00
005
0H
e0.
0000
50.
0001
560.
0003
Tot
al10
0.75
95.7
899
.97
100.
0010
0.58
99.9
610
0.01
CO
2/S
O2
3.25
90.
325
3.40
010
.845
0.47
76.
122
7.10
6m
edia
n3.
250
0.32
03.
400
6.61
4m
ean
3.25
04.
907
6.61
4ST
D3.
086
0.49
2H
Cl/S
O2
0.55
60.
145
0.50
02.
259
0.13
40.
301
0.85
1m
edia
n1.
197
0.57
6m
ean
3.25
00.
965
0.57
6ST
D0.
656
0.27
5N
2, e
xc/S
O2
0.44
10.
001
0.11
40.
218
0.03
50.
035
0.04
9m
edia
n0.
127
0.04
2m
ean
0.44
10.
123
0.04
2ST
D0.
053
0.00
7H
2O/S
O2
366.
312
.113
5.8
412.
233
.670
.010
8.7
med
ian
0.32
013
5.7
89.3
mea
n19
3.8
89.4
STD
113.
119
.3H
F/SO
20.
111
0.01
20.
041
0.16
40.
005
0.02
90.
073
med
ian
0.32
00.
041
0.05
2m
ean
0.07
00.
052
STD
0.04
80.
022

24 T. P. Fischer
Tabl
e 1.
(c
onti
nued
)
Vol
cano
Sat
sum
a Iw
ojim
aS
atsu
ma
Iwoj
ima
Usu
Sho
wa
Shi
nzan
Tok
achi
Unz
enA
rcJa
pan
Japa
nJa
pan
Japa
nJa
pan
Japa
nT
(°C
)88
588
069
080
050
581
8
Dat
eN
ov-9
319
92R
ef.
Gof
f an
d M
cMur
try,
200
0G
igge
nbac
h, 1
996
Gig
genb
ach,
199
6G
igge
nbac
h, 1
996
Gig
genb
ach,
199
6O
hba
et a
l., 1
994
H2O
(%
)97
.897
.399
.398
93.1
95.5
CO
20.
3432
0.51
0.36
1.2
1.15
22.
7S
O2
0.87
120.
818
0.03
20.
043
3.25
70.
7H
2S0.
0347
60.
164
0.01
80.
0004
2.14
6H
Cl
0.39
160.
5306
0.03
40.
053
0.27
60.
26H
F0.
0895
40.
0277
0.00
60.
024
0.03
45H
20.
451
0.60
70.
20.
630.
012
0.78
CH
40
0.00
040.
0005
70.
0007
10.
0000
1C
O0.
0017
20.
0000
50.
0033
0.00
011
0.02
8N
H3
00.
0001
30.
0003
N2
0.01
1396
0.00
80.
0104
0.05
70.
0224
0.04
6A
r0.
0000
50.
0000
580.
0001
0.00
025
0.00
007
O2
0.00
005
<0.
0005
<0.
0001
He
0.00
0008
0.00
0006
0.00
0002
0.00
0017
Tot
al99
.99
99.9
699
.96
100.
0110
0.00
100.
01
CO
2/S
O2
0.39
40.
623
11.2
5027
.907
0.35
43.
857
med
ian
2.24
0m
ean
7.39
8ST
D4.
444
HC
l/SO
20.
449
0.64
91.
063
1.23
30.
085
0.37
1m
edia
n0.
549
mea
n0.
642
STD
0.17
8N
2, e
xc/S
O2
0.01
10.
007
0.20
01.
093
0.00
60.
066
med
ian
0.03
8m
ean
0.23
0ST
D0.
175
H2O
/SO
211
2.3
118.
931
03.1
2279
.128
.613
6.4
med
ian
127.
7m
ean
963.
1ST
D55
6.9
HF/
SO2
0.10
30.
034
0.18
70.
558
0.01
10.
000
med
ian
0.06
8m
ean
0.14
9ST
D0.
087

Volatile fluxes from volcanoes 25
Vol
cano
Vul
cano
Vul
cano
Vul
cano
Kud
ryav
yK
udry
avy
Ala
idA
rcA
eoli
anA
eoli
anA
olin
anK
uril
eK
uril
eK
uril
eT
(°C
)54
662
085
894
092
070
0
Dat
eM
ay-9
519
91F
eb-9
2A
ug-9
5R
ef.
Gof
f an
d M
cMur
try,
200
0G
igge
nbac
h, 1
996
Gig
genb
ach
and
Mat
suo,
199
1T
aran
et
al.,
1995
Fis
cher
et
al.,
1998
Men
yail
ov e
t al
., 19
86
H2O
(%
)92
.686
.185
.894
.495
.397
.16
CO
27.
0744
11.9
12.4
1.79
761.
151.
61S
O2
0.04
8914
0.68
0.68
1.79
762.
050.
2H
2S0.
1213
60.
480.
530.
1792
0.39
HC
l0.
0427
720.
453
0.43
310.
4592
0.74
0.04
2H
F0.
0104
340.
101
0.12
070.
0252
0.09
60.
014
H2
0.04
0478
0.15
10.
2002
21.
1816
0.77
50.
94C
H4
00.
0000
10.
0000
1136
<0.
0001
12<
0.00
0005
<0.
0004
2C
O0.
011
0.01
1218
0.00
065
0.00
084
0.01
8N
H3
0.00
0902
80.
0005
60
N2
0.05
9644
0.10
680.
1107
60.
1332
80.
025
0.18
Ar
0.00
0318
20.
0001
120.
0001
136
0.00
1008
0.00
009
0.00
057
O2
0.00
1783
4<
0.00
020
0.02
240.
0176
He
0.00
0051
80.
0001
150.
0001
1928
0.00
0014
0.00
0006
5T
otal
100.
0099
.98
100.
2910
0.00
100.
5410
0.16
CO
2/S
O2
144.
629
17.5
0018
.235
1.00
00.
561
8.05
0m
edia
n17
.868
0.91
5m
ean
17.8
682.
096
ST
D0.
368
1.19
5H
Cl/
SO
20.
874
0.66
60.
637
0.25
50.
361
0.21
0m
edia
n0.
666
0.30
8m
ean
0.65
26.
311
ST
D0.
015
3.91
4N
2, e
xc/S
O2
0.95
90.
150
0.15
60.
052
0.01
00.
786
med
ian
0.15
60.
033
mea
n0.
153
0.15
2S
TD
0.00
30.
127
H2O
/SO
218
93.1
126.
612
6.2
52.5
46.5
485.
8m
edia
n12
6.4
269.
2m
ean
126.
461
0.9
ST
D0.
221
317.
5H
F/S
O2
0.21
30.
149
0.17
80.
014
0.04
70.
070
med
ian
0.16
30.
058
mea
n0.
163
1.41
8S
TD
0.01
40.
949

26 T. P. Fischer
Tabl
e 1.
(c
onti
nued
)
Vol
cano
Klu
iche
vsko
iT
olba
chik
Av
ach
aP
apan
daya
nM
erap
iM
erap
iL
evot
olo
Arc
Kam
chat
kaK
amch
atka
Kam
chat
kaJa
vaJa
vaJa
vaB
anda
T (
°C)
1100
1020
473
400
803
575
490
Dat
e19
7619
9419
9419
9419
84R
ef.
Gig
genb
ach,
199
6T
aran
et
al.,
1987
Tar
an e
t al
., 19
95G
igge
nbac
h, 1
996
Gig
genb
ach
et a
l., 2
001
Gig
genb
ach
et a
l., 2
001
Poo
rter
et
al.,
1993
H2O
(%
)97
.73
9894
.896
88.7
93.4
76.6
CO
20.
120.
042.
262.
945.
564.
7412
SO
20.
090.
052.
720.
675
0.98
0.51
8.69
H2S
0.00
20.
290.
134
0.59
HC
l1.
421.
060.
170.
125
0.60
794
0.19
998
0.61
HF
0.25
0.28
0.00
30.
0033
00.
0277
20.
037
H2
0.59
0.55
0.05
0.01
40.
5005
90.
1656
60.
54C
H4
<0.
0001
0.00
0000
40.
0003
0.00
006
00.
0005
775
0.00
02C
O0.
0001
0.00
020.
0000
30.
0235
040.
0046
20.
36N
H3
0.00
049
00.
0015
84N
20.
004
0.11
20.
055
3.60
470.
3894
Ar
0.00
0032
0.00
043
0.00
0039
0.04
8477
0.00
7524
O2
<0.
0002
0.01
7967
0.00
33H
e0.
0001
20.
0000
076
0.00
0025
0.00
0047
460.
0000
1914
0.00
003
Tot
al10
0.21
99.9
810
0.12
100.
1010
0.18
100.
0498
.84
CO
2/S
O2
1.33
30.
800
0.83
14.
356
5.67
39.
294
1.38
1m
edia
n5.
015
mea
n5.
176
ST
D1.
640
HC
l/S
O2
15.7
7821
.200
0.06
30.
185
0.62
00.
392
0.07
0m
edia
n0.
289
me a
n0.
317
ST
D0.
121
N2,
exc
/SO
20.
030
0.00
00.
035
0.07
91.
700
0.17
30.
000
med
ian
0.12
6m
ean
0.48
8S
TD
0.40
5H
2O/S
O2
1085
.919
60.0
34.9
142.
290
.518
3.1
8.8
med
ian
116.
4m
ean
106.
2S
TD
37.6
HF
/SO
22.
778
5.60
00.
001
0.00
50.
000
0.05
40.
004
med
ian
0.00
5m
ean
0.01
6S
TD
0.01
3

Volatile fluxes from volcanoes 27
Not
es:
Gas
rat
i os,
med
i ans
, mea
ns a
nd S
TD
are
cal
cul a
t ed
f or
each
arc
wi t
h t h
e al
l dat
a av
ail a
ble
f or
t he
arc.
If m
ore
t han
one
sam
ple
i s a
vai l
abl e
f or
one
vol c
ano,
eac
h i s
wei
ghed
equ
all y
f or
cal c
ulat
i ng
t he
arc
com
posi
t ion
s. F
or e
ach
arc,
the
med
i an,
mea
n an
d ST
D i
s sh
own
i n t
he l
eft -
mos
t co
l um
n of
eac
h ar
c he
adi n
g. F
or e
xam
ple
six
gas
sam
ples
are
ava
i lab
l e f
or t
he J
apan
arc
and
t he
med
i an,
mea
n an
d ST
D o
f al
l t h
ese
sam
ples
are
sho
wn
i n t
he f
i rst
col
umn
on T
abl e
2.2
. H
i gh
t em
pera
t ure
gas
es f
rom
ri f
t an
d ho
t sp
ot a
re a
l so
show
n f o
r co
mpa
riso
n.
Vol
cano
Whi
te I
slan
dN
gaur
uhoe
Ert
a A
leK
ilau
eaA
rcK
erm
adec
Ker
mad
ecA
fri c
an R
ift
Haw
aii
T (°
C)
495
640
1131
307
Dat
e19
9019
7419
97R
ef.
Gig
genb
ach,
199
6G
igge
nbac
h, 1
996
Gig
genb
ach,
199
6F
isch
er, u
npub
l.
H2O
(%
)92
.096
.079
.492
.1C
O2
6.01
001.
6050
9.9
6.25
SO
21.
0000
1.02
007.
81.
57H
2S0.
6000
0.68
00H
Cl
0.24
000.
2500
0.7
0.8
HF
0.00
280.
0026
9H
20.
0400
0.14
200.
750.
0043
9C
H4
0.00
140.
0000
<0.
0000
3C
O0.
0042
0.27
<0.
0000
4N
H3
0.00
64N
20.
0390
0.15
000.
180.
0026
Ar
0.00
0056
0.00
1050
0.00
10.
0000
1O
2<
0.00
01<
0.00
300.
0003
He
0.00
0021
0.00
0022
0.00
0135
Tot
al99
.94
99.8
610
0.73
CO
2/S
O2
6.01
01.
574
1.26
93.
981
med
ian
3.79
2m
ean
3.79
2ST
D2.
218
HC
l/SO
20.
240
0.24
50.
090
0.51
0m
edia
n0.
243
me a
n0.
243
STD
0.00
3N
2, e
xc/S
O2
0.03
70.
106
0.01
80.
001
med
ian
0.07
1m
ean
0.07
1ST
D0.
035
H2O
/SO
292
.094
.110
.258
.7m
edia
n93
.06
mea
n93
.06
STD
1.05
9H
F/SO
20.
003
00
0.00
2m
edia
n0.
001
mea
n0.
001
STD
0.00
1
28 T. P. Fischer
main the basis for the majority of global volcanic vola-tile flux estimates (Hilton et al., 2002) and provide themost extensive data set regarding volcanic gas fluxes(Andres and Kasgnoc, 1998).
The first global estimate of the annual contribution ofSO2 to the atmosphere by non-erupting volcanoes wasexclusively based on measurements of Central Americanvolcanoes (Stoiber and Jepsen, 1973). Their estimate of10 × 1012 g/y (1.6 × 10¹¹ mol/yr) is very similar to muchlater estimates of 15.2 × 10¹² g/yr (Berresheim andJaeschke, 1983), 18.7 × 10¹² g/yr (Stoiber et al., 1987),20 × 1012 g/yr (Graf et al., 1997), 15–21 × 1012 g/yr(Halmer et al., 2002) and 13.4 × 10¹² g/yr by Andres andKasgnoc (1998). Andres and Kasgnoc (1998) compiledSO2 flux data measured by COSPEC (9.7 × 10¹² g/yr)and by TOMS (3.7 × 10¹² g/yr). Considering the COSPECSO2 flux alone, more than 99% of the total flux is emit-ted from passively degassing volcanoes. Including theTOMS SO2 flux, 71% of the total SO2 flux is emitted bypassively degassing volcanoes.
SO2 flux data measured at individual volcanoes canbe combined with measurements of elemental ratios (SO2/x where x = CO2, N2, H2O, He etc.) to provide flux datafor species which cannot be measured directly (see Hiltonet al. (2002)). A potentially serious caveat of this approachis that in arcs where measurements of elemental ratiosare sparse or absent, the resulting fluxes may be burdenedwith significant errors. The use of median ratios, may al-leviate this problem to some extent (Hilton et al., 2002;Fischer and Marty, 2005) but only if a large number ofsamples are available. An alternative approach is to useonly samples from high temperature (>400 and prefer-ably >700°C) fumaroles for each arc system, rather thanall available data from low temperature emissions and hotsprings. Due to the magmatic temperatures of the emis-
0
50
100
150
200
250
300
350
400
0 0.2 0.4 0.6 0.8 1 1.2 1.4
HCl/SO2 (molar)
H2O
/SO
2 (m
olar
)
CascadesAleutiansC. AmericaN South Am.JapanAeolianKurileJavaKermadec
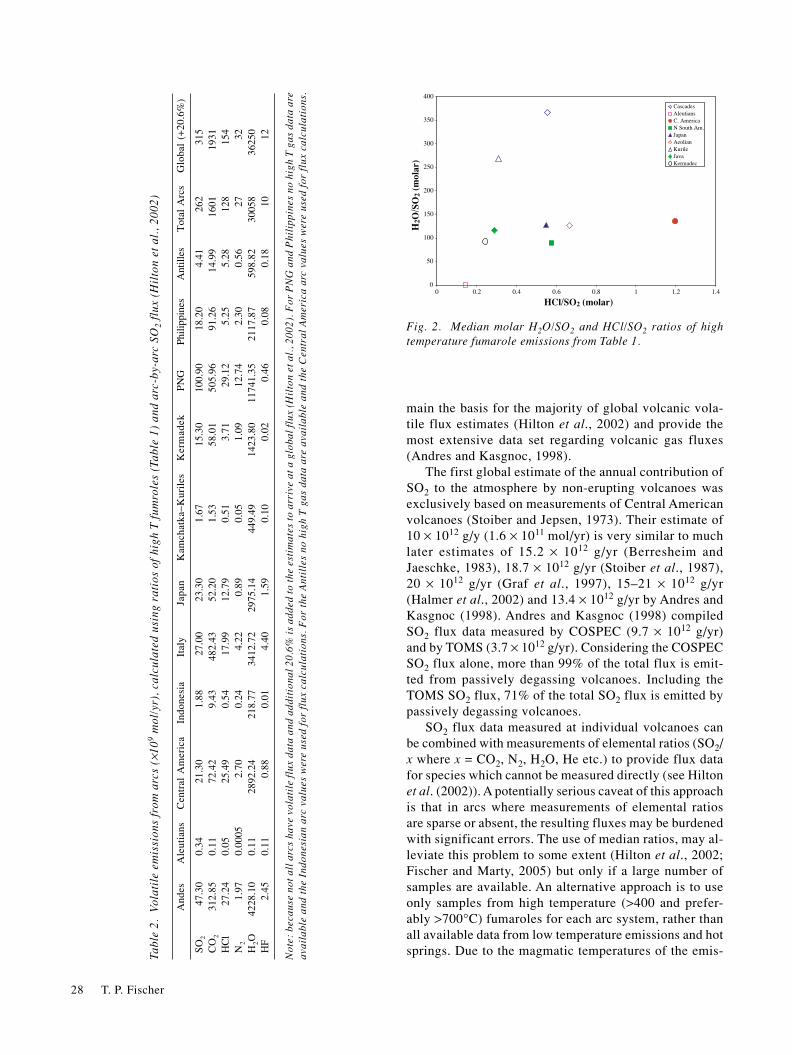
Fig. 2. Median molar H2O/SO2 and HCl/SO2 ratios of hightemperature fumarole emissions from Table 1.
And
esA
leut
ians
Cen
tral
Am
eric
aIn
done
sia
Ital
yJa
pan
Kam
chat
ka−K
uril
esK
erm
adek
PNG
Phili
ppin
esA
ntill
esT
otal
Arc
sG
loba
l (+
20.6
%)
SO
247
.30
0.34
21.3
01.
8827
.00
23.3
01.
6715
.30
100.
9018
.20
4.41
262
315
CO
231
2.85
0.11
72.4
29.
4348
2.43
52.2
01.
5358
.01
505.
9691
.26
14.9
916
0119
31H
Cl
27.2
40.
0525
.49
0.54
17.9
912
.79
0.51
3.71
29.1
25.
255.
2812
815
4N
21.
970.
0005
2.70
0.24
4.22
0.89
0.05
1.09
12.7
42.
300.
5627
32H
2O42
28.1
00.
1128
92.2
421
8.77
3412
.72
2975
.14
449.
4914
23.8
011
741.
3521
17.8
759
8.82
3005
836
250
HF
2.45
0.11
0.88
0.01
4.40
1.59
0.10
0.02
0.46
0.08
0.18
1012
Tabl
e 2.
Vo
lati
le e
mis
sion
s fr
om a
rcs
( ×10
9 mol
/yr)
, ca
lcul
ated
usi
ng r
atio
s of
hig
h T
fum
role
s (T
able
1)
and
arc-
by-a
rc S
O2
flux
(H
ilto
n et
al.
, 20
02)
Not
e : b
e cau
se n
ot a
ll a
rcs
hav e
vol
atil
e fl
ux d
ata
and
addi
tion
al 2
0.6%
is
adde
d to
the
est
imat
e s t
o ar
riv e
at
a gl
obal
flu
x (H
ilto
n e t
al.
, 200
2). F
or P
NG
and
Phi
lipp
ine s
no
high
T g
as d
ata
are
avai
labl
e an
d th
e In
done
sian
arc
val
ues
we r
e us
e d f
or f
lux
c alc
ulat
ions
. F
or t
he A
ntil
les
no h
igh
T g
as d
ata
are
avai
labl
e an
d th
e C
e ntr
al A
me r
ica
arc
v alu
e s w
e re
use d
for
flu
x c a
lcul
atio
ns.

Volatile fluxes from volcanoes 29
of their estimates is similar to the HCl and HF arc fluxescalculated here.
Volatile fluxes from ridges and plumesVolatile flux estimates from mid-ocean ridges (MOR)
fall into two categories 1) using the 3He flux from MORas derived from the measured 3He concentration in thewater column and volatile ratios relative to 3He (i.e., CO2/3He) or 2) using the global mid ocean ridge basalt pro-duction rate and volatile concentrations of the MORBsource and a degree of melting. For the 3He flux of MOR,
sions, processes such as interaction with a shallow hy-drothermal system that would cause precipitation of Sspecies and partitioning of HCl and HF into the liquidphase before reaching the surface, are likely to be negli-gible (Gerlach and Doukas, 1994; Giggenbach, 1996). Thecompositions of such high temperature fumarole emis-sions world-wide are shown in Table 1. The arcs that havehigh temperature fumarole data available are shown inFig. 1. Although there are still significant variations ingas ratios within an arc system, the variations are gener-ally smaller and considered more representative of thevolatiles that are exsolving from the magma. Figure 2shows the median values for each arc. A similar approachof using high temperature fumarole gas emissions in com-bination with SO2 flux estimates has been used by Halmeret al. (2002) to calculate global volcanic emissions of H2S,HCl, HF, HBr, OCS and CS2 for the period of 1972 to2000. These authors suggest that 70–80% of the globalSO2 flux, or 186 to 266 × 109 mol/yr is from arc volca-noes.
Using the median ratios of Table 1, the fluxes of themajor volatile species from the individual arcs are sum-marized in Table 2. As discussed in Hilton et al. (2002),not all arcs have flux measurements and to extrapolate toa global arc flux 20.6% is added to the sum of the indi-vidual arc fluxes. Previous estimates of arc volatile emis-sions are summarized in Table 3 and it can be seen thatthe CO2, SO2 and HCl fluxes are consistent within a fac-tor of two. The N2 flux of this study is within a factor oftwo of Hilton et al. (2002) but almost two orders of mag-nitude higher than that of Sano et al. (2001), the onlyother estimate of N2 flux from arcs. The arc volcanicfluxes of HCl and HF calculated by Halmer et al. (2002)show a higher maximum value for HCl (25–3500 × 109
mol/yr) and for HF (26–320 × 109 mol/yr). The lower end
Table 3. Compilation of volatile fluxes from arcs (109 mol/yr)
Note: the values of the Halmer study consider 75% of the global flux to be arc related and only consider HCl and HF released to the atmosphere,not stratosphere.
SO2 CO2 HCl N2 H2O HF Reference
292 Stoiber and Jepsen, 1973240 Berrensheim and Jaeschke, 1983203 Andres and Kasgnoc, 1998
2500 Marty and Tolstikhin, 1998700 Allard, 1992
3100 Sano and Williams, 19961500 Varecamp et al., 1992
226 25–3500 26–320 Halmer et al., 2002315 1600 20 81200 Hilton et al., 2002
127 5560 Ito et al., 1983563 197 17000 Wallace, 2005
0.64 Sano et al., 2001315 1931 154 32 36250 12 This study
Farc: total global flux of volatile species from subduction zones. Cal-culated by summing up the volatile fluxes from individual arcs (Table2).FMORB: flux of volatiles from the mantle, approximated by MORB flux.H2O: from Jambon and Zimmermann (1990).SO2: from Alt et al. (1985).CO2: from Marty and Tolstikhin (1998).N2: from Marty (1995).HCl: from CO2 flux and Cl/CO2 of 0.017 molar from Saal et al. (2002).HF: from CO2 flux and F/CO2 of 0.51 molar from Saal et al. (2002).Upper Mantle: all values from Saal et al., 2002; except N from Marty(1995).
Table 4. Global volatile fluxes from arc and MORB and thecomposition of the depleted upper mantle
Volatile Farc FMORB Depleted upper mantle(mol/yr) (mol/yr) (ppm)
H2O 3.25 × 10¹³ 2.90 × 10¹³ 142 ± 85
SO2 3.15 × 10¹¹ 2.67 × 10¹² 146 ± 35 (S)
CO2 1.93 × 10¹² 2.20 × 10¹² 72 ± 19
N2 3.50 × 10¹⁰ 2.20 × 10⁹ 2.8 ± 1 (N)
Cl 1.54 × 10¹¹ 3.90 × 10¹⁰ 1 ± 0.5
F 1.20 × 10¹⁰ 1.13 × 10¹² 16 ± 3

30 T. P. Fischer
the value of 1000 mol/yr of Craig et al. (1975) has beenwell established and widely used over the past 30 years.A somewhat smaller estimate for 3He flux from MOR of422 ± 181 mol/yr has been made using a global MORBmagma flux of 21 km3/yr (Crisp, 1984), a CO2 mantlesource abundance of 72 ± 19 ppm and the CO2/3He ratioof 2.2 ± 0.7 × 10⁹ (Saal et al., 2002). The knowledge ofthe MORB source mantle volatile contents (CO2, S, Cl,F) allows for a new estimate of MORB CO2 flux (9.3 ±2.8 × 10¹¹ mol/yr). This value is close to the previousestimate of 2.2 × 10¹² mol/yr (Marty and Tolstikhin, 1998)which has been obtained in a similar fashion. Mid oceanridge Cl and F fluxes calculated using the MOR CO2 fluxof Marty and Tolstikhin (1998) and Cl/CO2 and F/CO2ratios from Saal et al. (2002) are shown in Table 4. Martyand Tolstikhin (1998) report a nitrogen flux from MORof 2.2 ± 1.0 × 10⁹, similar to the estimate of 1.6–6.4 × 10⁹
mol/yr by Zhang and Zindler (1993). Table 4 shows thatfor H2O and CO2, the arc fluxes are comparable to theMOR fluxes, whereas for N2 and Cl, the arc flux exceedsthe MOR flux. It is interesting to note that MOR fluxexceeds the arc flux by factor of about ten for SO2 and bya factor of about 100 for F.
Because MOR fluxes are calculated using the CO2 fluxfrom ridges and volatile ratios estimated for the uppermantle it assumes complete degassing of mantle magmafor all volatile species. The lower solubility of CO2 com-pared to other species (i.e., Cl and F) in the source mag-mas results in incomplete degassing of the more solublespecies. This is evident from the lower CO2/Cl contentsof MORB host glasses compared to MORB melt inclu-sions, indicating CO2 degassing and/or Cl contaminationin MORBs (Saal et al., 2002). Therefore, the MOR fluxestimates for Cl and F in Table 5 represent maxima.
Volatile fluxes from plumes are poorly constrained.Allard (1992) estimates a non-arc subaerial volcanic 3Heflux of 160–240 mol/yr. This estimate includes Etna(which does not show plume-type 3He) with ~58 mol 3He/yr. Therefore, the plume 3He flux is about one order ofmagnitude lower than the ridge flux. Marty and Tolstikhin(1998) estimate a plume CO2 flux of 3 × 10¹² mol/yr whichis similar to that from ridges. The N2 flux from plumes isestimated at 4.1 × 10⁶ mol/yr by Sano et al. (2001) andsignificantly lower than the arc and MOR fluxes. Chlo-rine flux from plumes is estimated at approximately 3.8× 10¹⁰ mol/yr by Ito et al. (1983), which is similar to theMOR flux.
THE IMPORTANCE OF WATER
Water is the most dominant volatile component (bymass) in arc magmas and is the transport medium for allother volatile components during magmatic degassing(Sisson and Layne, 1993; Sobolev and Chaussidon, 1996;
Roggensack et al., 1997), though a notable exceptionexists for water-poor arc magmas (Sisson and Bronto,1998). High H2O contents of arc magmas along with highSiO2 are also responsible for the explosive and hazard-ous nature of arc volcanoes. Water also has a profoundimpact on melt properties such as melting point, viscos-ity and melt compositions.
Mass imbalance for waterThe amount of water in the ocean amounts to 1.4 ×
1024 g and that in the continents to 0.2 × 1024 g. Becausethe oceanic crust is altered by interaction with sea waterat the ridge axis, the average oceanic crust (6.5 km thick)contains about 1.5 ± 0.5 wt% H2O which amounts to 8.8± 2.9 × 10¹⁴ g (4.9 × 10¹³ mol) H2O/yr for 3.0 km2/yr ofsubducted oceanic crust. This value increases to 1.05 ×10¹⁵ g (5.8 × 10¹³ mol) including oceanic sediments with6.3 wt% H2O (Ito et al., 1983). Studies by Ito et al. (1983),Peacock (1990) and Bebout (1996) have concluded thatthere is a significant imbalance between the amount ofH2O subducted into the mantle and the amount returnedto the surface by arc magmatism. This imbalance hasimplications for the permanence of oceans because thetotal amount of H2O currently in the oceans would besubducted back into the mantle in about 1 Ga (Fyfe andMcBirney, 1975). While the return flux of these studiesrelies on conservative estimates of the average amountof H2O in arc magmas and likely underestimates theamount of water returned to the atmosphere; more recentwork by Hilton et al. (2002) suggests that more water isreturned to the surface through volcanic degassing thanwhat is subducted. These authors explain this imbalanceby non-magmatic water incorporated into volcanic gasesresulting in an overestimate of the average H2O/CO2 ra-tio of 50 which is used to calculate the arc H2O flux.
Towards a mass balance for waterA more recent estimate by Wallace (2005) uses the
range of H2O contents measured in arc melt inclusions(3–6 wt%) and an estimate for the primary, non-degassedCO2 contents of these magmas. Because all melt inclu-sions are likely to have been trapped after significant lossof CO2 by degassing (Fischer and Marty, 2005; Wallace,2005), the primary CO2 content of arc magmas is esti-mated by combining the CO2 flux from arcs with a maxi-mum magma flux to arcs of 8.5 km3/yr (Crisp, 1984). Thismethod yields a minimum of 3000 ppm CO2. A more likelyarc magma flux of 2–4 km3/yr (Crisp, 1984; Carmichael,2002; Dimalanta et al., 2002) results in a primary CO2content of arc magmas of about 0.6–1.3 wt% (Wallace,2005). These estimates are consistent with the work ofFischer and Marty (2005) who estimate 0.35–0.76 wt%CO2 for undegassed arc magmas based on arc CO2 fluxesand magma emplacement rates. Therefore, a primary H2O/

Volatile fluxes from volcanoes 31
CO2 ratio for arc magmas of ~4 may be more appropriatewhich would result in a H2O flux from arc magmas ofabout 3 × 10¹⁴ g/yr (1.7 × 10¹³ mol/yr) (Wallace, 2005).This amount is comparable to the 4.9 × 10¹³ mol/yr ofH2O subducted in the altered oceanic crust estimated byIto et al. (1983). However, the global subduction rates ofH2O are still poorly constrained and range from 91.1 to194 × 1013 g H2O/yr (5 × 10¹² to 1 × 10¹⁴ mol H2O/yr)(see review by Bebout (1996)). Therefore, a maximum ofabout 1 × 10¹⁴ mol H2O/yr could be subducted globally,which is one order of magnitude higher than the H2O fluxfrom arc magmas estimated by Wallace (2005).
Certainly, not all H2O stored in subducted sedimentsand oceanic crust will make it to the depths of magmageneration due to shallow level dehydration and forearcflux back to the ocean. Using phase relationships of oce-anic crustal rocks and sediments, Schmidt and Poli (1998)calculate that the oceanic lithosphere contains about 0.71–1.08 × 10⁹ g H2O/m2 in a 7 km column of the crust at 20km depth and that 18 to 37% of that amount (0.124 to 0.4× 10⁹ g H2O/m2) are available for the generation of arcmagmas. The remainder is lost into shallow, cold cornerof the mantle wedge where serpentine is stable (Schmidtand Poli, 1998), alternatively, it could also be returned tothe ocean in the fore-arc (but this flux is currently un-known). These estimates result in 1.8 to 5.7 × 10⁴ g H2O/m3 of crust available for arc magma generation. At anoceanic crust density of 2.9 × 10⁶ g/m3 about 0.6 to 2wt% of H2O stored in the subducting crust is availablefor arc magma generation. Estimates of the global sub-duction rate of oceanic sediments range from 1.33 to 3.5× 10¹⁵ g/yr and the subduction rate for oceanic crust iswell constrained at 60 × 1015 g/yr (see summary by Bebout(1996)). Therefore, about 0.4 to 1.3 × 10¹⁵ g H2O/yr (2–7× 10¹³ mol H2O/yr) would be available for arc magmageneration. The arc H2O flux by Wallace (2005) (1.7 ×10¹³ mol/yr) is at the low end of this estimate. Consider-ing the uncertainties, it follows that the amount of H2Othat is globally available for the generation of arc mag-mas and originates in the subducting oceanic lithosphereis efficiently recycled back to the atmosphere through arcvolcanism.
An important observation is that the H2O flux seemsto be balanced with the subduction input when using theestimate of Wallace (2005) which relies on magmatic H2O/CO2 ratios derived from melt inclusions and the primaryCO2 content of the mantle below arcs (which in turn de-pends on arc CO2 flux and magma production rates). Al-ternatively, the H2O flux can be calculated more directlyusing the H2O/SO2 ratios of high temperature arcfumaroles and the global SO2 flux (Table 2) which re-sults in an arc H2O flux of 3.6 × 10¹³ mol/yr, which isalso within the range of the flux that it available for arcmagma generation based on Schmidt and Poli (1998) and
only a factor of about two higher than the estimate ofWallace (2005). The important implication of this obser-vation is that most of the H2O discharging from high tem-perature fumaroles is of mantle origin, without signifi-cant meteoric (surficial) contribution. This is also con-sistent with δD and δ18O systematics of high temperaturearc fumaroles that show compositions close to the“andesitic” or “arc-type” water end-member of Taran etal. (1987) and Giggenbach (1992), whereas lower tem-perature discharges have higher H2O contents (generally> 97%) and show isotopic compositions similar to mete-oric waters (see Goff and McMurtry (2000)).
In summary, a flux of magmatic/mantle (non mete-oric) H2O from arc volcanoes to the atmosphere of 2 to 4× 10¹³ mol/yr is currently the best estimate because it isconsistent with 1) melt inclusion data and magma em-placement rates 2) high temperature global fumarole dataand time averaged arc SO2 fluxes and 3) the amount ofH2O subducted and available for arc magma generationthat implies a balance between the input and the outputof H2O at arcs.
REGIONAL STUDIES: THE CENTRAL AMERICAN ARC
Studies on volatile systematics that focus on one arcwhere subduction parameters (slab dip, convergence rate,composition of the incoming plate, etc.) as well as outputcharacteristics (trace and isotopic composition of thelavas, crutsal composition and thickness) are well con-strained provide natural laboratories to study elementcycles in greater detail. The Central American VolcanicArc (CAVA) has recently received much attention becauseit meets many of the criteria that make it an ideal site toinvestigate the tectonic, geophysical and geochemicalprocesses operating in subduction zones.
The CAVA is the result of eastward subduction of theCocos Plate beneath the Caribbean Plate. Figure 3 showsthe locations and names of the active volcanoes in theCentral American arc. The subducting plate comprises 170m of hemipelagic sediments overlying 400 m of limestonewhich, in turn, overlie oceanic basalt basement (vonHuene et al., 1980). The crustal basement ranges in agefrom ~13–17 Ma at the trench adjacent to Costa Rica to~25–30 Ma off Nicaragua. The dip of the slab is steepestoff Nicaragua (up to 84°) and this is relatively constantthroughout the country despite abrupt changes in the sur-face orientation of the volcanic front (Proti et al., 1995).Convergence direction is nearly orthogonal to the vol-canic front in Nicaragua, with convergence rates currentlyproceeding at about 90 mm/a (Minister and Jordan, 1978).Crustal thickness is less than 35 km in Nicaragua whereasit is greater in both Guatemala (~50 km) and Costa Rica(42 km) (Carr et al., 1990).
Western Nicaraguan volcanic rocks are characterized

32 T. P. Fischer
by high Ba/La, B/La, and 10Be/9Be ratios (Carr et al.,1990; Morris et al., 1990; Leeman and Carr, 1995). Thesefeatures indicate high degrees of partial melting in themantle beneath Nicaragua, with addition of fluid mobileelements from the uppermost part of the subducting sedi-ment column. These same ratios are low in Costa Ricaand intermediate in eastern Nicaragua, Guatemala, andEl Salvador (Carr et al., 1990; Leeman et al., 1994; Patinoet al., 2000).
A proposed explanation for these observations is thatdue to the steep subduction angle beneath Nicaragua,volatiles are released into only a small volume of mantlewedge above the slab (Carr et al., 1990). Consequently,the release of fluids generates a high degree of partialmelting but an overall small melt volume. Conversely,the shallow dip of the slab beneath Costa Rica explains
the generation of large volumes of small-degree melts andconsequent dilution of the recycled beryllium signature(Carr, 1984; Carr et al., 1990). However, more recent es-timates based on extensive age dating reveal that the vol-canic fluxes in both arc segments are equal within errors(Carr et al., 2007). Underplating of the uppermost part ofthe sediment column beneath the overriding crust alsohas been proposed to explain low cosmogenic 10Be sig-natures in Costa Rica lavas (Morris et al., 1990; Leemanet al., 1994).
Volatile flux studies: recent constrains on mass balanceVolcanic gas measurements have been an integral part
of geochemical and volcanological studies in the CentralAmerican arc since the 1960’s, starting with Stoiber’spioneering work on gas condensates (Stoiber and Rose,
PANAMA
COSTA RICA
San Jose
IrazuTurrialba
Poas
Arenal
Miravalles
PACIFIC OCEAN
CARIBBEAN SEA
0 50 km
N
Chocosuela-Platanar
Managua
TelicaCerro Negro
NICARAGUA
CARIBBEAN PLATECOCOS PLATE
Rincon de la Vieja
Las PilasMomotombo
Coseguina
Concepcion
Mombacho
Xiloa
14° 14°
13°
12°
11°
10°
9°
8°
13°
12°
11°
10°
9°
8°
EL SALVADOR
HONDURAS
MEXICO
BELIZE
GUATEMALA
88° 87° 86° 85° 84° 83°89°90°91°
88° 87° 86° 85° 84° 83°89°90°91°
Tegucigalpa
San Salvador
Guatemala city
Belmopan
15°
16°
17°
15°
16°
17°
Masaya
San Cristobal
San SalvadorSanta Ana
San MiguelSan Vicente
PacayaAgua
Fuego
AcatenangoToliman
Atitlan
SantaMaria
Almolonga
Izalco
El Tigre
Fig. 3. The Central American Volcanic Arc. Shown are the volcanoes that are associated with gas emissions through fumaroles,bubbling springs, geothermal wells or mud-pots (from Fischer et al., 2007).

Volatile fluxes from volcanoes 33
1970) and have recently been summarized by Fischer etal. (2007). With regards to volatile sources and fluxes,gas discharges have been examined for helium, carbon,and nitrogen in Guatemala Nicargua and Costa Rica(Fischer et al., 2002; Shaw et al., 2003; Zimmer et al.,2004), and for helium and carbon in Nicaragua, El Salva-dor and Honduras (Shaw et al., 2003; de Leeuw et al.,2007) and along the entire length of the CAVA (Snyder etal., 2001). Snyder et al. (2003) investigated the sourcesof nitrogen and methane in geothermal fluids along theCentral American arc. This work focused on geothermalwell fluids and concluded that most of the nitrogen dis-charging in Nicaragua is crustal in origin, based on highN2/3He, close to MORB-like 3He/4He ratios, and an in-ferred relationship between excess nitrogen and an io-dine isotopic component that is much older than thesubducted sediments.
Recent work by Elkins et al. (2006) shows that nitro-gen isotope systematics correlate with other geochemicalparameters along the arc (Fig. 4). These correlations sup-port the notion that nitrogen originates from subductedhemipelagic sediments which have δ15N values of around+6‰ and high nitrogen contents (Li and Bebout, 2005).Below Costa Rica, the upper-most hemipelagic sedimentlayer is off-scraped and the resulting δ15N values of thegas discharges become mantle or MORB-like (–5 ± 3‰).Approximation of the end-member compositions of air,mantle and sediments allows for the calculation of therelative contribution of these end-members to the totalnitrogen discharge (Sano et al., 1998). For example forNicaragua, the average contribution of sediment derivednitrogen to the discharging volatiles is 85%. Significantlyhigher than for Costa Rica to the south (Zimmer et al.,2004). Table 5 tabulates the recent estimates of nitrogeninput and output in the Central American subduction zonesystem. For example considering the Nicaragua N outputflux of sedimentary N (85% of total N) of 8.8 × 10⁸ mol/yr (last column) and comparing that value with the esti-mated N input stored in subducted sediments (9.3 × 10⁸
mol/yr) for Nicaragua, shows that the input is only slightlyhigher than the output through arc volcanoes. Consider-ing the uncertainties, the volcanic N flux that originatesfrom subducted sediments is approximately balanced bythe input of nitrogen stored in the sedimentary sequencesof the subducting oceanic crust. Clearly, more work isneeded to further constrain the inputs and outputs ofvolatiles and their recycling efficiency through subduc-tion zones. An important observation of this study is (andshown in Table 5), that the amount of nitrogen stored inthe oceanic basement (5 to 50 ppm (Li and Bebout, 2005))significantly adds to the amount of subducted N. Whenincluding the basement N, the subducted N greatly ex-ceeds the amount released through arc volcanism andcould likely be subducted into the deeper mantle.
The notion that significant amounts of N are subductedinto the mantle is also supported by a recent study of car-bon systemtatics of the CAVA. The work by Shaw et al.(2003) showed that only about 14–18% of the CO2 thatoriginates from subducted sediments and the altered oce-anic crust is recycled back to the atmosphere through arcvolcanism, the remainder is either returned into the deepmantle or lost in the for-arc, prior to sudbuction.
Fig. 4. Variation of geochemical parameters along the CentralAmerican arc. Ba/La is from recently erupted lavas (Patino etal., 2000 and Carr et al., 2003). Nitrogen data is from Elkins etal. (2006) and %S represents the amount of N2 that originatesfrom subducted sediments.
Costa Rica Nicaragua El Salvador Guatemala

34 T. P. Fischer
Volatile emissions from arc to back-arc: constraining thefate of CO2
A more recent study of the C–He systematics of ElSalvador and Honduras (back-arc) gas emissions has re-visited the processes of CO2 recycling in Central America(de Leeuw et al., 2007). This study takes advantage ofthe now much more detailed knowledge regarding the Ccontent as well as isotopic composition in the subductedoceanic plate. Li and Bebout (2005) identified three unitsin the subducting plate: U1 and U2 are clay rich and un-derlain by U3, a carbonate rich unit. The source of C ischaracterized by a distinct C-isotopic composition andCO2/3He ratio that allows for the calculation of the con-tribution of C from a carbonate component (L) and anorganic sediment component (S). Each subducted unit hasa distinct ratio of C derived from carbonate and from or-ganic C (the L/S ratio) that can be calculated from its C-isotopes and appropriate endmemebers following Sanoand Marty (1995). Additionally, the amount of C deliv-ered by each unit to the subduction zone has been esti-mated by Li and Bebout (2005). By knowing the L/S ra-tio of gas emissions and the flux of CO2 out of the arc, deLeeuw et al. (2007) are able to make a more robust esti-mate of how much C is contributed from each unit to sat-isfy the output flux and L/S ratios measured at the vol-canic arc. A major finding of this work is that, based onthe L/S ratio of the subducting units, no C is contributedfrom the oceanic basement to satisfy the output in El Sal-
vador or any other part of the volcanic front. Using thisnew approach, about 29% of the CO2 stored in the sedi-mentary pile of the incoming plate is released througharc volcanism, the remainder (about 70%) is either lostin the fore-arc or subducted past the zones of arc magmageneration. In Costa Rica, the recycling efficiency is evenlower, with only about 12% of the sediment hosted CO2released through arc volcanism (de Leeuw et al., 2007).This study shows that as for N2 (Zimmer et al., 2004;Elkins et al., 2006) the efficiency of CO2 recycling var-ies along strike of the Central American arc. Anotherimportant aspect of this work is that for the first time, thevolatile emissions of a back-arc region (Honduras) areinvestigated with respect to CO2 subduction. Althoughgas discharges in Honduras are exclusively low tempera-ture (boiling) and geothermal in nature with significantamount of crustal contamination in most sites, helium iso-tope ratios up to 6 RA are found in the Sula graben(Kennedy et al., 1991) and allow for an evaluation of theCO2–He systematics of the mantle beneath the back-arc.Honduras has a lower slab (L + S) versus mantle (M) con-tribution than El Salvador. The (L + S)/M = 5.7 in Hon-duras compared to 9.4 in El Salvador. The L/S ratio ofboth Honduras and El Salvador is comparable and sug-gests that at least some CO2 in the back-arc is ultimatelyslab-derived (de Leeuw et al., 2007). This slab signaturebehind the volcanic front seems to be unique to CO2 asother geochemical indicators (Ba/La, 87Sr/86Sr (Patino et
Table 5. Calculated nitrogen fluxes for the Nicaraguan volcanic front, in 108 mol/yr from (Elkins et al.,2006)
Note: %S represents the percentage of N derived from subducted sediments. This is calculated using N–He systematic. 71% is the average forCentral America, 85% is for Nicaragua only. See Elkins et al. (2006) for details on the flux calculations.
Nicaragua N flux Sediment-derived N flux (%S = 71%)
Nicaragua CAVA Global arcs (%S = 85%) Nicaragua
N flux (Elkins et al., 2006) 11 7.8 28 9.4Calculated from 3He 9.7 6.9 25 8.2Calculated from SO2 2.9 2.1 7.4 2.5Calculated from CO2, 3He 18 12.8 46 15.3Calculated from CO2, SO2 10.4 7.4 27 1800 8.8
N inputsFischer et al. (2002) 2.3Hilton et al. (2002) 5.5 69Li and Bebout (2005) 7.1Snyder et al. (2003) 92Zimmer et al. (2004):
Minimum 0.49Maximum 1.05
Li and Bebout (2005):Subducted sediment 9.3+ Altered ocean crust 14
[N] = 5 ppm[N] = 50 ppm 62

Volatile fluxes from volcanoes 35
al., 1997; Walker et al., 2000)) show MORB-like signa-tures. There are two possibilities to explain the arc-likesignature in Honduras 1) the slab continues to release CO2at >200 km depth after by-passing the zone of arc magmageneration or 2) the slab signature reflects either entrain-ment of a CO2 charged mantle wedge from the volcanicfront or represents a signature from prior subductionfluxing of the mantle wedge. Based on the L/S ratio andmass balance constraints, de Leeuw et al. (2007) concludethat the CO2 discharging in the back-arc, indeed has aslab sedimentary provenance that has been released intothe mantle wedge at conditions to maintain the L/S ratio.The current data, however, do not allow to distinguishbetween a contemporary slab signature due to entrain-ment of mantle wedge material from above the volcanicfront, or the signature of ancient subduction fluxing ofthis part of the mantle wedge (de Leeuw et al., 2007).Future work on the evolution of the arc system throughtime should help to better distinguish between these twopossibilities. In summary, this across-arc study shows thatthe fate of volatiles in a subduction zone system can bewell constrained when detailed information on the inputand output parameters is available.
CONCLUDING REMARKS AND FUTURE DIRECTIONS
This review has focused on the fluxes of majorvolatiles from volcanic arcs and mid ocean ridges to theatmosphere and hydrosphere. Although a considerabledatabase has been accumulated both on the gas composi-tions as well as the fluxes of gases from volcanoes, thereare still numerous issues that warrant further attention infuture studies. The following is a list of topics where sig-nificant progress could be made:
1. Although it is encouraging that the fluxes of H2O,SO2 and HCl from arc volcanoes are consistent using vari-ous approaches of estimating these fluxes (melt inclu-sions, magma emplacement rates and SO2 flux coupledwith gas chemistry), the estimates of HCl and HF fluxesare still few. Future melt inclusion work should includemeasurements of F in addition to Cl to better constrainthe Cl/F ratio of arc volatiles. The recent work by Saal etal. (2002) on MORBs is an example of the amount ofinformation that can be obtained by such complete vola-tile studies.
2. The number of SO2 flux measurements is seriouslyskewed towards volcanoes that are easily accessible andalready have been studied for decades (i.e., Masaya, Nica-ragua and Etna, Italy). There still remain a number of arcsthat have only a couple of measurements during non-eruptive periods (i.e., Papua New Guinea, NorthernMarianas, Aleutians, Chile). Recent satellite remote sens-ing techniques should focus on these remote areas to bet-ter quantify passive degassing fluxes and variations
through time and level of volcanic activity.3. The number of data (volatile abundances and
fluxes) from arcs and MORs vastly exceeds those fromback-arcs and fore-arcs. Knowledge of the fore-arc andback-arc degassing fluxes is important for the assessmentof volatile mass balances between the Earth’s surface andinterior. In particular for H2O such information is criticalin order to investigate if up 70% of the subducted wateris transferred from the oceanic crust to the cool part ofthe mantle wedge to form serpentinite (Schmidt and Poli,1998) and how much of the remaining H2O is not releasedin the back-arc but subducted into the deep mantle.
4. Studies that focus on one well-constrained arc sys-tem are invaluable to correlate volatiles with other pa-rameters (geochemical, geophysical and petrological). Avast amount of data has accumulated for the CentralAmerican arc since the first volatile studies in the 1960’sand we are now making significant progress towards in-corporating volatile studies into the broader frameworkof the subduction zone. Such focused studies also pro-vide better constrains on the input composition and rates(Li and Bebout, 2005).
5. More data are required on the elemental and iso-topic fractionation during the subduction process. Expan-sion of the work of Schmidt and Poli (1998) for H2O andCO2 (Kerrick and Connolly, 2001) to N, S, Cl and F wouldprovide important constraints on the efficiency of vola-tile release during subduction which could then be re-lated to the emissions through arc volcanism.
Acknowledgments—I would like to thank K. Notsu for theinvitation to contribute this review. This work has been par-tially supported by the NSF MARGINS program and NSF EAR.Data compiled by Y. Taran for the Kuriles are very valuableand I would like to thank him for making these available. Help-ful comments by J. Yamamoto and an anonymous reviewergreatly improved an earlier version of this manuscript.
REFERENCES
Allard, P. (1992) Global Emissions of helium-3 by subarealvolcanism. Geophys. Res. Lett. 19, 1479–1481.
Alt, J. C., Saltzman, E. S. and Price, D. A. (1985) Anhydrite inhydrothermally altered basalts; Deep Sea Drilling ProjectHole 504B, Leg 83. Initial Reports of the Deep Sea Drill-ing Project 83 283–287.
Andres, R. J. and Kasgnoc, A. D. (1998) A time-averaged in-ventory of subaerial volcanic sulfur emissions. J. Geophys.Res. 103, 25251–25261.
Bebout, G. E. (1996) Volatile transfer and recycling at conver-gent margins: mass-balance and insights from High-P/Tmetamorphic rocks. Subduction: Top to Bottom (Bebout, G.E., Scholl, D. W., Kirby, S. H. and Platt, J. P., eds.), Geo-physical Monograph 96, American Geophys. Union.
Berner, R. A. and Lasaga, A. C. (1989) Modeling thegeochemical carbon cycle. Sci. Am. 260, 74–81.

36 T. P. Fischer
Berresheim, H. and Jaeschke, W. (1983) The contributions ofvolcanoes to the global atmospheric sulfur budget. J.Geophys. Res. 88, 3732–3740.
Bluth, G. J. S., Schnetzler, C. C., Krueger, A. J. and Walter, L.S. (1993) The contribution of explosive volcanism to glo-bal atmospheric sulphur dioxide concentrations. Nature 366,327–329.
Carmichael, I. S. E. (2002) The andesite aqueduct: perspec-tives on the evolution of intermediate magmatisim in west-central (105–99°W) Mexico. Contrib. Mineral. Petrol. 143,641–663.
Carr, M. J. (1984) Symmetrical and segmented variation ofphysical and geochemical characteristics of the CentralAmerican Volcanic front. J. Volcanol. Geotherm. Res. 20,231–252.
Carr, M. J., Feigenson, M. D. and Bennett, E. A. (1990) Incom-patible element and isotopic evidence for tectonic controlof source mixing and melt extraction along the CentralAmerican arc. Contrib. Mineral. Petrol. 105, 369–380.
Carr, M. J., Feigenson, M. D., Patino, L. C. and Walker, J. A.(2003) Volcanism and geochemistry in Central America.Inside the Subduction Factory (Eiler, J. M., ed.), Geophysi-cal Monograph Series.
Carr, M. J., Saginor, I., Alvarado, G., Bolge, L. L., Lindsay, F.N., Milidakis, K., Turrin, B. D., Feigenson, M. D. andSwisher, C. C., III (2007) Element fluxes from the volcanicfront of Nicaragua and Costa Rica. Geochem. Geophys.Geosyst. 8, Q06001, doi:10.1029/2006GC001396.
Craig, H., Clarke, W. B. and Beg, M. A. (1975) Excess 3He indeep water on the East Pacific Rise. Earth Planet. Sci. Lett.26, 125–132.
Crisp, J. A. (1984) Rates of magma emplacement and volcanicoutput. J. Volcanol. Geotherm. Res. 20, 177–211.
de Leeuw, G. A. M., Hilton, D. R., Fischer, T. P. and Walker, J.A. (2007) The He–CO2 isotope and relative abundance char-acteristics of geothermal fluids in El Salvador and Hondu-ras: new constraints on volatile mass balance of the CentralAmerican Volcanic Arc. Earth Planet. Sci. Lett. 158, 132–146.
Dimalanta, C., Taira, A., Yumul, G. P., Tokuyama, H. andMochizuki, K. (2002) New rates of western Pacific islandarc magmatism from seismic and gravity data. Earth Planet.Sci. Lett. 202, 105–115.
Elkins, L., Fischer, T. P., Hilton, D. R., Sharp, Z. D., McKnight,S. and Walker, J. A. (2006) Tracing nitrogen in volcanicand geothermal volatiles from the Nicaraguan volcanicfront. Geochim. Cosmochim. Acta 70, 5215–5235.
Fischer, T. P. and Marty, B. (2005) Volatiles in the sub-arc man-tle: insights from volcanic and hydrothermal gas emissions.J. Volcanol. Geotherm. Res. 140, 205–216.
Fischer, T. P., Giggenbach, W. F., Sano, Y. and Williams, S. N.(1998) Fluxes and sources of volatiles discharged fromKudryavy, a subduction zone volcano, Kurile Islands. EarthPlanet. Sci. Lett. 160, 81–96.
Fischer, T. P., Hilton, D. R., Zimmer, M. M., Shaw, A. M., Sharp,Z. D. and Walker, J. A. (2002) Subduction and recycling ofnitrogen along the Central American margin. Science 297,1154–1157.
Fischer, T. P., Shaw, A. M. and Hilton, D. R. (2007) Gas
geochemistry of volcanic and hydrothermal fluids of Cen-tral America. Central America: Geology, Resources andHazards (Bundscuh, J. and Alvarado, G., eds.), Taylor andFrancis.
Fyfe, W. S. and McBirney, A. R. (1975) Subduction and thestructure of andesite volcanic belts. Am. J. Sci. 275-A, 285–297.
Galle, B., Oppenheimer, C., Geyer, A., McGonigle, A. J. S.,Edmonds, M. and Horrocks, L. (2002) A miniaturised ul-traviolet spectrometer for remote sensing of SO2 fluxes; anew tool for volcano surveillance. J. Volcanol. Geotherm.Res. 119, 241–254.
Gerlach, T. and Doukas, M. (1994) Sulfur dioxide scrubbingby water in volcanoes and implications for volcano hazardsassesment based on sulfur dioxide fluxes (abs.). Abstractswith Programs 26, 453.
Giggenbach, W. F. (1992) Isotopic shifts in waters fromgeothermal and volcanic systems along convergent plateboundaries and their origin. Earth Planet. Sci. Lett. 113,495–510.
Giggenbach, W. F. (1996) Chemical composition of volcanicgases. IAVCEI-UNESCO: Monitoring and Mitigation ofVolcano Hazards (Tilling, R. and Scarpa, R., eds.), Springer-Verlag, Berlin Heidelberg.
Giggenbach, W. F. and Matsuo, S. (1991) Evaluation of resultsfrom second and third IAVCEI field workshop on volcanicgases, Mt. Usu, Japan and White Island, New Zealand. Appl.Geochem. 3, 125–141.
Giggenbach, W. F., Tedesco, D., Sulisiyo, Y., Caprai, A., Cioni,R., Favara, R., Fischer, T. P., Hirabayashi, J., Korzhinsky,M., Martini, M., Menyailov, I. and Shinohara, H. (2001)Evaluation of results from Forth and Fifth IAVCEI FieldWorkshop on Volcanic Gases, Vulcano Island, Italy and Java,Indonesia. J. Volcanol. Geotherm. Res. 108, 283–302.
Goff, F. and McMurtry, G. M. (2000) Tritium and stable iso-topes of magmatic waters. J. Volcanol. Geotherm. Res. 97,347–396.
Graf, H.-F., Feichter, J. and Langmann, B. (1997) Volcanicsulfur emissions: Estimates of source strength and its con-tribution to the global sulfate distribution. J. Geophys. Res.102, 10727–10738.
Halmer, M. M., Schminke, H.-U. and Graf, H.-F. (2002) Theannual volcanic gas input into the atmosphere, in particularinto the stratosphere: a global data setfor the past 100 years.J. Volcanol. Geotherm. Res. 115, 511–528.
Hilton, D. R., Fischer, T. P. and Marty, B. (2002) Noble gasesand volatile recycling at subduction zones. Noble Gases inCosmochemistry and Geochemistry (Porcelli, D., Ballentine,C. J. and Wieler, R., eds.), Mineralogical Society ofAmerica, Washington, D.C.
Ito, E., Harris, D. M. and Anderson, A. T. (1983) Alteration ofoceanic crust and geologic recycling of chlorine and water.Geochim. Cosmochim. Acta 47, 1613–1624.
Jambon, A. and Zimmermann, J. L. (1990) Water in oceanicbasalts; evidence for dehydration of recycled crust. EarthPlanet. Sci. Lett. 101, 323–331.
Kazahaya, K., Shinohara, H., Uto, K., Odai, M., Nakahori, Y.,Mori, H., Iino, H., Miyashita, M. and Hirabayashi, J. (2004)Gigantic SO2 emission from Miyakejima volcano, Japan,

Volatile fluxes from volcanoes 37
casued by caldera collapse. Geology 32, 425–428.Kennedy, B. M., Hiyagon, H. and Reynolds, J. H. (1991) No-
ble gases from Honduras geothermal sites. J. Volcanol.Geotherm. Res. 45, 29–39.
Kerrick, D. M. (2001) Present and past nonanthropogenic CO2degassing from the solid earth. Rev. Geophys. 39, 565–585.
Kerrick, D. M. and Connolly, J. A. D. (2001) Metamorphicdevolatilization of subducted marine sediments and thetransport of volatiles into the Earth’s mantle. Nature 411,293–296.
Khokhar, M. F., Frankenberg, C., van Roozendael, M., Beirle,S., Kuhl, S., Richter, A., Platt, U. and Wagner, T. (2005)Satellite observations of atmospheric SO2 from volcaniceruptions during the time-period of 1996–2002. Advancesin Space Research Atmospheric Remote Sensing: Earth’sSurface, Troposphere, Stratosphere and Mesosphere-I 36,879–887.
Leeman, W. P. and Carr, M. J. (1995) Geochemical constrainson subduction processes in the Central American VolcanicArc: Implications of bororn geochemistry. Geol. Soc. Am.Spec. Paper 295, 57–73.
Leeman, W. P., Carr, M. J. and Morris, J. D. (1994) BoronGeochemistry of the Central American Volcanic Arc: Con-strains on the genesis of subduction-related magmas.Geochim. Cosmochim. Acta 58, 149–168.
Li, L. and Bebout, G. E. (2005) Carbon and nitrogengeochemistry of sediments in the Central American con-vergent margin: insights regarding paleoproductivity andcarbon and nitrogen subduction fluxes. J. Geophys. Res. 110,10.1029/2004JB003276.
Marty, B. (1995) Nitrogen content of the mantle inferred fromN2/Ar correlations in oceanic basalts. Nature 377, 326–329.
Marty, B. and Jambon, A. (1987) C/3He in volatile fluxes fromthe solid earth: Implications for carbon geodynamics. EarthPlanet. Sci. Lett. 83, 16–26.
Marty, B. and Tolstikhin, I. N. (1998) CO2 fluxes from mid-ocean ridges, arcs and plumes. Chem. Geol. 145, 233–248.
Menyailov, I. A., Nikitina, L. P., Shapar, V. N., Rozhkov, A. M.and Miklishansky, A. Z. (1986) Chemical composition andmetal content in gas discharges from the 1981 eruption ofAlaid volcano, Kuril Islands. Volcanol. Seismol. 1, 26–31.
Minister, J. B. and Jordan, T. H. (1978) Present-day plate mo-tions. J. Geophys. Res. 83, 5331–5354.
Moffat, A. J., Kakara, T., Akimoto, T. and Langan, L. (1972)Air Note. Environmental Measurements, San Francisco.
Morris, J. D., Leeman, W. P. and Tera, F. (1990) The subductedcomponent in island arc lavas: Constrains from Be isotopesand Be–B systematics. Nature 344.
Ohba, T., Hirabayashi, J. and Yoshida, M. (1994) Equilibriumtemperatures and redox state of volcanic gas at Unzen vol-cano, Japan. J. Volcanol. Geotherm. Res. 60, 263–272.
Patino, L. C., Carr, M. J. and Feigenson, M. D. (1997) Cross-arc geochemical variations in volcanic fields in Honduras,C.A.: progressive changes in source with distance from thevolcanic front. Contrib. Mineral. Petrol. 129, 341–351.
Patino, L. C., Carr, M. J. and Feigenson, M. D. (2000) Localand regional variations in Central American arc lavas con-trolled by variations in subducted sediment input. Contrib.Mineral. Petrol. 138, 265–283.
Peacock, S. M. (1990) Fluid processes in subduction zones.Science 248, 329–337.
Poorter, R. P. E., Varekamp, J. C., Poreda, R. J., Van Bergen,M. J. and Kruelen, R. (1993) Chemical and isotopic com-positions of volcanic gases from the East Sunda and BandaArcs, Indonesia. Geochim. Cosmochim. Acta 55, 3795–3807.
Proti, M., Gendel, F. and Mc Nally, K. (1995) Correlation be-tween the age of the subducting Cocos plate and the geom-etry of the Wadati-Benioff zone under Nicaragua and CostaRica. Geologic and Tectonic Development of the CaribbeanPlate Boundary in Southern Central America (Mann, P.,ed.), Geol. Soc. Am. Special Paper, Boulder, CO.
Roggensack, K., Hervig, R. L., McKnight, S. B. and Williams,S. N. (1997) Explosive basaltic volcanism from Cerro Ne-gro Volcano: Influence of volatiles on eruptive style. Sci-ence 277, 1639–1642.
Rowe, G. L., Jr., Brantley, S. L., Fernandez, M., Fernandez, J.F., Borgia, A. and Barquero, J. (1992) Fluid-volcano inter-action in an active stratovolcano: the crater lake system ofPoás volcano, Costa Rica. J. Volcanol. Geotherm. Res. 49,23–52.
Saal, A., Hauri, E. H., Langmuir, C. H. and Perfit, M. (2002)Vapor undersaturation in primitive mid-ocean ridge basaltand the volatile content of the Earth’s upper mantle. Nature419, 451–455.
Sano, Y. and Marty, B. (1995) Origin of carbon in fumarolicgas from island arcs. Chem. Geol. 119, 265–274.
Sano, Y. and Williams, S. N. (1996) Fluxes of mantle andsubducted carbon along convergent plate boundaries.Geophys. Res. Lett. 23, 2749–2752.
Sano, Y., Takahata, N., Nishio, Y. and Marty, B. (1998) Nitro-gen recycling in subduction zones. Geophys. Res. Lett. 25,2289–2292.
Sano, Y., Takahata, N., Nishio, Y., Fischer, T. P. and Williams,S. N. (2001) Volcanic flux of nitrogen from the Earth. Chem.Geol. 171, 263–271.
Schmidt, M. W. and Poli, S. (1998) Experimentally based wa-ter budgets for dehydrating slabs and consequences for arcmagma generation. Earth Planet. Sci. Lett. 163, 361–379.
Shaw, A. M., Hilton, D. R., Fischer, T. P., Walker, J. A. andAlvarado, G. (2003) Contrasting He–C relationships inNicaragua and Costa Rica: insights into C cycling throughsubduction zones. Earth Planet. Sci. Lett. 214, 499–513.
Sisson, T. W. and Layne, G. D. (1993) H2O in basalt and basal-tic andesite glass inclusions from four subduction relatedvolcanoes. Earth Planet. Sci. Lett. 117, 619–635.
Sisson, T. W. and Bronto, S. (1998) Evidence for pressure-release melting beneath magmatic arcs from basalt atGalunggung, Indonesia. Nature 391, 883–886.
Snyder, G., Poreda, R., Hunt, A. and Fehn, U. (2001) Regionalvariations in volatile composition: Isotopic evidence forcarbonate recycling in the Central American volcanic arc.G-cubed 2, 2001GC000163.
Snyder, G., Poreda, R. J., Fehn, U. and Hunt, A. (2003) Sourcesof nitrogen and methane in Central American geothermalsettings: Noble gas and 129I evidence for crustal and mag-matic volatile components. G-cubed 4, 9001, doi:10.1029/2002GC000363.
Sobolev, A. V. and Chaussidon, M. (1996) H2O concentrations

38 T. P. Fischer
in primary melts from supra-subduction zones and mid-ocean ridges: implications for H2O storage and recyclingin the mantle. Earth Planet. Sci. Lett. 137, 45–55.
Stoiber, R. E. and Jepsen, A. (1973) Sulfur dioxide contribu-tions to the atmosphere by volcanoes. Science 182, 577–578.
Stoiber, R. E. and Rose, W. I., Jr. (1970) The geochemistry ofCentral American volcanic gas condensates. Geol. Soc. Am.,Bull. 81, 2891–2911.
Stoiber, R. E., Williams, S. N. and Hubert, B. J. (1987) Annualcontribution of sulfur dioxide to the atmosphere by volca-noes. J. Volcanol. Geotherm. Res. 33, 1–8.
Symonds, R. B., Rose, W. I., Gerlach, T. M., Briggs, P. H. andHarmon, R. S. (1990) Evaluation of gases, condensates, andSO2 emissions from Augustine Volcano, Alaska; thedegassing of a Cl-rich volcanic system. Bull. Volcanol. 52,355–374.
Symonds, R. B., Rose, W. I., Bluth, G. J. S. and Gerlach, T. M.(1994) Volcanic-gas studies: Methods, results, and applica-tions. Volatiles in Magmas (Carroll, M. R. and Holloway, J.R., eds.), American Mineralogical Society, Fredericksburg,Virginia.
Taran, Y. A. and Korablev, A. N. (1995) Chemical and isotopiccomposition of fumarolic gases from South Kurils volca-noes in 1992–1994. Abs. Volcano-Atmos. Interaction, Ha-waii.
Taran, Y. A., Kirsanova, T. P., Esikov, A. D. and Vakin, E. A.(1987) Isotopic composition of water in fumarolic gases ofsome Kamchatkan volcanoes. Izv. Acad. Nauk USSR, Geol-ogy 9, 124–127.
Taran, Y. A., Hedenquist, J. W., Korzhinsky, M. A., Tkachenko,S. I. and Shmulovich, K. I. (1995) Geochemistry of mag-matic gases from Kudriavy volcano, Iturup, Kuril Islands.Geochim. Cosmochim. Acta 59, 1749–1761.
Varekamp, J. C., Kreulen, R., Poorter, R. P. E. and Van Bergen,M. J. (1992) Carbon sources in arc volcanism, with impli-cations for the carbon cycle. Terra Nova 4, 363–373.
von Huene, R., Aubouin, J., Azema, J., Blackinton, G.,Coulbourn, W. T., Cowan, D. S., Curiale, J. A., Dengo, C.A., Faas, R. W., Harrison, W., Hesse, R., Hussong, D. M.,Laad, J. W., Muzylov, N., Shiki, T., Thompson, P. R.,Westberg, J. and Carter, J. A. (1980) Leg 67; the Deep SeaDrilling Project Mid-America Trench transect off Guate-mala. Geol. Soc. Am. Bull. 91, 1421–1432.
Walker, J. A., Patino, L. C., Cameron, B. I. and Carr, M. J.(2000) Petrogenetic insights provided by compositionaltransects across the Central American arc: SoutheasternGuatemala and Honduras. J. Geophys. Res. 105, B8, 18949–18964.
Wallace, P. J. (2005) Volatiles in subduction zone magmas: con-centrations and fluxes based on melt inclusion and volcanicgas data. J. Volcanol. Geotherm. Res. 140, 217–240.
Zhang, Y. X. and Zindler, A. (1993) Distribution and evolutionof carbon and nitrogen in Earth. Earth Planet. Sci. Lett.117, 331–345.
Zimmer, M. M., Fischer, T. P., Hilton, D. R., Alvarado, G. E.,Sharp, Z. D. and Walker, J. A. (2004) Nitrogen systematicsand gas fluxes of subduction zones: insights from Costa Ricaarc volatiles. Geochem. Geophys. Geosyst. 5, doi:10.1029/2003GC000651.