flying on demand - airbus · global market forecast 2014- 2033 . bob lange . head of market and...
TRANSCRIPT

© AIRBUS all rights reserved. Confidential and proprietary document. © AIRBUS all rights reserved. Confidential and proprietary document.
Flying on Demand Deutsche Bank Toulouse, 22nd January 2015
Global Market Forecast 2014-2033
Bob Lange Head of Market and Product Strategy

© AIRBUS all rights reserved. Confidential and proprietary document.
Aviation’s benefit -
23 minutes
2 hours
4 – 12 hours
20 hours
The first commercial flight was 100 years ago
© AIRBUS all rights reserved. Confidential and proprietary document.
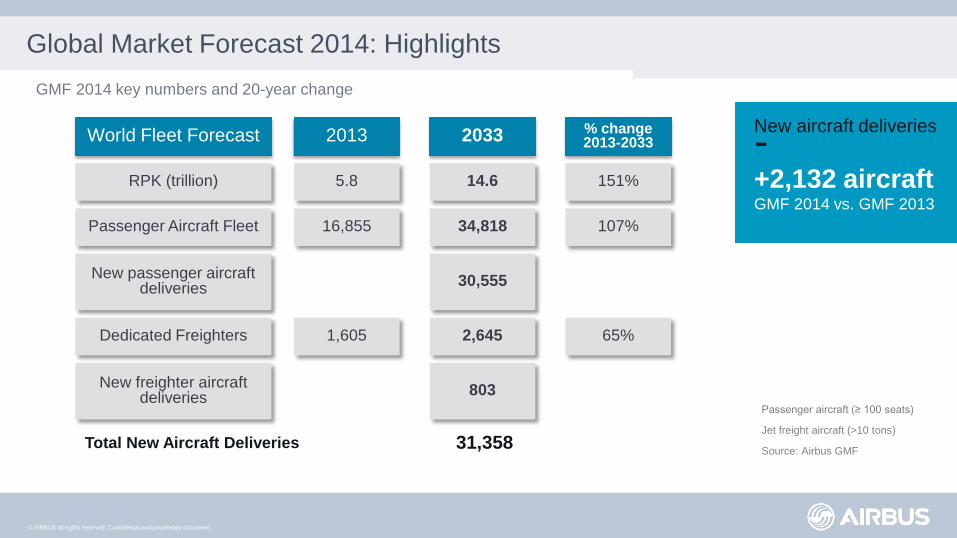
Global Market Forecast 2014: Highlights GMF 2014 key numbers and 20-year change
World Fleet Forecast 2013 2033 % change 2013-2033
RPK (trillion) 5.8 14.6 151%
Passenger Aircraft Fleet 16,855 34,818 107%
New passenger aircraft deliveries 30,555
Dedicated Freighters 1,605 2,645 65%
New freighter aircraft deliveries 803
Passenger aircraft (≥ 100 seats)
Jet freight aircraft (>10 tons)
Source: Airbus GMF
New aircraft deliveries - +2,132 aircraft GMF 2014 vs. GMF 2013
Total New Aircraft Deliveries 31,358

© AIRBUS all rights reserved. Confidential and proprietary document.
20-year demand for 31,358 new passenger and freight aircraft
Passenger aircraft (≥ 100 seats)
Jet freight aircraft (>10 tons)
Source: Airbus GMF
20-year new deliveries of passenger and freight aircraft
Market Value of - $4.6 trillion
22,071 single-aisle aircraft
7,786 twin-aisle aircraft
1,501 very large aircraft
31,358 new aircraft

© AIRBUS all rights reserved. Confidential and proprietary document.
Single-aisle: 70% of units; Wide-bodies: 55% of value
Passenger aircraft (≥ 100 seats) and jet freight aircraft (>10 tons)
Source: Airbus
31,400 New Deliveries GMF 2014 -2033
0
4,000
8,000
12,000
16,000
20,000
24,000
Single-aisle Twin-aisle Very Large Aircraft
1,500
7,800
22,100
70% 25% 5% % units
45% 44% 11% % value
20-year new deliveries of passenger and freighter aircraft

© AIRBUS all rights reserved. Confidential and proprietary document.
0
5
10
15
20
25
1980 1985 1990 1995 2000 2005 2010
Inflation-adjusted average yields have stabilised
Cents per RPK in 2013 US$
Source: ICAO, IATA, Airbus
Fairly stable

© AIRBUS all rights reserved. Confidential and proprietary document.
More movements, more connectivity….
Source: OAG, Airbus
Airport movements Airport connectivity
0
2,000
4,000
6,000
8,000
10,000
12,000
14,000
16,000
18,000
20,000
1980 1983 1986 1989 1992 1995 1998 2001 2004 2007 2010 2013
Avg. number of movements per airport Avg. number of destinations per airport
0
2
4
6
8
10
12
14
1980 1983 1986 1989 1992 1995 1998 2001 2004 2007 2010 2013
x2.4 x1.8

© AIRBUS all rights reserved. Confidential and proprietary document.
More seats per aircraft, and more of them filled
Source: OAG, Ascend, Airbus
Offered seats per aircraft
0
50
100
150
200
250
1980 1983 1986 1989 1992 1995 1998 2001 2004 2007 2010 2013
Avg. number of offered seats per aircraft (000)
50%
55%
60%
65%
70%
75%
80%
85%
1980 1983 1986 1989 1992 1995 1998 2001 2004 2007 2010 2013
World passenger load factors (%)
Source: ICAO, OAG, Airbus
Load factors
+17.4 percentage
points

© AIRBUS all rights reserved. Confidential and proprietary document.
Less fuel burn, therefore less emissions…
Source: ICAO, IATA, Airbus
Fuel consumption CO2 emissions
0
20
40
60
80
100
120
2000 2002 2004 2006 2008 2010 2012
Kilograms per passenger per trip (avg.) Kilograms per passenger per trip (avg.)
0
50
100
150
200
250
300
350
2000 2002 2004 2006 2008 2010 2012
-31% -31%

© AIRBUS all rights reserved. Confidential and proprietary document.
0
20
40
60
80
100
120
140
160
180
200
1980 1985 1990 1995 2000 2005 2010 2015 2020 2025 2030 2035 2040
Jan 2015 forecast
Jan 2014 forecast
Short term oil forecast revised down; high oil price consensus over long term
Source: IHS Energy, Airbus
Forecast History
Brent oil price (US$ per bbl.)

© AIRBUS all rights reserved. Confidential and proprietary document.
Aircraft orders are correlated to airlines profitability
Source: Airbus, ICAO
Airlines results & net orders
0
500
1,000
1,500
2,000
2,500
3,000
3,500
-6%
-4%
-2%
0%
2%
4%
6%
8%
1990 1995 2000 2005 2010
Operating marginNet Orders
Operating margin (%) Units

© AIRBUS all rights reserved. Confidential and proprietary document.
Deliveries are much less volatile
Source: Airbus, ICAO
Airlines results & net orders
0
500
1,000
1,500
2,000
2,500
3,000
3,500
-6%
-4%
-2%
0%
2%
4%
6%
8%
1990 1995 2000 2005 2010
Operating marginDeliveriesNet Orders
Operating margin (%) Units

© AIRBUS all rights reserved. Confidential and proprietary document.
Oil Crisis Oil Crisis Gulf Crisis AsianCrisis 9/11 SARS Financial
Crisis
Air travel has proven to be resilient to external shocks
Source: ICAO, Airbus
World traffic - 73% growth through multiple crises over the last ten years
World annual traffic (RPKs - trillions)
0.0
1.0
2.0
3.0
4.0
5.0
6.0
1968 1973 1978 1983 1988 1993 1998 2003 2008 2013

© AIRBUS all rights reserved. Confidential and proprietary document.
-4%
-2%
0%
2%
4%
6%
8%
J M M J S N J M M J S N J M M J S N J M M J S N J M M J S N J M M J S N J M M J S N-4%
-2%
0%
2%
4%
6%
8%
Q1 Q2 Q3 Q4 Q1 Q2 Q3 Q4 Q1 Q2 Q3 Q4 Q1 Q2 Q3 Q4 Q1 Q2 Q3 Q4 Q1 Q2 Q3 Q4 Q1 Q2 Q3 Q4
World real GDPWorld passenger traffic (ASKs)
Passenger traffic is outperforming GDP growth
% (year-over-year)
2008 2009 2010 2011 2012 2013 2014
World real GDP and passenger traffic
Source: IHS Global Insight, Airbus
+5.3%
December 2014 Passenger Traffic

© AIRBUS all rights reserved. Confidential and proprietary document.
A two-speed economic world
* 54 emerging economies
** 32 advanced economies
Source: IHS Global Insight, Airbus
Comparison of year-over-year GDP growth
-4%
-2%
0%
2%
4%
6%
8%
10%
1982 1986 1990 1994 1998 2002 2006 2010 2014 2018
Emerging economies*
Real GDP growth (%) History Forecast Emerging economies will continue to lead the pack
Advanced economies**

© AIRBUS all rights reserved. Confidential and proprietary document.
The World of 2033 will be very different from today
1- US 2- China 3- Japan 4- Germany 5- France 6- UK 7- Brazil 8- Russia 9- Italy 10- India
Source: IHS Global Insight, Airbus
1- China 2- US 3- India 4- Japan 5- Germany 6- UK 7- France 8- Brazil 9- Russia 10- Italy
1- China 2- US 3- India 4- Japan 5- Brazil 6- Germany 7- UK 8- Russia 9- France 10- Indonesia
GDP ranking based on nominal GDP expressed in US$
2013 2023 2033

© AIRBUS all rights reserved. Confidential and proprietary document.
+2.5% US Traffic
Asia-Pacific and other emerging markets are leading traffic growth
+6.5% Asia - Pacific Traffic
+2.6% Western Europe Traffic
% (year-over-year)
+9.4% Emerging Markets Traffic
ASKs year-over-year monthly evolution
2009 2010 2011 2012 2013 2014 Source: OAG, Airbus
-12%
-8%
-4%
0%
4%
8%
12%
16%
J M M J S N J M M J S N J M M J S N J M M J S N J M M J S N J M M J S N

© AIRBUS all rights reserved. Confidential and proprietary document.
In-service fleet
Emerging economies are driving future growth
Source: IHS Global Insight, Airbus
* Nominal GDP in US$
Emerging economies (54 countries) All other countries (150 countries)
38%
50% 54%
36%
GDP
59%
42%
Passengers trips
2033
Today
Population
69%
67%
© AIRBUS all rights reserved. Confidential and proprietary document.
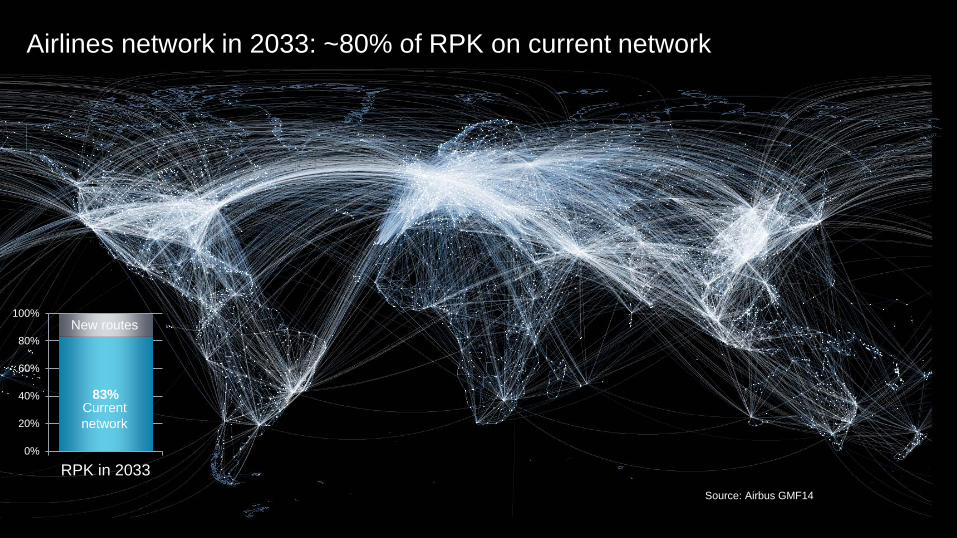
Airlines network in 2033: ~80% of RPK on current network
83%
0%
20%
40%
60%
80%
100%
RPK in 2033
Current network
New routes
Source: Airbus GMF14

© AIRBUS all rights reserved. Confidential and proprietary document. September 14
Emerging regions will account for the largest share of origin and destination traffic worldwide
Source: ICAO, Sabre GDD, Airbus GMF
0
2
4
6
8
10
12
14
16
2003 2005 2007 2009 2011 2013 2015 2017 2019 2021 2023 2025 2027 2029 2031 2033
World annual RPK (trillion)
2.6% p.a. Advanced – Advanced
5.0% p.a. Emerging – Advanced
6.8% p.a. Emerging – Emerging
Airbus GMF 2014
ICAO total traffic

© AIRBUS all rights reserved. Confidential and proprietary document.
Air transport growth is highest in expanding regions
Billions of people will increasingly want to travel by air
China India Middle East Asia Africa CIS Latin America Eastern Europe
Western Europe North America Japan
Yearly RPK growth 2014 - 2033
1 billion
people 2014
6.2 billion
people 2014
Em
ergi
ng/D
evel
opin
g A
dvan
ced
+6.0 %
+4.2 %
© AIRBUS all rights reserved. Confidential and proprietary document.
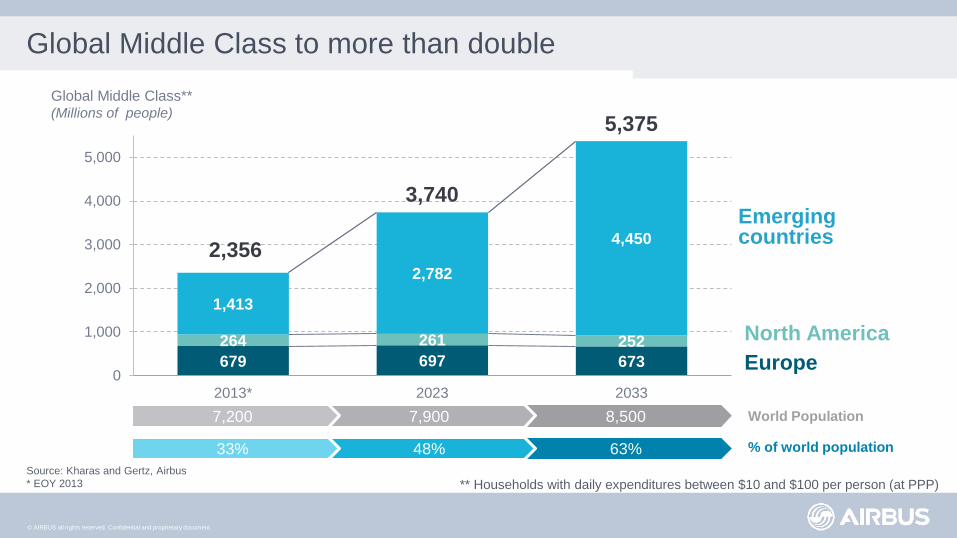
Global Middle Class to more than double
679 697 673 264 261 252
1,413
2,782
4,450
0
1,000
2,000
3,000
4,000
5,000
2013* 2023 2033
Global Middle Class** (Millions of people)
Emerging countries
World Population
% of world population
8,500
63%
7,900
48%
7,200
33% Source: Kharas and Gertz, Airbus * EOY 2013 ** Households with daily expenditures between $10 and $100 per person (at PPP)
3,740
2,356
5,375
North America Europe

© AIRBUS all rights reserved. Confidential and proprietary document.
0.01
0.10
1.00
10.00
0 20 40 60 80
Page 23
North Americans and Europeans are the most willing to fly
2/3 of the population of the emerging countries will take a trip a year in 2033
2013 trips per capita
2013 GDP per capita (thousands $US)
Europe ~1 trip per capita
India 2013 0.06 trips per capita
China 2013 0.25 trips per capita
October 2014 Airbus Global Market Forecast 2014 - Presentation to AAL
Source: Sabre (annualized September 2013 data), IHS Global Insight, Airbus |
*Passengers originating from respective country
Bubble size proportional to population
North America 1.6 trips per capita
© AIRBUS all rights reserved. Confidential and proprietary document.
0.01
0.10
1.00
10.00
0 20 40 60 80
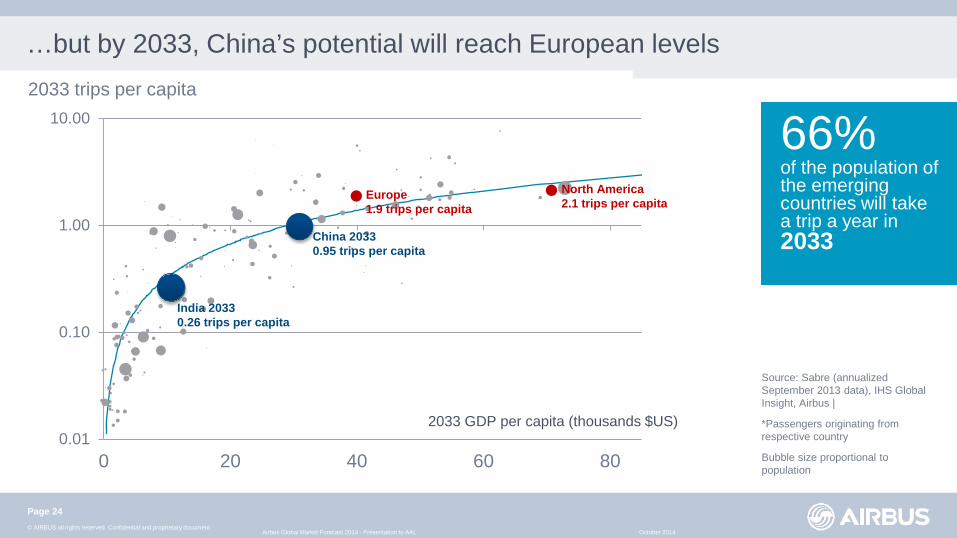
…but by 2033, China’s potential will reach European levels
Source: Sabre (annualized September 2013 data), IHS Global Insight, Airbus |
*Passengers originating from respective country
Bubble size proportional to population
66% of the population of the emerging countries will take a trip a year in 2033
2033 trips per capita
2033 GDP per capita (thousands $US)
India 2033 0.26 trips per capita
China 2033 0.95 trips per capita
Page 24
October 2014 Airbus Global Market Forecast 2014 - Presentation to AAL
North America 2.1 trips per capita
Europe 1.9 trips per capita

© AIRBUS all rights reserved. Confidential and proprietary document.
Long-haul traffic grows stronger than short haul traffic
Source: OAG
* Long haul traffic: flight distance >2,000nm
Evolution of long-haul vs short-haul traffic (ASKs), 1973-2013, (Base 100 in 1973)
0
100
200
300
400
500
600
700
800
900
1000
1973 1978 1983 1988 1993 1998 2003 2008 2013
Long-haul traffic has grown 1% p.a. faster than short-haul
x6.2
Short-haul traffic
x9.1
Long-haul traffic

© AIRBUS all rights reserved. Confidential and proprietary document.
Long-haul traffic consolidation
Source: OAG, Airbus
* Long haul traffic: flight distance >2,000nm
Evolution of traffic per long-haul airline (ASKs), 1973-2013, (Base 100 in 1973)
ASK per airline have nearly quadrupled since 1973
0
50
100
150
200
250
300
350
400
1973 1978 1983 1988 1993 1998 2003 2008 2013
ASKs per Airline
Number of Airlines

© AIRBUS all rights reserved. Confidential and proprietary document.
Urbanisation to increase
49%
60%
67%
0%
10%
20%
30%
40%
50%
60%
70%
80%
-
1
2
3
4
5
6
7
8
9
10
1950 1960 1970 1980 1990 2000 2010 2020 2030 2040 2050
RuralUrbanUrban share
billion History Forecast
Urban population: 1.3bn 2.3bn 3.5bn 5.0bn 6.4bn
World population and share of urban agglomeration evolution
Source: UN population division, Airbus

© AIRBUS all rights reserved. Confidential and proprietary document.
42 Aviation Mega-Cities in 2013
• >50 000 daily long-haul passengers
• >20 000 daily long-haul passengers
• >10 000 daily long-haul passengers
2013 Aviation Mega-Cities
42 Aviation
Mega-cities
Source: McKinsey, UNPD, Airbus GMF
0.8M Daily Passengers: Long Haul traffic to/ from/via Mega
Cities
90%+ of long-haul
traffic on routes to/from/via 42 cities
22% of World
GDP in 2013

© AIRBUS all rights reserved. Confidential and proprietary document.
… and 91 Mega-Cities by 2033
• >50 000 daily long-haul passengers
• >20 000 daily long-haul passengers
• >10 000 daily long-haul passengers
2033 Aviation Mega-Cities
Source: McKinsey, UNPD, Airbus GMF
91 Aviation
Mega-cities
2.2M Daily Passengers: Long Haul traffic to/ from/via Mega
Cities
95%+ of long-haul
traffic on routes to/from/via 91 cities
35% of World
GDP in 2013

© AIRBUS all rights reserved. Confidential and proprietary document.
The bigger the city, the wealthier the population 2013 Aviation Mega-Cities and 2013 GDP per capita (real 2010 $US, thousands)
0
20
40
60
AMC Otherlargecities
Region
North America (12 AMC)
05
10152025
AMC Otherlargecities
Region 0
5
10
15
AMC Otherlargecities
Region
0
20
40
60
AMC Otherlargecities
Region 010203040
AMC Otherlargecities
Region
0
10
20
30
AMC Otherlargecities
Region
010203040
AMC Otherlargecities
Region
Latin America (2 AMC)
Europe (9 AMC)
Africa (1 AMC)
Middle East (4 AMC)
CIS (1 AMC)
Asia-Pacific (13 AMC)
GDP per capita in Aviation Mega-Cities
4x World average
Source: McKinsey, UNPD, IHS Global Insight, Airbus GMF
Other large cities: urban agglomerations with a population above 300,000 people

© AIRBUS all rights reserved. Confidential and proprietary document.
0%
2%
4%
6%
8%
10%
12%
14%
Aviation Mega-City to AviationMega-City
Aviation Mega-City <>Secondary City
Secondary City to SecondaryCity
Routes between Aviation Mega-Cities carry a greater share of premium passengers
Percentage of premium passengers on route types Based on 2012 Aviation Mega-Cities
Source: SABRE, Airbus Market Research and Forecasts| Cities with more than 10,000 daily passengers, Long-haul traffic: flight distance >2,000nm, excl. domestic traffic
13% of passengers betwwen AMCs are Premium customers
© AIRBUS all rights reserved. Confidential and proprietary document.
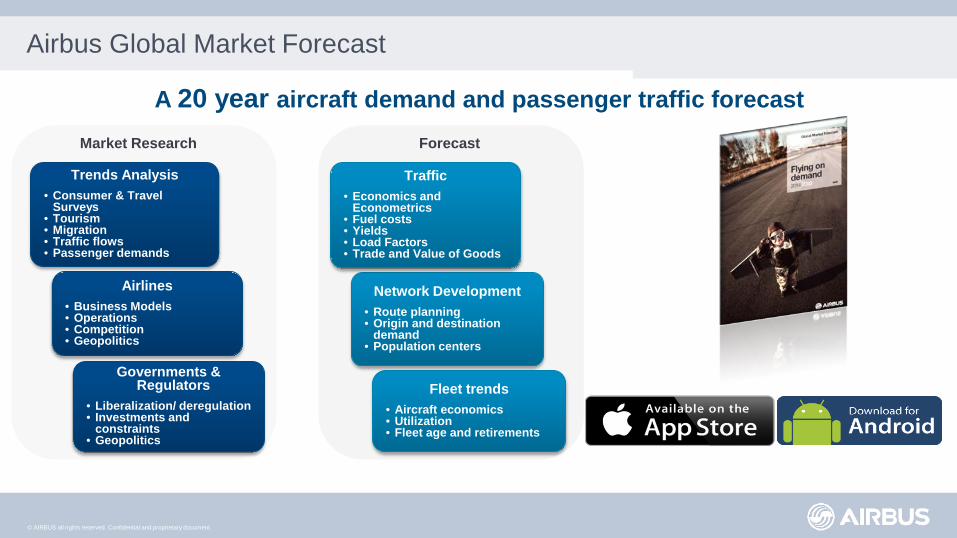
Airbus Global Market Forecast
A 20 year aircraft demand and passenger traffic forecast
Airlines • Business Models • Operations • Competition • Geopolitics
Trends Analysis • Consumer & Travel
Surveys • Tourism • Migration • Traffic flows • Passenger demands
Governments & Regulators
• Liberalization/ deregulation • Investments and
constraints • Geopolitics
Market Research
Network Development • Route planning • Origin and destination
demand • Population centers
Traffic • Economics and
Econometrics • Fuel costs • Yields • Load Factors • Trade and Value of Goods
Fleet trends • Aircraft economics • Utilization • Fleet age and retirements
Forecast

© AIRBUS all rights reserved. Confidential and proprietary document.
Around 800 airlines and their subsidiaries are analysed…
80
44 40 36
92
119
23
43 34
46
18
68
98
58
0
20
40
60
80
100
120
140
Airlines distribution per region
Number of airlines
48%
19%
5%
17%
3% 8%
4% 9%
20%
6% 16%
45%
Global Network Major Network
Small Network LCC
Regional & Affiliate Charter
Installed seats in service (outside circle) Number of airlines (inside circle)
Airlines distribution per type
© AIRBUS all rights reserved. Confidential and proprietary document.
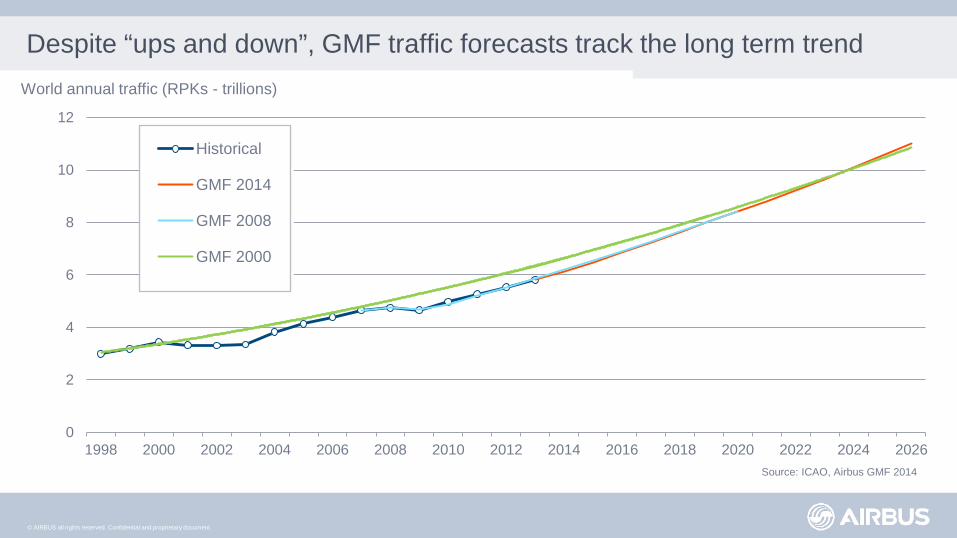
Despite “ups and down”, GMF traffic forecasts track the long term trend
0
2
4
6
8
10
12
1998 2000 2002 2004 2006 2008 2010 2012 2014 2016 2018 2020 2022 2024 2026
Historical
GMF 2014
GMF 2008
GMF 2000
World annual traffic (RPKs - trillions)
Source: ICAO, Airbus GMF 2014

© AIRBUS all rights reserved. Confidential and proprietary document.
Air traffic will double in the next 15 years
Source: ICAO, Airbus GMF 2014
0
2
4
6
8
10
12
14
16
1973 1978 1983 1988 1993 1998 2003 2008 2013 2018 2023 2028 2033
World annual RPK* (trillion) Airbus GMF 2014
ICAO total traffic
4.7%
2013-2033

© AIRBUS all rights reserved. Confidential and proprietary document.
Domestic PRC to become number one within 10 years
* 20-year annual growth rate (CAGR) Source: Airbus GMF
- 500 1,000 1,500 2,000
Sub Sahara Africa - Western EuropeAsia Advanced - Asia Emerging
Asia Emerging - Middle EastIndian Sub-Continent - USA
Central Europe - Western EuropeAsia Emerging - PRCSouth America - USA
Western Europe - South AmericaPRC - USA
Western Europe - PRCDomestic Brazil
Western Europe - Middle EastIndian Sub-Continent - Middle East
Domestic IndiaAsia Emerging - Western Europe
Domestic Asia EmergingWestern Europe - USA
Intra Western EuropeDomestic USADomestic PRC
Billion RPKs 20-year annual growth* 7.1% 1.9% 2.9% 2.9% 6.9% 4.0% 9.5% 6.8% 4.6% 6.0% 5.6% 6.6% 4.3% 5.3% 7.5% 5.4% 6.4% 6.8% 5.6% 4.3%

© AIRBUS all rights reserved. Confidential and proprietary document.
Asia-Pacific to lead in world traffic by 2033
Source: Airbus GMF 2014
RPK traffic by airline domicile (billions)
0 1,000 2,000 3,000 4,000 5,000
Asia-Pacific
Europe
North America
Middle East
Latin America
CIS
Africa
30%
25%
24%
8%
5%
4%
3%
5.7%
3.6%
2.9%
7.1%
5.4%
5.4%
4.7%
% of 2013 world RPK
20-year growth
36%
20%
17%
13%
6%
5%
3%
% of 2033 world RPK
2013 traffic 2014-2033 traffic
20-year world annual traffic growth
4.7%

© AIRBUS all rights reserved. Confidential and proprietary document.
31,400 New
aircraft
6,100
12,400
19,000
0
5,000
10,000
15,000
20,000
25,000
30,000
35,000
40,000
Beginning 2014 2033
Demand for around 31,400 new aircraft
Stay in service
Replacement
Growth
Source: Airbus
Note: Passenger aircraft ≥100 seats, Freighter aircraft ≥10 tonnes
Fleet in service evolution; 2014-2033
18,500
37,500

© AIRBUS all rights reserved. Confidential and proprietary document.
Airbus order backlog by region vs. 20 year market forecast
At end December 2014. Values are rounded.
Does not include orders from undisclosed customers
North America 12%
Latin America
5%
Europe & CIS 17% Middle
East 7%
Africa
1% Asia
Pacific 27%
Lessors
20%
Backlog - 6,386 aircraft worth over $850 billion

© AIRBUS all rights reserved. Confidential and proprietary document.
Backlog today extends 3 to 4 years further in time than before
Share of backlog delivered/scheduled to be delivered
0%
20%
40%
60%
80%
100%
0 1 2 3 4 5 6 7 8 9 10 11 12 13 14 15
1993
2003
2013
Delivery lead time
Backlog today - 40% of the backlog is for delivery beyond 5 years In 2003, this value was 5%
Aircraft above 100 seats
Source: Airbus analysis from ASCEND database

© AIRBUS all rights reserved. Confidential and proprietary document.
Each year, deliveries represent on average 7% of the in service fleet
Source: Airbus analysis from ASCEND database
Aircraft >= 100 seats
Yearly deliveries of aircraft above 100 seats
0%
2%
4%
6%
8%
10%
12%
0
200
400
600
800
1,000
1,200
1,400
1981 1984 1987 1990 1993 1996 1999 2002 2005 2008 2011 2014
Deliveries as % of fleet Deliveries - Estimated ratio for 2015-2018 deliveries is 7.6% of the in-service fleet
© AIRBUS all rights reserved. Confidential and proprietary document.
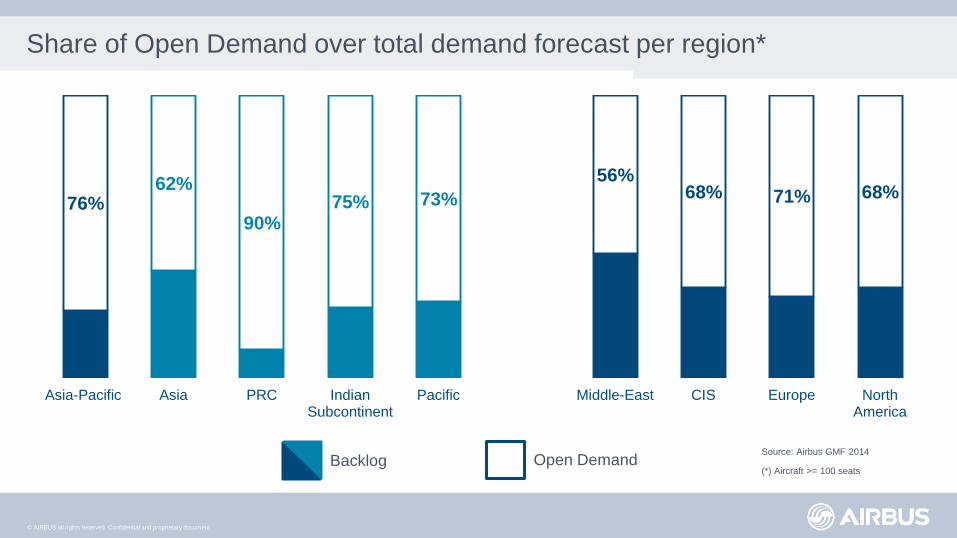
Share of Open Demand over total demand forecast per region*
Source: Airbus GMF 2014
(*) Aircraft >= 100 seats Open Demand Backlog
76% 62%
90% 75% 73%
56% 68% 71% 68%
Asia-Pacific Asia PRC IndianSubcontinent
Pacific Middle-East CIS Europe NorthAmerica

© AIRBUS all rights reserved. Confidential and proprietary document.
Summary
• Strong growth in passenger traffic – resilient growth through a difficult, but improving economic period
• Demand for 31,400 new aircraft by 2033 – ~30,600 passenger aircraft and nearly 800
freighter aircraft
• Replacement of ageing fleets – 20 year demand for 12,400 passenger aircraft for replacement, largely in the single-aisle segment
• Single-aisle aircraft represent 70% of demand in units, but wide-body aircraft represent 55% of value
• VLA demand driven by aviation mega-cities – more than 95%+ of all long-haul passengers will fly to, from or through 91 aviation mega-cities by 2033

© AIRBUS all rights reserved. Confidential and proprietary document.