fmc technologies inc form 10-k annual report filed 2015-02 …
TRANSCRIPT
Business Address5875 N SAM HOUSTONPARKWAY WHOUSTON TX 770862815914000
Mailing Address5875 N SAM HOUSTONPARKWAY WHOUSTON TX 77086
SECURITIES AND EXCHANGE COMMISSION
FORM 10-KAnnual report pursuant to section 13 and 15(d)
Filing Date: 2015-02-20 | Period of Report: 2014-12-31SEC Accession No. 0001135152-15-000004
(HTML Version on secdatabase.com)
FILERFMC TECHNOLOGIES INCCIK:1135152| IRS No.: 364412642 | State of Incorp.:DE | Fiscal Year End: 1231Type: 10-K | Act: 34 | File No.: 001-16489 | Film No.: 15636176SIC: 3533 Oil & gas field machinery & equipment
Copyright © 2014 www.secdatabase.com. All Rights Reserved.Please Consider the Environment Before Printing This Document
UNITED STATESSECURITIES AND EXCHANGE COMMISSION
WASHINGTON, D.C. 20549
FORM 10-K(Mark One)
ý ANNUAL REPORT PURSUANT TO SECTION 13 OR 15(d) OF THE SECURITIES EXCHANGEACT OF 1934
For the fiscal year ended December 31, 2014or
¨ TRANSITION REPORT PURSUANT TO SECTION 13 OR 15(d) OF THE SECURITIESEXCHANGE ACT OF 1934
For the transition period from toCommission file number 001-16489
FMC TECHNOLOGIES, INC.(Exact name of registrant as specified in its charter)
Delaware 36-4412642(State or other jurisdiction of incorporation or organization) (I.R.S. Employer Identification No.)
5875 N. Sam Houston Parkway W.,Houston, Texas 77086
(Address of principal executive offices) (Zip Code)Registrant’s telephone number, including area code: 281/591-4000
Securities registered pursuant to Section 12(b) of the Act:
Title of each class Name of each exchange on which registeredCommon Stock, $0.01 par value New York Stock Exchange
Securities registered pursuant to Section 12(g) of the Act: None
Indicate by check mark if the registrant is a well-known seasoned issuer, as defined in Rule 405 of the Securities Act. YES ý NO ¨Indicate by check mark if the registrant is not required to file reports pursuant to Section 13 or Section 15(d) of the Act. YES ¨ NO ýIndicate by check mark whether the registrant (1) has filed all reports required to be filed by Section 13 or 15(d) of the Securities Exchange Act
of 1934 during the preceding 12 months (or for such shorter period that the registrant was required to file such reports), and (2) has been subject to suchfiling requirements for the past 90 days. YES ý NO ¨
Indicate by check mark whether the registrant has submitted electronically and posted on its corporate website, if any, every Interactive Data Filerequired to be submitted and posted pursuant to Rule 405 of Regulation S-T (§232.405 of this chapter) during the preceding 12 months (or for suchshorter period that the registrant was required to submit and post such files). YES ý NO ¨
Indicate by check mark if disclosure of delinquent filers pursuant to Item 405 of Regulation S-K (§232.405 of this chapter) is not containedherein, and will not be contained, to the best of the registrant’s knowledge, in definitive proxy or information statements incorporated by reference inPart III of this Form 10-K or any amendment to this Form 10-K. ý
Indicate by check mark whether the registrant is a large accelerated filer, an accelerated filer, a non-accelerated filer, or a smaller reportingcompany. See the definitions of “large accelerated filer,” “accelerated filer” and “smaller reporting company” in Rule 12b-2 of the Exchange Act.
Large accelerated filer ý Accelerated filer ¨ Non-accelerated filer ¨ Smaller reporting company ¨
Copyright © 2013 www.secdatabase.com. All Rights Reserved.Please Consider the Environment Before Printing This Document

Indicate by check mark whether the registrant is a shell company (as defined in Rule 12b-2 of the Act). YES ¨ NO ý
The aggregate market value of the registrant’s common stock held by non-affiliates of the registrant, determined by multiplying the outstandingshares on June 30, 2014, by the closing price on such day of $61.07 as reported on the New York Stock Exchange, was $7,923,489,042.*
The number of shares of the registrant’s common stock, $0.01 par value, outstanding as of February 18, 2015 was 231,444,593.DOCUMENTS INCORPORATED BY REFERENCE
DOCUMENT FORM 10-K REFERENCEPortions of Proxy Statement for the 2015 Annual Meeting of Stockholders Part III
* Excludes 105,363,947 shares of the registrant’s Common Stock held by directors, officers and holders of more than 5% of the registrant’s Common Stock as ofJune 30, 2014. Exclusion of shares held by any person should not be construed to indicate that such person or entity possesses the power, direct or indirect, todirect or cause the direction of the management or policies of the registrant, or that such person or entity is controlled by or under common control with theregistrant.
Copyright © 2013 www.secdatabase.com. All Rights Reserved.Please Consider the Environment Before Printing This Document
TABLE OF CONTENTS
Page
PART I
Item 1. Business 4Executive Officers of the Registrant 12Item 1A. Risk Factors 13Item 1B. Unresolved Staff Comments 18Item 2. Properties 19Item 3. Legal Proceedings 19Item 4. Mine Safety Disclosures 19
PART II
Item 5. Market for Registrant’s Common Equity, Related Stockholder Matters and Issuer Purchases of Equity Securities 20Item 6. Selected Financial Data 22Item 7. Management’s Discussion and Analysis of Financial Condition and Results of Operations 23Item 7A. Quantitative and Qualitative Disclosures About Market Risk 45Item 8. Financial Statements and Supplementary Data 46Item 9. Changes in and Disagreements with Accountants on Accounting and Financial Disclosure 93Item 9A. Controls and Procedures 93Item 9B. Other Information 93
PART III
Item 10. Directors, Executive Officers and Corporate Governance 94Item 11. Executive Compensation 94Item 12. Security Ownership of Certain Beneficial Owners and Management and Related Stockholder Matters 94Item 13. Certain Relationships and Related Transactions, and Director Independence 95Item 14. Principal Accounting Fees and Services 95
PART IV
Item 15. Exhibits, Financial Statement Schedules 96Signatures 98
2
Copyright © 2013 www.secdatabase.com. All Rights Reserved.Please Consider the Environment Before Printing This Document
Cautionary Note Regarding Forward-Looking Statements
This Annual Report on Form 10-K contains “forward-looking statements” intended to qualify for the safe harbors from liabilityestablished by the Private Securities Litigation Reform Act of 1995. All statements other than statements of historical fact containedin this report are forward-looking statements within the meaning of Section 27A of the Securities Act of 1933, as amended, andSection 21E of the Securities Exchange Act of 1934, as amended (the “Exchange Act”). Forward-looking statements usually relate tofuture events and anticipated revenues, earnings, cash flows or other aspects of our operations or operating results. Forward-lookingstatements are often identified by the words “believe,” “expect,” “anticipate,” “plan,” “intend,” “foresee,” “should,” “would,” “could,”“may,” “estimate,” “outlook” and similar expressions, including the negative thereof. The absence of these words, however, does notmean that the statements are not forward-looking. These forward-looking statements are based on our current expectations, beliefs andassumptions concerning future developments and business conditions and their potential effect on us. While management believes thatthese forward-looking statements are reasonable as and when made, there can be no assurance that future developments affecting us willbe those that we anticipate.
All of our forward-looking statements involve risks and uncertainties (some of which are significant or beyond our control) andassumptions that could cause actual results to differ materially from our historical experience and our present expectations orprojections. Known material factors that could cause our actual results to differ from those in the forward-looking statements are thosedescribed in Part I, Item 1A “Risk Factors” of this Annual Report on Form 10-K. We wish to caution you not to place undue reliance onany forward-looking statements, which speak only as of the date hereof. We undertake no obligation to publicly update or revise any ofour forward-looking statements after the date they are made, whether as a result of new information, future events or otherwise, exceptto the extent required by law.
3
Copyright © 2013 www.secdatabase.com. All Rights Reserved.Please Consider the Environment Before Printing This Document
PART I
ITEM 1. BUSINESS
OVERVIEW
FMC Technologies, Inc. is a global provider of technology solutions for the energy industry. FMC Technologies, Inc. was incorporatedin November 2000 under Delaware law and was a wholly-owned subsidiary of FMC Corporation until our initial public offering in June2001. Our principal executive offices are located at 5875 North Sam Houston Parkway West, Houston, Texas 77086. As used in thisreport, except where otherwise stated or indicated by the context, all references to the “Company,” “FMC Technologies,” “we,” “us,”and “our” are to FMC Technologies, Inc. and its consolidated subsidiaries.
We design, manufacture and service technologically sophisticated systems and products, including subsea production and processingsystems, surface wellhead production systems, high pressure fluid control equipment, measurement solutions and marine loadingsystems for the energy industry. We report our results of operations in the following reporting segments: Subsea Technologies, SurfaceTechnologies and Energy Infrastructure. Financial information about our business segments is incorporated herein by reference fromNote 19 to our consolidated financial statements included in Part II, Item 8 of this Annual Report on Form 10-K.
During 2012 we acquired the remaining 55% of Schilling Robotics, LLC (“Schilling Robotics”), 100% of Pure Energy Services Ltd.(“Pure Energy”) and 100% of Control Systems International, Inc. (“CSI”). Schilling Robotics is a supplier of advanced roboticintervention products, including a line of remotely operating vehicle systems (“ROV”), manipulator systems and subsea control systemsand is included in our Subsea Technologies segment. Prior to 2012 we owned 45% of Schilling Robotics, and the acquisition of theremaining 55% is allowing us to grow in the expanding subsea environment, where demand for ROVs and the need for maintenanceactivities of subsea equipment is expected to increase. Additionally, we acquired Pure Energy, a provider of flowback services andwireline services. The acquisition of Pure Energy is complementing the existing products and services of our Surface Technologiessegment and is expected to create client value by providing an integrated well site solution. Finally, we acquired CSI, a provider ofautomation, control and information technology to the oil and gas industry. Included in our Energy Infrastructure segment, CSI isenhancing our automation and controls technologies and is benefiting technologies to support our long-term strategy to expand oursubsea production and processing systems. Additional information about our 2012 business combinations is incorporated herein byreference from Note 4 to our consolidated financial statements included in Part II, Item 8 of this Annual Report on Form 10-K.
During 2014 we completed the sale of our equity interests and assets primarily representing a product line of our material handlingbusiness to Syntron Material Handling, LLC, an affiliate of Levine Leichtman Capital Partners Private Capital Solutions II, L.P.Additional financial information is incorporated herein by reference from Note 5 to our consolidated financial statements included inPart II, Item 8 of this Annual Report on Form 10-K.
Our Annual Reports on Form 10-K, Quarterly Reports on Form 10-Q and Current Reports on Form 8-K and amendments to thosereports are available free of charge through our website at www.fmctechnologies.com, under “Investors—Financial Information—SECFilings” as soon as reasonably practicable after we file the reports with the Securities and Exchange Commission (the “SEC”).Alternatively, our reports may be accessed through the website maintained by the SEC at www.sec.gov.
Throughout this Annual Report on Form 10-K, we incorporate by reference certain information from our Proxy Statement for the 2015Annual Meeting of Stockholders. We intend to provide stockholders with an annual report containing financial information that hasbeen examined and reported upon, with an opinion expressed thereon by our independent registered public accounting firm. On or aboutApril 6, 2015, we expect our Proxy Statement for the 2015 Annual Meeting of Stockholders will be available on our website under“Investors—Financial Information—SEC Filings.” Similarly, on the same date, we expect our 2014 Annual Report to Stockholders willbe available on our website under “Investors—Financial Information—Annual Reports.”
4
Copyright © 2013 www.secdatabase.com. All Rights Reserved.Please Consider the Environment Before Printing This Document
BUSINESS SEGMENTS
Subsea Technologies
Subsea Technologies designs and manufactures products and systems and provides services used by oil and gas companies involved indeepwater exploration and production of crude oil and natural gas. The core competencies of this segment are ourtechnology and engineering expertise. Our production systems control the flow of crude oil and natural gas from producing wells. Wespecialize in offshore production systems and have manufacturing facilities near the world’s principal offshore oil and gas producingbasins. We primarily market our products through our own technical sales organization.
Principal Products and Services
Subsea Systems. Our systems are used in the offshore production of crude oil and natural gas. Subsea systems are placed on the seafloorand are used to control the flow of crude oil and natural gas from the reservoir to a host processing facility, such as a floating productionfacility, a fixed platform or an onshore facility.
The design and manufacture of our subsea systems requires a high degree of technical expertise and innovation. Some of our systemsare designed to withstand exposure to the extreme hydrostatic pressure that deepwater environments present, as well as internalpressures of up to 15,000 pounds per square inch (“psi”) and temperatures in excess of 350º F. The development of our integratedsubsea production systems includes initial engineering design studies and field development planning to consider all relevant aspectsand project requirements including optimization of drilling programs and subsea architecture. Our subsea production systems andproducts include drilling systems, subsea trees, chokes and flow modules, manifold pipeline systems, control and data acquisitionsystems, well access systems and other technologies. Additionally, as part of our technologies to enhance field economics bymaximizing recovery, our subsea processing systems can enable cost-effective, platform-less solutions where the field is tied directlyback to an existing offshore facility or directly to shore. Subsea processing system solutions include subsea boosting, subsea gascompression and subsea separation which are designed to accelerate production, increase recovery or extend field life. In order toprovide these products, systems and services, we utilize engineering, project management, procurement, manufacturing, assembly andtesting capabilities.
We also provide well access and flow management services and other customer support services that offer a broad range of products andservices including installation and workover tools, service technicians for installation assistance and field support for commissioning,intervention, and maintenance of our subsea systems throughout the life of the field. This scope of activity also includes providing toolsand technical support such as our riserless light well intervention system for certain well workover and intervention tasks. In 2012 FMCTechnologies formed a joint venture with Edison Chouest Offshore LLC to provide integrated vessel-based subsea services for offshoreoil and gas fields around the world. This joint venture is expected to provide cost-effective solutions to enhance our customer’s ability toinitiate, maintain and increase production from subsea field developments through efficient operations, innovative technologies and abroad inventory of vessels and tools.
Subsea systems represented approximately 63%, 63% and 62% of our consolidated revenue in 2014, 2013 and 2012, respectively.
Schilling Robotics. We design and manufacture ROVs and manipulator arms and provide support services for subsea control systemsfor subsea exploration and production. Our product offering includes electric and hydraulic work-class ROVs, tether-managementsystems, launch and recovery systems, remote manipulator arms and modular control systems for wide-ranging subsea applications. Wealso provide support and services such as product training, pilot simulator training, spare parts, technical assistance and logisticssupport.
Multi Phase Meters. We design and manufacture multiphase and wetgas meters with applications that include production and surfacewell testing, reservoir monitoring, remote operation of entire fields, measurement of fluid rates for production and revenue sharingbetween partners, process monitoring and control, and artificial lift optimization. This technology delivers highly accurate, self-calibrating meters with low maintenance features to meet our customers’ increasing requirements for subsea and topside applications.The Multi Phase Meters product line augments our portfolio of technologies for increasing oil and gas recovery, early water detectionand reservoir optimization.
5
Copyright © 2013 www.secdatabase.com. All Rights Reserved.Please Consider the Environment Before Printing This Document
Capital Intensity
Many of the systems and products we supply for subsea applications are highly engineered to meet the unique demands of ourcustomers’ field properties and are typically ordered one to two years prior to installation. We often receive advance and progresspayments from our customers in order to fund initial development and our working capital requirements. However, our working capitalbalances can vary significantly depending on the payment terms and execution timing on key contracts.
Dependence on Key Customers
Generally, our customers in this segment are major integrated oil companies, national oil companies and independent exploration andproduction companies.
We have actively pursued alliances with oil and gas companies that are engaged in the subsea development of crude oil and natural gasto promote our integrated systems for subsea production. Development of subsea fields, particularly in deepwater environments,involves substantial capital investments by our customers. Our customers have sought the security of alliances with us to ensure timelyand cost-effective delivery of subsea and other energy-related systems that provide integrated solutions to their needs. Our alliancesestablish important ongoing relationships with our customers. While our alliances do not contractually commit our customers topurchase our systems and services, they have historically led to, and we expect that they will continue to result in, such purchases.Examples of customers we have entered alliances with include Statoil, Shell, BP and Anadarko.
Petrobras is a key customer for the Subsea Technologies segment. During early 2014, Brazilian authorities triggered an investigationinto Petrobras wholly unrelated to FMC Technologies. As a result of the investigation at Petrobras, our operational performance may beaffected by any significant changes in Petrobras’ operational activities. As part of our strong customer relationship, we are working withPetrobras to delay certain deliveries of product in 2015 which may affect our cash flows. During 2014, we did not take any bad debtcharges related to this customer.
The loss of one or more of our significant oil and gas company customers could have a material adverse effect on our SubseaTechnologies business segment. No single Subsea Technologies customer accounted for 10% or more of our 2014 consolidated revenue.
Competition
Subsea Technologies competes with other companies that supply subsea systems and with smaller companies that are focused on aspecific application, technology or geographical niche in which we operate. Companies including OneSubsea, GE Oil & Gas, AkerSolutions and Dril-Quip compete with us in the marketplace across our various Subsea Technologies product lines.
Competitive factors in our industry include reliability, cost-effective technology, execution and delivery. Our competitive strengthsinclude our intellectual capital, our execution of our projects, reliability of our products, experience base and breadth of technologiesembedded in our products and services that enable us to design unique solutions for our customers’ project requirements whileincorporating standardized components to contain costs. We maintain a presence in all of the world’s major producing basins. Ourstrong customer relationships, experience and technology help us maintain a leadership position in subsea systems.
Seasonality
In the North Sea, winter weather generally subdues drilling activity and demand for subsea services as certain activities cannot beperformed. As a result, the level of offshore activity in our subsea services is negatively influenced and tends to decrease in the firstquarter of the year.
6
Copyright © 2013 www.secdatabase.com. All Rights Reserved.Please Consider the Environment Before Printing This Document
Surface Technologies
Surface Technologies designs and manufactures products and systems and provides services used by oil and gas companies involved inland and offshore exploration and production of crude oil and natural gas. We design, manufacture and supply technologically advancedhigh pressure valves, pumps and fittings used in stimulation activities for oilfield service companies and provide flowback and wirelineservices for exploration and production companies in the oil and gas industry.
Principal Products and Services
Surface Wellhead. We provide a full range of drilling, completion and production wellhead systems for both standard and custom-engineered applications. Surface wellhead production systems, or trees, are used to control and regulate the flow of crude oil and naturalgas from the well. Our surface wellhead products and systems are used worldwide on both onshore and offshore applications and can beused in difficult climates, including arctic cold or desert high temperatures. Our product technologies include conventional wellheads,unihead drill-thru wellheads designed for faster surface installations, drilling time optimization (“DTO”) timesaving conventionalwellheads designed to reduce overall rig time and other technologies including sealing technology, thermal equipment, and valves andactuators. We support our customers through comprehensive surface wellhead system service packages that provide strategic solutionsto ensure optimal equipment performance and reliability and include all phases of the asset’s life cycle, from the early planning stagesthrough testing and installation, commissioning and operations, replacement and upgrades, interventions, decommissioning/abandonment, and maintenance, storage and preservations. In addition, our integrated shale services include manifolds and trees andflow back equipment for timely and cost-effective well completion.
Surface wellhead represented approximately 15%, 14% and 13% of our consolidated revenue in 2014, 2013 and 2012, respectively.
Fluid Control. We design and manufacture flowline products, under the Weco®/Chiksan® trademarks, manifold trailers, well servicepumps, compact valves and reciprocating pumps used in well completion and stimulation activities by major oilfield service companies,such as Schlumberger Limited, Baker Hughes Incorporated, Halliburton Company and Weatherford International plc. Our flowlineproducts are used in equipment that pumps fluid into a well during the well construction and stimulation processes. Our well servicepump product line includes Triplex and Quintuplex pumps utilized in a variety of applications including fracturing, acidizing and matrixstimulation and are capable of delivering flow rates up to 35 barrels per minute at pressures up to 20,000 psi. The performance of thisbusiness typically rises and falls with variations in the active rig count throughout the world and pressure pumping activity in theAmericas.
Fluid control represented approximately 8%, 8% and 12% of our consolidated revenue in 2014, 2013 and 2012, respectively.
Completion Services. We provide flowback services, cased hole electric wireline and slickline services, specialty logging services,pressure transient analysis, and well optimization services for exploration companies in the oil and gas industry. Acquired in October2012 and formerly known as Pure Energy Services Ltd., our completion services business offers flowback services that provide ourcustomers the well services necessary for the recovery of solids, fluids and hydrocarbons from oil and natural gas wells after thestimulation of the well and can involve high pressure or multi-well pad operations.
Capital Intensity
Surface Technologies manufactures most of its products, resulting in a reliance on manufacturing locations throughout the world. Wealso maintain a large amount of rental equipment related to pressure pumping operations.
Dependence on Key Customers
No single Surface Technologies customer accounted for 10% or more of our 2014, 2013 or 2012 consolidated revenue.
7
Copyright © 2013 www.secdatabase.com. All Rights Reserved.Please Consider the Environment Before Printing This Document
Competition
Surface Technologies is a market leader for its primary products and services. Some of the competitive factors include technologicalinnovation, reliability and product quality. Surface Technologies competes with other companies that supply surface productionequipment and pressure pumping products. Some of our major competitors include Cameron International Corporation, Weir Oil & Gas,GE Oil & Gas and Gardner Denver, Inc.
Seasonality
In western Canada, the level of activity in the oilfield services industry is influenced by seasonal weather patterns. During the springmonths, wet weather and the spring thaw make the ground unstable and less capable of supporting heavy equipment and machinery. Asa result, municipalities and provincial transportation departments enforce road bans that restrict the movement of heavy equipment,which reduces activity levels. There is greater demand for oilfield services provided by our completion services business in the winterseason when freezing permits the movement and operation of heavy equipment. Activities tend to increase in the fall and peak in thewinter months of November through March.
8
Copyright © 2013 www.secdatabase.com. All Rights Reserved.Please Consider the Environment Before Printing This Document
Energy Infrastructure
Principal Products and Services
Measurement Solutions. We design, manufacture and supply measurement products for the worldwide oil and gas industry. Our flowcomputers and control systems manage and monitor liquid and gas measurement for applications such as custody transfer, fiscalmeasurement and batch loading and deliveries. Our floating production, storage and off-loading metering systems provide the precisionand reliability required for measuring large flow rates characteristic of marine loading operations. Our measurement systems providemany solutions in energy-related applications such as crude oil and natural gas production and transportation, refined producttransportation, petroleum refining, and petroleum marketing and distribution. We combine advanced measurement technology withstate-of-the-art electronics and supervisory control systems to provide the measurement of both liquids and gases to ensure processesoperate efficiently while reducing operating costs and minimizing the risk associated with custody transfer.
We also provide design, engineering, project management, training, commissioning and aftermarket services in connection with theapplications of blending and transfer technology solutions and process automation systems for manufacturers in the lubricant,petroleum, fuel blending, and additive and chemical industries.
Loading Systems. We provide land- and marine-based fluid loading and transfer systems to the oil and gas, petrochemical and chemicalindustries. Our systems provide transfer loading solutions using Chiksan loading arms and Chiksan swivel joint technologies capable ofdiverse applications. While our marine systems are typically constructed on a fixed jetty platform, we have developed advanced loadingsystems that can be mounted on a vessel or structure to facilitate ship-to-ship and tandem loading and offloading operations in open seasor exposed locations. Both our land- and marine- based loading and transfer systems are capable of handling a wide range of productsincluding petroleum products, liquefied natural gas (“LNG”) and chemical products.
Separation Systems. We design and manufacture systems that separate production flows from wells into oil, gas, sand and water. Ourseparation technology improves upon conventional separation technologies by moving the flow in a spiral, spinning motion. This causesthe elements of the flow stream to separate more efficiently than conventional separation technologies. These systems are currentlycapable of subsea and topside applications. For subsea separation, performing a part of the required separation process at the seabedenables our customers to have more effective production and reduces the need for topside processing capacity. We are able to applysubsea separation technologies for both greenfield development and retrofit solutions for fields currently in production in order toreduce costs for topside facilities and increase production and recovery of fields.
Automation and Control. We provide automation, control and information technology for the oil and gas and other industries. Acquiredin April 2012 and formerly known as Control Systems International, Inc., our automation and control business is a supplier ofinnovative control and automation system solutions. One of the business’ primary product, UCOS®, is a comprehensive softwaresolution that combines distributed control system and supervisory control and data acquisition system retrofits using software solutionsand compression control algorithms which allows customers to control and manage the engineering, design and monitoring of theirsystems of operations.
Dependence on Key Customers
No single Energy Infrastructure customer accounted for 10% or more of our 2014, 2013 or 2012 consolidated revenue.
9
Copyright © 2013 www.secdatabase.com. All Rights Reserved.Please Consider the Environment Before Printing This Document
OTHER BUSINESS INFORMATION RELEVANT TO OUR BUSINESS SEGMENTS
Product Development
We continue to invest in product development to advance technologies necessary to support the current and future technical challengesof our customers. New products and services are developed in order to ensure our ability to tender in upcoming projects and to enableour growth platforms. We also strive to increase standardization within our product lines in order to reduce delivery times, improveproduct integrity and control costs. To satisfy all these aims, we are focused on leveraging capabilities and advanced technologies acrossall of our businesses.
In our Subsea Technologies segment, we seek to invest in new technology that will enable the development of our customers’ fields. Wecontinue to expand the portfolio of solutions in order to deliver a complete production system for high pressure, high temperature(“HPHT”) applications. In 2014 we entered into a joint development agreement with several major operators to develop commonstandards for subsea production equipment capable of operating at pressures as high as 20,000 psi and temperatures up to 350º F. Webelieve standardization is an important element in improving execution, optimizing resources, lowering life cycle costs and providingsuperior long-term value. This agreement is expected to result in standardized materials, processes and interfaces and is expected todeliver improved reliability and operability over the life of the field. During 2014 we continued work to complete the portfolio ofcapabilities to support these applications with systems for high integrity pressure protection (“HIPPS”) and completion workover risers(“CWOR”). Also in 2014, our third generation of ultra-heavy duty work class ROVs, the UHD-III, was completed and delivered to themarket. This recent evolution of ROV technology features a new hydraulic pumping system capable of operating underwater valves inemergency situations, a tool dynamic positioning system, and a high definition Ethernet video system enhancing vehicle operation forROV pilots.
In addition to the development of new technology for challenging fields, we also seek to develop solutions that will help operatorsmaximize recovery from existing subsea fields. We continue to advance the development of motor and drive solutions for pumps inorder to expand our subsea product portfolio and to meet a broader set of market needs. Along with our development partner, SulzerPumps Ltd, development work progressed on a pump system capable of operating at higher pressures and temperatures compared tosolutions currently available in the market.
Standardization of subsea equipment is key to achieve reductions in cost and improved performance. In 2014 our next generationMaster Control Station featuring our proprietary User Configurable Open System (UCOS®) software was completed, installed andcommissioned offshore. The modular UCOS software platform allows for greater flexibility and scalability and will be utilized as thestandard for control system applications in subsea production, processing and workover systems. Additionally, the next generation ofstandard electric and hydraulic actuators were completed and delivered for field application. The E3 hydraulic actuator features designimprovements that will offer improved reliability. The G2i electric actuator was designed for improved manufacturability and qualifiedaccording to the highest industrial standards. The G2i electric actuator will be a key component in subsea production and processingsystems.
We are also expanding our subsea services portfolio to provide more services that maximize production and recovery over the life of thefield. In January 2015, we completed the construction of a fourth riserless light well intervention (“RLWI”) system capable of operatingat water depths up to 6,000 ft. RLWI is a cost-effective, rigless intervention solution designed to perform various types of jobs inoffshore wells that will improve and optimize recovery using smaller, purpose-built intervention vessels rather than rigs.
In our Surface Technologies segment, development work focused on enhancing our capabilities to provide products and services tosupport our integrated shale operations. Development work was completed on de-sanding technology designed to improve theperformance of flowback operations. Pilot units were produced and successfully tested in the field. Our fluid control business alsocompleted development and launched the ePRV, an electronic pressure relief valve. The ePRV is the first fully electronic pressure reliefvalve for the pressure pumping market, providing improved accuracy and serviceability. Additional investments in SurfaceTechnologies were directed toward the expansion of capabilities to support shallow water production. The JXT (Jack-Up X-mas Tree)and JXT-3 designs were delivered to the field. These standard products provide production options that enable operators to minimizetime to first oil and reduce capital investments.
In our Energy Infrastructure segment, our loading systems business unit completed development on an all-electric marine loading arm.The electric drives are easier to maintain and more efficient to operate compared to existing hydraulic arms.
10
Copyright © 2013 www.secdatabase.com. All Rights Reserved.Please Consider the Environment Before Printing This Document
Order Backlog
Information regarding order backlog is incorporated herein by reference from the section entitled “Inbound Orders and Order Backlog”in Part II, Item 7 of this Annual Report on Form 10-K.
Sources and Availability of Raw Materials
Our business segments purchase carbon steel, stainless steel, aluminum and steel castings and forgings both domestically andinternationally. We typically do not use single source suppliers for the majority of our raw material purchases; however, certaingeographic areas of our businesses or a project or group of projects may heavily depend on certain suppliers for raw materials or supplyof semi-finished goods. We believe the available supplies of raw materials are adequate to meet our needs.
Research and Development
We are engaged in research and development (“R&D”) activities directed toward the improvement of existing products and services, thedesign of specialized products to meet customer needs and the development of new products, processes and services. A large part of ourproduct development spending has focused on the improved design and standardization of our Subsea Technologies product lines tomeet our customer needs. Financial information about R&D activities is incorporated herein by reference from Note 19 to ourconsolidated financial statements included in Part II, Item 8 of this Annual Report on Form 10-K.
Patents, Trademarks and Other Intellectual Property
We own a number of U.S. and foreign patents, trademarks and licenses that are cumulatively important to our businesses. As part of ourongoing research and development, we seek patents when appropriate for new products and product improvements. We haveapproximately 1,330 issued patents and pending patent applications worldwide. Further, we license intellectual property rights to orfrom third parties. We also own numerous U.S. and foreign trademarks and trade names and have approximately 150 registrations andpending applications in the United States and abroad.
We protect and promote our intellectual property portfolio and take those actions we deem appropriate to enforce and defend ourintellectual property rights. We do not believe, however, that the loss of any one patent, trademark or license, or group of related patents,trademarks or licenses would have a material adverse effect on our overall business.
Employees
As of December 31, 2014, we had approximately 20,300 full-time employees, consisting of approximately 6,900 in the United Statesand 13,400 in non-U.S. locations. Less than 2% of our U.S. employees are represented by labor unions.
The Iran Threat Reduction and Syria Human Rights Act of 2012
The Iran Threat Reduction and Syria Human Rights Act of 2012 amended Section 13 of the Exchange Act and requires disclosure whena company knowingly engages in specified prohibited activities involving Iran. We had no such activities to report during the yearended December 31, 2014.
Segment and Geographic Financial Information
The majority of our consolidated revenue and segment operating profits are generated in markets outside of the United States. Each ofour segments’ revenue is dependent upon worldwide oil and gas exploration and production activity. Financial information about oursegments and geographic areas is incorporated herein by reference from Note 19 to our consolidated financial statements in Part II,Item 8 of this Annual Report on Form 10-K.
11
Copyright © 2013 www.secdatabase.com. All Rights Reserved.Please Consider the Environment Before Printing This Document
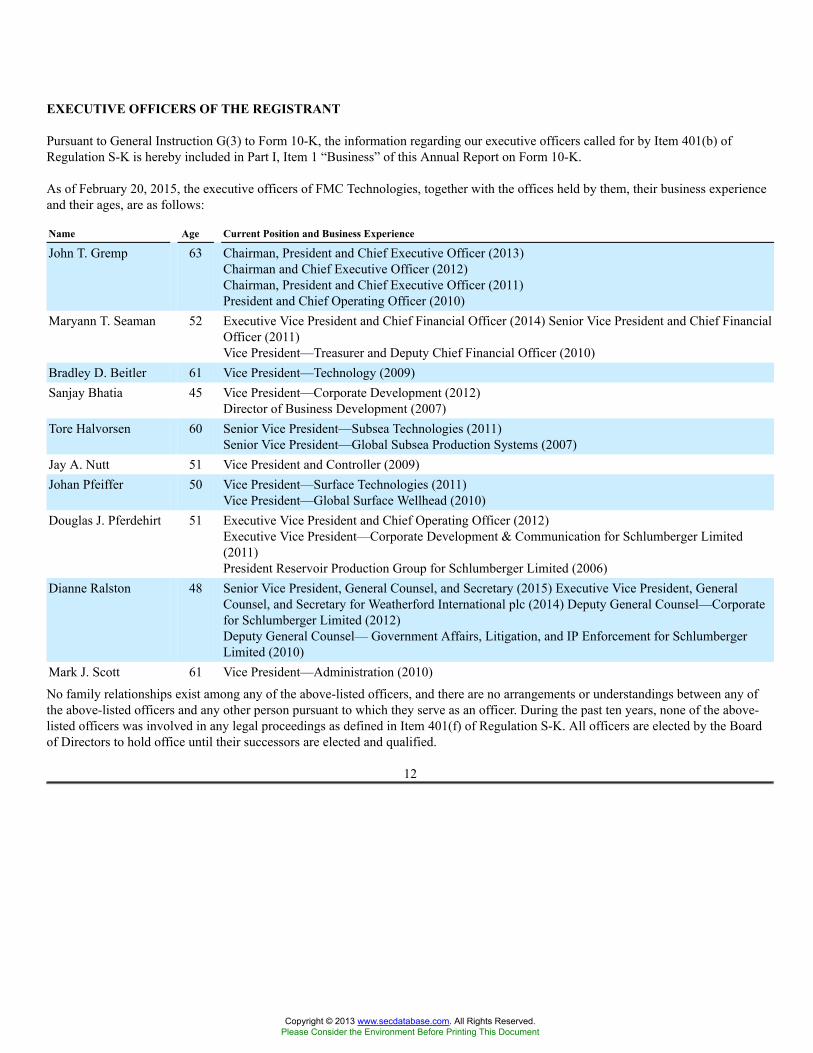
EXECUTIVE OFFICERS OF THE REGISTRANT
Pursuant to General Instruction G(3) to Form 10-K, the information regarding our executive officers called for by Item 401(b) ofRegulation S-K is hereby included in Part I, Item 1 “Business” of this Annual Report on Form 10-K.
As of February 20, 2015, the executive officers of FMC Technologies, together with the offices held by them, their business experienceand their ages, are as follows:
Name Age Current Position and Business Experience
John T. Gremp 63 Chairman, President and Chief Executive Officer (2013)Chairman and Chief Executive Officer (2012)Chairman, President and Chief Executive Officer (2011)President and Chief Operating Officer (2010)
Maryann T. Seaman 52 Executive Vice President and Chief Financial Officer (2014) Senior Vice President and Chief FinancialOfficer (2011)Vice President—Treasurer and Deputy Chief Financial Officer (2010)
Bradley D. Beitler 61 Vice President—Technology (2009)Sanjay Bhatia 45 Vice President—Corporate Development (2012)
Director of Business Development (2007)Tore Halvorsen 60 Senior Vice President—Subsea Technologies (2011)
Senior Vice President—Global Subsea Production Systems (2007)Jay A. Nutt 51 Vice President and Controller (2009)Johan Pfeiffer 50 Vice President—Surface Technologies (2011)
Vice President—Global Surface Wellhead (2010)Douglas J. Pferdehirt 51 Executive Vice President and Chief Operating Officer (2012)
Executive Vice President—Corporate Development & Communication for Schlumberger Limited(2011)President Reservoir Production Group for Schlumberger Limited (2006)
Dianne Ralston 48 Senior Vice President, General Counsel, and Secretary (2015) Executive Vice President, GeneralCounsel, and Secretary for Weatherford International plc (2014) Deputy General Counsel—Corporatefor Schlumberger Limited (2012)Deputy General Counsel— Government Affairs, Litigation, and IP Enforcement for SchlumbergerLimited (2010)
Mark J. Scott 61 Vice President—Administration (2010)
No family relationships exist among any of the above-listed officers, and there are no arrangements or understandings between any ofthe above-listed officers and any other person pursuant to which they serve as an officer. During the past ten years, none of the above-listed officers was involved in any legal proceedings as defined in Item 401(f) of Regulation S-K. All officers are elected by the Boardof Directors to hold office until their successors are elected and qualified.
12
Copyright © 2013 www.secdatabase.com. All Rights Reserved.Please Consider the Environment Before Printing This Document
ITEM 1A. RISK FACTORS
Important risk factors that could impact our ability to achieve our anticipated operating results and growth plan goals are presentedbelow. The following risk factors should be read in conjunction with discussions of our business and the factors affecting our businesslocated elsewhere in this Annual Report on Form 10-K and in our other filings with the SEC.
Demand for our systems and services depends on oil and gas industry activity and expenditure levels, which are directly affected bytrends in the demand for and price of crude oil and natural gas.
We are substantially dependent on conditions in the oil and gas industry, including the level of exploration, development and productionactivity of, and the corresponding capital spending by, oil and natural gas companies. Any substantial or extended decline in theseexpenditures may result in the reduced pace of discovery and development of new reserves of oil and gas and the reduced exploitationof existing wells, which could adversely affect demand for our systems and services and, in certain instances, result in the cancellation,modification or rescheduling of existing orders in our backlog. These factors could have an adverse effect on our revenue andprofitability. The level of exploration, development and production activity is directly affected by trends in oil and natural gas prices,which, historically, have been volatile.
Factors affecting the prices of oil and natural gas include, but are not limited to, the following:
• demand for hydrocarbons, which is affected by worldwide population growth, economic growth rates and general economicand business conditions;
• costs of exploring for, producing and delivering oil and natural gas;
• political and economic uncertainty and sociopolitical unrest;
• available excess production capacity within the Organization of Petroleum Exporting Countries (“OPEC”) and the level of oilproduction by non-OPEC countries;
• oil refining capacity and shifts in end-customer preferences toward fuel efficiency and the use of natural gas;
• technological advances affecting energy consumption;
• potential acceleration of the development of alternative fuels;
• access to capital and credit markets, which may affect our customers’ activity levels and spending for our products andservices; and
• natural disasters.
The oil and gas industry has historically experienced periodic downturns, which have been characterized by diminished demand foroilfield services and downward pressure on the prices we charge. A significant downturn in the oil and gas industry could result in areduction in demand for oilfield services and could adversely affect our financial condition, results of operations or cash flows.
The industries in which we operate or have operated expose us to potential liabilities arising out of the installation or use of oursystems that could adversely affect our financial condition.
We are subject to equipment defects, malfunctions and failures, equipment misuse and natural disasters, the occurrence of which mayresult in uncontrollable flows of gas or well fluids, fires and explosions. Although we have obtained insurance against many of theserisks, our insurance may not be adequate to cover our liabilities. Further, the insurance may not generally be available in the future or, ifavailable, premiums may not be commercially justifiable. If we incur substantial liability and the damages are not covered by insuranceor are in excess of policy limits, or if we were to incur liability at a time when we are not able to obtain liability insurance, suchpotential liabilities could have a material adverse effect on our business, results of operations, financial condition or cash flows.
13
Copyright © 2013 www.secdatabase.com. All Rights Reserved.Please Consider the Environment Before Printing This Document
Our operations require us to comply with numerous U.S. and international regulations, violations of which could have a materialadverse effect on our financial condition, results of operations or cash flows.
We are exposed to a variety of federal, state, local and international laws and regulations relating to matters such as environmental,health and safety, labor and employment, import/export control, currency exchange, bribery and corruption and taxation. These laws andregulations are complex, frequently change and have tended to become more stringent over time. In the event the scope of these lawsand regulations expand in the future, the incremental cost of compliance could adversely impact our financial condition, results ofoperations or cash flows.
Our operations outside of the United States require us to comply with numerous anti-bribery and anti-corruption regulations under thelaws of the United States and various other countries. The U.S. Foreign Corrupt Practices Act (“FCPA”), the United Kingdom (“U.K.”)Bribery Act and the Brazilian Anti-Bribery Act (also known as the Brazilian Clean Company Act), among others, apply to us and ouroperations. We have internal control policies and procedures and have implemented training and compliance programs for ouremployees and agents with respect to these regulations. However, our policies, procedures and programs may not always protect usfrom reckless or criminal acts committed by our employees or agents, and severe criminal or civil sanctions may be imposed as a resultof violations of these laws. We are also subject to the risks that our employees, joint venture partners and agents outside of the UnitedStates may fail to comply with applicable laws.
Moreover, we import raw materials, semi-finished goods, as well as finished products into many countries for use in such countries orfor manufacturing and/or finishing for re-export and import into another country for use or further integration into equipment orsystems. Most movement of raw materials, semi-finished or finished products involves imports and exports. As a result, compliancewith multiple trade sanctions, embargoes and import/export laws and regulations, as well as the recently enacted conflict mineralsreporting requirements, pose a constant challenge and risk to us since our business is conducted on a worldwide basis through varioussubsidiaries. Our failure to comply with these laws and regulations could materially affect our reputation, financial condition and resultsof operations.
Compliance with environmental laws and regulations may adversely affect our business and operating results.
Environmental laws and regulations in the United States and regulations in foreign countries affect the equipment, systems and serviceswe design, market and sell, as well as the facilities where we manufacture our equipment and systems. We are required to investfinancial and managerial resources to comply with environmental laws and regulations and believe that we will continue to be requiredto do so in the future. Failure to comply with these laws and regulations may result in the assessment of administrative, civil andcriminal penalties, the imposition of remedial obligations, or the issuance of orders enjoining operations. These laws and regulations, aswell as the adoption of new legal requirements or other laws and regulations affecting exploration and development of drilling for crudeoil and natural gas, could adversely affect our business and operating results by increasing our costs, limiting the demand for oursystems and services or restricting our operations.
International, national and state governments and agencies are currently evaluating and/or promulgating legislation and regulations thatare focused on restricting emissions commonly referred to as greenhouse gas (“GHG”) emissions. For instance, under the U.S. CleanAir Act, the U.S. Environmental Protection Agency (“EPA”) has made findings that GHG emissions endanger public health and theenvironment, resulting in the EPA’s adoption of regulations requiring construction and operating permit reviews of certain stationarysources with major emissions of GHGs, which reviews may require the installation of best available control technologies typicallyapproved by the states and the monitoring and annual reporting of GHG emissions from certain sources, including onshore and offshoreoil and natural gas production facilities and onshore oil and natural gas processing, transmission, storage and distribution facilities. Inaddition, in June 2014, the EPA, acting under President Obama’s Climate Action Plan, proposed its Clean Power Plan, which would setU.S. state-by-state guidelines for power plants to reduce their carbon emissions and cut pollution, nitrogen oxides and sulfur dioxide. Tothe extent our customers are subject to these or other similar proposed or newly enacted laws and regulations, the additional costsincurred by our customers to comply with such laws and regulations could impact their ability or desire to continue to operate at currentor anticipated levels, which would negatively impact their demand for our systems and services. In addition, any new laws orregulations establishing cap-and-trade and those that favor the increased use of non-fossil fuels may dampen demand for oil and gasproduction and lead to lower spending by our customers for our systems and services. Similarly, to the extent we are or become subjectto any of these or other similar proposed or newly enacted laws and regulations, we expect that our efforts to monitor, report and complywith such laws and regulations, and any related taxes imposed on companies by such programs, will increase our cost of doing businessand may have a material adverse effect on our financial condition and results of operation.
14
Copyright © 2013 www.secdatabase.com. All Rights Reserved.Please Consider the Environment Before Printing This Document
Moreover, environmental concerns have been raised regarding the potential impact of hydraulic fracturing or “fracking” on undergroundwater supplies. We provide equipment and services to companies employing this enhanced recovery technique. There have been severalregulatory and governmental initiatives in the United States to restrict the hydraulic fracturing process, which could have an adverseimpact on our customers’ completion or production activities. For example, the U.S. Department of the Interior has issued proposedregulations that would apply to hydraulic fracturing operations on wells that are subject to federal oil and gas leases and that wouldimpose requirements regarding the disclosure of chemicals used in the hydraulic fracturing process, as well as requirements to obtaincertain federal approvals before proceeding with hydraulic fracturing at a well site. This and other similar state and foreign regulatoryinitiatives, if adopted, would establish additional levels of regulation for our customers that could make it more difficult for ourcustomers to complete natural gas and oil wells and could adversely affect the demand for our equipment and services, which, in turn,could adversely affect our financial condition, results of operations or cash flows.
Disruptions in the political, regulatory, economic and social conditions of the countries in which we conduct business couldadversely affect our business or results of operations.
We operate manufacturing facilities in the United States and in various countries across the world. Instability and unforeseen changes inany of the markets in which we conduct business, including economically and politically volatile areas such as North Africa, WestAfrica, the Middle East and the Commonwealth of Independent States, could have an adverse effect on the demand for our systems andservices, our financial condition or our results of operations. These factors include, but are not limited to, the following:
• nationalization and expropriation;
• potentially burdensome taxation;
• inflationary and recessionary markets, including capital and equity markets;
• civil unrest, labor issues, political instability, terrorist attacks, cyber-terrorism, military activity and wars;
• supply disruptions in key oil producing countries;
• ability of OPEC to set and maintain production levels and pricing;
• trade restrictions, trade protection measures or price controls;
• foreign ownership restrictions;
• import or export licensing requirements;
• restrictions on operations, trade practices, trade partners and investment decisions resulting from domestic and foreign laws andregulations;
• changes in, and the administration of, laws and regulations;
• inability to repatriate income or capital;
• reductions in the availability of qualified personnel;
• foreign currency fluctuations or currency restrictions; and
• fluctuations in the interest rate component of forward foreign currency rates.
Because a significant portion of our revenue is denominated in foreign currencies, changes in exchange rates will produce fluctuationsin our revenue, costs and earnings and may also affect the book value of our assets located outside of the United States and the amountof our stockholders’ equity. Although it is our policy to seek to minimize our currency exposure by engaging in hedging transactionswhere appropriate, our efforts may not be successful. Moreover, certain currencies, specifically currencies in countries such as Angolaand Nigeria where we have expanding operations, do not actively trade in the global foreign exchange markets and may subject us toincreased foreign currency exposures. To the extent we sell our products and services in foreign markets, currency fluctuations mayresult in our products and services becoming too expensive for foreign customers. As a result, fluctuations in foreign currency exchangerates may affect our financial position or results of operations.
15
Copyright © 2013 www.secdatabase.com. All Rights Reserved.Please Consider the Environment Before Printing This Document
We may lose money on fixed-price contracts.
As is customary for the types of businesses in which we operate, we often agree to provide products and services under fixed-pricecontracts. Under these contracts, we are typically responsible for cost overruns. Our actual costs and any gross profit realized on thesefixed-price contracts may vary from the estimated amounts on which these contracts were originally based. There is inherent risk in theestimation process, including significant unforeseen technical and logistical challenges or longer than expected lead times. A fixed-pricecontract may prohibit our ability to mitigate the impact of unanticipated increases in raw material prices through increased pricing.Depending on the size of a project, variations from estimated contract performance could have a significant impact on our financialcondition, results of operations or cash flows.
Disruptions in the timely delivery of our backlog could affect our future sales, profitability, and our relationships with ourcustomers.
Many of the contracts we enter into with our customers require long manufacturing lead times due to complex technical and logisticalrequirements. These contracts may contain penalty clauses relating to on-time delivery, and a failure by us to deliver in accordance withcustomer expectations could subject us to contractual penalties, reduce our margins on these contracts or result in damage to existingcustomer relationships. The ability to meet customer delivery schedules for this backlog is dependent on a number of factors, including,but not limited to, access to the raw materials required for production, an adequately trained and capable workforce, subcontractorperformance, project engineering expertise, sufficient manufacturing plant capacity and appropriate planning and scheduling ofmanufacturing resources. Failure to deliver backlog in accordance with expectations could negatively impact our financial performance,particularly in light of the current industry environment where customers may seek to improve their returns or cash flows.
Due to the types of contracts we enter into, the cumulative loss of several major contracts or alliances may have an adverse effect onour results of operations.
We often enter into large, long-term contracts that, collectively, represent a significant portion of our revenue. These agreements, ifterminated or breached, may have a larger impact on our operating results or our financial condition than shorter-term contracts due tothe value at risk. If we were to lose several key alliances or agreements over a relatively short period of time we could experience asignificant adverse impact on our financial condition, results of operations or cash flows.
Increased costs of raw materials and other components may result in increased operating expenses and adversely affect our resultsof operations or cash flows.
Our results of operations may be adversely affected by our inability to manage the rising costs and availability of raw materials andcomponents used in our wide variety of products and systems. Unexpected changes in the size and timing of regional and/or productmarkets, particularly for short lead-time products, could affect our results of operations or cash flows.
Moreover, in August 2012, the SEC issued its final rule to implement Section 1502 of the Dodd-Frank Wall Street Reform andConsumer Protection Act regarding mandatory disclosure and reporting requirements by public companies of their use of “conflictminerals” (tantalum, tin, tungsten and gold) originating in the Democratic Republic of Congo and adjoining countries. We conductedrequired due diligence activities for the 2013 calendar year and filed our first Form SD report with the SEC in June 2014. While theconflict minerals rule continues in effect as adopted, there remains uncertainty regarding how the conflict minerals rule, and ourcompliance obligations, will be affected in the future. Specifically, the Court of Appeals for the D.C. Circuit largely upheld the conflictminerals rule in April 2014, but in November 2014, it granted the SEC’s and Amnesty International’s petitions for rehearing regardingcertain disclosure requirements of the rule. Additional requirements under the rule could affect sourcing at competitive prices andavailability in sufficient quantities of certain of the conflict minerals used in the manufacture of our products or in the provision of ourservices, which could have a material adverse effect on our ability to purchase these products in the future. The costs of compliance,including those related to supply chain research, the limited number of suppliers and possible changes in the sourcing of these minerals,could have a material adverse effect on our results of operations or cash flows.
16
Copyright © 2013 www.secdatabase.com. All Rights Reserved.Please Consider the Environment Before Printing This Document
A failure of our information technology infrastructure could adversely impact our business and results of operations.
The efficient operation of our business is dependent on our information technology (“IT”) systems. Accordingly, we rely upon thecapacity, reliability and security of our IT hardware and software infrastructure and our ability to expand and update this infrastructurein response to our changing needs. Despite our implementation of security measures, our systems are vulnerable to damages fromcomputer viruses, natural disasters, incursions by intruders or hackers, failures in hardware or software, power fluctuations, cyberterrorists and other similar disruptions. Although no such material incidents have occurred to date, the failure of our IT systems toperform as anticipated for any reason or any significant breach of security could disrupt our business and result in numerous adverseconsequences, including reduced effectiveness and efficiency of operations, inappropriate disclosure of confidential information,increased overhead costs and loss of important information, which could have a material adverse effect on our business and results ofoperations. In addition, we may be required to incur significant costs to protect against damage caused by these disruptions or securitybreaches in the future.
Our success depends on our ability to implement new technologies and services.
Our success depends on the ongoing development and implementation of new product designs and improvements and on our ability toprotect and maintain critical intellectual property assets related to these developments. If we are not able to obtain patent or otherprotection of our technology, we may not be able to continue to develop systems, services and technologies to meet evolving industryrequirements, and if so, at prices acceptable to our customers.
Uninsured claims and litigation against us, including intellectual property litigation, could adversely impact our financial condition,results of operations or cash flows.
We could be impacted by the outcome of pending litigation, as well as unexpected litigation or proceedings. We have insurancecoverage against operating hazards, including product liability claims and personal injury claims related to our products, to the extentdeemed prudent by our management and to the extent insurance is available. However, no assurance can be given that the nature andamount of that insurance will be sufficient to fully indemnify us against liabilities arising out of pending and future claims and litigation.Our financial condition, results of operations or cash flows could be adversely affected by unexpected claims not covered by insurance.
In addition, the tools, techniques, methodologies, programs and components we use to provide our services may infringe upon theintellectual property rights of others. Infringement claims generally result in significant legal and other costs and may distractmanagement from running our core business. Royalty payments under licenses from third parties, if available, would increase our costs.If a license were not available, we might not be able to continue providing a particular service or product, which could adversely affectour financial condition, results of operations or cash flows. Additionally, developing non-infringing technologies would increase ourcosts.
17
Copyright © 2013 www.secdatabase.com. All Rights Reserved.Please Consider the Environment Before Printing This Document
A deterioration in future expected profitability or cash flows could result in an impairment of our recorded goodwill.
Goodwill is tested for impairment on an annual basis, or more frequently when impairment indicators arise. A lower fair value estimatein the future for any of our reporting units could result in goodwill impairments. Factors that could trigger a lower fair value estimateinclude changes in customer demand, cost increases, regulatory or political environment changes, and other changes in marketconditions, such as decreased prices in similar market-based transactions, which could impact future earnings of the reporting unit.
At December 31, 2014, recorded goodwill of $75.8 million was associated with our completion services reporting unit. The recentdecline in crude oil prices has introduced some uncertainty associated with certain key assumptions used in estimating fair value of thereporting unit. Depressed crude oil prices for a prolonged period of time may adversely affect the economics of certain of ourcustomers’ projects, particularly for shale-related projects in North America, and may reduce the demand for completion services,negatively impacting the financial results of the reporting unit. Management is monitoring the overall market, specifically crude oilprices, and its effect on the estimates and assumptions used in our goodwill impairment test for completion services, which may requirere-evaluation and could result in an impairment of goodwill for this reporting unit.
At December 31, 2014, recorded goodwill of $30.7 million was associated with our automation and control reporting unit. During 2014the automation and control reporting unit realized significantly lower sales volumes, leading to negative operating results for the yearand creating some uncertainty regarding future demand for certain products. Management has undertaken efforts to integrate thereporting unit’s UCOS® product with our Master Control Station in our subsea systems business to promote cost and efficiency savingsin our subsea product offering by utilizing the UCOS® Master Control Station as the standard for control system applications in subseaproduction, processing and workover systems. Management is evaluating the realizability of these savings and its effect on the estimatesand assumptions used in our goodwill impairment test for automation and control, which may require re-evaluation and could result inan impairment of goodwill for this reporting unit.
A downgrade in the rating of our debt could restrict our ability to access the capital markets.
Changes in the ratings assigned to our debt may impact our access to the debt capital markets. If ratings for our debt fall belowinvestment grade, our access to the debt capital markets could become restricted. Moreover, our revolving credit agreement includes anincrease in interest rates if the ratings for our debt are downgraded, which could have an adverse effect on our results of operations. Anincrease in the level of our indebtedness and related interest costs may increase our vulnerability to adverse general economic andindustry conditions and may affect our ability to obtain additional financing.
ITEM 1B. UNRESOLVED STAFF COMMENTS
None.
18
Copyright © 2013 www.secdatabase.com. All Rights Reserved.Please Consider the Environment Before Printing This Document

ITEM 2. PROPERTIES
We lease our corporate headquarters in Houston, Texas. We own or lease numerous properties throughout the world and consider ourproduction facilities to be our principal properties. We operate 24 significant production facilities in 14 countries.
We believe our properties and facilities are suitable for their present and intended purposes and are operating at a level consistent withthe requirements of the industry in which we operate. We also believe that our leases are at competitive or market rates and do notanticipate any difficulty in leasing suitable additional space upon expiration of our current lease terms.
The following table shows our significant production properties by reporting segment at December 31, 2014:
Subsea Technologies Surface Technologies Energy Infrastructure
United States:Davis, California Oklahoma City, Oklahoma Corpus Christi, Texas
* Houston, Texas Stephenville, Texas Erie, PennsylvaniaShingle Springs, California
International:* Aberdeen, Scotland Collecchio, Italy Arnhem, The Netherlands* Bergen, Norway Edmonton, Canada* Dunfermline, Scotland Jakarta, Indonesia
Kongsberg, Norway + Sens, FranceLuanda, AngolaMacaé, Brazil
* Nusajaya, MalaysiaPort Harcourt, Nigeria
* Rio de Janeiro, Brazil* Singapore* Stavanger, Norway
Takoradi, Ghana
*These facilities are production properties in Subsea Technologies and Surface Technologies.
+This facility is a production property in Surface Technologies and Energy Infrastructure.
ITEM 3. LEGAL PROCEEDINGS
We are involved in various pending or potential legal actions in the ordinary course of our business. Management is unable to predictthe ultimate outcome of these actions because of the inherent uncertainty of litigation. However, management believes that the mostprobable, ultimate resolution of these matters will not have a material adverse effect on our consolidated financial position, results ofoperations or cash flows.
ITEM 4. MINE SAFETY DISCLOSURES
Not applicable.
19
Copyright © 2013 www.secdatabase.com. All Rights Reserved.Please Consider the Environment Before Printing This Document
PART II
ITEM 5. MARKET FOR REGISTRANT’S COMMON EQUITY, RELATED STOCKHOLDER MATTERS AND ISSUERPURCHASES OF EQUITY SECURITIES
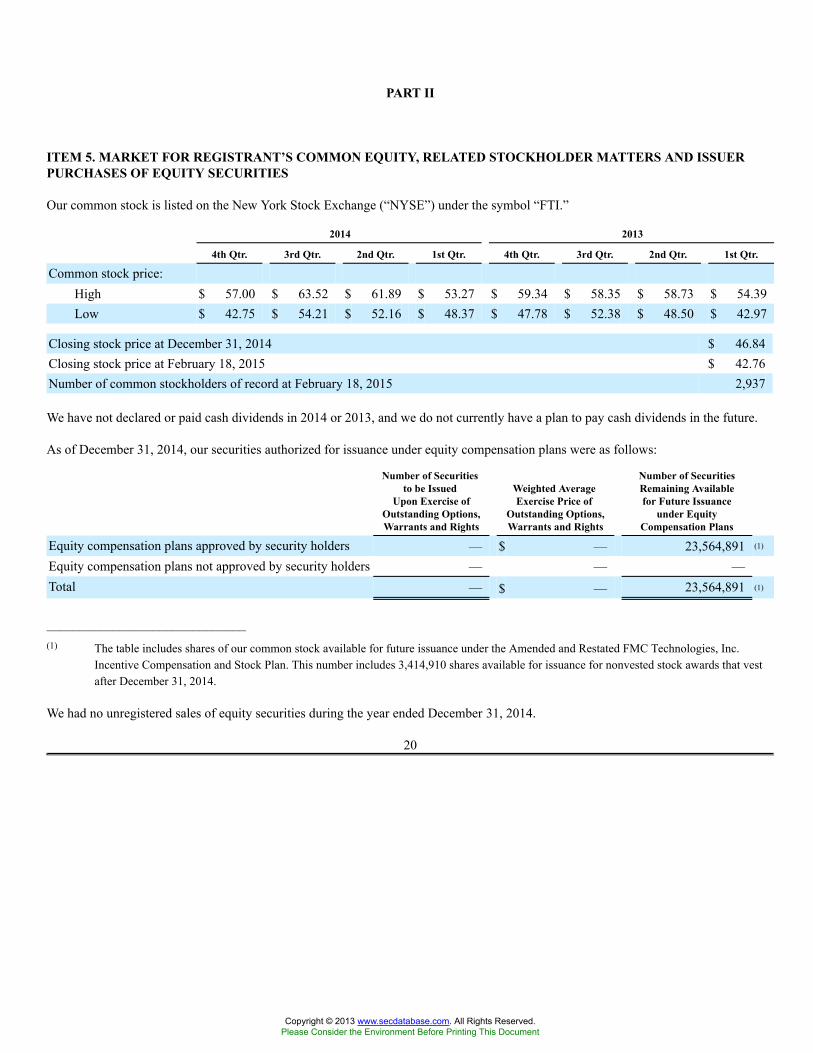
Our common stock is listed on the New York Stock Exchange (“NYSE”) under the symbol “FTI.”
2014 2013
4th Qtr. 3rd Qtr. 2nd Qtr. 1st Qtr. 4th Qtr. 3rd Qtr. 2nd Qtr. 1st Qtr.
Common stock price:High $ 57.00 $ 63.52 $ 61.89 $ 53.27 $ 59.34 $ 58.35 $ 58.73 $ 54.39Low $ 42.75 $ 54.21 $ 52.16 $ 48.37 $ 47.78 $ 52.38 $ 48.50 $ 42.97
Closing stock price at December 31, 2014 $ 46.84Closing stock price at February 18, 2015 $ 42.76Number of common stockholders of record at February 18, 2015 2,937
We have not declared or paid cash dividends in 2014 or 2013, and we do not currently have a plan to pay cash dividends in the future.
As of December 31, 2014, our securities authorized for issuance under equity compensation plans were as follows:
Number of Securitiesto be Issued
Upon Exercise ofOutstanding Options,Warrants and Rights
Weighted AverageExercise Price of
Outstanding Options,Warrants and Rights
Number of SecuritiesRemaining Availablefor Future Issuance
under EquityCompensation Plans
Equity compensation plans approved by security holders — $ — 23,564,891 (1)
Equity compensation plans not approved by security holders — — —Total — $ — 23,564,891 (1)
______________________________(1) The table includes shares of our common stock available for future issuance under the Amended and Restated FMC Technologies, Inc.
Incentive Compensation and Stock Plan. This number includes 3,414,910 shares available for issuance for nonvested stock awards that vestafter December 31, 2014.
We had no unregistered sales of equity securities during the year ended December 31, 2014.
20
Copyright © 2013 www.secdatabase.com. All Rights Reserved.Please Consider the Environment Before Printing This Document
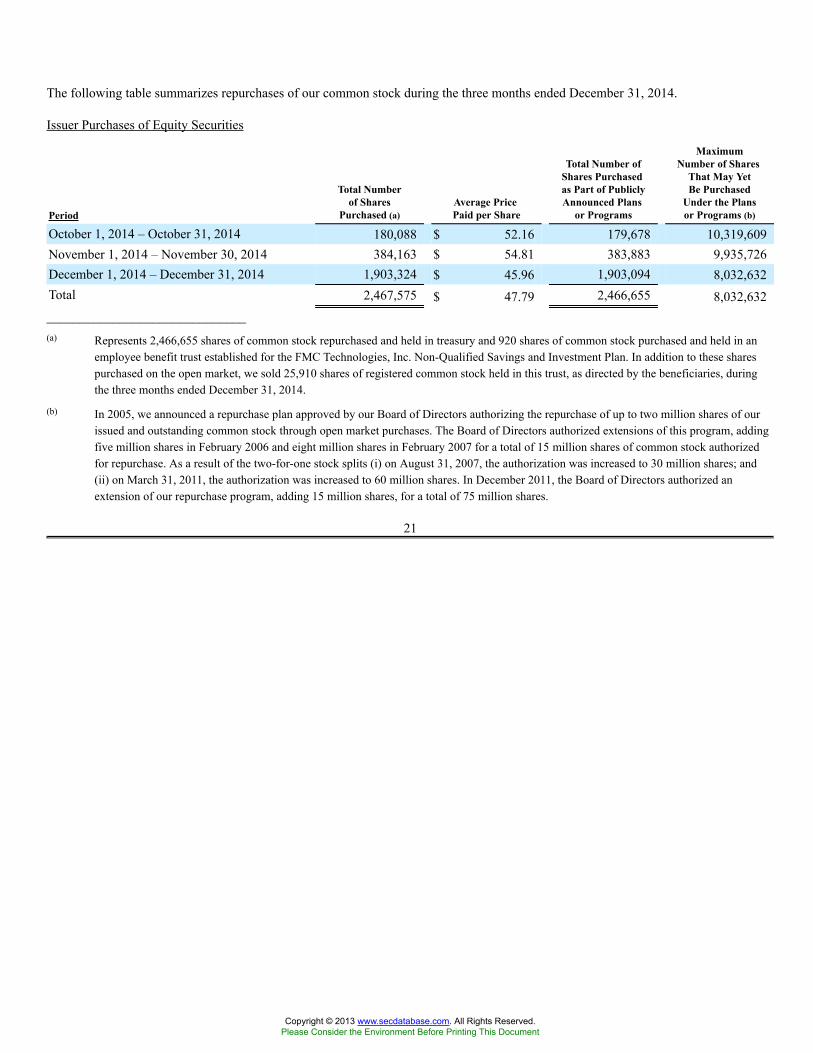
The following table summarizes repurchases of our common stock during the three months ended December 31, 2014.
Issuer Purchases of Equity Securities
Period
Total Numberof Shares
Purchased (a)Average PricePaid per Share
Total Number ofShares Purchasedas Part of PubliclyAnnounced Plans
or Programs
MaximumNumber of Shares
That May YetBe Purchased
Under the Plansor Programs (b)
October 1, 2014 – October 31, 2014 180,088 $ 52.16 179,678 10,319,609November 1, 2014 – November 30, 2014 384,163 $ 54.81 383,883 9,935,726December 1, 2014 – December 31, 2014 1,903,324 $ 45.96 1,903,094 8,032,632Total 2,467,575 $ 47.79 2,466,655 8,032,632______________________________(a) Represents 2,466,655 shares of common stock repurchased and held in treasury and 920 shares of common stock purchased and held in an
employee benefit trust established for the FMC Technologies, Inc. Non-Qualified Savings and Investment Plan. In addition to these sharespurchased on the open market, we sold 25,910 shares of registered common stock held in this trust, as directed by the beneficiaries, duringthe three months ended December 31, 2014.
(b) In 2005, we announced a repurchase plan approved by our Board of Directors authorizing the repurchase of up to two million shares of ourissued and outstanding common stock through open market purchases. The Board of Directors authorized extensions of this program, addingfive million shares in February 2006 and eight million shares in February 2007 for a total of 15 million shares of common stock authorizedfor repurchase. As a result of the two-for-one stock splits (i) on August 31, 2007, the authorization was increased to 30 million shares; and(ii) on March 31, 2011, the authorization was increased to 60 million shares. In December 2011, the Board of Directors authorized anextension of our repurchase program, adding 15 million shares, for a total of 75 million shares.
21
Copyright © 2013 www.secdatabase.com. All Rights Reserved.Please Consider the Environment Before Printing This Document
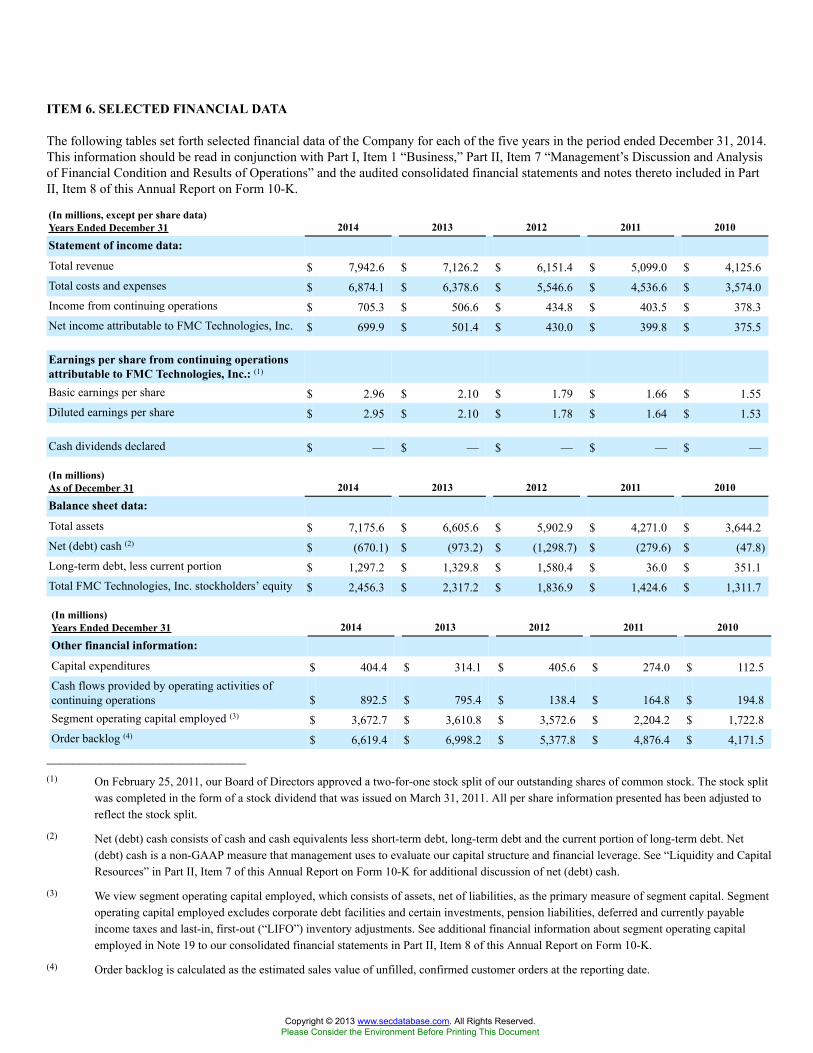
ITEM 6. SELECTED FINANCIAL DATA
The following tables set forth selected financial data of the Company for each of the five years in the period ended December 31, 2014.This information should be read in conjunction with Part I, Item 1 “Business,” Part II, Item 7 “Management’s Discussion and Analysisof Financial Condition and Results of Operations” and the audited consolidated financial statements and notes thereto included in PartII, Item 8 of this Annual Report on Form 10-K.
(In millions, except per share data)Years Ended December 31 2014 2013 2012 2011 2010
Statement of income data:
Total revenue $ 7,942.6 $ 7,126.2 $ 6,151.4 $ 5,099.0 $ 4,125.6Total costs and expenses $ 6,874.1 $ 6,378.6 $ 5,546.6 $ 4,536.6 $ 3,574.0Income from continuing operations $ 705.3 $ 506.6 $ 434.8 $ 403.5 $ 378.3Net income attributable to FMC Technologies, Inc. $ 699.9 $ 501.4 $ 430.0 $ 399.8 $ 375.5
Earnings per share from continuing operationsattributable to FMC Technologies, Inc.: (1)
Basic earnings per share $ 2.96 $ 2.10 $ 1.79 $ 1.66 $ 1.55Diluted earnings per share $ 2.95 $ 2.10 $ 1.78 $ 1.64 $ 1.53
Cash dividends declared $ — $ — $ — $ — $ —
(In millions)As of December 31 2014 2013 2012 2011 2010
Balance sheet data:
Total assets $ 7,175.6 $ 6,605.6 $ 5,902.9 $ 4,271.0 $ 3,644.2Net (debt) cash (2) $ (670.1) $ (973.2) $ (1,298.7) $ (279.6) $ (47.8)Long-term debt, less current portion $ 1,297.2 $ 1,329.8 $ 1,580.4 $ 36.0 $ 351.1Total FMC Technologies, Inc. stockholders’ equity $ 2,456.3 $ 2,317.2 $ 1,836.9 $ 1,424.6 $ 1,311.7
(In millions)Years Ended December 31 2014 2013 2012 2011 2010
Other financial information:
Capital expenditures $ 404.4 $ 314.1 $ 405.6 $ 274.0 $ 112.5Cash flows provided by operating activities ofcontinuing operations $ 892.5 $ 795.4 $ 138.4 $ 164.8 $ 194.8Segment operating capital employed (3) $ 3,672.7 $ 3,610.8 $ 3,572.6 $ 2,204.2 $ 1,722.8Order backlog (4) $ 6,619.4 $ 6,998.2 $ 5,377.8 $ 4,876.4 $ 4,171.5
______________________________(1) On February 25, 2011, our Board of Directors approved a two-for-one stock split of our outstanding shares of common stock. The stock split
was completed in the form of a stock dividend that was issued on March 31, 2011. All per share information presented has been adjusted toreflect the stock split.
(2) Net (debt) cash consists of cash and cash equivalents less short-term debt, long-term debt and the current portion of long-term debt. Net(debt) cash is a non-GAAP measure that management uses to evaluate our capital structure and financial leverage. See “Liquidity and CapitalResources” in Part II, Item 7 of this Annual Report on Form 10-K for additional discussion of net (debt) cash.
(3) We view segment operating capital employed, which consists of assets, net of liabilities, as the primary measure of segment capital. Segmentoperating capital employed excludes corporate debt facilities and certain investments, pension liabilities, deferred and currently payableincome taxes and last-in, first-out (“LIFO”) inventory adjustments. See additional financial information about segment operating capitalemployed in Note 19 to our consolidated financial statements in Part II, Item 8 of this Annual Report on Form 10-K.
(4) Order backlog is calculated as the estimated sales value of unfilled, confirmed customer orders at the reporting date.
Copyright © 2013 www.secdatabase.com. All Rights Reserved.Please Consider the Environment Before Printing This Document

22
Copyright © 2013 www.secdatabase.com. All Rights Reserved.Please Consider the Environment Before Printing This Document
ITEM 7. MANAGEMENT’S DISCUSSION AND ANALYSIS OF FINANCIAL CONDITION AND RESULTS OFOPERATIONS
Executive Overview
We design, manufacture and service technologically sophisticated systems and products for customers in the energy industry. We havemanufacturing operations worldwide, strategically located to facilitate delivery of our products, systems and services to our customers.We report the results of operations in the following segments: Subsea Technologies, Surface Technologies and Energy Infrastructure.Management’s determination of the Company’s reporting segments was made on the basis of our strategic priorities and corresponds tothe manner in which our chief operating decision maker reviews and evaluates operating performance to make decisions about resourcesto be allocated to the segment.
A description of our products and services and annual financial data for each segment can be found in Part I, Item 1, “Business” andNote 19 to our consolidated financial statements in Part II, Item 8 of this Annual Report on Form 10-K. A discussion and analysis of ourconsolidated results and the results of each of our segments for the years ended December 31, 2014, 2013 and 2012 follows.
We focus on economic and industry-specific drivers and key risk factors affecting our business segments as we formulate our strategicplans and make decisions related to allocating capital and human resources. The following discussion provides examples of economicand industry factors and key risks that we consider relevant to our business segments.
The results of our businesses are primarily driven by changes in capital spending by oil and gas companies, which largely depend uponcurrent and anticipated future crude oil and natural gas demand, production volumes, and consequently, commodity prices. We usecrude oil and natural gas prices as an indicator of demand. Additionally, we use rig count as an indicator of demand which consequentlyinfluences the level of worldwide production activity and spending decisions.Our Subsea Technologies business is primarily affected by trends in deepwater oil and natural gas production. Our Surface Technologiesbusiness is primarily affected by trends in land-based and shallow water oil and natural gas production, including trends in shaleproduction.
We also focus on key risk factors when determining our overall strategy and making decisions for capital allocation. These factorsinclude risks associated with the global economic outlook, product obsolescence and the competitive environment. We address theserisks in our business strategies, which incorporate continuing development of leading edge technologies and cultivating strong customerrelationships.
We have developed close working relationships with our customers. Our Subsea Technologies business results reflect our ability to buildlong-term alliances with oil and natural gas companies that are actively engaged in offshore deepwater development and to providesolutions for their needs in a timely and cost-effective manner. We believe that by closely working with our customers, we enhance ourcompetitive advantage, improve our operating results and strengthen our market positions. Evaluating our share of subsea tree awardsduring the year is one way we evaluate our market position.
As we evaluate our operating results, we consider business segment performance indicators like segment revenue, operating profit andcapital employed, in addition to the level of inbound orders and order backlog. A significant proportion of our revenue is recognizedunder the percentage of completion method of accounting. Cash receipts from such arrangements typically occur at milestones achievedunder stated contract terms. Consequently, the timing of revenue recognition is not always correlated with the timing of customerpayments. We aim to structure our contracts to receive advance payments that we typically use to fund engineering efforts and inventorypurchases. Working capital (excluding cash) and net (debt) cash are therefore key performance indicators of cash flows.
In each of our segments, we serve customers from around the world. During 2014, approximately 72% of our total sales wererecognized outside of the United States. We evaluate international markets and pursue opportunities that fit our technologicalcapabilities and strategies. Based on the increasing focus by international oil companies on deepwater development and production, wehave targeted opportunities in West Africa, Brazil, the North Sea and the Asia-Pacific region because of the expected offshore drillingpotential in those regions.
23
Copyright © 2013 www.secdatabase.com. All Rights Reserved.Please Consider the Environment Before Printing This Document
Business OutlookOverall Outlook. We operate in the commodity-driven, cyclical oil and gas industry. Since the beginning of 2011 and until the fourthquarter of 2014, the industry operated in an environment where crude oil prices largely avoided this cycle with WTI crude oil pricesaveraging approximately $96 per barrel over this period. With crude oil prices at such levels, many discoveries were economical foroperators to develop. During the fourth quarter of 2014, crude oil prices significantly declined due to continued growth in U.S. oilproduction, weakened outlooks for the global economy and continued strong international crude oil supply, especially from OPEC’sunexpected decision to maintain oil production levels. As a result of the weaker crude oil price environment, many crude oildevelopment prospects are or are becoming less economical for many operators, leading to an expected downturn in demand for ourproducts and services and an overall weaker demand for oilfield services. While the downturn we now face in our industry is significant,we believe the predominantly supply-driven, current market imbalance will undergo the corrective measures necessary for the recoveryof commodity prices in the long term. Although the timing of the recovery of crude oil prices is dependent on many variables, webelieve as long-term demand rises and production naturally declines, commodity prices will recover and our customers will begin toincrease their investments in new sources of oil production. Our improved execution in 2014 has set the stage for us to overcome thechallenges in the industry in 2015, and while certain reductions to our headcount in the coming year are necessary to protect ourprofitability, the measures we expect to take will align with our long-term growth strategies.
Subsea Technologies. All of our businesses will be negatively affected by the decline in crude oil prices, but the timing will be differentfor each. Our 2014 subsea order activity, specifically during the fourth quarter related to Chevron’s Agbami Phase 3 project, Eni’s Block15/06 East Hub development and Wintershall’s Maria, led to another year of strong subsea project backlog as of December 31, 2014.However, in reaction to the decline in crude oil prices, many of our customers have announced reductions to their capital spending in2015, and we are preparing for the anticipated slowing of subsea orders in the coming year. We expect subsea revenue in 2015 to berelatively flat when compared to 2014 in large part from our conversion of existing backlog, partially offset by lower 2015 inboundexpectations and the impact of a strong U.S. dollar. Our focus in the coming year will concentrate on leveraging our global capabilitiesand reducing operating costs. In the long-term, we continue to believe deepwater development will remain a significant part of ourcustomers’ portfolios. A critical part of our long-term strategy to maintain our subsea market leadership is to continue to invest in thetechnologies required to develop our customers’ challenging assets and further expand our capabilities focused on increasing reservoirproduction over the life of the field. However, given the critical need to reduce costs over the short-term, we are focused on offeringcost-effective approaches to our customers’ project developments, including customer acceptance of new technologies and acceptanceof business models to help achieve their cost-reduction goals. Part of this strategy includes standardization of subsea productionequipment as operators understand the cost and scheduling benefits that standardization brings to their projects.
Given the recent decline in crude oil prices and the capital budget reductions by our customers, we expect that growth related to subseaservices in 2015 to be relatively flat when compared to 2014. However, we continue to focus on subsea processing and subsea servicesas key long-term growth platforms so that we can expand our role as life-of-field partners with our customers by lowering their costsand improving their recovery. When crude oil prices recover to levels that support economic field development and the overall oil andgas market recovers, operators will continue to seek ways to reduce costs associated with developing their deepwater assets, and webelieve our continued focus on subsea processing and subsea services, particularly in subsea boosting and well intervention solutions,will be critical parts of our continued growth and success. Overall, we continue to seek ways to leverage our capacity investments, ourtalent, and our overall cost structure to drive improvement in our execution and our financial results in the coming year.
Surface Technologies. The improved operational results we realized in 2014 were the result of North American surface technologiesorders recovering from the slowdown that began in 2012 and that continued into mid 2013. However, provided the recent decline incommodity prices, and consequently, the decline in rig counts, we are preparing for decreased North American land activity in 2015,which will affect our surface wellhead, fluid control and completion services businesses in North America. Absent a recovery of oil andgas prices in the second half of 2015, we believe that commodity prices in 2016 may be at a level to allow recovery in North Americanactivity. In 2015 we expect to continue efforts to integrate our North American surface wellhead and completion services businesses tostrengthen our market presence and service offerings which we believe will bring increased value to our customers. Our internationalsurface wellhead business delivered strong operational results from continued strength in international markets in 2014, and we expectthis strength to continue in 2015 as a result of our strong international surface wellhead backlog.
24
Copyright © 2013 www.secdatabase.com. All Rights Reserved.Please Consider the Environment Before Printing This Document
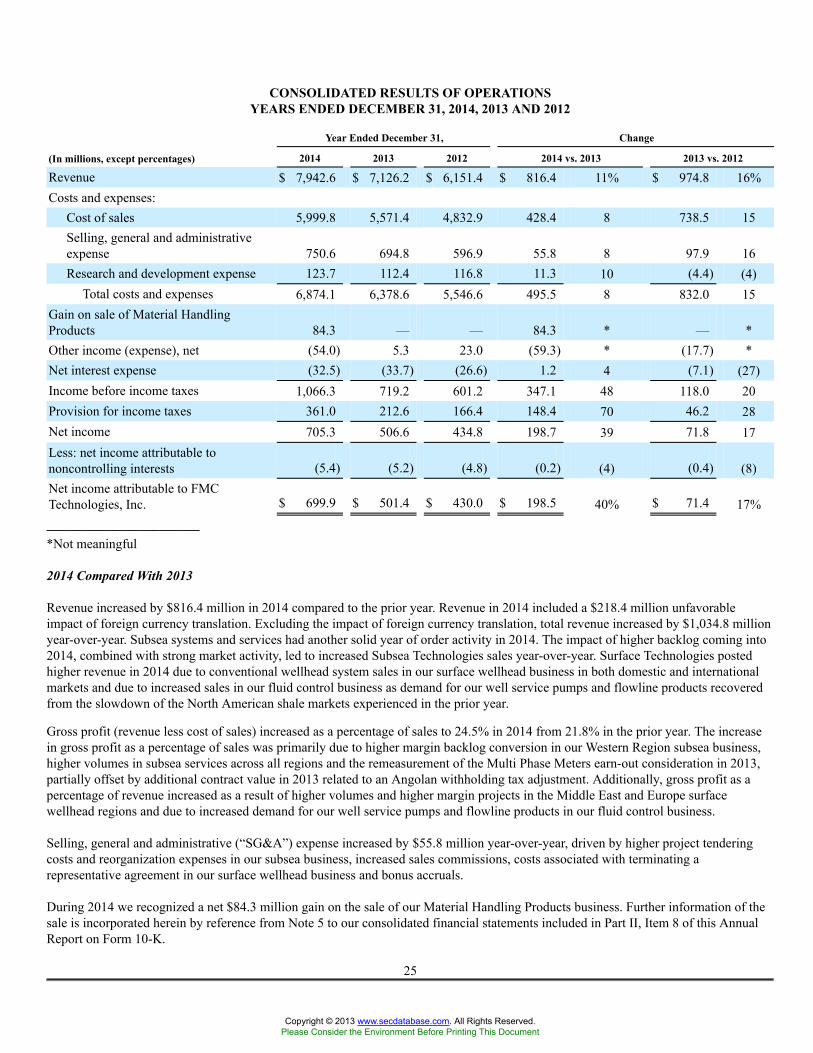
CONSOLIDATED RESULTS OF OPERATIONSYEARS ENDED DECEMBER 31, 2014, 2013 AND 2012
Year Ended December 31, Change
(In millions, except percentages) 2014 2013 2012 2014 vs. 2013 2013 vs. 2012
Revenue $ 7,942.6 $ 7,126.2 $ 6,151.4 $ 816.4 11% $ 974.8 16%Costs and expenses:
Cost of sales 5,999.8 5,571.4 4,832.9 428.4 8 738.5 15Selling, general and administrativeexpense 750.6 694.8 596.9 55.8 8 97.9 16Research and development expense 123.7 112.4 116.8 11.3 10 (4.4) (4)
Total costs and expenses 6,874.1 6,378.6 5,546.6 495.5 8 832.0 15Gain on sale of Material HandlingProducts 84.3 — — 84.3 * — *Other income (expense), net (54.0) 5.3 23.0 (59.3) * (17.7) *Net interest expense (32.5) (33.7) (26.6) 1.2 4 (7.1) (27)Income before income taxes 1,066.3 719.2 601.2 347.1 48 118.0 20Provision for income taxes 361.0 212.6 166.4 148.4 70 46.2 28Net income 705.3 506.6 434.8 198.7 39 71.8 17Less: net income attributable tononcontrolling interests (5.4) (5.2) (4.8) (0.2) (4) (0.4) (8)Net income attributable to FMCTechnologies, Inc. $ 699.9 $ 501.4 $ 430.0 $ 198.5 40% $ 71.4 17%_______________________*Not meaningful
2014 Compared With 2013
Revenue increased by $816.4 million in 2014 compared to the prior year. Revenue in 2014 included a $218.4 million unfavorableimpact of foreign currency translation. Excluding the impact of foreign currency translation, total revenue increased by $1,034.8 millionyear-over-year. Subsea systems and services had another solid year of order activity in 2014. The impact of higher backlog coming into2014, combined with strong market activity, led to increased Subsea Technologies sales year-over-year. Surface Technologies postedhigher revenue in 2014 due to conventional wellhead system sales in our surface wellhead business in both domestic and internationalmarkets and due to increased sales in our fluid control business as demand for our well service pumps and flowline products recoveredfrom the slowdown of the North American shale markets experienced in the prior year.
Gross profit (revenue less cost of sales) increased as a percentage of sales to 24.5% in 2014 from 21.8% in the prior year. The increasein gross profit as a percentage of sales was primarily due to higher margin backlog conversion in our Western Region subsea business,higher volumes in subsea services across all regions and the remeasurement of the Multi Phase Meters earn-out consideration in 2013,partially offset by additional contract value in 2013 related to an Angolan withholding tax adjustment. Additionally, gross profit as apercentage of revenue increased as a result of higher volumes and higher margin projects in the Middle East and Europe surfacewellhead regions and due to increased demand for our well service pumps and flowline products in our fluid control business.
Selling, general and administrative (“SG&A”) expense increased by $55.8 million year-over-year, driven by higher project tenderingcosts and reorganization expenses in our subsea business, increased sales commissions, costs associated with terminating arepresentative agreement in our surface wellhead business and bonus accruals.
During 2014 we recognized a net $84.3 million gain on the sale of our Material Handling Products business. Further information of thesale is incorporated herein by reference from Note 5 to our consolidated financial statements included in Part II, Item 8 of this AnnualReport on Form 10-K.
25
Copyright © 2013 www.secdatabase.com. All Rights Reserved.Please Consider the Environment Before Printing This Document
Other income (expense), net, reflected a $33.4 million loss related to the remeasurement of an intercompany foreign currencytransaction and other foreign currency losses primarily due to the strengthening of the U.S. dollar in 2014. Further discussion of ourderivative instruments is incorporated herein by reference from Note 15 to our consolidated financial statements included in Part II,Item 8 of this Annual Report on Form 10-K.
Our provision for income taxes reflected an effective tax rate of 34.0% and 29.8% in 2014 and 2013, respectively. Excluding aretroactive benefit related to the American Taxpayer Relief Act of 2012 recorded in the first quarter of 2013, our effective tax rate was30.7% in 2013. The increase in our effective tax rate in 2014 from the adjusted rate in 2013 was primarily due changes in Norwegian taxlaw effective from 2014 and an unfavorable change in mix of earnings. Our effective tax rate can fluctuate depending on our countrymix of earnings, since our foreign earnings are generally subject to lower tax rates than in the United States. In certain jurisdictions,primarily Singapore and Malaysia, our tax rate is significantly less than the relevant statutory rate due to tax holidays which are set toexpire after 2018 and 2015, respectively. The difference between the effective tax rate and the statutory U.S. federal income tax rateprimarily related to differing foreign and state tax rates.
2013 Compared With 2012
Revenue increased by $974.8 million in 2013 compared to the prior year and reflected revenue growth in all reporting segments.Revenue in 2013 included a $136.8 million unfavorable impact of foreign currency translation. Excluding the impact of foreigncurrency translation, total revenue increased by $1,111.6 million year-over-year. Subsea systems and services had another strong year oforder activity in 2013. The impact of the higher backlog coming into 2013, combined with robust market activity, led to increasedSubsea Technologies sales year-over-year. Additionally, revenue increased year-over-year as a result of our acquisition of the remaining55% of Schilling Robotics during the second quarter of 2012. Surface Technologies posted higher revenue in 2013 as a result of ouracquisition of our completion service business in the fourth quarter of 2012 and higher conventional wellhead system sales in oursurface wellhead business in the Middle East and Europe regions.
Gross profit (revenue less cost of sales) increased as a percentage of sales to 21.8% in 2013 from 21.4% in the prior year. The increasein gross profit as a percentage of sales was primarily due to increased utilization and efficiency of engineering resources in our WesternRegion subsea business, improved performance in our subsea services business, additional subsea contract value in 2013 related to anAngolan withholding tax adjustment, a larger remeasurement of the Multi Phase Meters contingent earn-out consideration in 2012,increased sales volumes and profitability in our Schilling Robotics business, and foreign exchange gains recognized in 2013, partiallyoffset by charges taken on the ExxonMobil Hibernia Southern Extension project in our subsea business and the slowdown in the NorthAmerican shale markets, primarily from a lack of capacity expansion, which lowered demand for our well service pumps and flowlineproducts.
SG&A expense increased by $97.9 million year-over-year, driven by higher bid and proposal expenses, increased sales commissionsand additional staffing to support subsea service operations in our subsea systems business, the full year impact of SG&A expense as theresult of our acquisition of our completion services business in the fourth quarter of 2012, and increased sales commissions in oursurface wellhead business.
Other income (expense), net, reflected a $20.0 million gain related to the fair valuation of our previously held equity interest in SchillingRobotics during 2012 and $1.7 million and $1.4 million of gains related to the remeasurement of foreign currency exposures in 2013and 2012, respectively. Further discussion of our derivative instruments is incorporated herein by reference from Note 15 to ourconsolidated financial statements included in Part II, Item 8 of this Annual Report on Form 10-K.
Our provision for income taxes reflected an effective tax rate of 29.8% in 2013. Excluding a charge related to withholding taxes inAngola, our effective tax rate was 26.7% in 2013. In 2012, our effective tax rate was 28.0%. The decrease in our effective tax rate from2012 to the adjusted rate in 2013 was primarily due to a more favorable mix of earnings. Our effective tax rate can fluctuate dependingon our country mix of earnings, since our foreign earnings are generally subject to lower tax rates than in the United States. In certainjurisdictions, primarily Singapore and Malaysia, our tax rate is significantly less than the relevant statutory rate due to tax holidayswhich are set to expire after 2018 and 2015, respectively. The difference between the effective tax rate and the statutory U.S. federalincome tax rate primarily related to differing foreign and state tax rates.
26
Copyright © 2013 www.secdatabase.com. All Rights Reserved.Please Consider the Environment Before Printing This Document
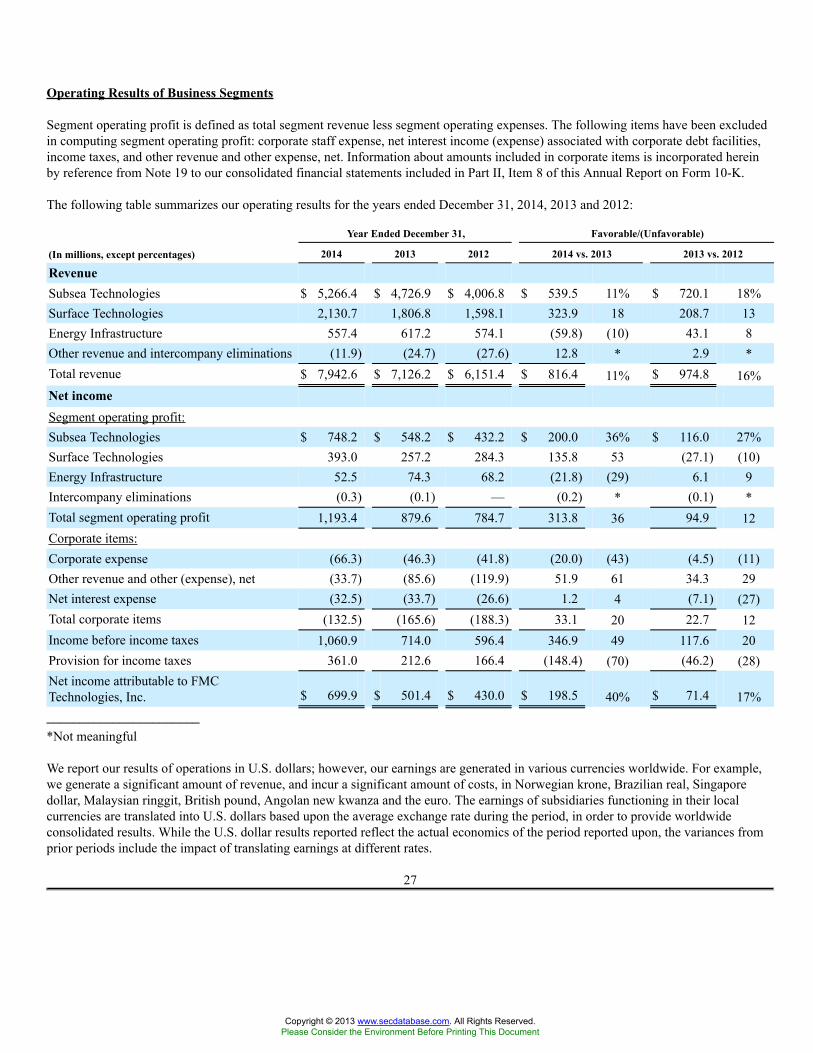
Operating Results of Business Segments
Segment operating profit is defined as total segment revenue less segment operating expenses. The following items have been excludedin computing segment operating profit: corporate staff expense, net interest income (expense) associated with corporate debt facilities,income taxes, and other revenue and other expense, net. Information about amounts included in corporate items is incorporated hereinby reference from Note 19 to our consolidated financial statements included in Part II, Item 8 of this Annual Report on Form 10-K.
The following table summarizes our operating results for the years ended December 31, 2014, 2013 and 2012:
Year Ended December 31, Favorable/(Unfavorable)
(In millions, except percentages) 2014 2013 2012 2014 vs. 2013 2013 vs. 2012
RevenueSubsea Technologies $ 5,266.4 $ 4,726.9 $ 4,006.8 $ 539.5 11% $ 720.1 18%Surface Technologies 2,130.7 1,806.8 1,598.1 323.9 18 208.7 13Energy Infrastructure 557.4 617.2 574.1 (59.8) (10) 43.1 8Other revenue and intercompany eliminations (11.9) (24.7) (27.6) 12.8 * 2.9 *Total revenue $ 7,942.6 $ 7,126.2 $ 6,151.4 $ 816.4 11% $ 974.8 16%Net incomeSegment operating profit:Subsea Technologies $ 748.2 $ 548.2 $ 432.2 $ 200.0 36% $ 116.0 27%Surface Technologies 393.0 257.2 284.3 135.8 53 (27.1) (10)Energy Infrastructure 52.5 74.3 68.2 (21.8) (29) 6.1 9Intercompany eliminations (0.3) (0.1) — (0.2) * (0.1) *Total segment operating profit 1,193.4 879.6 784.7 313.8 36 94.9 12Corporate items:Corporate expense (66.3) (46.3) (41.8) (20.0) (43) (4.5) (11)Other revenue and other (expense), net (33.7) (85.6) (119.9) 51.9 61 34.3 29Net interest expense (32.5) (33.7) (26.6) 1.2 4 (7.1) (27)Total corporate items (132.5) (165.6) (188.3) 33.1 20 22.7 12Income before income taxes 1,060.9 714.0 596.4 346.9 49 117.6 20Provision for income taxes 361.0 212.6 166.4 (148.4) (70) (46.2) (28)Net income attributable to FMCTechnologies, Inc. $ 699.9 $ 501.4 $ 430.0 $ 198.5 40% $ 71.4 17%_______________________*Not meaningful
We report our results of operations in U.S. dollars; however, our earnings are generated in various currencies worldwide. For example,we generate a significant amount of revenue, and incur a significant amount of costs, in Norwegian krone, Brazilian real, Singaporedollar, Malaysian ringgit, British pound, Angolan new kwanza and the euro. The earnings of subsidiaries functioning in their localcurrencies are translated into U.S. dollars based upon the average exchange rate during the period, in order to provide worldwideconsolidated results. While the U.S. dollar results reported reflect the actual economics of the period reported upon, the variances fromprior periods include the impact of translating earnings at different rates.
27
Copyright © 2013 www.secdatabase.com. All Rights Reserved.Please Consider the Environment Before Printing This Document
Subsea Technologies
2014 Compared With 2013
Subsea Technologies’ revenue increased $539.5 million in 2014 compared to the prior year. Revenue for 2014 included a $178.5 millionunfavorable impact of foreign currency translation. Excluding the impact of foreign currency translation, Subsea Technologies’ revenueincreased by $718.0 million during 2014 compared to the prior year. We entered the year with a strong backlog. During the first half of2014, high crude oil prices led to solid oil and gas exploration and production activity when compared to the prior year; however, adecline in oil prices that began in mid-2014 and which significantly further declined in the fourth quarter of 2014 has unfavorablyaffected the subsea market. Despite the late 2014 decline in crude oil prices, we had solid order activity during 2014 from high demandfor subsea systems and services. The year-over-year increase in revenue was attributable to the conversion of backlog and solid orderactivity in 2014.
Subsea Technologies’ operating profit totaled $748.2 million, or 14.2% of revenue, in 2014, compared to the prior-year’s operatingprofit as a percentage of revenue of 11.6%. The margin improvement was primarily driven by our Western Region subsea business fromhigher margin project backlog conversion and higher volumes in subsea services, particularly in the Gulf of Mexico, partially offset byadditional contract value in 2013 related to an Angolan withholding tax adjustment.
Foreign currency translation unfavorably impacted operating profit in 2014 by $24.9 million compared to the prior year.
2013 Compared With 2012
Subsea Technologies’ revenue increased $720.1 million in 2013 compared to the prior year. Revenue for 2013 included a $129.1 millionunfavorable impact of foreign currency translation. Excluding the impact of foreign currency translation, Subsea Technologies’ revenueincreased by $849.2 million during 2013 compared to the prior year. With continued high crude oil prices, oil and gas exploration andproduction activity increased in 2013 when compared to the prior year, as evidenced by increased spending by oil and gas companies.This led to a stronger market for subsea products and services. We entered the year with a strong backlog and continued to have solidorder activity during 2013 from high demand for subsea systems. The year-over-year increase in revenue was attributable to theconversion of backlog, combined with strong order activity in 2013. The revenue increase in 2013 was also due in part to ouracquisition of the remaining 55% of Schilling Robotics in the second quarter of 2012.
Subsea Technologies’ operating profit totaled $548.2 million, or 11.6% of revenue, in 2013, compared to the prior-year’s operatingprofit as a percentage of revenue of 10.8%. The margin improvement was primarily driven by our subsea systems business fromincreased utilization and efficiency of engineering resources in our Western Region business, improved results in our subsea servicebusiness, additional contract value in 2013 related to an Angolan withholding tax adjustment, lower overall research and developmentexpenses and liquidated damage charges recognized in 2012 in Brazil, partially offset by charges taken on the ExxonMobil HiberniaSouthern Extension project. This increase was partially offset by the recognition of the gain on our previously held equity interest inSchilling Robotics in 2012.
Foreign currency translation unfavorably impacted operating profit in 2013 by $14.6 million compared to the prior year.
28
Copyright © 2013 www.secdatabase.com. All Rights Reserved.Please Consider the Environment Before Printing This Document
Surface Technologies
2014 Compared With 2013
Surface Technologies’ revenue increased $323.9 million in 2014 compared to the prior year. The revenue increase was driven byinternational growth in our surface wellhead business, primarily in the Middle East and Europe regions. Additionally, revenue in NorthAmerica increased as the North American shale markets had higher activity compared to the prior year which drove additional demandfor our well service pumps and flowline products in our fluid control business and surface wellhead products and services. Foreigncurrency translation unfavorably impacted revenue by $35.9 million in 2014 compared to the prior year.
Surface Technologies’ operating profit totaled $393.0 million, or 18.4% of revenue, in 2014, compared to the prior-year’s operatingprofit as a percentage of revenue of 14.2%. The margin improvement was primarily driven by the following:
• Surface Wellhead - 2.5 percentage point increase due to higher volumes and higher margin projects in the Middle East andEurope regions; and
• Fluid Control - 1.7 percentage point increase due to increased demand for our well service pumps and flowline productsresulting from the improved North American shale markets in 2014.
2013 Compared With 2012
Surface Technologies’ revenue increased $208.7 million in 2013 compared to the prior year. The revenue increase was driven by theacquisition of our completion service business in the fourth quarter of 2012 and our surface wellhead business in the Middle East andEurope regions due to conventional wellhead system sales. These increases were partially offset by a decrease in revenue in our fluidcontrol business resulting from the slowdown of the North American shale markets which have decreased demand for our well servicepumps and flowline products. Foreign currency translation unfavorably impacted revenue by $11.9 million in 2013 compared to theprior year.
Surface Technologies’ operating profit totaled $257.2 million, or 14.2% of revenue, in 2013, compared to the prior-year’s operatingprofit as a percentage of revenue of 17.8%. The margin decline was primarily driven by the following:
• Fluid Control - 2.2 percentage point decrease due to the slowdown in the North American shale markets, primarily from a lackof capacity expansion, which lowered demand for our well service pumps and flowline products;
• Completion Services - 1.8 percentage point decrease due to the inclusion of our completion service business and lower activityin the Canadian market which impacted results; and
• Surface Wellhead - 0.5 percentage point increase due to strong sales of conventional wellhead systems in the Middle East andEurope.
29
Copyright © 2013 www.secdatabase.com. All Rights Reserved.Please Consider the Environment Before Printing This Document
Energy Infrastructure
2014 Compared With 2013
Energy Infrastructure’s revenue decreased $59.8 million in 2014 compared to the prior year. The decrease in revenue was due to the saleof our Material Handling Products business in the second quarter of 2014. Foreign currency translation unfavorably impacted revenueby $4.1 million in 2014 compared to the prior year.
Energy Infrastructure’s operating profit totaled $52.5 million, or 9.4% of revenue, in 2014, compared to the prior-year’s operating profitas a percentage of revenue of 12.0%. The margin decline was primarily driven by the following:
• Automation and Control - 2.0 percentage point decrease due to lower sales volumes and the execution of lower marginprojects; and
• Material Handling - 1.1 percentage point decrease due to the sale of our Material Handling Products business in the secondquarter of 2014.
2013 Compared With 2012
Energy Infrastructure’s revenue increased $43.1 million in 2013 compared to the prior year. The increase in revenue was led by ourmeasurement solutions business due to the strength of North American oil and gas custody and control activity and progress on aloading systems project with Technip for Shell’s Prelude development. Foreign currency translation favorably impacted revenue by $4.2million in 2013 compared to the prior year.
Energy Infrastructure’s operating profit totaled $74.3 million, or 12.0% of revenue, in 2013, compared to the prior-year’s operatingprofit as a percentage of revenue of 11.9%. The margin improvement was primarily driven by the following:
• Separation Systems - 0.6 percentage point increase due to higher sales volumes and cost reduction efforts in SG&A; and
• Measurement Solutions - 0.7 percentage point decrease due to higher overhead costs related to growth initiatives.
30
Copyright © 2013 www.secdatabase.com. All Rights Reserved.Please Consider the Environment Before Printing This Document
Corporate Items
2014 Compared With 2013
Our corporate items reduced earnings by $132.5 million in 2014, compared to $165.6 million in 2013. The year-over-year decreaseprimarily reflected the following:
• favorable variance related to the gain on sale of our Material Handling Products business of $84.3 million;
• favorable variance related to the remeasurement of the Multi Phase Meters earn-out consideration of $25.1 million;
• unfavorable variance in foreign currency, primarily related to an intercompany foreign currency loss, of $59.9 million; and an
• unfavorable variance related to higher corporate staff expenses, primarily from increased bonus accruals, of $20.0 million.
2013 Compared With 2012
Our corporate items reduced earnings by $165.6 million in 2013, compared to $188.3 million in 2012. The year-over-year decreaseprimarily reflected the following:
• favorable variance in foreign currency of $21.5 million;
• favorable variance related to the remeasurement of the Multi Phase Meters contingent earn-out consideration of $13.2 million;
• unfavorable variance related to stock-based compensation expense, primarily from the accelerated vesting of awards forretirement eligible grantees, of $13.6 million; and an
• unfavorable variance related to higher interest expense of $7.1 million.
31
Copyright © 2013 www.secdatabase.com. All Rights Reserved.Please Consider the Environment Before Printing This Document
Inbound Orders and Order Backlog
Inbound orders represent the estimated sales value of confirmed customer orders received during the reporting period.
Inbound OrdersYear Ended December 31,
(In millions) 2014 2013
Subsea Technologies $ 5,547.1 $ 6,510.3Surface Technologies 2,070.4 2,049.1Energy Infrastructure 473.3 605.7Intercompany eliminations and other (6.2) (44.4)Total inbound orders $ 8,084.6 $ 9,120.7
Order backlog is calculated as the estimated sales value of unfilled, confirmed customer orders at the reporting date. Translationnegatively affected backlog by $520.8 million and $374.1 million for the years ended December 31, 2014 and 2013, respectively.
Order BacklogDecember 31,
(In millions) 2014 2013
Subsea Technologies $ 5,793.1 $ 5,988.8Surface Technologies 654.2 742.4Energy Infrastructure 187.0 288.4Intercompany eliminations (14.9) (21.4)Total order backlog $ 6,619.4 $ 6,998.2
Order backlog for Subsea Technologies at December 31, 2014, decreased by $195.7 million compared to December 31, 2013, primarilydue to the negative impact of foreign exchange translation. Subsea Technologies backlog of $5.8 billion at December 31, 2014, wascomposed of various subsea projects, including BP’s Mad Dog Phase 2 and Shah Deniz Stage 2; Chevron’s Agbami; CNRInternational’s Baobab Field Phase 3; Eni’s Block 15/06 East Hub and Jangkrik; ExxonMobil’s Julia; Petrobras’ tree frame agreementand pre-salt tree and manifold award; Statoil’s Snorre B Platform Workover System; Total’s Edradour and Egina; Tullow Ghana’s TEN;and Wintershall’s Maria. We expect to convert approximately 50% to 55% of December 31, 2014 backlog into revenue during 2015.
Order backlog for Surface Technologies at December 31, 2014 decreased by $88.2 million compared to December 31, 2013. Thedecrease was due to high conversion of backlog in the Middle East and the negative impact of foreign exchange translation.
32
Copyright © 2013 www.secdatabase.com. All Rights Reserved.Please Consider the Environment Before Printing This Document
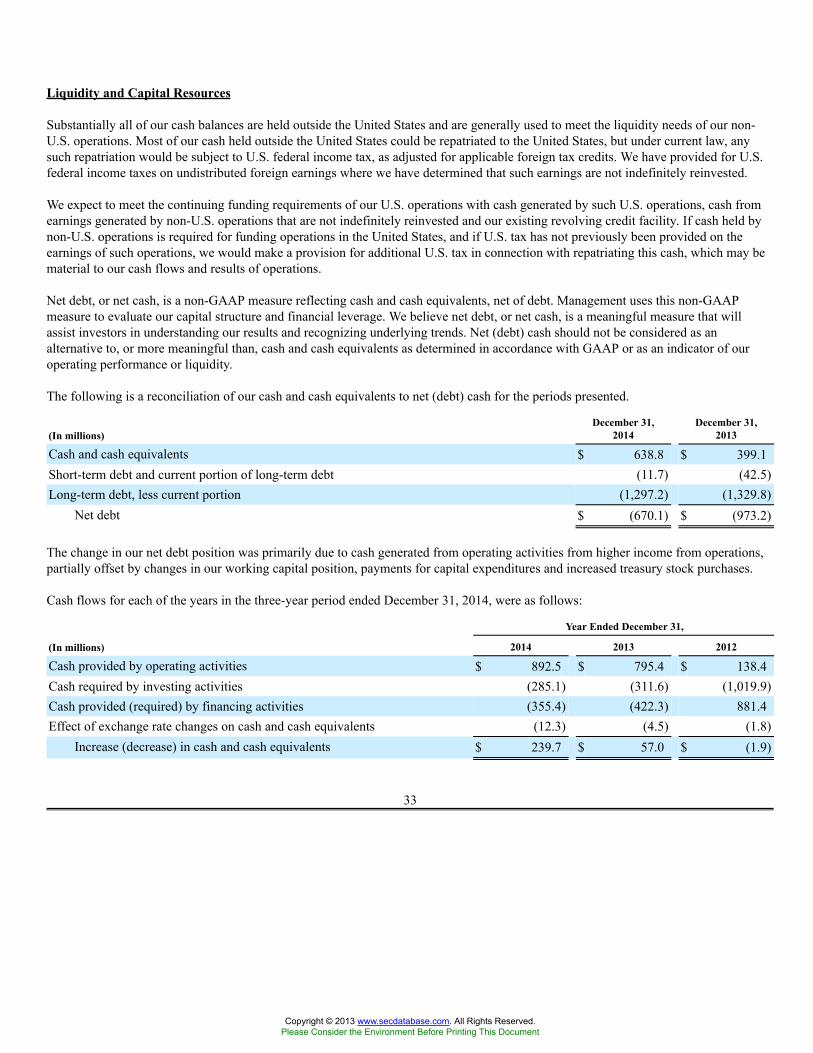
Liquidity and Capital Resources
Substantially all of our cash balances are held outside the United States and are generally used to meet the liquidity needs of our non-U.S. operations. Most of our cash held outside the United States could be repatriated to the United States, but under current law, anysuch repatriation would be subject to U.S. federal income tax, as adjusted for applicable foreign tax credits. We have provided for U.S.federal income taxes on undistributed foreign earnings where we have determined that such earnings are not indefinitely reinvested.
We expect to meet the continuing funding requirements of our U.S. operations with cash generated by such U.S. operations, cash fromearnings generated by non-U.S. operations that are not indefinitely reinvested and our existing revolving credit facility. If cash held bynon-U.S. operations is required for funding operations in the United States, and if U.S. tax has not previously been provided on theearnings of such operations, we would make a provision for additional U.S. tax in connection with repatriating this cash, which may bematerial to our cash flows and results of operations.
Net debt, or net cash, is a non-GAAP measure reflecting cash and cash equivalents, net of debt. Management uses this non-GAAPmeasure to evaluate our capital structure and financial leverage. We believe net debt, or net cash, is a meaningful measure that willassist investors in understanding our results and recognizing underlying trends. Net (debt) cash should not be considered as analternative to, or more meaningful than, cash and cash equivalents as determined in accordance with GAAP or as an indicator of ouroperating performance or liquidity.
The following is a reconciliation of our cash and cash equivalents to net (debt) cash for the periods presented.
(In millions)December 31,
2014December 31,
2013
Cash and cash equivalents $ 638.8 $ 399.1Short-term debt and current portion of long-term debt (11.7) (42.5)Long-term debt, less current portion (1,297.2) (1,329.8)
Net debt $ (670.1) $ (973.2)
The change in our net debt position was primarily due to cash generated from operating activities from higher income from operations,partially offset by changes in our working capital position, payments for capital expenditures and increased treasury stock purchases.
Cash flows for each of the years in the three-year period ended December 31, 2014, were as follows:
Year Ended December 31,
(In millions) 2014 2013 2012
Cash provided by operating activities $ 892.5 $ 795.4 $ 138.4Cash required by investing activities (285.1) (311.6) (1,019.9)Cash provided (required) by financing activities (355.4) (422.3) 881.4Effect of exchange rate changes on cash and cash equivalents (12.3) (4.5) (1.8)
Increase (decrease) in cash and cash equivalents $ 239.7 $ 57.0 $ (1.9)
33
Copyright © 2013 www.secdatabase.com. All Rights Reserved.Please Consider the Environment Before Printing This Document
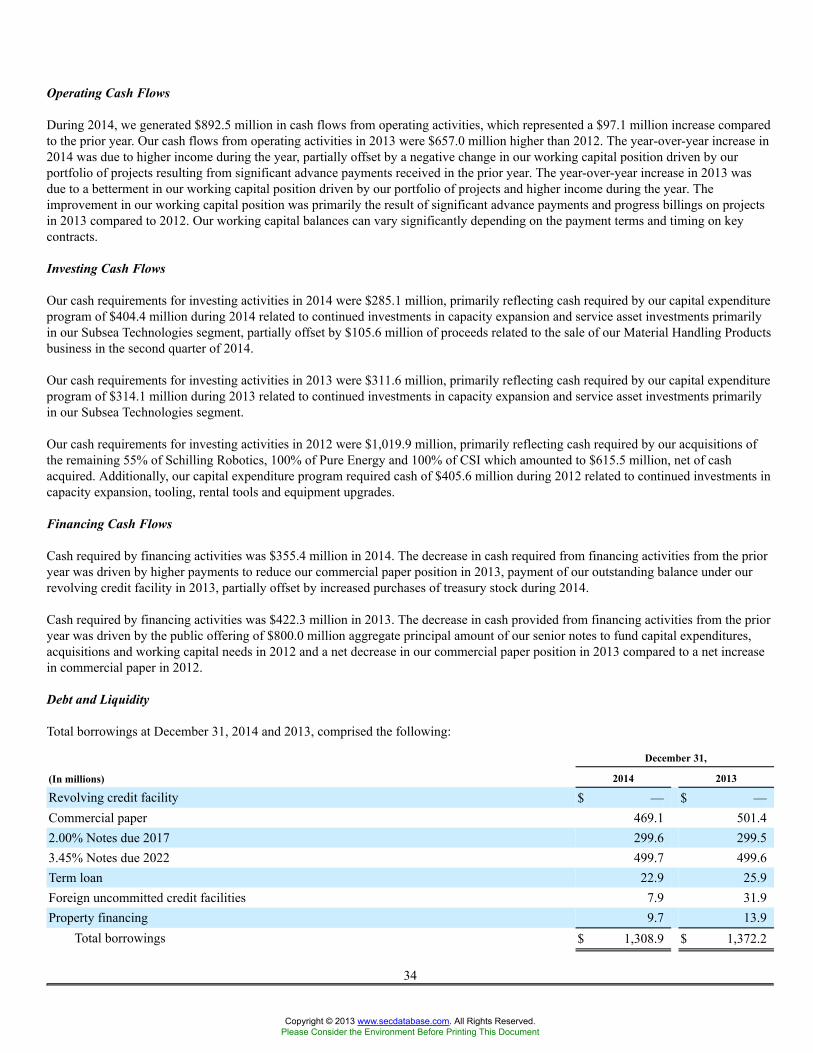
Operating Cash Flows
During 2014, we generated $892.5 million in cash flows from operating activities, which represented a $97.1 million increase comparedto the prior year. Our cash flows from operating activities in 2013 were $657.0 million higher than 2012. The year-over-year increase in2014 was due to higher income during the year, partially offset by a negative change in our working capital position driven by ourportfolio of projects resulting from significant advance payments received in the prior year. The year-over-year increase in 2013 wasdue to a betterment in our working capital position driven by our portfolio of projects and higher income during the year. Theimprovement in our working capital position was primarily the result of significant advance payments and progress billings on projectsin 2013 compared to 2012. Our working capital balances can vary significantly depending on the payment terms and timing on keycontracts.
Investing Cash Flows
Our cash requirements for investing activities in 2014 were $285.1 million, primarily reflecting cash required by our capital expenditureprogram of $404.4 million during 2014 related to continued investments in capacity expansion and service asset investments primarilyin our Subsea Technologies segment, partially offset by $105.6 million of proceeds related to the sale of our Material Handling Productsbusiness in the second quarter of 2014.
Our cash requirements for investing activities in 2013 were $311.6 million, primarily reflecting cash required by our capital expenditureprogram of $314.1 million during 2013 related to continued investments in capacity expansion and service asset investments primarilyin our Subsea Technologies segment.
Our cash requirements for investing activities in 2012 were $1,019.9 million, primarily reflecting cash required by our acquisitions ofthe remaining 55% of Schilling Robotics, 100% of Pure Energy and 100% of CSI which amounted to $615.5 million, net of cashacquired. Additionally, our capital expenditure program required cash of $405.6 million during 2012 related to continued investments incapacity expansion, tooling, rental tools and equipment upgrades.
Financing Cash Flows
Cash required by financing activities was $355.4 million in 2014. The decrease in cash required from financing activities from the prioryear was driven by higher payments to reduce our commercial paper position in 2013, payment of our outstanding balance under ourrevolving credit facility in 2013, partially offset by increased purchases of treasury stock during 2014.
Cash required by financing activities was $422.3 million in 2013. The decrease in cash provided from financing activities from the prioryear was driven by the public offering of $800.0 million aggregate principal amount of our senior notes to fund capital expenditures,acquisitions and working capital needs in 2012 and a net decrease in our commercial paper position in 2013 compared to a net increasein commercial paper in 2012.
Debt and Liquidity
Total borrowings at December 31, 2014 and 2013, comprised the following:
December 31,
(In millions) 2014 2013
Revolving credit facility $ — $ —Commercial paper 469.1 501.42.00% Notes due 2017 299.6 299.53.45% Notes due 2022 499.7 499.6Term loan 22.9 25.9Foreign uncommitted credit facilities 7.9 31.9Property financing 9.7 13.9
Total borrowings $ 1,308.9 $ 1,372.2
34
Copyright © 2013 www.secdatabase.com. All Rights Reserved.Please Consider the Environment Before Printing This Document
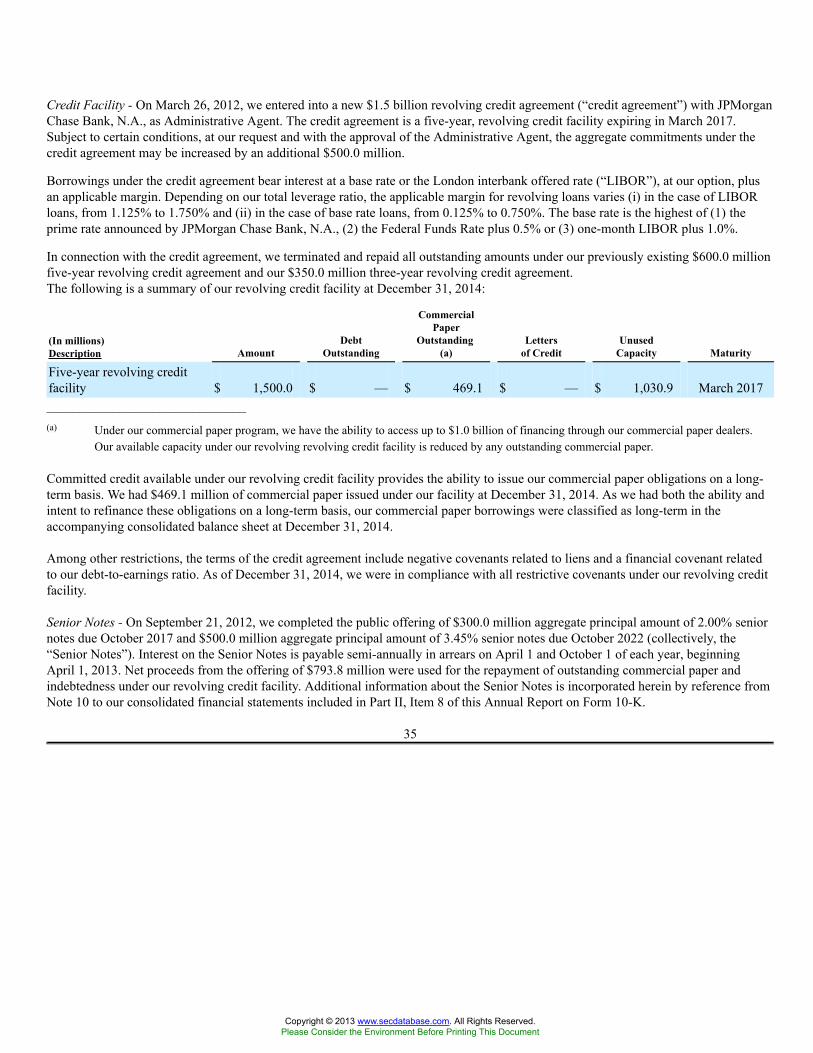
Credit Facility - On March 26, 2012, we entered into a new $1.5 billion revolving credit agreement (“credit agreement”) with JPMorganChase Bank, N.A., as Administrative Agent. The credit agreement is a five-year, revolving credit facility expiring in March 2017.Subject to certain conditions, at our request and with the approval of the Administrative Agent, the aggregate commitments under thecredit agreement may be increased by an additional $500.0 million.
Borrowings under the credit agreement bear interest at a base rate or the London interbank offered rate (“LIBOR”), at our option, plusan applicable margin. Depending on our total leverage ratio, the applicable margin for revolving loans varies (i) in the case of LIBORloans, from 1.125% to 1.750% and (ii) in the case of base rate loans, from 0.125% to 0.750%. The base rate is the highest of (1) theprime rate announced by JPMorgan Chase Bank, N.A., (2) the Federal Funds Rate plus 0.5% or (3) one-month LIBOR plus 1.0%.
In connection with the credit agreement, we terminated and repaid all outstanding amounts under our previously existing $600.0 millionfive-year revolving credit agreement and our $350.0 million three-year revolving credit agreement.The following is a summary of our revolving credit facility at December 31, 2014:
(In millions)Description Amount
DebtOutstanding
CommercialPaper
Outstanding(a)
Lettersof Credit
UnusedCapacity Maturity
Five-year revolving creditfacility $ 1,500.0 $ — $ 469.1 $ — $ 1,030.9 March 2017______________________________(a) Under our commercial paper program, we have the ability to access up to $1.0 billion of financing through our commercial paper dealers.
Our available capacity under our revolving revolving credit facility is reduced by any outstanding commercial paper.
Committed credit available under our revolving credit facility provides the ability to issue our commercial paper obligations on a long-term basis. We had $469.1 million of commercial paper issued under our facility at December 31, 2014. As we had both the ability andintent to refinance these obligations on a long-term basis, our commercial paper borrowings were classified as long-term in theaccompanying consolidated balance sheet at December 31, 2014.
Among other restrictions, the terms of the credit agreement include negative covenants related to liens and a financial covenant relatedto our debt-to-earnings ratio. As of December 31, 2014, we were in compliance with all restrictive covenants under our revolving creditfacility.
Senior Notes - On September 21, 2012, we completed the public offering of $300.0 million aggregate principal amount of 2.00% seniornotes due October 2017 and $500.0 million aggregate principal amount of 3.45% senior notes due October 2022 (collectively, the“Senior Notes”). Interest on the Senior Notes is payable semi-annually in arrears on April 1 and October 1 of each year, beginningApril 1, 2013. Net proceeds from the offering of $793.8 million were used for the repayment of outstanding commercial paper andindebtedness under our revolving credit facility. Additional information about the Senior Notes is incorporated herein by reference fromNote 10 to our consolidated financial statements included in Part II, Item 8 of this Annual Report on Form 10-K.
35
Copyright © 2013 www.secdatabase.com. All Rights Reserved.Please Consider the Environment Before Printing This Document
Outlook for 2015
Historically, we have generated our liquidity and capital resources primarily through operations and, when needed, through our creditfacility. We have $1,030.9 million in capacity available under our revolving credit facility that we expect to utilize if working capitalneeds temporarily increase in response to market demand. The volatility in credit, equity and commodity markets creates someuncertainty for our businesses. However, management believes, based on our current financial condition, existing backlog levels andcurrent expectations for future market conditions, that we will continue to meet our short- and long-term liquidity needs with acombination of cash on hand, cash generated from operations and access to capital markets. Although we will continue to reachpayment milestones on many of our projects, we expect our consolidated operating cash flow position in 2015 to slightly decrease as aresult of the negative impact the decline in commodity prices will have on our overall business.
We expect to make contributions of approximately $15.9 million to our international pension plans during 2015. Actual contributionamounts are dependent upon plan investment returns, changes in pension obligations, regulatory environments and other economicfactors. We update our pension estimates annually or more frequently upon the occurrence of significant events. Additionally, we expectto make contributions of approximately $4.0 million to our U.S. Non-Qualified Defined Benefit Pension Plan during 2015.
We project spending approximately $300 million in 2015 for capital expenditures, largely towards our growth of our subsea serviceofferings. During the second quarter of 2015, we expect to remit most of the $10 million withheld purchase price related to theacquisition of our automation and control business. Additional information is incorporated herein by reference from Note 4 to ourconsolidated financial statements included in Part II, Item 8 of this Annual Report on Form 10-K. Further, we expect to continue ourstock repurchases authorized by our Board of Directors, with the timing and amounts of these repurchases dependent upon marketconditions and liquidity; however, we expect to repurchase approximately $100 million of common stock during 2015.
We continue to evaluate acquisitions, divestitures and joint ventures that meet our strategic priorities. Our intent is to maintain a level offinancing sufficient to meet these objectives.
36
Copyright © 2013 www.secdatabase.com. All Rights Reserved.Please Consider the Environment Before Printing This Document
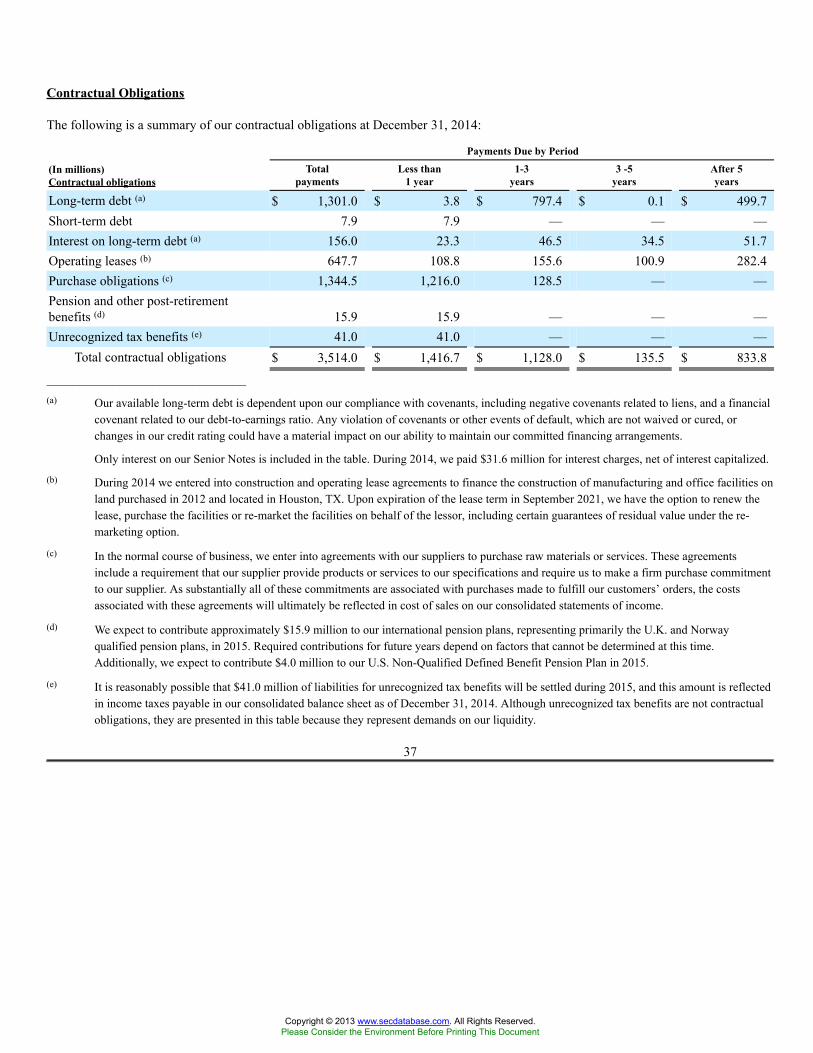
Contractual Obligations
The following is a summary of our contractual obligations at December 31, 2014:
Payments Due by Period
(In millions)Contractual obligations
Totalpayments
Less than1 year
1-3years
3 -5years
After 5years
Long-term debt (a) $ 1,301.0 $ 3.8 $ 797.4 $ 0.1 $ 499.7Short-term debt 7.9 7.9 — — —Interest on long-term debt (a) 156.0 23.3 46.5 34.5 51.7Operating leases (b) 647.7 108.8 155.6 100.9 282.4Purchase obligations (c) 1,344.5 1,216.0 128.5 — —Pension and other post-retirementbenefits (d) 15.9 15.9 — — —Unrecognized tax benefits (e) 41.0 41.0 — — —
Total contractual obligations $ 3,514.0 $ 1,416.7 $ 1,128.0 $ 135.5 $ 833.8______________________________(a) Our available long-term debt is dependent upon our compliance with covenants, including negative covenants related to liens, and a financial
covenant related to our debt-to-earnings ratio. Any violation of covenants or other events of default, which are not waived or cured, orchanges in our credit rating could have a material impact on our ability to maintain our committed financing arrangements.
Only interest on our Senior Notes is included in the table. During 2014, we paid $31.6 million for interest charges, net of interest capitalized.
(b) During 2014 we entered into construction and operating lease agreements to finance the construction of manufacturing and office facilities onland purchased in 2012 and located in Houston, TX. Upon expiration of the lease term in September 2021, we have the option to renew thelease, purchase the facilities or re-market the facilities on behalf of the lessor, including certain guarantees of residual value under the re-marketing option.
(c) In the normal course of business, we enter into agreements with our suppliers to purchase raw materials or services. These agreementsinclude a requirement that our supplier provide products or services to our specifications and require us to make a firm purchase commitmentto our supplier. As substantially all of these commitments are associated with purchases made to fulfill our customers’ orders, the costsassociated with these agreements will ultimately be reflected in cost of sales on our consolidated statements of income.
(d) We expect to contribute approximately $15.9 million to our international pension plans, representing primarily the U.K. and Norwayqualified pension plans, in 2015. Required contributions for future years depend on factors that cannot be determined at this time.Additionally, we expect to contribute $4.0 million to our U.S. Non-Qualified Defined Benefit Pension Plan in 2015.
(e) It is reasonably possible that $41.0 million of liabilities for unrecognized tax benefits will be settled during 2015, and this amount is reflectedin income taxes payable in our consolidated balance sheet as of December 31, 2014. Although unrecognized tax benefits are not contractualobligations, they are presented in this table because they represent demands on our liquidity.
37
Copyright © 2013 www.secdatabase.com. All Rights Reserved.Please Consider the Environment Before Printing This Document
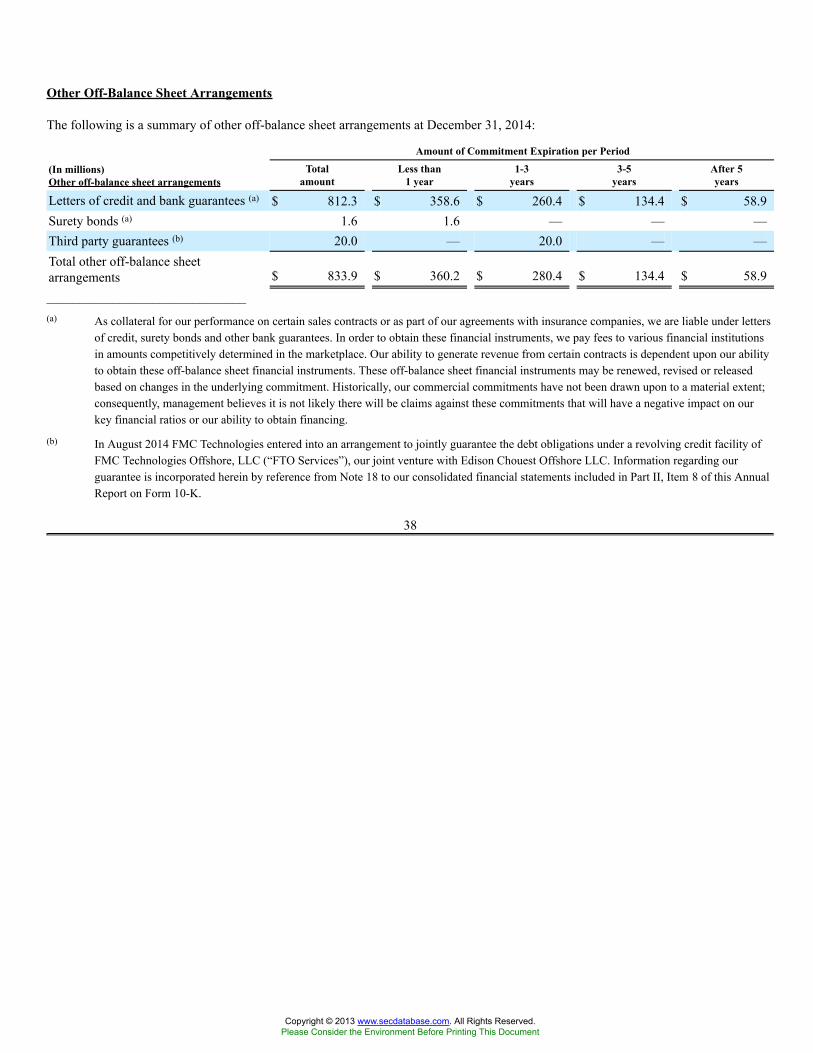
Other Off-Balance Sheet Arrangements
The following is a summary of other off-balance sheet arrangements at December 31, 2014:
Amount of Commitment Expiration per Period
(In millions)Other off-balance sheet arrangements
Totalamount
Less than1 year
1-3years
3-5years
After 5years
Letters of credit and bank guarantees (a) $ 812.3 $ 358.6 $ 260.4 $ 134.4 $ 58.9Surety bonds (a) 1.6 1.6 — — —Third party guarantees (b) 20.0 — 20.0 — —Total other off-balance sheetarrangements $ 833.9 $ 360.2 $ 280.4 $ 134.4 $ 58.9______________________________(a) As collateral for our performance on certain sales contracts or as part of our agreements with insurance companies, we are liable under letters
of credit, surety bonds and other bank guarantees. In order to obtain these financial instruments, we pay fees to various financial institutionsin amounts competitively determined in the marketplace. Our ability to generate revenue from certain contracts is dependent upon our abilityto obtain these off-balance sheet financial instruments. These off-balance sheet financial instruments may be renewed, revised or releasedbased on changes in the underlying commitment. Historically, our commercial commitments have not been drawn upon to a material extent;consequently, management believes it is not likely there will be claims against these commitments that will have a negative impact on ourkey financial ratios or our ability to obtain financing.
(b) In August 2014 FMC Technologies entered into an arrangement to jointly guarantee the debt obligations under a revolving credit facility ofFMC Technologies Offshore, LLC (“FTO Services”), our joint venture with Edison Chouest Offshore LLC. Information regarding ourguarantee is incorporated herein by reference from Note 18 to our consolidated financial statements included in Part II, Item 8 of this AnnualReport on Form 10-K.
38
Copyright © 2013 www.secdatabase.com. All Rights Reserved.Please Consider the Environment Before Printing This Document
Critical Accounting EstimatesThe preparation of financial statements in conformity with U.S. generally accepted accounting principles requires management to makecertain estimates, judgments and assumptions about future events that affect the reported amounts of assets and liabilities at the date ofthe financial statements, the reported amounts of revenue and expenses during the periods presented and the related disclosures in theaccompanying notes to the financial statements. Management has reviewed these critical accounting estimates with the AuditCommittee of our Board of Directors. We believe the following critical accounting estimates used in preparing our financial statementsaddress all important accounting areas where the nature of the estimates or assumptions is material due to the levels of subjectivity andjudgment necessary to account for highly uncertain matters or the susceptibility of such matters to change. See Note 1 to ourconsolidated financial statements included in Part II, Item 8 of this Annual Report on Form 10-K for a description of our significantaccounting policies.
Percentage of Completion Method of AccountingWe recognize revenue on construction-type manufacturing projects using the percentage of completion method of accounting wherebyrevenue is recognized as work progresses on each contract. There are several acceptable methods under U.S. generally acceptedaccounting principles of measuring progress toward completion. Most frequently, we use the ratio of costs incurred to date to totalestimated contract costs at completion to measure progress toward completion.
We execute contracts with our customers that clearly describe the equipment, systems and/or services that we will provide and theamount of consideration we will receive. After analyzing the drawings and specifications of the contract requirements, our projectengineers estimate total contract costs based on their experience with similar projects and then adjust these estimates for specific risksassociated with each project, such as technical risks associated with a new design. Costs associated with specific risks are estimated byassessing the probability that conditions arising from these specific risks will affect our total cost to complete the project. After work ona project begins, assumptions that form the basis for our calculation of total project cost are examined on a regular basis and ourestimates are updated to reflect the most current information and management’s best judgment.
Revenue recognized using the percentage of completion method of accounting was approximately 52%, 55% and 51% of total revenuerecognized for the years ended December 31, 2014, 2013 and 2012, respectively. A significant portion of our total revenue recognizedunder the percentage of completion method of accounting relates to our Subsea Technologies segment, primarily for subsea explorationand production equipment projects that involve the design, engineering, manufacturing and assembly of complex, customer-specificsystems. The systems are not entirely built from standard bills of material and typically require extended periods of time to design andconstruct.
Total estimated contract cost affects both the revenue recognized in a period as well as the reported profit or loss on a project. Thedetermination of profit or loss on a contract requires consideration of contract revenue, change orders and claims, less costs incurred todate and estimated costs to complete. Profits are recognized based on the estimated project profit multiplied by the percentage complete.Adjustments to estimates of contract revenue, total contract cost, or extent of progress toward completion are often required as workprogresses under the contract and as experience is gained, even though the scope of work required under the contract may not change.The nature of accounting for contracts under the percentage of completion method of accounting is such that refinements of theestimating process for changing conditions and new developments are continuous and characteristic of the process. Consequently, theamount of revenue recognized using the percentage of completion method of accounting is sensitive to changes in our estimates of totalcontract costs. For each contract in progress at December 31, 2014, a 1% increase or decrease in the estimated margin earned on eachcontract would have increased or decreased total revenue and pre-tax income by $33.1 million for the year ended December 31, 2014.
The total estimated contract cost in the percentage of completion method of accounting is a critical accounting estimate because it canmaterially affect revenue and profit and requires us to make judgments about matters that are uncertain. There are many factors,including, but not limited to, the ability to properly execute the engineering and designing phases consistent with our customers’expectations, the availability and costs of labor and material resources, productivity and weather, that can affect the accuracy of our costestimates, and ultimately, our future profitability. In the past, we have realized both lower and higher than expected margins and haveincurred losses as a result of unforeseen changes in our project costs; however, historically, our estimates have been reasonablydependable regarding the recognition of revenue and profit on contracts using the percentage of completion method of accounting.
39
Copyright © 2013 www.secdatabase.com. All Rights Reserved.Please Consider the Environment Before Printing This Document
Inventory ValuationInventory is recorded at the lower of cost or net realizable value. In order to determine net realizable value, we evaluate each componentof inventory on a regular basis to determine whether it is excess or obsolete. We record the decline in the carrying value of estimatedexcess or obsolete inventory as a reduction of inventory and as an expense included in cost of sales in the period in which it isidentified. Our estimate of excess and obsolete inventory is a critical accounting estimate because it is highly susceptible to change fromperiod to period. In addition, the estimate requires management to make judgments about the future demand for inventory.
In order to quantify excess or obsolete inventory, we begin by preparing a candidate listing of the components of inventory that have aquantity on hand in excess of usage within the most recent two-year period. The list is reviewed with sales, engineering, production andmaterials management personnel to determine whether the list of potential excess or obsolete inventory items is accurate. As part of thisevaluation, management considers whether there has been a change in the market for finished goods, whether there will be futuredemand for on-hand inventory items and whether there are components of inventory that incorporate obsolete technology. Finally, anassessment is made of our historical usage of inventory previously written off as excess or obsolete, and a further adjustment to theestimate is made based on this historical experience. As a result, our estimate of excess or obsolete inventory is sensitive to changes inassumptions about future usage of inventory. See Note 6 to our consolidated financial statements included in Part II, Item 8 of thisAnnual Report on Form 10-K for additional information related to inventory valuation adjustments.
Impairment of Long-Lived and Intangible AssetsLong-lived assets, including property, plant and equipment, identifiable intangible assets being amortized and capitalized software costsare reviewed for impairment whenever events or changes in circumstances indicate the carrying amount of the long-lived asset may notbe recoverable. The carrying amount of a long-lived asset is not recoverable if it exceeds the sum of the undiscounted cash flowsexpected to result from the use and eventual disposition of the asset. If it is determined that an impairment loss has occurred, the loss ismeasured as the amount by which the carrying amount of the long-lived asset exceeds its fair value. The determination of future cashflows as well as the estimated fair value of long-lived assets involves significant estimates on the part of management. Because thereusually is a lack of quoted market prices for long-lived assets, fair value of impaired assets is typically determined based on the presentvalues of expected future cash flows using discount rates believed to be consistent with those used by principal market participants, orbased on a multiple of operating cash flow validated with historical market transactions of similar assets where possible. The expectedfuture cash flows used for impairment reviews and related fair value calculations are based on judgmental assessments of futureproductivity of the asset, operating costs and capital decisions and all available information at the date of review.
Impairment of GoodwillGoodwill is not subject to amortization but is tested for impairment on an annual basis, or more frequently if impairment indicatorsarise. We have established October 31 as the date of our annual test for impairment of goodwill. Reporting units with goodwill are testedfor impairment by first assessing qualitative factors to determine whether the existence of events or circumstances leads to adetermination that it is more likely than not that the fair value of the reporting unit is less than its carrying amount. If after assessing thetotality of events or circumstances, or based on management’s judgment, we determine it is more likely than not that the fair value of areporting unit is less than its carrying amount, a two-step quantitative impairment test is performed.
When using the two-step quantitative impairment test, determining the fair value of a reporting unit is judgmental in nature and involvesthe use of significant estimates and assumptions. We estimate the fair value of our reporting units using a discounted future cash flowmodel. The majority of the estimates and assumptions used in a discounted future cash flow model involve unobservable inputsreflecting management’s own assumptions about the assumptions market participants would use in estimating the fair value of abusiness. These estimates and assumptions include revenue growth rates and operating margins used to calculate projected future cashflows, discount rates and future economic and market conditions. Our estimates are based upon assumptions believed to be reasonable,but which are inherently uncertain and unpredictable and do not reflect unanticipated events and circumstances that may occur.
40
Copyright © 2013 www.secdatabase.com. All Rights Reserved.Please Consider the Environment Before Printing This Document
At December 31, 2014, recorded goodwill of $75.8 million was associated with our completion services reporting unit. The recentdecline in crude oil prices has introduced some uncertainty associated with certain key assumptions used in estimating fair value of thereporting unit. Depressed crude oil prices for a prolonged period of time may adversely affect the economics of certain of ourcustomers’ projects, particularly for shale-related projects in North America, and may reduce the demand for completion services,negatively impacting the financial results of the reporting unit. Management is monitoring the overall market, specifically crude oilprices, and its effect on the estimates and assumptions used in our goodwill impairment test for completion services, which may requirere-evaluation and could result in an impairment of goodwill for this reporting unit.
At December 31, 2014, recorded goodwill of $30.7 million was associated with our automation and control reporting unit. During 2014the automation and control reporting unit realized significantly lower sales volumes, leading to negative operating results for the yearand creating some uncertainty regarding future demand for certain products. Management has undertaken efforts to integrate thereporting unit’s UCOS® product with our Master Control Station in our subsea systems business to promote cost and efficiency savingsin our subsea product offering by utilizing the UCOS® Master Control Station as the standard for control system applications in subseaproduction, processing and workover systems. Management is evaluating the realizability of these savings and its effect on the estimatesand assumptions used in our goodwill impairment test for automation and control, which may require re-evaluation and could result inan impairment of goodwill for this reporting unit.
A lower fair value estimate in the future for any of our reporting units, specifically our completion services and automation and controlreporting units, could result in goodwill impairments. Factors that could trigger a lower fair value estimate include sustained pricedeclines of the reporting unit’s products and services, cost increases, regulatory or political environment changes, changes in customerdemand, and other changes in market conditions, which may affect certain market participant assumptions used in the discounted futurecash flow model. We did not recognize any goodwill impairment for the years ended December 31, 2014 or 2013, as the fair values ofour reporting units with goodwill balances exceeded their carrying amounts. In addition, there were no negative conditions, or triggeringevents, that occurred in 2014 or 2013 requiring us to perform additional impairment reviews.
Accounting for Income Taxes
Our income tax expense, deferred tax assets and liabilities, and reserves for uncertain tax positions reflect management’s bestassessment of estimated future taxes to be paid. We are subject to income taxes in the United States and numerous foreignjurisdictions. Significant judgments and estimates are required in determining our consolidated income tax expense.
In determining our current income tax provision, we assess temporary differences resulting from differing treatments of items for taxand accounting purposes. These differences result in deferred tax assets and liabilities, which are recorded in our consolidated balancesheets. When we maintain deferred tax assets, we must assess the likelihood that these assets will be recovered through adjustments tofuture taxable income. To the extent we believe recovery is not likely, we establish a valuation allowance. We record an allowancereducing the asset to a value we believe will be recoverable based on our expectation of future taxable income. We believe theaccounting estimate related to the valuation allowance is a critical accounting estimate because it is highly susceptible to change fromperiod to period, requires management to make assumptions about our future income over the lives of the deferred tax assets, andfinally, the impact of increasing or decreasing the valuation allowance is potentially material to our results of operations.
Forecasting future income requires us to use a significant amount of judgment. In estimating future income, we use our internaloperating budgets and long-range planning projections. We develop our budgets and long-range projections based on recent results,trends, economic and industry forecasts influencing our segments’ performance, our backlog, planned timing of new product launchesand customer sales commitments. Significant changes in the expected realizability of a deferred tax asset would require that we adjustthe valuation allowance applied against the gross value of our total deferred tax assets, resulting in a change to net income.
41
Copyright © 2013 www.secdatabase.com. All Rights Reserved.Please Consider the Environment Before Printing This Document
As of December 31, 2014, we believe that it is not more likely than not that we will generate future taxable income in certain foreignjurisdictions in which we have cumulative net operating losses and, therefore, we have provided a valuation allowance against therelated deferred tax assets. As of December 31, 2014, we believe that it is more likely than not that we will have future taxable incomein the United States to utilize our domestic deferred tax assets. Therefore, we have not provided a valuation allowance against anydomestic deferred tax assets.
The need for a valuation allowance is sensitive to changes in our estimate of future taxable income. If our estimate of future taxableincome was 25% lower than the estimate used, we would still generate sufficient taxable income to utilize such domestic deferred taxassets.
The calculation of our income tax expense involves dealing with uncertainties in the application of complex tax laws and regulations innumerous jurisdictions in which we operate. We recognize tax benefits related to uncertain tax positions when, in our judgment, it ismore likely than not that such positions will be sustained on examination, including resolutions of any related appeals or litigation,based on the technical merits. We adjust our liabilities for uncertain tax positions when our judgment changes as a result of newinformation previously unavailable. Due to the complexity of some of these uncertainties, their ultimate resolution may result inpayments that are materially different from our current estimates. Any such differences will be reflected as adjustments to income taxexpense in the periods in which they are determined.
Accounting for Pension and Other Post-Retirement Benefit PlansOur pension and other post-retirement (health care and life insurance) obligations are described in Note 12 to our consolidated financialstatements included in Part II, Item 8 of this Annual Report on Form 10-K.
The determination of the projected benefit obligations of our pension and other post-retirement benefit plans are important to therecorded amounts of such obligations on our consolidated balance sheet and to the amount of pension expense in our consolidatedstatements of income. In order to measure the obligations and expense associated with our pension benefits, management must make avariety of estimates, including discount rates used to value certain liabilities, expected return on plan assets set aside to fund these costs,rate of compensation increase, employee turnover rates, retirement rates, mortality rates and other factors. We update these estimates onan annual basis or more frequently upon the occurrence of significant events. These accounting estimates bear the risk of change due tothe uncertainty and difficulty in estimating these measures. Different estimates used by management could result in our recognition ofdifferent amounts of expense over different periods of time.
Due to the specialized and statistical nature of these calculations which attempt to anticipate future events, we engage third-partyspecialists to assist management in evaluating our assumptions as well as appropriately measuring the costs and obligations associatedwith these pension benefits. The discount rate and expected long-term rate of return on plan assets are primarily based on investmentyields available and the historical performance of our plan assets, respectively. These measures are critical accounting estimates becausethey are subject to management’s judgment and can materially affect net income.
The discount rate affects the interest cost component of net periodic pension cost and the calculation of the projected benefit obligation.The discount rate is based on rates at which the pension benefit obligation could be effectively settled on a present value basis. Discountrates are derived by identifying a theoretical settlement portfolio of long-term, high quality (“AA” rated) corporate bonds at ourdetermination date that is sufficient to provide for the projected pension benefit payments. A single discount rate is determined thatresults in a discounted value of the pension benefit payments that equate to the market value of the selected bonds. The resultingdiscount rate is reflective of both the current interest rate environment and the pension’s distinct liability characteristics. Significantchanges in the discount rate, such as those caused by changes in the yield curve, the mix of bonds available in the market, the durationof selected bonds and the timing of expected benefit payments, may result in volatility in our pension expense and pension liabilities.
The expected long-term rate of return on plan assets is a component of net periodic pension cost. Our estimate of the expected long-termrate of return on plan assets is primarily based on the historical performance of plan assets, current market conditions, our assetallocation and long-term growth expectations. The difference between the expected return and the actual return on plan assets isamortized over the expected remaining service life of employees, resulting in a lag time between the market’s performance and itsimpact on plan results.
42
Copyright © 2013 www.secdatabase.com. All Rights Reserved.Please Consider the Environment Before Printing This Document
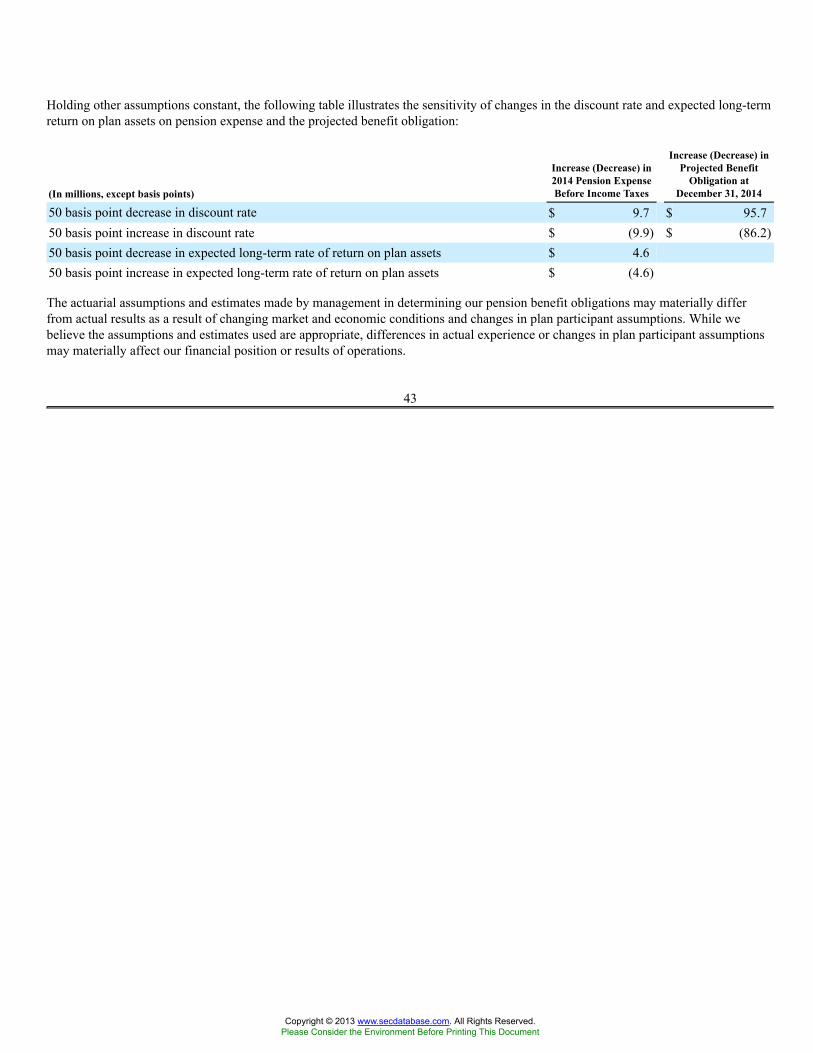
Holding other assumptions constant, the following table illustrates the sensitivity of changes in the discount rate and expected long-termreturn on plan assets on pension expense and the projected benefit obligation:
(In millions, except basis points)
Increase (Decrease) in2014 Pension ExpenseBefore Income Taxes
Increase (Decrease) inProjected Benefit
Obligation atDecember 31, 2014
50 basis point decrease in discount rate $ 9.7 $ 95.750 basis point increase in discount rate $ (9.9) $ (86.2)50 basis point decrease in expected long-term rate of return on plan assets $ 4.650 basis point increase in expected long-term rate of return on plan assets $ (4.6)
The actuarial assumptions and estimates made by management in determining our pension benefit obligations may materially differfrom actual results as a result of changing market and economic conditions and changes in plan participant assumptions. While webelieve the assumptions and estimates used are appropriate, differences in actual experience or changes in plan participant assumptionsmay materially affect our financial position or results of operations.
43
Copyright © 2013 www.secdatabase.com. All Rights Reserved.Please Consider the Environment Before Printing This Document
Other MattersDuring the second quarter of 2014, the Company received an inquiry and a subpoena from the SEC seeking information about accrualswithin the automation and control business unit for paid time off (“PTO”). The inquiry addressed the reversal of an accrual for PTOwhich understated the liability for PTO in the business unit for the quarter ended March 31, 2013. During the fourth quarter of 2014, theCompany informed the SEC about an additional matter the Company identified within the automation and control business unit. TheCompany received a second subpoena in the fourth quarter of 2014. The Company has cooperated and fully responded to all requestsfor information. The Company has assessed the matters individually and collectively and concluded the impact is immaterial to theCompany’s consolidated financial statements as of and for the year ended December 31, 2014. The Company discussed these matterswith its independent registered public accounting firm and the Company’s Audit Committee.
Recently Issued Accounting Standards
In May 2014, the FASB issued Accounting Standards Update (“ASU”) No. 2014-09, “Revenue from Contracts with Customers.” Thisupdate requires an entity to recognize revenue to depict the transfer of promised goods or services to customers in an amount thatreflects the consideration to which the entity expects to be entitled in exchange for those goods or services. The ASU will supersedemost existing GAAP related to revenue recognition and will supersede some cost guidance in existing GAAP related to construction-type and production-type contract accounting. Additionally, the ASU will significantly increase disclosures related to revenuerecognition. The amendments in the ASU are effective for the Company on January 1, 2017. Early application is not permitted. Entitiesare permitted to apply the amendments either retrospectively to each prior reporting period presented or retrospectively with thecumulative effect of initially applying the ASU recognized at the date of initial application. The Company has not determined themethod to be utilized upon adoption. The impacts that adoption of the ASU is expected to have on the Company’s consolidated financialstatements and related disclosures are being evaluated. Additionally, the Company has not determined the effect of the ASU on itsinternal control over financial reporting or other changes in business practices and processes.
Management believes that other recently issued accounting standards, which are not yet effective, will not have a material impact on ourconsolidated financial statements upon adoption.
44
Copyright © 2013 www.secdatabase.com. All Rights Reserved.Please Consider the Environment Before Printing This Document
ITEM 7A. QUANTITATIVE AND QUALITATIVE DISCLOSURES ABOUT MARKET RISKWe are subject to financial market risks, including fluctuations in foreign currency exchange rates and interest rates. In order to manageand mitigate our exposure to these risks, we may use derivative financial instruments in accordance with established policies andprocedures. We do not use derivative financial instruments where the objective is to generate profits solely from trading activities. AtDecember 31, 2014 and 2013, substantially all of our derivative holdings consisted of foreign currency forward contracts and foreigncurrency instruments embedded in purchase and sale contracts.
These forward-looking disclosures only address potential impacts from market risks as they affect our financial instruments and do notinclude other potential effects that could impact our business as a result of changes in foreign currency exchange rates, interest rates,commodity prices or equity prices.
Foreign Currency Exchange Rate RiskWe conduct operations around the world in a number of different currencies. Most of our significant foreign subsidiaries havedesignated the local currency as their functional currency. Our earnings are therefore subject to change due to fluctuations in foreigncurrency exchange rates when the earnings in foreign currencies are translated into U.S. dollars. We do not hedge this translation impacton earnings. A 10% increase or decrease in the average exchange rates of all foreign currencies at December 31, 2014, would havechanged our revenue and income before income taxes attributable to FMC Technologies, Inc. by approximately 4% and 3%,respectively.
When transactions are denominated in currencies other than our subsidiaries’ respective functional currencies, we manage theseexposures through the use of derivative instruments to mitigate our risk. We use foreign currency forward contracts to hedge the foreigncurrency fluctuation associated with firmly committed and forecasted foreign currency denominated payments and receipts. Thederivative instruments associated with these anticipated transactions are designated and qualify as cash flow hedges, and as such thegains and losses associated with these instruments are recorded in other comprehensive income until such time that the underlyingtransactions are recognized. When an anticipated transaction in a currency other than the functional currency of an entity is recognizedas an asset or liability on the balance sheet, we also hedge the foreign currency fluctuation with derivative instruments after netting ourexposures worldwide. These derivative instruments do not qualify as cash flow hedges.
Occasionally, we enter into contracts or other arrangements that are subject to foreign exchange fluctuations that qualify as embeddedderivative instruments. In those situations, we enter into derivative foreign exchange contracts that hedge the price fluctuations due tomovements in the foreign exchange rates. These hedges are not treated as cash flow hedges.
We have prepared a sensitivity analysis of our foreign currency forward contracts hedging anticipated transactions that are accounted foras cash flow hedges. This analysis assumes that each foreign currency rate would change 10% against a stronger and then weaker U.S.dollar. A 10% increase in the value of the U.S. dollar would result in an additional loss of $107.4 million in the net fair value of cashflow hedges reflected in our consolidated balance sheet at December 31, 2014. Unless these contracts are deemed to be ineffective,changes in the derivative fair value will not have an immediate impact on our results of operations since the gains and losses associatedwith these instruments are recorded in other comprehensive income. When the anticipated transactions occur, these changes in value ofderivatives instrument positions will be offset against changes in the value of the underlying transaction.
Interest Rate Risk
At December 31, 2014, we had unhedged variable rate debt of $469.1 million with a weighted average interest rate of 0.52%. Usingsensitivity analysis to measure the impact of a 10% adverse movement in the interest rate, or five basis points, would result in anincrease to interest expense of $0.2 million.
We assess effectiveness of forward foreign currency contracts designated as cash flow hedges based on changes in fair value attributableto changes in spot rates. We exclude the impact attributable to changes in the difference between the spot rate and the forward rate forthe assessment of hedge effectiveness and recognize the change in fair value of this component immediately in earnings. Consideringthat the difference between the spot rate and the forward rate is proportional to the differences in the interest rates of the countries of thecurrencies being traded, we have exposure to relative changes in interest rates between countries in our results of operations. To theextent any one interest rate increases by 10% across all tenors and other countries’ interest rates remain fixed, and assuming no changein discount rates, we would expect to recognize a decrease of $0.4 million in earnings in the period of change. Based on our portfolio asof December 31, 2014, we have material positions with exposure to the interest rates in the United States, Brazil, the United Kingdom,Singapore, the European Community and Norway.
Copyright © 2013 www.secdatabase.com. All Rights Reserved.Please Consider the Environment Before Printing This Document

45
Copyright © 2013 www.secdatabase.com. All Rights Reserved.Please Consider the Environment Before Printing This Document
ITEM 8. FINANCIAL STATEMENTS AND SUPPLEMENTARY DATA
MANAGEMENT’S REPORT ON INTERNAL CONTROL OVER FINANCIAL REPORTINGManagement is responsible for establishing and maintaining adequate internal control over financial reporting, as defined in Rule13a-15(f) of the Securities Exchange Act of 1934, as amended. Our internal control over financial reporting is a process designed underthe supervision of the Chief Executive Officer and Chief Financial Officer to provide reasonable assurance regarding the reliability offinancial reporting and the preparation of our consolidated financial statements in accordance with U.S. generally accepted accountingprinciples. All internal control systems, no matter how well designed, have inherent limitations. Therefore, even internal control systemsdetermined to be effective can provide only reasonable assurance with respect to financial statement preparation and reporting.
Under the supervision and with the participation of management, we conducted an evaluation of the effectiveness of our internal controlover financial reporting based on the framework in Internal Control—Integrated Framework (1992) issued by the Committee ofSponsoring Organizations of the Treadway Commission. Based on our evaluation, we concluded that our internal control over financialreporting was effective in providing this reasonable assurance as of December 31, 2014.
KPMG LLP, an independent registered public accounting firm, has audited the Company’s consolidated financial statements as of andfor the three-year period ended December 31, 2014, and has issued an audit report on the Company’s internal control over financialreporting as of December 31, 2014, which is included herein.
/s/ JOHN T. GREMP /s/ MARYANN T. SEAMAN
John T. Gremp Maryann T. SeamanChairman, President and Chief Executive Officer Executive Vice President and Chief Financial Officer
February 20, 2015
46
Copyright © 2013 www.secdatabase.com. All Rights Reserved.Please Consider the Environment Before Printing This Document
REPORT OF INDEPENDENT REGISTERED PUBLIC ACCOUNTING FIRM
The Board of Directors and Stockholders of FMC Technologies, Inc.:
We have audited FMC Technologies, Inc.’s internal control over financial reporting as of December 31, 2014, based on criteriaestablished in Internal Control—Integrated Framework (1992) issued by the Committee of Sponsoring Organizations of the TreadwayCommission (COSO). FMC Technologies, Inc.’s management is responsible for maintaining effective internal control over financialreporting and for its assessment of the effectiveness of internal control over financial reporting, included in the accompanyingManagement’s Report on Internal Control over Financial Reporting. Our responsibility is to express an opinion on the FMCTechnologies, Inc.’s internal control over financial reporting based on our audit.
We conducted our audit in accordance with the standards of the Public Company Accounting Oversight Board (United States). Thosestandards require that we plan and perform the audit to obtain reasonable assurance about whether effective internal control overfinancial reporting was maintained in all material respects. Our audit included obtaining an understanding of internal control overfinancial reporting, assessing the risk that a material weakness exists, and testing and evaluating the design and operating effectivenessof internal control based on the assessed risk. Our audit also included performing such other procedures as we considered necessary inthe circumstances. We believe that our audit provides a reasonable basis for our opinion.
A company’s internal control over financial reporting is a process designed to provide reasonable assurance regarding the reliability offinancial reporting and the preparation of financial statements for external purposes in accordance with generally accepted accountingprinciples. A company’s internal control over financial reporting includes those policies and procedures that (1) pertain to themaintenance of records that, in reasonable detail, accurately and fairly reflect the transactions and dispositions of the assets of thecompany; (2) provide reasonable assurance that transactions are recorded as necessary to permit preparation of financial statements inaccordance with generally accepted accounting principles, and that receipts and expenditures of the company are being made only inaccordance with authorizations of management and directors of the company; and (3) provide reasonable assurance regardingprevention or timely detection of unauthorized acquisition, use, or disposition of the company’s assets that could have a material effecton the financial statements.
Because of its inherent limitations, internal control over financial reporting may not prevent or detect misstatements. Also, projectionsof any evaluation of effectiveness to future periods are subject to the risk that controls may become inadequate because of changes inconditions, or that the degree of compliance with the policies or procedures may deteriorate.
In our opinion, FMC Technologies, Inc. maintained, in all material respects, effective internal control over financial reporting as ofDecember 31, 2014, based on criteria established in Internal Control—Integrated Framework (1992) issued by the Committee ofSponsoring Organizations of the Treadway Commission.
We also have audited, in accordance with the standards of the Public Company Accounting Oversight Board (United States), theconsolidated balance sheets of FMC Technologies, Inc. and subsidiaries as of December 31, 2014 and 2013, and the related consolidatedstatements of income, comprehensive income, cash flows, and changes in stockholders’ equity for each of the years in the three-yearperiod ended December 31, 2014, and our report dated February 20, 2015 expressed an unqualified opinion on those consolidatedfinancial statements.
/s/ KPMG LLP
Houston, TexasFebruary 20, 2015
47
Copyright © 2013 www.secdatabase.com. All Rights Reserved.Please Consider the Environment Before Printing This Document
REPORT OF INDEPENDENT REGISTERED PUBLIC ACCOUNTING FIRM
The Board of Directors and Stockholders of FMC Technologies, Inc.:
We have audited the accompanying consolidated balance sheets of FMC Technologies, Inc. and subsidiaries (the Company) as ofDecember 31, 2014 and 2013, and the related consolidated statements of income, comprehensive income, cash flows, and changes instockholders’ equity for each of the years in the three-year period ended December 31, 2014. In connection with our audits of theconsolidated financial statements, we also have audited financial statement schedule II. These consolidated financial statements andfinancial statement schedule are the responsibility of the Company’s management. Our responsibility is to express an opinion on theseconsolidated financial statements and financial statement schedule based on our audits.
We conducted our audits in accordance with the standards of the Public Company Accounting Oversight Board (United States). Thosestandards require that we plan and perform the audit to obtain reasonable assurance about whether the financial statements are free ofmaterial misstatement. An audit includes examining, on a test basis, evidence supporting the amounts and disclosures in the financialstatements. An audit also includes assessing the accounting principles used and significant estimates made by management, as well asevaluating the overall financial statement presentation. We believe that our audits provide a reasonable basis for our opinion.
In our opinion, the consolidated financial statements referred to above present fairly, in all material respects, the financial position of theCompany as of December 31, 2014 and 2013, and the results of their operations and their cash flows for each of the years in the three-year period ended December 31, 2014, in conformity with U.S. generally accepted accounting principles. Also in our opinion, therelated financial statement schedule II, when considered in relation to the basic consolidated financial statements taken as a whole,presents fairly, in all material respects, the information set forth therein.
We also have audited, in accordance with the standards of the Public Company Accounting Oversight Board (United States), theCompany’s internal control over financial reporting as of December 31, 2014, based on criteria established in InternalControl—Integrated Framework (1992) issued by the Committee of Sponsoring Organizations of the Treadway Commission, and ourreport dated February 20, 2015 expressed an unqualified opinion on the effectiveness of the Company’s internal control over financialreporting.
/s/ KPMG LLP
Houston, TexasFebruary 20, 2015
48
Copyright © 2013 www.secdatabase.com. All Rights Reserved.Please Consider the Environment Before Printing This Document
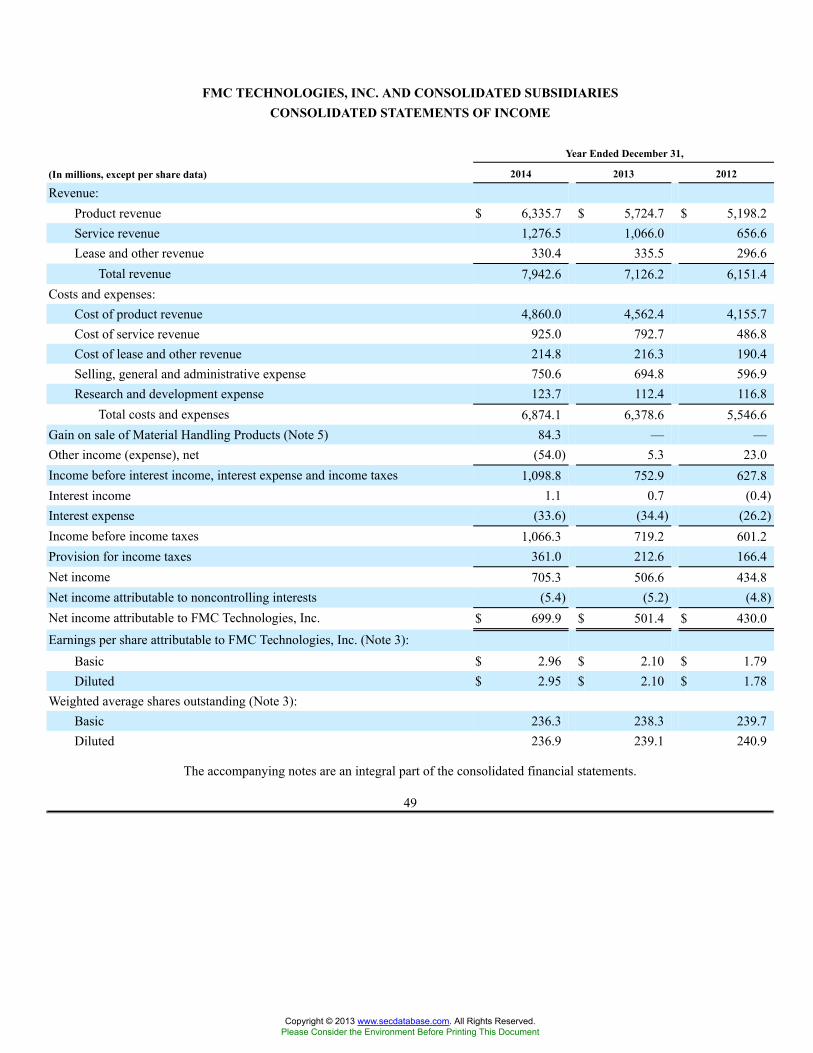
FMC TECHNOLOGIES, INC. AND CONSOLIDATED SUBSIDIARIESCONSOLIDATED STATEMENTS OF INCOME
Year Ended December 31,
(In millions, except per share data) 2014 2013 2012
Revenue:Product revenue $ 6,335.7 $ 5,724.7 $ 5,198.2Service revenue 1,276.5 1,066.0 656.6Lease and other revenue 330.4 335.5 296.6
Total revenue 7,942.6 7,126.2 6,151.4Costs and expenses:
Cost of product revenue 4,860.0 4,562.4 4,155.7Cost of service revenue 925.0 792.7 486.8Cost of lease and other revenue 214.8 216.3 190.4Selling, general and administrative expense 750.6 694.8 596.9Research and development expense 123.7 112.4 116.8
Total costs and expenses 6,874.1 6,378.6 5,546.6Gain on sale of Material Handling Products (Note 5) 84.3 — —Other income (expense), net (54.0) 5.3 23.0Income before interest income, interest expense and income taxes 1,098.8 752.9 627.8Interest income 1.1 0.7 (0.4)Interest expense (33.6) (34.4) (26.2)Income before income taxes 1,066.3 719.2 601.2Provision for income taxes 361.0 212.6 166.4Net income 705.3 506.6 434.8Net income attributable to noncontrolling interests (5.4) (5.2) (4.8)Net income attributable to FMC Technologies, Inc. $ 699.9 $ 501.4 $ 430.0Earnings per share attributable to FMC Technologies, Inc. (Note 3):
Basic $ 2.96 $ 2.10 $ 1.79Diluted $ 2.95 $ 2.10 $ 1.78
Weighted average shares outstanding (Note 3):Basic 236.3 238.3 239.7Diluted 236.9 239.1 240.9
The accompanying notes are an integral part of the consolidated financial statements.
49
Copyright © 2013 www.secdatabase.com. All Rights Reserved.Please Consider the Environment Before Printing This Document
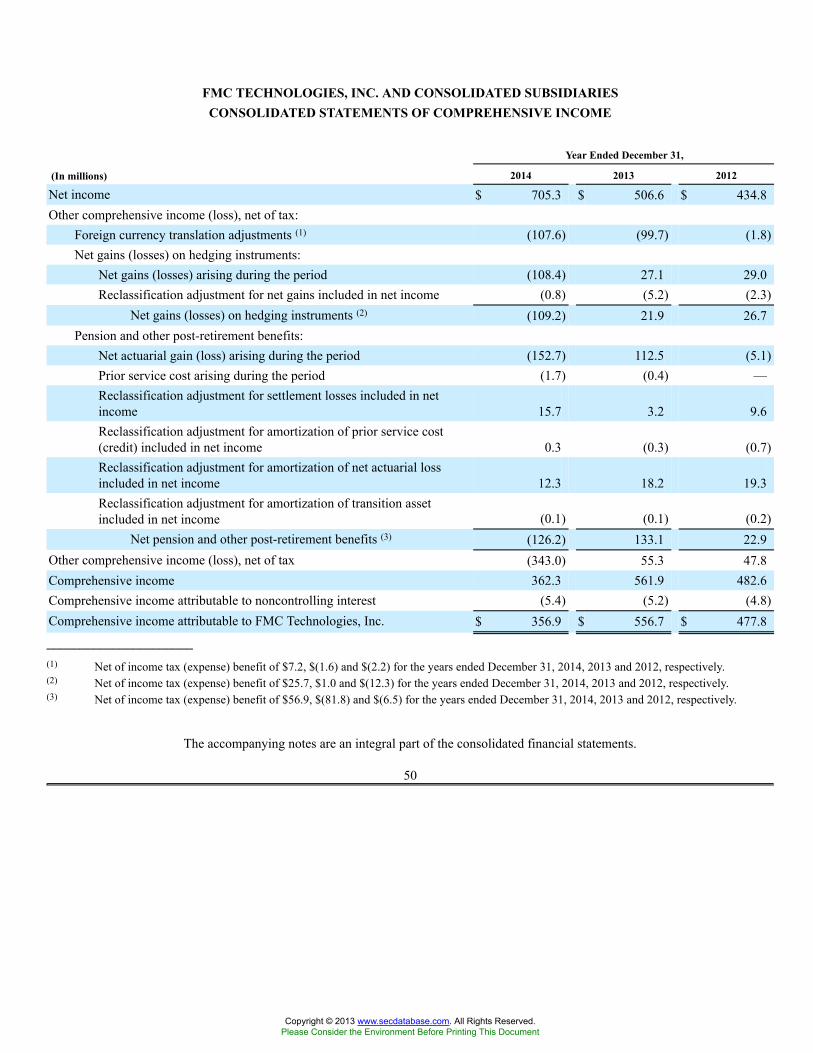
FMC TECHNOLOGIES, INC. AND CONSOLIDATED SUBSIDIARIESCONSOLIDATED STATEMENTS OF COMPREHENSIVE INCOME
Year Ended December 31,
(In millions) 2014 2013 2012
Net income $ 705.3 $ 506.6 $ 434.8Other comprehensive income (loss), net of tax:
Foreign currency translation adjustments (1) (107.6) (99.7) (1.8)Net gains (losses) on hedging instruments:
Net gains (losses) arising during the period (108.4) 27.1 29.0Reclassification adjustment for net gains included in net income (0.8) (5.2) (2.3)
Net gains (losses) on hedging instruments (2) (109.2) 21.9 26.7Pension and other post-retirement benefits:
Net actuarial gain (loss) arising during the period (152.7) 112.5 (5.1)Prior service cost arising during the period (1.7) (0.4) —Reclassification adjustment for settlement losses included in netincome 15.7 3.2 9.6Reclassification adjustment for amortization of prior service cost(credit) included in net income 0.3 (0.3) (0.7)Reclassification adjustment for amortization of net actuarial lossincluded in net income 12.3 18.2 19.3Reclassification adjustment for amortization of transition assetincluded in net income (0.1) (0.1) (0.2)
Net pension and other post-retirement benefits (3) (126.2) 133.1 22.9Other comprehensive income (loss), net of tax (343.0) 55.3 47.8Comprehensive income 362.3 561.9 482.6Comprehensive income attributable to noncontrolling interest (5.4) (5.2) (4.8)Comprehensive income attributable to FMC Technologies, Inc. $ 356.9 $ 556.7 $ 477.8______________________(1) Net of income tax (expense) benefit of $7.2, $(1.6) and $(2.2) for the years ended December 31, 2014, 2013 and 2012, respectively.(2) Net of income tax (expense) benefit of $25.7, $1.0 and $(12.3) for the years ended December 31, 2014, 2013 and 2012, respectively.(3) Net of income tax (expense) benefit of $56.9, $(81.8) and $(6.5) for the years ended December 31, 2014, 2013 and 2012, respectively.
The accompanying notes are an integral part of the consolidated financial statements.
50
Copyright © 2013 www.secdatabase.com. All Rights Reserved.Please Consider the Environment Before Printing This Document
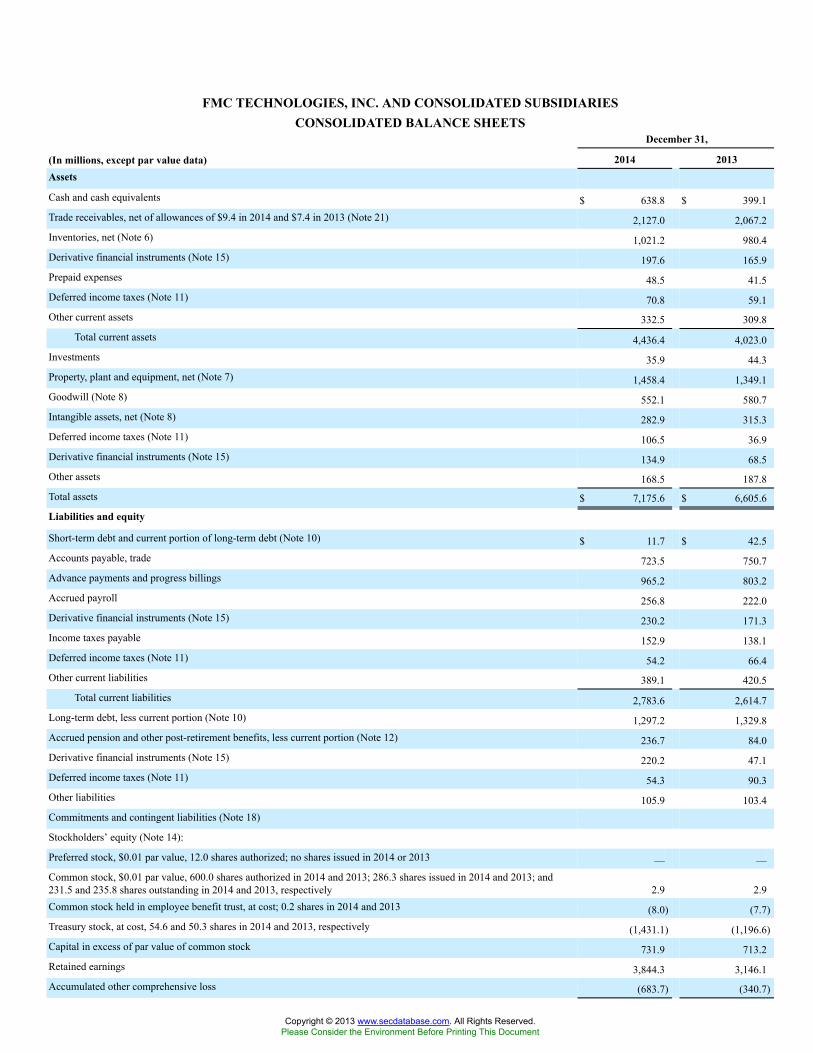
FMC TECHNOLOGIES, INC. AND CONSOLIDATED SUBSIDIARIESCONSOLIDATED BALANCE SHEETS
December 31,
(In millions, except par value data) 2014 2013Assets
Cash and cash equivalents $ 638.8 $ 399.1Trade receivables, net of allowances of $9.4 in 2014 and $7.4 in 2013 (Note 21) 2,127.0 2,067.2Inventories, net (Note 6) 1,021.2 980.4Derivative financial instruments (Note 15) 197.6 165.9Prepaid expenses 48.5 41.5Deferred income taxes (Note 11) 70.8 59.1Other current assets 332.5 309.8
Total current assets 4,436.4 4,023.0Investments 35.9 44.3Property, plant and equipment, net (Note 7) 1,458.4 1,349.1Goodwill (Note 8) 552.1 580.7Intangible assets, net (Note 8) 282.9 315.3Deferred income taxes (Note 11) 106.5 36.9Derivative financial instruments (Note 15) 134.9 68.5Other assets 168.5 187.8Total assets $ 7,175.6 $ 6,605.6
Liabilities and equity
Short-term debt and current portion of long-term debt (Note 10) $ 11.7 $ 42.5Accounts payable, trade 723.5 750.7Advance payments and progress billings 965.2 803.2Accrued payroll 256.8 222.0Derivative financial instruments (Note 15) 230.2 171.3Income taxes payable 152.9 138.1Deferred income taxes (Note 11) 54.2 66.4Other current liabilities 389.1 420.5
Total current liabilities 2,783.6 2,614.7Long-term debt, less current portion (Note 10) 1,297.2 1,329.8Accrued pension and other post-retirement benefits, less current portion (Note 12) 236.7 84.0Derivative financial instruments (Note 15) 220.2 47.1Deferred income taxes (Note 11) 54.3 90.3Other liabilities 105.9 103.4Commitments and contingent liabilities (Note 18)
Stockholders’ equity (Note 14):
Preferred stock, $0.01 par value, 12.0 shares authorized; no shares issued in 2014 or 2013 — —Common stock, $0.01 par value, 600.0 shares authorized in 2014 and 2013; 286.3 shares issued in 2014 and 2013; and231.5 and 235.8 shares outstanding in 2014 and 2013, respectively 2.9 2.9Common stock held in employee benefit trust, at cost; 0.2 shares in 2014 and 2013 (8.0) (7.7)Treasury stock, at cost, 54.6 and 50.3 shares in 2014 and 2013, respectively (1,431.1) (1,196.6)Capital in excess of par value of common stock 731.9 713.2Retained earnings 3,844.3 3,146.1Accumulated other comprehensive loss (683.7) (340.7)
Copyright © 2013 www.secdatabase.com. All Rights Reserved.Please Consider the Environment Before Printing This Document
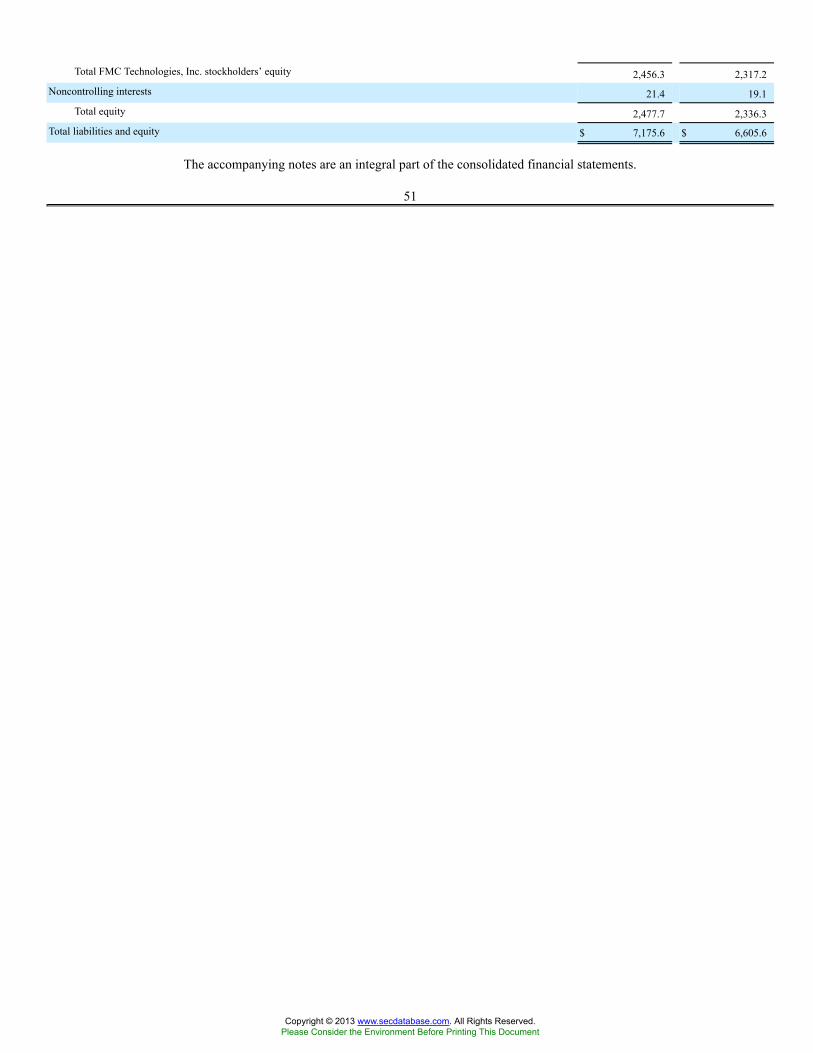
Total FMC Technologies, Inc. stockholders’ equity 2,456.3 2,317.2Noncontrolling interests 21.4 19.1
Total equity 2,477.7 2,336.3Total liabilities and equity $ 7,175.6 $ 6,605.6
The accompanying notes are an integral part of the consolidated financial statements.
51
Copyright © 2013 www.secdatabase.com. All Rights Reserved.Please Consider the Environment Before Printing This Document
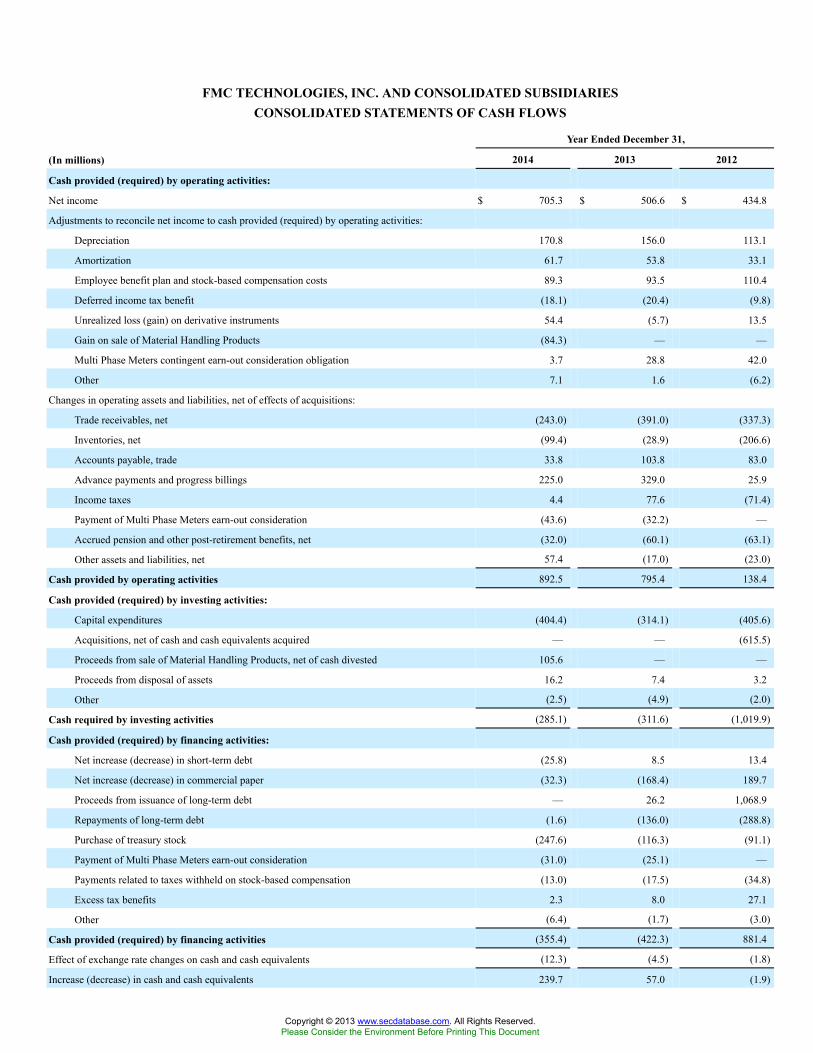
FMC TECHNOLOGIES, INC. AND CONSOLIDATED SUBSIDIARIESCONSOLIDATED STATEMENTS OF CASH FLOWS
Year Ended December 31,
(In millions) 2014 2013 2012
Cash provided (required) by operating activities:
Net income $ 705.3 $ 506.6 $ 434.8
Adjustments to reconcile net income to cash provided (required) by operating activities:
Depreciation 170.8 156.0 113.1
Amortization 61.7 53.8 33.1
Employee benefit plan and stock-based compensation costs 89.3 93.5 110.4
Deferred income tax benefit (18.1) (20.4) (9.8)
Unrealized loss (gain) on derivative instruments 54.4 (5.7) 13.5
Gain on sale of Material Handling Products (84.3) — —
Multi Phase Meters contingent earn-out consideration obligation 3.7 28.8 42.0
Other 7.1 1.6 (6.2)
Changes in operating assets and liabilities, net of effects of acquisitions:
Trade receivables, net (243.0) (391.0) (337.3)
Inventories, net (99.4) (28.9) (206.6)
Accounts payable, trade 33.8 103.8 83.0
Advance payments and progress billings 225.0 329.0 25.9
Income taxes 4.4 77.6 (71.4)
Payment of Multi Phase Meters earn-out consideration (43.6) (32.2) —
Accrued pension and other post-retirement benefits, net (32.0) (60.1) (63.1)
Other assets and liabilities, net 57.4 (17.0) (23.0)
Cash provided by operating activities 892.5 795.4 138.4
Cash provided (required) by investing activities:
Capital expenditures (404.4) (314.1) (405.6)
Acquisitions, net of cash and cash equivalents acquired — — (615.5)
Proceeds from sale of Material Handling Products, net of cash divested 105.6 — —
Proceeds from disposal of assets 16.2 7.4 3.2
Other (2.5) (4.9) (2.0)
Cash required by investing activities (285.1) (311.6) (1,019.9)
Cash provided (required) by financing activities:
Net increase (decrease) in short-term debt (25.8) 8.5 13.4
Net increase (decrease) in commercial paper (32.3) (168.4) 189.7
Proceeds from issuance of long-term debt — 26.2 1,068.9
Repayments of long-term debt (1.6) (136.0) (288.8)
Purchase of treasury stock (247.6) (116.3) (91.1)
Payment of Multi Phase Meters earn-out consideration (31.0) (25.1) —
Payments related to taxes withheld on stock-based compensation (13.0) (17.5) (34.8)
Excess tax benefits 2.3 8.0 27.1
Other (6.4) (1.7) (3.0)
Cash provided (required) by financing activities (355.4) (422.3) 881.4
Effect of exchange rate changes on cash and cash equivalents (12.3) (4.5) (1.8)
Increase (decrease) in cash and cash equivalents 239.7 57.0 (1.9)
Copyright © 2013 www.secdatabase.com. All Rights Reserved.Please Consider the Environment Before Printing This Document
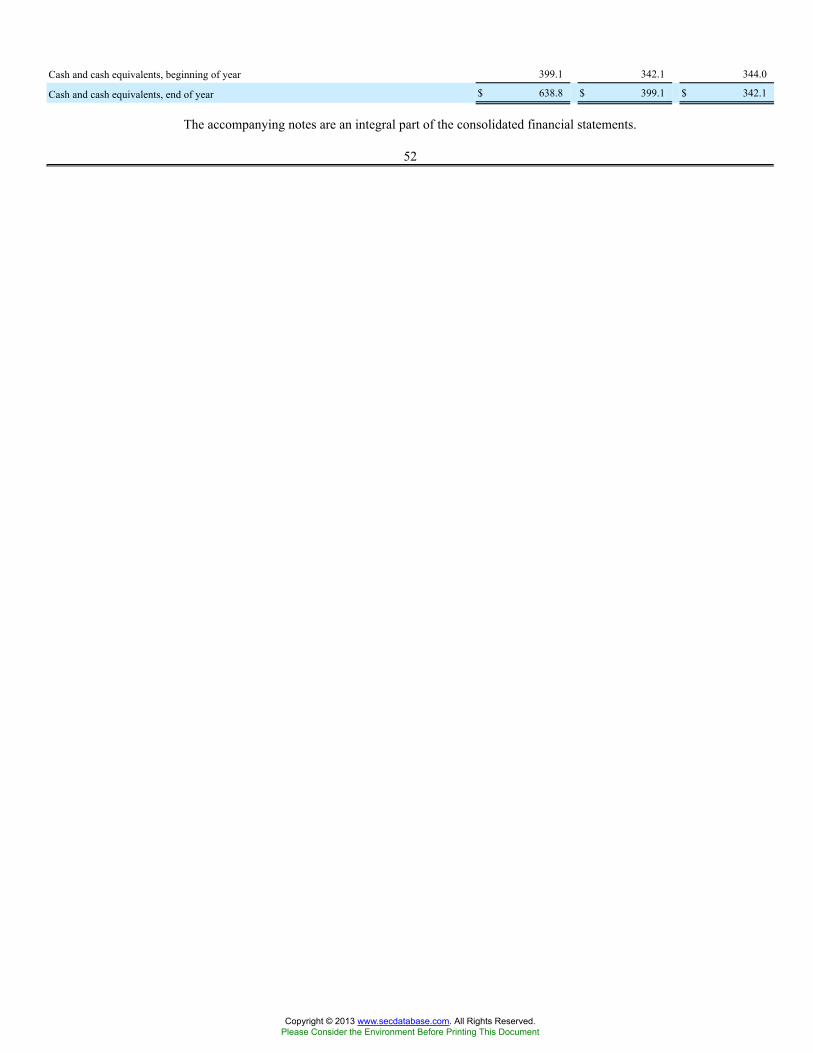
Cash and cash equivalents, beginning of year 399.1 342.1 344.0
Cash and cash equivalents, end of year $ 638.8 $ 399.1 $ 342.1
The accompanying notes are an integral part of the consolidated financial statements.
52
Copyright © 2013 www.secdatabase.com. All Rights Reserved.Please Consider the Environment Before Printing This Document
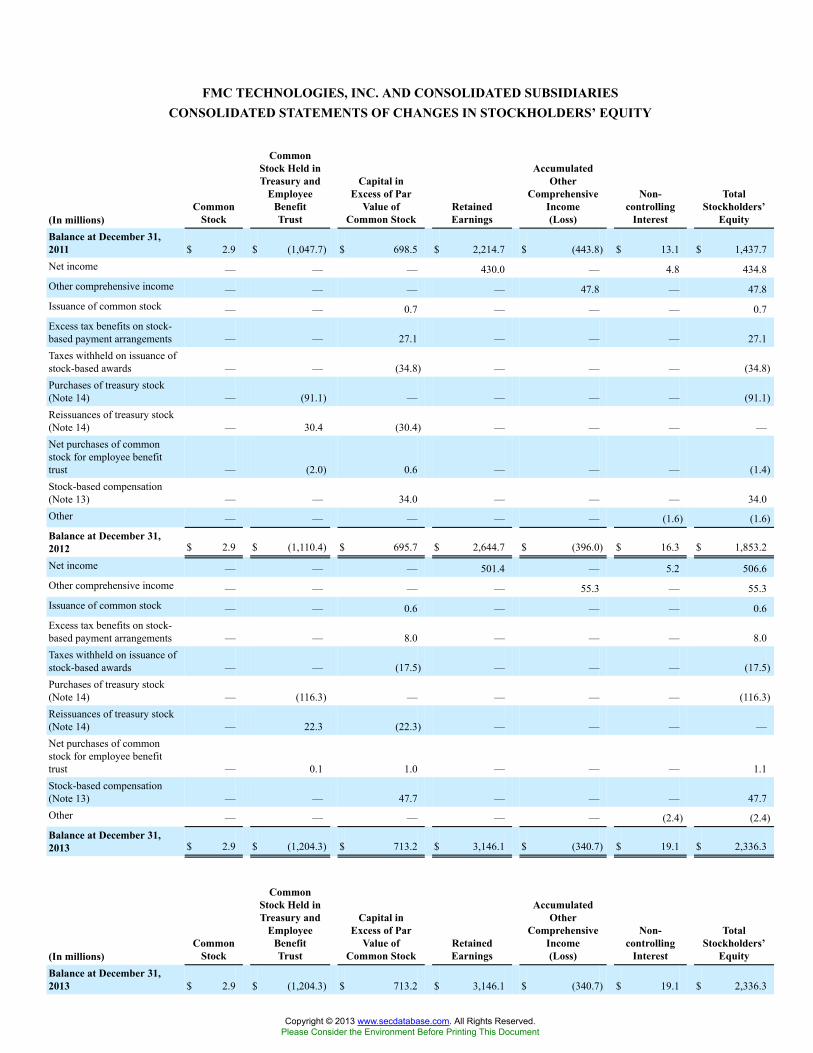
FMC TECHNOLOGIES, INC. AND CONSOLIDATED SUBSIDIARIESCONSOLIDATED STATEMENTS OF CHANGES IN STOCKHOLDERS’ EQUITY
(In millions)Common
Stock
CommonStock Held inTreasury and
EmployeeBenefitTrust
Capital inExcess of Par
Value ofCommon Stock
RetainedEarnings
AccumulatedOther
ComprehensiveIncome(Loss)
Non-controlling
Interest
TotalStockholders’
EquityBalance at December 31,2011 $ 2.9 $ (1,047.7) $ 698.5 $ 2,214.7 $ (443.8) $ 13.1 $ 1,437.7Net income — — — 430.0 — 4.8 434.8Other comprehensive income — — — — 47.8 — 47.8Issuance of common stock — — 0.7 — — — 0.7Excess tax benefits on stock-based payment arrangements — — 27.1 — — — 27.1Taxes withheld on issuance ofstock-based awards — — (34.8) — — — (34.8)Purchases of treasury stock(Note 14) — (91.1) — — — — (91.1)Reissuances of treasury stock(Note 14) — 30.4 (30.4) — — — —Net purchases of commonstock for employee benefittrust — (2.0) 0.6 — — — (1.4)Stock-based compensation(Note 13) — — 34.0 — — — 34.0Other — — — — — (1.6) (1.6)Balance at December 31,2012 $ 2.9 $ (1,110.4) $ 695.7 $ 2,644.7 $ (396.0) $ 16.3 $ 1,853.2
Net income — — — 501.4 — 5.2 506.6Other comprehensive income — — — — 55.3 — 55.3Issuance of common stock — — 0.6 — — — 0.6Excess tax benefits on stock-based payment arrangements — — 8.0 — — — 8.0Taxes withheld on issuance ofstock-based awards — — (17.5) — — — (17.5)Purchases of treasury stock(Note 14) — (116.3) — — — — (116.3)Reissuances of treasury stock(Note 14) — 22.3 (22.3) — — — —Net purchases of commonstock for employee benefittrust — 0.1 1.0 — — — 1.1Stock-based compensation(Note 13) — — 47.7 — — — 47.7Other — — — — — (2.4) (2.4)Balance at December 31,2013 $ 2.9 $ (1,204.3) $ 713.2 $ 3,146.1 $ (340.7) $ 19.1 $ 2,336.3
(In millions)Common
Stock
CommonStock Held inTreasury and
EmployeeBenefitTrust
Capital inExcess of Par
Value ofCommon Stock
RetainedEarnings
AccumulatedOther
ComprehensiveIncome(Loss)
Non-controlling
Interest
TotalStockholders’
EquityBalance at December 31,2013 $ 2.9 $ (1,204.3) $ 713.2 $ 3,146.1 $ (340.7) $ 19.1 $ 2,336.3
Copyright © 2013 www.secdatabase.com. All Rights Reserved.Please Consider the Environment Before Printing This Document
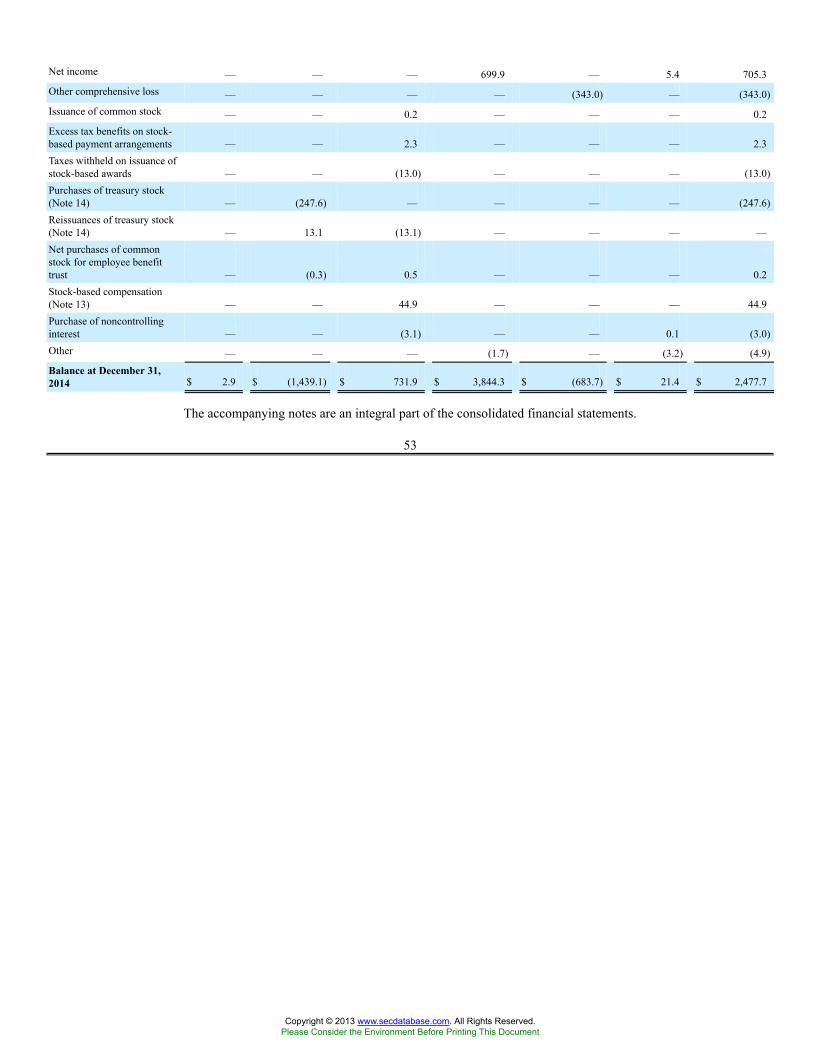
Net income — — — 699.9 — 5.4 705.3Other comprehensive loss — — — — (343.0) — (343.0)Issuance of common stock — — 0.2 — — — 0.2Excess tax benefits on stock-based payment arrangements — — 2.3 — — — 2.3Taxes withheld on issuance ofstock-based awards — — (13.0) — — — (13.0)Purchases of treasury stock(Note 14) — (247.6) — — — — (247.6)Reissuances of treasury stock(Note 14) — 13.1 (13.1) — — — —Net purchases of commonstock for employee benefittrust — (0.3) 0.5 — — — 0.2Stock-based compensation(Note 13) — — 44.9 — — — 44.9Purchase of noncontrollinginterest — — (3.1) — — 0.1 (3.0)Other — — — (1.7) — (3.2) (4.9)Balance at December 31,2014 $ 2.9 $ (1,439.1) $ 731.9 $ 3,844.3 $ (683.7) $ 21.4 $ 2,477.7
The accompanying notes are an integral part of the consolidated financial statements.
53
Copyright © 2013 www.secdatabase.com. All Rights Reserved.Please Consider the Environment Before Printing This Document
FMC TECHNOLOGIES, INC. AND CONSOLIDATED SUBSIDIARIESNOTES TO CONSOLIDATED FINANCIAL STATEMENTS
NOTE 1. BASIS OF PRESENTATION AND SUMMARY OF SIGNIFICANT ACCOUNTING POLICIES
Nature of operations—FMC Technologies, Inc. and consolidated subsidiaries (“FMC Technologies,” “we” or “us”) designs,manufactures and services technologically sophisticated systems and products for our customers in the energy industry through ourbusiness segments: Subsea Technologies, Surface Technologies and Energy Infrastructure. We have manufacturing operationsworldwide, strategically located to facilitate delivery of our products, systems and services to our customers.
Basis of presentation—Our consolidated financial statements have been prepared in U.S. dollars and in accordance with U.S. generallyaccepted accounting principles (“GAAP”).
On February 25, 2011, our Board of Directors approved a two-for-one stock split of our outstanding shares of common stock. The stocksplit was completed in the form of a stock dividend; however, upon issuance of the common stock pursuant to the stock split, an amountequal to the aggregate par value of the additional shares of common stock issued was not reclassified from capital in excess of par valueto common stock during the first quarter of 2011. This adjustment was made during the first quarter of 2014. All prior-year amountshave been revised to conform to the current year presentation. This adjustment had no overall effect on total equity and did not impactour overall financial position or results of operations for any period presented.
Principles of consolidation—The consolidated financial statements include the accounts of FMC Technologies and its majority-ownedsubsidiaries and affiliates. Intercompany accounts and transactions are eliminated in consolidation.
Use of estimates—The preparation of financial statements in conformity with GAAP requires management to make estimates andassumptions that affect the reported amounts of assets and liabilities and disclosures of contingent assets and liabilities at the date of thefinancial statements and the reported amounts of revenue and expenses during the reporting period. Actual results could differ fromthose estimates. Such estimates include, but are not limited to, estimates of total contract profit or loss on long-term construction-typecontracts; estimated realizable value on excess and obsolete inventory; estimates related to pension accounting; estimates related to fairvalue for purposes of assessing goodwill, long-lived assets and intangible assets for impairment; estimates related to income taxes; andestimates related to contingencies, including liquidated damages.
Investments in the common stock of unconsolidated affiliates—The investments in, and the operating results of, unconsolidated affiliatesare included in the consolidated financial statements on the basis of the equity method of accounting or the cost method of accounting,depending on specific facts and circumstances.
Investments in unconsolidated affiliates are assessed for impairment whenever events or changes in facts and circumstances indicate thecarrying value of the investments may not be fully recoverable. When such a condition is judgmentally determined to be other thantemporary, the carrying value of the investment is written down to fair value. Management’s assessment as to whether any decline invalue is other than temporary is based on our ability and intent to hold the investment and whether evidence indicating the carryingvalue of the investment is recoverable within a reasonable period of time outweighs evidence to the contrary. Management generallyconsiders our investments in equity method investees to be strategic long-term investments and completes its assessments forimpairment with a long-term viewpoint.
Reclassifications—Certain prior-year amounts have been reclassified to conform to the current year’s presentation.
Revenue recognition—Revenue is generally recognized once the following four criteria are met: i) persuasive evidence of anarrangement exists, ii) delivery of the equipment has occurred (which is upon shipment or when customer-specific acceptancerequirements are met) or services have been rendered, iii) the price of the equipment or service is fixed and determinable, and iv)collectibility is reasonably assured. We record our sales net of any value added, sales or use tax.
For certain construction-type manufacturing and assembly projects that involve significant design and engineering efforts in order tosatisfy detailed customer-supplied specifications, revenue is recognized using the percentage of completion method of accounting.Under the percentage of completion method, revenue is recognized as work progresses on each contract. We primarily apply the ratio ofcosts incurred to date to total estimated contract costs at completion to measure this ratio. If it is not possible to form a reliable estimateof progress toward completion, no revenue or costs are recognized until the project is complete or substantially complete. Any expectedlosses on construction-type contracts in progress are charged to earnings, in total, in the period the losses are identified.
54
Copyright © 2013 www.secdatabase.com. All Rights Reserved.Please Consider the Environment Before Printing This Document

Modifications to construction-type contracts, referred to as “change orders,” effectively change the provisions of the original contract,and may, for example, alter the specifications or design, method or manner of performance, equipment, materials, sites and/or period forcompletion of the work. If a change order represents a firm price commitment from a customer, we account for the revised estimate as ifit had been included in the original estimate, effectively recognizing the pro rata impact of the new estimate on our calculation ofprogress toward completion in the period in which the firm commitment is received. If a change order is unpriced: (1) we include thecosts of contract performance in our calculation of progress toward completion in the period in which the costs are incurred or becomeprobable; and (2) when it is determined that the revenue is probable of recovery, we include the change order revenue, limited to thecosts incurred to date related to the change order, in our calculation of progress toward completion. Unpriced change orders included inrevenue were immaterial to our consolidated revenue for all periods presented. Margin is not recorded on unpriced change orders unlessrealization is assured beyond a reasonable doubt. The assessment of realization may be based upon our previous experience with thecustomer or based upon our receipt of a firm price commitment from the customer.
Progress billings are generally issued upon completion of certain phases of the work as stipulated in the contract. Revenue in excess ofprogress billings are reported in trade receivables in our consolidated balance sheets. Progress billings and cash collections in excess ofrevenue recognized on a contract are classified as advance payments and progress billings within current liabilities in our consolidatedbalance sheets. Revenue generated from the installation portion of construction-type contracts is included in product revenue in ourconsolidated statements of income.
Shipping and handling costs—Shipping and handling costs are recorded as cost of product revenue in our consolidated statements ofincome. Shipping and handling costs billed to customers are recorded as a component of revenue.
Cash equivalents—Cash equivalents are highly-liquid, short-term instruments with original maturities of three months or less from theirdate of purchase.
Trade receivables, net of allowances—An allowance for doubtful accounts is provided on trade receivables equal to the estimateduncollectible amounts. This estimate is based on historical collection experience and a specific review of each customer’s tradereceivable balance.
Inventories—Inventories are stated at the lower of cost or net realizable value. Inventory costs include those costs directly attributable toproducts, including all manufacturing overhead, but excluding costs to distribute. Cost is determined on the last-in, first-out (“LIFO”)basis for all significant domestic inventories, except certain inventories relating to construction-type contracts, which are stated at theactual production cost incurred to date, reduced by the portion of these costs identified with revenue recognized. The first-in, first-out(“FIFO”) method is used to determine the cost for all other inventories.
Investments—The appropriate classification of investments in marketable equity securities is determined at the time of purchase and re-evaluated as of each subsequent reporting date. Securities classified as available-for-sale are carried at fair value with unrealized holdinggains and losses on these securities recognized in accumulated other comprehensive income (loss), net of related income tax. We did nothave any available-for-sale securities at December 31, 2014 or 2013.
Securities classified as trading securities are carried at fair value with gains and losses on these securities recognized through otherincome (expense), net. Trading securities are primarily comprised of marketable equity mutual funds that approximate a portion of ourliability under our Non-Qualified Savings and Investment Plan (“Non-Qualified Plan”).
Property, plant, and equipment—Property, plant, and equipment is recorded at cost. Depreciation is principally provided on the straight-line basis over the estimated useful lives of the assets (land improvements—20 to 35 years; buildings—20 to 50 years; and machineryand equipment—3 to 20 years). Gains and losses are realized upon the sale or retirement of assets and are recorded in other income(expense), net on our consolidated statements of income. Maintenance and repair costs are expensed as incurred. Expenditures thatextend the useful lives of property, plant and equipment are capitalized and depreciated over the estimated new remaining life of theasset.
55
Copyright © 2013 www.secdatabase.com. All Rights Reserved.Please Consider the Environment Before Printing This Document
Impairment of property, plant, and equipment—Property, plant and equipment are reviewed for impairment whenever events or changesin circumstances indicate the carrying value of the long-lived asset may not be recoverable. The carrying value of a long-lived asset isnot recoverable if it exceeds the sum of the undiscounted cash flows expected to result from the use and eventual disposition of theasset. If it is determined that an impairment loss has occurred, the impairment loss is measured as the amount by which the carryingvalue of the long-lived asset exceeds its fair value.
Long-lived assets held for sale are reported at the lower of carrying value or fair value less cost to sell.
Capitalized software costs—Other assets on the consolidated balance sheets include the capitalized cost of internal use software(including Internet websites). The assets are stated at cost less accumulated amortization. These software costs include significantpurchases of software and internal and external costs incurred during the application development stage of software projects. Thesecosts are amortized on a straight-line basis over the estimated useful lives of the assets. For internal use software, the useful lives rangefrom three to ten years. For Internet website costs, the estimated useful lives do not exceed three years.
Goodwill and other intangible assets—Goodwill is not subject to amortization but is tested for impairment on an annual basis (or morefrequently if impairment indicators arise). We have established October 31 as the date of our annual test for impairment of goodwill.Reporting units with goodwill are tested for impairment by first assessing qualitative factors to determine whether the existence ofevents or circumstances leads to a determination that it is more likely than not that the fair value of the reporting unit is less than itscarrying amount. If after assessing the totality of events or circumstances, or based on management’s judgment, we determine it is morelikely than not that the fair value of a reporting unit is less than its carrying amount, a two-step impairment test is performed. The firststep compares the fair value of the reporting unit (measured as the present value of expected future cash flows) to its carrying amount. Ifthe fair value of the reporting unit is less than its carrying amount, a second step is performed. In this step, the fair value of the reportingunit is allocated to its assets and liabilities to determine the implied fair value of goodwill, which is used to measure the impairmentloss.
Our acquired intangible assets are amortized on a straight-line basis over their estimated useful lives, which generally range from 7 to40 years. Our acquired intangible assets do not have indefinite lives. Intangible assets are reviewed for impairment whenever events orchanges in circumstances indicate the carrying amount of the intangible asset may not be recoverable. The carrying amount of anintangible asset is not recoverable if it exceeds the sum of the undiscounted cash flows expected to result from the use and eventualdisposition of the asset. If it is determined that an impairment loss has occurred, the loss is measured as the amount by which thecarrying amount of the intangible asset exceeds its fair value.
Fair value measurements—We record our financial assets and financial liabilities at fair value. Fair value is defined as the price thatwould be received to sell an asset or paid to transfer a liability (an exit price) in an orderly transaction between market participants at thereporting date. The fair value framework requires the categorization of assets and liabilities into three levels based upon the assumptions(inputs) used to price the assets or liabilities. Level 1 provides the most reliable measure of fair value, whereas Level 3 generallyrequires significant management judgment. The three levels are defined as follows:
• Level 1: Unadjusted quoted prices in active markets for identical assets and liabilities.
• Level 2: Observable inputs other than quoted prices included in Level 1. For example, quoted prices for similar assets orliabilities in active markets or quoted prices for identical assets or liabilities in inactive markets.
• Level 3: Unobservable inputs reflecting management’s own assumptions about the assumptions market participants would usein pricing the asset or liability.
56
Copyright © 2013 www.secdatabase.com. All Rights Reserved.Please Consider the Environment Before Printing This Document

Income taxes—Current income taxes are provided on income reported for financial statement purposes, adjusted for transactions that donot enter into the computation of income taxes payable in the same year. Deferred tax assets and liabilities are measured using enactedtax rates for the expected future tax consequences of temporary differences between the carrying amounts and the tax bases of assetsand liabilities. A valuation allowance is established whenever management believes that it is more likely than not that deferred taxassets may not be realizable.
U.S. income taxes are not provided on our equity in undistributed earnings of foreign subsidiaries or affiliates to the extent we havedetermined that the earnings are indefinitely reinvested. U.S. income taxes are provided on such earnings in the period in which we canno longer support that such earnings are indefinitely reinvested.
Tax benefits related to uncertain tax positions are recognized when it is more likely than not, based on the technical merits, that theposition will be sustained upon examination.
We classify interest expense and penalties recognized on underpayments of income taxes as income tax expense.
Stock-based employee compensation—We measure stock-based compensation expense on restricted stock awards based on the marketprice at the grant date and the number of shares awarded. The stock-based compensation expense for each award is recognized ratablyover the applicable service period, after taking into account estimated forfeitures, or the period beginning at the start of the serviceperiod and ending when an employee becomes eligible for retirement.
Common stock held in employee benefit trust—Shares of our common stock are purchased by the plan administrator of the Non-Qualified Plan and placed in a trust owned by us. Purchased shares are recorded at cost and classified as a reduction of stockholders’equity on the consolidated balance sheets.
Earnings per common share (“EPS”)—Basic EPS is computed using the weighted-average number of common shares outstandingduring the year. Diluted EPS gives effect to the potential dilution of earnings that could have occurred if additional shares were issuedfor stock option exercises and restricted stock under the treasury stock method. The treasury stock method assumes proceeds that wouldbe obtained upon exercise of common stock options and issuance of restricted stock are used to buy back outstanding common stock atthe average market price during the period.
Warranty obligations—We provide warranties of various lengths and terms to certain of our customers based on standard terms andconditions and negotiated agreements. Estimated cost of warranties are accrued at the time revenue is recognized for products wherereliable, historical experience of warranty claims and costs exists or when additional specific obligations are identified. The obligationreflected in other current liabilities on the consolidated balance sheets is based on historical experience by product and considers failurerates and the related costs in correcting a product failure. Should actual product failure rates or repair costs differ from our currentestimates, revisions to the estimated warranty liability would be required.
Foreign currency—Financial statements of operations for which the U.S. dollar is not the functional currency, and are located in non-highly inflationary countries, are translated into U.S. dollars prior to consolidation. Assets and liabilities are translated at the exchangerate in effect at the balance sheet date, while income statement accounts are translated at the average exchange rate for each period. Forthese operations, translation gains and losses are recorded as a component of accumulated other comprehensive income (loss) instockholders’ equity until the foreign entity is sold or liquidated. For operations in highly inflationary countries and where the localcurrency is not the functional currency, inventories, property, plant and equipment, and other non-current assets are converted to U.S.dollars at historical exchange rates, and all gains or losses from conversion are included in net income. Foreign currency effects on cash,cash equivalents and debt in hyperinflationary economies are included in interest income or expense.
57
Copyright © 2013 www.secdatabase.com. All Rights Reserved.Please Consider the Environment Before Printing This Document
Derivative instruments—Derivatives are recognized on the consolidated balance sheets at fair value, with classification as current ornon-current based upon the maturity of the derivative instrument. Changes in the fair value of derivative instruments are recorded incurrent earnings or deferred in accumulated other comprehensive income (loss), depending on the type of hedging transaction andwhether a derivative is designated as, and is effective as, a hedge. Each instrument is accounted for individually and assets and liabilitiesare not offset.
Hedge accounting is only applied when the derivative is deemed to be highly effective at offsetting changes in anticipated cash flows ofthe hedged item or transaction. Changes in fair value of derivatives that are designated as cash flow hedges are deferred in accumulatedother comprehensive income (loss) until the underlying transactions are recognized in earnings. At such time, related deferred hedginggains or losses are also recorded in operating earnings on the same line as the hedged item. Effectiveness is assessed at the inception ofthe hedge and on a quarterly basis. Effectiveness of forward contract cash flow hedges are assessed based solely on changes in fair valueattributable to the change in the spot rate. The change in the fair value of the contract related to the change in forward rates is excludedfrom the assessment of hedge effectiveness. Changes in this excluded component of the derivative instrument, along with anyineffectiveness identified, are recorded in operating earnings as incurred. We document our risk management strategy and hedgeeffectiveness at the inception of, and during the term of, each hedge.
We also use forward contracts to hedge foreign currency assets and liabilities, for which we do not apply hedge accounting. The changesin fair value of these contracts are recognized in other income (expense), net on our consolidated statements of income, as they occurand offset gains or losses on the remeasurement of the related asset or liability.
Cash flows from derivative contracts are reported in the consolidated statements of cash flows in the same categories as the cash flowsfrom the underlying transactions.
NOTE 2. RECENTLY ADOPTED ACCOUNTING STANDARDS
Effective January 1, 2014, we adopted Accounting Standards Update (“ASU”) No. 2013-11, “Presentation of an Unrecognized TaxBenefit When a Net Operating Loss Carryforward, a Similar Tax Loss, or a Tax Credit Carryforward Exists” issued by the FinancialAccounting Standards Board (“FASB”). This update requires the netting of unrecognized tax benefits against a deferred tax asset for aloss or other carryforward that would apply in settlement of the uncertain tax positions. Under the amended guidance, unrecognized taxbenefits are netted against all available same-jurisdiction loss or other tax carryforwards that would be utilized, rather than only againstcarryforwards that are created by the unrecognized tax benefits. The updated guidance is applied prospectively, effective January 1,2014. The adoption of this update concerns presentation and disclosure only as it relates to our consolidated financial statements.
Effective January 1, 2014, we adopted ASU No. 2014-08, “Reporting Discontinued Operations and Disclosures ofDisposals of Components of an Entity” issued by the FASB. This update changes the requirements of reporting discontinued operations.Under the amended guidance, a disposal of a component of an entity or a group of components of an entity is required to be reported indiscontinued operations if the disposal represents a strategic shift that has (or will have) a major effect on an entity’s operations andfinancial results. The amendments in this update are effective for all disposals (or classifications as held for sale) of components of anentity that occur within annual periods beginning on or after December 15, 2014, and interim periods within those years, with earlyadoption permitted. The adoption of this update concerns presentation and disclosure only as it relates to our consolidated financialstatements.
Effective December 31, 2014, we adopted ASU No. 2014-15, “Presentation of Financial Statements - Going Concern.” This updateprovides guidance about management’s responsibility to evaluate whether there is substantial doubt about an entity’s ability to continueas a going concern and on determining when and how entities must disclose going concern uncertainties in the financial statements. Theupdate requires management to perform interim and annual assessments of an entity’s ability to continue as a going concern within oneyear of the date of issuance of the entity’s financial statements. The amendments in this ASU are effective for the Company for annualperiods ending after December 15, 2016, and interim periods thereafter, with early adoption permitted. The adoption of this updateconcerns disclosure only and did not have any financial impact on our consolidated financial statements.
58
Copyright © 2013 www.secdatabase.com. All Rights Reserved.Please Consider the Environment Before Printing This Document
NOTE 3. EARNINGS PER SHARE
A reconciliation of the number of shares used for the basic and diluted earnings per share calculation was as follows:
Year Ended December 31,
(In millions, except per share data) 2014 2013 2012
Net income attributable to FMC Technologies, Inc. $ 699.9 $ 501.4 $ 430.0Weighted average number of shares outstanding 236.3 238.3 239.7Dilutive effect of restricted stock units and stock options 0.6 0.8 1.2Total shares and dilutive securities 236.9 239.1 240.9
Basic earnings per share attributable to FMC Technologies, Inc. $ 2.96 $ 2.10 $ 1.79Diluted earnings per share attributable to FMC Technologies, Inc. $ 2.95 $ 2.10 $ 1.78
NOTE 4. BUSINESS COMBINATIONS
Schilling Robotics, LLC—On January 3, 2012, we exercised our option to purchase the remaining 55% of outstanding shares ofSchilling Robotics, LLC (“Schilling Robotics”), a Delaware limited liability company, for $282.8 million in cash, and closed thetransaction on April 25, 2012. Prior to April 25, 2012, we owned 45% of Schilling Robotics. Schilling Robotics is a supplier ofadvanced robotic intervention products, including a line of remotely operated vehicle systems (“ROV”), manipulator systems andsubsea control systems. The acquisition of the remaining interests in Schilling Robotics is allowing us to grow in the expanding subseaenvironment, where demand for ROVs and the need for maintenance activities of subsea equipment is expected to increase.
Schilling Robotics is included among the consolidated subsidiaries reported in our Subsea Technologies segment. The acquisition-datefair value of our previously held equity interest in Schilling Robotics was $144.9 million with the fair value primarily estimated throughan income approach valuation. In 2012 we recorded a gain of $20.0 million in other income (expense), net on the consolidated statementof income related to the fair value remeasurement of our previously held equity interest in Schilling Robotics.
Control Systems International, Inc.—On April 30, 2012, we acquired 100% of Control Systems International, Inc. (“CSI”) for $59.0million in consideration transferred, comprised of $49.0 million in cash and $10.0 million withheld ("holdback") pursuant to the termsof the stock purchase agreement. The holdback amount will be held and maintained by FMC Technologies as security for the paymentof any and all amounts to which CSI indemnifies us, including final working capital adjustments and other indemnifications as listed inthe stock purchase agreement. We may deduct from the holdback any eligible amounts and pay CSI the net amount three years after theclosing date.
CSI is included among the consolidated subsidiaries reported in our Energy Infrastructure segment. Our acquisition of CSI is enhancingour automation and controls technologies and is benefiting production and processing businesses such as measurement solutionsthrough comprehensive fuel terminal and pipeline automation systems. Additionally, the acquired technologies support our long-termstrategy to expand our subsea production and processing systems.
Pure Energy Services Ltd.—On October 1, 2012, we acquired 100% of Pure Energy Services Ltd. (“Pure Energy”) for $287.0 million incash, which is included among the consolidated subsidiaries reported in our Surface Technologies segment. Based in Calgary, Alberta,Canada, and operating in multiple field locations in both Canada and the United States, Pure Energy is a provider of flowback servicesand wireline services. The acquisition of Pure Energy is complementing the existing products and services of our Surface Technologiessegment and is expected to create client value by providing an integrated well site solution.
Goodwill recognized for Schilling Robotics, CSI and Pure Energy as of the acquisition dates were $215.7 million, $30.7 million, and$85.5 million, respectively. The goodwill recognized is primarily attributable to expected synergies and assembled workforce acquired.The majority of the combined goodwill recognized for Schilling Robotics and CSI is deductible for tax purposes. Goodwill recognizedfor Pure Energy is not deductible for tax purposes.
59
Copyright © 2013 www.secdatabase.com. All Rights Reserved.Please Consider the Environment Before Printing This Document
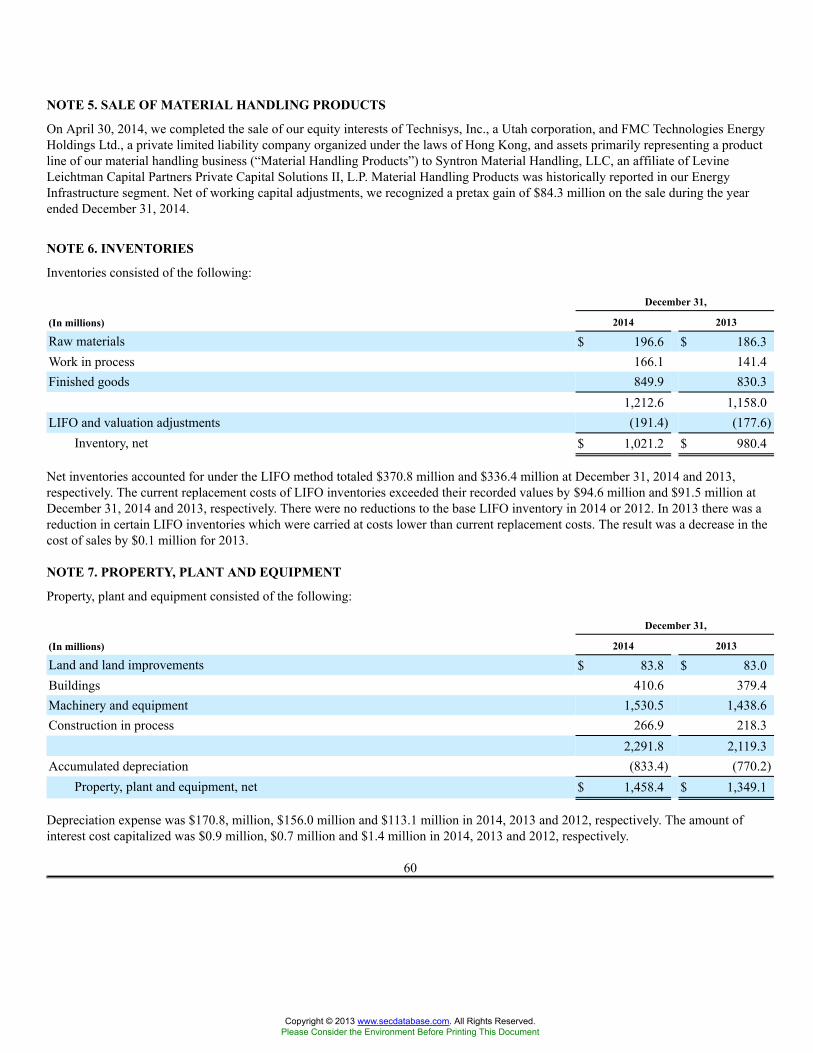
NOTE 5. SALE OF MATERIAL HANDLING PRODUCTS
On April 30, 2014, we completed the sale of our equity interests of Technisys, Inc., a Utah corporation, and FMC Technologies EnergyHoldings Ltd., a private limited liability company organized under the laws of Hong Kong, and assets primarily representing a productline of our material handling business (“Material Handling Products”) to Syntron Material Handling, LLC, an affiliate of LevineLeichtman Capital Partners Private Capital Solutions II, L.P. Material Handling Products was historically reported in our EnergyInfrastructure segment. Net of working capital adjustments, we recognized a pretax gain of $84.3 million on the sale during the yearended December 31, 2014.
NOTE 6. INVENTORIES
Inventories consisted of the following:
December 31,
(In millions) 2014 2013
Raw materials $ 196.6 $ 186.3Work in process 166.1 141.4Finished goods 849.9 830.3
1,212.6 1,158.0LIFO and valuation adjustments (191.4) (177.6)
Inventory, net $ 1,021.2 $ 980.4
Net inventories accounted for under the LIFO method totaled $370.8 million and $336.4 million at December 31, 2014 and 2013,respectively. The current replacement costs of LIFO inventories exceeded their recorded values by $94.6 million and $91.5 million atDecember 31, 2014 and 2013, respectively. There were no reductions to the base LIFO inventory in 2014 or 2012. In 2013 there was areduction in certain LIFO inventories which were carried at costs lower than current replacement costs. The result was a decrease in thecost of sales by $0.1 million for 2013.
NOTE 7. PROPERTY, PLANT AND EQUIPMENT
Property, plant and equipment consisted of the following:
December 31,
(In millions) 2014 2013
Land and land improvements $ 83.8 $ 83.0Buildings 410.6 379.4Machinery and equipment 1,530.5 1,438.6Construction in process 266.9 218.3
2,291.8 2,119.3Accumulated depreciation (833.4) (770.2)
Property, plant and equipment, net $ 1,458.4 $ 1,349.1
Depreciation expense was $170.8, million, $156.0 million and $113.1 million in 2014, 2013 and 2012, respectively. The amount ofinterest cost capitalized was $0.9 million, $0.7 million and $1.4 million in 2014, 2013 and 2012, respectively.
60
Copyright © 2013 www.secdatabase.com. All Rights Reserved.Please Consider the Environment Before Printing This Document
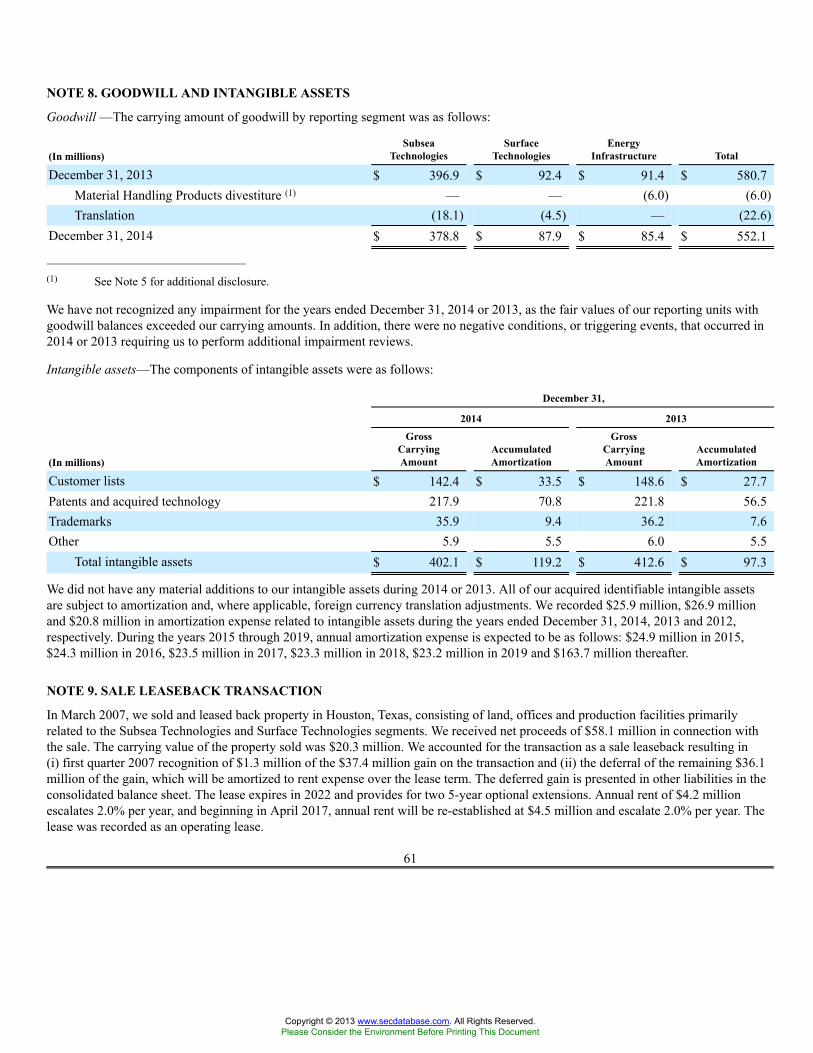
NOTE 8. GOODWILL AND INTANGIBLE ASSETS
Goodwill —The carrying amount of goodwill by reporting segment was as follows:
(In millions)Subsea
TechnologiesSurface
TechnologiesEnergy
Infrastructure Total
December 31, 2013 $ 396.9 $ 92.4 $ 91.4 $ 580.7Material Handling Products divestiture (1) — — (6.0) (6.0)Translation (18.1) (4.5) — (22.6)
December 31, 2014 $ 378.8 $ 87.9 $ 85.4 $ 552.1______________________________(1) See Note 5 for additional disclosure.
We have not recognized any impairment for the years ended December 31, 2014 or 2013, as the fair values of our reporting units withgoodwill balances exceeded our carrying amounts. In addition, there were no negative conditions, or triggering events, that occurred in2014 or 2013 requiring us to perform additional impairment reviews.
Intangible assets—The components of intangible assets were as follows:
December 31,
2014 2013
(In millions)
GrossCarryingAmount
AccumulatedAmortization
GrossCarryingAmount
AccumulatedAmortization
Customer lists $ 142.4 $ 33.5 $ 148.6 $ 27.7Patents and acquired technology 217.9 70.8 221.8 56.5Trademarks 35.9 9.4 36.2 7.6Other 5.9 5.5 6.0 5.5
Total intangible assets $ 402.1 $ 119.2 $ 412.6 $ 97.3
We did not have any material additions to our intangible assets during 2014 or 2013. All of our acquired identifiable intangible assetsare subject to amortization and, where applicable, foreign currency translation adjustments. We recorded $25.9 million, $26.9 millionand $20.8 million in amortization expense related to intangible assets during the years ended December 31, 2014, 2013 and 2012,respectively. During the years 2015 through 2019, annual amortization expense is expected to be as follows: $24.9 million in 2015,$24.3 million in 2016, $23.5 million in 2017, $23.3 million in 2018, $23.2 million in 2019 and $163.7 million thereafter.
NOTE 9. SALE LEASEBACK TRANSACTION
In March 2007, we sold and leased back property in Houston, Texas, consisting of land, offices and production facilities primarilyrelated to the Subsea Technologies and Surface Technologies segments. We received net proceeds of $58.1 million in connection withthe sale. The carrying value of the property sold was $20.3 million. We accounted for the transaction as a sale leaseback resulting in(i) first quarter 2007 recognition of $1.3 million of the $37.4 million gain on the transaction and (ii) the deferral of the remaining $36.1million of the gain, which will be amortized to rent expense over the lease term. The deferred gain is presented in other liabilities in theconsolidated balance sheet. The lease expires in 2022 and provides for two 5-year optional extensions. Annual rent of $4.2 millionescalates 2.0% per year, and beginning in April 2017, annual rent will be re-established at $4.5 million and escalate 2.0% per year. Thelease was recorded as an operating lease.
61
Copyright © 2013 www.secdatabase.com. All Rights Reserved.Please Consider the Environment Before Printing This Document
NOTE 10. DEBT
Credit facility—On March 26, 2012, we entered into a $1.5 billion revolving credit agreement (“credit agreement”) with JPMorganChase Bank, N.A., as Administrative Agent. The credit agreement is a five-year, revolving credit facility expiring in March 2017.Subject to certain conditions, at our request and with the approval of the Administrative Agent, the aggregate commitments under thecredit agreement may be increased by an additional $500.0 million.
Borrowings under the credit agreement bear interest at a base rate or the London interbank offered rate (“LIBOR”), at our option, plusan applicable margin. Depending on our total leverage ratio, the applicable margin for revolving loans varies (i) in the case of LIBORloans, from 1.125% to 1.750% and (ii) in the case of base rate loans, from 0.125% to 0.750%. The base rate is the highest of (1) theprime rate announced by JPMorgan Chase Bank, N.A., (2) the Federal Funds Rate plus 0.5% or (3) one-month LIBOR plus 1.0%.
Senior Notes—On September 21, 2012, we completed the public offering of $300.0 million aggregate principal amount of 2.00% seniornotes due October 2017 (the “2017 Notes”) and $500.0 million aggregate principal amount of 3.45% senior notes due October 2022 (the“2022 Notes” and, collectively with the 2017 Notes, the “Senior Notes”). Interest on the Senior Notes is payable semi-annually in arrearson April 1 and October 1 of each year, beginning April 1, 2013. Net proceeds from the offering of $793.8 million were used for therepayment of outstanding commercial paper and indebtedness under our revolving credit facility.
The terms of the Senior Notes are governed by the indenture (the “Base Indenture”), dated as of September 21, 2012 between FMCTechnologies and U.S. Bank National Association, as trustee (the “Trustee”), as amended and supplemented by the First SupplementalIndenture between FMC Technologies and the Trustee (the “First Supplemental Indenture”) relating to the issuance of the 2017 Notesand the Second Supplemental Indenture between FMC Technologies and the Trustee (the “Second Supplemental Indenture”) relating tothe issuance of the 2022 Notes.
At any time prior to their maturity in the case of the 2017 Notes, and at any time prior to July 1, 2022, in the case of the 2022 Notes, wemay redeem some or all of the Senior Notes at the redemption prices specified in the First Supplemental Indenture and SecondSupplemental Indenture, respectively. At any time on or after July 1, 2022, we may redeem some or all of the 2022 Notes at theredemption price equal to 100% of the principal amount of the 2022 Notes redeemed. The Senior Notes are our senior unsecuredobligations. The Senior Notes will rank equally in right of payment with all of our existing and future unsubordinated debt, and willrank senior in right of payment to all of our future subordinated debt.
Commercial paper—Under our commercial paper program, we have the ability to access $1.0 billion of short-term financing throughour commercial paper dealers subject to the limit of unused capacity of our revolving credit agreement. Commercial paper borrowingsare issued at market interest rates. Commercial paper borrowings as of December 31, 2014, had a weighted average interest rate of0.52%.
Term loan—In August 2013, we entered into a R$60.7 million term loan agreement in Brazil maturing on August 15, 2016, with ItaúBBA., as Administrative Agent. Under the loan agreement, interest accrues at an annual rate of 5.50%. Principal is due at maturity andinterest is paid quarterly.
Property financing—In September 2004, we entered into agreements for the sale and leaseback of an office building having a net bookvalue of $8.5 million. Under the terms of the agreement, the building was sold for $9.7 million in net proceeds and leased back under a10-year lease. We subleased this property to a third party under a lease agreement that was accounted for as an operating lease. Weaccounted for the transaction as a financing transaction and were amortizing the related obligation using an effective annual interest rateof 5.37%. In September 2014, the sale and leaseback expired and resulted in an immaterial noncash gain. In addition, property financingincludes our obligations under capital lease arrangements.
Uncommitted credit—We have uncommitted credit lines at many of our international subsidiaries for immaterial amounts. We utilizethese facilities to provide a more efficient daily source of liquidity. The effective interest rates depend upon the local national market.
62
Copyright © 2013 www.secdatabase.com. All Rights Reserved.Please Consider the Environment Before Printing This Document
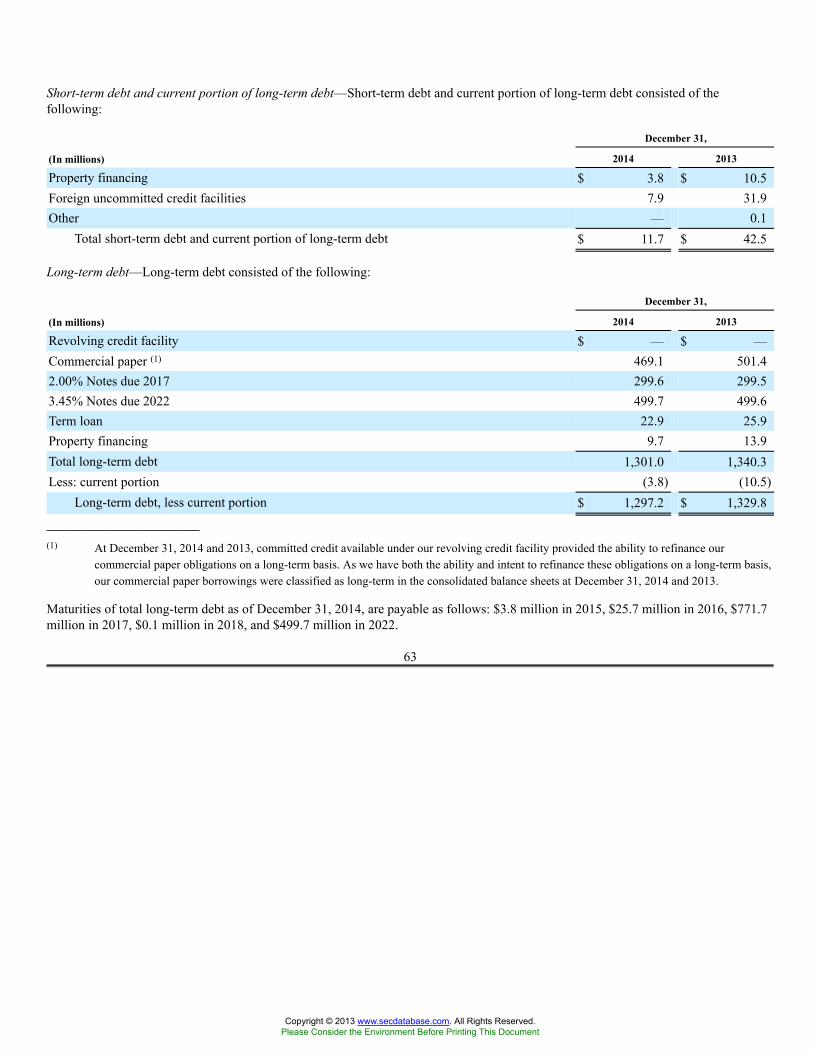
Short-term debt and current portion of long-term debt—Short-term debt and current portion of long-term debt consisted of thefollowing:
December 31,
(In millions) 2014 2013
Property financing $ 3.8 $ 10.5Foreign uncommitted credit facilities 7.9 31.9Other — 0.1
Total short-term debt and current portion of long-term debt $ 11.7 $ 42.5
Long-term debt—Long-term debt consisted of the following:
December 31,
(In millions) 2014 2013
Revolving credit facility $ — $ —Commercial paper (1) 469.1 501.42.00% Notes due 2017 299.6 299.53.45% Notes due 2022 499.7 499.6Term loan 22.9 25.9Property financing 9.7 13.9Total long-term debt 1,301.0 1,340.3Less: current portion (3.8) (10.5)
Long-term debt, less current portion $ 1,297.2 $ 1,329.8_______________________(1) At December 31, 2014 and 2013, committed credit available under our revolving credit facility provided the ability to refinance our
commercial paper obligations on a long-term basis. As we have both the ability and intent to refinance these obligations on a long-term basis,our commercial paper borrowings were classified as long-term in the consolidated balance sheets at December 31, 2014 and 2013.
Maturities of total long-term debt as of December 31, 2014, are payable as follows: $3.8 million in 2015, $25.7 million in 2016, $771.7million in 2017, $0.1 million in 2018, and $499.7 million in 2022.
63
Copyright © 2013 www.secdatabase.com. All Rights Reserved.Please Consider the Environment Before Printing This Document
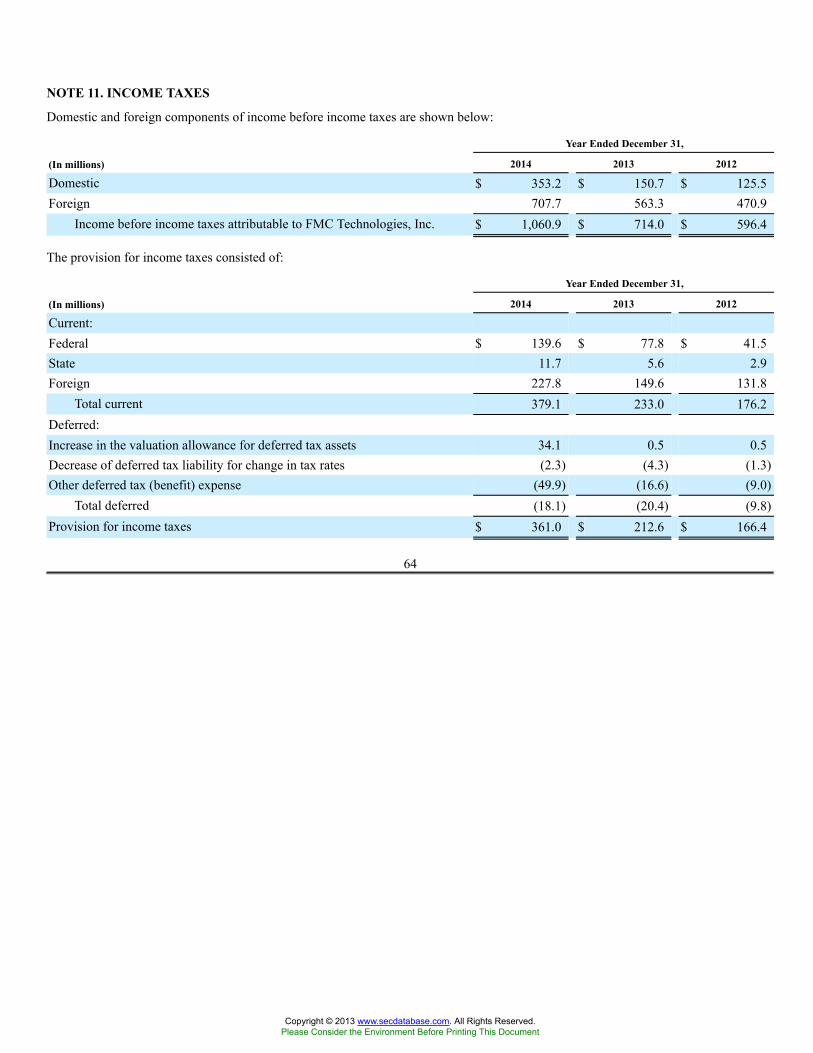
NOTE 11. INCOME TAXES
Domestic and foreign components of income before income taxes are shown below:
Year Ended December 31,
(In millions) 2014 2013 2012
Domestic $ 353.2 $ 150.7 $ 125.5Foreign 707.7 563.3 470.9
Income before income taxes attributable to FMC Technologies, Inc. $ 1,060.9 $ 714.0 $ 596.4
The provision for income taxes consisted of:
Year Ended December 31,
(In millions) 2014 2013 2012
Current:Federal $ 139.6 $ 77.8 $ 41.5State 11.7 5.6 2.9Foreign 227.8 149.6 131.8
Total current 379.1 233.0 176.2Deferred:Increase in the valuation allowance for deferred tax assets 34.1 0.5 0.5Decrease of deferred tax liability for change in tax rates (2.3) (4.3) (1.3)Other deferred tax (benefit) expense (49.9) (16.6) (9.0)
Total deferred (18.1) (20.4) (9.8)Provision for income taxes $ 361.0 $ 212.6 $ 166.4
64
Copyright © 2013 www.secdatabase.com. All Rights Reserved.Please Consider the Environment Before Printing This Document
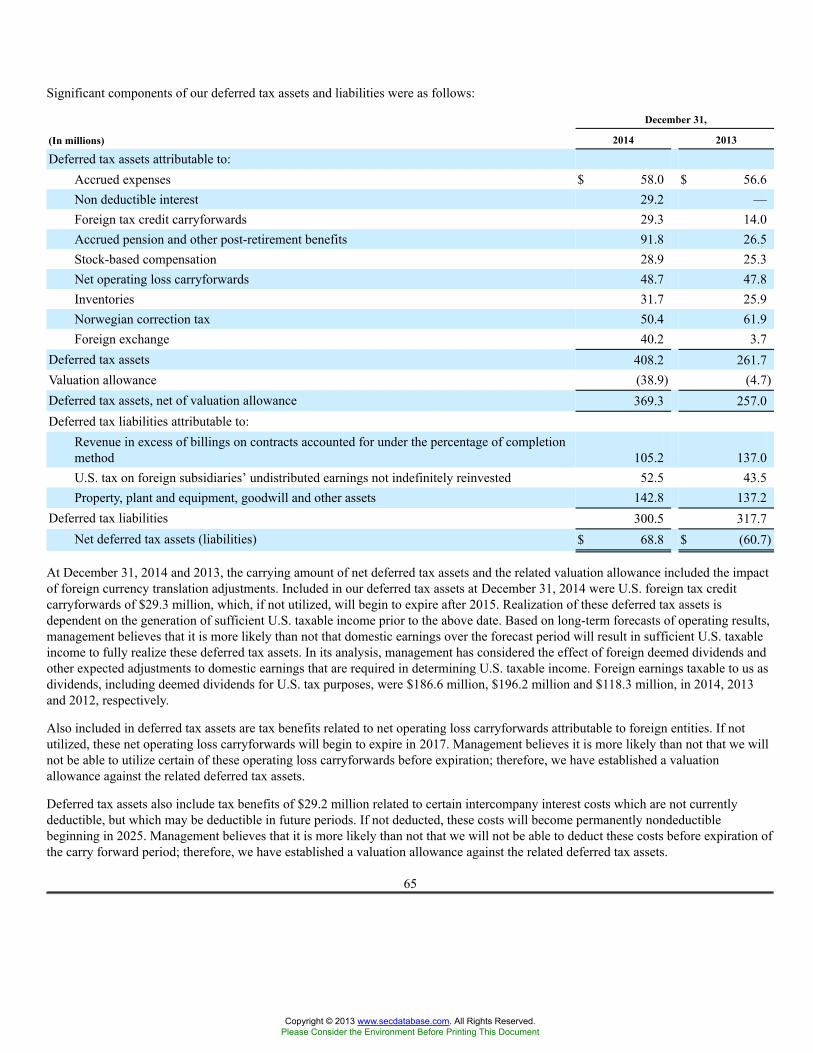
Significant components of our deferred tax assets and liabilities were as follows:
December 31,
(In millions) 2014 2013
Deferred tax assets attributable to:Accrued expenses $ 58.0 $ 56.6Non deductible interest 29.2 —Foreign tax credit carryforwards 29.3 14.0Accrued pension and other post-retirement benefits 91.8 26.5Stock-based compensation 28.9 25.3Net operating loss carryforwards 48.7 47.8Inventories 31.7 25.9Norwegian correction tax 50.4 61.9Foreign exchange 40.2 3.7
Deferred tax assets 408.2 261.7Valuation allowance (38.9) (4.7)Deferred tax assets, net of valuation allowance 369.3 257.0Deferred tax liabilities attributable to:
Revenue in excess of billings on contracts accounted for under the percentage of completionmethod 105.2 137.0U.S. tax on foreign subsidiaries’ undistributed earnings not indefinitely reinvested 52.5 43.5Property, plant and equipment, goodwill and other assets 142.8 137.2
Deferred tax liabilities 300.5 317.7Net deferred tax assets (liabilities) $ 68.8 $ (60.7)
At December 31, 2014 and 2013, the carrying amount of net deferred tax assets and the related valuation allowance included the impactof foreign currency translation adjustments. Included in our deferred tax assets at December 31, 2014 were U.S. foreign tax creditcarryforwards of $29.3 million, which, if not utilized, will begin to expire after 2015. Realization of these deferred tax assets isdependent on the generation of sufficient U.S. taxable income prior to the above date. Based on long-term forecasts of operating results,management believes that it is more likely than not that domestic earnings over the forecast period will result in sufficient U.S. taxableincome to fully realize these deferred tax assets. In its analysis, management has considered the effect of foreign deemed dividends andother expected adjustments to domestic earnings that are required in determining U.S. taxable income. Foreign earnings taxable to us asdividends, including deemed dividends for U.S. tax purposes, were $186.6 million, $196.2 million and $118.3 million, in 2014, 2013and 2012, respectively.
Also included in deferred tax assets are tax benefits related to net operating loss carryforwards attributable to foreign entities. If notutilized, these net operating loss carryforwards will begin to expire in 2017. Management believes it is more likely than not that we willnot be able to utilize certain of these operating loss carryforwards before expiration; therefore, we have established a valuationallowance against the related deferred tax assets.
Deferred tax assets also include tax benefits of $29.2 million related to certain intercompany interest costs which are not currentlydeductible, but which may be deductible in future periods. If not deducted, these costs will become permanently nondeductiblebeginning in 2025. Management believes that it is more likely than not that we will not be able to deduct these costs before expiration ofthe carry forward period; therefore, we have established a valuation allowance against the related deferred tax assets.
65
Copyright © 2013 www.secdatabase.com. All Rights Reserved.Please Consider the Environment Before Printing This Document
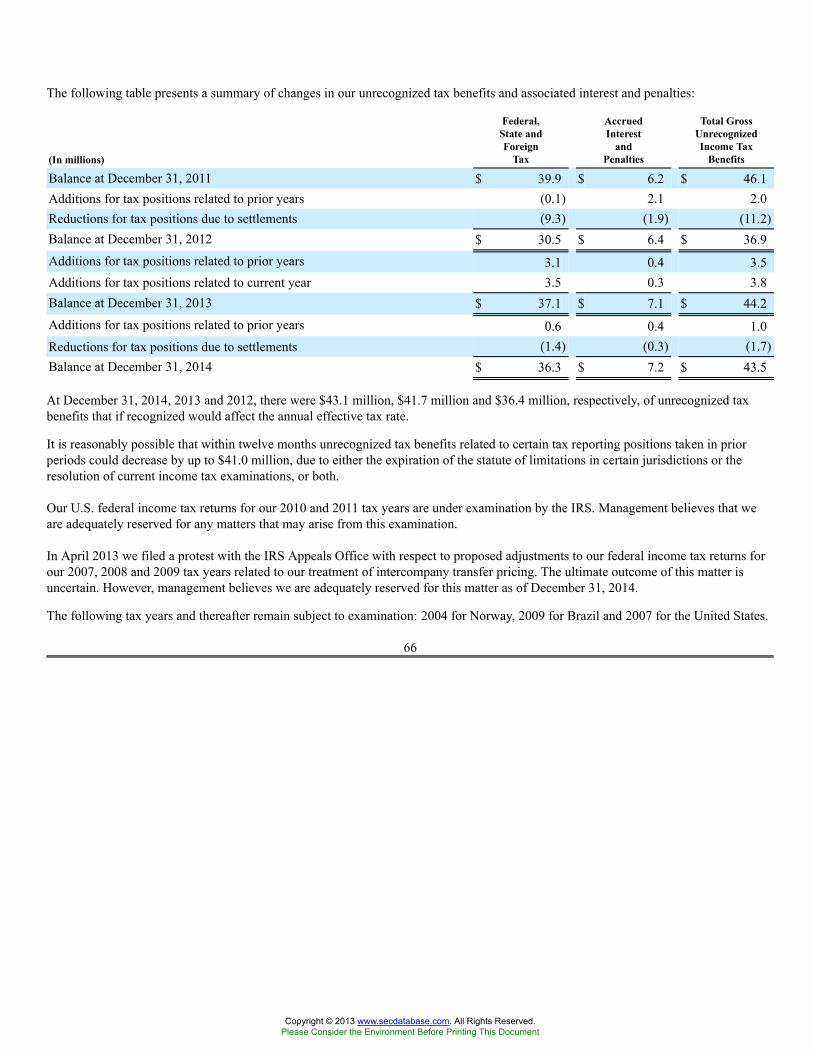
The following table presents a summary of changes in our unrecognized tax benefits and associated interest and penalties:
(In millions)
Federal,State andForeign
Tax
AccruedInterest
andPenalties
Total GrossUnrecognizedIncome Tax
Benefits
Balance at December 31, 2011 $ 39.9 $ 6.2 $ 46.1Additions for tax positions related to prior years (0.1) 2.1 2.0Reductions for tax positions due to settlements (9.3) (1.9) (11.2)Balance at December 31, 2012 $ 30.5 $ 6.4 $ 36.9Additions for tax positions related to prior years 3.1 0.4 3.5Additions for tax positions related to current year 3.5 0.3 3.8Balance at December 31, 2013 $ 37.1 $ 7.1 $ 44.2Additions for tax positions related to prior years 0.6 0.4 1.0Reductions for tax positions due to settlements (1.4) (0.3) (1.7)Balance at December 31, 2014 $ 36.3 $ 7.2 $ 43.5
At December 31, 2014, 2013 and 2012, there were $43.1 million, $41.7 million and $36.4 million, respectively, of unrecognized taxbenefits that if recognized would affect the annual effective tax rate.
It is reasonably possible that within twelve months unrecognized tax benefits related to certain tax reporting positions taken in priorperiods could decrease by up to $41.0 million, due to either the expiration of the statute of limitations in certain jurisdictions or theresolution of current income tax examinations, or both.
Our U.S. federal income tax returns for our 2010 and 2011 tax years are under examination by the IRS. Management believes that weare adequately reserved for any matters that may arise from this examination.
In April 2013 we filed a protest with the IRS Appeals Office with respect to proposed adjustments to our federal income tax returns forour 2007, 2008 and 2009 tax years related to our treatment of intercompany transfer pricing. The ultimate outcome of this matter isuncertain. However, management believes we are adequately reserved for this matter as of December 31, 2014.
The following tax years and thereafter remain subject to examination: 2004 for Norway, 2009 for Brazil and 2007 for the United States.
66
Copyright © 2013 www.secdatabase.com. All Rights Reserved.Please Consider the Environment Before Printing This Document
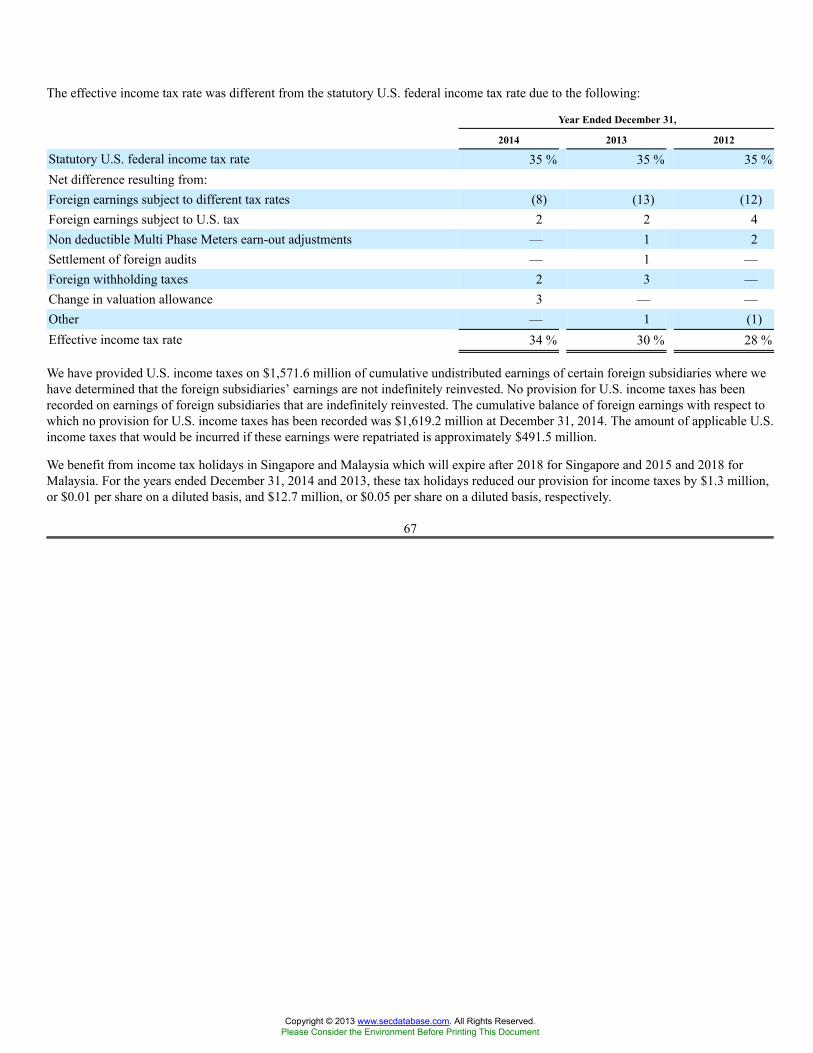
The effective income tax rate was different from the statutory U.S. federal income tax rate due to the following:
Year Ended December 31,
2014 2013 2012
Statutory U.S. federal income tax rate 35 % 35 % 35 %Net difference resulting from:Foreign earnings subject to different tax rates (8) (13) (12)Foreign earnings subject to U.S. tax 2 2 4Non deductible Multi Phase Meters earn-out adjustments — 1 2Settlement of foreign audits — 1 —Foreign withholding taxes 2 3 —Change in valuation allowance 3 — —Other — 1 (1)Effective income tax rate 34 % 30 % 28 %
We have provided U.S. income taxes on $1,571.6 million of cumulative undistributed earnings of certain foreign subsidiaries where wehave determined that the foreign subsidiaries’ earnings are not indefinitely reinvested. No provision for U.S. income taxes has beenrecorded on earnings of foreign subsidiaries that are indefinitely reinvested. The cumulative balance of foreign earnings with respect towhich no provision for U.S. income taxes has been recorded was $1,619.2 million at December 31, 2014. The amount of applicable U.S.income taxes that would be incurred if these earnings were repatriated is approximately $491.5 million.
We benefit from income tax holidays in Singapore and Malaysia which will expire after 2018 for Singapore and 2015 and 2018 forMalaysia. For the years ended December 31, 2014 and 2013, these tax holidays reduced our provision for income taxes by $1.3 million,or $0.01 per share on a diluted basis, and $12.7 million, or $0.05 per share on a diluted basis, respectively.
67
Copyright © 2013 www.secdatabase.com. All Rights Reserved.Please Consider the Environment Before Printing This Document
NOTE 12. PENSION AND OTHER POST-RETIREMENT BENEFIT PLANS
We have funded and unfunded defined benefit pension plans which provide defined benefits based on years of service and final averagesalary. In October 2009, the Board of Directors amended the U.S. Qualified and Non-Qualified Defined Benefit Pension Plans (“U.S.Pension Plans”) to freeze participation in the U.S. Pension Plans for all new nonunion employees hired on or after January 1, 2010, andcurrent nonunion employees with less than five years of vesting service as of December 31, 2009 (“frozen participants”). For currentnonunion employees with less than five years of vesting service as of December 31, 2009, benefits accrued under the U.S. Pension Plansand earned as of that date were frozen based on credited service and pay as of December 31, 2009.
In 2014 the Company amended the U.S. Qualified Pension Plan, and effective June 1, 2014, the assets and liabilities attributable toparticipants who are (i) either frozen participants or participants that had terminated service and subsequently became re-employed onor after January 1, 2010, and (ii) active employees of FMC Technologies as of June 1, 2014 were transferred from the U.S. QualifiedPension Plan to the FMC Technologies, Inc. Frozen Retirement Plan (“Frozen Plan”). Under the Frozen Plan, participants had the optionto accept cash or an annuity upon the Frozen Plan’s termination. In December 2014, settlement payments were made based on frozenparticipants’ elections and settlement costs were recorded during 2014.
Foreign-based employees are eligible to participate in FMC Technologies-sponsored or government-sponsored benefit plans to whichwe contribute. Several of the foreign defined benefit pension plans sponsored by us provide for employee contributions; the remainingplans are noncontributory.
We have other post-retirement benefit plans covering substantially all of our U.S. employees who were hired prior to January 1, 2003.The post-retirement health care plans are contributory; the post-retirement life insurance plans are noncontributory.
We are required to recognize the funded status of defined benefit post-retirement plans as an asset or liability in the consolidated balancesheet and recognize changes in that funded status in comprehensive income in the year in which the changes occur. Further, we arerequired to measure the plan’s assets and its obligations that determine its funded status as of the date of the consolidated balance sheet.We have applied this guidance to our domestic pension and other post-retirement benefit plans as well as for many of our non-U.S.plans, including those in the United Kingdom, Norway, Germany, France and Canada. Pension expense measured in compliance withGAAP for the other non-U.S. pension plans is not materially different from the locally reported pension expense.
68
Copyright © 2013 www.secdatabase.com. All Rights Reserved.Please Consider the Environment Before Printing This Document
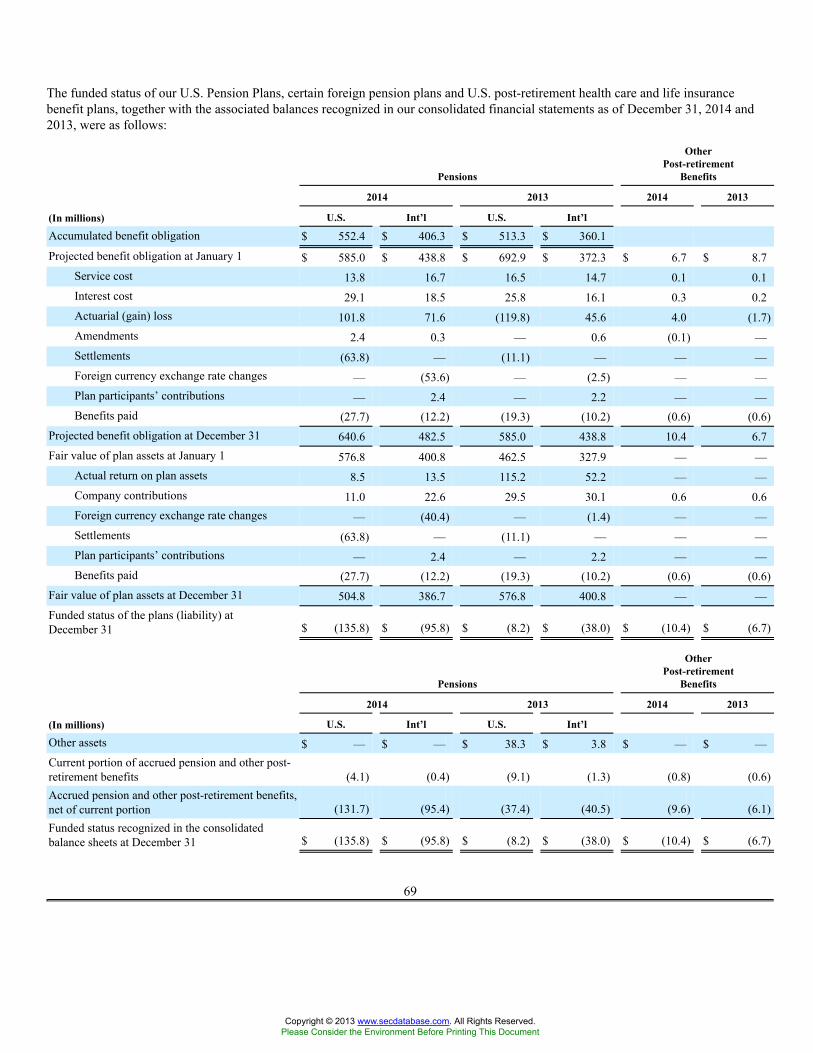
The funded status of our U.S. Pension Plans, certain foreign pension plans and U.S. post-retirement health care and life insurancebenefit plans, together with the associated balances recognized in our consolidated financial statements as of December 31, 2014 and2013, were as follows:
Pensions
OtherPost-retirement
Benefits
2014 2013 2014 2013
(In millions) U.S. Int’l U.S. Int’l
Accumulated benefit obligation $ 552.4 $ 406.3 $ 513.3 $ 360.1
Projected benefit obligation at January 1 $ 585.0 $ 438.8 $ 692.9 $ 372.3 $ 6.7 $ 8.7Service cost 13.8 16.7 16.5 14.7 0.1 0.1Interest cost 29.1 18.5 25.8 16.1 0.3 0.2Actuarial (gain) loss 101.8 71.6 (119.8) 45.6 4.0 (1.7)Amendments 2.4 0.3 — 0.6 (0.1) —Settlements (63.8) — (11.1) — — —Foreign currency exchange rate changes — (53.6) — (2.5) — —Plan participants’ contributions — 2.4 — 2.2 — —Benefits paid (27.7) (12.2) (19.3) (10.2) (0.6) (0.6)
Projected benefit obligation at December 31 640.6 482.5 585.0 438.8 10.4 6.7Fair value of plan assets at January 1 576.8 400.8 462.5 327.9 — —
Actual return on plan assets 8.5 13.5 115.2 52.2 — —Company contributions 11.0 22.6 29.5 30.1 0.6 0.6Foreign currency exchange rate changes — (40.4) — (1.4) — —Settlements (63.8) — (11.1) — — —Plan participants’ contributions — 2.4 — 2.2 — —Benefits paid (27.7) (12.2) (19.3) (10.2) (0.6) (0.6)
Fair value of plan assets at December 31 504.8 386.7 576.8 400.8 — —Funded status of the plans (liability) atDecember 31 $ (135.8) $ (95.8) $ (8.2) $ (38.0) $ (10.4) $ (6.7)
Pensions
OtherPost-retirement
Benefits
2014 2013 2014 2013
(In millions) U.S. Int’l U.S. Int’l
Other assets $ — $ — $ 38.3 $ 3.8 $ — $ —Current portion of accrued pension and other post-retirement benefits (4.1) (0.4) (9.1) (1.3) (0.8) (0.6)Accrued pension and other post-retirement benefits,net of current portion (131.7) (95.4) (37.4) (40.5) (9.6) (6.1)Funded status recognized in the consolidatedbalance sheets at December 31 $ (135.8) $ (95.8) $ (8.2) $ (38.0) $ (10.4) $ (6.7)
69
Copyright © 2013 www.secdatabase.com. All Rights Reserved.Please Consider the Environment Before Printing This Document
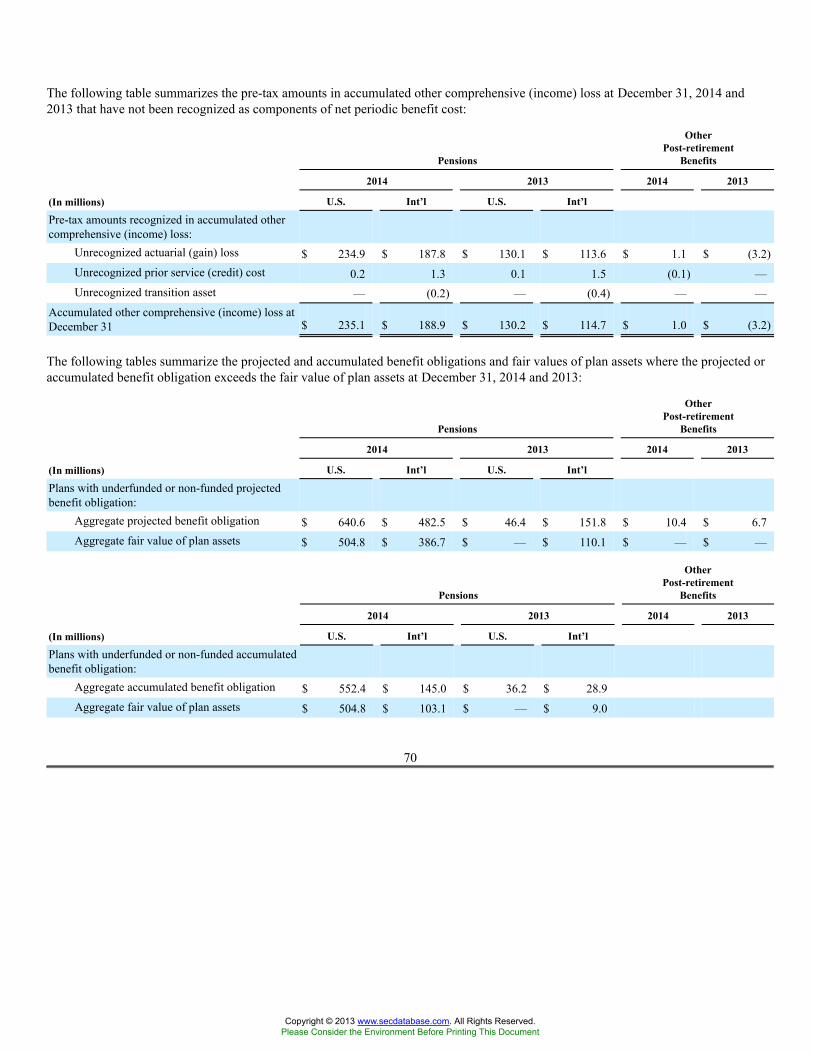
The following table summarizes the pre-tax amounts in accumulated other comprehensive (income) loss at December 31, 2014 and2013 that have not been recognized as components of net periodic benefit cost:
Pensions
OtherPost-retirement
Benefits
2014 2013 2014 2013
(In millions) U.S. Int’l U.S. Int’l
Pre-tax amounts recognized in accumulated othercomprehensive (income) loss:
Unrecognized actuarial (gain) loss $ 234.9 $ 187.8 $ 130.1 $ 113.6 $ 1.1 $ (3.2)Unrecognized prior service (credit) cost 0.2 1.3 0.1 1.5 (0.1) —Unrecognized transition asset — (0.2) — (0.4) — —
Accumulated other comprehensive (income) loss atDecember 31 $ 235.1 $ 188.9 $ 130.2 $ 114.7 $ 1.0 $ (3.2)
The following tables summarize the projected and accumulated benefit obligations and fair values of plan assets where the projected oraccumulated benefit obligation exceeds the fair value of plan assets at December 31, 2014 and 2013:
Pensions
OtherPost-retirement
Benefits
2014 2013 2014 2013
(In millions) U.S. Int’l U.S. Int’l
Plans with underfunded or non-funded projectedbenefit obligation:
Aggregate projected benefit obligation $ 640.6 $ 482.5 $ 46.4 $ 151.8 $ 10.4 $ 6.7Aggregate fair value of plan assets $ 504.8 $ 386.7 $ — $ 110.1 $ — $ —
Pensions
OtherPost-retirement
Benefits
2014 2013 2014 2013
(In millions) U.S. Int’l U.S. Int’l
Plans with underfunded or non-funded accumulatedbenefit obligation:
Aggregate accumulated benefit obligation $ 552.4 $ 145.0 $ 36.2 $ 28.9Aggregate fair value of plan assets $ 504.8 $ 103.1 $ — $ 9.0
70
Copyright © 2013 www.secdatabase.com. All Rights Reserved.Please Consider the Environment Before Printing This Document
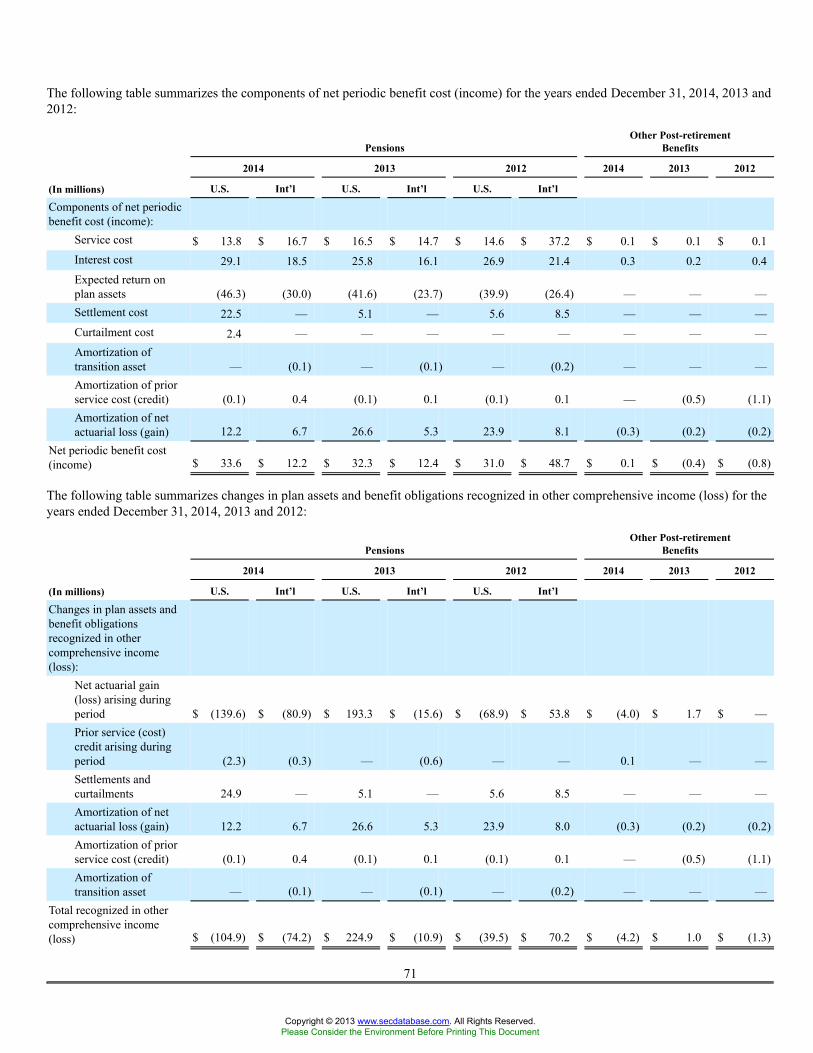
The following table summarizes the components of net periodic benefit cost (income) for the years ended December 31, 2014, 2013 and2012:
PensionsOther Post-retirement
Benefits
2014 2013 2012 2014 2013 2012
(In millions) U.S. Int’l U.S. Int’l U.S. Int’l
Components of net periodicbenefit cost (income):
Service cost $ 13.8 $ 16.7 $ 16.5 $ 14.7 $ 14.6 $ 37.2 $ 0.1 $ 0.1 $ 0.1Interest cost 29.1 18.5 25.8 16.1 26.9 21.4 0.3 0.2 0.4Expected return onplan assets (46.3) (30.0) (41.6) (23.7) (39.9) (26.4) — — —Settlement cost 22.5 — 5.1 — 5.6 8.5 — — —Curtailment cost 2.4 — — — — — — — —Amortization oftransition asset — (0.1) — (0.1) — (0.2) — — —Amortization of priorservice cost (credit) (0.1) 0.4 (0.1) 0.1 (0.1) 0.1 — (0.5) (1.1)Amortization of netactuarial loss (gain) 12.2 6.7 26.6 5.3 23.9 8.1 (0.3) (0.2) (0.2)
Net periodic benefit cost(income) $ 33.6 $ 12.2 $ 32.3 $ 12.4 $ 31.0 $ 48.7 $ 0.1 $ (0.4) $ (0.8)
The following table summarizes changes in plan assets and benefit obligations recognized in other comprehensive income (loss) for theyears ended December 31, 2014, 2013 and 2012:
PensionsOther Post-retirement
Benefits
2014 2013 2012 2014 2013 2012
(In millions) U.S. Int’l U.S. Int’l U.S. Int’l
Changes in plan assets andbenefit obligationsrecognized in othercomprehensive income(loss):
Net actuarial gain(loss) arising duringperiod $ (139.6) $ (80.9) $ 193.3 $ (15.6) $ (68.9) $ 53.8 $ (4.0) $ 1.7 $ —Prior service (cost)credit arising duringperiod (2.3) (0.3) — (0.6) — — 0.1 — —Settlements andcurtailments 24.9 — 5.1 — 5.6 8.5 — — —Amortization of netactuarial loss (gain) 12.2 6.7 26.6 5.3 23.9 8.0 (0.3) (0.2) (0.2)Amortization of priorservice cost (credit) (0.1) 0.4 (0.1) 0.1 (0.1) 0.1 — (0.5) (1.1)Amortization oftransition asset — (0.1) — (0.1) — (0.2) — — —
Total recognized in othercomprehensive income(loss) $ (104.9) $ (74.2) $ 224.9 $ (10.9) $ (39.5) $ 70.2 $ (4.2) $ 1.0 $ (1.3)
71
Copyright © 2013 www.secdatabase.com. All Rights Reserved.Please Consider the Environment Before Printing This Document
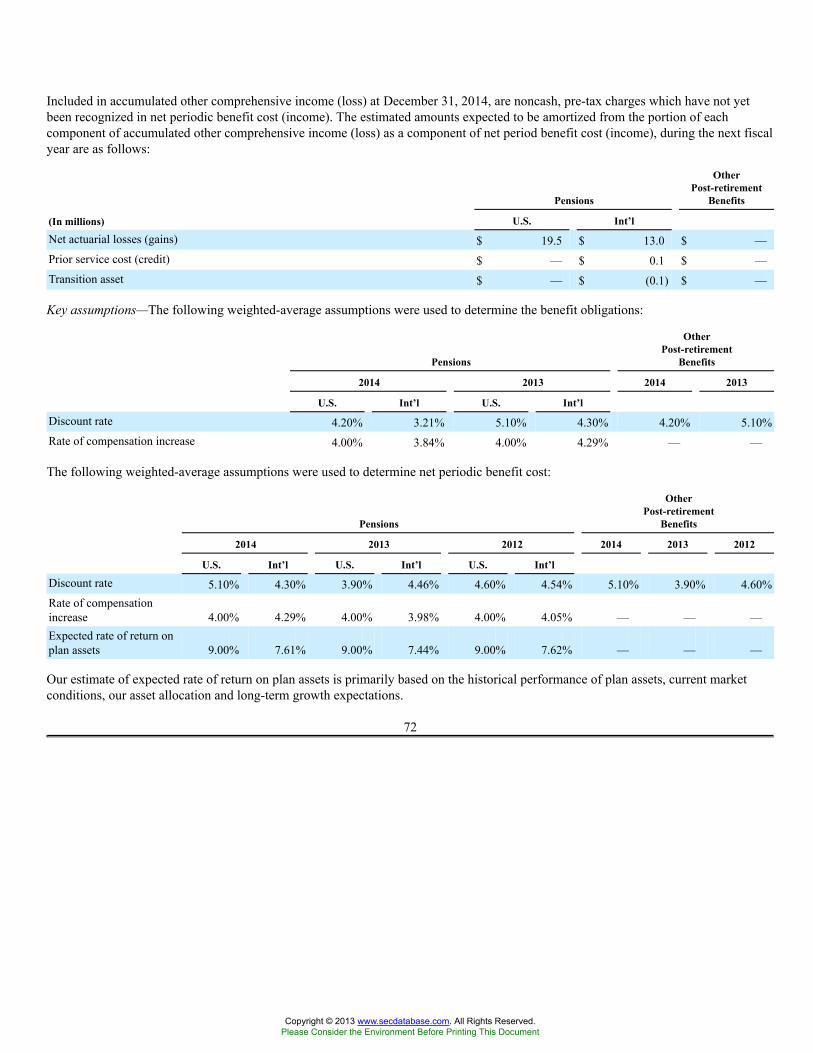
Included in accumulated other comprehensive income (loss) at December 31, 2014, are noncash, pre-tax charges which have not yetbeen recognized in net periodic benefit cost (income). The estimated amounts expected to be amortized from the portion of eachcomponent of accumulated other comprehensive income (loss) as a component of net period benefit cost (income), during the next fiscalyear are as follows:
Pensions
OtherPost-retirement
Benefits
(In millions) U.S. Int’l
Net actuarial losses (gains) $ 19.5 $ 13.0 $ —Prior service cost (credit) $ — $ 0.1 $ —Transition asset $ — $ (0.1) $ —
Key assumptions—The following weighted-average assumptions were used to determine the benefit obligations:
Pensions
OtherPost-retirement
Benefits
2014 2013 2014 2013
U.S. Int’l U.S. Int’l
Discount rate 4.20% 3.21% 5.10% 4.30% 4.20% 5.10%Rate of compensation increase 4.00% 3.84% 4.00% 4.29% — —
The following weighted-average assumptions were used to determine net periodic benefit cost:
Pensions
OtherPost-retirement
Benefits
2014 2013 2012 2014 2013 2012
U.S. Int’l U.S. Int’l U.S. Int’l
Discount rate 5.10% 4.30% 3.90% 4.46% 4.60% 4.54% 5.10% 3.90% 4.60%Rate of compensationincrease 4.00% 4.29% 4.00% 3.98% 4.00% 4.05% — — —Expected rate of return onplan assets 9.00% 7.61% 9.00% 7.44% 9.00% 7.62% — — —
Our estimate of expected rate of return on plan assets is primarily based on the historical performance of plan assets, current marketconditions, our asset allocation and long-term growth expectations.
72
Copyright © 2013 www.secdatabase.com. All Rights Reserved.Please Consider the Environment Before Printing This Document
Plan assets—Our pension investment strategy emphasizes maximizing returns consistent with balancing risk. Excluding ourinternational plans with insurance-based investments, 89% of our total pension plan assets represent the U.S. qualified plan, the U.K.plan and the Canadian plan. These plans are primarily invested in equity securities to maximize the long-term returns of the plans. Theinvestment managers of these assets, including the hedge funds and limited partnerships, use Graham and Dodd fundamental investmentanalysis to select securities that have a margin of safety between the price of the security and the estimated value of the security. Thisvalue-oriented approach tends to mitigate the risk of a large equity allocation.
The following is a description of the valuation methodologies used for the pension plan assets. There have been no changes in themethodologies used at December 31, 2014 and 2013.
• Cash is valued at cost, which approximates fair value.
• Equity securities are comprised of common stock, preferred stock, registered investment companies and common/collectivetrusts. The fair values of equity securities are valued at the closing price reported on the active market on which the securitiesare traded. The fair values of registered investment companies and common/collective trusts are valued based on quoted marketprices, which represent the net asset value (“NAV”) of shares held, and primarily include investments in equity securities.
• The fair values of hedge funds are valued using the NAV as determined by the administrator or custodian of the fund.
• The fair values of limited partnerships are valued using the NAV as determined by the administrator or custodian of the fund.
• Insurance contracts are valued at book value, which approximates fair value, and is calculated using the prior-year balance plusor minus investment returns and changes in cash flows.
• Emerging market bonds are comprised of registered investment companies. The fair values of registered investment companiesare valued based on quoted market prices, which represent the NAV of shares held.
73
Copyright © 2013 www.secdatabase.com. All Rights Reserved.Please Consider the Environment Before Printing This Document
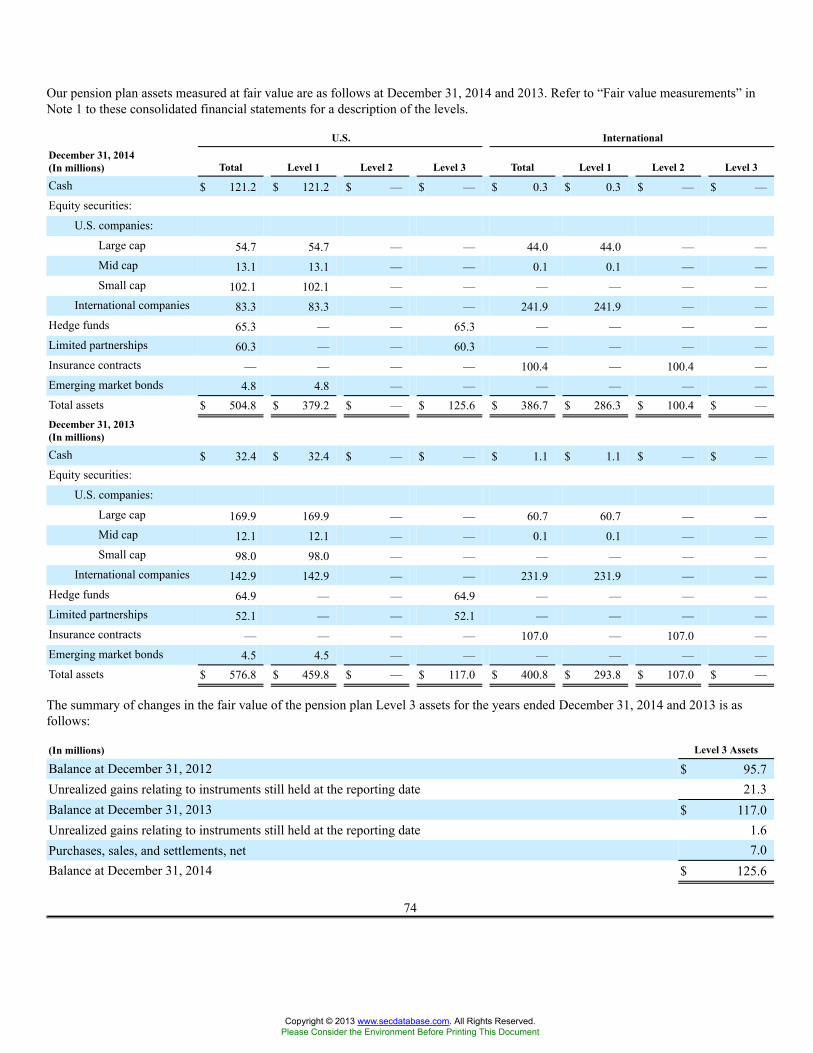
Our pension plan assets measured at fair value are as follows at December 31, 2014 and 2013. Refer to “Fair value measurements” inNote 1 to these consolidated financial statements for a description of the levels.
U.S. InternationalDecember 31, 2014(In millions) Total Level 1 Level 2 Level 3 Total Level 1 Level 2 Level 3
Cash $ 121.2 $ 121.2 $ — $ — $ 0.3 $ 0.3 $ — $ —Equity securities:
U.S. companies:
Large cap 54.7 54.7 — — 44.0 44.0 — —Mid cap 13.1 13.1 — — 0.1 0.1 — —Small cap 102.1 102.1 — — — — — —
International companies 83.3 83.3 — — 241.9 241.9 — —Hedge funds 65.3 — — 65.3 — — — —Limited partnerships 60.3 — — 60.3 — — — —Insurance contracts — — — — 100.4 — 100.4 —Emerging market bonds 4.8 4.8 — — — — — —Total assets $ 504.8 $ 379.2 $ — $ 125.6 $ 386.7 $ 286.3 $ 100.4 $ —December 31, 2013(In millions)
Cash $ 32.4 $ 32.4 $ — $ — $ 1.1 $ 1.1 $ — $ —Equity securities:
U.S. companies:
Large cap 169.9 169.9 — — 60.7 60.7 — —Mid cap 12.1 12.1 — — 0.1 0.1 — —Small cap 98.0 98.0 — — — — — —
International companies 142.9 142.9 — — 231.9 231.9 — —Hedge funds 64.9 — — 64.9 — — — —Limited partnerships 52.1 — — 52.1 — — — —Insurance contracts — — — — 107.0 — 107.0 —Emerging market bonds 4.5 4.5 — — — — — —Total assets $ 576.8 $ 459.8 $ — $ 117.0 $ 400.8 $ 293.8 $ 107.0 $ —
The summary of changes in the fair value of the pension plan Level 3 assets for the years ended December 31, 2014 and 2013 is asfollows:
(In millions) Level 3 Assets
Balance at December 31, 2012 $ 95.7Unrealized gains relating to instruments still held at the reporting date 21.3Balance at December 31, 2013 $ 117.0Unrealized gains relating to instruments still held at the reporting date 1.6Purchases, sales, and settlements, net 7.0Balance at December 31, 2014 $ 125.6
74
Copyright © 2013 www.secdatabase.com. All Rights Reserved.Please Consider the Environment Before Printing This Document
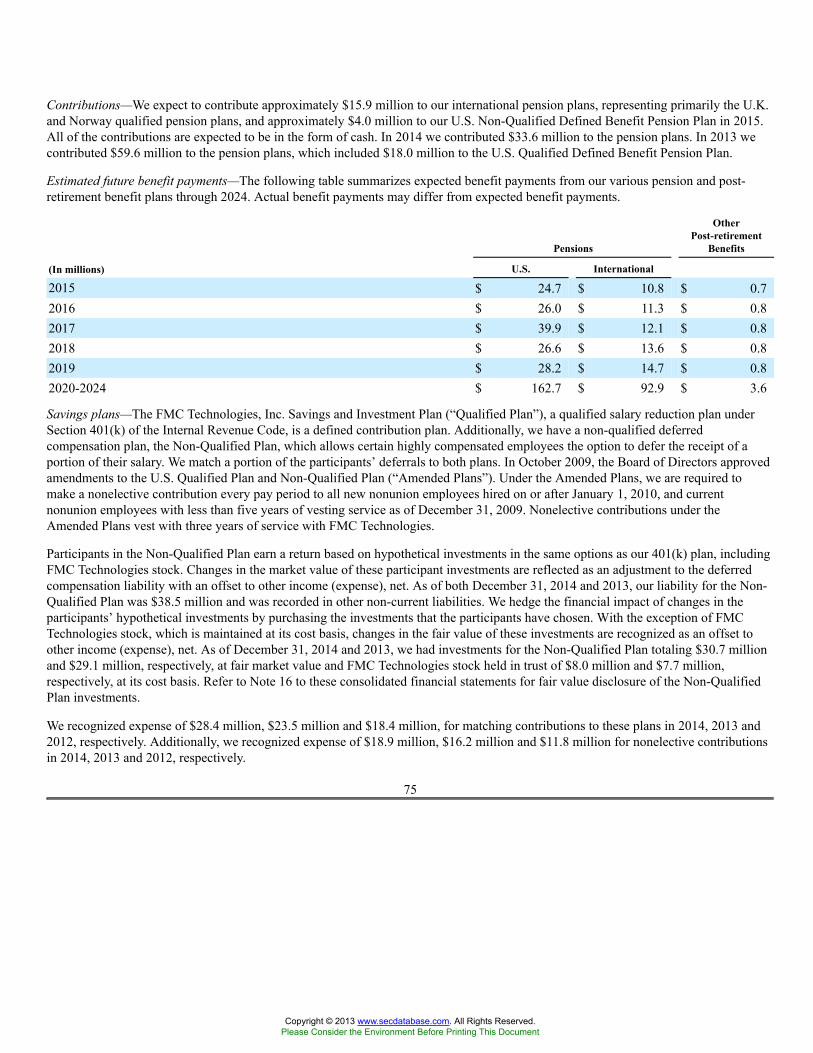
Contributions—We expect to contribute approximately $15.9 million to our international pension plans, representing primarily the U.K.and Norway qualified pension plans, and approximately $4.0 million to our U.S. Non-Qualified Defined Benefit Pension Plan in 2015.All of the contributions are expected to be in the form of cash. In 2014 we contributed $33.6 million to the pension plans. In 2013 wecontributed $59.6 million to the pension plans, which included $18.0 million to the U.S. Qualified Defined Benefit Pension Plan.
Estimated future benefit payments—The following table summarizes expected benefit payments from our various pension and post-retirement benefit plans through 2024. Actual benefit payments may differ from expected benefit payments.
Pensions
OtherPost-retirement
Benefits
(In millions) U.S. International
2015 $ 24.7 $ 10.8 $ 0.72016 $ 26.0 $ 11.3 $ 0.82017 $ 39.9 $ 12.1 $ 0.82018 $ 26.6 $ 13.6 $ 0.82019 $ 28.2 $ 14.7 $ 0.82020-2024 $ 162.7 $ 92.9 $ 3.6
Savings plans—The FMC Technologies, Inc. Savings and Investment Plan (“Qualified Plan”), a qualified salary reduction plan underSection 401(k) of the Internal Revenue Code, is a defined contribution plan. Additionally, we have a non-qualified deferredcompensation plan, the Non-Qualified Plan, which allows certain highly compensated employees the option to defer the receipt of aportion of their salary. We match a portion of the participants’ deferrals to both plans. In October 2009, the Board of Directors approvedamendments to the U.S. Qualified Plan and Non-Qualified Plan (“Amended Plans”). Under the Amended Plans, we are required tomake a nonelective contribution every pay period to all new nonunion employees hired on or after January 1, 2010, and currentnonunion employees with less than five years of vesting service as of December 31, 2009. Nonelective contributions under theAmended Plans vest with three years of service with FMC Technologies.
Participants in the Non-Qualified Plan earn a return based on hypothetical investments in the same options as our 401(k) plan, includingFMC Technologies stock. Changes in the market value of these participant investments are reflected as an adjustment to the deferredcompensation liability with an offset to other income (expense), net. As of both December 31, 2014 and 2013, our liability for the Non-Qualified Plan was $38.5 million and was recorded in other non-current liabilities. We hedge the financial impact of changes in theparticipants’ hypothetical investments by purchasing the investments that the participants have chosen. With the exception of FMCTechnologies stock, which is maintained at its cost basis, changes in the fair value of these investments are recognized as an offset toother income (expense), net. As of December 31, 2014 and 2013, we had investments for the Non-Qualified Plan totaling $30.7 millionand $29.1 million, respectively, at fair market value and FMC Technologies stock held in trust of $8.0 million and $7.7 million,respectively, at its cost basis. Refer to Note 16 to these consolidated financial statements for fair value disclosure of the Non-QualifiedPlan investments.
We recognized expense of $28.4 million, $23.5 million and $18.4 million, for matching contributions to these plans in 2014, 2013 and2012, respectively. Additionally, we recognized expense of $18.9 million, $16.2 million and $11.8 million for nonelective contributionsin 2014, 2013 and 2012, respectively.
75
Copyright © 2013 www.secdatabase.com. All Rights Reserved.Please Consider the Environment Before Printing This Document
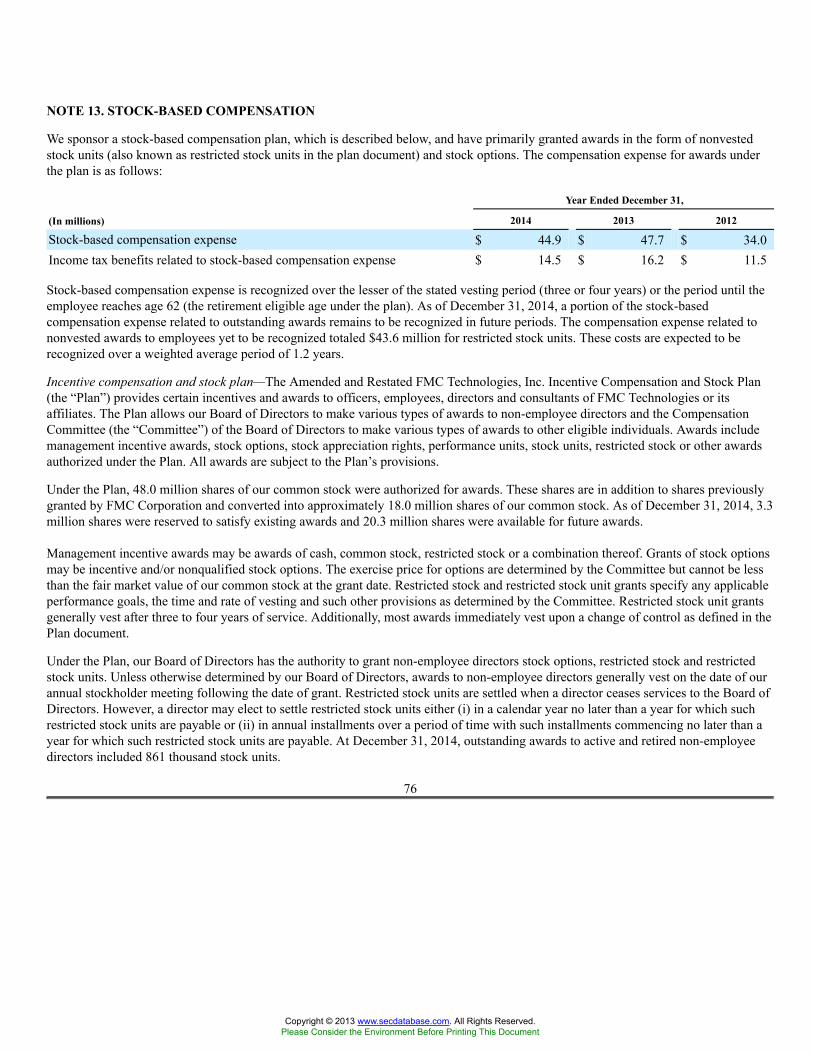
NOTE 13. STOCK-BASED COMPENSATION
We sponsor a stock-based compensation plan, which is described below, and have primarily granted awards in the form of nonvestedstock units (also known as restricted stock units in the plan document) and stock options. The compensation expense for awards underthe plan is as follows:
Year Ended December 31,
(In millions) 2014 2013 2012
Stock-based compensation expense $ 44.9 $ 47.7 $ 34.0Income tax benefits related to stock-based compensation expense $ 14.5 $ 16.2 $ 11.5
Stock-based compensation expense is recognized over the lesser of the stated vesting period (three or four years) or the period until theemployee reaches age 62 (the retirement eligible age under the plan). As of December 31, 2014, a portion of the stock-basedcompensation expense related to outstanding awards remains to be recognized in future periods. The compensation expense related tononvested awards to employees yet to be recognized totaled $43.6 million for restricted stock units. These costs are expected to berecognized over a weighted average period of 1.2 years.
Incentive compensation and stock plan—The Amended and Restated FMC Technologies, Inc. Incentive Compensation and Stock Plan(the “Plan”) provides certain incentives and awards to officers, employees, directors and consultants of FMC Technologies or itsaffiliates. The Plan allows our Board of Directors to make various types of awards to non-employee directors and the CompensationCommittee (the “Committee”) of the Board of Directors to make various types of awards to other eligible individuals. Awards includemanagement incentive awards, stock options, stock appreciation rights, performance units, stock units, restricted stock or other awardsauthorized under the Plan. All awards are subject to the Plan’s provisions.
Under the Plan, 48.0 million shares of our common stock were authorized for awards. These shares are in addition to shares previouslygranted by FMC Corporation and converted into approximately 18.0 million shares of our common stock. As of December 31, 2014, 3.3million shares were reserved to satisfy existing awards and 20.3 million shares were available for future awards.
Management incentive awards may be awards of cash, common stock, restricted stock or a combination thereof. Grants of stock optionsmay be incentive and/or nonqualified stock options. The exercise price for options are determined by the Committee but cannot be lessthan the fair market value of our common stock at the grant date. Restricted stock and restricted stock unit grants specify any applicableperformance goals, the time and rate of vesting and such other provisions as determined by the Committee. Restricted stock unit grantsgenerally vest after three to four years of service. Additionally, most awards immediately vest upon a change of control as defined in thePlan document.
Under the Plan, our Board of Directors has the authority to grant non-employee directors stock options, restricted stock and restrictedstock units. Unless otherwise determined by our Board of Directors, awards to non-employee directors generally vest on the date of ourannual stockholder meeting following the date of grant. Restricted stock units are settled when a director ceases services to the Board ofDirectors. However, a director may elect to settle restricted stock units either (i) in a calendar year no later than a year for which suchrestricted stock units are payable or (ii) in annual installments over a period of time with such installments commencing no later than ayear for which such restricted stock units are payable. At December 31, 2014, outstanding awards to active and retired non-employeedirectors included 861 thousand stock units.
76
Copyright © 2013 www.secdatabase.com. All Rights Reserved.Please Consider the Environment Before Printing This Document
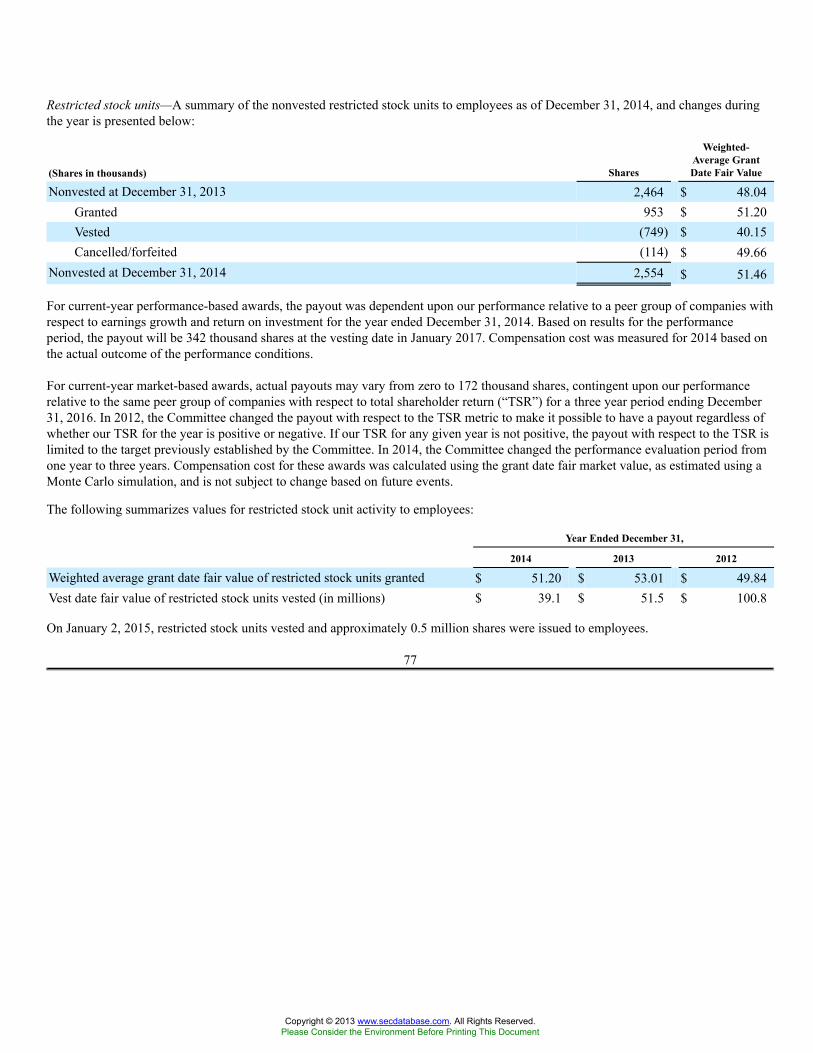
Restricted stock units—A summary of the nonvested restricted stock units to employees as of December 31, 2014, and changes duringthe year is presented below:
(Shares in thousands) Shares
Weighted-Average GrantDate Fair Value
Nonvested at December 31, 2013 2,464 $ 48.04Granted 953 $ 51.20Vested (749) $ 40.15Cancelled/forfeited (114) $ 49.66
Nonvested at December 31, 2014 2,554 $ 51.46
For current-year performance-based awards, the payout was dependent upon our performance relative to a peer group of companies withrespect to earnings growth and return on investment for the year ended December 31, 2014. Based on results for the performanceperiod, the payout will be 342 thousand shares at the vesting date in January 2017. Compensation cost was measured for 2014 based onthe actual outcome of the performance conditions.
For current-year market-based awards, actual payouts may vary from zero to 172 thousand shares, contingent upon our performancerelative to the same peer group of companies with respect to total shareholder return (“TSR”) for a three year period ending December31, 2016. In 2012, the Committee changed the payout with respect to the TSR metric to make it possible to have a payout regardless ofwhether our TSR for the year is positive or negative. If our TSR for any given year is not positive, the payout with respect to the TSR islimited to the target previously established by the Committee. In 2014, the Committee changed the performance evaluation period fromone year to three years. Compensation cost for these awards was calculated using the grant date fair market value, as estimated using aMonte Carlo simulation, and is not subject to change based on future events.
The following summarizes values for restricted stock unit activity to employees:
Year Ended December 31,
2014 2013 2012
Weighted average grant date fair value of restricted stock units granted $ 51.20 $ 53.01 $ 49.84Vest date fair value of restricted stock units vested (in millions) $ 39.1 $ 51.5 $ 100.8
On January 2, 2015, restricted stock units vested and approximately 0.5 million shares were issued to employees.
77
Copyright © 2013 www.secdatabase.com. All Rights Reserved.Please Consider the Environment Before Printing This Document
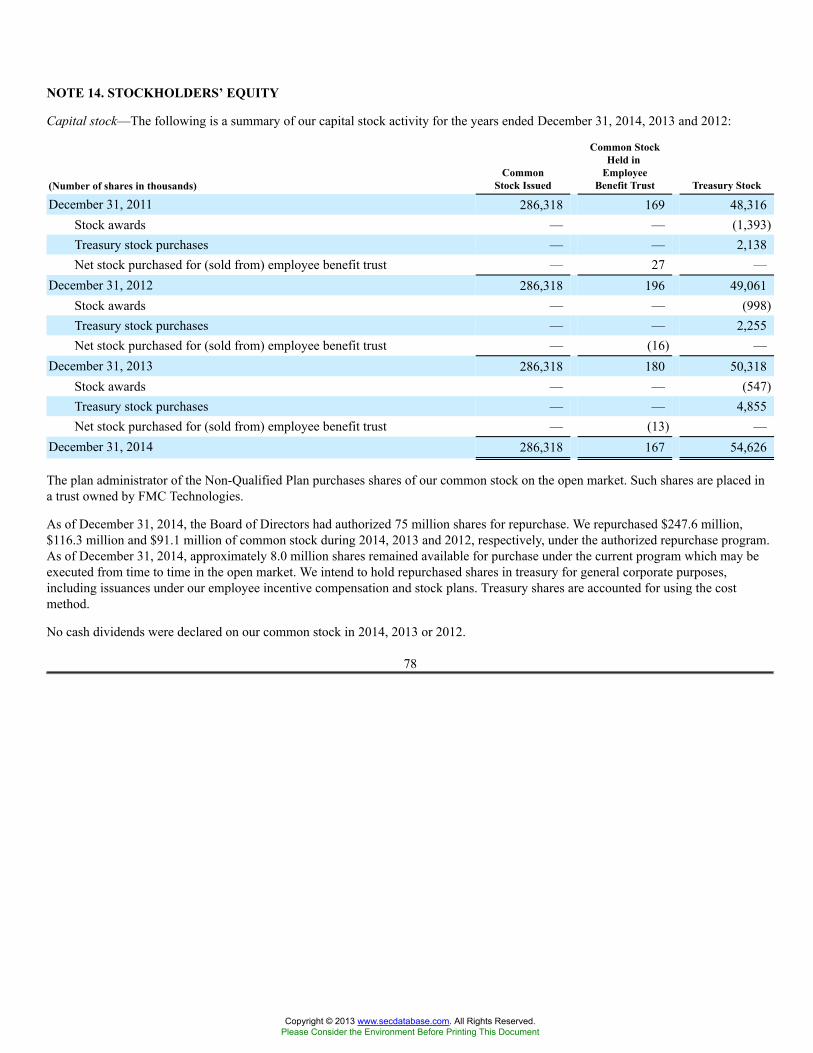
NOTE 14. STOCKHOLDERS’ EQUITY
Capital stock—The following is a summary of our capital stock activity for the years ended December 31, 2014, 2013 and 2012:
(Number of shares in thousands)Common
Stock Issued
Common StockHeld in
EmployeeBenefit Trust Treasury Stock
December 31, 2011 286,318 169 48,316Stock awards — — (1,393)Treasury stock purchases — — 2,138Net stock purchased for (sold from) employee benefit trust — 27 —
December 31, 2012 286,318 196 49,061Stock awards — — (998)Treasury stock purchases — — 2,255Net stock purchased for (sold from) employee benefit trust — (16) —
December 31, 2013 286,318 180 50,318Stock awards — — (547)Treasury stock purchases — — 4,855Net stock purchased for (sold from) employee benefit trust — (13) —
December 31, 2014 286,318 167 54,626
The plan administrator of the Non-Qualified Plan purchases shares of our common stock on the open market. Such shares are placed ina trust owned by FMC Technologies.
As of December 31, 2014, the Board of Directors had authorized 75 million shares for repurchase. We repurchased $247.6 million,$116.3 million and $91.1 million of common stock during 2014, 2013 and 2012, respectively, under the authorized repurchase program.As of December 31, 2014, approximately 8.0 million shares remained available for purchase under the current program which may beexecuted from time to time in the open market. We intend to hold repurchased shares in treasury for general corporate purposes,including issuances under our employee incentive compensation and stock plans. Treasury shares are accounted for using the costmethod.
No cash dividends were declared on our common stock in 2014, 2013 or 2012.
78
Copyright © 2013 www.secdatabase.com. All Rights Reserved.Please Consider the Environment Before Printing This Document
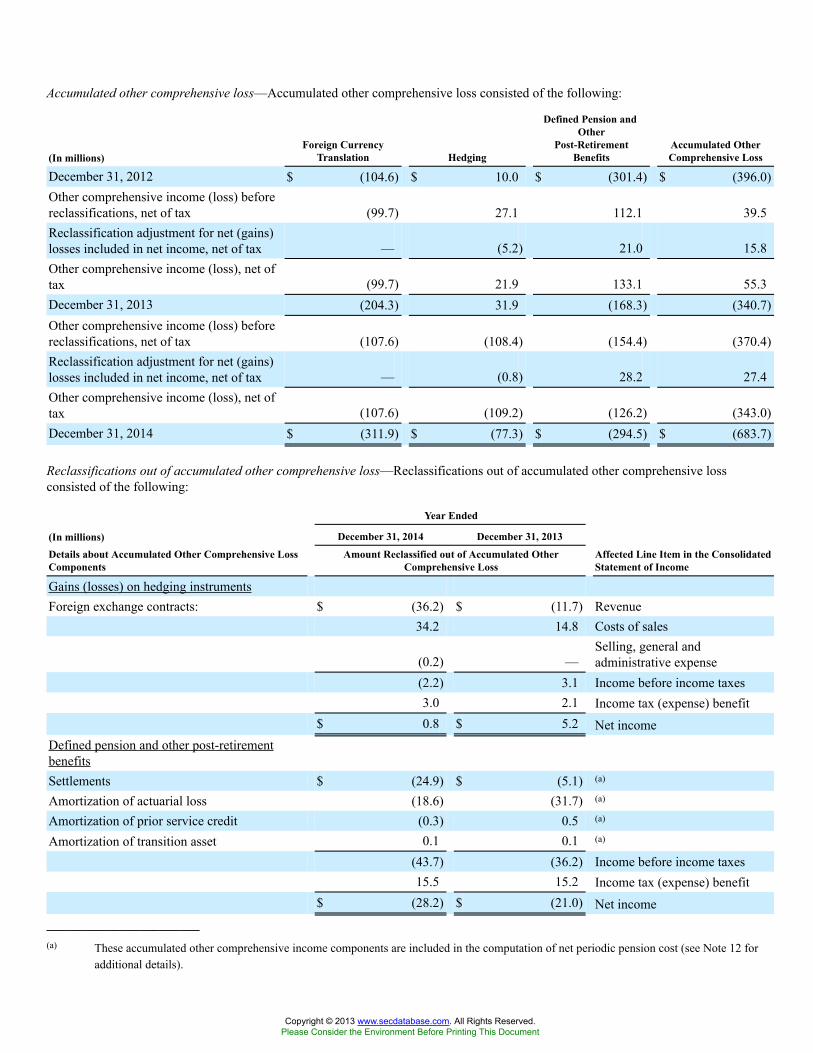
Accumulated other comprehensive loss—Accumulated other comprehensive loss consisted of the following:
(In millions)Foreign Currency
Translation Hedging
Defined Pension andOther
Post-RetirementBenefits
Accumulated OtherComprehensive Loss
December 31, 2012 $ (104.6) $ 10.0 $ (301.4) $ (396.0)Other comprehensive income (loss) beforereclassifications, net of tax (99.7) 27.1 112.1 39.5Reclassification adjustment for net (gains)losses included in net income, net of tax — (5.2) 21.0 15.8Other comprehensive income (loss), net oftax (99.7) 21.9 133.1 55.3December 31, 2013 (204.3) 31.9 (168.3) (340.7)Other comprehensive income (loss) beforereclassifications, net of tax (107.6) (108.4) (154.4) (370.4)Reclassification adjustment for net (gains)losses included in net income, net of tax — (0.8) 28.2 27.4Other comprehensive income (loss), net oftax (107.6) (109.2) (126.2) (343.0)December 31, 2014 $ (311.9) $ (77.3) $ (294.5) $ (683.7)
Reclassifications out of accumulated other comprehensive loss—Reclassifications out of accumulated other comprehensive lossconsisted of the following:
Year Ended
(In millions) December 31, 2014 December 31, 2013
Details about Accumulated Other Comprehensive LossComponents
Amount Reclassified out of Accumulated OtherComprehensive Loss
Affected Line Item in the ConsolidatedStatement of Income
Gains (losses) on hedging instrumentsForeign exchange contracts: $ (36.2) $ (11.7) Revenue
34.2 14.8 Costs of sales
(0.2) —Selling, general andadministrative expense
(2.2) 3.1 Income before income taxes3.0 2.1 Income tax (expense) benefit
$ 0.8 $ 5.2 Net incomeDefined pension and other post-retirementbenefitsSettlements $ (24.9) $ (5.1) (a)
Amortization of actuarial loss (18.6) (31.7) (a)
Amortization of prior service credit (0.3) 0.5 (a)
Amortization of transition asset 0.1 0.1 (a)
(43.7) (36.2) Income before income taxes15.5 15.2 Income tax (expense) benefit
$ (28.2) $ (21.0) Net income_______________________(a) These accumulated other comprehensive income components are included in the computation of net periodic pension cost (see Note 12 for
additional details).
Copyright © 2013 www.secdatabase.com. All Rights Reserved.Please Consider the Environment Before Printing This Document

79
Copyright © 2013 www.secdatabase.com. All Rights Reserved.Please Consider the Environment Before Printing This Document
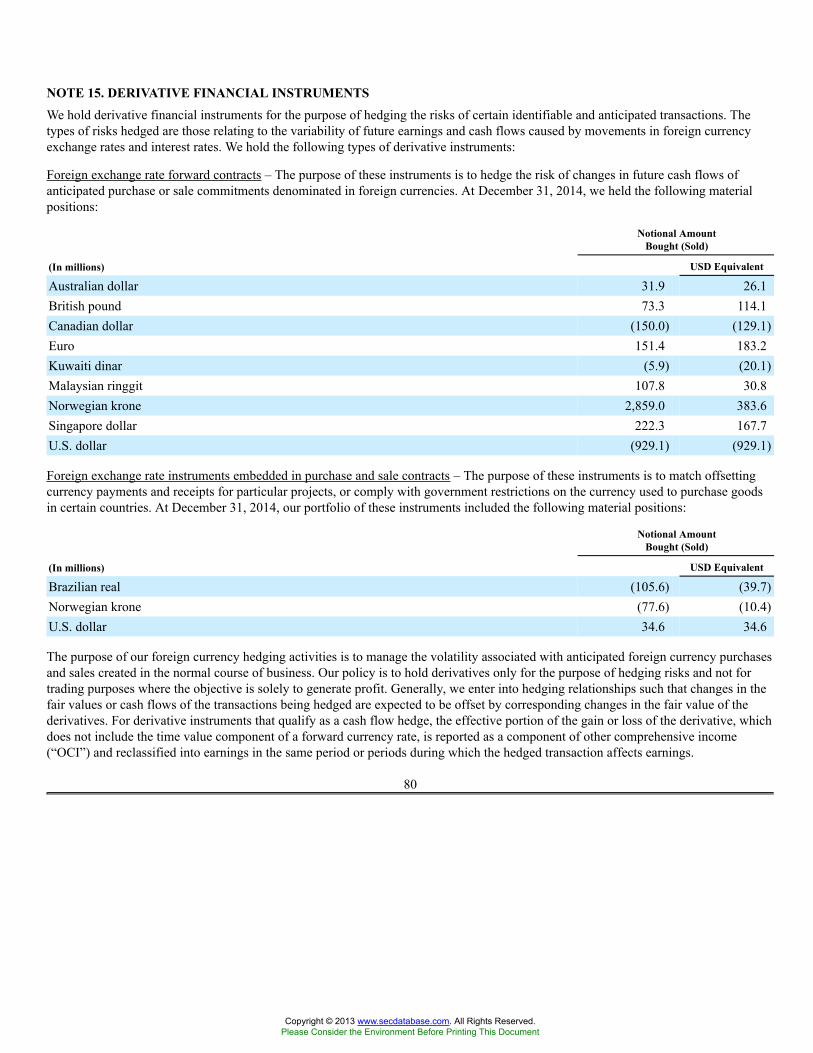
NOTE 15. DERIVATIVE FINANCIAL INSTRUMENTSWe hold derivative financial instruments for the purpose of hedging the risks of certain identifiable and anticipated transactions. Thetypes of risks hedged are those relating to the variability of future earnings and cash flows caused by movements in foreign currencyexchange rates and interest rates. We hold the following types of derivative instruments:
Foreign exchange rate forward contracts – The purpose of these instruments is to hedge the risk of changes in future cash flows ofanticipated purchase or sale commitments denominated in foreign currencies. At December 31, 2014, we held the following materialpositions:
Notional AmountBought (Sold)
(In millions) USD Equivalent
Australian dollar 31.9 26.1British pound 73.3 114.1Canadian dollar (150.0) (129.1)Euro 151.4 183.2Kuwaiti dinar (5.9) (20.1)Malaysian ringgit 107.8 30.8Norwegian krone 2,859.0 383.6Singapore dollar 222.3 167.7U.S. dollar (929.1) (929.1)
Foreign exchange rate instruments embedded in purchase and sale contracts – The purpose of these instruments is to match offsettingcurrency payments and receipts for particular projects, or comply with government restrictions on the currency used to purchase goodsin certain countries. At December 31, 2014, our portfolio of these instruments included the following material positions:
Notional AmountBought (Sold)
(In millions) USD Equivalent
Brazilian real (105.6) (39.7)Norwegian krone (77.6) (10.4)U.S. dollar 34.6 34.6
The purpose of our foreign currency hedging activities is to manage the volatility associated with anticipated foreign currency purchasesand sales created in the normal course of business. Our policy is to hold derivatives only for the purpose of hedging risks and not fortrading purposes where the objective is solely to generate profit. Generally, we enter into hedging relationships such that changes in thefair values or cash flows of the transactions being hedged are expected to be offset by corresponding changes in the fair value of thederivatives. For derivative instruments that qualify as a cash flow hedge, the effective portion of the gain or loss of the derivative, whichdoes not include the time value component of a forward currency rate, is reported as a component of other comprehensive income(“OCI”) and reclassified into earnings in the same period or periods during which the hedged transaction affects earnings.
80
Copyright © 2013 www.secdatabase.com. All Rights Reserved.Please Consider the Environment Before Printing This Document
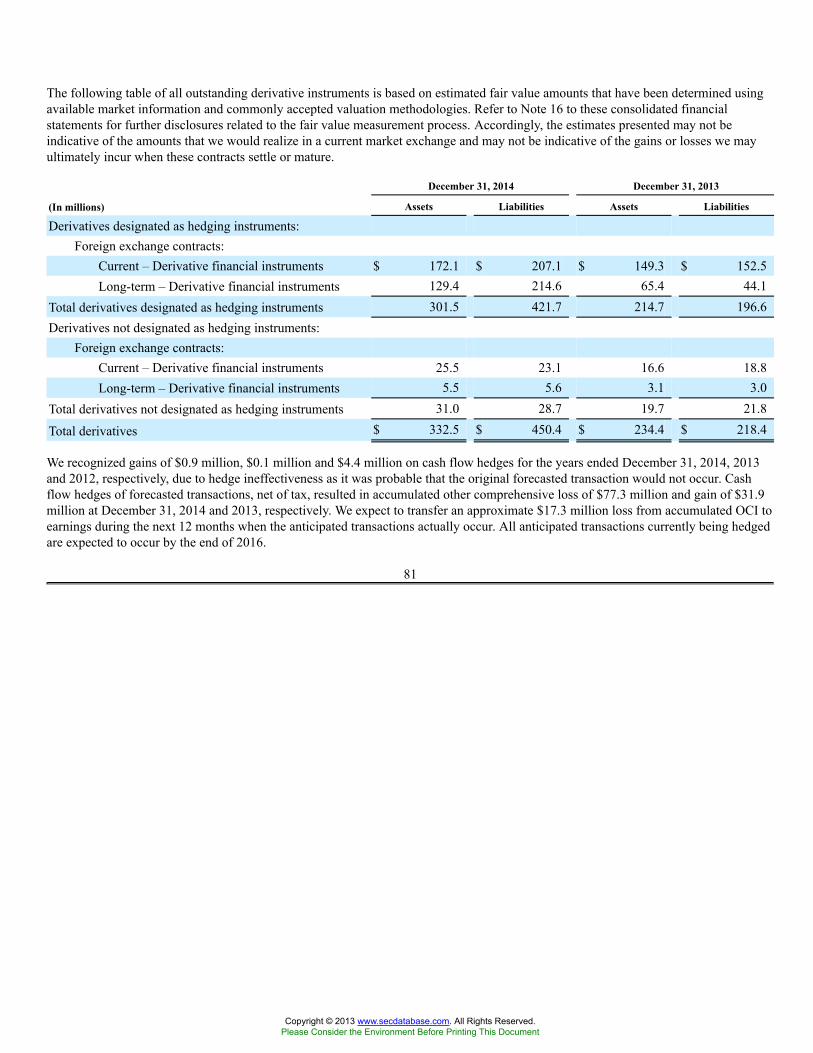
The following table of all outstanding derivative instruments is based on estimated fair value amounts that have been determined usingavailable market information and commonly accepted valuation methodologies. Refer to Note 16 to these consolidated financialstatements for further disclosures related to the fair value measurement process. Accordingly, the estimates presented may not beindicative of the amounts that we would realize in a current market exchange and may not be indicative of the gains or losses we mayultimately incur when these contracts settle or mature.
December 31, 2014 December 31, 2013
(In millions) Assets Liabilities Assets Liabilities
Derivatives designated as hedging instruments:Foreign exchange contracts:
Current – Derivative financial instruments $ 172.1 $ 207.1 $ 149.3 $ 152.5Long-term – Derivative financial instruments 129.4 214.6 65.4 44.1
Total derivatives designated as hedging instruments 301.5 421.7 214.7 196.6Derivatives not designated as hedging instruments:
Foreign exchange contracts:Current – Derivative financial instruments 25.5 23.1 16.6 18.8Long-term – Derivative financial instruments 5.5 5.6 3.1 3.0
Total derivatives not designated as hedging instruments 31.0 28.7 19.7 21.8
Total derivatives $ 332.5 $ 450.4 $ 234.4 $ 218.4
We recognized gains of $0.9 million, $0.1 million and $4.4 million on cash flow hedges for the years ended December 31, 2014, 2013and 2012, respectively, due to hedge ineffectiveness as it was probable that the original forecasted transaction would not occur. Cashflow hedges of forecasted transactions, net of tax, resulted in accumulated other comprehensive loss of $77.3 million and gain of $31.9million at December 31, 2014 and 2013, respectively. We expect to transfer an approximate $17.3 million loss from accumulated OCI toearnings during the next 12 months when the anticipated transactions actually occur. All anticipated transactions currently being hedgedare expected to occur by the end of 2016.
81
Copyright © 2013 www.secdatabase.com. All Rights Reserved.Please Consider the Environment Before Printing This Document
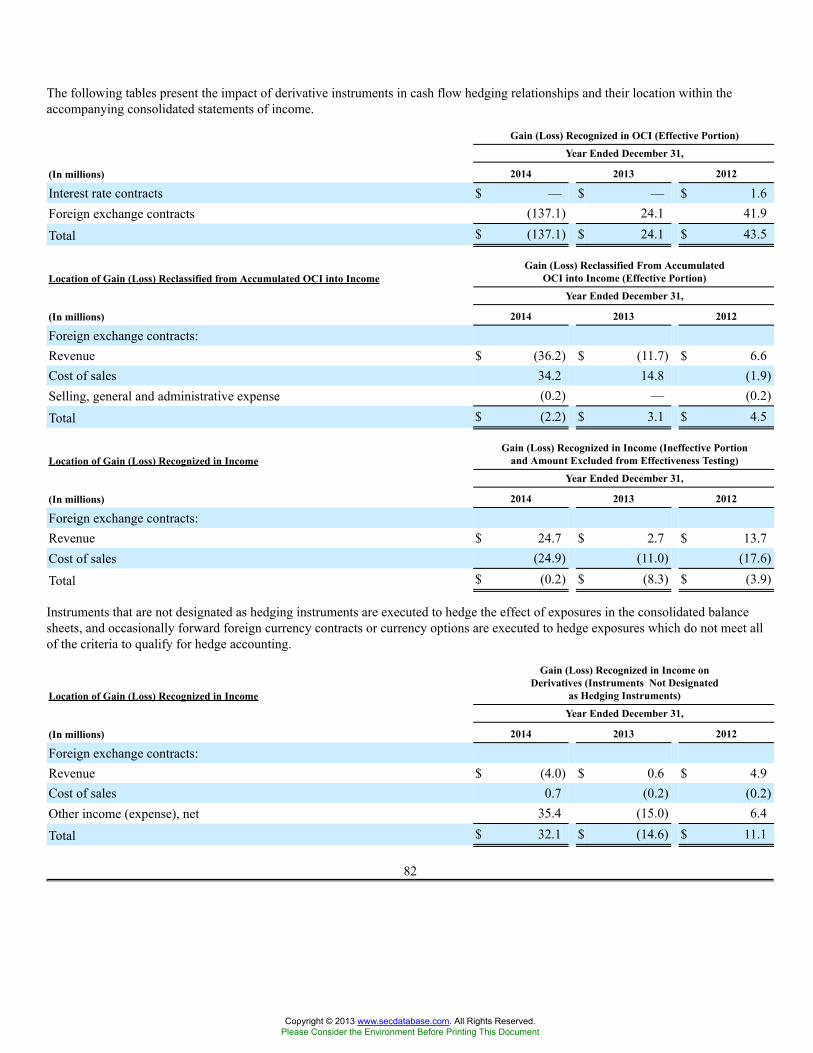
The following tables present the impact of derivative instruments in cash flow hedging relationships and their location within theaccompanying consolidated statements of income.
Gain (Loss) Recognized in OCI (Effective Portion)
Year Ended December 31,
(In millions) 2014 2013 2012
Interest rate contracts $ — $ — $ 1.6Foreign exchange contracts (137.1) 24.1 41.9
Total $ (137.1) $ 24.1 $ 43.5
Location of Gain (Loss) Reclassified from Accumulated OCI into IncomeGain (Loss) Reclassified From Accumulated
OCI into Income (Effective Portion)
Year Ended December 31,
(In millions) 2014 2013 2012
Foreign exchange contracts:Revenue $ (36.2) $ (11.7) $ 6.6Cost of sales 34.2 14.8 (1.9)Selling, general and administrative expense (0.2) — (0.2)
Total $ (2.2) $ 3.1 $ 4.5
Location of Gain (Loss) Recognized in IncomeGain (Loss) Recognized in Income (Ineffective Portion
and Amount Excluded from Effectiveness Testing)
Year Ended December 31,
(In millions) 2014 2013 2012
Foreign exchange contracts:Revenue $ 24.7 $ 2.7 $ 13.7Cost of sales (24.9) (11.0) (17.6)
Total $ (0.2) $ (8.3) $ (3.9)
Instruments that are not designated as hedging instruments are executed to hedge the effect of exposures in the consolidated balancesheets, and occasionally forward foreign currency contracts or currency options are executed to hedge exposures which do not meet allof the criteria to qualify for hedge accounting.
Location of Gain (Loss) Recognized in Income
Gain (Loss) Recognized in Income onDerivatives (Instruments Not Designated
as Hedging Instruments)
Year Ended December 31,
(In millions) 2014 2013 2012
Foreign exchange contracts:Revenue $ (4.0) $ 0.6 $ 4.9Cost of sales 0.7 (0.2) (0.2)Other income (expense), net 35.4 (15.0) 6.4
Total $ 32.1 $ (14.6) $ 11.1
82
Copyright © 2013 www.secdatabase.com. All Rights Reserved.Please Consider the Environment Before Printing This Document
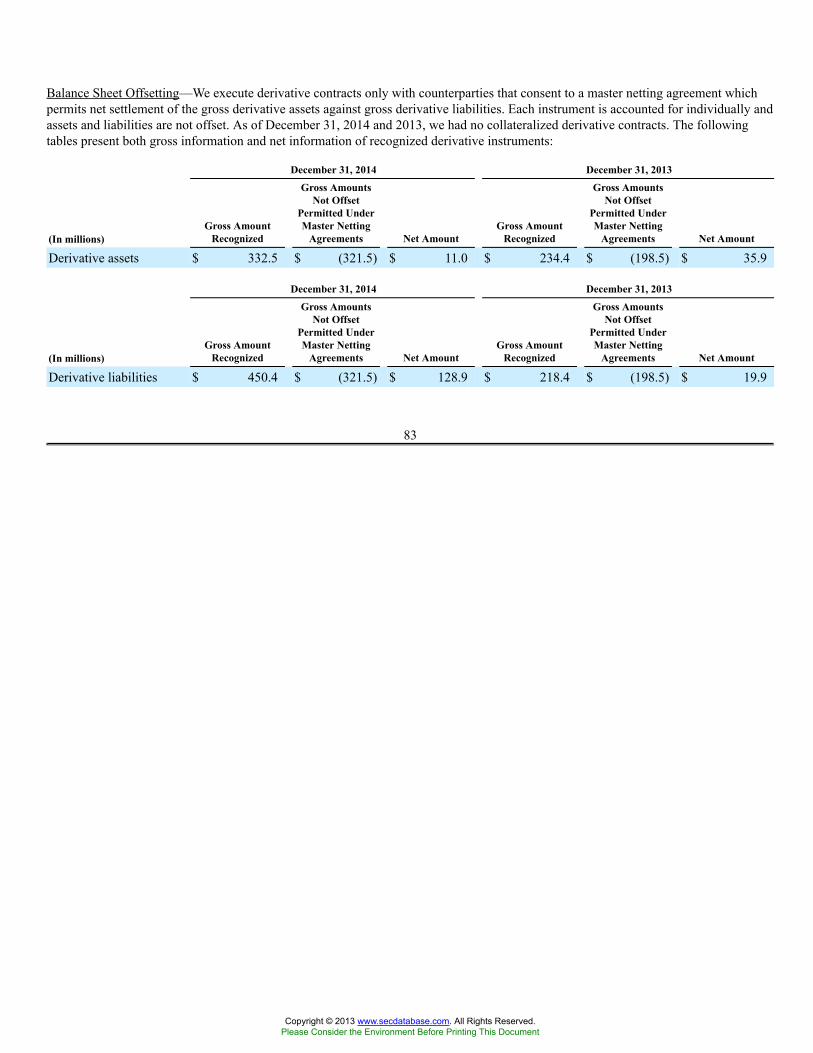
Balance Sheet Offsetting—We execute derivative contracts only with counterparties that consent to a master netting agreement whichpermits net settlement of the gross derivative assets against gross derivative liabilities. Each instrument is accounted for individually andassets and liabilities are not offset. As of December 31, 2014 and 2013, we had no collateralized derivative contracts. The followingtables present both gross information and net information of recognized derivative instruments:
December 31, 2014 December 31, 2013
(In millions)Gross Amount
Recognized
Gross AmountsNot Offset
Permitted UnderMaster Netting
Agreements Net AmountGross Amount
Recognized
Gross AmountsNot Offset
Permitted UnderMaster Netting
Agreements Net Amount
Derivative assets $ 332.5 $ (321.5) $ 11.0 $ 234.4 $ (198.5) $ 35.9
December 31, 2014 December 31, 2013
(In millions)Gross Amount
Recognized
Gross AmountsNot Offset
Permitted UnderMaster Netting
Agreements Net AmountGross Amount
Recognized
Gross AmountsNot Offset
Permitted UnderMaster Netting
Agreements Net Amount
Derivative liabilities $ 450.4 $ (321.5) $ 128.9 $ 218.4 $ (198.5) $ 19.9
83
Copyright © 2013 www.secdatabase.com. All Rights Reserved.Please Consider the Environment Before Printing This Document
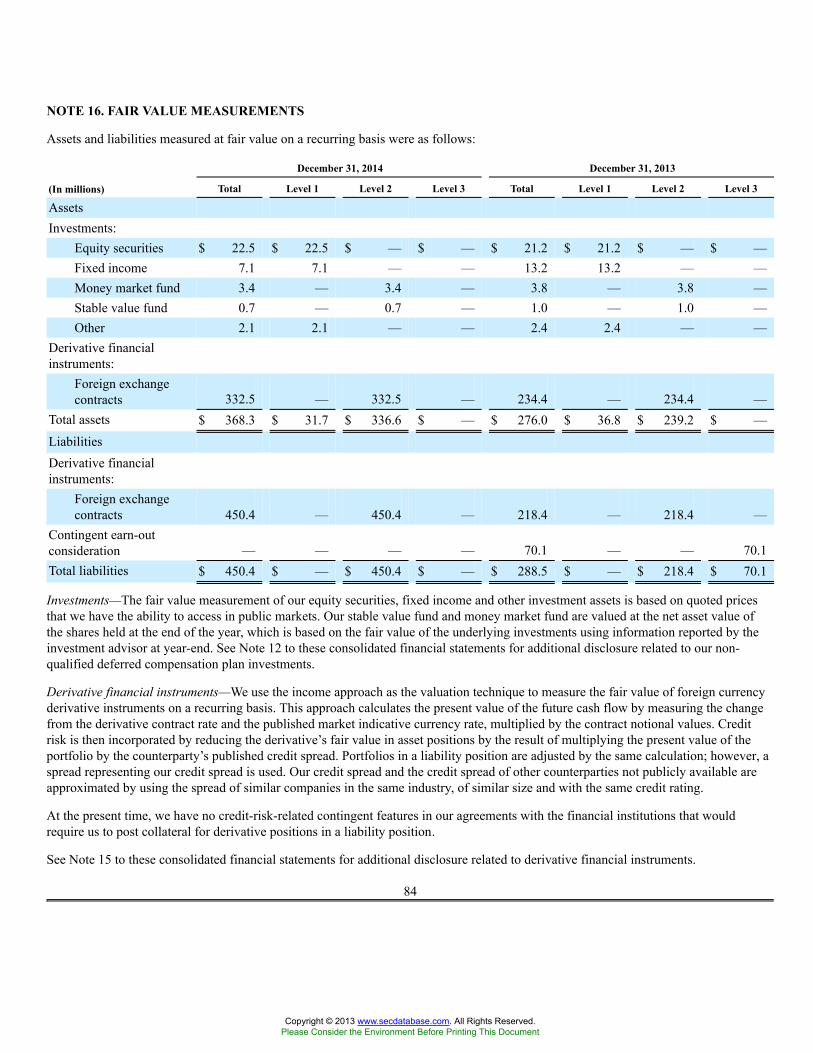
NOTE 16. FAIR VALUE MEASUREMENTS
Assets and liabilities measured at fair value on a recurring basis were as follows:
December 31, 2014 December 31, 2013
(In millions) Total Level 1 Level 2 Level 3 Total Level 1 Level 2 Level 3
AssetsInvestments:
Equity securities $ 22.5 $ 22.5 $ — $ — $ 21.2 $ 21.2 $ — $ —Fixed income 7.1 7.1 — — 13.2 13.2 — —Money market fund 3.4 — 3.4 — 3.8 — 3.8 —Stable value fund 0.7 — 0.7 — 1.0 — 1.0 —Other 2.1 2.1 — — 2.4 2.4 — —
Derivative financialinstruments:
Foreign exchangecontracts 332.5 — 332.5 — 234.4 — 234.4 —
Total assets $ 368.3 $ 31.7 $ 336.6 $ — $ 276.0 $ 36.8 $ 239.2 $ —LiabilitiesDerivative financialinstruments:
Foreign exchangecontracts 450.4 — 450.4 — 218.4 — 218.4 —
Contingent earn-outconsideration — — — — 70.1 — — 70.1Total liabilities $ 450.4 $ — $ 450.4 $ — $ 288.5 $ — $ 218.4 $ 70.1
Investments—The fair value measurement of our equity securities, fixed income and other investment assets is based on quoted pricesthat we have the ability to access in public markets. Our stable value fund and money market fund are valued at the net asset value ofthe shares held at the end of the year, which is based on the fair value of the underlying investments using information reported by theinvestment advisor at year-end. See Note 12 to these consolidated financial statements for additional disclosure related to our non-qualified deferred compensation plan investments.
Derivative financial instruments—We use the income approach as the valuation technique to measure the fair value of foreign currencyderivative instruments on a recurring basis. This approach calculates the present value of the future cash flow by measuring the changefrom the derivative contract rate and the published market indicative currency rate, multiplied by the contract notional values. Creditrisk is then incorporated by reducing the derivative’s fair value in asset positions by the result of multiplying the present value of theportfolio by the counterparty’s published credit spread. Portfolios in a liability position are adjusted by the same calculation; however, aspread representing our credit spread is used. Our credit spread and the credit spread of other counterparties not publicly available areapproximated by using the spread of similar companies in the same industry, of similar size and with the same credit rating.
At the present time, we have no credit-risk-related contingent features in our agreements with the financial institutions that wouldrequire us to post collateral for derivative positions in a liability position.
See Note 15 to these consolidated financial statements for additional disclosure related to derivative financial instruments.
84
Copyright © 2013 www.secdatabase.com. All Rights Reserved.Please Consider the Environment Before Printing This Document
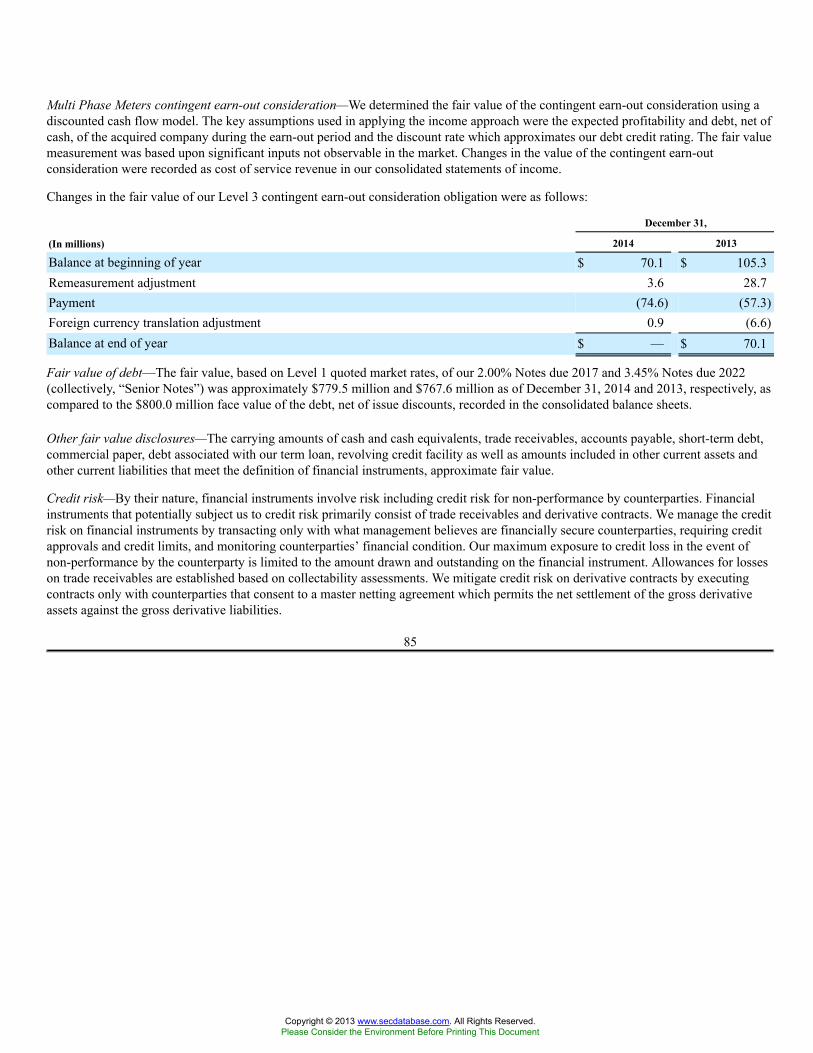
Multi Phase Meters contingent earn-out consideration—We determined the fair value of the contingent earn-out consideration using adiscounted cash flow model. The key assumptions used in applying the income approach were the expected profitability and debt, net ofcash, of the acquired company during the earn-out period and the discount rate which approximates our debt credit rating. The fair valuemeasurement was based upon significant inputs not observable in the market. Changes in the value of the contingent earn-outconsideration were recorded as cost of service revenue in our consolidated statements of income.
Changes in the fair value of our Level 3 contingent earn-out consideration obligation were as follows:
December 31,
(In millions) 2014 2013
Balance at beginning of year $ 70.1 $ 105.3Remeasurement adjustment 3.6 28.7Payment (74.6) (57.3)Foreign currency translation adjustment 0.9 (6.6)Balance at end of year $ — $ 70.1
Fair value of debt—The fair value, based on Level 1 quoted market rates, of our 2.00% Notes due 2017 and 3.45% Notes due 2022(collectively, “Senior Notes”) was approximately $779.5 million and $767.6 million as of December 31, 2014 and 2013, respectively, ascompared to the $800.0 million face value of the debt, net of issue discounts, recorded in the consolidated balance sheets.
Other fair value disclosures—The carrying amounts of cash and cash equivalents, trade receivables, accounts payable, short-term debt,commercial paper, debt associated with our term loan, revolving credit facility as well as amounts included in other current assets andother current liabilities that meet the definition of financial instruments, approximate fair value.
Credit risk—By their nature, financial instruments involve risk including credit risk for non-performance by counterparties. Financialinstruments that potentially subject us to credit risk primarily consist of trade receivables and derivative contracts. We manage the creditrisk on financial instruments by transacting only with what management believes are financially secure counterparties, requiring creditapprovals and credit limits, and monitoring counterparties’ financial condition. Our maximum exposure to credit loss in the event ofnon-performance by the counterparty is limited to the amount drawn and outstanding on the financial instrument. Allowances for losseson trade receivables are established based on collectability assessments. We mitigate credit risk on derivative contracts by executingcontracts only with counterparties that consent to a master netting agreement which permits the net settlement of the gross derivativeassets against the gross derivative liabilities.
85
Copyright © 2013 www.secdatabase.com. All Rights Reserved.Please Consider the Environment Before Printing This Document
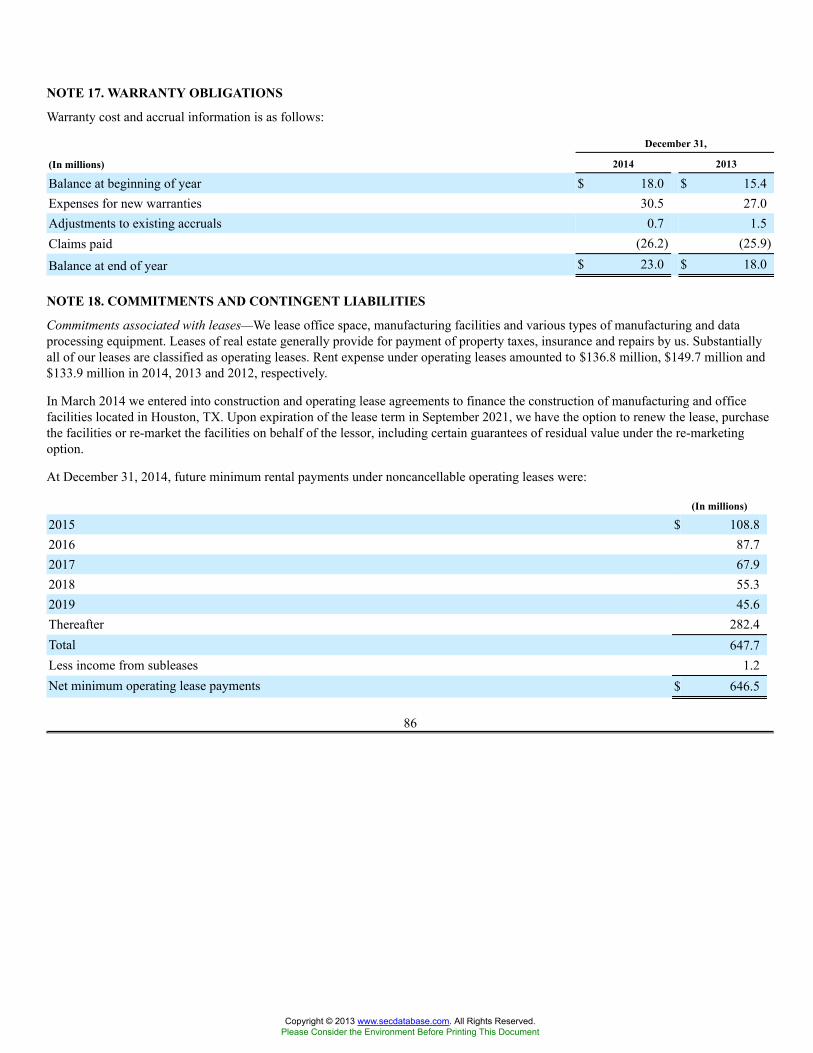
NOTE 17. WARRANTY OBLIGATIONS
Warranty cost and accrual information is as follows:
December 31,
(In millions) 2014 2013
Balance at beginning of year $ 18.0 $ 15.4Expenses for new warranties 30.5 27.0Adjustments to existing accruals 0.7 1.5Claims paid (26.2) (25.9)
Balance at end of year $ 23.0 $ 18.0
NOTE 18. COMMITMENTS AND CONTINGENT LIABILITIES
Commitments associated with leases—We lease office space, manufacturing facilities and various types of manufacturing and dataprocessing equipment. Leases of real estate generally provide for payment of property taxes, insurance and repairs by us. Substantiallyall of our leases are classified as operating leases. Rent expense under operating leases amounted to $136.8 million, $149.7 million and$133.9 million in 2014, 2013 and 2012, respectively.
In March 2014 we entered into construction and operating lease agreements to finance the construction of manufacturing and officefacilities located in Houston, TX. Upon expiration of the lease term in September 2021, we have the option to renew the lease, purchasethe facilities or re-market the facilities on behalf of the lessor, including certain guarantees of residual value under the re-marketingoption.
At December 31, 2014, future minimum rental payments under noncancellable operating leases were:
(In millions)
2015 $ 108.82016 87.72017 67.92018 55.32019 45.6Thereafter 282.4Total 647.7Less income from subleases 1.2Net minimum operating lease payments $ 646.5
86
Copyright © 2013 www.secdatabase.com. All Rights Reserved.Please Consider the Environment Before Printing This Document
Contingent liabilities associated with guarantees—In the ordinary course of business with customers, vendors and others, we issuestandby letters of credit, performance bonds, surety bonds and other guarantees. These financial instruments at December 31, 2014,represented $755.4 million for guarantees of our future performance and $78.4 million of bank guarantees and letters of credit to securea portion of our existing financial obligations. The majority of these financial instruments expire within three years, and we expect toreplace them through the issuance of new or the extension of existing letters of credit and surety bonds.
In August 2014 FMC Technologies entered into an arrangement to guarantee the debt obligations under a revolving credit facility ofFMC Technologies Offshore, LLC (“FTO Services”), our joint venture with Edison Chouest Offshore LLC. Under the terms of theguarantee, FMC Technologies and Edison Chouest Offshore LLC jointly and severally guaranteed amounts under the revolving creditfacility with a maximum potential amount of future payments of $40.0 million that would become payable if FTO Services defaults inpayment under the terms of the revolving credit facility. The approximate term of the guarantee is two years. The liability recognized atinception for the fair value of our obligation as a guarantor was not material, and we expect our future performance under the guaranteeto be remote.
Management believes the ultimate resolution of our known contingencies will not materially affect our consolidated financial position,results of operations, or cash flows.
Contingent liabilities associated with legal matters—We are involved in various pending or potential legal actions in the ordinary courseof our business. Management is unable to predict the ultimate outcome of these actions, because of the inherent uncertainty of litigation.However, management believes that the most probable, ultimate resolution of these matters will not have a material adverse effect onour consolidated financial position, results of operations or cash flows.
Contingent liabilities associated with liquidated damages—Some of our contracts contain penalty provisions that require us to payliquidated damages if we are responsible for the failure to meet specified contractual milestone dates and the applicable customer assertsa conforming claim under these provisions. These contracts define the conditions under which our customers may make claims againstus for liquidated damages. Based upon the evaluation of our performance and other commercial and legal analysis, managementbelieves we have appropriately accrued for probable liquidated damages at December 31, 2014 and 2013, and that the ultimateresolution of such matters will not materially affect our consolidated financial position, results of operations, or cash flows.
87
Copyright © 2013 www.secdatabase.com. All Rights Reserved.Please Consider the Environment Before Printing This Document
NOTE 19. BUSINESS SEGMENTS
We report the results of operations in the following segments: Subsea Technologies, Surface Technologies and Energy Infrastructure.Management’s determination of our reporting segments was made on the basis of our strategic priorities within each segment andcorresponds to the manner in which our chief operating decision maker reviews and evaluates operating performance to make decisionsabout resources to be allocated to the segment.
Our reportable segments are:
• Subsea Technologies—designs and manufactures products and systems and provides services used by oil and gas companiesinvolved in deepwater exploration and production of crude oil and natural gas.
• Surface Technologies—designs and manufactures systems and provides services used by oil and gas companies involved inland and offshore exploration and production of crude oil and gas; designs, manufactures and supplies technologicallyadvanced high pressure valves and fittings for oilfield service companies; and also provides flowback and wireline services forexploration companies in the oil and gas industry.
• Energy Infrastructure—manufactures and supplies liquid and gas measurement and transportation equipment and systems tocustomers involved in the production, transportation and processing of crude oil, natural gas and petroleum-based refinedproducts and the mining industry.
Beginning in the third quarter of 2013 and in conjunction with management's efforts to accelerate the development andcommercialization of subsea boosting technology for subsea markets, our direct drive systems technology development, previouslyreported in Energy Infrastructure, is now reported in Subsea Technologies. All prior-year information has been adjusted to reflect thecurrent presentation.
Total revenue by segment includes intersegment sales, which are made at prices approximating those that the selling entity is able toobtain on external sales. Segment operating profit is defined as total segment revenue less segment operating expenses. The followingitems have been excluded in computing segment operating profit: corporate staff expense, net interest income (expense) associated withcorporate debt facilities, income taxes, and other revenue and other expense, net.
88
Copyright © 2013 www.secdatabase.com. All Rights Reserved.Please Consider the Environment Before Printing This Document
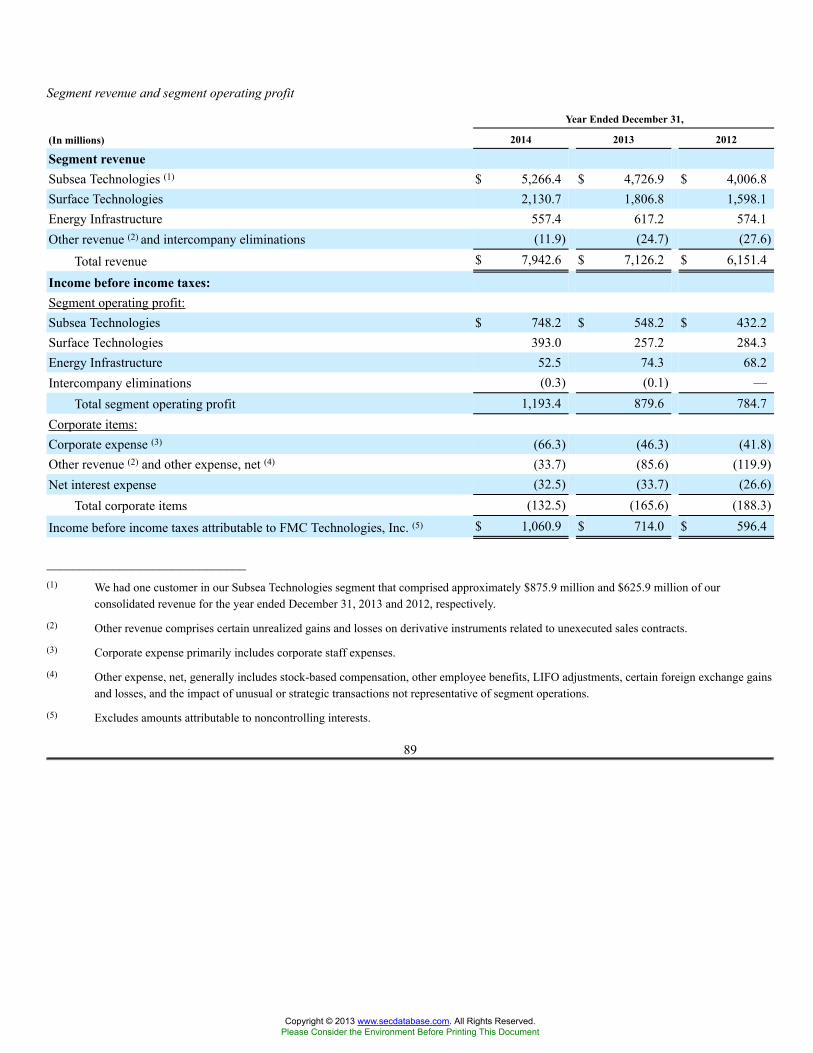
Segment revenue and segment operating profit
Year Ended December 31,
(In millions) 2014 2013 2012
Segment revenueSubsea Technologies (1) $ 5,266.4 $ 4,726.9 $ 4,006.8Surface Technologies 2,130.7 1,806.8 1,598.1Energy Infrastructure 557.4 617.2 574.1Other revenue (2) and intercompany eliminations (11.9) (24.7) (27.6)
Total revenue $ 7,942.6 $ 7,126.2 $ 6,151.4
Income before income taxes:Segment operating profit:Subsea Technologies $ 748.2 $ 548.2 $ 432.2Surface Technologies 393.0 257.2 284.3Energy Infrastructure 52.5 74.3 68.2Intercompany eliminations (0.3) (0.1) —
Total segment operating profit 1,193.4 879.6 784.7Corporate items:Corporate expense (3) (66.3) (46.3) (41.8)Other revenue (2) and other expense, net (4) (33.7) (85.6) (119.9)Net interest expense (32.5) (33.7) (26.6)
Total corporate items (132.5) (165.6) (188.3)
Income before income taxes attributable to FMC Technologies, Inc. (5) $ 1,060.9 $ 714.0 $ 596.4
______________________________(1) We had one customer in our Subsea Technologies segment that comprised approximately $875.9 million and $625.9 million of our
consolidated revenue for the year ended December 31, 2013 and 2012, respectively.
(2) Other revenue comprises certain unrealized gains and losses on derivative instruments related to unexecuted sales contracts.
(3) Corporate expense primarily includes corporate staff expenses.
(4) Other expense, net, generally includes stock-based compensation, other employee benefits, LIFO adjustments, certain foreign exchange gainsand losses, and the impact of unusual or strategic transactions not representative of segment operations.
(5) Excludes amounts attributable to noncontrolling interests.
89
Copyright © 2013 www.secdatabase.com. All Rights Reserved.Please Consider the Environment Before Printing This Document
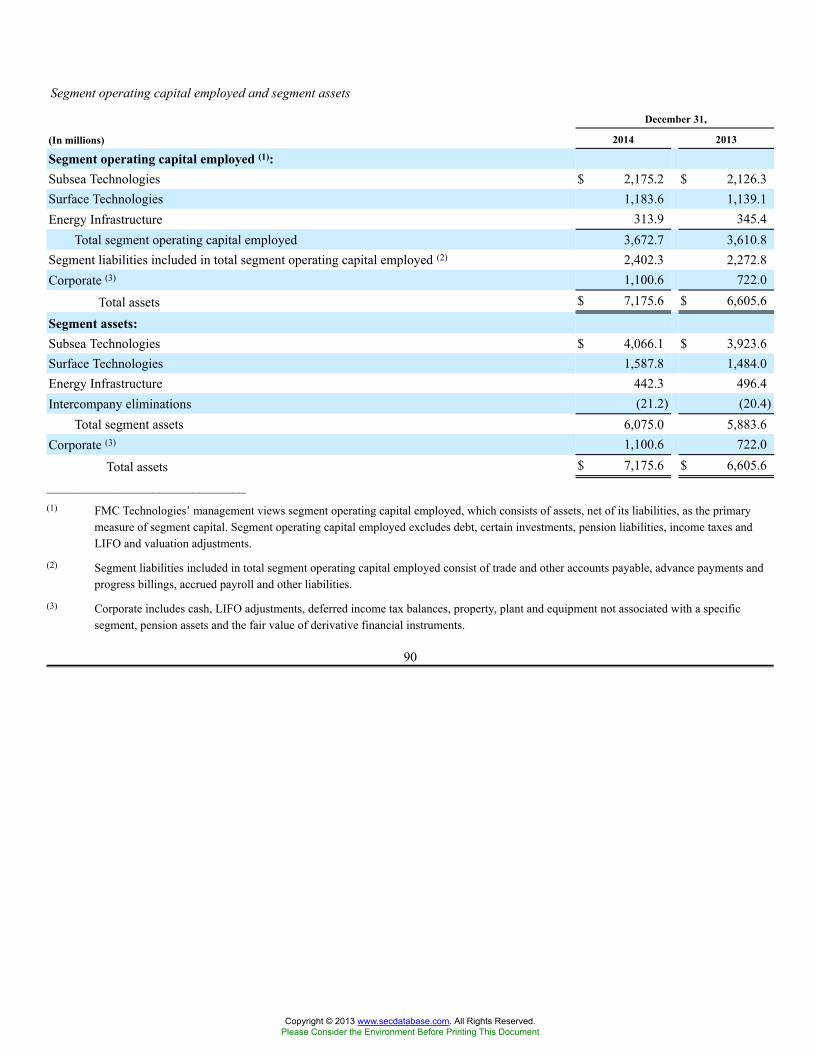
Segment operating capital employed and segment assets
December 31,
(In millions) 2014 2013
Segment operating capital employed (1):Subsea Technologies $ 2,175.2 $ 2,126.3Surface Technologies 1,183.6 1,139.1Energy Infrastructure 313.9 345.4
Total segment operating capital employed 3,672.7 3,610.8Segment liabilities included in total segment operating capital employed (2) 2,402.3 2,272.8Corporate (3) 1,100.6 722.0
Total assets $ 7,175.6 $ 6,605.6
Segment assets:Subsea Technologies $ 4,066.1 $ 3,923.6Surface Technologies 1,587.8 1,484.0Energy Infrastructure 442.3 496.4Intercompany eliminations (21.2) (20.4)
Total segment assets 6,075.0 5,883.6Corporate (3) 1,100.6 722.0
Total assets $ 7,175.6 $ 6,605.6______________________________(1) FMC Technologies’ management views segment operating capital employed, which consists of assets, net of its liabilities, as the primary
measure of segment capital. Segment operating capital employed excludes debt, certain investments, pension liabilities, income taxes andLIFO and valuation adjustments.
(2) Segment liabilities included in total segment operating capital employed consist of trade and other accounts payable, advance payments andprogress billings, accrued payroll and other liabilities.
(3) Corporate includes cash, LIFO adjustments, deferred income tax balances, property, plant and equipment not associated with a specificsegment, pension assets and the fair value of derivative financial instruments.
90
Copyright © 2013 www.secdatabase.com. All Rights Reserved.Please Consider the Environment Before Printing This Document
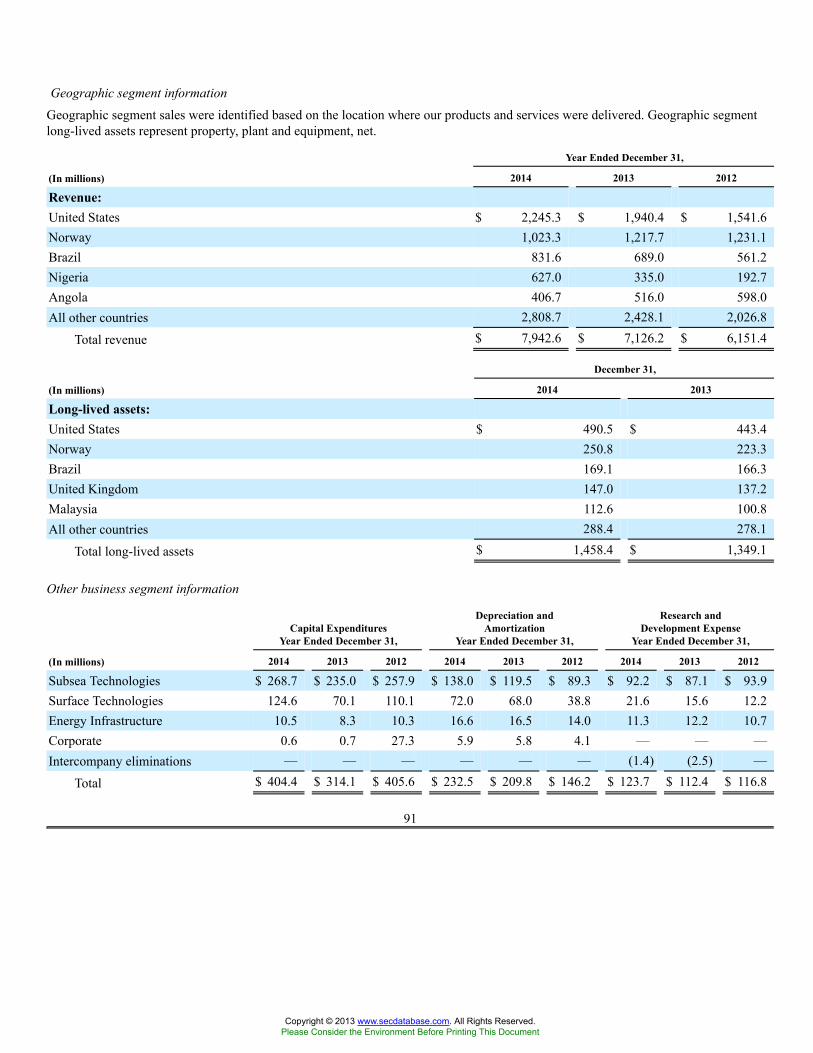
Geographic segment informationGeographic segment sales were identified based on the location where our products and services were delivered. Geographic segmentlong-lived assets represent property, plant and equipment, net.
Year Ended December 31,
(In millions) 2014 2013 2012
Revenue:United States $ 2,245.3 $ 1,940.4 $ 1,541.6Norway 1,023.3 1,217.7 1,231.1Brazil 831.6 689.0 561.2Nigeria 627.0 335.0 192.7Angola 406.7 516.0 598.0All other countries 2,808.7 2,428.1 2,026.8
Total revenue $ 7,942.6 $ 7,126.2 $ 6,151.4
December 31,
(In millions) 2014 2013
Long-lived assets:United States $ 490.5 $ 443.4Norway 250.8 223.3Brazil 169.1 166.3United Kingdom 147.0 137.2Malaysia 112.6 100.8All other countries 288.4 278.1
Total long-lived assets $ 1,458.4 $ 1,349.1
Other business segment information
Capital ExpendituresYear Ended December 31,
Depreciation andAmortization
Year Ended December 31,
Research andDevelopment Expense
Year Ended December 31,
(In millions) 2014 2013 2012 2014 2013 2012 2014 2013 2012
Subsea Technologies $ 268.7 $ 235.0 $ 257.9 $ 138.0 $ 119.5 $ 89.3 $ 92.2 $ 87.1 $ 93.9Surface Technologies 124.6 70.1 110.1 72.0 68.0 38.8 21.6 15.6 12.2Energy Infrastructure 10.5 8.3 10.3 16.6 16.5 14.0 11.3 12.2 10.7Corporate 0.6 0.7 27.3 5.9 5.8 4.1 — — —Intercompany eliminations — — — — — — (1.4) (2.5) —
Total $ 404.4 $ 314.1 $ 405.6 $ 232.5 $ 209.8 $ 146.2 $ 123.7 $ 112.4 $ 116.8
91
Copyright © 2013 www.secdatabase.com. All Rights Reserved.Please Consider the Environment Before Printing This Document
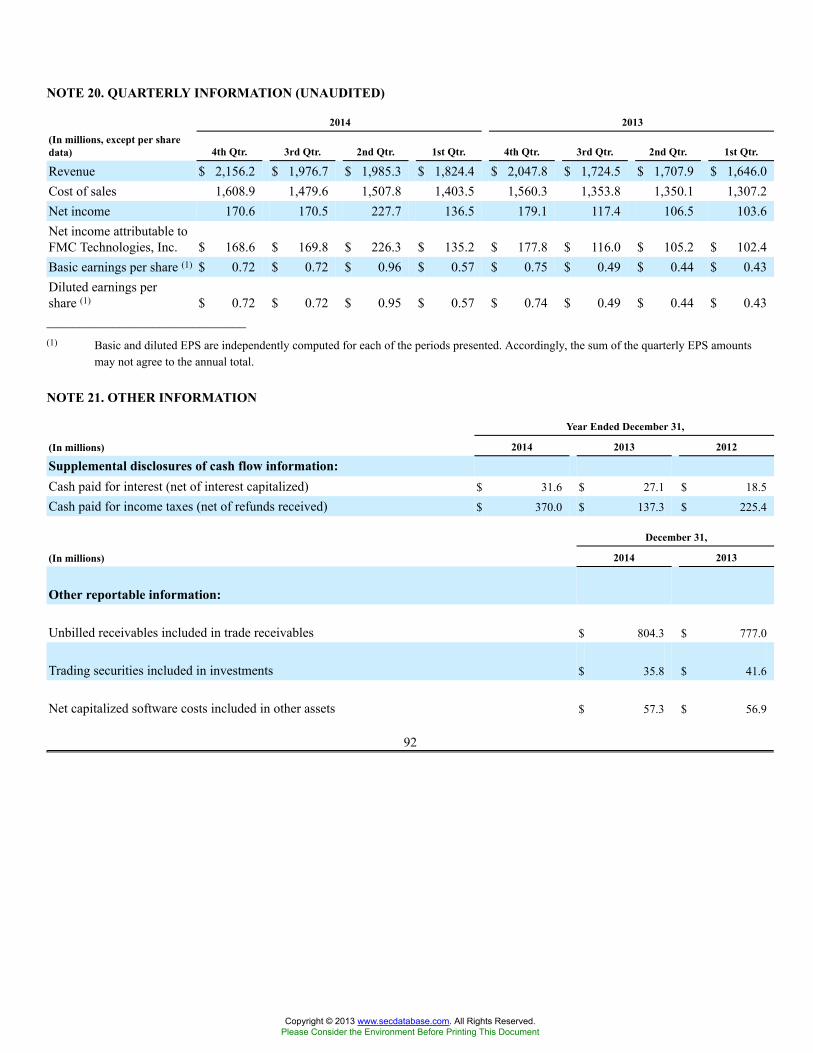
NOTE 20. QUARTERLY INFORMATION (UNAUDITED)
2014 2013(In millions, except per sharedata) 4th Qtr. 3rd Qtr. 2nd Qtr. 1st Qtr. 4th Qtr. 3rd Qtr. 2nd Qtr. 1st Qtr.
Revenue $ 2,156.2 $ 1,976.7 $ 1,985.3 $ 1,824.4 $ 2,047.8 $ 1,724.5 $ 1,707.9 $ 1,646.0Cost of sales 1,608.9 1,479.6 1,507.8 1,403.5 1,560.3 1,353.8 1,350.1 1,307.2Net income 170.6 170.5 227.7 136.5 179.1 117.4 106.5 103.6Net income attributable toFMC Technologies, Inc. $ 168.6 $ 169.8 $ 226.3 $ 135.2 $ 177.8 $ 116.0 $ 105.2 $ 102.4Basic earnings per share (1) $ 0.72 $ 0.72 $ 0.96 $ 0.57 $ 0.75 $ 0.49 $ 0.44 $ 0.43Diluted earnings pershare (1) $ 0.72 $ 0.72 $ 0.95 $ 0.57 $ 0.74 $ 0.49 $ 0.44 $ 0.43______________________________(1) Basic and diluted EPS are independently computed for each of the periods presented. Accordingly, the sum of the quarterly EPS amounts
may not agree to the annual total.
NOTE 21. OTHER INFORMATION
Year Ended December 31,
(In millions) 2014 2013 2012
Supplemental disclosures of cash flow information:Cash paid for interest (net of interest capitalized) $ 31.6 $ 27.1 $ 18.5Cash paid for income taxes (net of refunds received) $ 370.0 $ 137.3 $ 225.4
December 31,
(In millions) 2014 2013
Other reportable information:
Unbilled receivables included in trade receivables $ 804.3 $ 777.0
Trading securities included in investments $ 35.8 $ 41.6
Net capitalized software costs included in other assets $ 57.3 $ 56.9
92
Copyright © 2013 www.secdatabase.com. All Rights Reserved.Please Consider the Environment Before Printing This Document
ITEM 9. CHANGES IN AND DISAGREEMENTS WITH ACCOUNTANTS ON ACCOUNTING AND FINANCIALDISCLOSURENone.
ITEM 9A. CONTROLS AND PROCEDURESEvaluation of Disclosure Controls and ProceduresAs of December 31, 2014, and under the direction of our principal executive officer and principal financial officer, we have evaluatedthe effectiveness of our disclosure controls and procedures, as defined in Rules 13a-15(e) and 15d-15(e) under the Exchange Act. Basedupon this evaluation, our principal executive officer and principal financial officer have concluded as of December 31, 2014, that ourdisclosure controls and procedures were:
i) effective in ensuring that information required to be disclosed in reports that we file or submit under the Exchange Act isrecorded, processed, summarized and reported within the time periods specified in the SEC’s rules and forms; and
ii) effective in ensuring that information required to be disclosed in reports that we file or submit under the Exchange Act isaccumulated and communicated to management, including our principal executive officer and principal financial officer, asappropriate to allow timely decisions regarding required disclosure.
There were no changes in internal controls over financial reporting identified in the evaluation for the quarter ended December 31,2014, that have materially affected, or are reasonably likely to materially affect, our internal control over financial reporting, as definedin Rules 13a-15(f) and 15d-15(f) under the Exchange Act.
Management’s Annual Report on Internal Control over Financial Reporting
This report is included in Part II, Item 8 of this Annual Report on Form 10-K and is incorporated herein by reference.
ITEM 9B. OTHER INFORMATIONNone.
93
Copyright © 2013 www.secdatabase.com. All Rights Reserved.Please Consider the Environment Before Printing This Document
PART III
ITEM 10. DIRECTORS, EXECUTIVE OFFICERS AND CORPORATE GOVERNANCEInformation regarding our directors is incorporated herein by reference from the section entitled “Election of Directors (Item 1 on theProxy Card)” of our Proxy Statement for the 2015 Annual Meeting of Stockholders.
Our Board of Directors has three standing committees: an Audit Committee, a Compensation Committee and a Nominating andGovernance Committee. Each of these committees operates pursuant to a written charter setting out the functions and responsibilities ofthe committee. The charters for the Audit Committee, the Compensation Committee and the Nominating and Governance Committee ofthe Board of Directors may be found on our website at www.fmctechnologies.com under “About Us—Corporate Governance” and arealso available in print to any stockholder upon request without charge by submitting a written request to our Senior Vice President,General Counsel and Secretary, FMC Technologies, Inc., 5875 North Sam Houston Parkway West, Houston, Texas 77086. Informationregarding shareholder nominating procedures is incorporated herein by reference from the section entitled “CorporateGovernance—Committees of the Board of Directors—Nominating and Governance Committee” of the Proxy Statement for the 2015Annual Meeting of Stockholders. Information concerning audit committee financial experts on the Audit Committee of the Board ofDirectors is incorporated herein by reference from the section entitled “Corporate Governance—Committees of the Board ofDirectors—Audit Committee” of the Proxy Statement for the 2015 Annual Meeting of Stockholders.
Information regarding our executive officers is presented in the section entitled “Executive Officers of the Registrant” in Part I, Item 1of this Annual Report on Form 10-K.
Information regarding compliance by our directors and executive officers with Section 16(a) of the Securities and Exchange Act of1934, as amended, is incorporated herein by reference from the section entitled “Section 16(a) Beneficial Ownership ReportingCompliance” of our Proxy Statement for the 2015 Annual Meeting of Stockholders.
We have adopted a Code of Business Conduct and Ethics (the “Code”), which is applicable to our principal executive officer and othersenior financial officers, who include our principal financial officer, principal accounting officer or controller, and persons performingsimilar functions. The Code may be found on our website at www.fmctechnologies.com under “About Us—Corporate Governance” andis available in print to stockholders without charge by submitting a request to the address set forth above. To the extent required by SECrules, we intend to disclose any amendments to this Code and any waiver of a provision of the Code for the benefit of our principalexecutive officer, principal financial officer, principal accounting officer or controller, or persons performing similar functions, on ourwebsite within four business days following any such amendment of waiver, or within any other period that may be required under SECrules from time to time.
ITEM 11. EXECUTIVE COMPENSATIONInformation required by this item is incorporated herein by reference from the sections entitled “Director Compensation,” “CorporateGovernance—Compensation Committee Interlocks and Insider Participation in Compensation Decisions” and “ExecutiveCompensation” of our Proxy Statement for the 2015 Annual Meeting of Stockholders.
ITEM 12. SECURITY OWNERSHIP OF CERTAIN BENEFICIAL OWNERS AND MANAGEMENT AND RELATEDSTOCKHOLDER MATTERSInformation required by this item is incorporated herein by reference from the section entitled “Security Ownership of Our Managementand Holders of More Than 5% of Outstanding Shares of Common Stock” of our Proxy Statement for the 2015 Annual Meeting ofStockholders. Additionally, Equity Plan Compensation Information is presented in Part II, Item 5 of this Annual Report on Form 10-K.
94
Copyright © 2013 www.secdatabase.com. All Rights Reserved.Please Consider the Environment Before Printing This Document
ITEM 13. CERTAIN RELATIONSHIPS AND RELATED TRANSACTIONS, AND DIRECTOR INDEPENDENCEInformation required by this item is incorporated herein by reference from the sections entitled “Transactions with Related Persons” and“Corporate Governance—Director Independence” of our Proxy Statement for the 2015 Annual Meeting of Stockholders.
ITEM 14. PRINCIPAL ACCOUNTING FEES AND SERVICESInformation required by this item is incorporated herein by reference from the section entitled “Proposal to Ratify the Appointment ofKPMG LLP as Our Independent Registered Public Accounting Firm for 2015 (Item 2 on the Proxy Card)” of our Proxy Statement forthe 2015 Annual Meeting of Stockholders.
95
Copyright © 2013 www.secdatabase.com. All Rights Reserved.Please Consider the Environment Before Printing This Document
PART IV
ITEM 15. EXHIBITS, FINANCIAL STATEMENT SCHEDULES
(a) The following documents are filed as part of this Annual Report on Form 10-K:
1. The following consolidated financial statements of FMC Technologies, Inc. and subsidiaries are filed as part of thisAnnual Report on Form 10-K under Part II, Item 8:
Management’s Report on Internal Control over Financial Reporting
Report of Independent Registered Public Accounting Firm on Internal Control over Financial Reporting
Report of Independent Registered Public Accounting Firm on Consolidated Financial Statements
Consolidated Statements of Income for the Years Ended December 31, 2014, 2013 and 2012
Consolidated Statements of Comprehensive Income for the Years Ended December 31, 2014, 2013, and 2012
Consolidated Balance Sheets as of December 31, 2014 and 2013
Consolidated Statements of Cash Flows for the Years Ended December 31, 2014, 2013 and 2012
Consolidated Statements of Changes in Stockholders’ Equity for the Years Ended December 31, 2014, 2013 and 2012
Notes to Consolidated Financial Statements
2. Financial Statement Schedule and related Report of Independent Registered Public Accounting Firm:
See “Schedule II—Valuation and Qualifying Accounts” and the related Report of Independent Registered PublicAccounting Firm included herein. All other schedules are omitted because of the absence of conditions under whichthey are required or because information called for is shown in the consolidated financial statements and notes theretoin Part II, Item 8 of this Annual Report on Form 10-K.
3. Exhibits:
See “Index of Exhibits” filed as part of this Annual Report on Form 10-K.
96
Copyright © 2013 www.secdatabase.com. All Rights Reserved.Please Consider the Environment Before Printing This Document
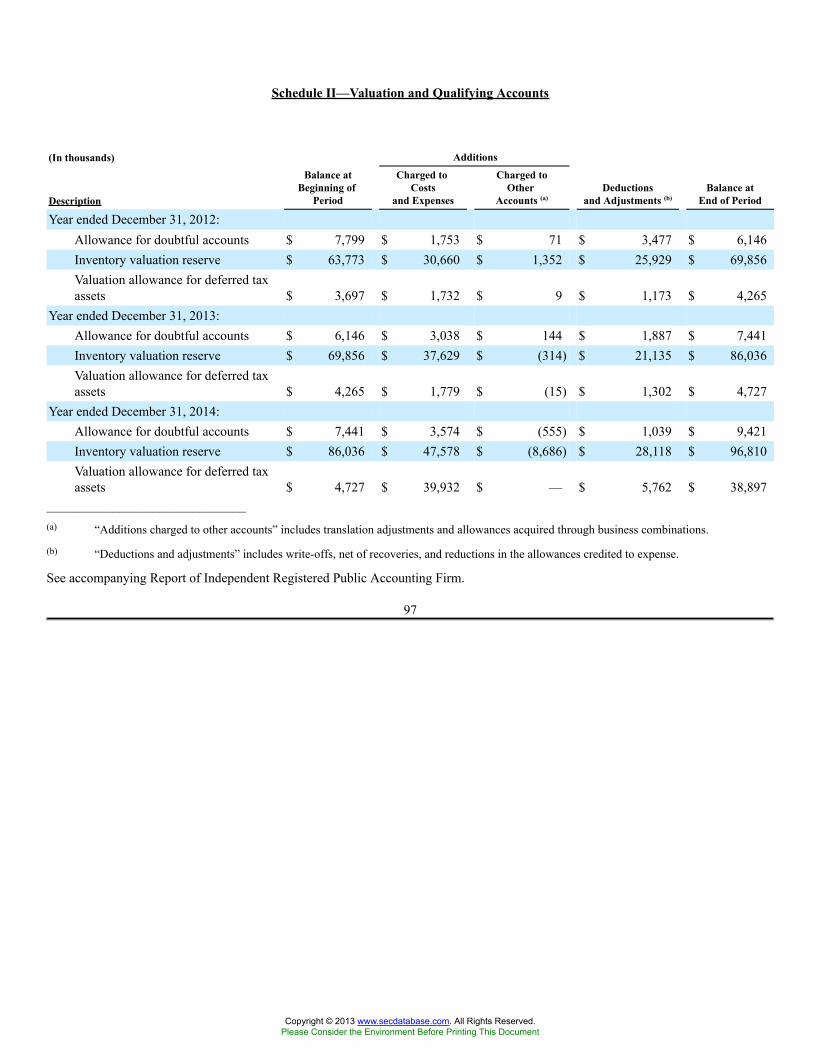
Schedule II—Valuation and Qualifying Accounts
(In thousands) Additions
Description
Balance atBeginning of
Period
Charged toCosts
and Expenses
Charged toOther
Accounts (a)Deductions
and Adjustments (b)Balance at
End of Period
Year ended December 31, 2012:Allowance for doubtful accounts $ 7,799 $ 1,753 $ 71 $ 3,477 $ 6,146Inventory valuation reserve $ 63,773 $ 30,660 $ 1,352 $ 25,929 $ 69,856Valuation allowance for deferred taxassets $ 3,697 $ 1,732 $ 9 $ 1,173 $ 4,265
Year ended December 31, 2013:Allowance for doubtful accounts $ 6,146 $ 3,038 $ 144 $ 1,887 $ 7,441Inventory valuation reserve $ 69,856 $ 37,629 $ (314) $ 21,135 $ 86,036Valuation allowance for deferred taxassets $ 4,265 $ 1,779 $ (15) $ 1,302 $ 4,727
Year ended December 31, 2014:Allowance for doubtful accounts $ 7,441 $ 3,574 $ (555) $ 1,039 $ 9,421Inventory valuation reserve $ 86,036 $ 47,578 $ (8,686) $ 28,118 $ 96,810Valuation allowance for deferred taxassets $ 4,727 $ 39,932 $ — $ 5,762 $ 38,897
______________________________(a) “Additions charged to other accounts” includes translation adjustments and allowances acquired through business combinations.
(b) “Deductions and adjustments” includes write-offs, net of recoveries, and reductions in the allowances credited to expense.
See accompanying Report of Independent Registered Public Accounting Firm.
97
Copyright © 2013 www.secdatabase.com. All Rights Reserved.Please Consider the Environment Before Printing This Document
SIGNATURES
Pursuant to the requirements of Section 13 or 15(d) of the Securities Exchange Act of 1934, the Registrant has duly caused thisreport to be signed on its behalf by the undersigned, thereunto duly authorized.
FMC TECHNOLOGIES, INC.(Registrant)
By: /S/ MARYANN T. SEAMAN
Maryann T. SeamanExecutive Vice President and Chief Financial Officer
Date: February 20, 2015
Pursuant to the requirements of the Securities Exchange Act of 1934, this report has been signed below by the following personson behalf of the Registrant and in the capacities and on the date indicated.
Date Signature
February 20, 2015 /S/ JOHN T. GREMP
John T. GrempChairman, President and Chief Executive Officer
(Principal Executive Officer)
February 20, 2015 /S/ MARYANN T. SEAMAN
Maryann T. SeamanExecutive Vice President and Chief Financial Officer
(Principal Financial Officer)
February 20, 2015 /S/ JAY A. NUTT
Jay A. NuttVice President and Controller(Principal Accounting Officer)
February 20, 2015 /S/ ELEAZAR DE CARVALHO FILHO
Eleazar De Carvalho Filho,Director
February 20, 2015 /S/ CLARENCE P. CAZALOT, JR.
Clarence P. Cazalot, Jr.,Director
February 20, 2015 /S/ C. MAURY DEVINE
C. Maury Devine,Director
February 20, 2015 /S/ CLAIRE S. FARLEY
Claire S. Farley,Director
February 20, 2015 /S/ THOMAS M. HAMILTON
Thomas M. Hamilton,Director
Copyright © 2013 www.secdatabase.com. All Rights Reserved.Please Consider the Environment Before Printing This Document
February 20, 2015 /S/ PETER MELLBYE
Peter Mellbye,Director
February 20, 2015 /S/ EDWARD J. MOONEY
Edward J. Mooney,Director
February 20, 2015 /S/ JOSEPH H. NETHERLAND
Joseph H. Netherland,Director
February 20, 2015 /S/ PETER OOSTERVEER
Peter Oosterveer,Director
February 20, 2015 /S/ JAMES M. RINGLER
James M. Ringler,Director
98
Copyright © 2013 www.secdatabase.com. All Rights Reserved.Please Consider the Environment Before Printing This Document
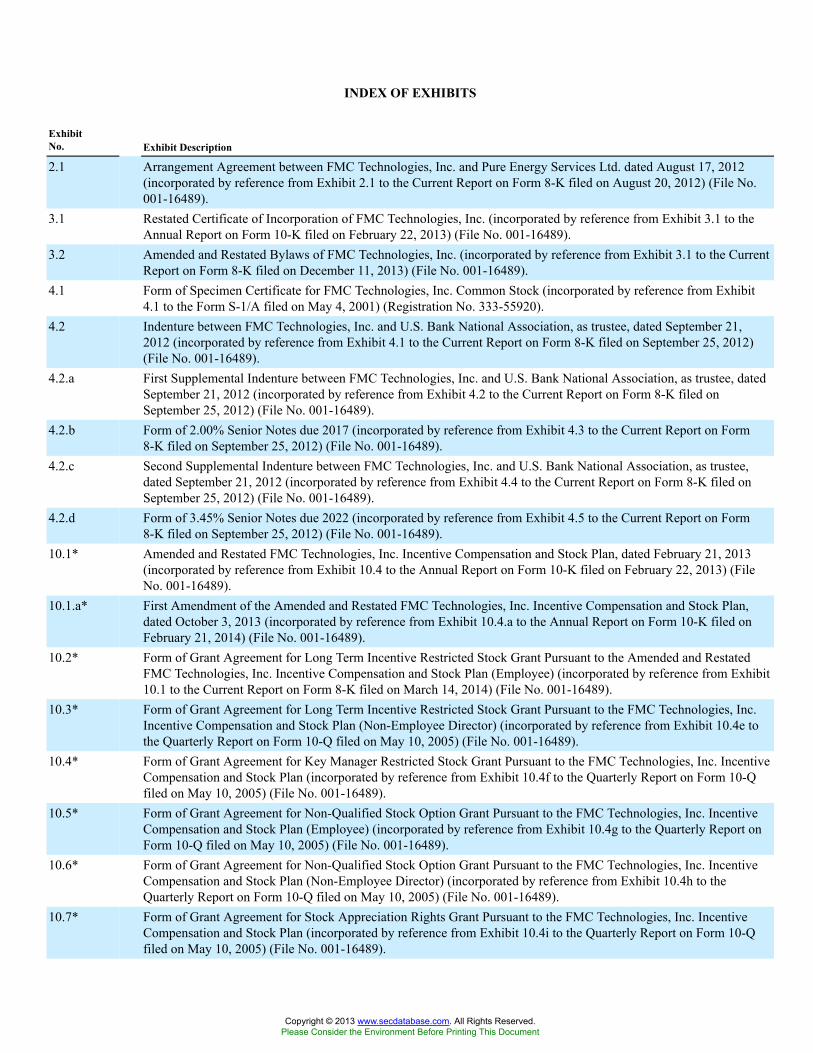
INDEX OF EXHIBITS
ExhibitNo. Exhibit Description
2.1 Arrangement Agreement between FMC Technologies, Inc. and Pure Energy Services Ltd. dated August 17, 2012(incorporated by reference from Exhibit 2.1 to the Current Report on Form 8-K filed on August 20, 2012) (File No.001-16489).
3.1 Restated Certificate of Incorporation of FMC Technologies, Inc. (incorporated by reference from Exhibit 3.1 to theAnnual Report on Form 10-K filed on February 22, 2013) (File No. 001-16489).
3.2 Amended and Restated Bylaws of FMC Technologies, Inc. (incorporated by reference from Exhibit 3.1 to the CurrentReport on Form 8-K filed on December 11, 2013) (File No. 001-16489).
4.1 Form of Specimen Certificate for FMC Technologies, Inc. Common Stock (incorporated by reference from Exhibit4.1 to the Form S-1/A filed on May 4, 2001) (Registration No. 333-55920).
4.2 Indenture between FMC Technologies, Inc. and U.S. Bank National Association, as trustee, dated September 21,2012 (incorporated by reference from Exhibit 4.1 to the Current Report on Form 8-K filed on September 25, 2012)(File No. 001-16489).
4.2.a First Supplemental Indenture between FMC Technologies, Inc. and U.S. Bank National Association, as trustee, datedSeptember 21, 2012 (incorporated by reference from Exhibit 4.2 to the Current Report on Form 8-K filed onSeptember 25, 2012) (File No. 001-16489).
4.2.b Form of 2.00% Senior Notes due 2017 (incorporated by reference from Exhibit 4.3 to the Current Report on Form8-K filed on September 25, 2012) (File No. 001-16489).
4.2.c Second Supplemental Indenture between FMC Technologies, Inc. and U.S. Bank National Association, as trustee,dated September 21, 2012 (incorporated by reference from Exhibit 4.4 to the Current Report on Form 8-K filed onSeptember 25, 2012) (File No. 001-16489).
4.2.d Form of 3.45% Senior Notes due 2022 (incorporated by reference from Exhibit 4.5 to the Current Report on Form8-K filed on September 25, 2012) (File No. 001-16489).
10.1* Amended and Restated FMC Technologies, Inc. Incentive Compensation and Stock Plan, dated February 21, 2013(incorporated by reference from Exhibit 10.4 to the Annual Report on Form 10-K filed on February 22, 2013) (FileNo. 001-16489).
10.1.a* First Amendment of the Amended and Restated FMC Technologies, Inc. Incentive Compensation and Stock Plan,dated October 3, 2013 (incorporated by reference from Exhibit 10.4.a to the Annual Report on Form 10-K filed onFebruary 21, 2014) (File No. 001-16489).
10.2* Form of Grant Agreement for Long Term Incentive Restricted Stock Grant Pursuant to the Amended and RestatedFMC Technologies, Inc. Incentive Compensation and Stock Plan (Employee) (incorporated by reference from Exhibit10.1 to the Current Report on Form 8-K filed on March 14, 2014) (File No. 001-16489).
10.3* Form of Grant Agreement for Long Term Incentive Restricted Stock Grant Pursuant to the FMC Technologies, Inc.Incentive Compensation and Stock Plan (Non-Employee Director) (incorporated by reference from Exhibit 10.4e tothe Quarterly Report on Form 10-Q filed on May 10, 2005) (File No. 001-16489).
10.4* Form of Grant Agreement for Key Manager Restricted Stock Grant Pursuant to the FMC Technologies, Inc. IncentiveCompensation and Stock Plan (incorporated by reference from Exhibit 10.4f to the Quarterly Report on Form 10-Qfiled on May 10, 2005) (File No. 001-16489).
10.5* Form of Grant Agreement for Non-Qualified Stock Option Grant Pursuant to the FMC Technologies, Inc. IncentiveCompensation and Stock Plan (Employee) (incorporated by reference from Exhibit 10.4g to the Quarterly Report onForm 10-Q filed on May 10, 2005) (File No. 001-16489).
10.6* Form of Grant Agreement for Non-Qualified Stock Option Grant Pursuant to the FMC Technologies, Inc. IncentiveCompensation and Stock Plan (Non-Employee Director) (incorporated by reference from Exhibit 10.4h to theQuarterly Report on Form 10-Q filed on May 10, 2005) (File No. 001-16489).
10.7* Form of Grant Agreement for Stock Appreciation Rights Grant Pursuant to the FMC Technologies, Inc. IncentiveCompensation and Stock Plan (incorporated by reference from Exhibit 10.4i to the Quarterly Report on Form 10-Qfiled on May 10, 2005) (File No. 001-16489).
Copyright © 2013 www.secdatabase.com. All Rights Reserved.Please Consider the Environment Before Printing This Document
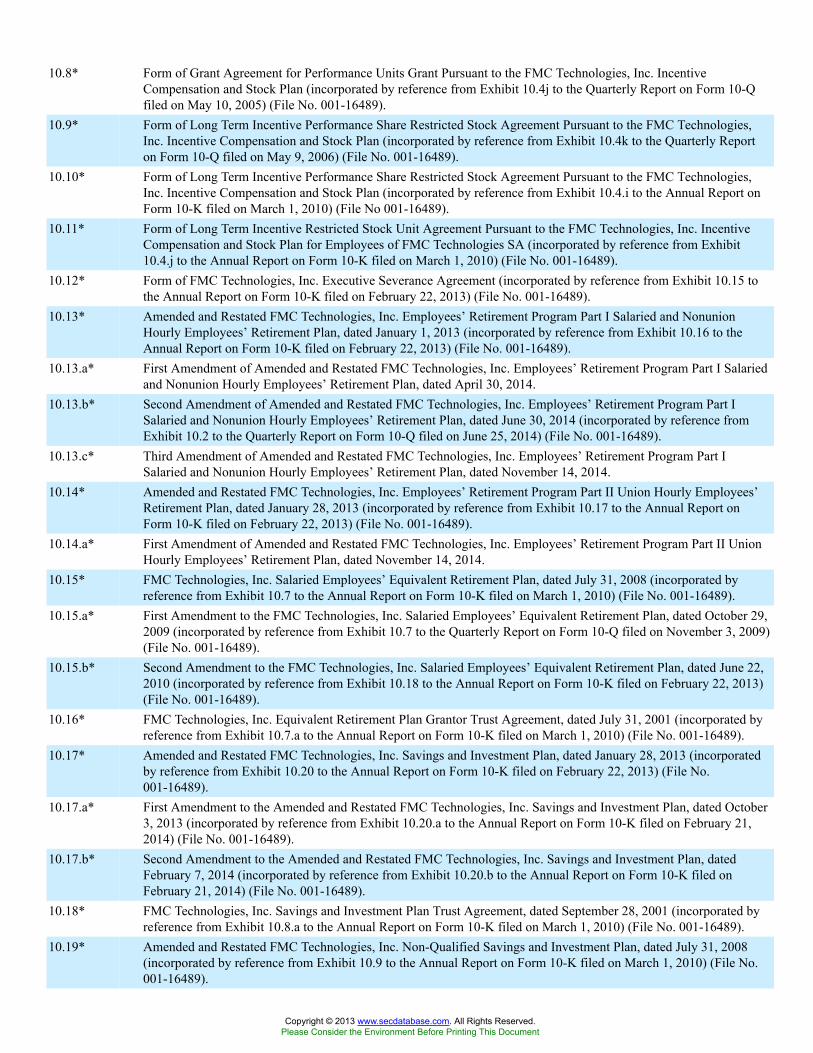
10.8* Form of Grant Agreement for Performance Units Grant Pursuant to the FMC Technologies, Inc. IncentiveCompensation and Stock Plan (incorporated by reference from Exhibit 10.4j to the Quarterly Report on Form 10-Qfiled on May 10, 2005) (File No. 001-16489).
10.9* Form of Long Term Incentive Performance Share Restricted Stock Agreement Pursuant to the FMC Technologies,Inc. Incentive Compensation and Stock Plan (incorporated by reference from Exhibit 10.4k to the Quarterly Reporton Form 10-Q filed on May 9, 2006) (File No. 001-16489).
10.10* Form of Long Term Incentive Performance Share Restricted Stock Agreement Pursuant to the FMC Technologies,Inc. Incentive Compensation and Stock Plan (incorporated by reference from Exhibit 10.4.i to the Annual Report onForm 10-K filed on March 1, 2010) (File No 001-16489).
10.11* Form of Long Term Incentive Restricted Stock Unit Agreement Pursuant to the FMC Technologies, Inc. IncentiveCompensation and Stock Plan for Employees of FMC Technologies SA (incorporated by reference from Exhibit10.4.j to the Annual Report on Form 10-K filed on March 1, 2010) (File No. 001-16489).
10.12* Form of FMC Technologies, Inc. Executive Severance Agreement (incorporated by reference from Exhibit 10.15 tothe Annual Report on Form 10-K filed on February 22, 2013) (File No. 001-16489).
10.13* Amended and Restated FMC Technologies, Inc. Employees’ Retirement Program Part I Salaried and NonunionHourly Employees’ Retirement Plan, dated January 1, 2013 (incorporated by reference from Exhibit 10.16 to theAnnual Report on Form 10-K filed on February 22, 2013) (File No. 001-16489).
10.13.a* First Amendment of Amended and Restated FMC Technologies, Inc. Employees’ Retirement Program Part I Salariedand Nonunion Hourly Employees’ Retirement Plan, dated April 30, 2014.
10.13.b* Second Amendment of Amended and Restated FMC Technologies, Inc. Employees’ Retirement Program Part ISalaried and Nonunion Hourly Employees’ Retirement Plan, dated June 30, 2014 (incorporated by reference fromExhibit 10.2 to the Quarterly Report on Form 10-Q filed on June 25, 2014) (File No. 001-16489).
10.13.c* Third Amendment of Amended and Restated FMC Technologies, Inc. Employees’ Retirement Program Part ISalaried and Nonunion Hourly Employees’ Retirement Plan, dated November 14, 2014.
10.14* Amended and Restated FMC Technologies, Inc. Employees’ Retirement Program Part II Union Hourly Employees’Retirement Plan, dated January 28, 2013 (incorporated by reference from Exhibit 10.17 to the Annual Report onForm 10-K filed on February 22, 2013) (File No. 001-16489).
10.14.a* First Amendment of Amended and Restated FMC Technologies, Inc. Employees’ Retirement Program Part II UnionHourly Employees’ Retirement Plan, dated November 14, 2014.
10.15* FMC Technologies, Inc. Salaried Employees’ Equivalent Retirement Plan, dated July 31, 2008 (incorporated byreference from Exhibit 10.7 to the Annual Report on Form 10-K filed on March 1, 2010) (File No. 001-16489).
10.15.a* First Amendment to the FMC Technologies, Inc. Salaried Employees’ Equivalent Retirement Plan, dated October 29,2009 (incorporated by reference from Exhibit 10.7 to the Quarterly Report on Form 10-Q filed on November 3, 2009)(File No. 001-16489).
10.15.b* Second Amendment to the FMC Technologies, Inc. Salaried Employees’ Equivalent Retirement Plan, dated June 22,2010 (incorporated by reference from Exhibit 10.18 to the Annual Report on Form 10-K filed on February 22, 2013)(File No. 001-16489).
10.16* FMC Technologies, Inc. Equivalent Retirement Plan Grantor Trust Agreement, dated July 31, 2001 (incorporated byreference from Exhibit 10.7.a to the Annual Report on Form 10-K filed on March 1, 2010) (File No. 001-16489).
10.17* Amended and Restated FMC Technologies, Inc. Savings and Investment Plan, dated January 28, 2013 (incorporatedby reference from Exhibit 10.20 to the Annual Report on Form 10-K filed on February 22, 2013) (File No.001-16489).
10.17.a* First Amendment to the Amended and Restated FMC Technologies, Inc. Savings and Investment Plan, dated October3, 2013 (incorporated by reference from Exhibit 10.20.a to the Annual Report on Form 10-K filed on February 21,2014) (File No. 001-16489).
10.17.b* Second Amendment to the Amended and Restated FMC Technologies, Inc. Savings and Investment Plan, datedFebruary 7, 2014 (incorporated by reference from Exhibit 10.20.b to the Annual Report on Form 10-K filed onFebruary 21, 2014) (File No. 001-16489).
10.18* FMC Technologies, Inc. Savings and Investment Plan Trust Agreement, dated September 28, 2001 (incorporated byreference from Exhibit 10.8.a to the Annual Report on Form 10-K filed on March 1, 2010) (File No. 001-16489).
10.19* Amended and Restated FMC Technologies, Inc. Non-Qualified Savings and Investment Plan, dated July 31, 2008(incorporated by reference from Exhibit 10.9 to the Annual Report on Form 10-K filed on March 1, 2010) (File No.001-16489).
Copyright © 2013 www.secdatabase.com. All Rights Reserved.Please Consider the Environment Before Printing This Document
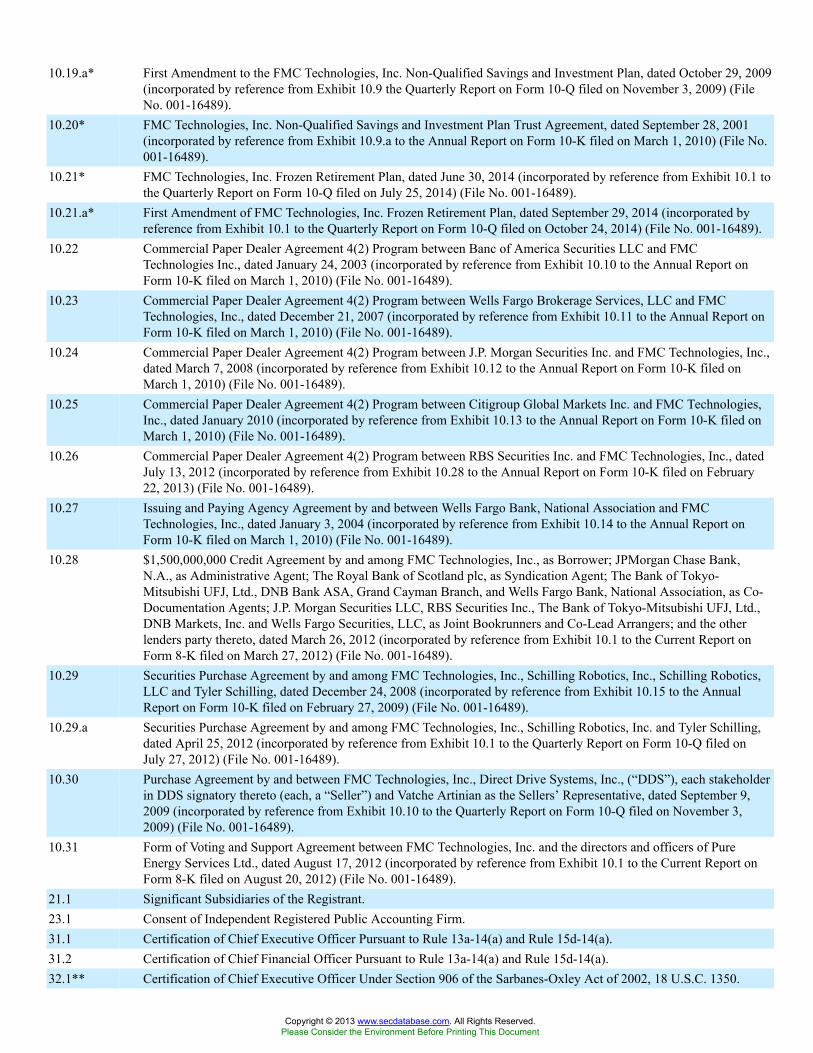
10.19.a* First Amendment to the FMC Technologies, Inc. Non-Qualified Savings and Investment Plan, dated October 29, 2009(incorporated by reference from Exhibit 10.9 the Quarterly Report on Form 10-Q filed on November 3, 2009) (FileNo. 001-16489).
10.20* FMC Technologies, Inc. Non-Qualified Savings and Investment Plan Trust Agreement, dated September 28, 2001(incorporated by reference from Exhibit 10.9.a to the Annual Report on Form 10-K filed on March 1, 2010) (File No.001-16489).
10.21* FMC Technologies, Inc. Frozen Retirement Plan, dated June 30, 2014 (incorporated by reference from Exhibit 10.1 tothe Quarterly Report on Form 10-Q filed on July 25, 2014) (File No. 001-16489).
10.21.a* First Amendment of FMC Technologies, Inc. Frozen Retirement Plan, dated September 29, 2014 (incorporated byreference from Exhibit 10.1 to the Quarterly Report on Form 10-Q filed on October 24, 2014) (File No. 001-16489).
10.22 Commercial Paper Dealer Agreement 4(2) Program between Banc of America Securities LLC and FMCTechnologies Inc., dated January 24, 2003 (incorporated by reference from Exhibit 10.10 to the Annual Report onForm 10-K filed on March 1, 2010) (File No. 001-16489).
10.23 Commercial Paper Dealer Agreement 4(2) Program between Wells Fargo Brokerage Services, LLC and FMCTechnologies, Inc., dated December 21, 2007 (incorporated by reference from Exhibit 10.11 to the Annual Report onForm 10-K filed on March 1, 2010) (File No. 001-16489).
10.24 Commercial Paper Dealer Agreement 4(2) Program between J.P. Morgan Securities Inc. and FMC Technologies, Inc.,dated March 7, 2008 (incorporated by reference from Exhibit 10.12 to the Annual Report on Form 10-K filed onMarch 1, 2010) (File No. 001-16489).
10.25 Commercial Paper Dealer Agreement 4(2) Program between Citigroup Global Markets Inc. and FMC Technologies,Inc., dated January 2010 (incorporated by reference from Exhibit 10.13 to the Annual Report on Form 10-K filed onMarch 1, 2010) (File No. 001-16489).
10.26 Commercial Paper Dealer Agreement 4(2) Program between RBS Securities Inc. and FMC Technologies, Inc., datedJuly 13, 2012 (incorporated by reference from Exhibit 10.28 to the Annual Report on Form 10-K filed on February22, 2013) (File No. 001-16489).
10.27 Issuing and Paying Agency Agreement by and between Wells Fargo Bank, National Association and FMCTechnologies, Inc., dated January 3, 2004 (incorporated by reference from Exhibit 10.14 to the Annual Report onForm 10-K filed on March 1, 2010) (File No. 001-16489).
10.28 $1,500,000,000 Credit Agreement by and among FMC Technologies, Inc., as Borrower; JPMorgan Chase Bank,N.A., as Administrative Agent; The Royal Bank of Scotland plc, as Syndication Agent; The Bank of Tokyo-Mitsubishi UFJ, Ltd., DNB Bank ASA, Grand Cayman Branch, and Wells Fargo Bank, National Association, as Co-Documentation Agents; J.P. Morgan Securities LLC, RBS Securities Inc., The Bank of Tokyo-Mitsubishi UFJ, Ltd.,DNB Markets, Inc. and Wells Fargo Securities, LLC, as Joint Bookrunners and Co-Lead Arrangers; and the otherlenders party thereto, dated March 26, 2012 (incorporated by reference from Exhibit 10.1 to the Current Report onForm 8-K filed on March 27, 2012) (File No. 001-16489).
10.29 Securities Purchase Agreement by and among FMC Technologies, Inc., Schilling Robotics, Inc., Schilling Robotics,LLC and Tyler Schilling, dated December 24, 2008 (incorporated by reference from Exhibit 10.15 to the AnnualReport on Form 10-K filed on February 27, 2009) (File No. 001-16489).
10.29.a Securities Purchase Agreement by and among FMC Technologies, Inc., Schilling Robotics, Inc. and Tyler Schilling,dated April 25, 2012 (incorporated by reference from Exhibit 10.1 to the Quarterly Report on Form 10-Q filed onJuly 27, 2012) (File No. 001-16489).
10.30 Purchase Agreement by and between FMC Technologies, Inc., Direct Drive Systems, Inc., (“DDS”), each stakeholderin DDS signatory thereto (each, a “Seller”) and Vatche Artinian as the Sellers’ Representative, dated September 9,2009 (incorporated by reference from Exhibit 10.10 to the Quarterly Report on Form 10-Q filed on November 3,2009) (File No. 001-16489).
10.31 Form of Voting and Support Agreement between FMC Technologies, Inc. and the directors and officers of PureEnergy Services Ltd., dated August 17, 2012 (incorporated by reference from Exhibit 10.1 to the Current Report onForm 8-K filed on August 20, 2012) (File No. 001-16489).
21.1 Significant Subsidiaries of the Registrant.23.1 Consent of Independent Registered Public Accounting Firm.31.1 Certification of Chief Executive Officer Pursuant to Rule 13a-14(a) and Rule 15d-14(a).31.2 Certification of Chief Financial Officer Pursuant to Rule 13a-14(a) and Rule 15d-14(a).32.1** Certification of Chief Executive Officer Under Section 906 of the Sarbanes-Oxley Act of 2002, 18 U.S.C. 1350.
Copyright © 2013 www.secdatabase.com. All Rights Reserved.Please Consider the Environment Before Printing This Document
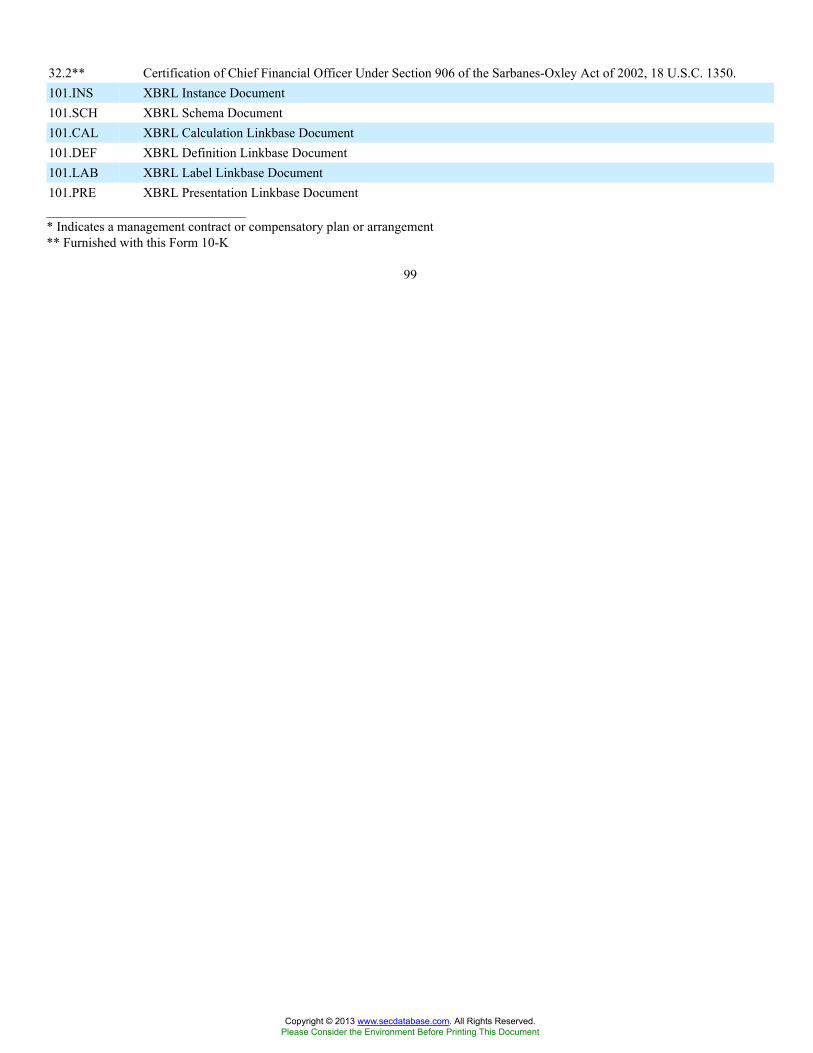
32.2** Certification of Chief Financial Officer Under Section 906 of the Sarbanes-Oxley Act of 2002, 18 U.S.C. 1350.101.INS XBRL Instance Document101.SCH XBRL Schema Document101.CAL XBRL Calculation Linkbase Document101.DEF XBRL Definition Linkbase Document101.LAB XBRL Label Linkbase Document101.PRE XBRL Presentation Linkbase Document______________________________* Indicates a management contract or compensatory plan or arrangement** Furnished with this Form 10-K
99
Copyright © 2013 www.secdatabase.com. All Rights Reserved.Please Consider the Environment Before Printing This Document
THIRD AMENDMENT OF
FMC TECHNOLOGIES, INC. EMPLOYEES’ RETIREMENT PROGRAM
PART I SALARIED AND NONUNION HOURLY EMPLOYEES’ RETIREMENT PLAN
WHEREAS, FMC Technologies, Inc. (the “Company”) maintains the FMC Technologies, Inc. Employees’ Retirement Program
Part I Salaried and Nonunion Hourly Employees’ Retirement Plan, as amended and restated effective January 1, 2013 (the “Plan”);
WHEREAS, the Company now deems it necessary and desirable to amend the Plan to (a) offer a one-time lump sum election
to certain eligible Participants during a window period and (b) raise the mandatory cashout threshold to $5,000 and provide for a
corresponding automatic rollover provision; and
WHEREAS, this Third Amendment shall supersede the provisions of the Plan to the extent those provisions are inconsistent
with the provisions of the amendment;
NOW, THEREFORE, by virtue and in exercise of the powers reserved to the Company under Section 11.1 Plan Amendment
or Termination of the Plan, the Plan is hereby amended as follows, effective September 1, 2014:
1. Effective as of September 1, 2014, Section 3.7 is hereby added to the Plan to read as follows:
3.7 2014 LUMP SUM OPTION WINDOW
The purpose of this Section 3.7 is to modify the provisions of the Plan to offer a one-time lump-sum electionto Qualifying Participants during a window period. The provisions of this Section 3.7 shall apply only to persons whomeet the requirements of a “Qualifying Participant.”
(a) Definitions. In addition to the definitions in Article I of the Plan, the following definitions shallapply for purposes of this Section 3.7:
(1) The term “Qualifying Participant” shall mean a Participant (A) who can be located bythe Company by September 26, 2014, after a diligent search, who terminated employment with the Companyor an Affiliate on or before April 30, 2014 with a vested accrued benefit and who has not been subsequentlyrehired by the Company or an Affiliate, (B) who is not currently receiving a benefit from the Plan as ofSeptember 26, 2014, (C) who is not scheduled to commence payment of his benefit from the Plan on or beforeOctober 1, 2014, (D) who is not age 70 ½ or older as of September 26, 2014, (E) who is not eligible as ofSeptember 26, 2014 to receive disability payments under the Long-Term Disability Plan for Employees ofFMC Technologies, Inc., and (F) who is not a Beneficiary. Additionally, alternate payees of Participants whosebenefit is subject to a qualified domestic relations order (as defined under Section 12.3 of the Plan) filed withthe Employer before May 1, 2014 shall be deemed Qualifying Participants.
Copyright © 2013 www.secdatabase.com. All Rights Reserved.Please Consider the Environment Before Printing This Document
(2) The term “Benefit Election Window” shall mean the special election period during whichQualifying Participants may elect to receive payment or commence to receive payment of their vested accruedbenefit, either as an annuity or as a lump-sum payment, even if such Qualifying Participant has not reachedage 55 and is not eligible for immediate commencement of his accrued benefit other than for the provisions ofthis Section 3.7. The Benefit Election Window shall begin on September 26, 2014 and shall expire on October30, 2014; provided however, that any Qualifying Participant who makes an election to receive payment orcommence to receive payment pursuant to the Benefit Election Window shall have until December 1, 2014 torevoke any such election by contacting the Plan Administrator.
(3) The term “Special Benefit Election” shall mean the valid election made by a QualifyingParticipant to receive or commence to receive his or her vested accrued benefit pursuant to the Benefit ElectionWindow.
(4) Any Qualifying Participant who makes a valid Special Benefit Election shall have anAnnuity Starting Date of December 1, 2014 (the “Limited Benefit Election Annuity Starting Date”).
(b) Calculation and Distribution of Benefits. For any Qualifying Participant who makes a validSpecial Benefit Election, the following provisions will apply in determining his or her benefits during this BenefitElection Window:
(1) For Participants who have not yet attained age 55 as of December 1, 2014, the single lifeannuity will be equal to the Actuarial Equivalent of the accrued benefit payable at Normal Retirement Date.For Participants who have attained age 55 by December 1, 2014, the single life annuity will be equal to theamount determined using the Plan’s early retirement factors set forth in Section 3.2 and Section 4.2 of the Plan(as applicable).
(2) The single life annuity may be converted into an optional benefit available under Section6.2 of the Plan. The optional form of benefit will be the Actuarial Equivalent of the single life annuity.
(3) A Qualifying Participant may elect to receive his accrued benefit as an immediate singlelump sum payment, but only during the Benefit Election Window. The lump sum optional form of paymentwill be equal to the Present Value of the Normal Retirement Benefit, determined using factors based on theapplicable interest rate and applicable mortality table as defined under Article I of the Plan. For Participantswho have attained age 55 as of December 1, 2014, the lump sum optional form of payment cannot be lessthan the Present Value of the Participant’s single life annuity payable at December 1, 2014, determined usingfactors based on the applicable interest rate and applicable mortality table as defined under Article I of thePlan.
(4) Any lump sum paid under this Section shall be deemed an eligible rollover distributionunder Section 12.10 of the Plan, but only to the extent permitted by Section 401(a)(9) of the Internal RevenueCode.
(5) A Qualifying Participant’s benefit must be definitely determinable based on the dataavailable to the Plan Administrator as of December 1, 2014, in order to be paid in accordance with the BenefitElection Window provisions set forth in this Section 3.7.
Copyright © 2013 www.secdatabase.com. All Rights Reserved.Please Consider the Environment Before Printing This Document
(6) Notwithstanding the above, all forms of payment included in this Benefit ElectionWindow shall exclude the portion of the accrued benefit accrued under the Plan as of November 30, 1985 (tothe extent funded by the Aetna nonparticipating annuity contract or the Prudential nonparticipating annuitycontract).
(c) Death Benefit.
(1) If a Qualifying Participant’s death occurs prior to September 26, 2014, and he is eligiblefor a death benefit payable pursuant to the provisions of Article VII of the Plan, the benefit shall be paid inaccordance with such provisions.
(2) If a Qualifying Participant’s death occurs on or after September 26, 2014, and suchQualifying Participant did not elect the Special Benefit Election, any death benefit for which he is eligible willbe paid pursuant to the provisions of Article VII of the Plan.
(3) If a Qualifying Participant’s death occurs on or after September 26, 2014, and suchQualifying Participant had timely and properly elected the Special Benefit Election hereunder to receive hisaccrued benefit, but did not receive such benefit as of the date of his death, the benefit so elected will be paidto such Qualifying Participant’s spouse, beneficiary, or estate in accordance with the following:
(A) Lump Sum Payment: If the Qualifying Participant elected to receive his accruedbenefit in the form of a lump sum payment and the Qualifying Participant has a spouse, the lump sumpayment shall be made to the spouse or beneficiary properly designated pursuant to Section 12.4 ofthe Plan. If such Qualifying Participant does not have a spouse, the lump sum payment shall be madeto the beneficiary. If such Qualifying Participant does not have a spouse or beneficiary, the lump sumpayment shall be made to the Qualifying Participant’s estate.
(B) Annuity: If the Qualifying Participant elected to receive his benefit in the formof an annuity, payment of the Special Election Benefit shall be made under the terms of the annuityelected.
(C) For purposes of this Section 3.7, a spouse shall be the individual to whom theQualifying Participant is married on September 26, 2014. Further, the beneficiary shall be as definedby Section 401(a)(9)(E) of the Internal Revenue Code.
Copyright © 2013 www.secdatabase.com. All Rights Reserved.Please Consider the Environment Before Printing This Document
2. Effective September 1, 2014, Section 12.8 of the Plan is hereby amended to add the following to the end thereto to readas follows:
12.8 Effective September 1, 2014, if the lump sum Actuarial Equivalent value of a Normal, Early, orDeferred Retirement Benefit under Article III, Termination Benefit under Article IV, or Survivor’sBenefit under Article VII, excluding any previously annuitized Aetna or Prudential nonparticipatingannuity, is equal to $5,000, or less, such amount shall be paid in a lump sum as soon asadministratively practicable following the Participant’s retirement, termination of employment ordeath. However, if the amount to be distributed is more than $1,000 and the Participant does not electto have such distribution paid directly to an “eligible retirement plan” specified by the Participantin a direct rollover (in accordance with the direct rollover provisions of the Plan) or to receivethe distribution directly, then the Administrator shall pay the distribution in a direct rollover to anindividual retirement plan designated by the Administrator.
IN WITNESS WHEREOF, the Company has caused this amendment to be executed by a duly authorized representative this
14th
day of November, 2014.
FMC Technologies, Inc.
By: /s/ Maryann T. SeamanIts: Executive Vice President & CFO
Copyright © 2013 www.secdatabase.com. All Rights Reserved.Please Consider the Environment Before Printing This Document

FIRST AMENDMENT OF
FMC TECHNOLOGIES, INC. EMPLOYEES’ RETIREMENT PROGRAM
PART II UNION HOURLY EMPLOYEES’ RETIREMENT PLAN
WHEREAS, FMC Technologies, Inc. (the “Company”) maintains the FMC Technologies, Inc. Employees’ Retirement Program
Part II Union Hourly Employees’ Retirement Plan, as amended and restated effective January 1, 2013 (the “Plan”);
WHEREAS, the Company now deems it necessary and desirable to amend the Plan to (a) offer a one-time lump sum election
to certain eligible Participants during a window period and (b) raise the mandatory cashout threshold to $5,000 and provide for a
corresponding automatic rollover provision; and
WHEREAS, this First Amendment shall supersede the provisions of the Plan to the extent those provisions are inconsistent
with the provisions of the amendment;
NOW, THEREFORE, by virtue and in exercise of the powers reserved to the Company under Section 11.1 Plan Amendment
or Termination of the Plan, the Plan is hereby amended as follows, effective September 1, 2014:
1. Effective as of September 1, 2014, Section 3.7 is hereby added to the Plan to read as follows:3.7 2014 LUMP SUM OPTION WINDOW
The purpose of this Section 3.7 is to modify the provisions of the Plan to offer a one-time lump-sum electionto Qualifying Participants during a window period. The provisions of this Section 3.7 shall apply only to persons whomeet the requirements of a “Qualifying Participant.”
(a) Definitions. In addition to the definitions in Article I of the Plan, the following definitions shallapply for purposes of this Section 3.7:
(1) The term “Qualifying Participant” shall mean a Participant (A) who can be located bythe Company by September 26, 2014, after a diligent search, who terminated employment with the Companyor an Affiliate on or before April 30, 2014 with a vested accrued benefit and who has not been subsequentlyrehired by the Company or an Affiliate, (B) who is not currently receiving a benefit from the Plan as ofSeptember 26, 2014, (C) who is not scheduled to commence payment of his benefit from the Plan on or beforeOctober 1, 2014, (D) who is not age 70 ½ or older as of September 26, 2014, (E) who is not eligible as ofSeptember 26, 2014 to receive disability payments under the Long-Term Disability Plan for Employees ofFMC Technologies, Inc., and (F) who is not a Beneficiary. Additionally, alternate payees of Participants whosebenefit is subject to a qualified domestic relations order (as defined under Section 12.3 of the Plan) filed withthe Employer before May 1, 2014 shall be deemed Qualifying Participants.
Copyright © 2013 www.secdatabase.com. All Rights Reserved.Please Consider the Environment Before Printing This Document
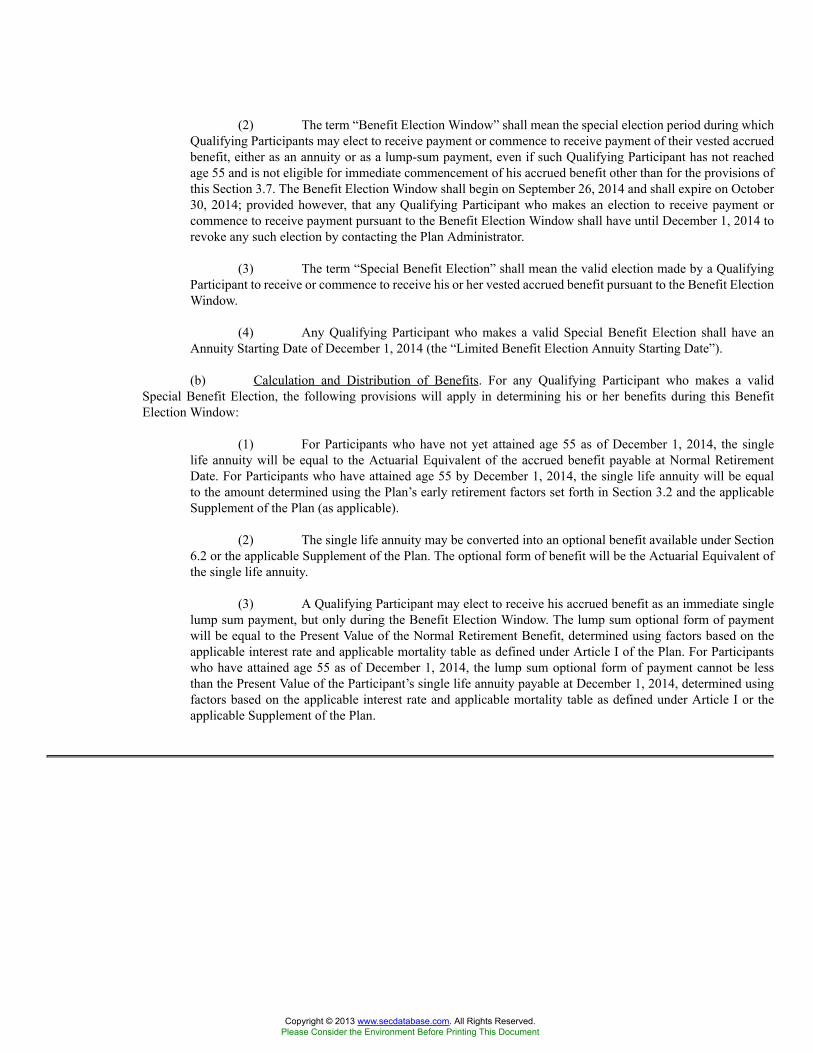
(2) The term “Benefit Election Window” shall mean the special election period during whichQualifying Participants may elect to receive payment or commence to receive payment of their vested accruedbenefit, either as an annuity or as a lump-sum payment, even if such Qualifying Participant has not reachedage 55 and is not eligible for immediate commencement of his accrued benefit other than for the provisions ofthis Section 3.7. The Benefit Election Window shall begin on September 26, 2014 and shall expire on October30, 2014; provided however, that any Qualifying Participant who makes an election to receive payment orcommence to receive payment pursuant to the Benefit Election Window shall have until December 1, 2014 torevoke any such election by contacting the Plan Administrator.
(3) The term “Special Benefit Election” shall mean the valid election made by a QualifyingParticipant to receive or commence to receive his or her vested accrued benefit pursuant to the Benefit ElectionWindow.
(4) Any Qualifying Participant who makes a valid Special Benefit Election shall have anAnnuity Starting Date of December 1, 2014 (the “Limited Benefit Election Annuity Starting Date”).
(b) Calculation and Distribution of Benefits. For any Qualifying Participant who makes a validSpecial Benefit Election, the following provisions will apply in determining his or her benefits during this BenefitElection Window:
(1) For Participants who have not yet attained age 55 as of December 1, 2014, the singlelife annuity will be equal to the Actuarial Equivalent of the accrued benefit payable at Normal RetirementDate. For Participants who have attained age 55 by December 1, 2014, the single life annuity will be equalto the amount determined using the Plan’s early retirement factors set forth in Section 3.2 and the applicableSupplement of the Plan (as applicable).
(2) The single life annuity may be converted into an optional benefit available under Section6.2 or the applicable Supplement of the Plan. The optional form of benefit will be the Actuarial Equivalent ofthe single life annuity.
(3) A Qualifying Participant may elect to receive his accrued benefit as an immediate singlelump sum payment, but only during the Benefit Election Window. The lump sum optional form of paymentwill be equal to the Present Value of the Normal Retirement Benefit, determined using factors based on theapplicable interest rate and applicable mortality table as defined under Article I of the Plan. For Participantswho have attained age 55 as of December 1, 2014, the lump sum optional form of payment cannot be lessthan the Present Value of the Participant’s single life annuity payable at December 1, 2014, determined usingfactors based on the applicable interest rate and applicable mortality table as defined under Article I or theapplicable Supplement of the Plan.
Copyright © 2013 www.secdatabase.com. All Rights Reserved.Please Consider the Environment Before Printing This Document
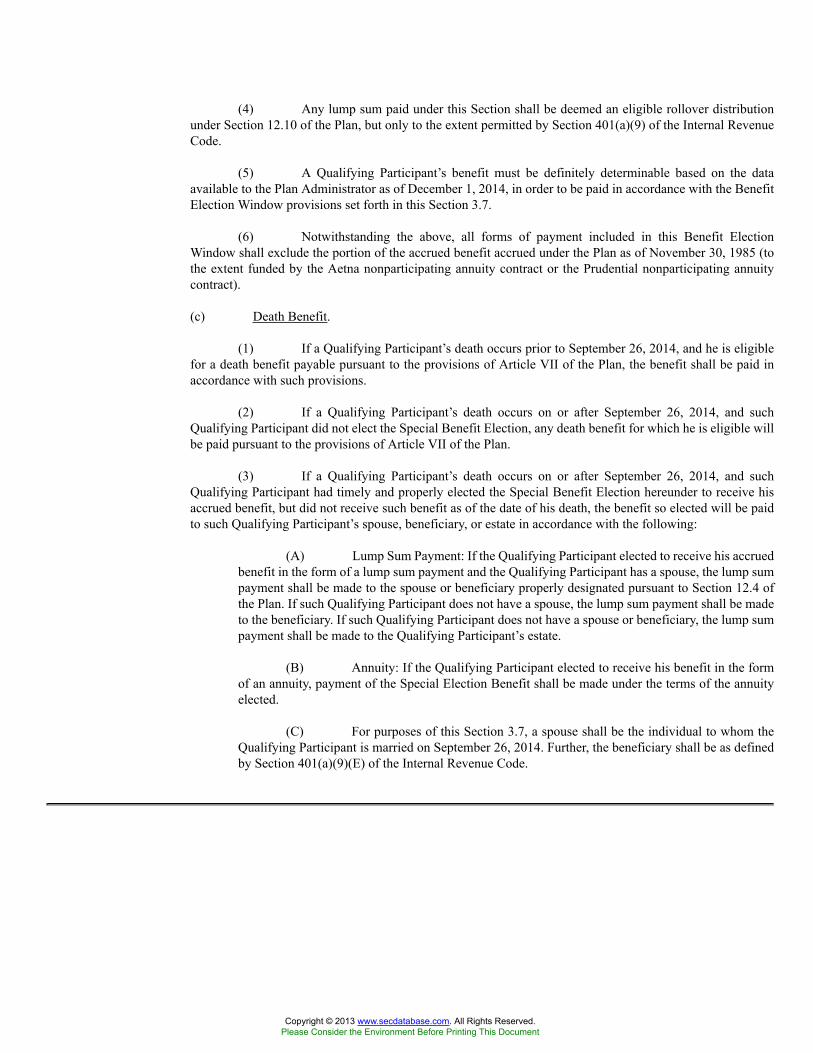
(4) Any lump sum paid under this Section shall be deemed an eligible rollover distributionunder Section 12.10 of the Plan, but only to the extent permitted by Section 401(a)(9) of the Internal RevenueCode.
(5) A Qualifying Participant’s benefit must be definitely determinable based on the dataavailable to the Plan Administrator as of December 1, 2014, in order to be paid in accordance with the BenefitElection Window provisions set forth in this Section 3.7.
(6) Notwithstanding the above, all forms of payment included in this Benefit ElectionWindow shall exclude the portion of the accrued benefit accrued under the Plan as of November 30, 1985 (tothe extent funded by the Aetna nonparticipating annuity contract or the Prudential nonparticipating annuitycontract).
(c) Death Benefit.
(1) If a Qualifying Participant’s death occurs prior to September 26, 2014, and he is eligiblefor a death benefit payable pursuant to the provisions of Article VII of the Plan, the benefit shall be paid inaccordance with such provisions.
(2) If a Qualifying Participant’s death occurs on or after September 26, 2014, and suchQualifying Participant did not elect the Special Benefit Election, any death benefit for which he is eligible willbe paid pursuant to the provisions of Article VII of the Plan.
(3) If a Qualifying Participant’s death occurs on or after September 26, 2014, and suchQualifying Participant had timely and properly elected the Special Benefit Election hereunder to receive hisaccrued benefit, but did not receive such benefit as of the date of his death, the benefit so elected will be paidto such Qualifying Participant’s spouse, beneficiary, or estate in accordance with the following:
(A) Lump Sum Payment: If the Qualifying Participant elected to receive his accruedbenefit in the form of a lump sum payment and the Qualifying Participant has a spouse, the lump sumpayment shall be made to the spouse or beneficiary properly designated pursuant to Section 12.4 ofthe Plan. If such Qualifying Participant does not have a spouse, the lump sum payment shall be madeto the beneficiary. If such Qualifying Participant does not have a spouse or beneficiary, the lump sumpayment shall be made to the Qualifying Participant’s estate.
(B) Annuity: If the Qualifying Participant elected to receive his benefit in the formof an annuity, payment of the Special Election Benefit shall be made under the terms of the annuityelected.
(C) For purposes of this Section 3.7, a spouse shall be the individual to whom theQualifying Participant is married on September 26, 2014. Further, the beneficiary shall be as definedby Section 401(a)(9)(E) of the Internal Revenue Code.
Copyright © 2013 www.secdatabase.com. All Rights Reserved.Please Consider the Environment Before Printing This Document
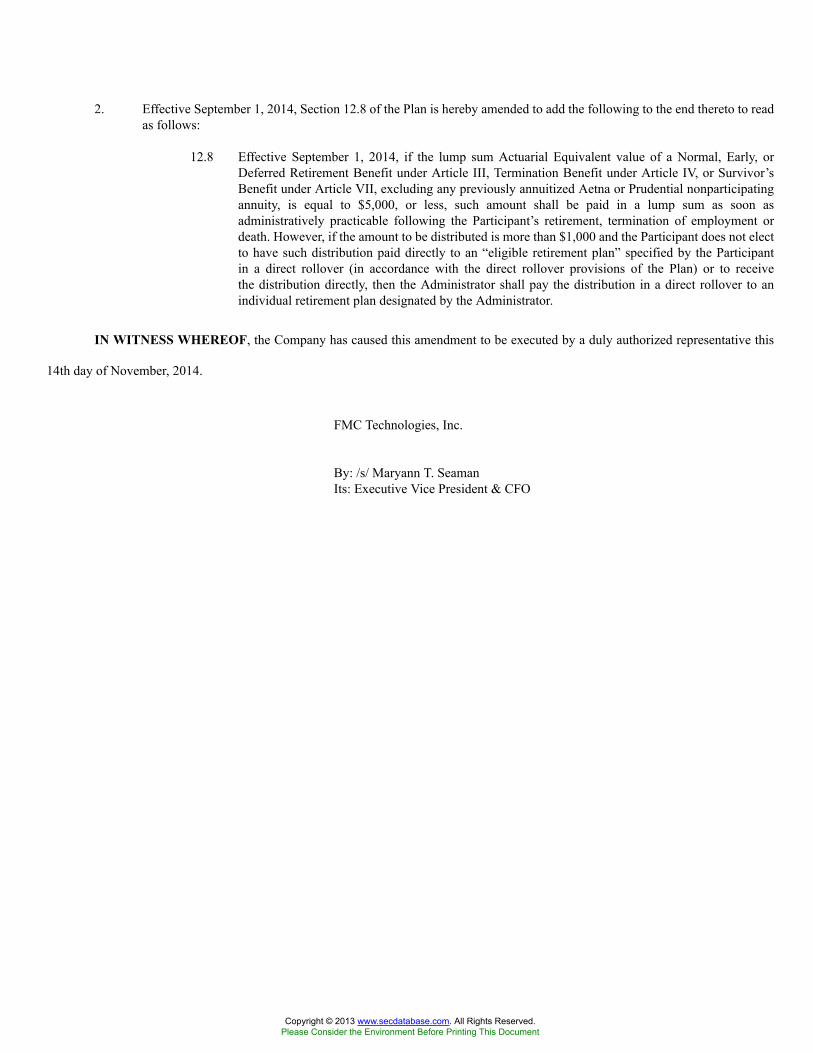
2. Effective September 1, 2014, Section 12.8 of the Plan is hereby amended to add the following to the end thereto to readas follows:
12.8 Effective September 1, 2014, if the lump sum Actuarial Equivalent value of a Normal, Early, orDeferred Retirement Benefit under Article III, Termination Benefit under Article IV, or Survivor’sBenefit under Article VII, excluding any previously annuitized Aetna or Prudential nonparticipatingannuity, is equal to $5,000, or less, such amount shall be paid in a lump sum as soon asadministratively practicable following the Participant’s retirement, termination of employment ordeath. However, if the amount to be distributed is more than $1,000 and the Participant does not electto have such distribution paid directly to an “eligible retirement plan” specified by the Participantin a direct rollover (in accordance with the direct rollover provisions of the Plan) or to receivethe distribution directly, then the Administrator shall pay the distribution in a direct rollover to anindividual retirement plan designated by the Administrator.
IN WITNESS WHEREOF, the Company has caused this amendment to be executed by a duly authorized representative this
14th day of November, 2014.
FMC Technologies, Inc.
By: /s/ Maryann T. SeamanIts: Executive Vice President & CFO
Copyright © 2013 www.secdatabase.com. All Rights Reserved.Please Consider the Environment Before Printing This Document
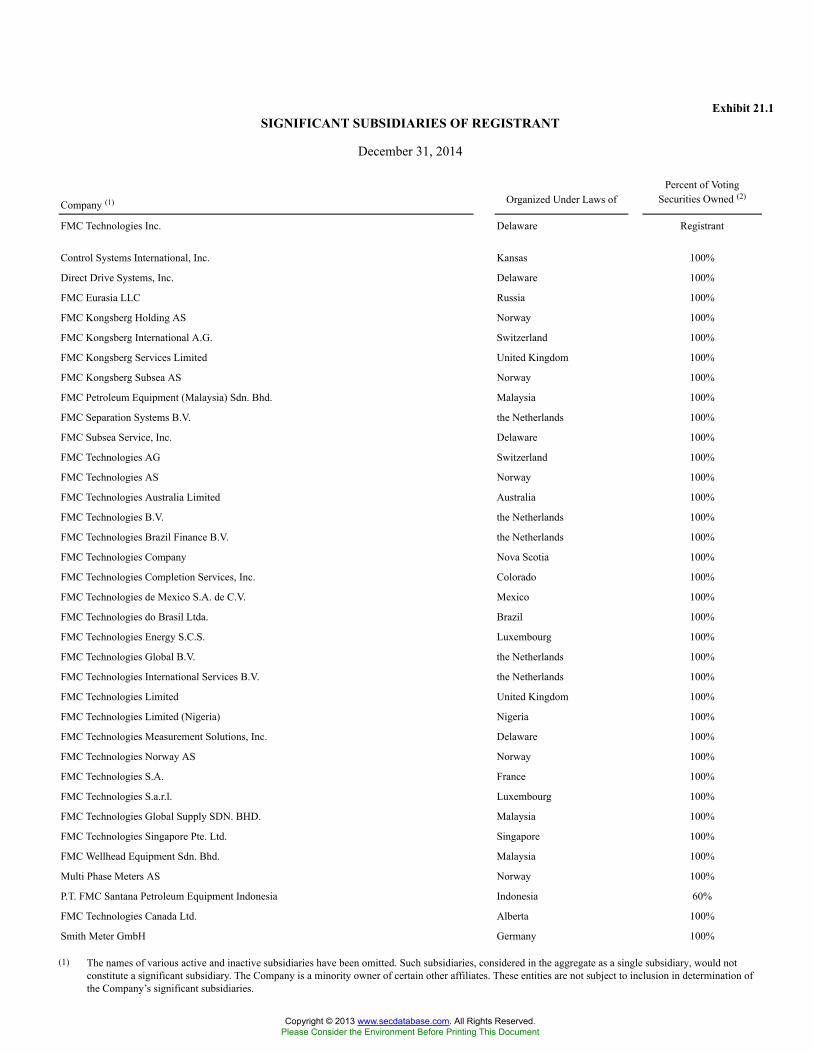
Exhibit 21.1SIGNIFICANT SUBSIDIARIES OF REGISTRANT
December 31, 2014
Company (1) Organized Under Laws ofPercent of Voting
Securities Owned (2)
FMC Technologies Inc. Delaware Registrant
Control Systems International, Inc. Kansas 100%
Direct Drive Systems, Inc. Delaware 100%
FMC Eurasia LLC Russia 100%
FMC Kongsberg Holding AS Norway 100%
FMC Kongsberg International A.G. Switzerland 100%
FMC Kongsberg Services Limited United Kingdom 100%
FMC Kongsberg Subsea AS Norway 100%
FMC Petroleum Equipment (Malaysia) Sdn. Bhd. Malaysia 100%
FMC Separation Systems B.V. the Netherlands 100%
FMC Subsea Service, Inc. Delaware 100%
FMC Technologies AG Switzerland 100%
FMC Technologies AS Norway 100%
FMC Technologies Australia Limited Australia 100%
FMC Technologies B.V. the Netherlands 100%
FMC Technologies Brazil Finance B.V. the Netherlands 100%
FMC Technologies Company Nova Scotia 100%
FMC Technologies Completion Services, Inc. Colorado 100%
FMC Technologies de Mexico S.A. de C.V. Mexico 100%
FMC Technologies do Brasil Ltda. Brazil 100%
FMC Technologies Energy S.C.S. Luxembourg 100%
FMC Technologies Global B.V. the Netherlands 100%
FMC Technologies International Services B.V. the Netherlands 100%
FMC Technologies Limited United Kingdom 100%
FMC Technologies Limited (Nigeria) Nigeria 100%
FMC Technologies Measurement Solutions, Inc. Delaware 100%
FMC Technologies Norway AS Norway 100%
FMC Technologies S.A. France 100%
FMC Technologies S.a.r.l. Luxembourg 100%
FMC Technologies Global Supply SDN. BHD. Malaysia 100%
FMC Technologies Singapore Pte. Ltd. Singapore 100%
FMC Wellhead Equipment Sdn. Bhd. Malaysia 100%
Multi Phase Meters AS Norway 100%
P.T. FMC Santana Petroleum Equipment Indonesia Indonesia 60%
FMC Technologies Canada Ltd. Alberta 100%
Smith Meter GmbH Germany 100%
(1) The names of various active and inactive subsidiaries have been omitted. Such subsidiaries, considered in the aggregate as a single subsidiary, would notconstitute a significant subsidiary. The Company is a minority owner of certain other affiliates. These entities are not subject to inclusion in determination ofthe Company’s significant subsidiaries.
Copyright © 2013 www.secdatabase.com. All Rights Reserved.Please Consider the Environment Before Printing This Document

(2) Percentages shown for indirect subsidiaries reflect the percentage of voting securities owned by the parent.
Copyright © 2013 www.secdatabase.com. All Rights Reserved.Please Consider the Environment Before Printing This Document
Exhibit 23.1
Consent of Independent Registered Public Accounting Firm
The Board of Directors and Stockholders of FMC Technologies, Inc.:
We consent to the incorporation by reference in the registration statements (Nos. 333-62996, 333-76210, 333-76214, and 333-76216) onForm S-8 and (No. 333-183953) on Form S-3 of FMC Technologies, Inc. of our reports dated February 20, 2015, with respect to theconsolidated balance sheets of FMC Technologies, Inc. as of December 31, 2014 and 2013, and the related consolidated statements ofincome, comprehensive income, cash flows, and changes in stockholders’ equity for each of the years in the three-year period endedDecember 31, 2014, and the related financial statement schedule (Schedule II) for each of the years in the three-year period endedDecember 31, 2014, and the effectiveness of internal control over financial reporting as of December 31, 2014, which reports appear inthe December 31, 2014 annual report on Form 10-K of FMC Technologies, Inc.
/s/ KPMG LLP
Houston, TexasFebruary 20, 2015
Copyright © 2013 www.secdatabase.com. All Rights Reserved.Please Consider the Environment Before Printing This Document
Exhibit 31.1CERTIFICATION OF CHIEF EXECUTIVE OFFICER
PURSUANT TO RULE 13A-14(A) AND RULE 15D-14(A)OF THE SECURITIES EXCHANGE ACT OF 1934, AS AMENDED
I, John T. Gremp, certify that:
1. I have reviewed this annual report on Form 10-K of FMC Technologies, Inc. (the “registrant”);
2. Based on my knowledge, this report does not contain any untrue statement of a material fact or omit to state a material fact necessary to makethe statements made, in light of the circumstances under which such statements were made, not misleading with respect to the period coveredby this report;
3. Based on my knowledge, the financial statements, and other financial information included in this report, fairly present in all materialrespects the financial condition, results of operations and cash flows of the registrant as of, and for, the periods presented in this report;
4. The registrant’s other certifying officer and I are responsible for establishing and maintaining disclosure controls and procedures (as definedin Exchange Act Rules 13a-15(e) and 15d-15(e)) and internal control over financial reporting (as defined in Exchange Act Rules 13a-15(f)and 15d-15(f)) for the registrant and have:
(a) Designed such disclosure controls and procedures, or caused such disclosure controls and procedures to be designed under oursupervision, to ensure that material information relating to the registrant, including its consolidated subsidiaries, is made known tous by others within those entities, particularly during the period in which this report is being prepared;
(b) Designed such internal control over financial reporting, or caused such internal control over financial reporting to be designed underour supervision, to provide reasonable assurance regarding the reliability of financial reporting and the preparation of financialstatements for external purposes in accordance with generally accepted accounting principles;
(c) Evaluated the effectiveness of the registrant’s disclosure controls and procedures and presented in this report our conclusions aboutthe effectiveness of the disclosure controls and procedures, as of the end of the period covered by this report based on suchevaluation; and
(d) Disclosed in this report any change in the registrant’s internal control over financial reporting that occurred during the registrant’smost recent fiscal quarter (the registrant’s fourth fiscal quarter in the case of an annual report) that has materially affected, or isreasonably likely to materially affect, the registrant’s internal control over financial reporting; and
5. The registrant’s other certifying officer and I have disclosed, based on our most recent evaluation of internal control over financial reporting,to the registrant’s auditors and the audit committee of the registrant’s board of directors (or persons performing the equivalent functions):
(a) All significant deficiencies and material weaknesses in the design or operation of internal control over financial reporting which arereasonably likely to adversely affect the registrant’s ability to record, process, summarize and report financial information; and
(b) Any fraud, whether or not material, that involves management or other employees who have a significant role in the registrant’sinternal control over financial reporting.
Date: February 20, 2015
/s/ JOHN T. GREMP
John T. Gremp
Chairman, President and Chief Executive Officer
(Principal Executive Officer)
Copyright © 2013 www.secdatabase.com. All Rights Reserved.Please Consider the Environment Before Printing This Document

Exhibit 31.2CERTIFICATION OF CHIEF FINANCIAL OFFICER
PURSUANT TO RULE 13A-14(A) AND RULE 15D-14(A)OF THE SECURITIES EXCHANGE ACT OF 1934, AS AMENDED
I, Maryann T. Seaman, certify that:
1. I have reviewed this annual report on Form 10-K of FMC Technologies, Inc. (the “registrant”);
2. Based on my knowledge, this report does not contain any untrue statement of a material fact or omit to state a material fact necessary to makethe statements made, in light of the circumstances under which such statements were made, not misleading with respect to the period coveredby this report;
3. Based on my knowledge, the financial statements, and other financial information included in this report, fairly present in all materialrespects the financial condition, results of operations and cash flows of the registrant as of, and for, the periods presented in this report;
4. The registrant’s other certifying officer and I are responsible for establishing and maintaining disclosure controls and procedures (as definedin Exchange Act Rules 13a-15(e) and 15d-15(e)) and internal control over financial reporting (as defined in Exchange Act Rules 13a-15(f)and 15d-15(f)) for the registrant and have:
(a) Designed such disclosure controls and procedures, or caused such disclosure controls and procedures to be designed under oursupervision, to ensure that material information relating to the registrant, including its consolidated subsidiaries, is made known tous by others within those entities, particularly during the period in which this report is being prepared;
(b) Designed such internal control over financial reporting, or caused such internal control over financial reporting to be designed underour supervision, to provide reasonable assurance regarding the reliability of financial reporting and the preparation of financialstatements for external purposes in accordance with generally accepted accounting principles;
(c) Evaluated the effectiveness of the registrant’s disclosure controls and procedures and presented in this report our conclusions aboutthe effectiveness of the disclosure controls and procedures, as of the end of the period covered by this report based on suchevaluation; and
(d) Disclosed in this report any change in the registrant’s internal control over financial reporting that occurred during the registrant’smost recent fiscal quarter (the registrant’s fourth fiscal quarter in the case of an annual report) that has materially affected, or isreasonably likely to materially affect, the registrant’s internal control over financial reporting; and
5. The registrant’s other certifying officer and I have disclosed, based on our most recent evaluation of internal control over financial reporting,to the registrant’s auditors and the audit committee of the registrant’s board of directors (or persons performing the equivalent functions):
(a) All significant deficiencies and material weaknesses in the design or operation of internal control over financial reporting which arereasonably likely to adversely affect the registrant’s ability to record, process, summarize and report financial information; and
(b) Any fraud, whether or not material, that involves management or other employees who have a significant role in the registrant’sinternal control over financial reporting.
Date: February 20, 2015
/s/ MARYANN T. SEAMAN
Maryann T. Seaman
Executive Vice President and Chief Financial Officer
(Principal Financial Officer)
Copyright © 2013 www.secdatabase.com. All Rights Reserved.Please Consider the Environment Before Printing This Document

Exhibit 32.1CERTIFICATION OF CHIEF EXECUTIVE OFFICERUNDER SECTION 906 OF THE SARBANES-OXLEY
ACT OF 2002, 18 U.S.C. 1350
I, John T. Gremp, Chairman, President and Chief Executive Officer of FMC Technologies, Inc. (the “Company”), do hereby certify, pursuant to 18U.S.C. 1350, as adopted pursuant to Section 906 of the Sarbanes-Oxley Act of 2002, that, to my knowledge:
(a) The Annual Report on Form 10-K of the Company for the year ended December 31, 2014, as filed with the Securities and Exchange Commission(the “Report”), fully complies with the requirements of Section 13(a) or 15(d) of the Securities Exchange Act of 1934, as amended; and
(b) The information contained in the Report fairly presents, in all material respects, the financial condition and results of operations of the Company.
Date: February 20, 2015
/s/ JOHN T. GREMP
John T. Gremp
Chairman, President and Chief Executive Officer
(Principal Executive Officer)
Copyright © 2013 www.secdatabase.com. All Rights Reserved.Please Consider the Environment Before Printing This Document

Exhibit 32.2CERTIFICATION OF CHIEF FINANCIAL OFFICERUNDER SECTION 906 OF THE SARBANES-OXLEY
ACT OF 2002, 18 U.S.C. 1350
I, Maryann T. Seaman, Executive Vice President and Chief Financial Officer of FMC Technologies, Inc. (the “Company”), do hereby certify, pursuantto 18 U.S.C. 1350, as adopted pursuant to Section 906 of the Sarbanes-Oxley Act of 2002, that, to my knowledge:
(a) The Annual Report on Form 10-K of the Company for the year ended December 31, 2014, as filed with the Securities and Exchange Commission(the “Report”), fully complies with the requirements of Section 13(a) or 15(d) of the Securities Exchange Act of 1934, as amended; and
(b) The information contained in the Report fairly presents, in all material respects, the financial condition and results of operations of the Company.
Date: February 20, 2015
/s/ MARYANN T. SEAMAN
Maryann T. Seaman
Executive Vice President and Chief Financial Officer
(Principal Financial Officer)
Copyright © 2013 www.secdatabase.com. All Rights Reserved.Please Consider the Environment Before Printing This Document
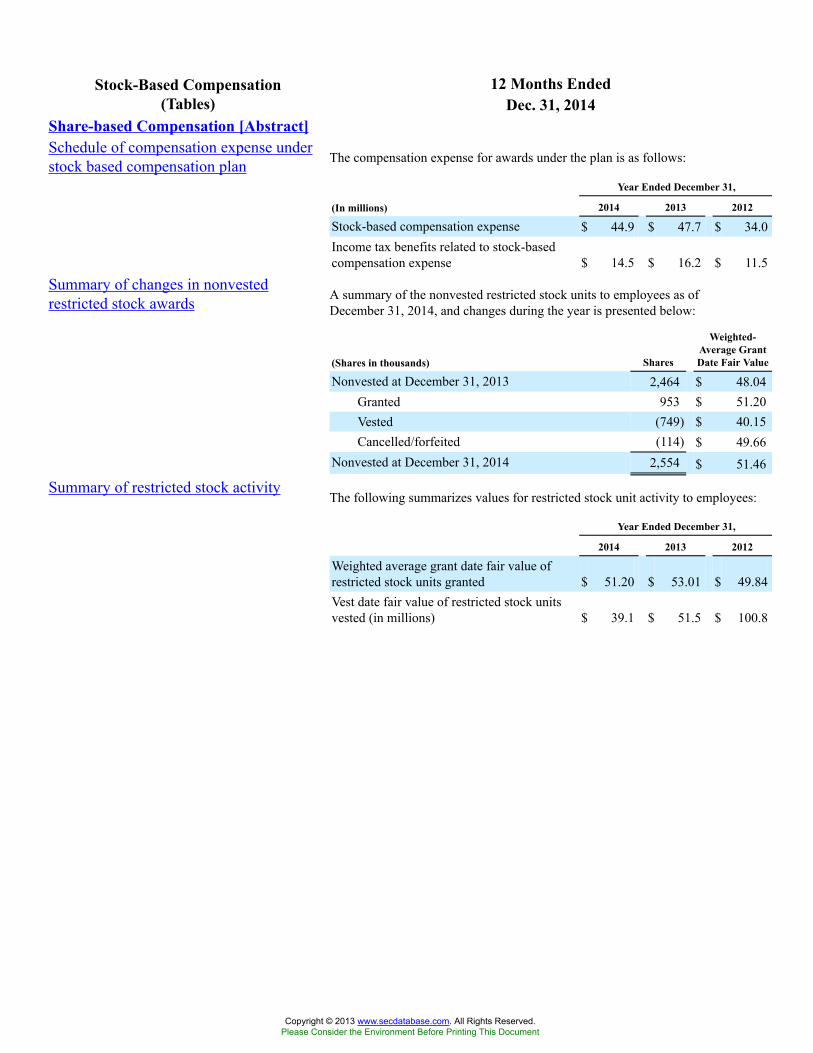
12 Months EndedStock-Based Compensation(Tables) Dec. 31, 2014
Share-based Compensation [Abstract]Schedule of compensation expense understock based compensation plan The compensation expense for awards under the plan is as follows:
Year Ended December 31,
(In millions) 2014 2013 2012
Stock-based compensation expense $ 44.9 $ 47.7 $ 34.0Income tax benefits related to stock-basedcompensation expense $ 14.5 $ 16.2 $ 11.5
Summary of changes in nonvestedrestricted stock awards A summary of the nonvested restricted stock units to employees as of
December 31, 2014, and changes during the year is presented below:
(Shares in thousands) Shares
Weighted-Average GrantDate Fair Value
Nonvested at December 31, 2013 2,464 $ 48.04Granted 953 $ 51.20Vested (749) $ 40.15Cancelled/forfeited (114) $ 49.66
Nonvested at December 31, 2014 2,554 $ 51.46
Summary of restricted stock activityThe following summarizes values for restricted stock unit activity to employees:
Year Ended December 31,
2014 2013 2012
Weighted average grant date fair value ofrestricted stock units granted $ 51.20 $ 53.01 $ 49.84Vest date fair value of restricted stock unitsvested (in millions) $ 39.1 $ 51.5 $ 100.8
Copyright © 2013 www.secdatabase.com. All Rights Reserved.Please Consider the Environment Before Printing This Document
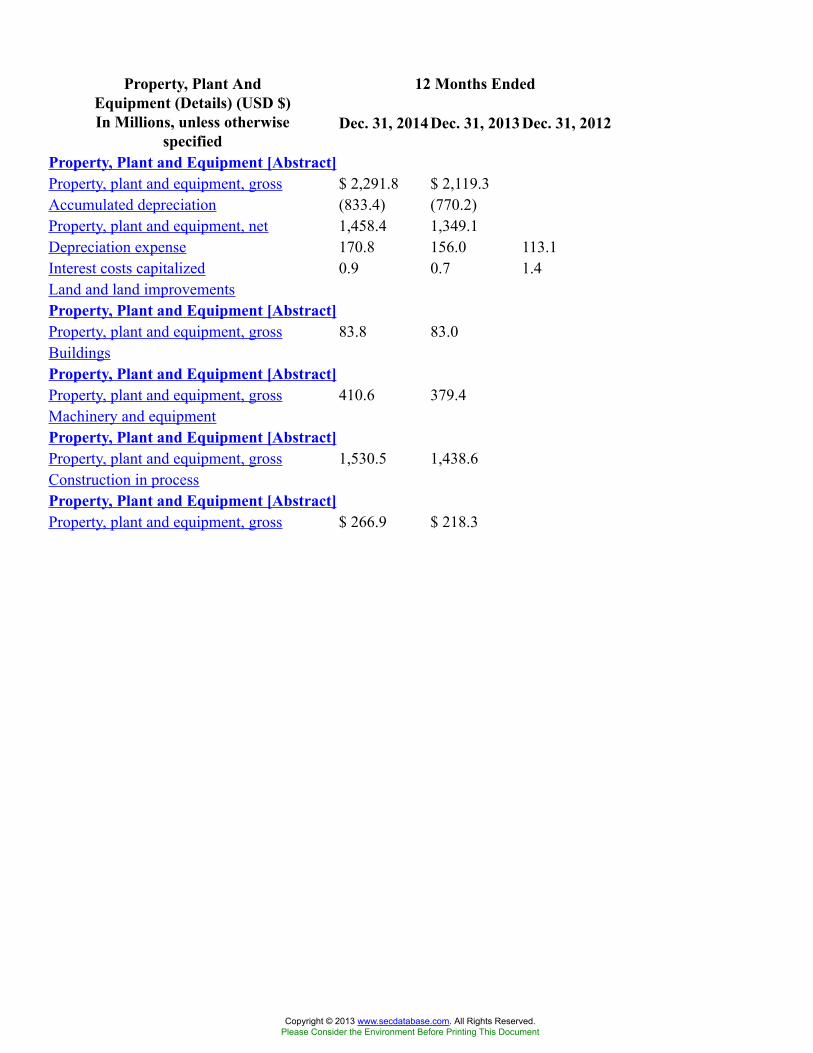
12 Months EndedProperty, Plant AndEquipment (Details) (USD $)In Millions, unless otherwise
specifiedDec. 31, 2014 Dec. 31, 2013 Dec. 31, 2012
Property, Plant and Equipment [Abstract]Property, plant and equipment, gross $ 2,291.8 $ 2,119.3Accumulated depreciation (833.4) (770.2)Property, plant and equipment, net 1,458.4 1,349.1Depreciation expense 170.8 156.0 113.1Interest costs capitalized 0.9 0.7 1.4Land and land improvementsProperty, Plant and Equipment [Abstract]Property, plant and equipment, gross 83.8 83.0BuildingsProperty, Plant and Equipment [Abstract]Property, plant and equipment, gross 410.6 379.4Machinery and equipmentProperty, Plant and Equipment [Abstract]Property, plant and equipment, gross 1,530.5 1,438.6Construction in processProperty, Plant and Equipment [Abstract]Property, plant and equipment, gross $ 266.9 $ 218.3
Copyright © 2013 www.secdatabase.com. All Rights Reserved.Please Consider the Environment Before Printing This Document
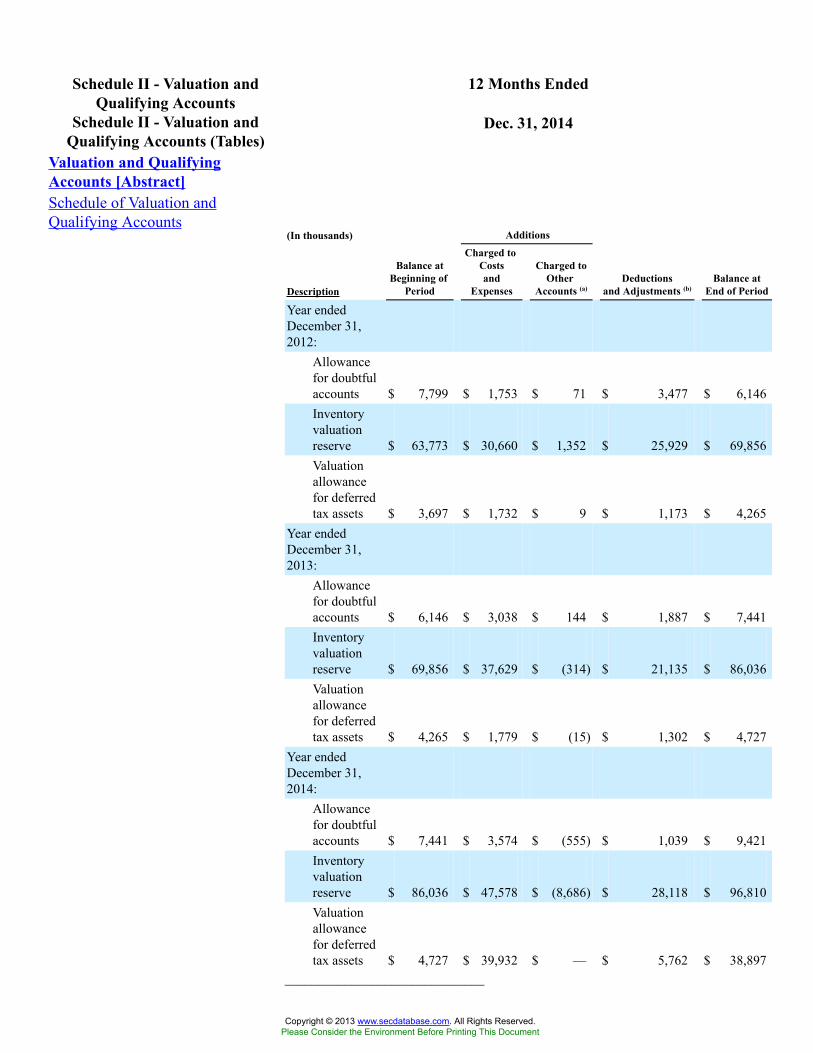
12 Months EndedSchedule II - Valuation andQualifying Accounts
Schedule II - Valuation andQualifying Accounts (Tables)
Dec. 31, 2014
Valuation and QualifyingAccounts [Abstract]Schedule of Valuation andQualifying Accounts
(In thousands) Additions
Description
Balance atBeginning of
Period
Charged toCostsand
Expenses
Charged toOther
Accounts (a)Deductions
and Adjustments (b)Balance at
End of Period
Year endedDecember 31,2012:
Allowancefor doubtfulaccounts $ 7,799 $ 1,753 $ 71 $ 3,477 $ 6,146Inventoryvaluationreserve $ 63,773 $ 30,660 $ 1,352 $ 25,929 $ 69,856Valuationallowancefor deferredtax assets $ 3,697 $ 1,732 $ 9 $ 1,173 $ 4,265
Year endedDecember 31,2013:
Allowancefor doubtfulaccounts $ 6,146 $ 3,038 $ 144 $ 1,887 $ 7,441Inventoryvaluationreserve $ 69,856 $ 37,629 $ (314) $ 21,135 $ 86,036Valuationallowancefor deferredtax assets $ 4,265 $ 1,779 $ (15) $ 1,302 $ 4,727
Year endedDecember 31,2014:
Allowancefor doubtfulaccounts $ 7,441 $ 3,574 $ (555) $ 1,039 $ 9,421Inventoryvaluationreserve $ 86,036 $ 47,578 $ (8,686) $ 28,118 $ 96,810Valuationallowancefor deferredtax assets $ 4,727 $ 39,932 $ — $ 5,762 $ 38,897
______________________________
Copyright © 2013 www.secdatabase.com. All Rights Reserved.Please Consider the Environment Before Printing This Document

(a) “Additions charged to other accounts” includes translation adjustments and allowancesacquired through business combinations.
(b) “Deductions and adjustments” includes write-offs, net of recoveries, and reductions in theallowances credited to expense.
Copyright © 2013 www.secdatabase.com. All Rights Reserved.Please Consider the Environment Before Printing This Document
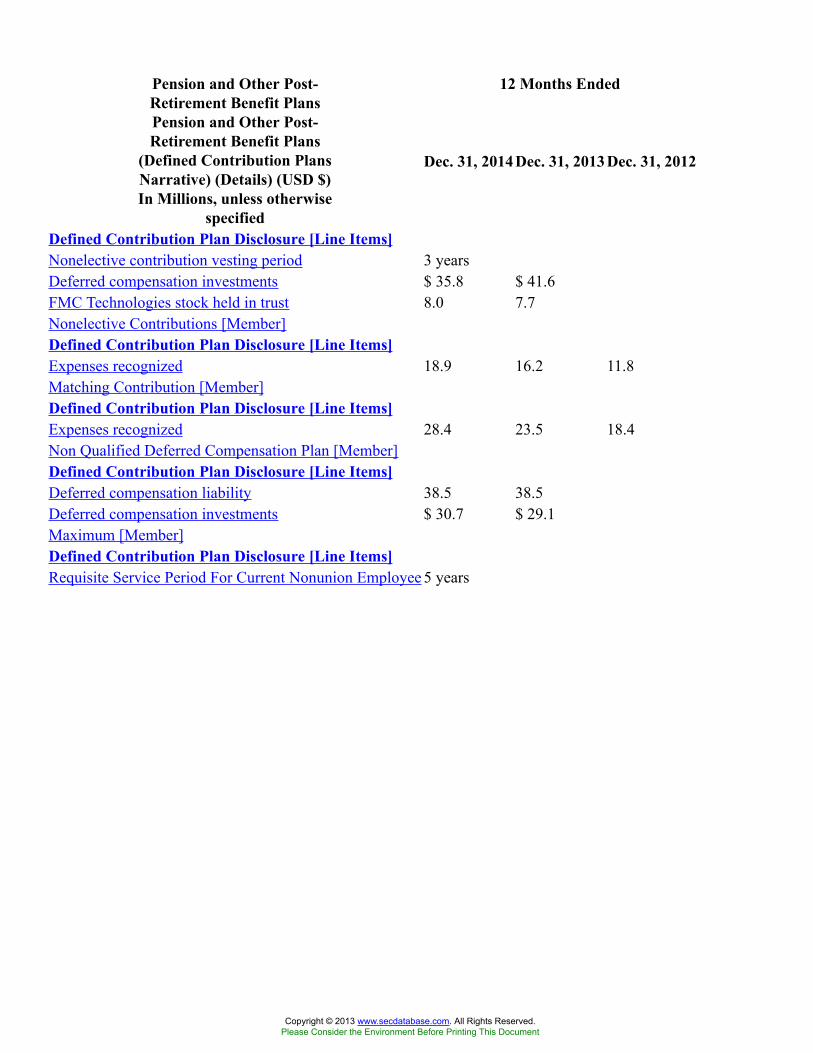
12 Months EndedPension and Other Post-Retirement Benefit PlansPension and Other Post-Retirement Benefit Plans
(Defined Contribution PlansNarrative) (Details) (USD $)In Millions, unless otherwise
specified
Dec. 31, 2014 Dec. 31, 2013 Dec. 31, 2012
Defined Contribution Plan Disclosure [Line Items]Nonelective contribution vesting period 3 yearsDeferred compensation investments $ 35.8 $ 41.6FMC Technologies stock held in trust 8.0 7.7Nonelective Contributions [Member]Defined Contribution Plan Disclosure [Line Items]Expenses recognized 18.9 16.2 11.8Matching Contribution [Member]Defined Contribution Plan Disclosure [Line Items]Expenses recognized 28.4 23.5 18.4Non Qualified Deferred Compensation Plan [Member]Defined Contribution Plan Disclosure [Line Items]Deferred compensation liability 38.5 38.5Deferred compensation investments $ 30.7 $ 29.1Maximum [Member]Defined Contribution Plan Disclosure [Line Items]Requisite Service Period For Current Nonunion Employee 5 years
Copyright © 2013 www.secdatabase.com. All Rights Reserved.Please Consider the Environment Before Printing This Document
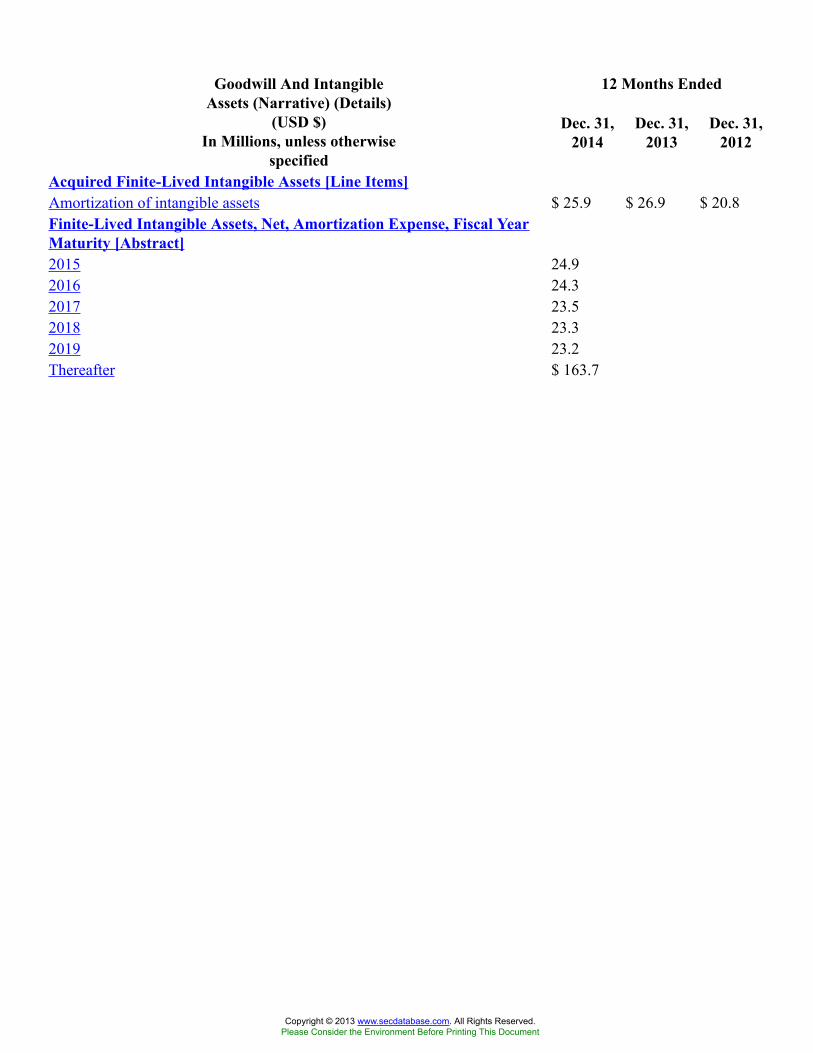
12 Months EndedGoodwill And IntangibleAssets (Narrative) (Details)
(USD $)In Millions, unless otherwise
specified
Dec. 31,2014
Dec. 31,2013
Dec. 31,2012
Acquired Finite-Lived Intangible Assets [Line Items]Amortization of intangible assets $ 25.9 $ 26.9 $ 20.8Finite-Lived Intangible Assets, Net, Amortization Expense, Fiscal YearMaturity [Abstract]2015 24.92016 24.32017 23.52018 23.32019 23.2Thereafter $ 163.7
Copyright © 2013 www.secdatabase.com. All Rights Reserved.Please Consider the Environment Before Printing This Document
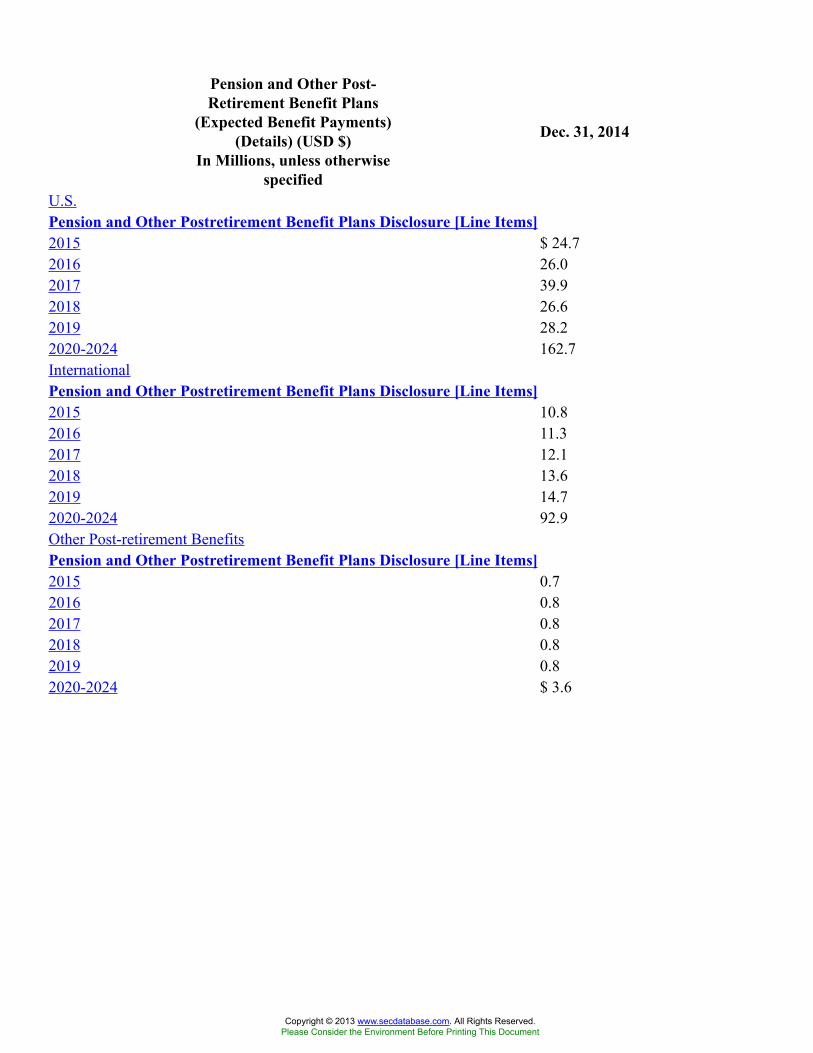
Pension and Other Post-Retirement Benefit Plans
(Expected Benefit Payments)(Details) (USD $)
In Millions, unless otherwisespecified
Dec. 31, 2014
U.S.Pension and Other Postretirement Benefit Plans Disclosure [Line Items]2015 $ 24.72016 26.02017 39.92018 26.62019 28.22020-2024 162.7InternationalPension and Other Postretirement Benefit Plans Disclosure [Line Items]2015 10.82016 11.32017 12.12018 13.62019 14.72020-2024 92.9Other Post-retirement BenefitsPension and Other Postretirement Benefit Plans Disclosure [Line Items]2015 0.72016 0.82017 0.82018 0.82019 0.82020-2024 $ 3.6
Copyright © 2013 www.secdatabase.com. All Rights Reserved.Please Consider the Environment Before Printing This Document
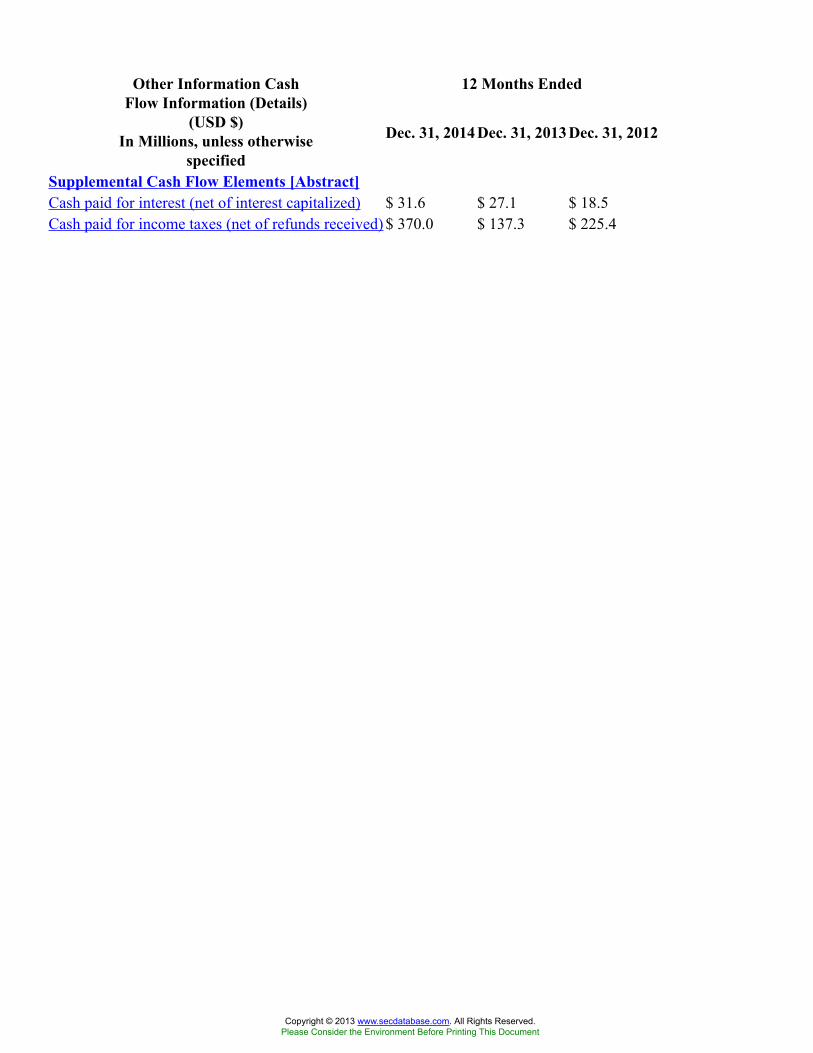
12 Months EndedOther Information CashFlow Information (Details)
(USD $)In Millions, unless otherwise
specified
Dec. 31, 2014 Dec. 31, 2013 Dec. 31, 2012
Supplemental Cash Flow Elements [Abstract]Cash paid for interest (net of interest capitalized) $ 31.6 $ 27.1 $ 18.5Cash paid for income taxes (net of refunds received) $ 370.0 $ 137.3 $ 225.4
Copyright © 2013 www.secdatabase.com. All Rights Reserved.Please Consider the Environment Before Printing This Document
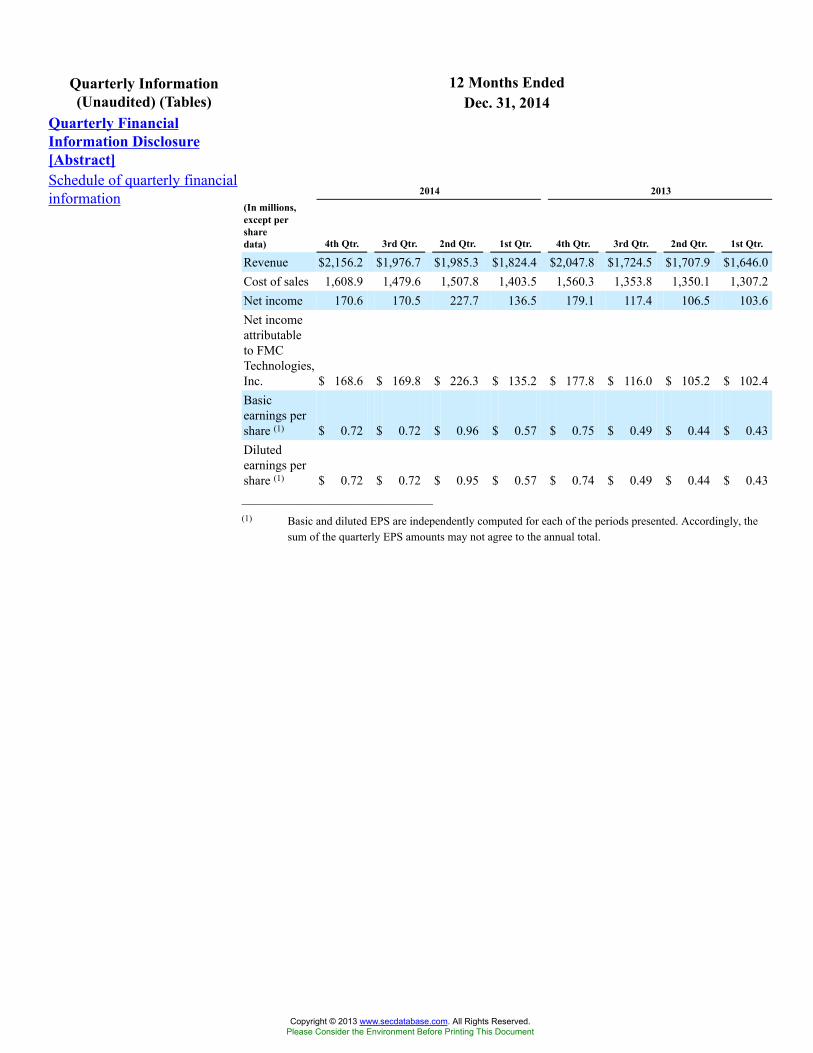
12 Months EndedQuarterly Information(Unaudited) (Tables) Dec. 31, 2014
Quarterly FinancialInformation Disclosure[Abstract]Schedule of quarterly financialinformation 2014 2013
(In millions,except persharedata) 4th Qtr. 3rd Qtr. 2nd Qtr. 1st Qtr. 4th Qtr. 3rd Qtr. 2nd Qtr. 1st Qtr.
Revenue $2,156.2 $1,976.7 $1,985.3 $1,824.4 $2,047.8 $1,724.5 $1,707.9 $1,646.0Cost of sales 1,608.9 1,479.6 1,507.8 1,403.5 1,560.3 1,353.8 1,350.1 1,307.2Net income 170.6 170.5 227.7 136.5 179.1 117.4 106.5 103.6Net incomeattributableto FMCTechnologies,Inc. $ 168.6 $ 169.8 $ 226.3 $ 135.2 $ 177.8 $ 116.0 $ 105.2 $ 102.4Basicearnings pershare (1) $ 0.72 $ 0.72 $ 0.96 $ 0.57 $ 0.75 $ 0.49 $ 0.44 $ 0.43Dilutedearnings pershare (1) $ 0.72 $ 0.72 $ 0.95 $ 0.57 $ 0.74 $ 0.49 $ 0.44 $ 0.43______________________________(1) Basic and diluted EPS are independently computed for each of the periods presented. Accordingly, the
sum of the quarterly EPS amounts may not agree to the annual total.
Copyright © 2013 www.secdatabase.com. All Rights Reserved.Please Consider the Environment Before Printing This Document
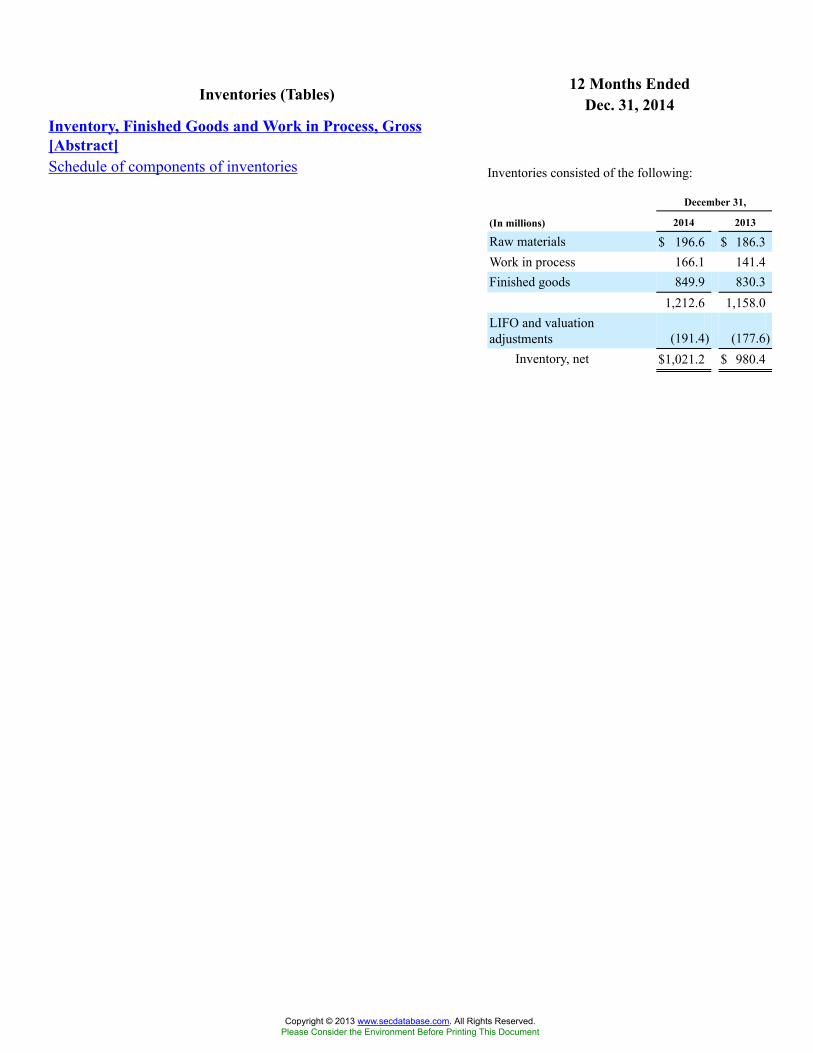
12 Months EndedInventories (Tables) Dec. 31, 2014Inventory, Finished Goods and Work in Process, Gross[Abstract]Schedule of components of inventories Inventories consisted of the following:
December 31,
(In millions) 2014 2013
Raw materials $ 196.6 $ 186.3Work in process 166.1 141.4Finished goods 849.9 830.3
1,212.6 1,158.0LIFO and valuationadjustments (191.4) (177.6)
Inventory, net $1,021.2 $ 980.4
Copyright © 2013 www.secdatabase.com. All Rights Reserved.Please Consider the Environment Before Printing This Document
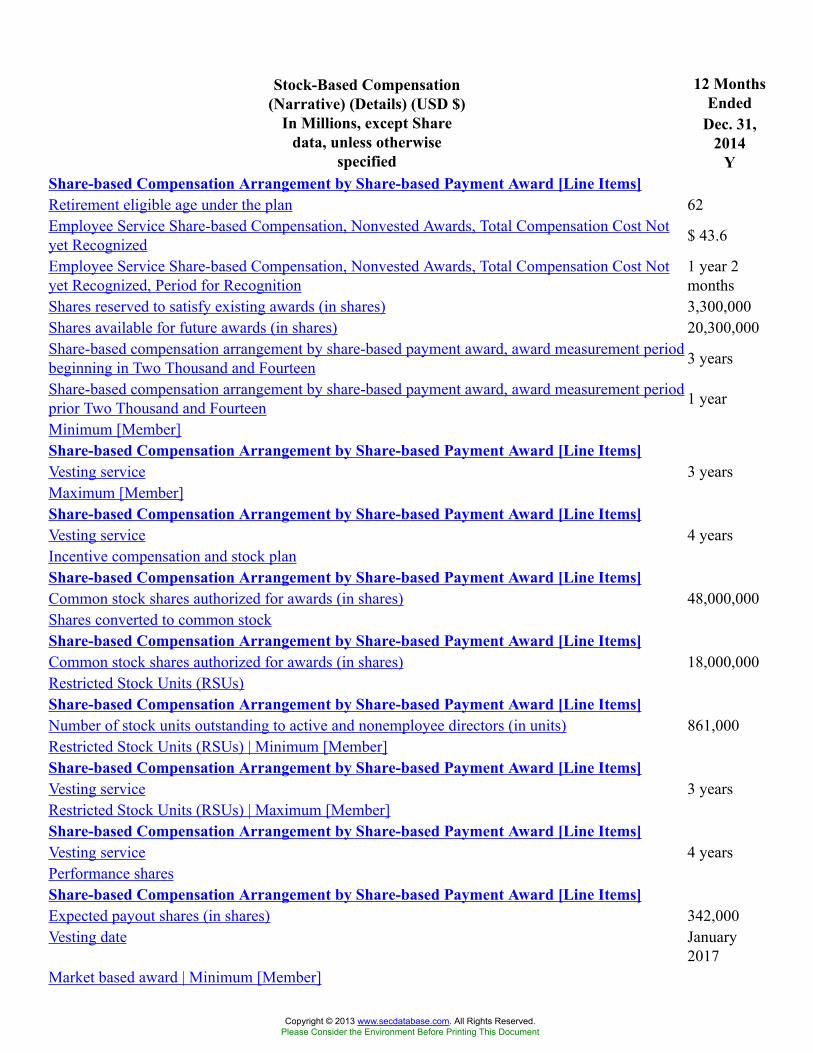
12 MonthsEnded
Stock-Based Compensation(Narrative) (Details) (USD $)
In Millions, except Sharedata, unless otherwise
specified
Dec. 31,2014
YShare-based Compensation Arrangement by Share-based Payment Award [Line Items]Retirement eligible age under the plan 62Employee Service Share-based Compensation, Nonvested Awards, Total Compensation Cost Notyet Recognized $ 43.6
Employee Service Share-based Compensation, Nonvested Awards, Total Compensation Cost Notyet Recognized, Period for Recognition
1 year 2months
Shares reserved to satisfy existing awards (in shares) 3,300,000Shares available for future awards (in shares) 20,300,000Share-based compensation arrangement by share-based payment award, award measurement periodbeginning in Two Thousand and Fourteen 3 years
Share-based compensation arrangement by share-based payment award, award measurement periodprior Two Thousand and Fourteen 1 year
Minimum [Member]Share-based Compensation Arrangement by Share-based Payment Award [Line Items]Vesting service 3 yearsMaximum [Member]Share-based Compensation Arrangement by Share-based Payment Award [Line Items]Vesting service 4 yearsIncentive compensation and stock planShare-based Compensation Arrangement by Share-based Payment Award [Line Items]Common stock shares authorized for awards (in shares) 48,000,000Shares converted to common stockShare-based Compensation Arrangement by Share-based Payment Award [Line Items]Common stock shares authorized for awards (in shares) 18,000,000Restricted Stock Units (RSUs)Share-based Compensation Arrangement by Share-based Payment Award [Line Items]Number of stock units outstanding to active and nonemployee directors (in units) 861,000Restricted Stock Units (RSUs) | Minimum [Member]Share-based Compensation Arrangement by Share-based Payment Award [Line Items]Vesting service 3 yearsRestricted Stock Units (RSUs) | Maximum [Member]Share-based Compensation Arrangement by Share-based Payment Award [Line Items]Vesting service 4 yearsPerformance sharesShare-based Compensation Arrangement by Share-based Payment Award [Line Items]Expected payout shares (in shares) 342,000Vesting date January
2017Market based award | Minimum [Member]
Copyright © 2013 www.secdatabase.com. All Rights Reserved.Please Consider the Environment Before Printing This Document
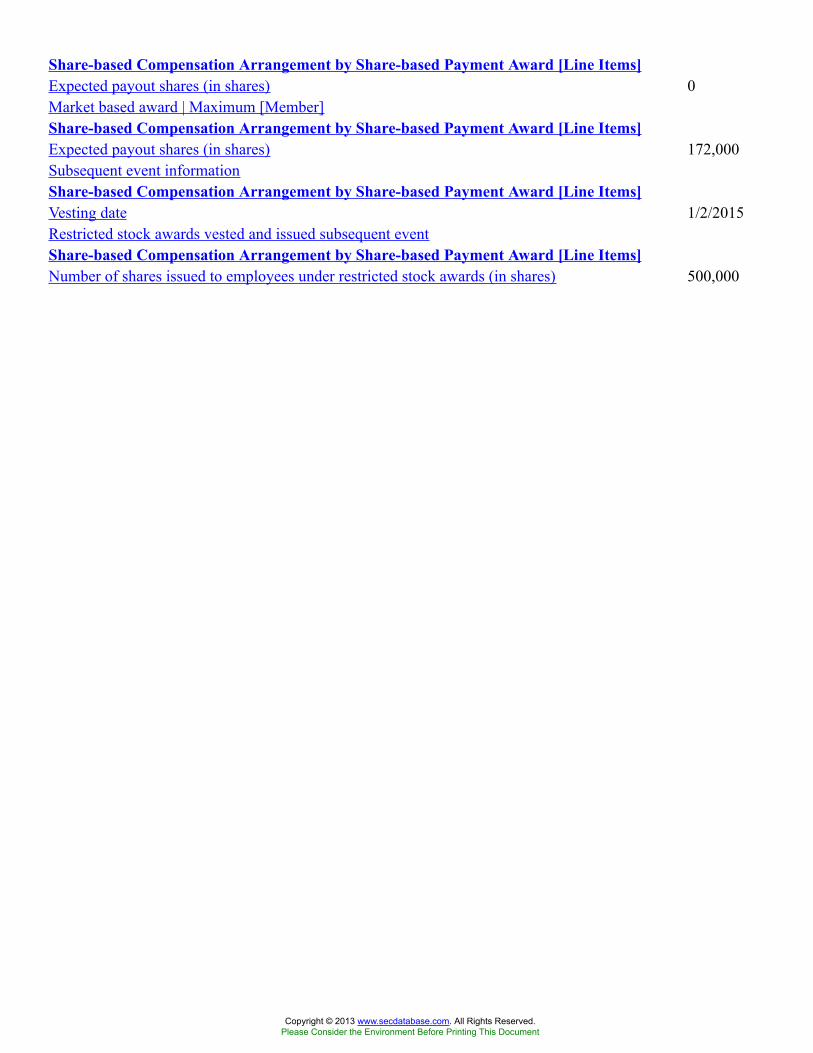
Share-based Compensation Arrangement by Share-based Payment Award [Line Items]Expected payout shares (in shares) 0Market based award | Maximum [Member]Share-based Compensation Arrangement by Share-based Payment Award [Line Items]Expected payout shares (in shares) 172,000Subsequent event informationShare-based Compensation Arrangement by Share-based Payment Award [Line Items]Vesting date 1/2/2015Restricted stock awards vested and issued subsequent eventShare-based Compensation Arrangement by Share-based Payment Award [Line Items]Number of shares issued to employees under restricted stock awards (in shares) 500,000
Copyright © 2013 www.secdatabase.com. All Rights Reserved.Please Consider the Environment Before Printing This Document
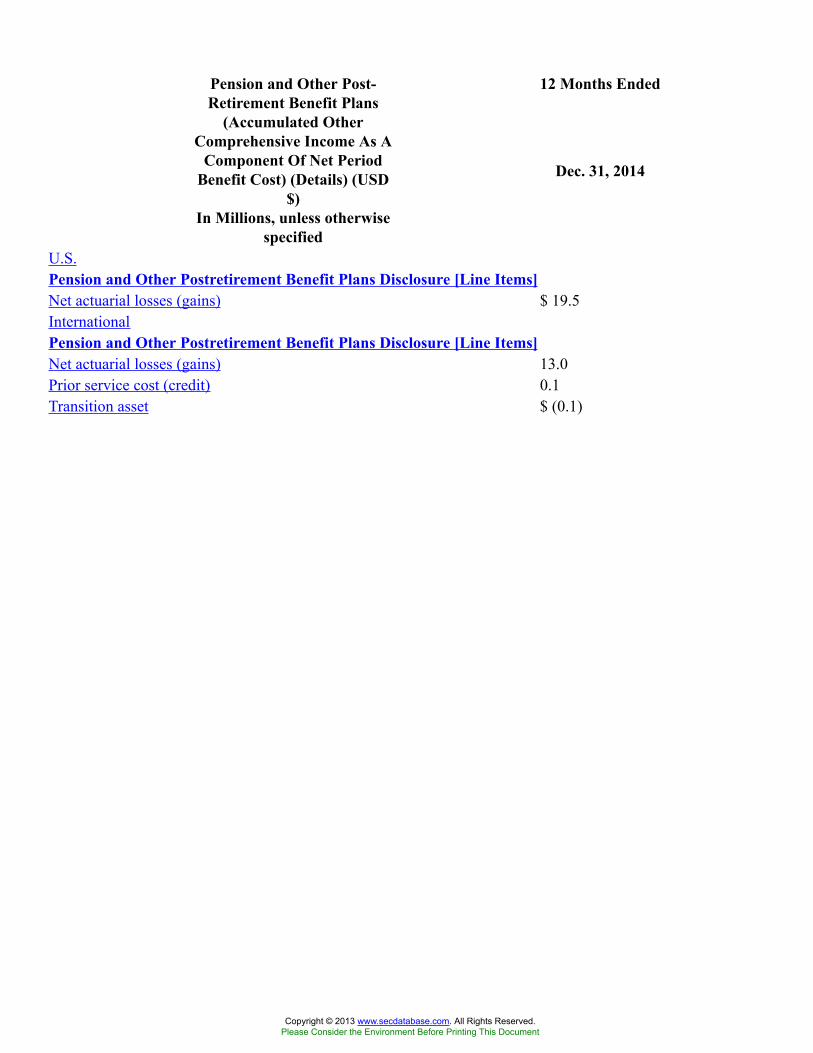
12 Months EndedPension and Other Post-Retirement Benefit Plans
(Accumulated OtherComprehensive Income As A
Component Of Net PeriodBenefit Cost) (Details) (USD
$)In Millions, unless otherwise
specified
Dec. 31, 2014
U.S.Pension and Other Postretirement Benefit Plans Disclosure [Line Items]Net actuarial losses (gains) $ 19.5InternationalPension and Other Postretirement Benefit Plans Disclosure [Line Items]Net actuarial losses (gains) 13.0Prior service cost (credit) 0.1Transition asset $ (0.1)
Copyright © 2013 www.secdatabase.com. All Rights Reserved.Please Consider the Environment Before Printing This Document
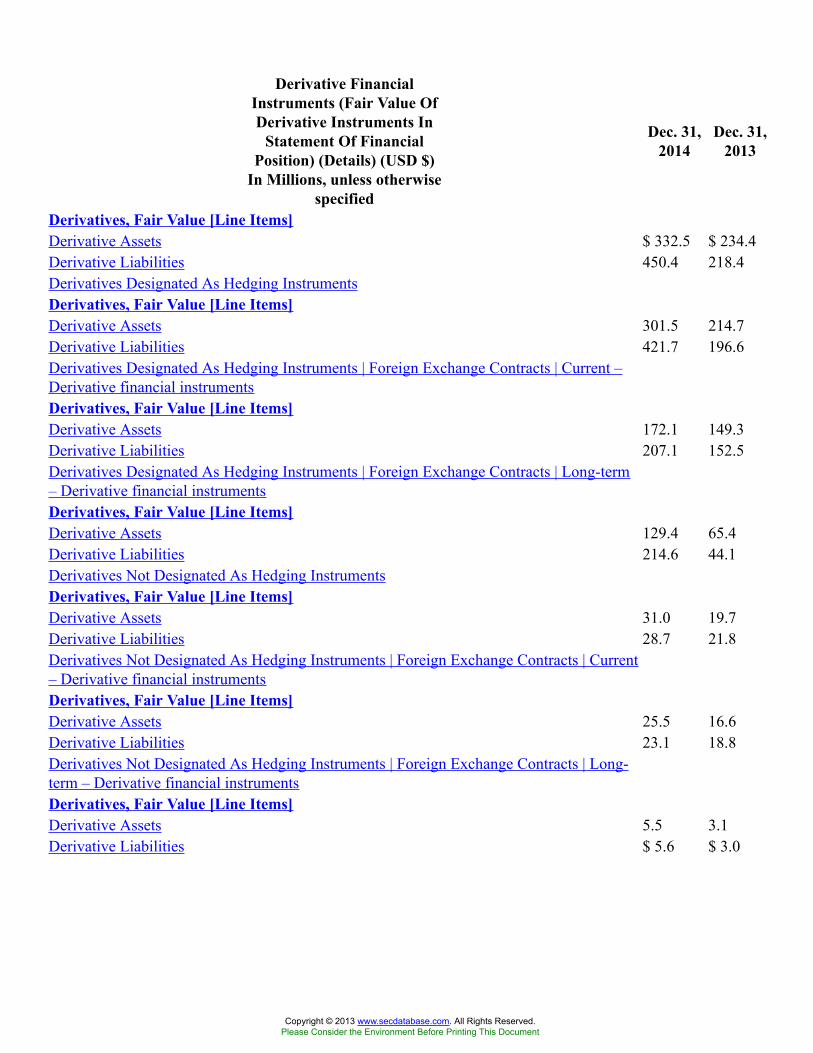
Derivative FinancialInstruments (Fair Value OfDerivative Instruments In
Statement Of FinancialPosition) (Details) (USD $)
In Millions, unless otherwisespecified
Dec. 31,2014
Dec. 31,2013
Derivatives, Fair Value [Line Items]Derivative Assets $ 332.5 $ 234.4Derivative Liabilities 450.4 218.4Derivatives Designated As Hedging InstrumentsDerivatives, Fair Value [Line Items]Derivative Assets 301.5 214.7Derivative Liabilities 421.7 196.6Derivatives Designated As Hedging Instruments | Foreign Exchange Contracts | Current –Derivative financial instrumentsDerivatives, Fair Value [Line Items]Derivative Assets 172.1 149.3Derivative Liabilities 207.1 152.5Derivatives Designated As Hedging Instruments | Foreign Exchange Contracts | Long-term– Derivative financial instrumentsDerivatives, Fair Value [Line Items]Derivative Assets 129.4 65.4Derivative Liabilities 214.6 44.1Derivatives Not Designated As Hedging InstrumentsDerivatives, Fair Value [Line Items]Derivative Assets 31.0 19.7Derivative Liabilities 28.7 21.8Derivatives Not Designated As Hedging Instruments | Foreign Exchange Contracts | Current– Derivative financial instrumentsDerivatives, Fair Value [Line Items]Derivative Assets 25.5 16.6Derivative Liabilities 23.1 18.8Derivatives Not Designated As Hedging Instruments | Foreign Exchange Contracts | Long-term – Derivative financial instrumentsDerivatives, Fair Value [Line Items]Derivative Assets 5.5 3.1Derivative Liabilities $ 5.6 $ 3.0
Copyright © 2013 www.secdatabase.com. All Rights Reserved.Please Consider the Environment Before Printing This Document
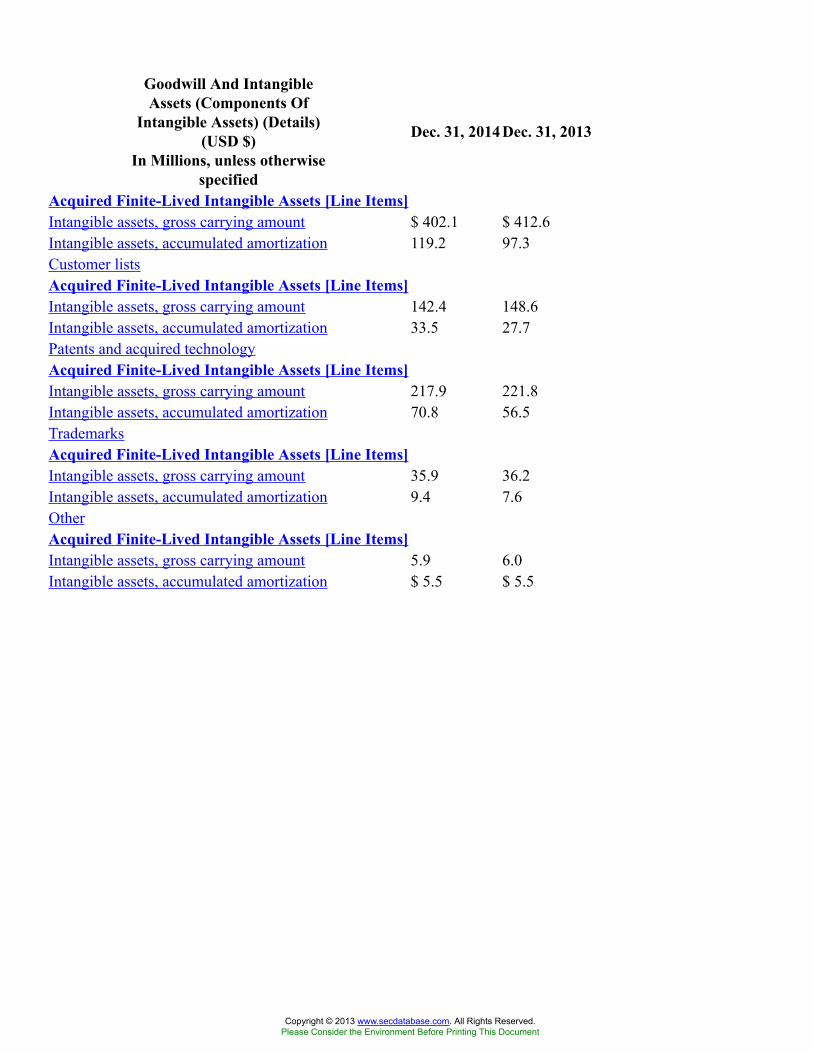
Goodwill And IntangibleAssets (Components Of
Intangible Assets) (Details)(USD $)
In Millions, unless otherwisespecified
Dec. 31, 2014 Dec. 31, 2013
Acquired Finite-Lived Intangible Assets [Line Items]Intangible assets, gross carrying amount $ 402.1 $ 412.6Intangible assets, accumulated amortization 119.2 97.3Customer listsAcquired Finite-Lived Intangible Assets [Line Items]Intangible assets, gross carrying amount 142.4 148.6Intangible assets, accumulated amortization 33.5 27.7Patents and acquired technologyAcquired Finite-Lived Intangible Assets [Line Items]Intangible assets, gross carrying amount 217.9 221.8Intangible assets, accumulated amortization 70.8 56.5TrademarksAcquired Finite-Lived Intangible Assets [Line Items]Intangible assets, gross carrying amount 35.9 36.2Intangible assets, accumulated amortization 9.4 7.6OtherAcquired Finite-Lived Intangible Assets [Line Items]Intangible assets, gross carrying amount 5.9 6.0Intangible assets, accumulated amortization $ 5.5 $ 5.5
Copyright © 2013 www.secdatabase.com. All Rights Reserved.Please Consider the Environment Before Printing This Document
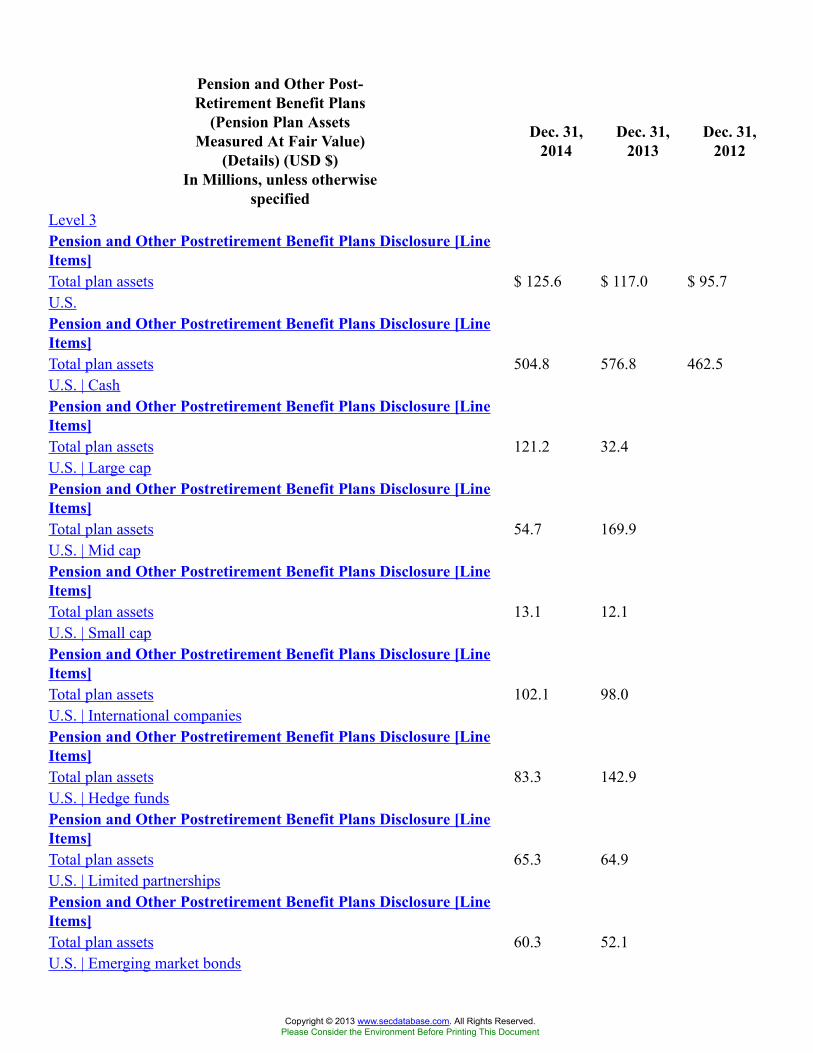
Pension and Other Post-Retirement Benefit Plans
(Pension Plan AssetsMeasured At Fair Value)
(Details) (USD $)In Millions, unless otherwise
specified
Dec. 31,2014
Dec. 31,2013
Dec. 31,2012
Level 3Pension and Other Postretirement Benefit Plans Disclosure [LineItems]Total plan assets $ 125.6 $ 117.0 $ 95.7U.S.Pension and Other Postretirement Benefit Plans Disclosure [LineItems]Total plan assets 504.8 576.8 462.5U.S. | CashPension and Other Postretirement Benefit Plans Disclosure [LineItems]Total plan assets 121.2 32.4U.S. | Large capPension and Other Postretirement Benefit Plans Disclosure [LineItems]Total plan assets 54.7 169.9U.S. | Mid capPension and Other Postretirement Benefit Plans Disclosure [LineItems]Total plan assets 13.1 12.1U.S. | Small capPension and Other Postretirement Benefit Plans Disclosure [LineItems]Total plan assets 102.1 98.0U.S. | International companiesPension and Other Postretirement Benefit Plans Disclosure [LineItems]Total plan assets 83.3 142.9U.S. | Hedge fundsPension and Other Postretirement Benefit Plans Disclosure [LineItems]Total plan assets 65.3 64.9U.S. | Limited partnershipsPension and Other Postretirement Benefit Plans Disclosure [LineItems]Total plan assets 60.3 52.1U.S. | Emerging market bonds
Copyright © 2013 www.secdatabase.com. All Rights Reserved.Please Consider the Environment Before Printing This Document
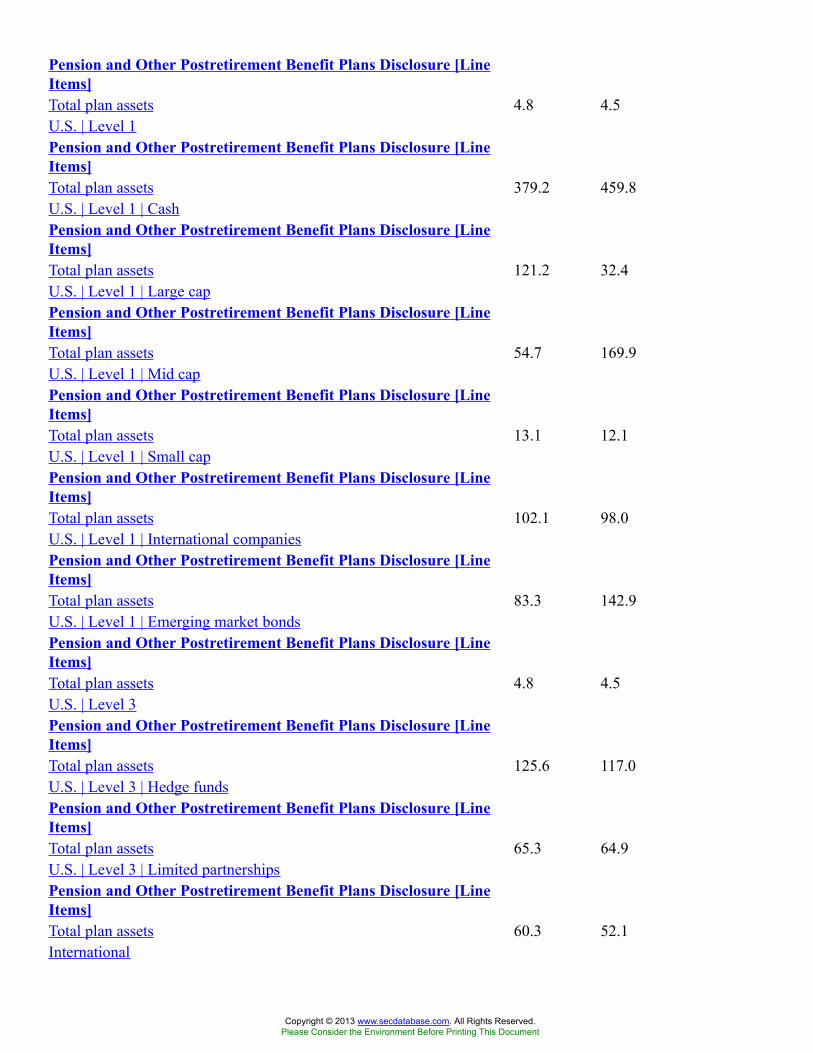
Pension and Other Postretirement Benefit Plans Disclosure [LineItems]Total plan assets 4.8 4.5U.S. | Level 1Pension and Other Postretirement Benefit Plans Disclosure [LineItems]Total plan assets 379.2 459.8U.S. | Level 1 | CashPension and Other Postretirement Benefit Plans Disclosure [LineItems]Total plan assets 121.2 32.4U.S. | Level 1 | Large capPension and Other Postretirement Benefit Plans Disclosure [LineItems]Total plan assets 54.7 169.9U.S. | Level 1 | Mid capPension and Other Postretirement Benefit Plans Disclosure [LineItems]Total plan assets 13.1 12.1U.S. | Level 1 | Small capPension and Other Postretirement Benefit Plans Disclosure [LineItems]Total plan assets 102.1 98.0U.S. | Level 1 | International companiesPension and Other Postretirement Benefit Plans Disclosure [LineItems]Total plan assets 83.3 142.9U.S. | Level 1 | Emerging market bondsPension and Other Postretirement Benefit Plans Disclosure [LineItems]Total plan assets 4.8 4.5U.S. | Level 3Pension and Other Postretirement Benefit Plans Disclosure [LineItems]Total plan assets 125.6 117.0U.S. | Level 3 | Hedge fundsPension and Other Postretirement Benefit Plans Disclosure [LineItems]Total plan assets 65.3 64.9U.S. | Level 3 | Limited partnershipsPension and Other Postretirement Benefit Plans Disclosure [LineItems]Total plan assets 60.3 52.1International
Copyright © 2013 www.secdatabase.com. All Rights Reserved.Please Consider the Environment Before Printing This Document
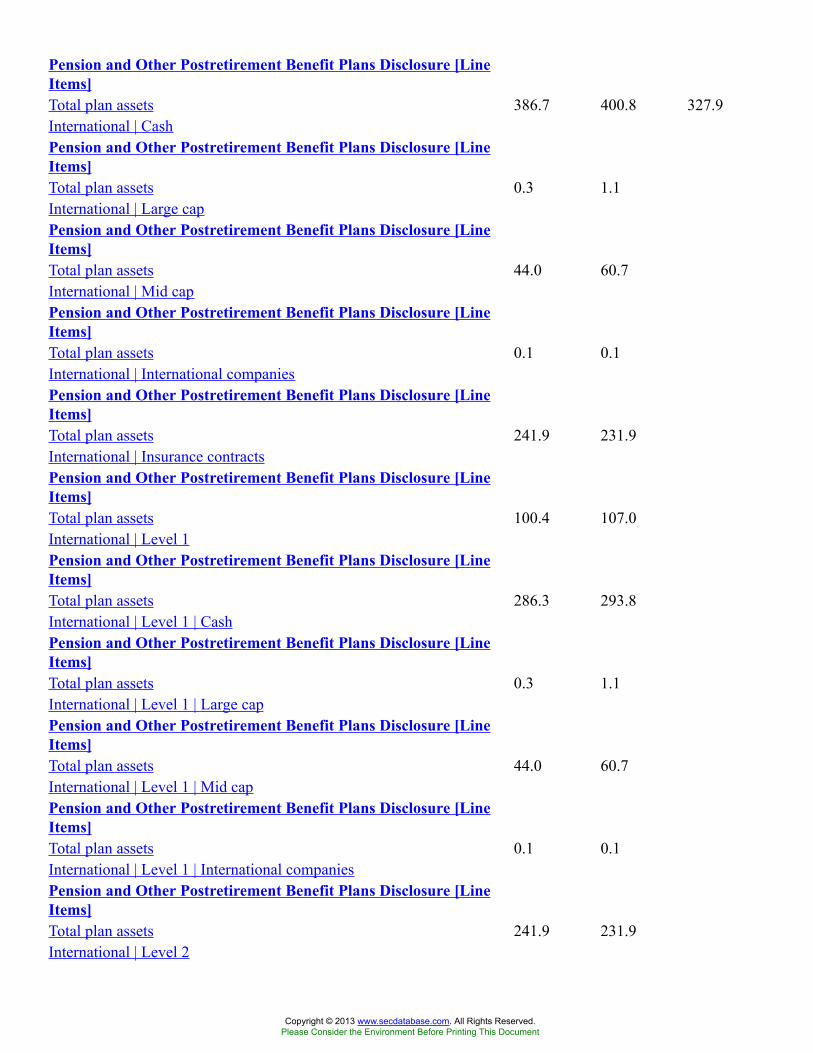
Pension and Other Postretirement Benefit Plans Disclosure [LineItems]Total plan assets 386.7 400.8 327.9International | CashPension and Other Postretirement Benefit Plans Disclosure [LineItems]Total plan assets 0.3 1.1International | Large capPension and Other Postretirement Benefit Plans Disclosure [LineItems]Total plan assets 44.0 60.7International | Mid capPension and Other Postretirement Benefit Plans Disclosure [LineItems]Total plan assets 0.1 0.1International | International companiesPension and Other Postretirement Benefit Plans Disclosure [LineItems]Total plan assets 241.9 231.9International | Insurance contractsPension and Other Postretirement Benefit Plans Disclosure [LineItems]Total plan assets 100.4 107.0International | Level 1Pension and Other Postretirement Benefit Plans Disclosure [LineItems]Total plan assets 286.3 293.8International | Level 1 | CashPension and Other Postretirement Benefit Plans Disclosure [LineItems]Total plan assets 0.3 1.1International | Level 1 | Large capPension and Other Postretirement Benefit Plans Disclosure [LineItems]Total plan assets 44.0 60.7International | Level 1 | Mid capPension and Other Postretirement Benefit Plans Disclosure [LineItems]Total plan assets 0.1 0.1International | Level 1 | International companiesPension and Other Postretirement Benefit Plans Disclosure [LineItems]Total plan assets 241.9 231.9International | Level 2
Copyright © 2013 www.secdatabase.com. All Rights Reserved.Please Consider the Environment Before Printing This Document

Pension and Other Postretirement Benefit Plans Disclosure [LineItems]Total plan assets 100.4 107.0International | Level 2 | Insurance contractsPension and Other Postretirement Benefit Plans Disclosure [LineItems]Total plan assets $ 100.4 $ 107.0
Copyright © 2013 www.secdatabase.com. All Rights Reserved.Please Consider the Environment Before Printing This Document
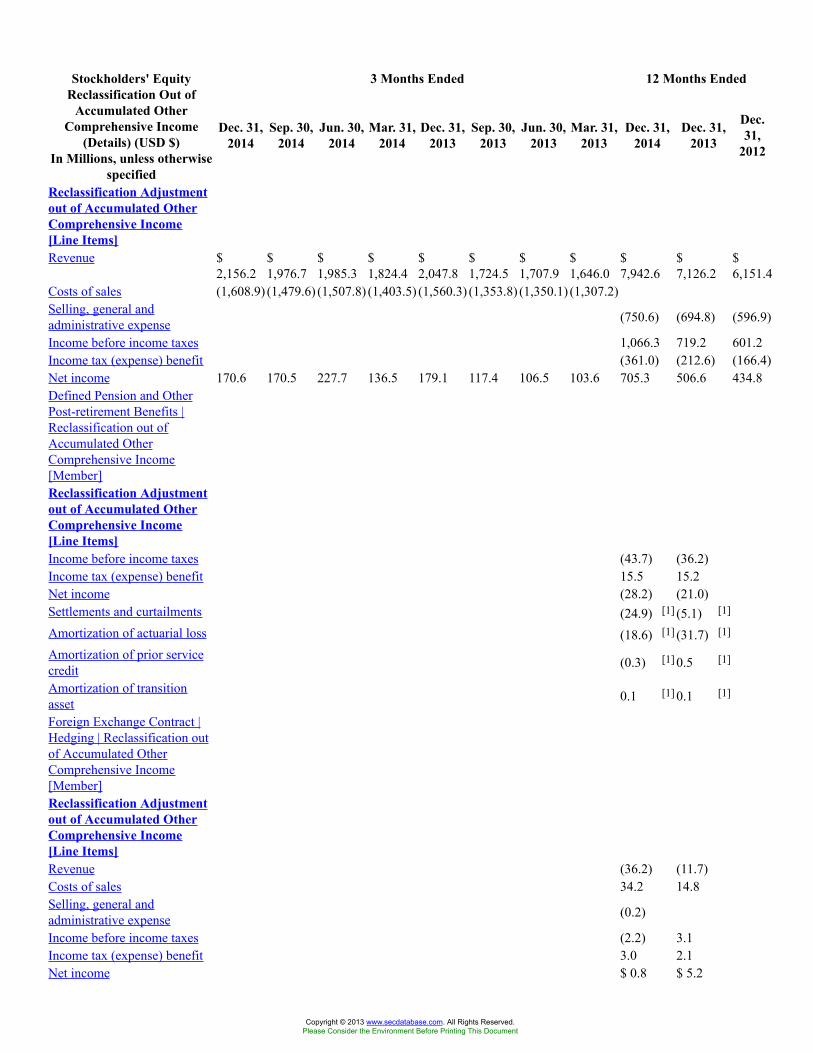
3 Months Ended 12 Months EndedStockholders' EquityReclassification Out of
Accumulated OtherComprehensive Income
(Details) (USD $)In Millions, unless otherwise
specified
Dec. 31,2014
Sep. 30,2014
Jun. 30,2014
Mar. 31,2014
Dec. 31,2013
Sep. 30,2013
Jun. 30,2013
Mar. 31,2013
Dec. 31,2014
Dec. 31,2013
Dec.31,
2012
Reclassification Adjustmentout of Accumulated OtherComprehensive Income[Line Items]Revenue $
2,156.2$1,976.7
$1,985.3
$1,824.4
$2,047.8
$1,724.5
$1,707.9
$1,646.0
$7,942.6
$7,126.2
$6,151.4
Costs of sales (1,608.9) (1,479.6) (1,507.8) (1,403.5) (1,560.3) (1,353.8) (1,350.1) (1,307.2)Selling, general andadministrative expense (750.6) (694.8) (596.9)
Income before income taxes 1,066.3 719.2 601.2Income tax (expense) benefit (361.0) (212.6) (166.4)Net income 170.6 170.5 227.7 136.5 179.1 117.4 106.5 103.6 705.3 506.6 434.8Defined Pension and OtherPost-retirement Benefits |Reclassification out ofAccumulated OtherComprehensive Income[Member]Reclassification Adjustmentout of Accumulated OtherComprehensive Income[Line Items]Income before income taxes (43.7) (36.2)Income tax (expense) benefit 15.5 15.2Net income (28.2) (21.0)Settlements and curtailments (24.9) [1] (5.1) [1]
Amortization of actuarial loss (18.6) [1] (31.7) [1]
Amortization of prior servicecredit (0.3) [1] 0.5 [1]
Amortization of transitionasset 0.1 [1] 0.1 [1]
Foreign Exchange Contract |Hedging | Reclassification outof Accumulated OtherComprehensive Income[Member]Reclassification Adjustmentout of Accumulated OtherComprehensive Income[Line Items]Revenue (36.2) (11.7)Costs of sales 34.2 14.8Selling, general andadministrative expense (0.2)
Income before income taxes (2.2) 3.1Income tax (expense) benefit 3.0 2.1Net income $ 0.8 $ 5.2
Copyright © 2013 www.secdatabase.com. All Rights Reserved.Please Consider the Environment Before Printing This Document

[1] (a) These accumulated other comprehensive income components are included in the computation of net periodic pension cost (seeNote 12 for additional details).
Copyright © 2013 www.secdatabase.com. All Rights Reserved.Please Consider the Environment Before Printing This Document
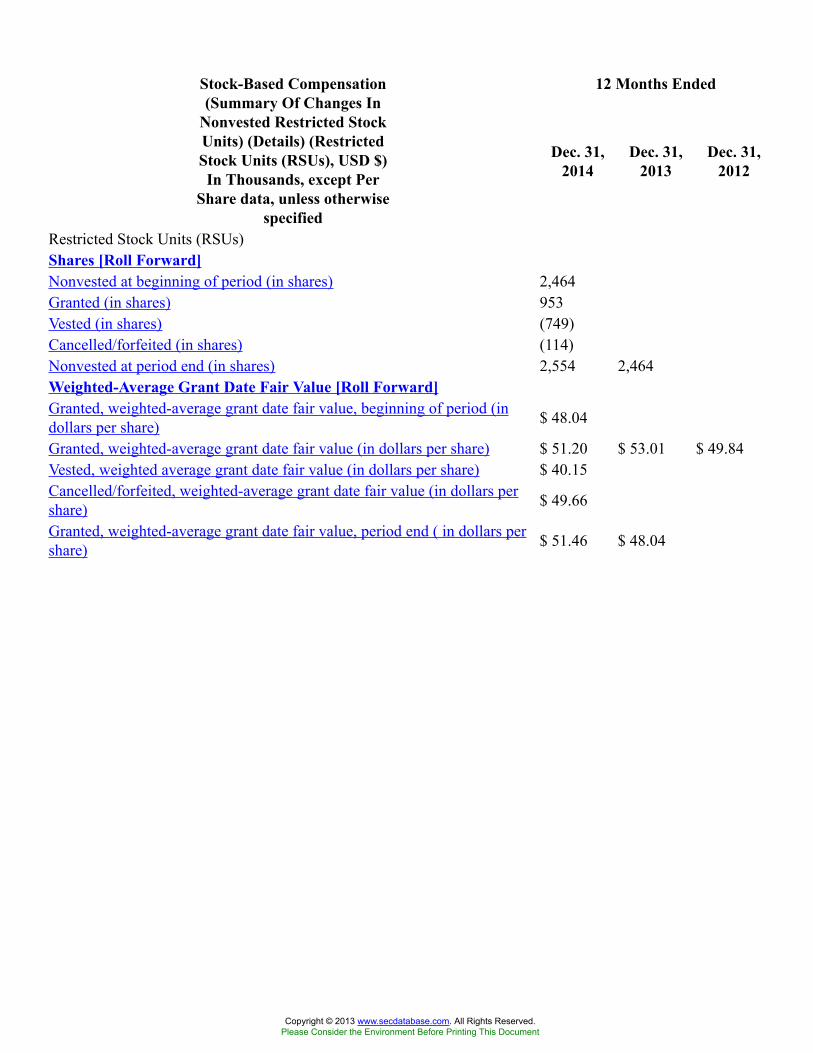
12 Months EndedStock-Based Compensation(Summary Of Changes In
Nonvested Restricted StockUnits) (Details) (RestrictedStock Units (RSUs), USD $)In Thousands, except Per
Share data, unless otherwisespecified
Dec. 31,2014
Dec. 31,2013
Dec. 31,2012
Restricted Stock Units (RSUs)Shares [Roll Forward]Nonvested at beginning of period (in shares) 2,464Granted (in shares) 953Vested (in shares) (749)Cancelled/forfeited (in shares) (114)Nonvested at period end (in shares) 2,554 2,464Weighted-Average Grant Date Fair Value [Roll Forward]Granted, weighted-average grant date fair value, beginning of period (indollars per share) $ 48.04
Granted, weighted-average grant date fair value (in dollars per share) $ 51.20 $ 53.01 $ 49.84Vested, weighted average grant date fair value (in dollars per share) $ 40.15Cancelled/forfeited, weighted-average grant date fair value (in dollars pershare) $ 49.66
Granted, weighted-average grant date fair value, period end ( in dollars pershare) $ 51.46 $ 48.04
Copyright © 2013 www.secdatabase.com. All Rights Reserved.Please Consider the Environment Before Printing This Document
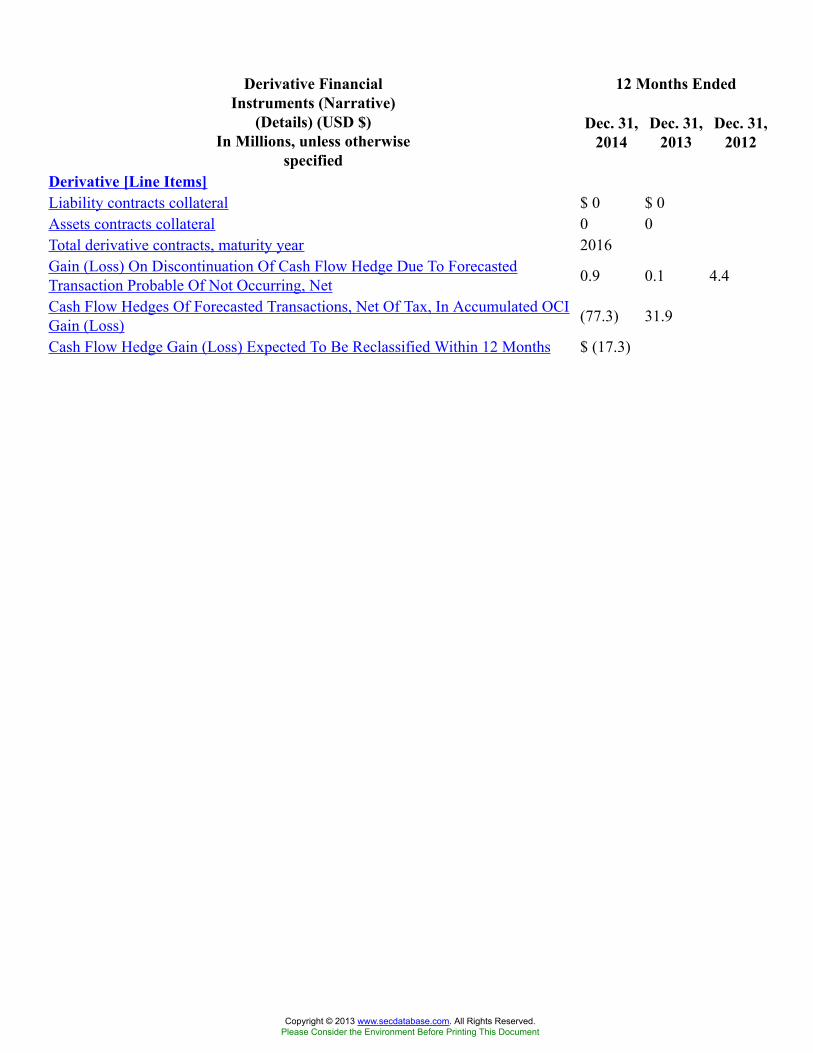
12 Months EndedDerivative FinancialInstruments (Narrative)
(Details) (USD $)In Millions, unless otherwise
specified
Dec. 31,2014
Dec. 31,2013
Dec. 31,2012
Derivative [Line Items]Liability contracts collateral $ 0 $ 0Assets contracts collateral 0 0Total derivative contracts, maturity year 2016Gain (Loss) On Discontinuation Of Cash Flow Hedge Due To ForecastedTransaction Probable Of Not Occurring, Net 0.9 0.1 4.4
Cash Flow Hedges Of Forecasted Transactions, Net Of Tax, In Accumulated OCIGain (Loss) (77.3) 31.9
Cash Flow Hedge Gain (Loss) Expected To Be Reclassified Within 12 Months $ (17.3)
Copyright © 2013 www.secdatabase.com. All Rights Reserved.Please Consider the Environment Before Printing This Document
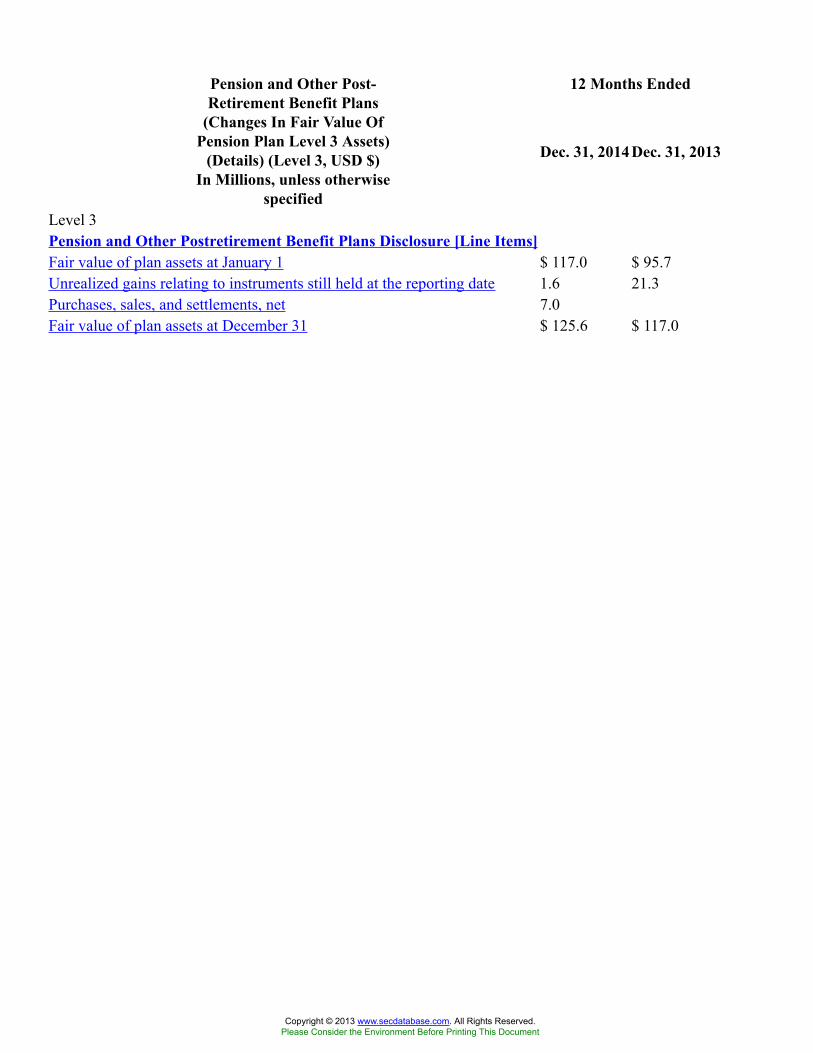
12 Months EndedPension and Other Post-Retirement Benefit Plans
(Changes In Fair Value OfPension Plan Level 3 Assets)
(Details) (Level 3, USD $)In Millions, unless otherwise
specified
Dec. 31, 2014 Dec. 31, 2013
Level 3Pension and Other Postretirement Benefit Plans Disclosure [Line Items]Fair value of plan assets at January 1 $ 117.0 $ 95.7Unrealized gains relating to instruments still held at the reporting date 1.6 21.3Purchases, sales, and settlements, net 7.0Fair value of plan assets at December 31 $ 125.6 $ 117.0
Copyright © 2013 www.secdatabase.com. All Rights Reserved.Please Consider the Environment Before Printing This Document
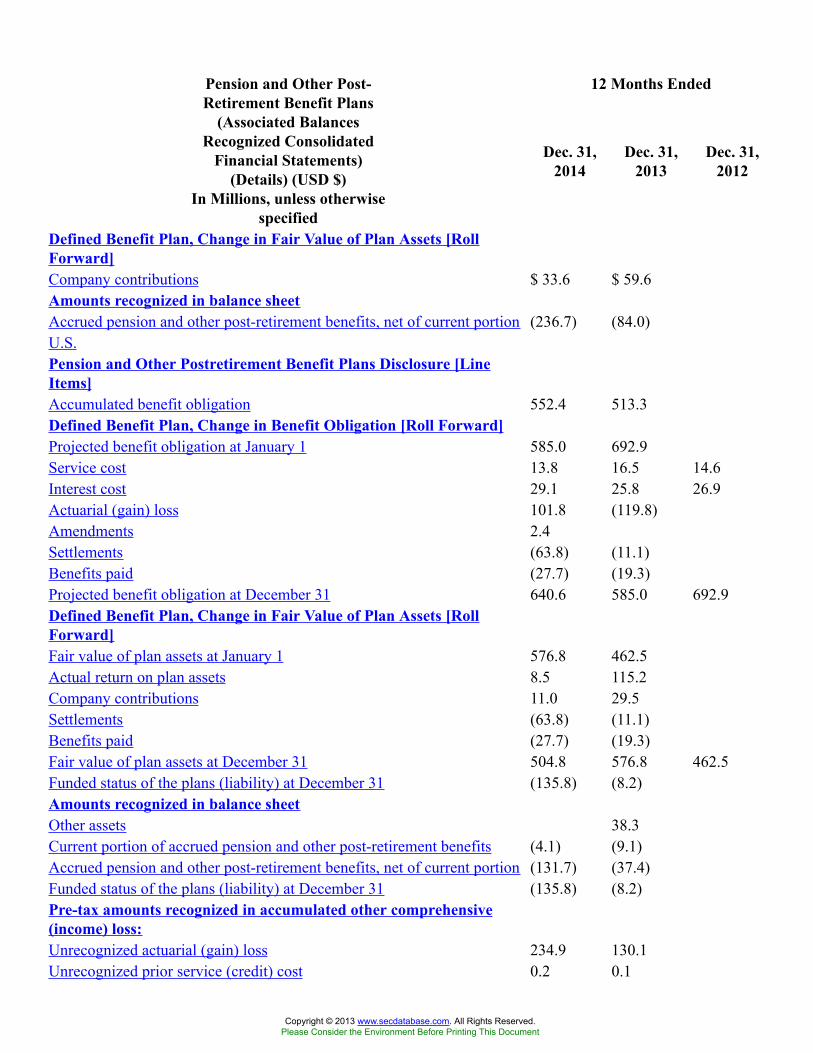
12 Months EndedPension and Other Post-Retirement Benefit Plans
(Associated BalancesRecognized Consolidated
Financial Statements)(Details) (USD $)
In Millions, unless otherwisespecified
Dec. 31,2014
Dec. 31,2013
Dec. 31,2012
Defined Benefit Plan, Change in Fair Value of Plan Assets [RollForward]Company contributions $ 33.6 $ 59.6Amounts recognized in balance sheetAccrued pension and other post-retirement benefits, net of current portion (236.7) (84.0)U.S.Pension and Other Postretirement Benefit Plans Disclosure [LineItems]Accumulated benefit obligation 552.4 513.3Defined Benefit Plan, Change in Benefit Obligation [Roll Forward]Projected benefit obligation at January 1 585.0 692.9Service cost 13.8 16.5 14.6Interest cost 29.1 25.8 26.9Actuarial (gain) loss 101.8 (119.8)Amendments 2.4Settlements (63.8) (11.1)Benefits paid (27.7) (19.3)Projected benefit obligation at December 31 640.6 585.0 692.9Defined Benefit Plan, Change in Fair Value of Plan Assets [RollForward]Fair value of plan assets at January 1 576.8 462.5Actual return on plan assets 8.5 115.2Company contributions 11.0 29.5Settlements (63.8) (11.1)Benefits paid (27.7) (19.3)Fair value of plan assets at December 31 504.8 576.8 462.5Funded status of the plans (liability) at December 31 (135.8) (8.2)Amounts recognized in balance sheetOther assets 38.3Current portion of accrued pension and other post-retirement benefits (4.1) (9.1)Accrued pension and other post-retirement benefits, net of current portion (131.7) (37.4)Funded status of the plans (liability) at December 31 (135.8) (8.2)Pre-tax amounts recognized in accumulated other comprehensive(income) loss:Unrecognized actuarial (gain) loss 234.9 130.1Unrecognized prior service (credit) cost 0.2 0.1
Copyright © 2013 www.secdatabase.com. All Rights Reserved.Please Consider the Environment Before Printing This Document
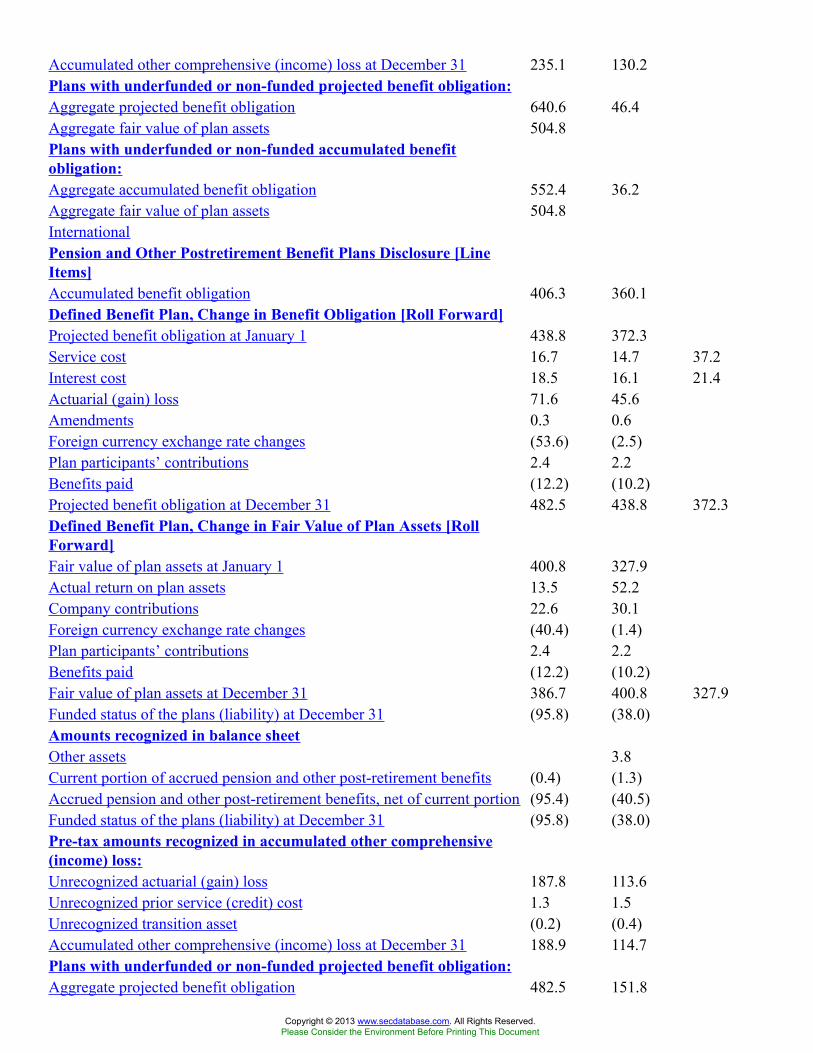
Accumulated other comprehensive (income) loss at December 31 235.1 130.2Plans with underfunded or non-funded projected benefit obligation:Aggregate projected benefit obligation 640.6 46.4Aggregate fair value of plan assets 504.8Plans with underfunded or non-funded accumulated benefitobligation:Aggregate accumulated benefit obligation 552.4 36.2Aggregate fair value of plan assets 504.8InternationalPension and Other Postretirement Benefit Plans Disclosure [LineItems]Accumulated benefit obligation 406.3 360.1Defined Benefit Plan, Change in Benefit Obligation [Roll Forward]Projected benefit obligation at January 1 438.8 372.3Service cost 16.7 14.7 37.2Interest cost 18.5 16.1 21.4Actuarial (gain) loss 71.6 45.6Amendments 0.3 0.6Foreign currency exchange rate changes (53.6) (2.5)Plan participants’ contributions 2.4 2.2Benefits paid (12.2) (10.2)Projected benefit obligation at December 31 482.5 438.8 372.3Defined Benefit Plan, Change in Fair Value of Plan Assets [RollForward]Fair value of plan assets at January 1 400.8 327.9Actual return on plan assets 13.5 52.2Company contributions 22.6 30.1Foreign currency exchange rate changes (40.4) (1.4)Plan participants’ contributions 2.4 2.2Benefits paid (12.2) (10.2)Fair value of plan assets at December 31 386.7 400.8 327.9Funded status of the plans (liability) at December 31 (95.8) (38.0)Amounts recognized in balance sheetOther assets 3.8Current portion of accrued pension and other post-retirement benefits (0.4) (1.3)Accrued pension and other post-retirement benefits, net of current portion (95.4) (40.5)Funded status of the plans (liability) at December 31 (95.8) (38.0)Pre-tax amounts recognized in accumulated other comprehensive(income) loss:Unrecognized actuarial (gain) loss 187.8 113.6Unrecognized prior service (credit) cost 1.3 1.5Unrecognized transition asset (0.2) (0.4)Accumulated other comprehensive (income) loss at December 31 188.9 114.7Plans with underfunded or non-funded projected benefit obligation:Aggregate projected benefit obligation 482.5 151.8
Copyright © 2013 www.secdatabase.com. All Rights Reserved.Please Consider the Environment Before Printing This Document
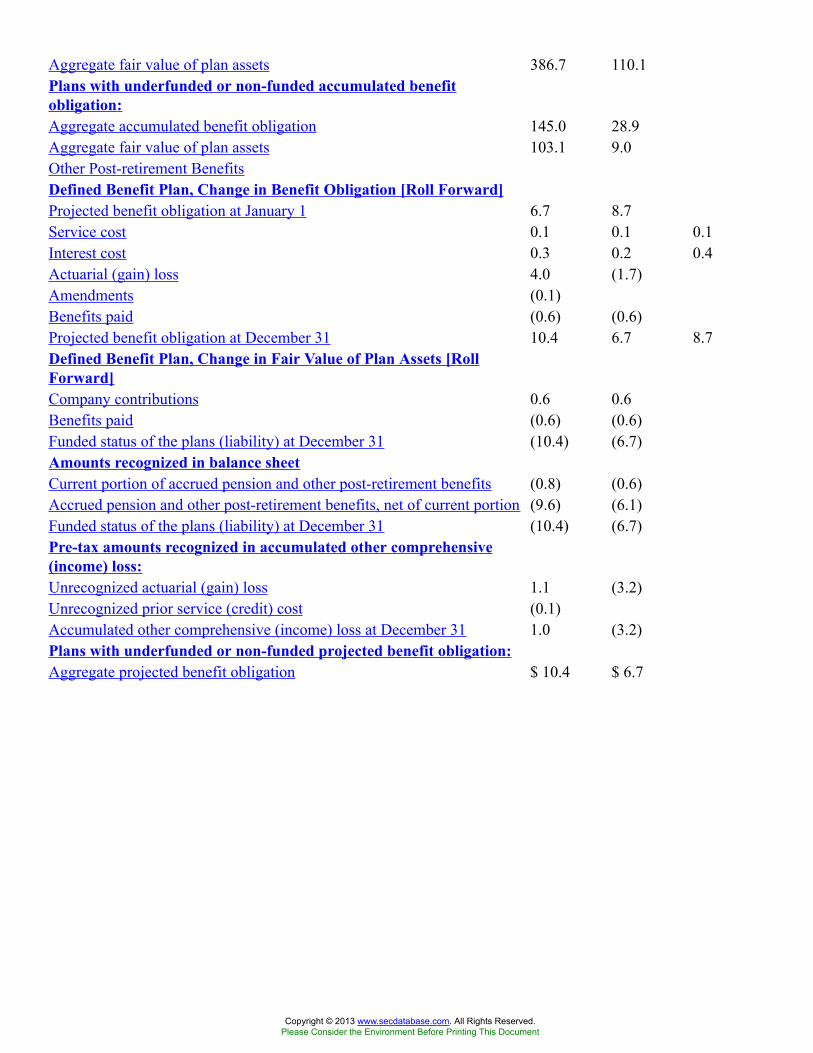
Aggregate fair value of plan assets 386.7 110.1Plans with underfunded or non-funded accumulated benefitobligation:Aggregate accumulated benefit obligation 145.0 28.9Aggregate fair value of plan assets 103.1 9.0Other Post-retirement BenefitsDefined Benefit Plan, Change in Benefit Obligation [Roll Forward]Projected benefit obligation at January 1 6.7 8.7Service cost 0.1 0.1 0.1Interest cost 0.3 0.2 0.4Actuarial (gain) loss 4.0 (1.7)Amendments (0.1)Benefits paid (0.6) (0.6)Projected benefit obligation at December 31 10.4 6.7 8.7Defined Benefit Plan, Change in Fair Value of Plan Assets [RollForward]Company contributions 0.6 0.6Benefits paid (0.6) (0.6)Funded status of the plans (liability) at December 31 (10.4) (6.7)Amounts recognized in balance sheetCurrent portion of accrued pension and other post-retirement benefits (0.8) (0.6)Accrued pension and other post-retirement benefits, net of current portion (9.6) (6.1)Funded status of the plans (liability) at December 31 (10.4) (6.7)Pre-tax amounts recognized in accumulated other comprehensive(income) loss:Unrecognized actuarial (gain) loss 1.1 (3.2)Unrecognized prior service (credit) cost (0.1)Accumulated other comprehensive (income) loss at December 31 1.0 (3.2)Plans with underfunded or non-funded projected benefit obligation:Aggregate projected benefit obligation $ 10.4 $ 6.7
Copyright © 2013 www.secdatabase.com. All Rights Reserved.Please Consider the Environment Before Printing This Document
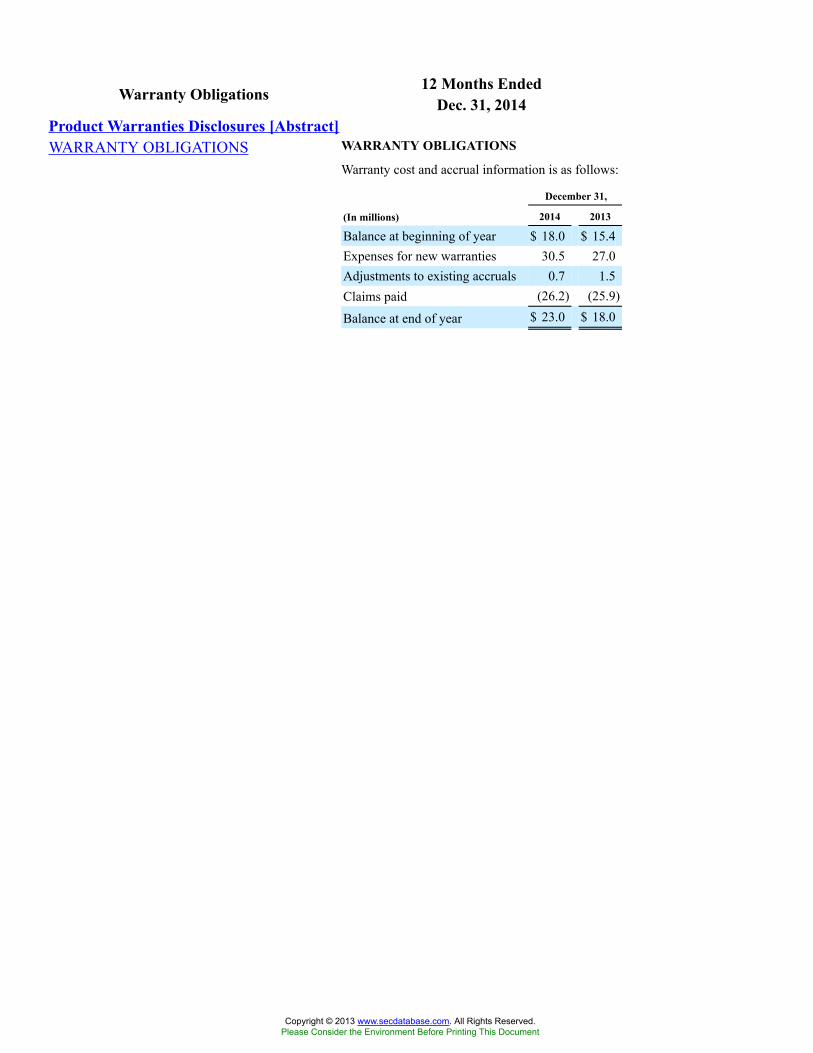
12 Months EndedWarranty Obligations Dec. 31, 2014Product Warranties Disclosures [Abstract]WARRANTY OBLIGATIONS WARRANTY OBLIGATIONS
Warranty cost and accrual information is as follows:
December 31,
(In millions) 2014 2013
Balance at beginning of year $ 18.0 $ 15.4Expenses for new warranties 30.5 27.0Adjustments to existing accruals 0.7 1.5Claims paid (26.2) (25.9)
Balance at end of year $ 23.0 $ 18.0
Copyright © 2013 www.secdatabase.com. All Rights Reserved.Please Consider the Environment Before Printing This Document
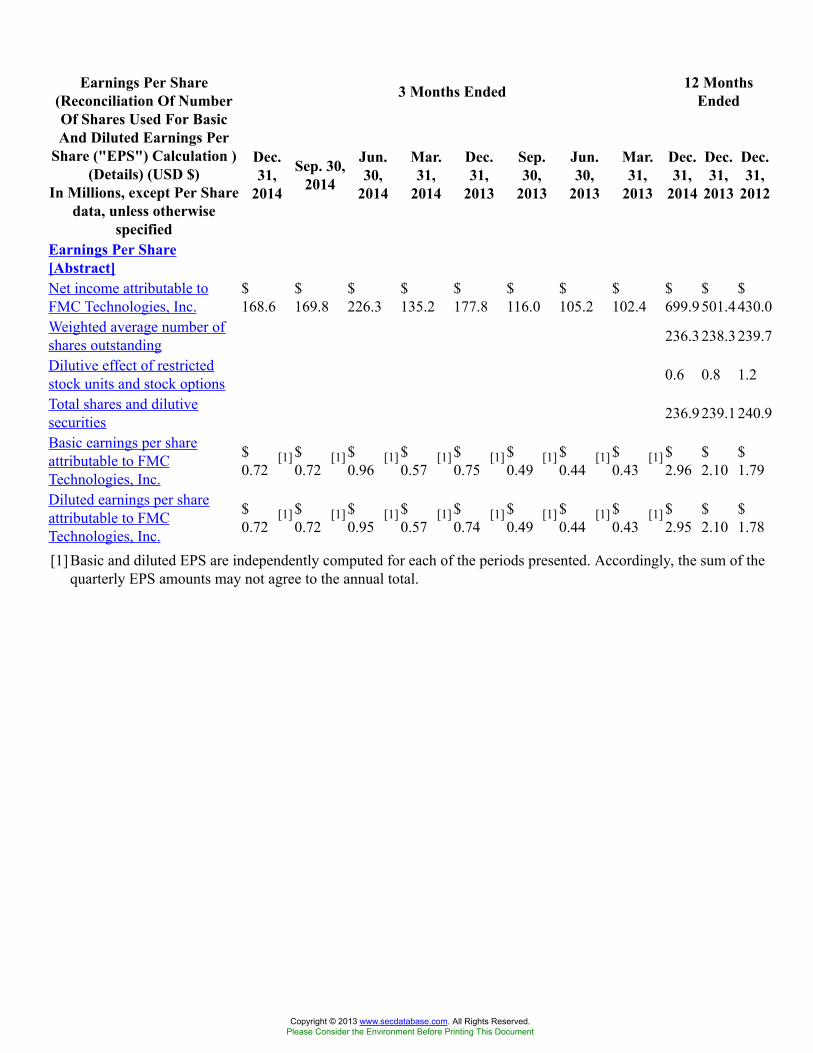
3 Months Ended 12 MonthsEnded
Earnings Per Share(Reconciliation Of NumberOf Shares Used For BasicAnd Diluted Earnings Per
Share ("EPS") Calculation )(Details) (USD $)
In Millions, except Per Sharedata, unless otherwise
specified
Dec.31,
2014
Sep. 30,2014
Jun.30,
2014
Mar.31,
2014
Dec.31,
2013
Sep.30,
2013
Jun.30,
2013
Mar.31,
2013
Dec.31,
2014
Dec.31,
2013
Dec.31,
2012
Earnings Per Share[Abstract]Net income attributable toFMC Technologies, Inc.
$168.6
$169.8
$226.3
$135.2
$177.8
$116.0
$105.2
$102.4
$699.9
$501.4
$430.0
Weighted average number ofshares outstanding 236.3238.3239.7
Dilutive effect of restrictedstock units and stock options 0.6 0.8 1.2
Total shares and dilutivesecurities 236.9239.1240.9
Basic earnings per shareattributable to FMCTechnologies, Inc.
$0.72
[1] $0.72
[1] $0.96
[1] $0.57
[1] $0.75
[1] $0.49
[1] $0.44
[1] $0.43
[1] $2.96
$2.10
$1.79
Diluted earnings per shareattributable to FMCTechnologies, Inc.
$0.72
[1] $0.72
[1] $0.95
[1] $0.57
[1] $0.74
[1] $0.49
[1] $0.44
[1] $0.43
[1] $2.95
$2.10
$1.78
[1] Basic and diluted EPS are independently computed for each of the periods presented. Accordingly, the sum of thequarterly EPS amounts may not agree to the annual total.
Copyright © 2013 www.secdatabase.com. All Rights Reserved.Please Consider the Environment Before Printing This Document
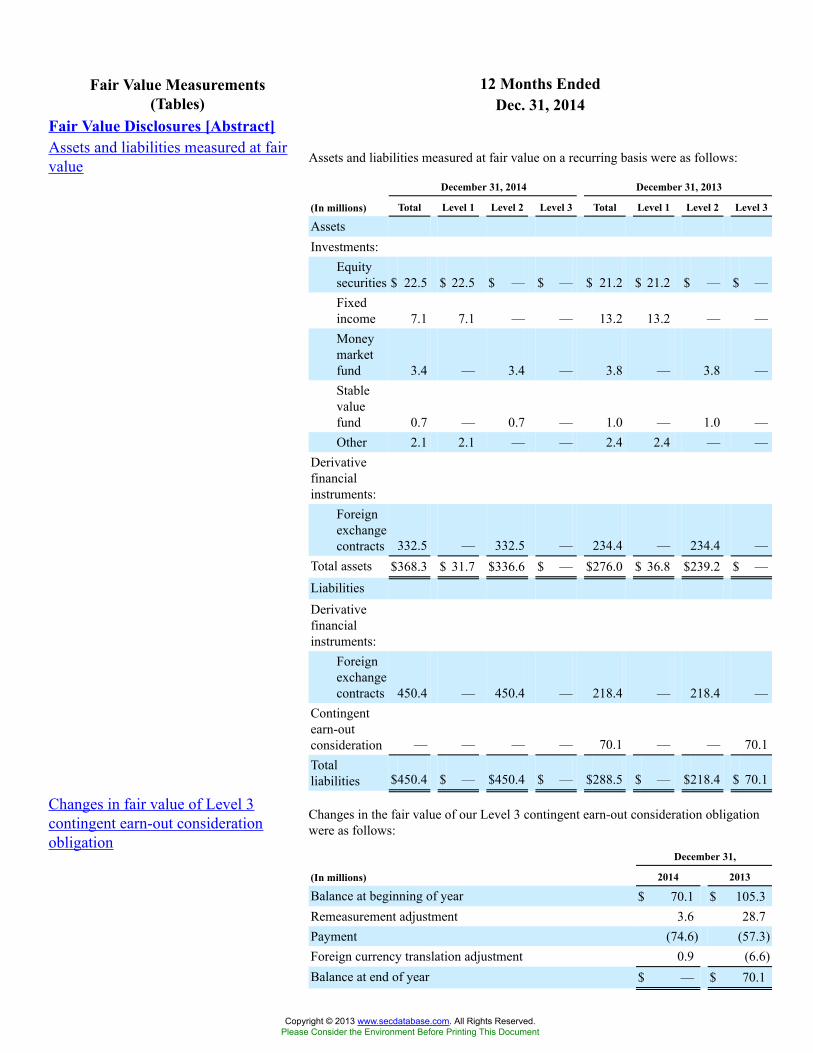
12 Months EndedFair Value Measurements(Tables) Dec. 31, 2014
Fair Value Disclosures [Abstract]Assets and liabilities measured at fairvalue Assets and liabilities measured at fair value on a recurring basis were as follows:
December 31, 2014 December 31, 2013
(In millions) Total Level 1 Level 2 Level 3 Total Level 1 Level 2 Level 3
AssetsInvestments:
Equitysecurities $ 22.5 $ 22.5 $ — $ — $ 21.2 $ 21.2 $ — $ —Fixedincome 7.1 7.1 — — 13.2 13.2 — —Moneymarketfund 3.4 — 3.4 — 3.8 — 3.8 —Stablevaluefund 0.7 — 0.7 — 1.0 — 1.0 —Other 2.1 2.1 — — 2.4 2.4 — —
Derivativefinancialinstruments:
Foreignexchangecontracts 332.5 — 332.5 — 234.4 — 234.4 —
Total assets $368.3 $ 31.7 $336.6 $ — $276.0 $ 36.8 $239.2 $ —LiabilitiesDerivativefinancialinstruments:
Foreignexchangecontracts 450.4 — 450.4 — 218.4 — 218.4 —
Contingentearn-outconsideration — — — — 70.1 — — 70.1Totalliabilities $450.4 $ — $450.4 $ — $288.5 $ — $218.4 $ 70.1
Changes in fair value of Level 3contingent earn-out considerationobligation
Changes in the fair value of our Level 3 contingent earn-out consideration obligationwere as follows:
December 31,
(In millions) 2014 2013
Balance at beginning of year $ 70.1 $ 105.3Remeasurement adjustment 3.6 28.7Payment (74.6) (57.3)Foreign currency translation adjustment 0.9 (6.6)Balance at end of year $ — $ 70.1
Copyright © 2013 www.secdatabase.com. All Rights Reserved.Please Consider the Environment Before Printing This Document
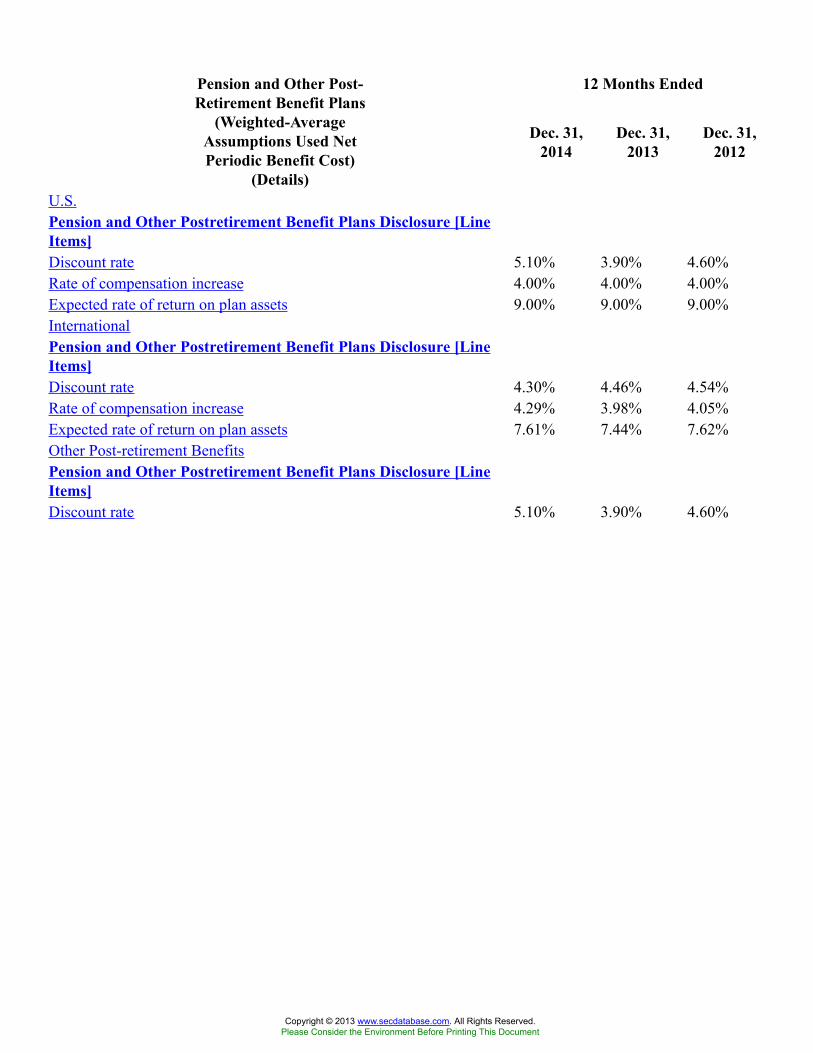
12 Months EndedPension and Other Post-Retirement Benefit Plans
(Weighted-AverageAssumptions Used NetPeriodic Benefit Cost)
(Details)
Dec. 31,2014
Dec. 31,2013
Dec. 31,2012
U.S.Pension and Other Postretirement Benefit Plans Disclosure [LineItems]Discount rate 5.10% 3.90% 4.60%Rate of compensation increase 4.00% 4.00% 4.00%Expected rate of return on plan assets 9.00% 9.00% 9.00%InternationalPension and Other Postretirement Benefit Plans Disclosure [LineItems]Discount rate 4.30% 4.46% 4.54%Rate of compensation increase 4.29% 3.98% 4.05%Expected rate of return on plan assets 7.61% 7.44% 7.62%Other Post-retirement BenefitsPension and Other Postretirement Benefit Plans Disclosure [LineItems]Discount rate 5.10% 3.90% 4.60%
Copyright © 2013 www.secdatabase.com. All Rights Reserved.Please Consider the Environment Before Printing This Document
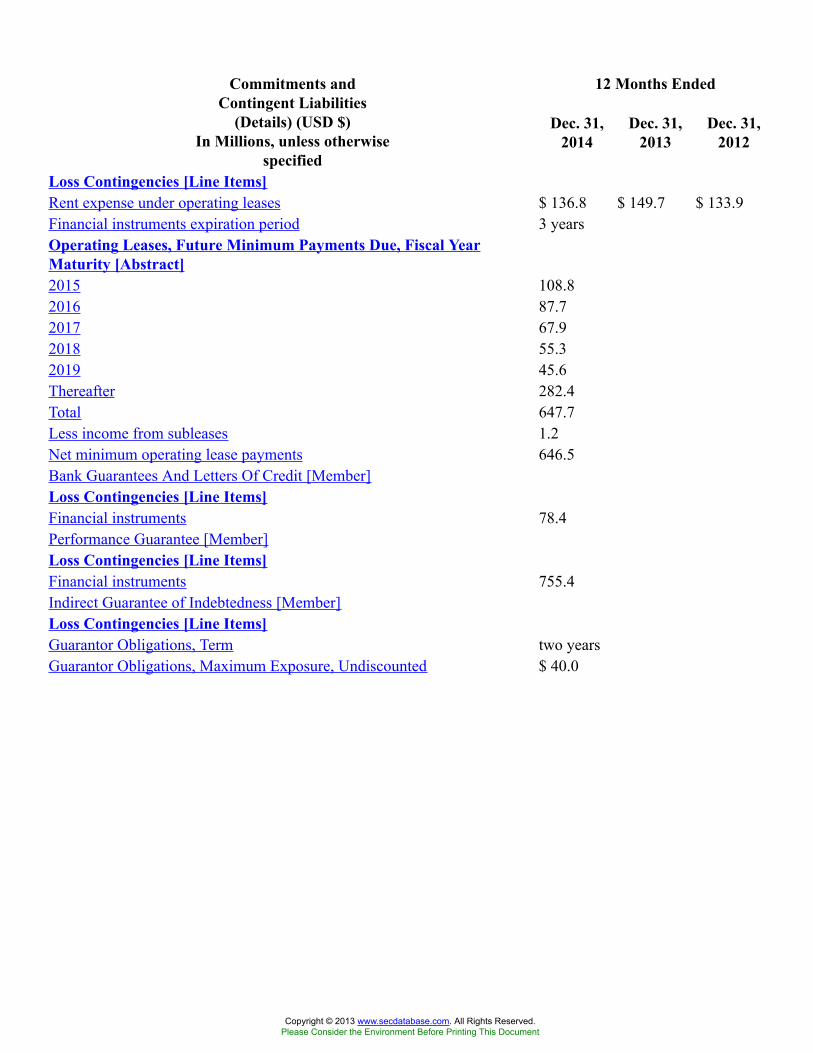
12 Months EndedCommitments andContingent Liabilities
(Details) (USD $)In Millions, unless otherwise
specified
Dec. 31,2014
Dec. 31,2013
Dec. 31,2012
Loss Contingencies [Line Items]Rent expense under operating leases $ 136.8 $ 149.7 $ 133.9Financial instruments expiration period 3 yearsOperating Leases, Future Minimum Payments Due, Fiscal YearMaturity [Abstract]2015 108.82016 87.72017 67.92018 55.32019 45.6Thereafter 282.4Total 647.7Less income from subleases 1.2Net minimum operating lease payments 646.5Bank Guarantees And Letters Of Credit [Member]Loss Contingencies [Line Items]Financial instruments 78.4Performance Guarantee [Member]Loss Contingencies [Line Items]Financial instruments 755.4Indirect Guarantee of Indebtedness [Member]Loss Contingencies [Line Items]Guarantor Obligations, Term two yearsGuarantor Obligations, Maximum Exposure, Undiscounted $ 40.0
Copyright © 2013 www.secdatabase.com. All Rights Reserved.Please Consider the Environment Before Printing This Document
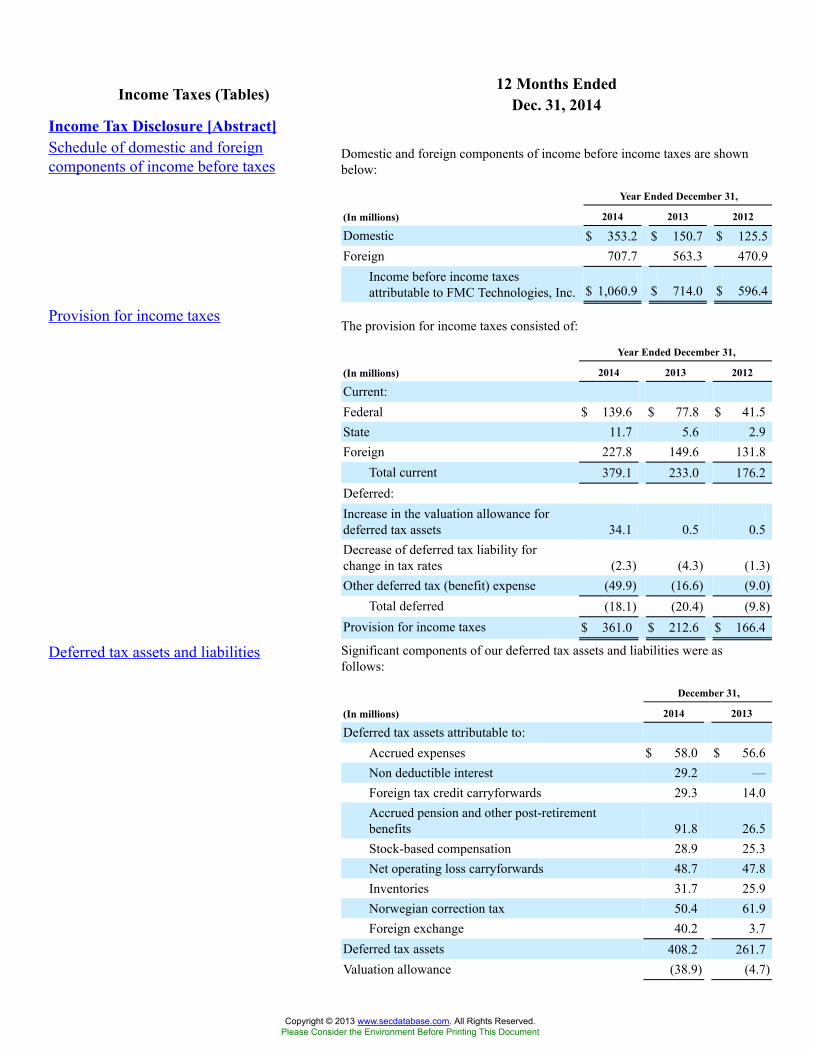
12 Months EndedIncome Taxes (Tables) Dec. 31, 2014Income Tax Disclosure [Abstract]Schedule of domestic and foreigncomponents of income before taxes
Domestic and foreign components of income before income taxes are shownbelow:
Year Ended December 31,
(In millions) 2014 2013 2012
Domestic $ 353.2 $ 150.7 $ 125.5Foreign 707.7 563.3 470.9
Income before income taxesattributable to FMC Technologies, Inc. $ 1,060.9 $ 714.0 $ 596.4
Provision for income taxesThe provision for income taxes consisted of:
Year Ended December 31,
(In millions) 2014 2013 2012
Current:Federal $ 139.6 $ 77.8 $ 41.5State 11.7 5.6 2.9Foreign 227.8 149.6 131.8
Total current 379.1 233.0 176.2Deferred:Increase in the valuation allowance fordeferred tax assets 34.1 0.5 0.5Decrease of deferred tax liability forchange in tax rates (2.3) (4.3) (1.3)Other deferred tax (benefit) expense (49.9) (16.6) (9.0)
Total deferred (18.1) (20.4) (9.8)Provision for income taxes $ 361.0 $ 212.6 $ 166.4
Deferred tax assets and liabilities Significant components of our deferred tax assets and liabilities were asfollows:
December 31,
(In millions) 2014 2013
Deferred tax assets attributable to:Accrued expenses $ 58.0 $ 56.6Non deductible interest 29.2 —Foreign tax credit carryforwards 29.3 14.0Accrued pension and other post-retirementbenefits 91.8 26.5Stock-based compensation 28.9 25.3Net operating loss carryforwards 48.7 47.8Inventories 31.7 25.9Norwegian correction tax 50.4 61.9Foreign exchange 40.2 3.7
Deferred tax assets 408.2 261.7Valuation allowance (38.9) (4.7)
Copyright © 2013 www.secdatabase.com. All Rights Reserved.Please Consider the Environment Before Printing This Document
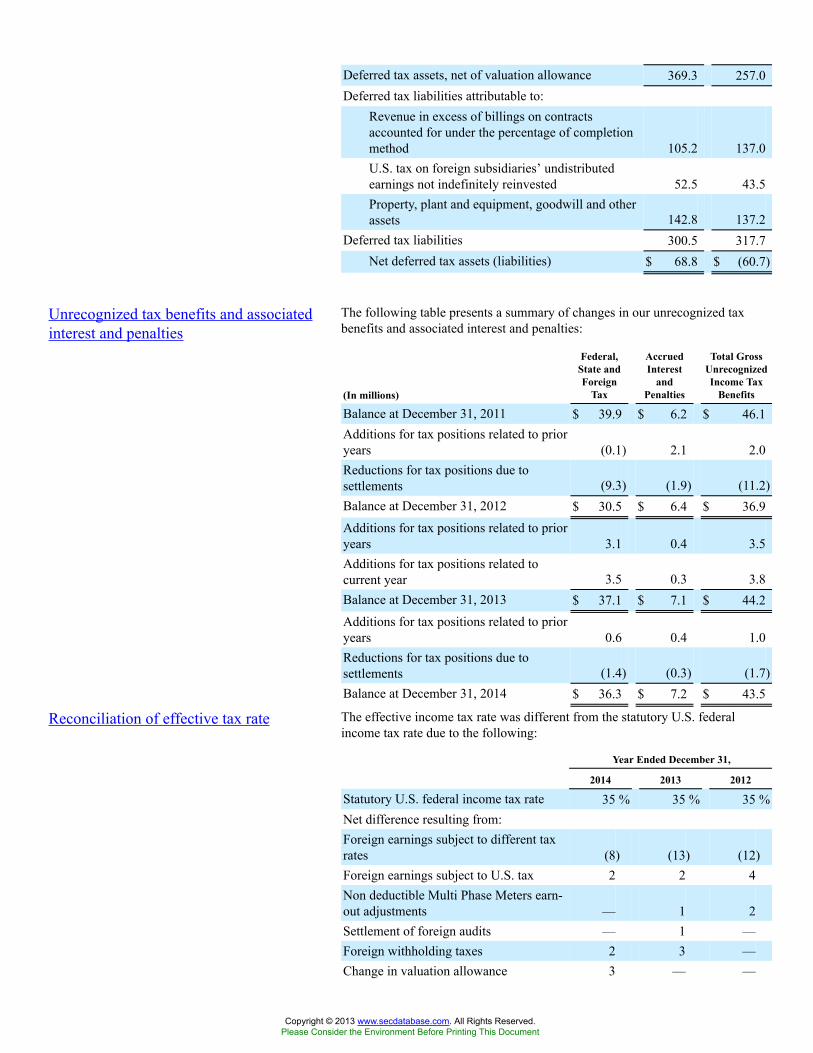
Deferred tax assets, net of valuation allowance 369.3 257.0Deferred tax liabilities attributable to:
Revenue in excess of billings on contractsaccounted for under the percentage of completionmethod 105.2 137.0U.S. tax on foreign subsidiaries’ undistributedearnings not indefinitely reinvested 52.5 43.5Property, plant and equipment, goodwill and otherassets 142.8 137.2
Deferred tax liabilities 300.5 317.7Net deferred tax assets (liabilities) $ 68.8 $ (60.7)
Unrecognized tax benefits and associatedinterest and penalties
The following table presents a summary of changes in our unrecognized taxbenefits and associated interest and penalties:
(In millions)
Federal,State andForeign
Tax
AccruedInterest
andPenalties
Total GrossUnrecognizedIncome Tax
Benefits
Balance at December 31, 2011 $ 39.9 $ 6.2 $ 46.1Additions for tax positions related to prioryears (0.1) 2.1 2.0Reductions for tax positions due tosettlements (9.3) (1.9) (11.2)Balance at December 31, 2012 $ 30.5 $ 6.4 $ 36.9Additions for tax positions related to prioryears 3.1 0.4 3.5Additions for tax positions related tocurrent year 3.5 0.3 3.8Balance at December 31, 2013 $ 37.1 $ 7.1 $ 44.2Additions for tax positions related to prioryears 0.6 0.4 1.0Reductions for tax positions due tosettlements (1.4) (0.3) (1.7)Balance at December 31, 2014 $ 36.3 $ 7.2 $ 43.5
Reconciliation of effective tax rate The effective income tax rate was different from the statutory U.S. federalincome tax rate due to the following:
Year Ended December 31,
2014 2013 2012
Statutory U.S. federal income tax rate 35 % 35 % 35 %Net difference resulting from:Foreign earnings subject to different taxrates (8) (13) (12)Foreign earnings subject to U.S. tax 2 2 4Non deductible Multi Phase Meters earn-out adjustments — 1 2Settlement of foreign audits — 1 —Foreign withholding taxes 2 3 —Change in valuation allowance 3 — —
Copyright © 2013 www.secdatabase.com. All Rights Reserved.Please Consider the Environment Before Printing This Document

Other — 1 (1)Effective income tax rate 34 % 30 % 28 %
Copyright © 2013 www.secdatabase.com. All Rights Reserved.Please Consider the Environment Before Printing This Document

12 Months EndedSale of Material HandlingProducts (Details) (USD $)
In Millions, unless otherwisespecified
Dec. 31, 2014
Disposal Group [Abstract]Gain on sale of Material Handling Products $ 84.3
Copyright © 2013 www.secdatabase.com. All Rights Reserved.Please Consider the Environment Before Printing This Document
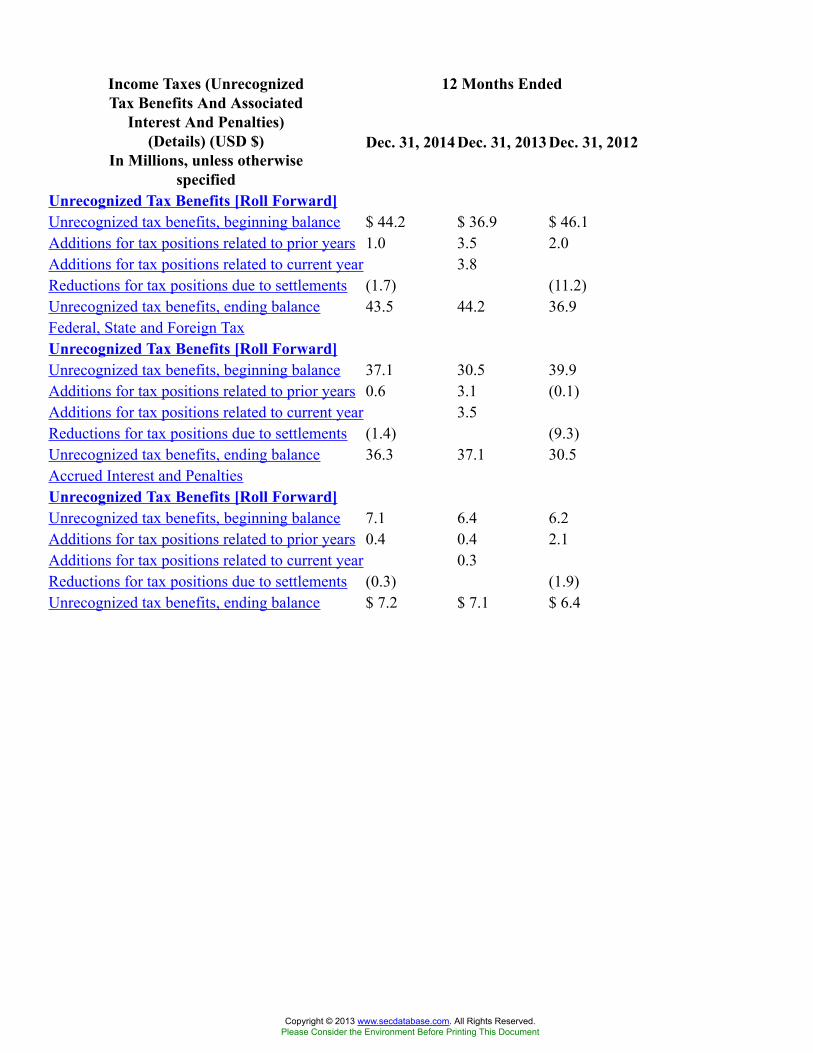
12 Months EndedIncome Taxes (UnrecognizedTax Benefits And Associated
Interest And Penalties)(Details) (USD $)
In Millions, unless otherwisespecified
Dec. 31, 2014 Dec. 31, 2013 Dec. 31, 2012
Unrecognized Tax Benefits [Roll Forward]Unrecognized tax benefits, beginning balance $ 44.2 $ 36.9 $ 46.1Additions for tax positions related to prior years 1.0 3.5 2.0Additions for tax positions related to current year 3.8Reductions for tax positions due to settlements (1.7) (11.2)Unrecognized tax benefits, ending balance 43.5 44.2 36.9Federal, State and Foreign TaxUnrecognized Tax Benefits [Roll Forward]Unrecognized tax benefits, beginning balance 37.1 30.5 39.9Additions for tax positions related to prior years 0.6 3.1 (0.1)Additions for tax positions related to current year 3.5Reductions for tax positions due to settlements (1.4) (9.3)Unrecognized tax benefits, ending balance 36.3 37.1 30.5Accrued Interest and PenaltiesUnrecognized Tax Benefits [Roll Forward]Unrecognized tax benefits, beginning balance 7.1 6.4 6.2Additions for tax positions related to prior years 0.4 0.4 2.1Additions for tax positions related to current year 0.3Reductions for tax positions due to settlements (0.3) (1.9)Unrecognized tax benefits, ending balance $ 7.2 $ 7.1 $ 6.4
Copyright © 2013 www.secdatabase.com. All Rights Reserved.Please Consider the Environment Before Printing This Document
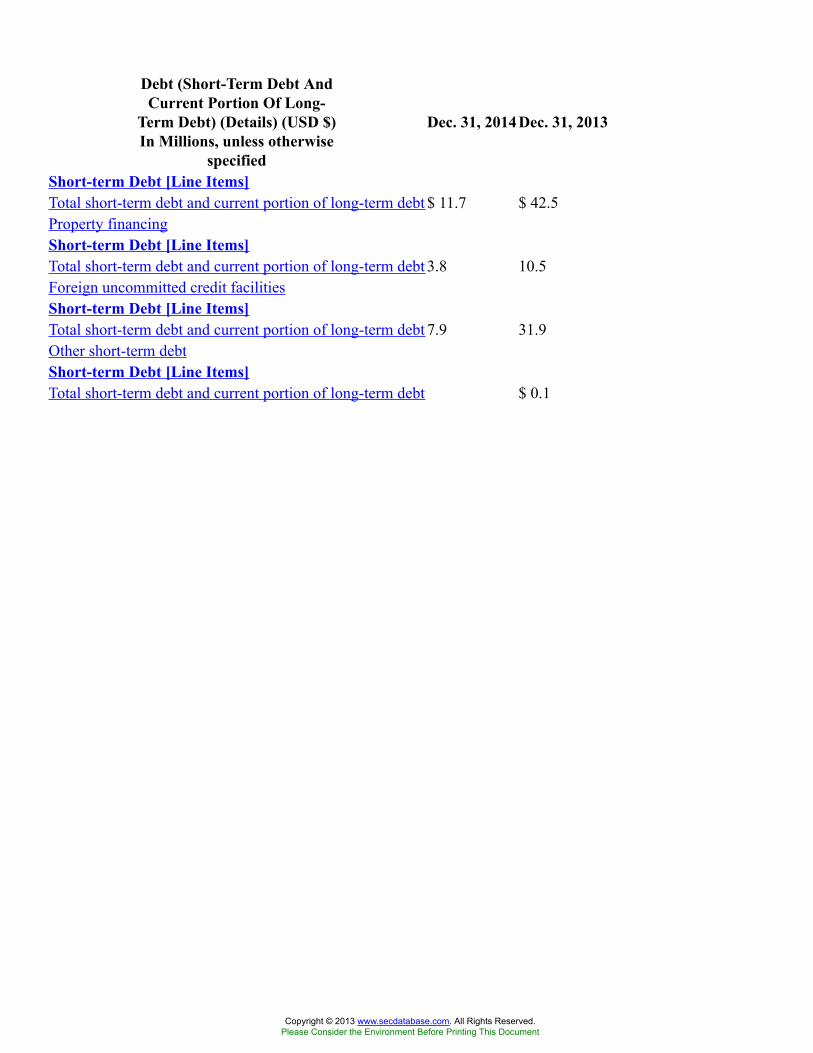
Debt (Short-Term Debt AndCurrent Portion Of Long-
Term Debt) (Details) (USD $)In Millions, unless otherwise
specified
Dec. 31, 2014 Dec. 31, 2013
Short-term Debt [Line Items]Total short-term debt and current portion of long-term debt $ 11.7 $ 42.5Property financingShort-term Debt [Line Items]Total short-term debt and current portion of long-term debt 3.8 10.5Foreign uncommitted credit facilitiesShort-term Debt [Line Items]Total short-term debt and current portion of long-term debt 7.9 31.9Other short-term debtShort-term Debt [Line Items]Total short-term debt and current portion of long-term debt $ 0.1
Copyright © 2013 www.secdatabase.com. All Rights Reserved.Please Consider the Environment Before Printing This Document

12 Months EndedOther Information (Tables) Dec. 31, 2014Cash Flow Information and Other Information[Abstract]Schedule of Cash Flow, Supplemental Disclosures
Year Ended December 31,
(In millions) 2014 2013 2012
Supplemental disclosures of cashflow information:Cash paid for interest (net of interestcapitalized) $ 31.6 $ 27.1 $ 18.5Cash paid for income taxes (net ofrefunds received) $ 370.0 $ 137.3 $ 225.4
Other Reportable Information
December 31,
(In millions) 2014 2013
Other reportable information:
Unbilled receivables included in tradereceivables $ 804.3 $ 777.0
Trading securities included in investments $ 35.8 $ 41.6
Net capitalized software costs included in otherassets $ 57.3 $ 56.9
Copyright © 2013 www.secdatabase.com. All Rights Reserved.Please Consider the Environment Before Printing This Document
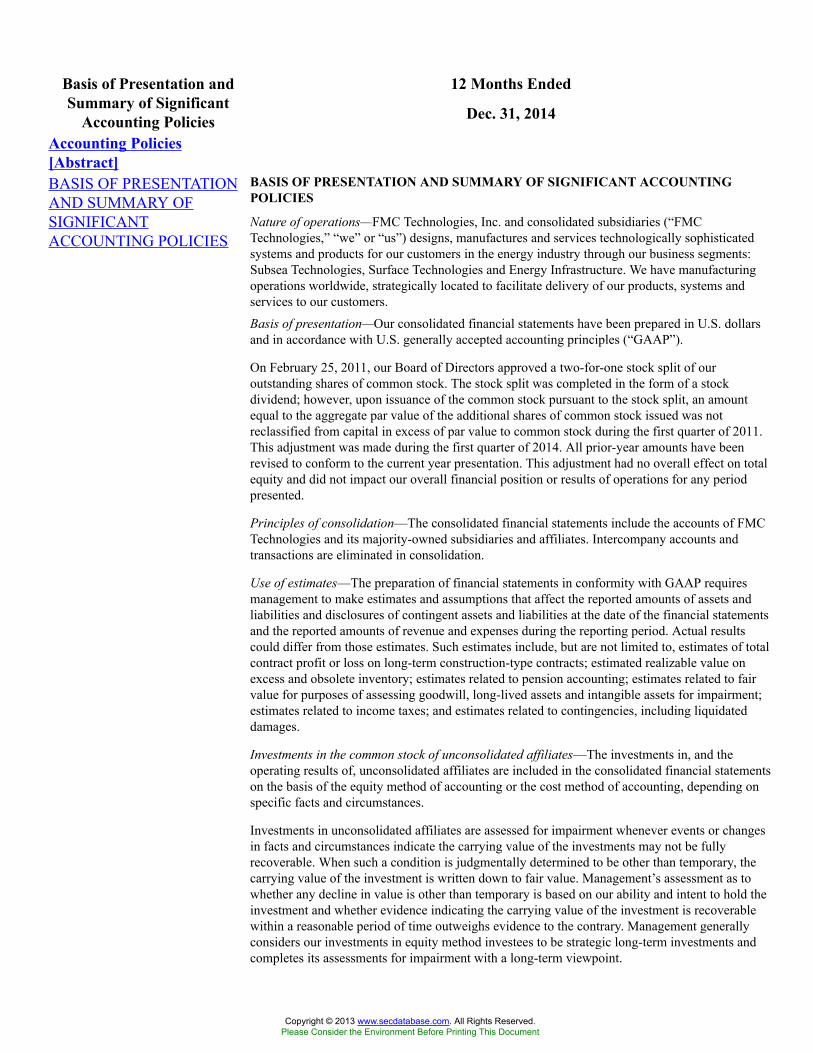
12 Months EndedBasis of Presentation andSummary of Significant
Accounting Policies Dec. 31, 2014
Accounting Policies[Abstract]BASIS OF PRESENTATIONAND SUMMARY OFSIGNIFICANTACCOUNTING POLICIES
BASIS OF PRESENTATION AND SUMMARY OF SIGNIFICANT ACCOUNTINGPOLICIES
Nature of operations—FMC Technologies, Inc. and consolidated subsidiaries (“FMCTechnologies,” “we” or “us”) designs, manufactures and services technologically sophisticatedsystems and products for our customers in the energy industry through our business segments:Subsea Technologies, Surface Technologies and Energy Infrastructure. We have manufacturingoperations worldwide, strategically located to facilitate delivery of our products, systems andservices to our customers.
Basis of presentation—Our consolidated financial statements have been prepared in U.S. dollarsand in accordance with U.S. generally accepted accounting principles (“GAAP”).
On February 25, 2011, our Board of Directors approved a two-for-one stock split of ouroutstanding shares of common stock. The stock split was completed in the form of a stockdividend; however, upon issuance of the common stock pursuant to the stock split, an amountequal to the aggregate par value of the additional shares of common stock issued was notreclassified from capital in excess of par value to common stock during the first quarter of 2011.This adjustment was made during the first quarter of 2014. All prior-year amounts have beenrevised to conform to the current year presentation. This adjustment had no overall effect on totalequity and did not impact our overall financial position or results of operations for any periodpresented.
Principles of consolidation—The consolidated financial statements include the accounts of FMCTechnologies and its majority-owned subsidiaries and affiliates. Intercompany accounts andtransactions are eliminated in consolidation.
Use of estimates—The preparation of financial statements in conformity with GAAP requiresmanagement to make estimates and assumptions that affect the reported amounts of assets andliabilities and disclosures of contingent assets and liabilities at the date of the financial statementsand the reported amounts of revenue and expenses during the reporting period. Actual resultscould differ from those estimates. Such estimates include, but are not limited to, estimates of totalcontract profit or loss on long-term construction-type contracts; estimated realizable value onexcess and obsolete inventory; estimates related to pension accounting; estimates related to fairvalue for purposes of assessing goodwill, long-lived assets and intangible assets for impairment;estimates related to income taxes; and estimates related to contingencies, including liquidateddamages.
Investments in the common stock of unconsolidated affiliates—The investments in, and theoperating results of, unconsolidated affiliates are included in the consolidated financial statementson the basis of the equity method of accounting or the cost method of accounting, depending onspecific facts and circumstances.
Investments in unconsolidated affiliates are assessed for impairment whenever events or changesin facts and circumstances indicate the carrying value of the investments may not be fullyrecoverable. When such a condition is judgmentally determined to be other than temporary, thecarrying value of the investment is written down to fair value. Management’s assessment as towhether any decline in value is other than temporary is based on our ability and intent to hold theinvestment and whether evidence indicating the carrying value of the investment is recoverablewithin a reasonable period of time outweighs evidence to the contrary. Management generallyconsiders our investments in equity method investees to be strategic long-term investments andcompletes its assessments for impairment with a long-term viewpoint.
Copyright © 2013 www.secdatabase.com. All Rights Reserved.Please Consider the Environment Before Printing This Document
Reclassifications—Certain prior-year amounts have been reclassified to conform to the currentyear’s presentation.
Revenue recognition—Revenue is generally recognized once the following four criteria are met:i) persuasive evidence of an arrangement exists, ii) delivery of the equipment has occurred (whichis upon shipment or when customer-specific acceptance requirements are met) or services havebeen rendered, iii) the price of the equipment or service is fixed and determinable, and iv)collectibility is reasonably assured. We record our sales net of any value added, sales or use tax.
For certain construction-type manufacturing and assembly projects that involve significant designand engineering efforts in order to satisfy detailed customer-supplied specifications, revenue isrecognized using the percentage of completion method of accounting. Under the percentage ofcompletion method, revenue is recognized as work progresses on each contract. We primarilyapply the ratio of costs incurred to date to total estimated contract costs at completion to measurethis ratio. If it is not possible to form a reliable estimate of progress toward completion, norevenue or costs are recognized until the project is complete or substantially complete. Anyexpected losses on construction-type contracts in progress are charged to earnings, in total, in theperiod the losses are identified.Modifications to construction-type contracts, referred to as “change orders,” effectively changethe provisions of the original contract, and may, for example, alter the specifications or design,method or manner of performance, equipment, materials, sites and/or period for completion of thework. If a change order represents a firm price commitment from a customer, we account for therevised estimate as if it had been included in the original estimate, effectively recognizing the prorata impact of the new estimate on our calculation of progress toward completion in the period inwhich the firm commitment is received. If a change order is unpriced: (1) we include the costs ofcontract performance in our calculation of progress toward completion in the period in which thecosts are incurred or become probable; and (2) when it is determined that the revenue is probableof recovery, we include the change order revenue, limited to the costs incurred to date related tothe change order, in our calculation of progress toward completion. Unpriced change ordersincluded in revenue were immaterial to our consolidated revenue for all periods presented.Margin is not recorded on unpriced change orders unless realization is assured beyond areasonable doubt. The assessment of realization may be based upon our previous experience withthe customer or based upon our receipt of a firm price commitment from the customer.
Progress billings are generally issued upon completion of certain phases of the work as stipulatedin the contract. Revenue in excess of progress billings are reported in trade receivables in ourconsolidated balance sheets. Progress billings and cash collections in excess of revenuerecognized on a contract are classified as advance payments and progress billings within currentliabilities in our consolidated balance sheets. Revenue generated from the installation portion ofconstruction-type contracts is included in product revenue in our consolidated statements ofincome.
Shipping and handling costs—Shipping and handling costs are recorded as cost of productrevenue in our consolidated statements of income. Shipping and handling costs billed tocustomers are recorded as a component of revenue.
Cash equivalents—Cash equivalents are highly-liquid, short-term instruments with originalmaturities of three months or less from their date of purchase.
Trade receivables, net of allowances—An allowance for doubtful accounts is provided on tradereceivables equal to the estimated uncollectible amounts. This estimate is based on historicalcollection experience and a specific review of each customer’s trade receivable balance.
Inventories—Inventories are stated at the lower of cost or net realizable value. Inventory costsinclude those costs directly attributable to products, including all manufacturing overhead, butexcluding costs to distribute. Cost is determined on the last-in, first-out (“LIFO”) basis for allsignificant domestic inventories, except certain inventories relating to construction-type contracts,which are stated at the actual production cost incurred to date, reduced by the portion of thesecosts identified with revenue recognized. The first-in, first-out (“FIFO”) method is used todetermine the cost for all other inventories.
Copyright © 2013 www.secdatabase.com. All Rights Reserved.Please Consider the Environment Before Printing This Document
Investments—The appropriate classification of investments in marketable equity securities isdetermined at the time of purchase and re-evaluated as of each subsequent reporting date.Securities classified as available-for-sale are carried at fair value with unrealized holding gainsand losses on these securities recognized in accumulated other comprehensive income (loss), netof related income tax. We did not have any available-for-sale securities at December 31, 2014 or2013.
Securities classified as trading securities are carried at fair value with gains and losses on thesesecurities recognized through other income (expense), net. Trading securities are primarilycomprised of marketable equity mutual funds that approximate a portion of our liability under ourNon-Qualified Savings and Investment Plan (“Non-Qualified Plan”).
Property, plant, and equipment—Property, plant, and equipment is recorded at cost. Depreciationis principally provided on the straight-line basis over the estimated useful lives of the assets (landimprovements—20 to 35 years; buildings—20 to 50 years; and machinery and equipment—3 to20 years). Gains and losses are realized upon the sale or retirement of assets and are recorded inother income (expense), net on our consolidated statements of income. Maintenance and repaircosts are expensed as incurred. Expenditures that extend the useful lives of property, plant andequipment are capitalized and depreciated over the estimated new remaining life of the asset.Impairment of property, plant, and equipment—Property, plant and equipment are reviewed forimpairment whenever events or changes in circumstances indicate the carrying value of the long-lived asset may not be recoverable. The carrying value of a long-lived asset is not recoverable if itexceeds the sum of the undiscounted cash flows expected to result from the use and eventualdisposition of the asset. If it is determined that an impairment loss has occurred, the impairmentloss is measured as the amount by which the carrying value of the long-lived asset exceeds its fairvalue.
Long-lived assets held for sale are reported at the lower of carrying value or fair value less cost tosell.
Capitalized software costs—Other assets on the consolidated balance sheets include thecapitalized cost of internal use software (including Internet websites). The assets are stated at costless accumulated amortization. These software costs include significant purchases of softwareand internal and external costs incurred during the application development stage of softwareprojects. These costs are amortized on a straight-line basis over the estimated useful lives of theassets. For internal use software, the useful lives range from three to ten years. For Internetwebsite costs, the estimated useful lives do not exceed three years.
Goodwill and other intangible assets—Goodwill is not subject to amortization but is tested forimpairment on an annual basis (or more frequently if impairment indicators arise). We haveestablished October 31 as the date of our annual test for impairment of goodwill. Reporting unitswith goodwill are tested for impairment by first assessing qualitative factors to determine whetherthe existence of events or circumstances leads to a determination that it is more likely than notthat the fair value of the reporting unit is less than its carrying amount. If after assessing thetotality of events or circumstances, or based on management’s judgment, we determine it is morelikely than not that the fair value of a reporting unit is less than its carrying amount, a two-stepimpairment test is performed. The first step compares the fair value of the reporting unit(measured as the present value of expected future cash flows) to its carrying amount. If the fairvalue of the reporting unit is less than its carrying amount, a second step is performed. In thisstep, the fair value of the reporting unit is allocated to its assets and liabilities to determine theimplied fair value of goodwill, which is used to measure the impairment loss.
Our acquired intangible assets are amortized on a straight-line basis over their estimated usefullives, which generally range from 7 to 40 years. Our acquired intangible assets do not haveindefinite lives. Intangible assets are reviewed for impairment whenever events or changes incircumstances indicate the carrying amount of the intangible asset may not be recoverable. Thecarrying amount of an intangible asset is not recoverable if it exceeds the sum of theundiscounted cash flows expected to result from the use and eventual disposition of the asset. If it
Copyright © 2013 www.secdatabase.com. All Rights Reserved.Please Consider the Environment Before Printing This Document
is determined that an impairment loss has occurred, the loss is measured as the amount by whichthe carrying amount of the intangible asset exceeds its fair value.
Fair value measurements—We record our financial assets and financial liabilities at fair value.Fair value is defined as the price that would be received to sell an asset or paid to transfer aliability (an exit price) in an orderly transaction between market participants at the reporting date.The fair value framework requires the categorization of assets and liabilities into three levelsbased upon the assumptions (inputs) used to price the assets or liabilities. Level 1 provides themost reliable measure of fair value, whereas Level 3 generally requires significant managementjudgment. The three levels are defined as follows:
• Level 1: Unadjusted quoted prices in active markets for identical assets and liabilities.
• Level 2: Observable inputs other than quoted prices included in Level 1. For example,quoted prices for similar assets or liabilities in active markets or quoted prices foridentical assets or liabilities in inactive markets.
• Level 3: Unobservable inputs reflecting management’s own assumptions about theassumptions market participants would use in pricing the asset or liability.
Income taxes—Current income taxes are provided on income reported for financial statementpurposes, adjusted for transactions that do not enter into the computation of income taxes payablein the same year. Deferred tax assets and liabilities are measured using enacted tax rates for theexpected future tax consequences of temporary differences between the carrying amounts and thetax bases of assets and liabilities. A valuation allowance is established whenever managementbelieves that it is more likely than not that deferred tax assets may not be realizable.
U.S. income taxes are not provided on our equity in undistributed earnings of foreign subsidiariesor affiliates to the extent we have determined that the earnings are indefinitely reinvested. U.S.income taxes are provided on such earnings in the period in which we can no longer support thatsuch earnings are indefinitely reinvested.
Tax benefits related to uncertain tax positions are recognized when it is more likely than not,based on the technical merits, that the position will be sustained upon examination.
We classify interest expense and penalties recognized on underpayments of income taxes asincome tax expense.
Stock-based employee compensation—We measure stock-based compensation expense onrestricted stock awards based on the market price at the grant date and the number of sharesawarded. The stock-based compensation expense for each award is recognized ratably over theapplicable service period, after taking into account estimated forfeitures, or the period beginningat the start of the service period and ending when an employee becomes eligible for retirement.
Common stock held in employee benefit trust—Shares of our common stock are purchased by theplan administrator of the Non-Qualified Plan and placed in a trust owned by us. Purchased sharesare recorded at cost and classified as a reduction of stockholders’ equity on the consolidatedbalance sheets.
Earnings per common share (“EPS”)—Basic EPS is computed using the weighted-averagenumber of common shares outstanding during the year. Diluted EPS gives effect to the potentialdilution of earnings that could have occurred if additional shares were issued for stock optionexercises and restricted stock under the treasury stock method. The treasury stock methodassumes proceeds that would be obtained upon exercise of common stock options and issuance ofrestricted stock are used to buy back outstanding common stock at the average market priceduring the period.
Warranty obligations—We provide warranties of various lengths and terms to certain of ourcustomers based on standard terms and conditions and negotiated agreements. Estimated cost ofwarranties are accrued at the time revenue is recognized for products where reliable, historicalexperience of warranty claims and costs exists or when additional specific obligations areidentified. The obligation reflected in other current liabilities on the consolidated balance sheetsis based on historical experience by product and considers failure rates and the related costs in
Copyright © 2013 www.secdatabase.com. All Rights Reserved.Please Consider the Environment Before Printing This Document
correcting a product failure. Should actual product failure rates or repair costs differ from ourcurrent estimates, revisions to the estimated warranty liability would be required.
Foreign currency—Financial statements of operations for which the U.S. dollar is not thefunctional currency, and are located in non-highly inflationary countries, are translated into U.S.dollars prior to consolidation. Assets and liabilities are translated at the exchange rate in effect atthe balance sheet date, while income statement accounts are translated at the average exchangerate for each period. For these operations, translation gains and losses are recorded as acomponent of accumulated other comprehensive income (loss) in stockholders’ equity until theforeign entity is sold or liquidated. For operations in highly inflationary countries and where thelocal currency is not the functional currency, inventories, property, plant and equipment, andother non-current assets are converted to U.S. dollars at historical exchange rates, and all gains orlosses from conversion are included in net income. Foreign currency effects on cash, cashequivalents and debt in hyperinflationary economies are included in interest income or expense.Derivative instruments—Derivatives are recognized on the consolidated balance sheets at fairvalue, with classification as current or non-current based upon the maturity of the derivativeinstrument. Changes in the fair value of derivative instruments are recorded in current earnings ordeferred in accumulated other comprehensive income (loss), depending on the type of hedgingtransaction and whether a derivative is designated as, and is effective as, a hedge. Eachinstrument is accounted for individually and assets and liabilities are not offset.
Hedge accounting is only applied when the derivative is deemed to be highly effective atoffsetting changes in anticipated cash flows of the hedged item or transaction. Changes in fairvalue of derivatives that are designated as cash flow hedges are deferred in accumulated othercomprehensive income (loss) until the underlying transactions are recognized in earnings. At suchtime, related deferred hedging gains or losses are also recorded in operating earnings on the sameline as the hedged item. Effectiveness is assessed at the inception of the hedge and on a quarterlybasis. Effectiveness of forward contract cash flow hedges are assessed based solely on changes infair value attributable to the change in the spot rate. The change in the fair value of the contractrelated to the change in forward rates is excluded from the assessment of hedge effectiveness.Changes in this excluded component of the derivative instrument, along with any ineffectivenessidentified, are recorded in operating earnings as incurred. We document our risk managementstrategy and hedge effectiveness at the inception of, and during the term of, each hedge.
We also use forward contracts to hedge foreign currency assets and liabilities, for which we donot apply hedge accounting. The changes in fair value of these contracts are recognized in otherincome (expense), net on our consolidated statements of income, as they occur and offset gains orlosses on the remeasurement of the related asset or liability.
Cash flows from derivative contracts are reported in the consolidated statements of cash flows inthe same categories as the cash flows from the underlying transactions.
Copyright © 2013 www.secdatabase.com. All Rights Reserved.Please Consider the Environment Before Printing This Document
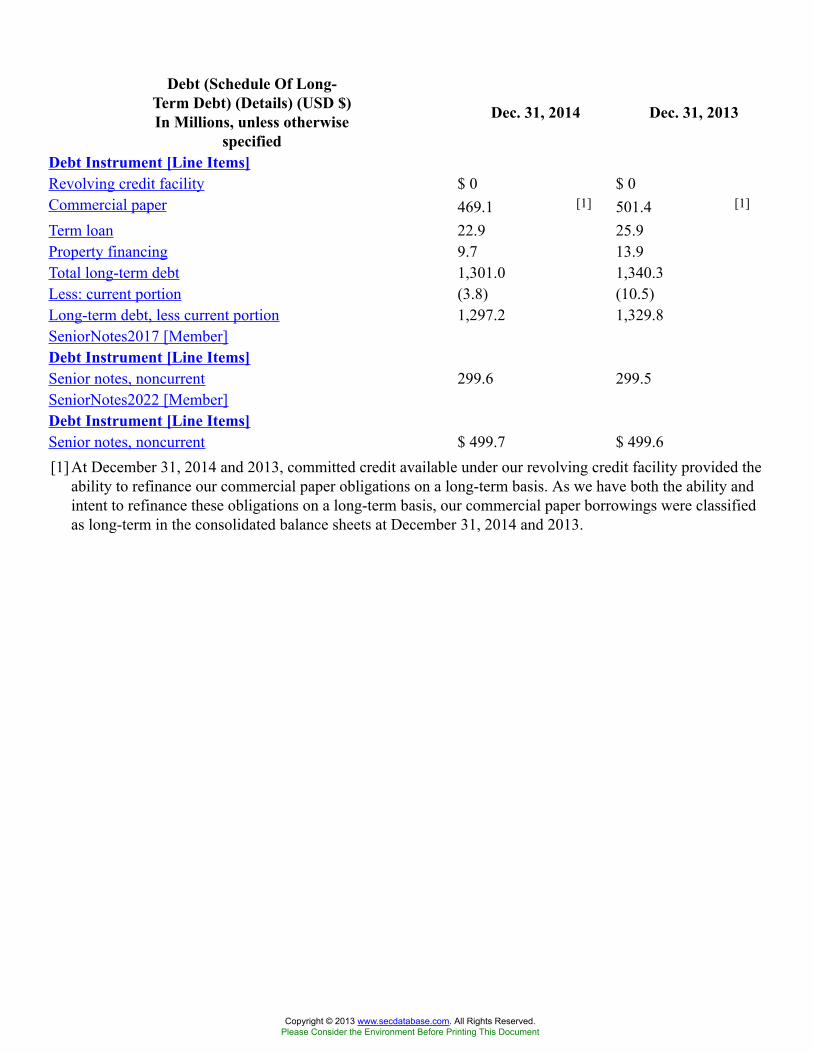
Debt (Schedule Of Long-Term Debt) (Details) (USD $)In Millions, unless otherwise
specified
Dec. 31, 2014 Dec. 31, 2013
Debt Instrument [Line Items]Revolving credit facility $ 0 $ 0Commercial paper 469.1 [1] 501.4 [1]
Term loan 22.9 25.9Property financing 9.7 13.9Total long-term debt 1,301.0 1,340.3Less: current portion (3.8) (10.5)Long-term debt, less current portion 1,297.2 1,329.8SeniorNotes2017 [Member]Debt Instrument [Line Items]Senior notes, noncurrent 299.6 299.5SeniorNotes2022 [Member]Debt Instrument [Line Items]Senior notes, noncurrent $ 499.7 $ 499.6[1] At December 31, 2014 and 2013, committed credit available under our revolving credit facility provided the
ability to refinance our commercial paper obligations on a long-term basis. As we have both the ability andintent to refinance these obligations on a long-term basis, our commercial paper borrowings were classifiedas long-term in the consolidated balance sheets at December 31, 2014 and 2013.
Copyright © 2013 www.secdatabase.com. All Rights Reserved.Please Consider the Environment Before Printing This Document
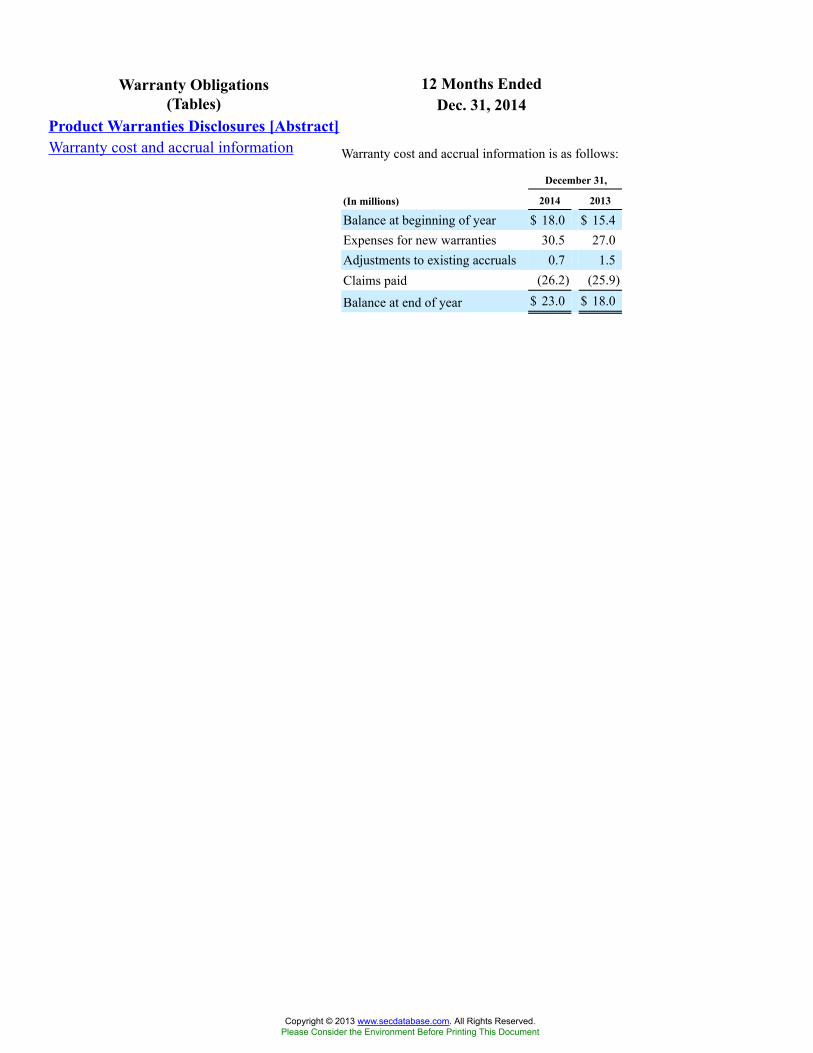
12 Months EndedWarranty Obligations(Tables) Dec. 31, 2014
Product Warranties Disclosures [Abstract]Warranty cost and accrual information Warranty cost and accrual information is as follows:
December 31,
(In millions) 2014 2013
Balance at beginning of year $ 18.0 $ 15.4Expenses for new warranties 30.5 27.0Adjustments to existing accruals 0.7 1.5Claims paid (26.2) (25.9)
Balance at end of year $ 23.0 $ 18.0
Copyright © 2013 www.secdatabase.com. All Rights Reserved.Please Consider the Environment Before Printing This Document
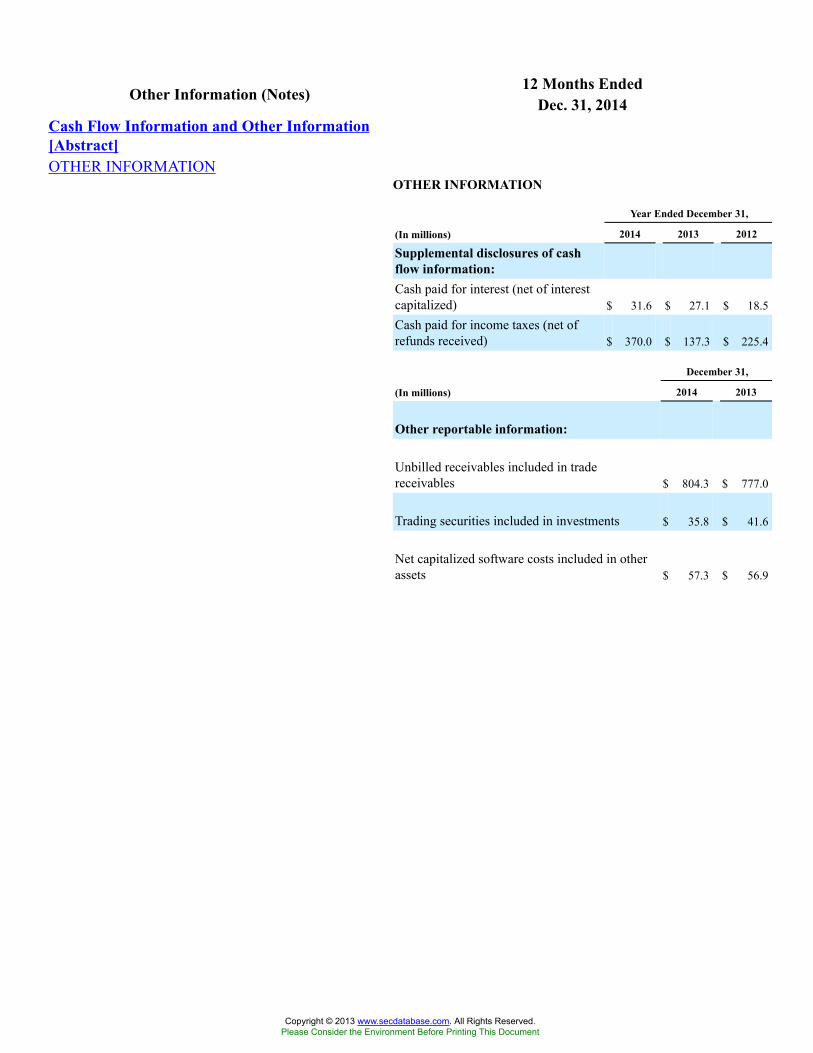
12 Months EndedOther Information (Notes) Dec. 31, 2014Cash Flow Information and Other Information[Abstract]OTHER INFORMATION
OTHER INFORMATION
Year Ended December 31,
(In millions) 2014 2013 2012
Supplemental disclosures of cashflow information:Cash paid for interest (net of interestcapitalized) $ 31.6 $ 27.1 $ 18.5Cash paid for income taxes (net ofrefunds received) $ 370.0 $ 137.3 $ 225.4
December 31,
(In millions) 2014 2013
Other reportable information:
Unbilled receivables included in tradereceivables $ 804.3 $ 777.0
Trading securities included in investments $ 35.8 $ 41.6
Net capitalized software costs included in otherassets $ 57.3 $ 56.9
Copyright © 2013 www.secdatabase.com. All Rights Reserved.Please Consider the Environment Before Printing This Document
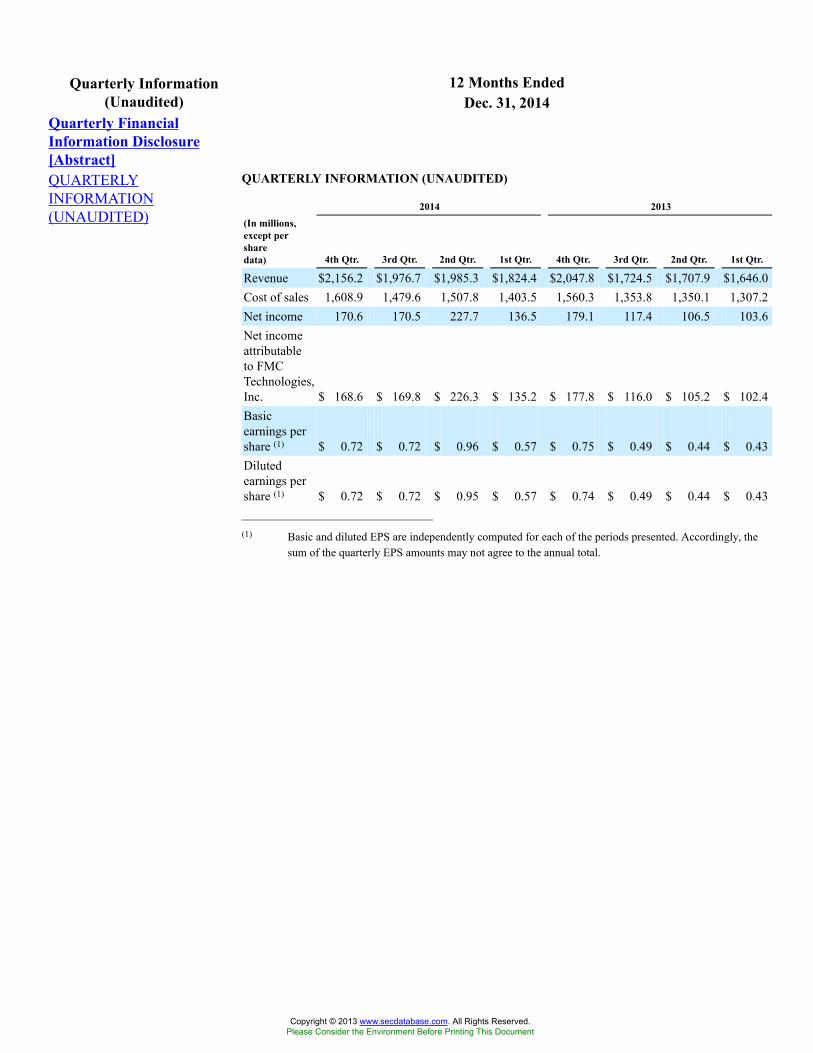
12 Months EndedQuarterly Information(Unaudited) Dec. 31, 2014
Quarterly FinancialInformation Disclosure[Abstract]QUARTERLYINFORMATION(UNAUDITED)
QUARTERLY INFORMATION (UNAUDITED)
2014 2013(In millions,except persharedata) 4th Qtr. 3rd Qtr. 2nd Qtr. 1st Qtr. 4th Qtr. 3rd Qtr. 2nd Qtr. 1st Qtr.
Revenue $2,156.2 $1,976.7 $1,985.3 $1,824.4 $2,047.8 $1,724.5 $1,707.9 $1,646.0Cost of sales 1,608.9 1,479.6 1,507.8 1,403.5 1,560.3 1,353.8 1,350.1 1,307.2Net income 170.6 170.5 227.7 136.5 179.1 117.4 106.5 103.6Net incomeattributableto FMCTechnologies,Inc. $ 168.6 $ 169.8 $ 226.3 $ 135.2 $ 177.8 $ 116.0 $ 105.2 $ 102.4Basicearnings pershare (1) $ 0.72 $ 0.72 $ 0.96 $ 0.57 $ 0.75 $ 0.49 $ 0.44 $ 0.43Dilutedearnings pershare (1) $ 0.72 $ 0.72 $ 0.95 $ 0.57 $ 0.74 $ 0.49 $ 0.44 $ 0.43______________________________(1) Basic and diluted EPS are independently computed for each of the periods presented. Accordingly, the
sum of the quarterly EPS amounts may not agree to the annual total.
Copyright © 2013 www.secdatabase.com. All Rights Reserved.Please Consider the Environment Before Printing This Document
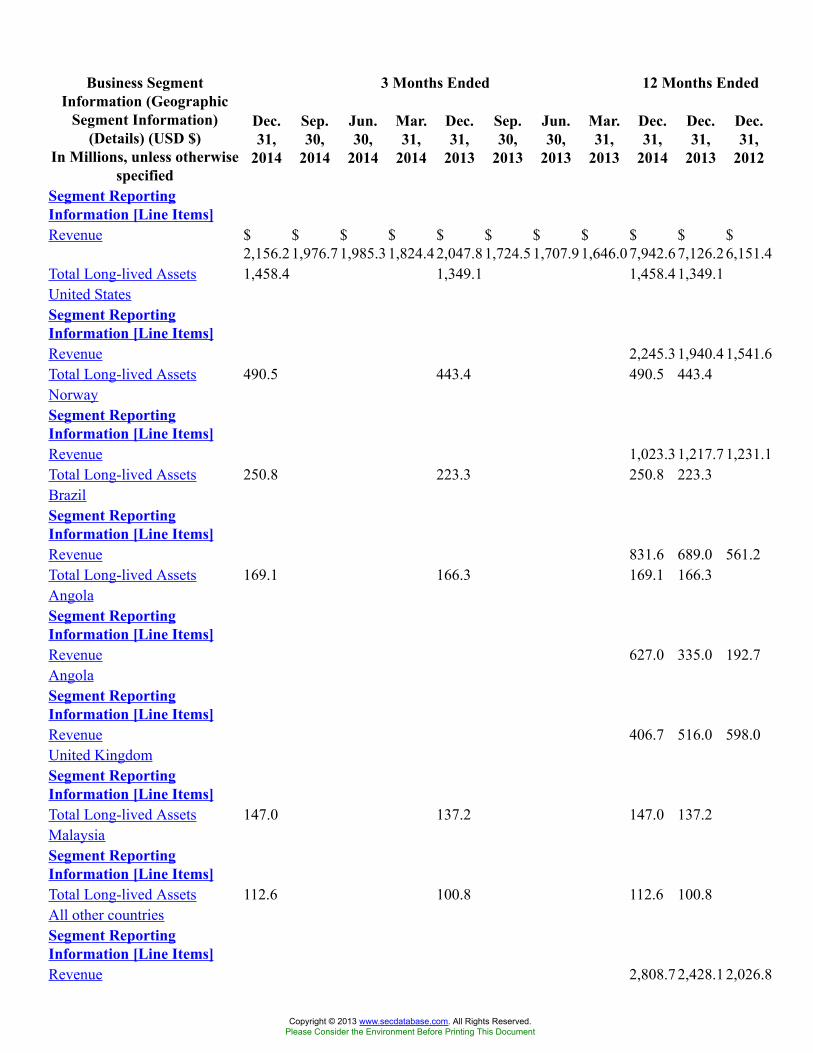
3 Months Ended 12 Months EndedBusiness SegmentInformation (Geographic
Segment Information)(Details) (USD $)
In Millions, unless otherwisespecified
Dec.31,
2014
Sep.30,
2014
Jun.30,
2014
Mar.31,
2014
Dec.31,
2013
Sep.30,
2013
Jun.30,
2013
Mar.31,
2013
Dec.31,
2014
Dec.31,
2013
Dec.31,
2012
Segment ReportingInformation [Line Items]Revenue $
2,156.2$1,976.7
$1,985.3
$1,824.4
$2,047.8
$1,724.5
$1,707.9
$1,646.0
$7,942.6
$7,126.2
$6,151.4
Total Long-lived Assets 1,458.4 1,349.1 1,458.41,349.1United StatesSegment ReportingInformation [Line Items]Revenue 2,245.31,940.4 1,541.6Total Long-lived Assets 490.5 443.4 490.5 443.4NorwaySegment ReportingInformation [Line Items]Revenue 1,023.31,217.7 1,231.1Total Long-lived Assets 250.8 223.3 250.8 223.3BrazilSegment ReportingInformation [Line Items]Revenue 831.6 689.0 561.2Total Long-lived Assets 169.1 166.3 169.1 166.3AngolaSegment ReportingInformation [Line Items]Revenue 627.0 335.0 192.7AngolaSegment ReportingInformation [Line Items]Revenue 406.7 516.0 598.0United KingdomSegment ReportingInformation [Line Items]Total Long-lived Assets 147.0 137.2 147.0 137.2MalaysiaSegment ReportingInformation [Line Items]Total Long-lived Assets 112.6 100.8 112.6 100.8All other countriesSegment ReportingInformation [Line Items]Revenue 2,808.72,428.1 2,026.8
Copyright © 2013 www.secdatabase.com. All Rights Reserved.Please Consider the Environment Before Printing This Document

Total Long-lived Assets $ 288.4 $ 278.1 $ 288.4$ 278.1
Copyright © 2013 www.secdatabase.com. All Rights Reserved.Please Consider the Environment Before Printing This Document
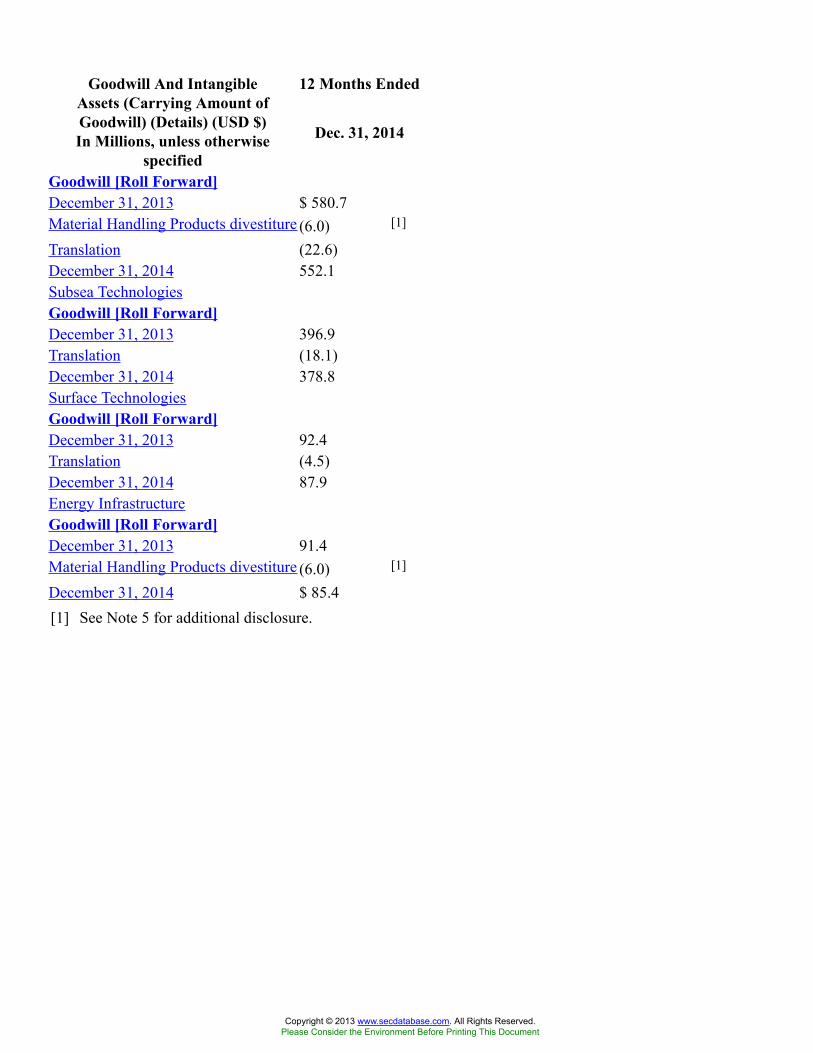
12 Months EndedGoodwill And IntangibleAssets (Carrying Amount ofGoodwill) (Details) (USD $)In Millions, unless otherwise
specified
Dec. 31, 2014
Goodwill [Roll Forward]December 31, 2013 $ 580.7Material Handling Products divestiture (6.0) [1]
Translation (22.6)December 31, 2014 552.1Subsea TechnologiesGoodwill [Roll Forward]December 31, 2013 396.9Translation (18.1)December 31, 2014 378.8Surface TechnologiesGoodwill [Roll Forward]December 31, 2013 92.4Translation (4.5)December 31, 2014 87.9Energy InfrastructureGoodwill [Roll Forward]December 31, 2013 91.4Material Handling Products divestiture (6.0) [1]
December 31, 2014 $ 85.4[1] See Note 5 for additional disclosure.
Copyright © 2013 www.secdatabase.com. All Rights Reserved.Please Consider the Environment Before Printing This Document
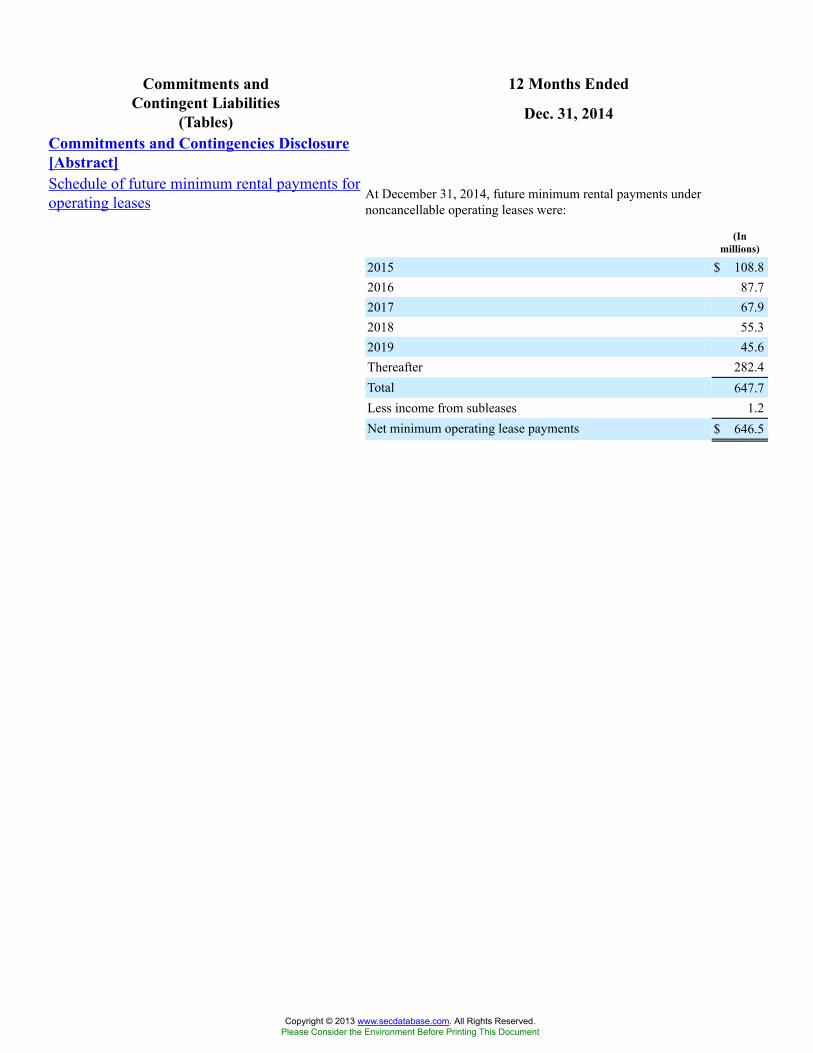
12 Months EndedCommitments andContingent Liabilities
(Tables) Dec. 31, 2014
Commitments and Contingencies Disclosure[Abstract]Schedule of future minimum rental payments foroperating leases At December 31, 2014, future minimum rental payments under
noncancellable operating leases were:
(Inmillions)
2015 $ 108.82016 87.72017 67.92018 55.32019 45.6Thereafter 282.4Total 647.7Less income from subleases 1.2Net minimum operating lease payments $ 646.5
Copyright © 2013 www.secdatabase.com. All Rights Reserved.Please Consider the Environment Before Printing This Document
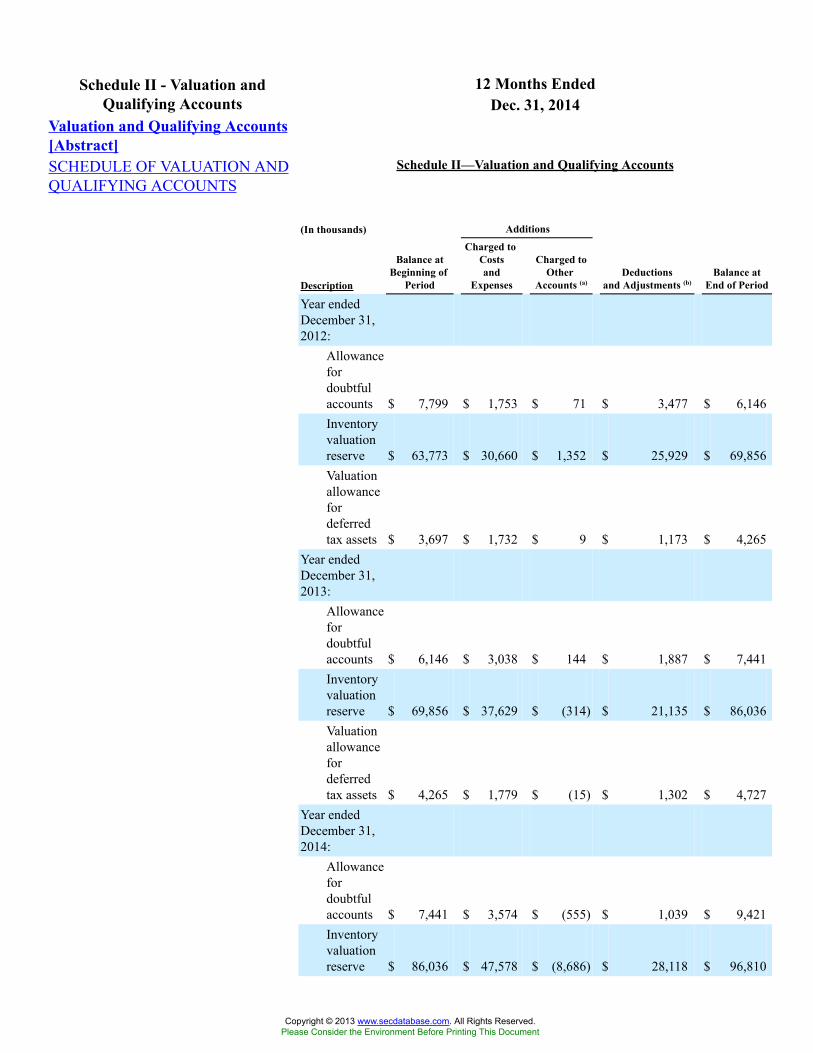
12 Months EndedSchedule II - Valuation andQualifying Accounts Dec. 31, 2014
Valuation and Qualifying Accounts[Abstract]SCHEDULE OF VALUATION ANDQUALIFYING ACCOUNTS
Schedule II—Valuation and Qualifying Accounts
(In thousands) Additions
Description
Balance atBeginning of
Period
Charged toCostsand
Expenses
Charged toOther
Accounts (a)Deductions
and Adjustments (b)Balance at
End of Period
Year endedDecember 31,2012:
Allowancefordoubtfulaccounts $ 7,799 $ 1,753 $ 71 $ 3,477 $ 6,146Inventoryvaluationreserve $ 63,773 $ 30,660 $ 1,352 $ 25,929 $ 69,856Valuationallowancefordeferredtax assets $ 3,697 $ 1,732 $ 9 $ 1,173 $ 4,265
Year endedDecember 31,2013:
Allowancefordoubtfulaccounts $ 6,146 $ 3,038 $ 144 $ 1,887 $ 7,441Inventoryvaluationreserve $ 69,856 $ 37,629 $ (314) $ 21,135 $ 86,036Valuationallowancefordeferredtax assets $ 4,265 $ 1,779 $ (15) $ 1,302 $ 4,727
Year endedDecember 31,2014:
Allowancefordoubtfulaccounts $ 7,441 $ 3,574 $ (555) $ 1,039 $ 9,421Inventoryvaluationreserve $ 86,036 $ 47,578 $ (8,686) $ 28,118 $ 96,810
Copyright © 2013 www.secdatabase.com. All Rights Reserved.Please Consider the Environment Before Printing This Document
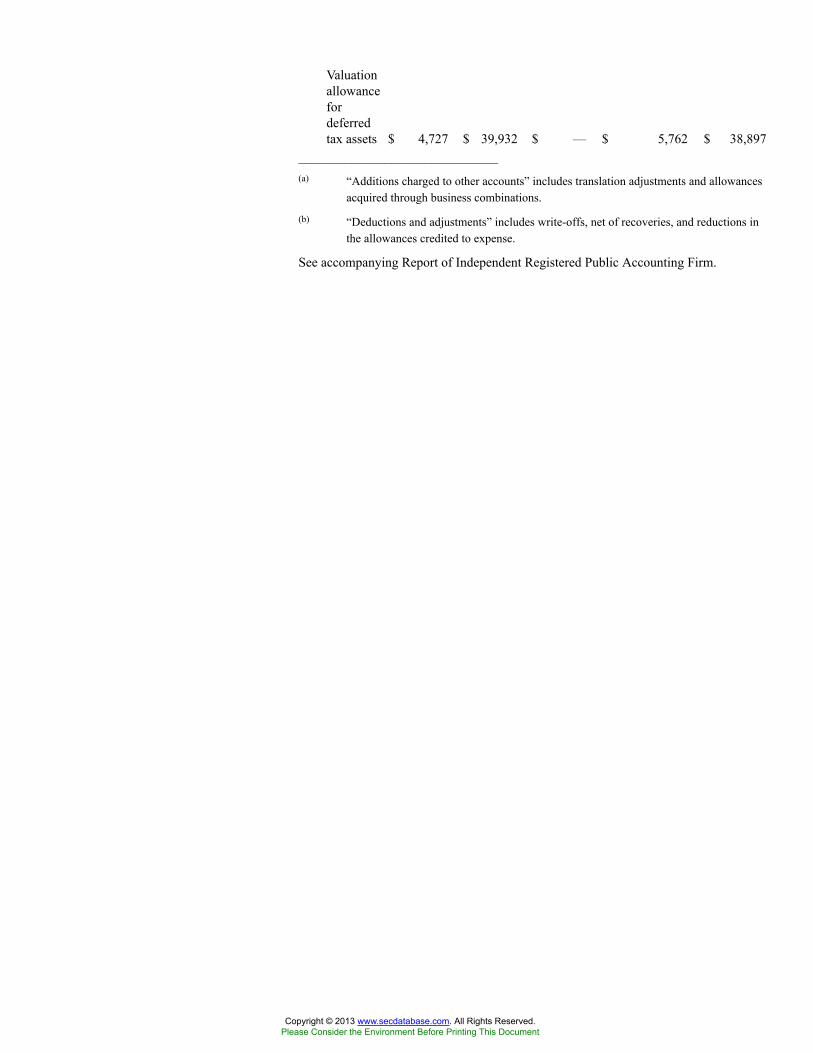
Valuationallowancefordeferredtax assets $ 4,727 $ 39,932 $ — $ 5,762 $ 38,897
______________________________(a) “Additions charged to other accounts” includes translation adjustments and allowances
acquired through business combinations.
(b) “Deductions and adjustments” includes write-offs, net of recoveries, and reductions inthe allowances credited to expense.
See accompanying Report of Independent Registered Public Accounting Firm.
Copyright © 2013 www.secdatabase.com. All Rights Reserved.Please Consider the Environment Before Printing This Document

12 Months EndedBasis of Presentation andSummary of Significant
Accounting Policies (Policy) Dec. 31, 2014
Accounting Policies[Abstract]Basis of presentation Basis of presentation—Our consolidated financial statements have been prepared in U.S. dollars
and in accordance with U.S. generally accepted accounting principles (“GAAP”).
On February 25, 2011, our Board of Directors approved a two-for-one stock split of ouroutstanding shares of common stock. The stock split was completed in the form of a stockdividend; however, upon issuance of the common stock pursuant to the stock split, an amountequal to the aggregate par value of the additional shares of common stock issued was notreclassified from capital in excess of par value to common stock during the first quarter of 2011.This adjustment was made during the first quarter of 2014. All prior-year amounts have beenrevised to conform to the current year presentation. This adjustment had no overall effect on totalequity and did not impact our overall financial position or results of operations for any periodpresented.
Principles of consolidationPrinciples of consolidation—The consolidated financial statements include the accounts of FMCTechnologies and its majority-owned subsidiaries and affiliates. Intercompany accounts andtransactions are eliminated in consolidation.
Use of estimatesUse of estimates—The preparation of financial statements in conformity with GAAP requiresmanagement to make estimates and assumptions that affect the reported amounts of assets andliabilities and disclosures of contingent assets and liabilities at the date of the financial statementsand the reported amounts of revenue and expenses during the reporting period. Actual resultscould differ from those estimates. Such estimates include, but are not limited to, estimates of totalcontract profit or loss on long-term construction-type contracts; estimated realizable value onexcess and obsolete inventory; estimates related to pension accounting; estimates related to fairvalue for purposes of assessing goodwill, long-lived assets and intangible assets for impairment;estimates related to income taxes; and estimates related to contingencies, including liquidateddamages.
Investments in the commonstock of unconsolidatedaffiliates
Investments in the common stock of unconsolidated affiliates—The investments in, and theoperating results of, unconsolidated affiliates are included in the consolidated financial statementson the basis of the equity method of accounting or the cost method of accounting, depending onspecific facts and circumstances.
Investments in unconsolidated affiliates are assessed for impairment whenever events or changesin facts and circumstances indicate the carrying value of the investments may not be fullyrecoverable. When such a condition is judgmentally determined to be other than temporary, thecarrying value of the investment is written down to fair value. Management’s assessment as towhether any decline in value is other than temporary is based on our ability and intent to hold theinvestment and whether evidence indicating the carrying value of the investment is recoverablewithin a reasonable period of time outweighs evidence to the contrary. Management generallyconsiders our investments in equity method investees to be strategic long-term investments andcompletes its assessments for impairment with a long-term viewpoint.
ReclassificationsReclassifications—Certain prior-year amounts have been reclassified to conform to the currentyear’s presentation.
Revenue recognitionRevenue recognition—Revenue is generally recognized once the following four criteria are met:i) persuasive evidence of an arrangement exists, ii) delivery of the equipment has occurred (whichis upon shipment or when customer-specific acceptance requirements are met) or services havebeen rendered, iii) the price of the equipment or service is fixed and determinable, and iv)collectibility is reasonably assured. We record our sales net of any value added, sales or use tax.
Copyright © 2013 www.secdatabase.com. All Rights Reserved.Please Consider the Environment Before Printing This Document

For certain construction-type manufacturing and assembly projects that involve significant designand engineering efforts in order to satisfy detailed customer-supplied specifications, revenue isrecognized using the percentage of completion method of accounting. Under the percentage ofcompletion method, revenue is recognized as work progresses on each contract. We primarilyapply the ratio of costs incurred to date to total estimated contract costs at completion to measurethis ratio. If it is not possible to form a reliable estimate of progress toward completion, norevenue or costs are recognized until the project is complete or substantially complete. Anyexpected losses on construction-type contracts in progress are charged to earnings, in total, in theperiod the losses are identified.Modifications to construction-type contracts, referred to as “change orders,” effectively changethe provisions of the original contract, and may, for example, alter the specifications or design,method or manner of performance, equipment, materials, sites and/or period for completion of thework. If a change order represents a firm price commitment from a customer, we account for therevised estimate as if it had been included in the original estimate, effectively recognizing the prorata impact of the new estimate on our calculation of progress toward completion in the period inwhich the firm commitment is received. If a change order is unpriced: (1) we include the costs ofcontract performance in our calculation of progress toward completion in the period in which thecosts are incurred or become probable; and (2) when it is determined that the revenue is probableof recovery, we include the change order revenue, limited to the costs incurred to date related tothe change order, in our calculation of progress toward completion. Unpriced change ordersincluded in revenue were immaterial to our consolidated revenue for all periods presented.Margin is not recorded on unpriced change orders unless realization is assured beyond areasonable doubt. The assessment of realization may be based upon our previous experience withthe customer or based upon our receipt of a firm price commitment from the customer.
Progress billings are generally issued upon completion of certain phases of the work as stipulatedin the contract. Revenue in excess of progress billings are reported in trade receivables in ourconsolidated balance sheets. Progress billings and cash collections in excess of revenuerecognized on a contract are classified as advance payments and progress billings within currentliabilities in our consolidated balance sheets. Revenue generated from the installation portion ofconstruction-type contracts is included in product revenue in our consolidated statements ofincome.
Shipping and handling costsShipping and handling costs—Shipping and handling costs are recorded as cost of productrevenue in our consolidated statements of income. Shipping and handling costs billed tocustomers are recorded as a component of revenue.
Cash equivalentsCash equivalents—Cash equivalents are highly-liquid, short-term instruments with originalmaturities of three months or less from their date of purchase.
Trade receivablesTrade receivables, net of allowances—An allowance for doubtful accounts is provided on tradereceivables equal to the estimated uncollectible amounts. This estimate is based on historicalcollection experience and a specific review of each customer’s trade receivable balance.
InventoriesInventories—Inventories are stated at the lower of cost or net realizable value. Inventory costsinclude those costs directly attributable to products, including all manufacturing overhead, butexcluding costs to distribute. Cost is determined on the last-in, first-out (“LIFO”) basis for allsignificant domestic inventories, except certain inventories relating to construction-type contracts,which are stated at the actual production cost incurred to date, reduced by the portion of thesecosts identified with revenue recognized. The first-in, first-out (“FIFO”) method is used todetermine the cost for all other inventories.
InvestmentsInvestments—The appropriate classification of investments in marketable equity securities isdetermined at the time of purchase and re-evaluated as of each subsequent reporting date.Securities classified as available-for-sale are carried at fair value with unrealized holding gainsand losses on these securities recognized in accumulated other comprehensive income (loss), netof related income tax. We did not have any available-for-sale securities at December 31, 2014 or2013.
Copyright © 2013 www.secdatabase.com. All Rights Reserved.Please Consider the Environment Before Printing This Document
Securities classified as trading securities are carried at fair value with gains and losses on thesesecurities recognized through other income (expense), net. Trading securities are primarilycomprised of marketable equity mutual funds that approximate a portion of our liability under ourNon-Qualified Savings and Investment Plan (“Non-Qualified Plan”).
Property, plant, and equipment Property, plant, and equipment—Property, plant, and equipment is recorded at cost. Depreciationis principally provided on the straight-line basis over the estimated useful lives of the assets (landimprovements—20 to 35 years; buildings—20 to 50 years; and machinery and equipment—3 to20 years). Gains and losses are realized upon the sale or retirement of assets and are recorded inother income (expense), net on our consolidated statements of income. Maintenance and repaircosts are expensed as incurred. Expenditures that extend the useful lives of property, plant andequipment are capitalized and depreciated over the estimated new remaining life of the asset.
Impairment of property, plant,and equipment
Impairment of property, plant, and equipment—Property, plant and equipment are reviewed forimpairment whenever events or changes in circumstances indicate the carrying value of the long-lived asset may not be recoverable. The carrying value of a long-lived asset is not recoverable if itexceeds the sum of the undiscounted cash flows expected to result from the use and eventualdisposition of the asset. If it is determined that an impairment loss has occurred, the impairmentloss is measured as the amount by which the carrying value of the long-lived asset exceeds its fairvalue.
Long-lived assets held for sale are reported at the lower of carrying value or fair value less cost tosell.
Capitalized software costsCapitalized software costs—Other assets on the consolidated balance sheets include thecapitalized cost of internal use software (including Internet websites). The assets are stated at costless accumulated amortization. These software costs include significant purchases of softwareand internal and external costs incurred during the application development stage of softwareprojects. These costs are amortized on a straight-line basis over the estimated useful lives of theassets. For internal use software, the useful lives range from three to ten years. For Internetwebsite costs, the estimated useful lives do not exceed three years.
Goodwill and other intangibleassets Goodwill and other intangible assets—Goodwill is not subject to amortization but is tested for
impairment on an annual basis (or more frequently if impairment indicators arise). We haveestablished October 31 as the date of our annual test for impairment of goodwill. Reporting unitswith goodwill are tested for impairment by first assessing qualitative factors to determine whetherthe existence of events or circumstances leads to a determination that it is more likely than notthat the fair value of the reporting unit is less than its carrying amount. If after assessing thetotality of events or circumstances, or based on management’s judgment, we determine it is morelikely than not that the fair value of a reporting unit is less than its carrying amount, a two-stepimpairment test is performed. The first step compares the fair value of the reporting unit(measured as the present value of expected future cash flows) to its carrying amount. If the fairvalue of the reporting unit is less than its carrying amount, a second step is performed. In thisstep, the fair value of the reporting unit is allocated to its assets and liabilities to determine theimplied fair value of goodwill, which is used to measure the impairment loss.
Our acquired intangible assets are amortized on a straight-line basis over their estimated usefullives, which generally range from 7 to 40 years. Our acquired intangible assets do not haveindefinite lives. Intangible assets are reviewed for impairment whenever events or changes incircumstances indicate the carrying amount of the intangible asset may not be recoverable. Thecarrying amount of an intangible asset is not recoverable if it exceeds the sum of theundiscounted cash flows expected to result from the use and eventual disposition of the asset. If itis determined that an impairment loss has occurred, the loss is measured as the amount by whichthe carrying amount of the intangible asset exceeds its fair value.
Fair value measurementsFair value measurements—We record our financial assets and financial liabilities at fair value.Fair value is defined as the price that would be received to sell an asset or paid to transfer aliability (an exit price) in an orderly transaction between market participants at the reporting date.The fair value framework requires the categorization of assets and liabilities into three levelsbased upon the assumptions (inputs) used to price the assets or liabilities. Level 1 provides the
Copyright © 2013 www.secdatabase.com. All Rights Reserved.Please Consider the Environment Before Printing This Document
most reliable measure of fair value, whereas Level 3 generally requires significant managementjudgment. The three levels are defined as follows:
• Level 1: Unadjusted quoted prices in active markets for identical assets and liabilities.
• Level 2: Observable inputs other than quoted prices included in Level 1. For example,quoted prices for similar assets or liabilities in active markets or quoted prices foridentical assets or liabilities in inactive markets.
• Level 3: Unobservable inputs reflecting management’s own assumptions about theassumptions market participants would use in pricing the asset or liability.
Income taxes Income taxes—Current income taxes are provided on income reported for financial statementpurposes, adjusted for transactions that do not enter into the computation of income taxes payablein the same year. Deferred tax assets and liabilities are measured using enacted tax rates for theexpected future tax consequences of temporary differences between the carrying amounts and thetax bases of assets and liabilities. A valuation allowance is established whenever managementbelieves that it is more likely than not that deferred tax assets may not be realizable.
U.S. income taxes are not provided on our equity in undistributed earnings of foreign subsidiariesor affiliates to the extent we have determined that the earnings are indefinitely reinvested. U.S.income taxes are provided on such earnings in the period in which we can no longer support thatsuch earnings are indefinitely reinvested.
Tax benefits related to uncertain tax positions are recognized when it is more likely than not,based on the technical merits, that the position will be sustained upon examination.
We classify interest expense and penalties recognized on underpayments of income taxes asincome tax expense.
Stock-based employeecompensation Stock-based employee compensation—We measure stock-based compensation expense on
restricted stock awards based on the market price at the grant date and the number of sharesawarded. The stock-based compensation expense for each award is recognized ratably over theapplicable service period, after taking into account estimated forfeitures, or the period beginningat the start of the service period and ending when an employee becomes eligible for retirement.
Common stock held inemployee benefit trust Common stock held in employee benefit trust—Shares of our common stock are purchased by the
plan administrator of the Non-Qualified Plan and placed in a trust owned by us. Purchased sharesare recorded at cost and classified as a reduction of stockholders’ equity on the consolidatedbalance sheets.
Earnings per common share(“EPS”) Earnings per common share (“EPS”)—Basic EPS is computed using the weighted-average
number of common shares outstanding during the year. Diluted EPS gives effect to the potentialdilution of earnings that could have occurred if additional shares were issued for stock optionexercises and restricted stock under the treasury stock method. The treasury stock methodassumes proceeds that would be obtained upon exercise of common stock options and issuance ofrestricted stock are used to buy back outstanding common stock at the average market priceduring the period.
Warranty obligationsWarranty obligations—We provide warranties of various lengths and terms to certain of ourcustomers based on standard terms and conditions and negotiated agreements. Estimated cost ofwarranties are accrued at the time revenue is recognized for products where reliable, historicalexperience of warranty claims and costs exists or when additional specific obligations areidentified. The obligation reflected in other current liabilities on the consolidated balance sheetsis based on historical experience by product and considers failure rates and the related costs incorrecting a product failure. Should actual product failure rates or repair costs differ from ourcurrent estimates, revisions to the estimated warranty liability would be required.
Foreign currencyForeign currency—Financial statements of operations for which the U.S. dollar is not thefunctional currency, and are located in non-highly inflationary countries, are translated into U.S.dollars prior to consolidation. Assets and liabilities are translated at the exchange rate in effect atthe balance sheet date, while income statement accounts are translated at the average exchange
Copyright © 2013 www.secdatabase.com. All Rights Reserved.Please Consider the Environment Before Printing This Document
rate for each period. For these operations, translation gains and losses are recorded as acomponent of accumulated other comprehensive income (loss) in stockholders’ equity until theforeign entity is sold or liquidated. For operations in highly inflationary countries and where thelocal currency is not the functional currency, inventories, property, plant and equipment, andother non-current assets are converted to U.S. dollars at historical exchange rates, and all gains orlosses from conversion are included in net income. Foreign currency effects on cash, cashequivalents and debt in hyperinflationary economies are included in interest income or expense.
Derivative instruments Derivative instruments—Derivatives are recognized on the consolidated balance sheets at fairvalue, with classification as current or non-current based upon the maturity of the derivativeinstrument. Changes in the fair value of derivative instruments are recorded in current earnings ordeferred in accumulated other comprehensive income (loss), depending on the type of hedgingtransaction and whether a derivative is designated as, and is effective as, a hedge. Eachinstrument is accounted for individually and assets and liabilities are not offset.
Hedge accounting is only applied when the derivative is deemed to be highly effective atoffsetting changes in anticipated cash flows of the hedged item or transaction. Changes in fairvalue of derivatives that are designated as cash flow hedges are deferred in accumulated othercomprehensive income (loss) until the underlying transactions are recognized in earnings. At suchtime, related deferred hedging gains or losses are also recorded in operating earnings on the sameline as the hedged item. Effectiveness is assessed at the inception of the hedge and on a quarterlybasis. Effectiveness of forward contract cash flow hedges are assessed based solely on changes infair value attributable to the change in the spot rate. The change in the fair value of the contractrelated to the change in forward rates is excluded from the assessment of hedge effectiveness.Changes in this excluded component of the derivative instrument, along with any ineffectivenessidentified, are recorded in operating earnings as incurred. We document our risk managementstrategy and hedge effectiveness at the inception of, and during the term of, each hedge.
We also use forward contracts to hedge foreign currency assets and liabilities, for which we donot apply hedge accounting. The changes in fair value of these contracts are recognized in otherincome (expense), net on our consolidated statements of income, as they occur and offset gains orlosses on the remeasurement of the related asset or liability.
Cash flows from derivative contracts are reported in the consolidated statements of cash flows inthe same categories as the cash flows from the underlying transactions.
Copyright © 2013 www.secdatabase.com. All Rights Reserved.Please Consider the Environment Before Printing This Document
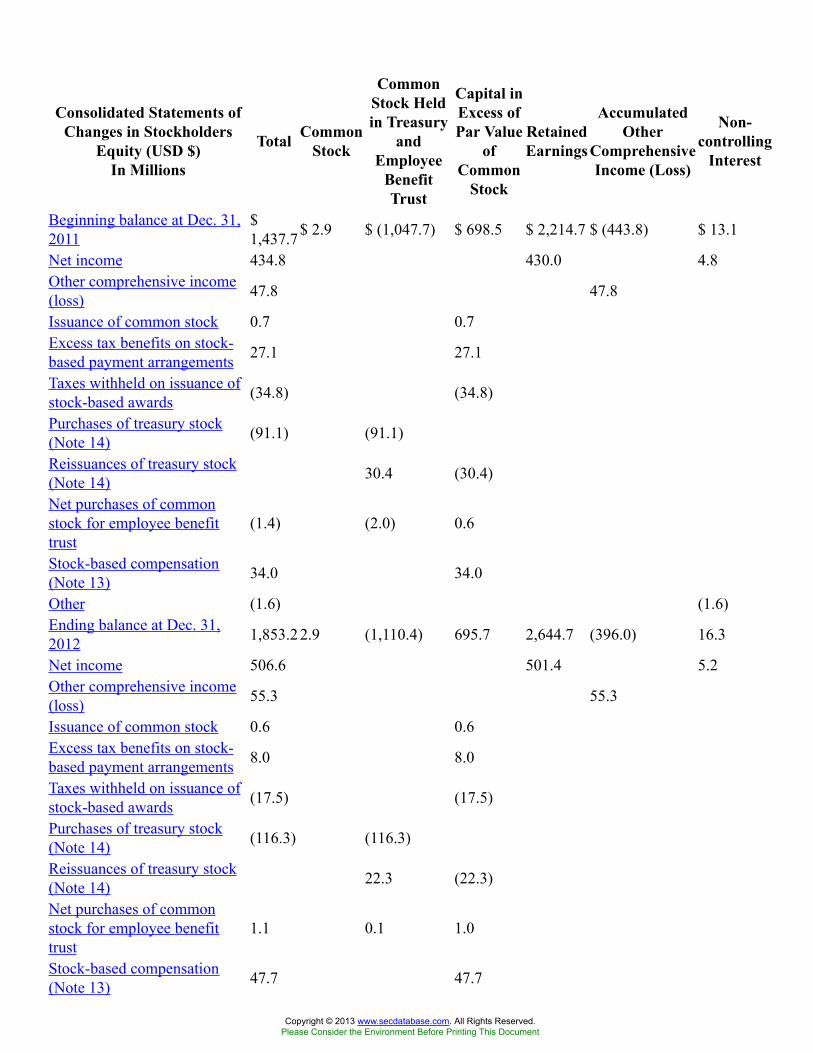
Consolidated Statements ofChanges in Stockholders
Equity (USD $)In Millions
Total CommonStock
CommonStock Heldin Treasury
andEmployee
BenefitTrust
Capital inExcess ofPar Value
ofCommon
Stock
RetainedEarnings
AccumulatedOther
ComprehensiveIncome (Loss)
Non-controlling
Interest
Beginning balance at Dec. 31,2011
$1,437.7$ 2.9 $ (1,047.7) $ 698.5 $ 2,214.7 $ (443.8) $ 13.1
Net income 434.8 430.0 4.8Other comprehensive income(loss) 47.8 47.8
Issuance of common stock 0.7 0.7Excess tax benefits on stock-based payment arrangements 27.1 27.1
Taxes withheld on issuance ofstock-based awards (34.8) (34.8)
Purchases of treasury stock(Note 14) (91.1) (91.1)
Reissuances of treasury stock(Note 14) 30.4 (30.4)
Net purchases of commonstock for employee benefittrust
(1.4) (2.0) 0.6
Stock-based compensation(Note 13) 34.0 34.0
Other (1.6) (1.6)Ending balance at Dec. 31,2012 1,853.22.9 (1,110.4) 695.7 2,644.7 (396.0) 16.3
Net income 506.6 501.4 5.2Other comprehensive income(loss) 55.3 55.3
Issuance of common stock 0.6 0.6Excess tax benefits on stock-based payment arrangements 8.0 8.0
Taxes withheld on issuance ofstock-based awards (17.5) (17.5)
Purchases of treasury stock(Note 14) (116.3) (116.3)
Reissuances of treasury stock(Note 14) 22.3 (22.3)
Net purchases of commonstock for employee benefittrust
1.1 0.1 1.0
Stock-based compensation(Note 13) 47.7 47.7
Copyright © 2013 www.secdatabase.com. All Rights Reserved.Please Consider the Environment Before Printing This Document
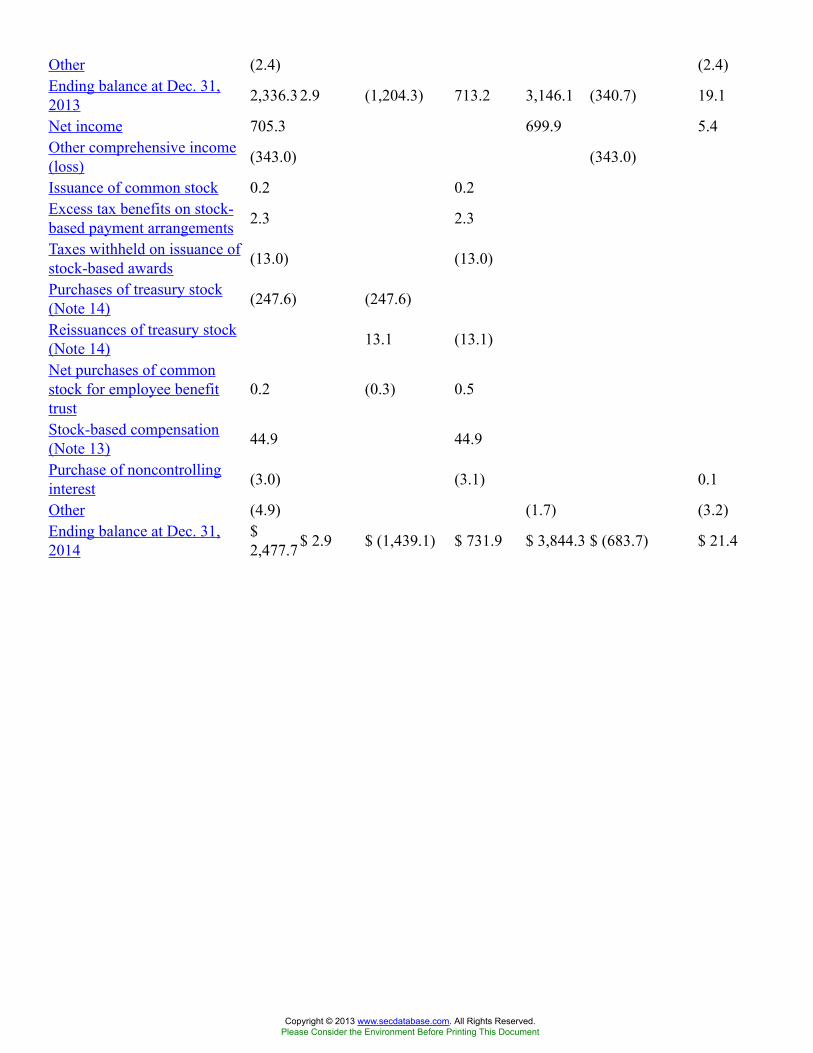
Other (2.4) (2.4)Ending balance at Dec. 31,2013 2,336.32.9 (1,204.3) 713.2 3,146.1 (340.7) 19.1
Net income 705.3 699.9 5.4Other comprehensive income(loss) (343.0) (343.0)
Issuance of common stock 0.2 0.2Excess tax benefits on stock-based payment arrangements 2.3 2.3
Taxes withheld on issuance ofstock-based awards (13.0) (13.0)
Purchases of treasury stock(Note 14) (247.6) (247.6)
Reissuances of treasury stock(Note 14) 13.1 (13.1)
Net purchases of commonstock for employee benefittrust
0.2 (0.3) 0.5
Stock-based compensation(Note 13) 44.9 44.9
Purchase of noncontrollinginterest (3.0) (3.1) 0.1
Other (4.9) (1.7) (3.2)Ending balance at Dec. 31,2014
$2,477.7$ 2.9 $ (1,439.1) $ 731.9 $ 3,844.3 $ (683.7) $ 21.4
Copyright © 2013 www.secdatabase.com. All Rights Reserved.Please Consider the Environment Before Printing This Document
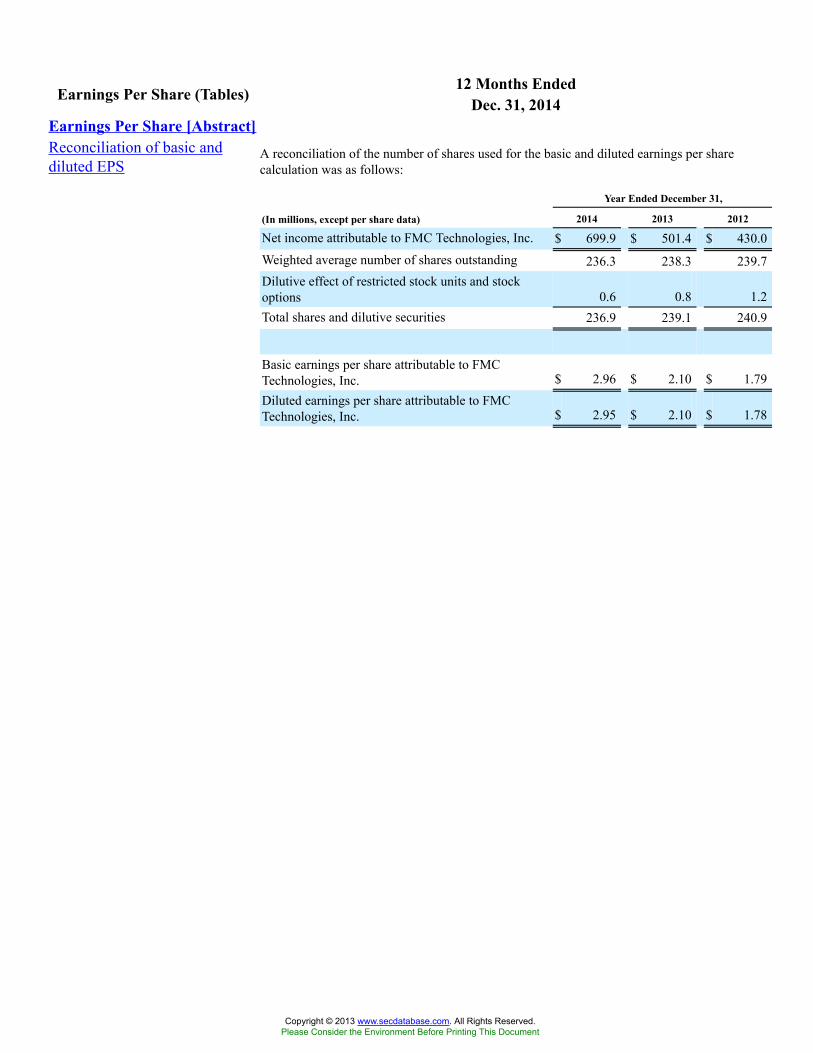
12 Months EndedEarnings Per Share (Tables) Dec. 31, 2014Earnings Per Share [Abstract]Reconciliation of basic anddiluted EPS
A reconciliation of the number of shares used for the basic and diluted earnings per sharecalculation was as follows:
Year Ended December 31,
(In millions, except per share data) 2014 2013 2012
Net income attributable to FMC Technologies, Inc. $ 699.9 $ 501.4 $ 430.0Weighted average number of shares outstanding 236.3 238.3 239.7Dilutive effect of restricted stock units and stockoptions 0.6 0.8 1.2Total shares and dilutive securities 236.9 239.1 240.9
Basic earnings per share attributable to FMCTechnologies, Inc. $ 2.96 $ 2.10 $ 1.79Diluted earnings per share attributable to FMCTechnologies, Inc. $ 2.95 $ 2.10 $ 1.78
Copyright © 2013 www.secdatabase.com. All Rights Reserved.Please Consider the Environment Before Printing This Document
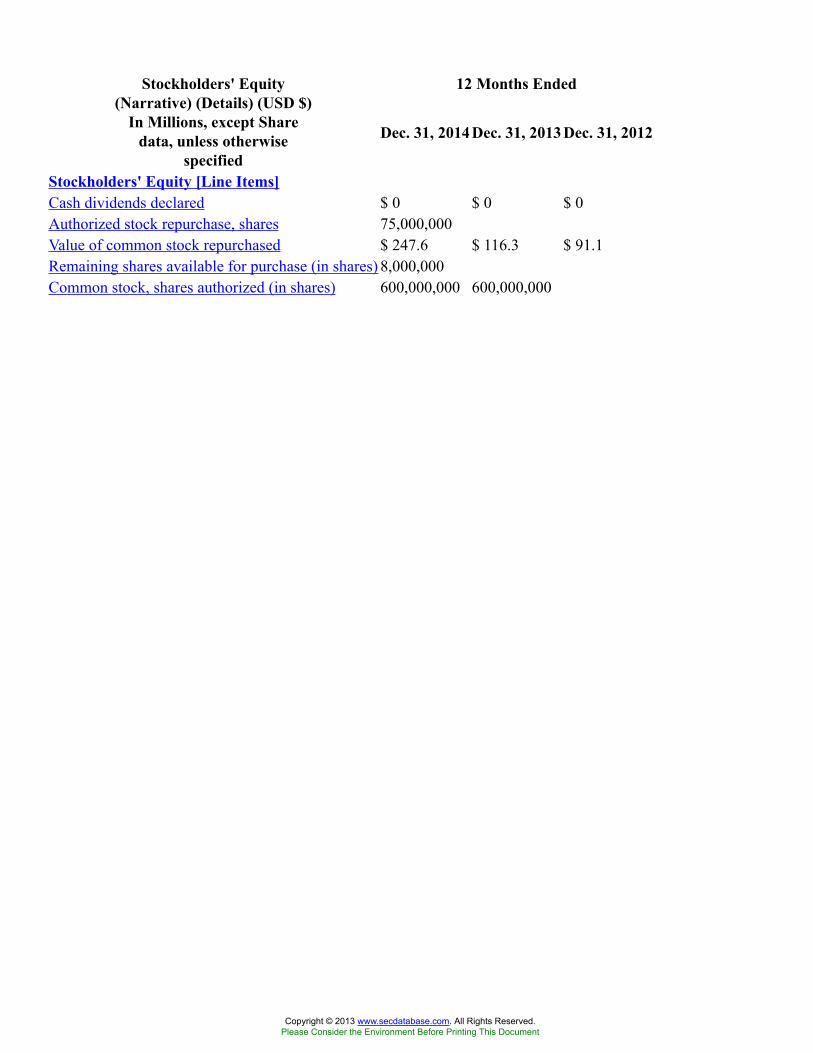
12 Months EndedStockholders' Equity(Narrative) (Details) (USD $)
In Millions, except Sharedata, unless otherwise
specified
Dec. 31, 2014 Dec. 31, 2013 Dec. 31, 2012
Stockholders' Equity [Line Items]Cash dividends declared $ 0 $ 0 $ 0Authorized stock repurchase, shares 75,000,000Value of common stock repurchased $ 247.6 $ 116.3 $ 91.1Remaining shares available for purchase (in shares) 8,000,000Common stock, shares authorized (in shares) 600,000,000 600,000,000
Copyright © 2013 www.secdatabase.com. All Rights Reserved.Please Consider the Environment Before Printing This Document
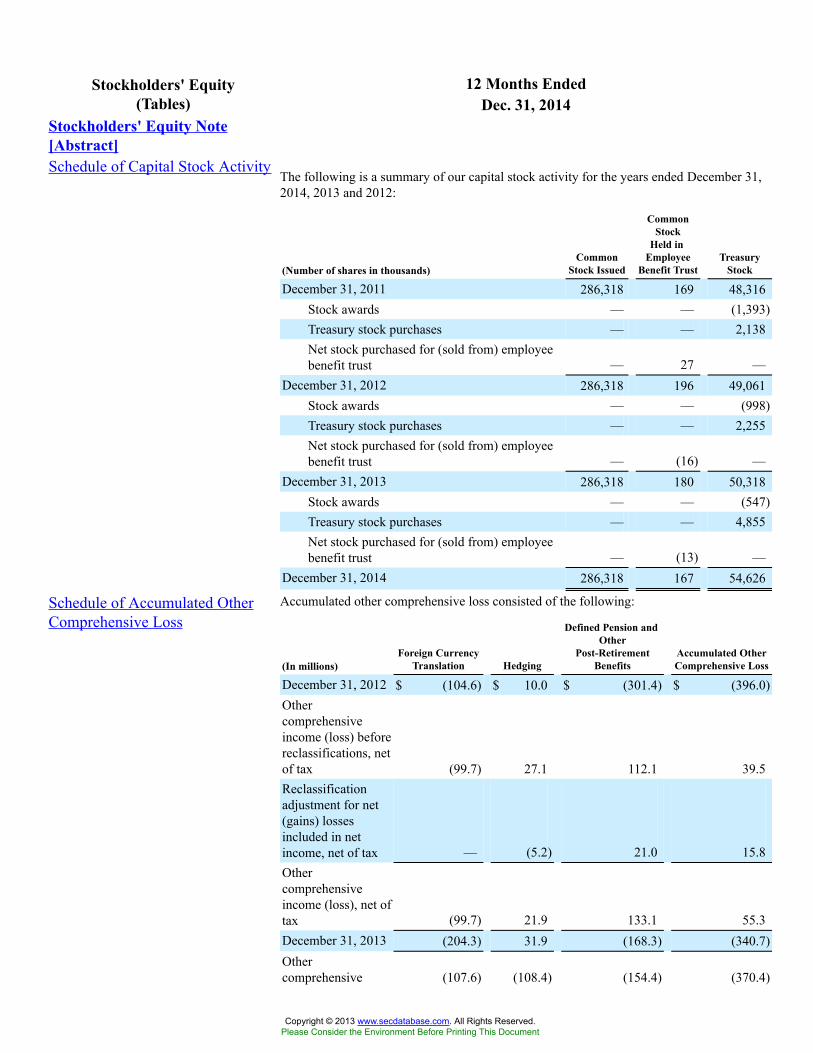
12 Months EndedStockholders' Equity(Tables) Dec. 31, 2014
Stockholders' Equity Note[Abstract]Schedule of Capital Stock Activity
The following is a summary of our capital stock activity for the years ended December 31,2014, 2013 and 2012:
(Number of shares in thousands)Common
Stock Issued
CommonStock
Held inEmployee
Benefit TrustTreasury
Stock
December 31, 2011 286,318 169 48,316Stock awards — — (1,393)Treasury stock purchases — — 2,138Net stock purchased for (sold from) employeebenefit trust — 27 —
December 31, 2012 286,318 196 49,061Stock awards — — (998)Treasury stock purchases — — 2,255Net stock purchased for (sold from) employeebenefit trust — (16) —
December 31, 2013 286,318 180 50,318Stock awards — — (547)Treasury stock purchases — — 4,855Net stock purchased for (sold from) employeebenefit trust — (13) —
December 31, 2014 286,318 167 54,626
Schedule of Accumulated OtherComprehensive Loss
Accumulated other comprehensive loss consisted of the following:
(In millions)Foreign Currency
Translation Hedging
Defined Pension andOther
Post-RetirementBenefits
Accumulated OtherComprehensive Loss
December 31, 2012 $ (104.6) $ 10.0 $ (301.4) $ (396.0)Othercomprehensiveincome (loss) beforereclassifications, netof tax (99.7) 27.1 112.1 39.5Reclassificationadjustment for net(gains) lossesincluded in netincome, net of tax — (5.2) 21.0 15.8Othercomprehensiveincome (loss), net oftax (99.7) 21.9 133.1 55.3December 31, 2013 (204.3) 31.9 (168.3) (340.7)Othercomprehensive (107.6) (108.4) (154.4) (370.4)
Copyright © 2013 www.secdatabase.com. All Rights Reserved.Please Consider the Environment Before Printing This Document

income (loss) beforereclassifications, netof taxReclassificationadjustment for net(gains) lossesincluded in netincome, net of tax — (0.8) 28.2 27.4Othercomprehensiveincome (loss), net oftax (107.6) (109.2) (126.2) (343.0)December 31, 2014 $ (311.9) $ (77.3) $ (294.5) $ (683.7)
Reclassification out ofAccumulated OtherComprehensive Income
Reclassifications out of accumulated other comprehensive loss consisted of the following:
Year Ended
(In millions) December 31, 2014 December 31, 2013
Details about Accumulated OtherComprehensive Loss Components
Amount Reclassified out of AccumulatedOther Comprehensive Loss
Affected Line Item in theConsolidated Statementof Income
Gains (losses) on hedginginstrumentsForeign exchange contracts: $ (36.2) $ (11.7) Revenue
34.2 14.8 Costs of sales
(0.2) —
Selling, general andadministrativeexpense
(2.2) 3.1Income beforeincome taxes
3.0 2.1Income tax(expense) benefit
$ 0.8 $ 5.2 Net incomeDefined pension and otherpost-retirement benefitsSettlements $ (24.9) $ (5.1) (a)
Amortization of actuarial loss (18.6) (31.7) (a)
Amortization of prior servicecredit (0.3) 0.5 (a)
Amortization of transitionasset 0.1 0.1 (a)
(43.7) (36.2)Income beforeincome taxes
15.5 15.2Income tax(expense) benefit
$ (28.2) $ (21.0) Net income_______________________(a) These accumulated other comprehensive income components are included in the
computation of net periodic pension cost (see Note 12 for additional details).
Copyright © 2013 www.secdatabase.com. All Rights Reserved.Please Consider the Environment Before Printing This Document
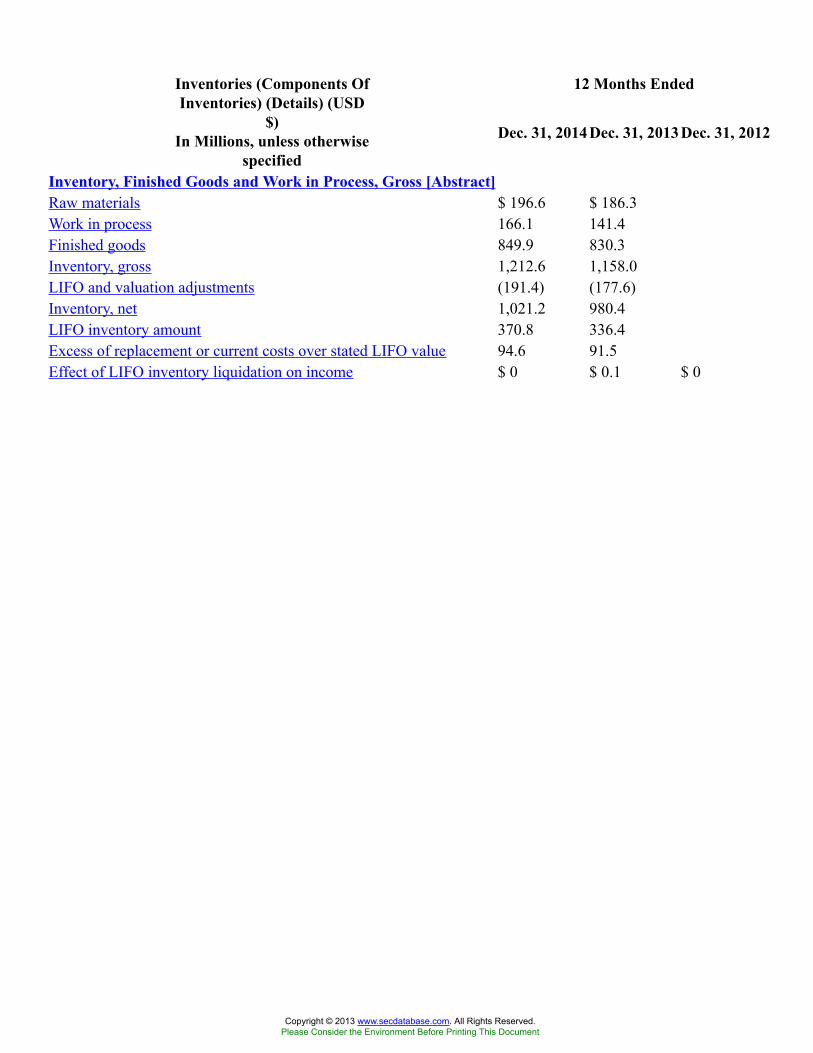
12 Months EndedInventories (Components OfInventories) (Details) (USD
$)In Millions, unless otherwise
specified
Dec. 31, 2014 Dec. 31, 2013 Dec. 31, 2012
Inventory, Finished Goods and Work in Process, Gross [Abstract]Raw materials $ 196.6 $ 186.3Work in process 166.1 141.4Finished goods 849.9 830.3Inventory, gross 1,212.6 1,158.0LIFO and valuation adjustments (191.4) (177.6)Inventory, net 1,021.2 980.4LIFO inventory amount 370.8 336.4Excess of replacement or current costs over stated LIFO value 94.6 91.5Effect of LIFO inventory liquidation on income $ 0 $ 0.1 $ 0
Copyright © 2013 www.secdatabase.com. All Rights Reserved.Please Consider the Environment Before Printing This Document
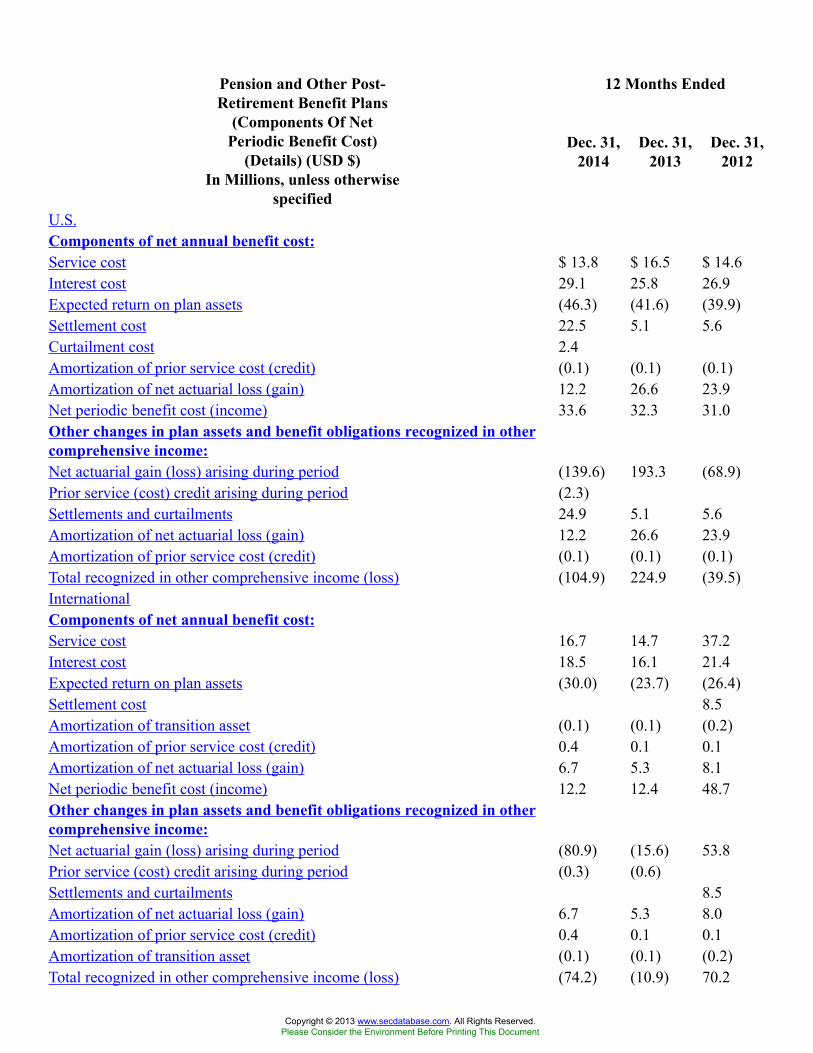
12 Months EndedPension and Other Post-Retirement Benefit Plans
(Components Of NetPeriodic Benefit Cost)
(Details) (USD $)In Millions, unless otherwise
specified
Dec. 31,2014
Dec. 31,2013
Dec. 31,2012
U.S.Components of net annual benefit cost:Service cost $ 13.8 $ 16.5 $ 14.6Interest cost 29.1 25.8 26.9Expected return on plan assets (46.3) (41.6) (39.9)Settlement cost 22.5 5.1 5.6Curtailment cost 2.4Amortization of prior service cost (credit) (0.1) (0.1) (0.1)Amortization of net actuarial loss (gain) 12.2 26.6 23.9Net periodic benefit cost (income) 33.6 32.3 31.0Other changes in plan assets and benefit obligations recognized in othercomprehensive income:Net actuarial gain (loss) arising during period (139.6) 193.3 (68.9)Prior service (cost) credit arising during period (2.3)Settlements and curtailments 24.9 5.1 5.6Amortization of net actuarial loss (gain) 12.2 26.6 23.9Amortization of prior service cost (credit) (0.1) (0.1) (0.1)Total recognized in other comprehensive income (loss) (104.9) 224.9 (39.5)InternationalComponents of net annual benefit cost:Service cost 16.7 14.7 37.2Interest cost 18.5 16.1 21.4Expected return on plan assets (30.0) (23.7) (26.4)Settlement cost 8.5Amortization of transition asset (0.1) (0.1) (0.2)Amortization of prior service cost (credit) 0.4 0.1 0.1Amortization of net actuarial loss (gain) 6.7 5.3 8.1Net periodic benefit cost (income) 12.2 12.4 48.7Other changes in plan assets and benefit obligations recognized in othercomprehensive income:Net actuarial gain (loss) arising during period (80.9) (15.6) 53.8Prior service (cost) credit arising during period (0.3) (0.6)Settlements and curtailments 8.5Amortization of net actuarial loss (gain) 6.7 5.3 8.0Amortization of prior service cost (credit) 0.4 0.1 0.1Amortization of transition asset (0.1) (0.1) (0.2)Total recognized in other comprehensive income (loss) (74.2) (10.9) 70.2
Copyright © 2013 www.secdatabase.com. All Rights Reserved.Please Consider the Environment Before Printing This Document
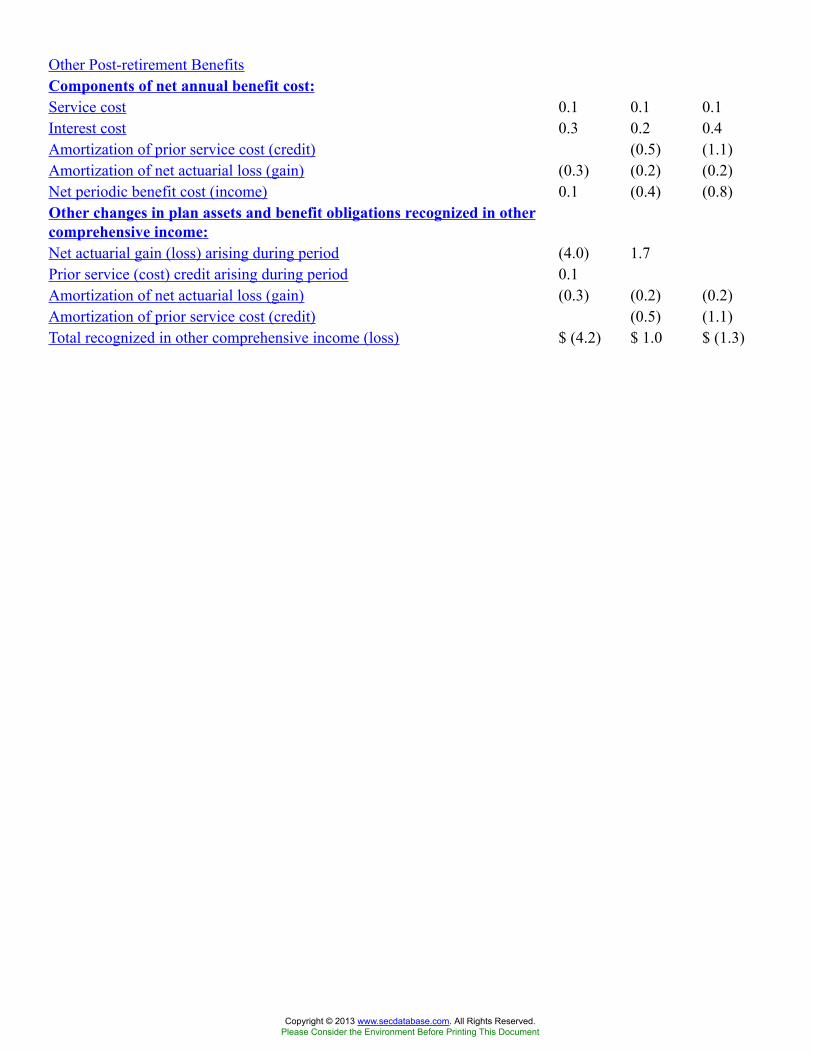
Other Post-retirement BenefitsComponents of net annual benefit cost:Service cost 0.1 0.1 0.1Interest cost 0.3 0.2 0.4Amortization of prior service cost (credit) (0.5) (1.1)Amortization of net actuarial loss (gain) (0.3) (0.2) (0.2)Net periodic benefit cost (income) 0.1 (0.4) (0.8)Other changes in plan assets and benefit obligations recognized in othercomprehensive income:Net actuarial gain (loss) arising during period (4.0) 1.7Prior service (cost) credit arising during period 0.1Amortization of net actuarial loss (gain) (0.3) (0.2) (0.2)Amortization of prior service cost (credit) (0.5) (1.1)Total recognized in other comprehensive income (loss) $ (4.2) $ 1.0 $ (1.3)
Copyright © 2013 www.secdatabase.com. All Rights Reserved.Please Consider the Environment Before Printing This Document
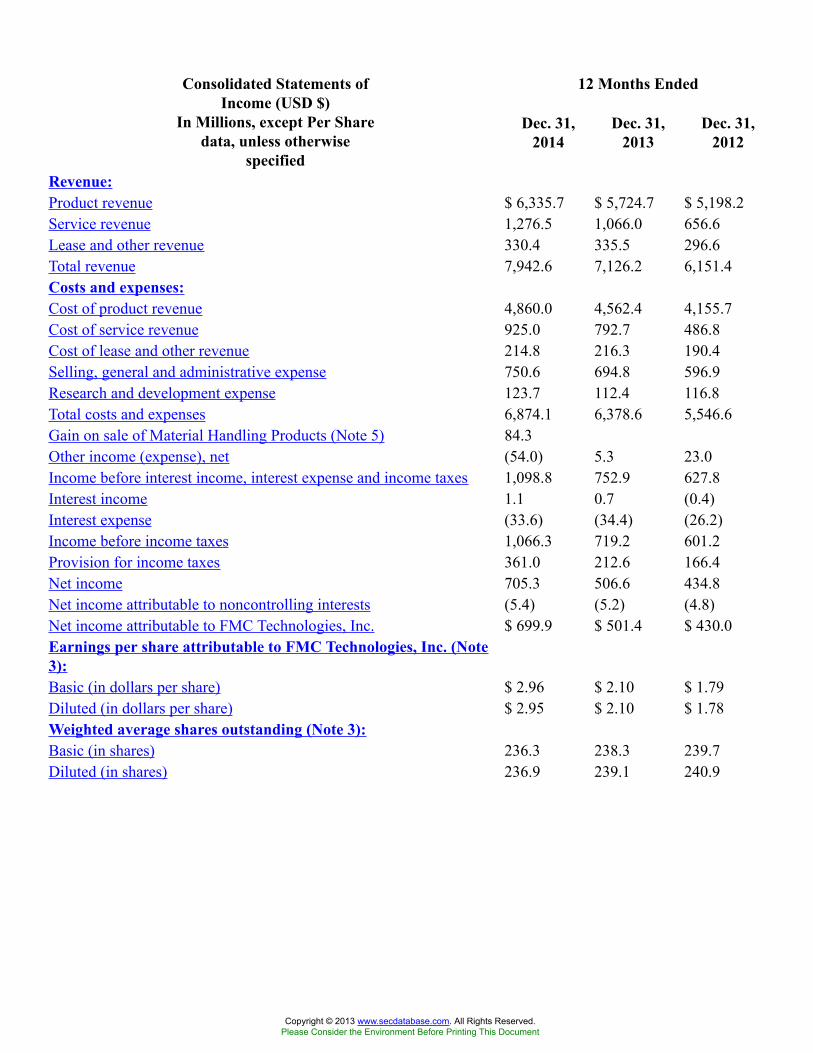
12 Months EndedConsolidated Statements ofIncome (USD $)
In Millions, except Per Sharedata, unless otherwise
specified
Dec. 31,2014
Dec. 31,2013
Dec. 31,2012
Revenue:Product revenue $ 6,335.7 $ 5,724.7 $ 5,198.2Service revenue 1,276.5 1,066.0 656.6Lease and other revenue 330.4 335.5 296.6Total revenue 7,942.6 7,126.2 6,151.4Costs and expenses:Cost of product revenue 4,860.0 4,562.4 4,155.7Cost of service revenue 925.0 792.7 486.8Cost of lease and other revenue 214.8 216.3 190.4Selling, general and administrative expense 750.6 694.8 596.9Research and development expense 123.7 112.4 116.8Total costs and expenses 6,874.1 6,378.6 5,546.6Gain on sale of Material Handling Products (Note 5) 84.3Other income (expense), net (54.0) 5.3 23.0Income before interest income, interest expense and income taxes 1,098.8 752.9 627.8Interest income 1.1 0.7 (0.4)Interest expense (33.6) (34.4) (26.2)Income before income taxes 1,066.3 719.2 601.2Provision for income taxes 361.0 212.6 166.4Net income 705.3 506.6 434.8Net income attributable to noncontrolling interests (5.4) (5.2) (4.8)Net income attributable to FMC Technologies, Inc. $ 699.9 $ 501.4 $ 430.0Earnings per share attributable to FMC Technologies, Inc. (Note3):Basic (in dollars per share) $ 2.96 $ 2.10 $ 1.79Diluted (in dollars per share) $ 2.95 $ 2.10 $ 1.78Weighted average shares outstanding (Note 3):Basic (in shares) 236.3 238.3 239.7Diluted (in shares) 236.9 239.1 240.9
Copyright © 2013 www.secdatabase.com. All Rights Reserved.Please Consider the Environment Before Printing This Document
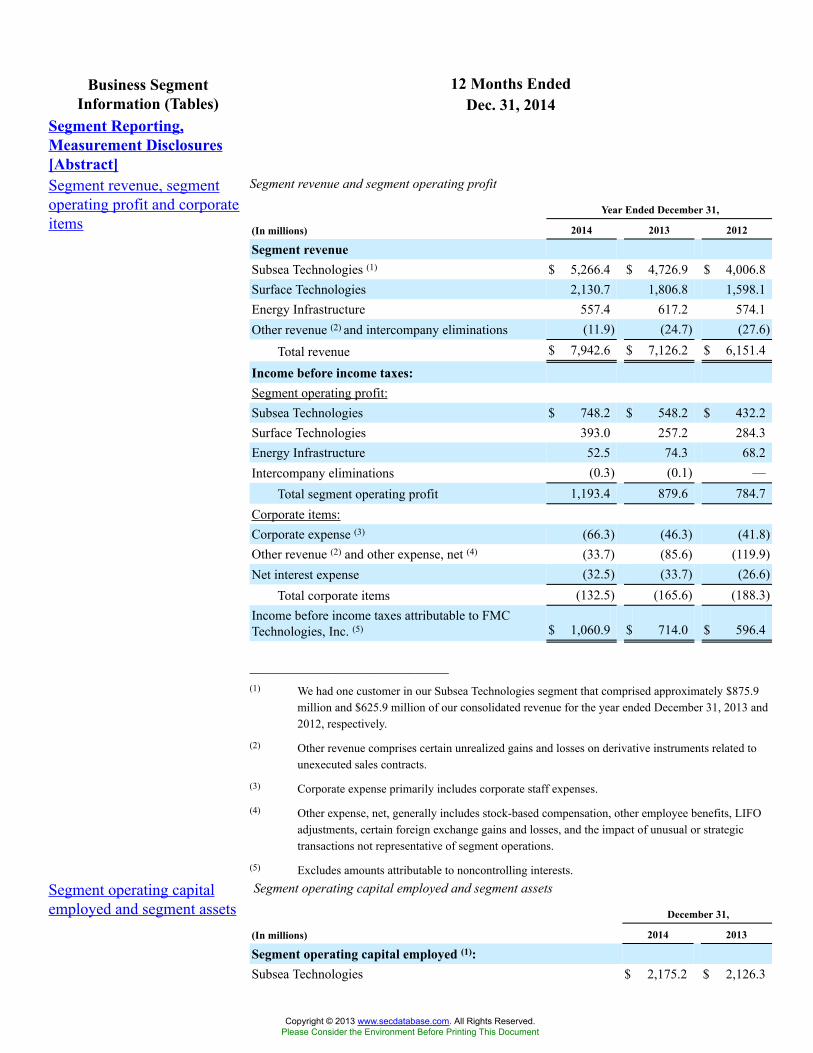
12 Months EndedBusiness SegmentInformation (Tables) Dec. 31, 2014
Segment Reporting,Measurement Disclosures[Abstract]Segment revenue, segmentoperating profit and corporateitems
Segment revenue and segment operating profit
Year Ended December 31,
(In millions) 2014 2013 2012
Segment revenueSubsea Technologies (1) $ 5,266.4 $ 4,726.9 $ 4,006.8Surface Technologies 2,130.7 1,806.8 1,598.1Energy Infrastructure 557.4 617.2 574.1Other revenue (2) and intercompany eliminations (11.9) (24.7) (27.6)
Total revenue $ 7,942.6 $ 7,126.2 $ 6,151.4
Income before income taxes:Segment operating profit:Subsea Technologies $ 748.2 $ 548.2 $ 432.2Surface Technologies 393.0 257.2 284.3Energy Infrastructure 52.5 74.3 68.2Intercompany eliminations (0.3) (0.1) —
Total segment operating profit 1,193.4 879.6 784.7Corporate items:Corporate expense (3) (66.3) (46.3) (41.8)Other revenue (2) and other expense, net (4) (33.7) (85.6) (119.9)Net interest expense (32.5) (33.7) (26.6)
Total corporate items (132.5) (165.6) (188.3)Income before income taxes attributable to FMCTechnologies, Inc. (5) $ 1,060.9 $ 714.0 $ 596.4
______________________________(1) We had one customer in our Subsea Technologies segment that comprised approximately $875.9
million and $625.9 million of our consolidated revenue for the year ended December 31, 2013 and2012, respectively.
(2) Other revenue comprises certain unrealized gains and losses on derivative instruments related tounexecuted sales contracts.
(3) Corporate expense primarily includes corporate staff expenses.
(4) Other expense, net, generally includes stock-based compensation, other employee benefits, LIFOadjustments, certain foreign exchange gains and losses, and the impact of unusual or strategictransactions not representative of segment operations.
(5) Excludes amounts attributable to noncontrolling interests.
Segment operating capitalemployed and segment assets
Segment operating capital employed and segment assets
December 31,
(In millions) 2014 2013
Segment operating capital employed (1):Subsea Technologies $ 2,175.2 $ 2,126.3
Copyright © 2013 www.secdatabase.com. All Rights Reserved.Please Consider the Environment Before Printing This Document
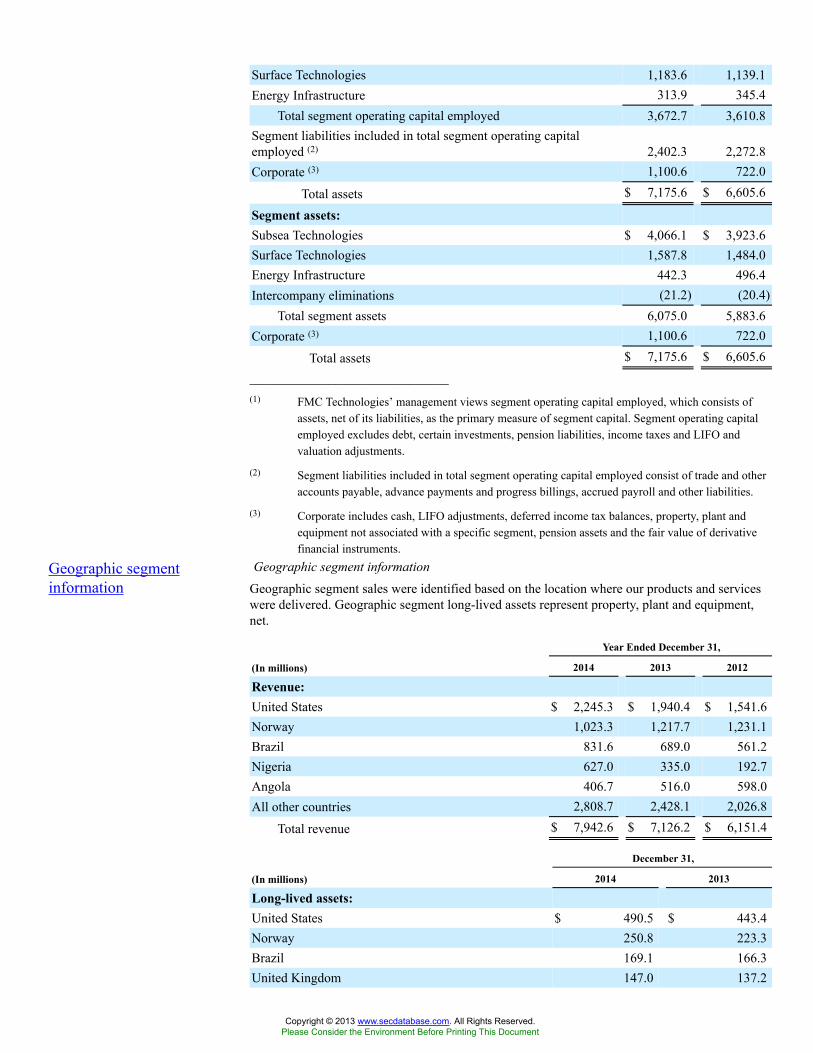
Surface Technologies 1,183.6 1,139.1Energy Infrastructure 313.9 345.4
Total segment operating capital employed 3,672.7 3,610.8Segment liabilities included in total segment operating capitalemployed (2) 2,402.3 2,272.8Corporate (3) 1,100.6 722.0
Total assets $ 7,175.6 $ 6,605.6
Segment assets:Subsea Technologies $ 4,066.1 $ 3,923.6Surface Technologies 1,587.8 1,484.0Energy Infrastructure 442.3 496.4Intercompany eliminations (21.2) (20.4)
Total segment assets 6,075.0 5,883.6Corporate (3) 1,100.6 722.0
Total assets $ 7,175.6 $ 6,605.6______________________________(1) FMC Technologies’ management views segment operating capital employed, which consists of
assets, net of its liabilities, as the primary measure of segment capital. Segment operating capitalemployed excludes debt, certain investments, pension liabilities, income taxes and LIFO andvaluation adjustments.
(2) Segment liabilities included in total segment operating capital employed consist of trade and otheraccounts payable, advance payments and progress billings, accrued payroll and other liabilities.
(3) Corporate includes cash, LIFO adjustments, deferred income tax balances, property, plant andequipment not associated with a specific segment, pension assets and the fair value of derivativefinancial instruments.
Geographic segmentinformation
Geographic segment informationGeographic segment sales were identified based on the location where our products and serviceswere delivered. Geographic segment long-lived assets represent property, plant and equipment,net.
Year Ended December 31,
(In millions) 2014 2013 2012
Revenue:United States $ 2,245.3 $ 1,940.4 $ 1,541.6Norway 1,023.3 1,217.7 1,231.1Brazil 831.6 689.0 561.2Nigeria 627.0 335.0 192.7Angola 406.7 516.0 598.0All other countries 2,808.7 2,428.1 2,026.8
Total revenue $ 7,942.6 $ 7,126.2 $ 6,151.4
December 31,
(In millions) 2014 2013
Long-lived assets:United States $ 490.5 $ 443.4Norway 250.8 223.3Brazil 169.1 166.3United Kingdom 147.0 137.2
Copyright © 2013 www.secdatabase.com. All Rights Reserved.Please Consider the Environment Before Printing This Document
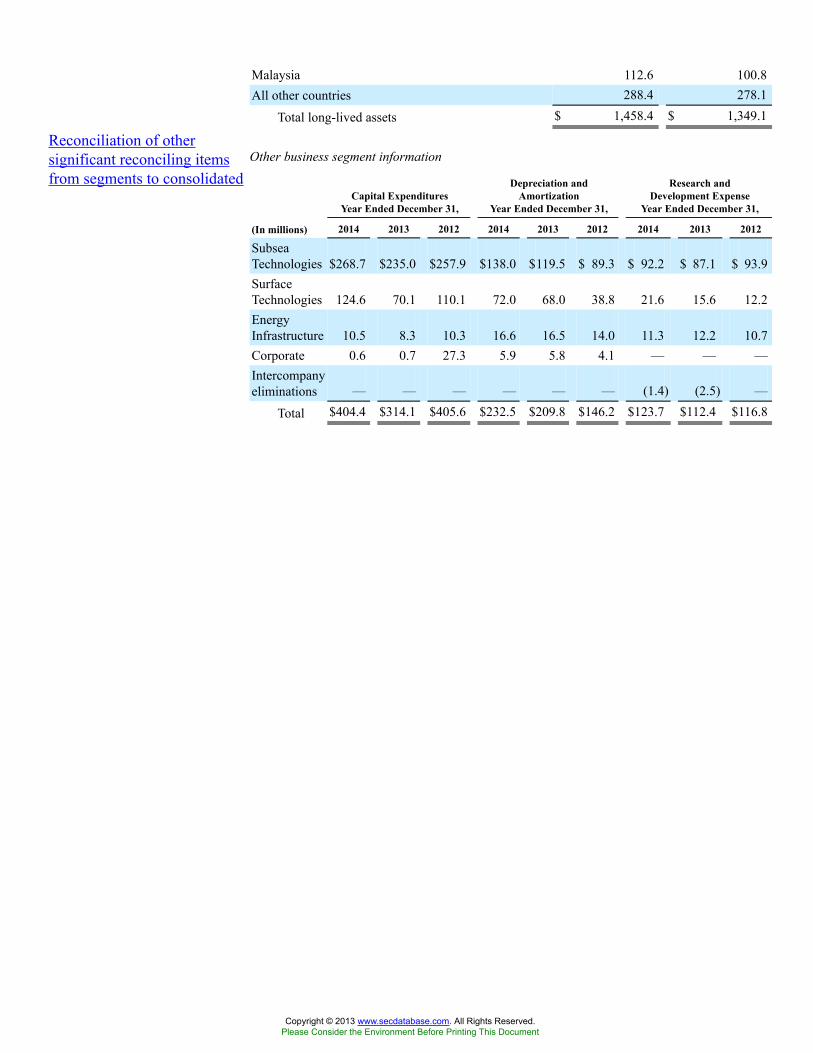
Malaysia 112.6 100.8All other countries 288.4 278.1
Total long-lived assets $ 1,458.4 $ 1,349.1
Reconciliation of othersignificant reconciling itemsfrom segments to consolidated
Other business segment information
Capital ExpendituresYear Ended December 31,
Depreciation andAmortization
Year Ended December 31,
Research andDevelopment Expense
Year Ended December 31,
(In millions) 2014 2013 2012 2014 2013 2012 2014 2013 2012
SubseaTechnologies $268.7 $235.0 $257.9 $138.0 $119.5 $ 89.3 $ 92.2 $ 87.1 $ 93.9SurfaceTechnologies 124.6 70.1 110.1 72.0 68.0 38.8 21.6 15.6 12.2EnergyInfrastructure 10.5 8.3 10.3 16.6 16.5 14.0 11.3 12.2 10.7Corporate 0.6 0.7 27.3 5.9 5.8 4.1 — — —Intercompanyeliminations — — — — — — (1.4) (2.5) —
Total $404.4 $314.1 $405.6 $232.5 $209.8 $146.2 $123.7 $112.4 $116.8
Copyright © 2013 www.secdatabase.com. All Rights Reserved.Please Consider the Environment Before Printing This Document
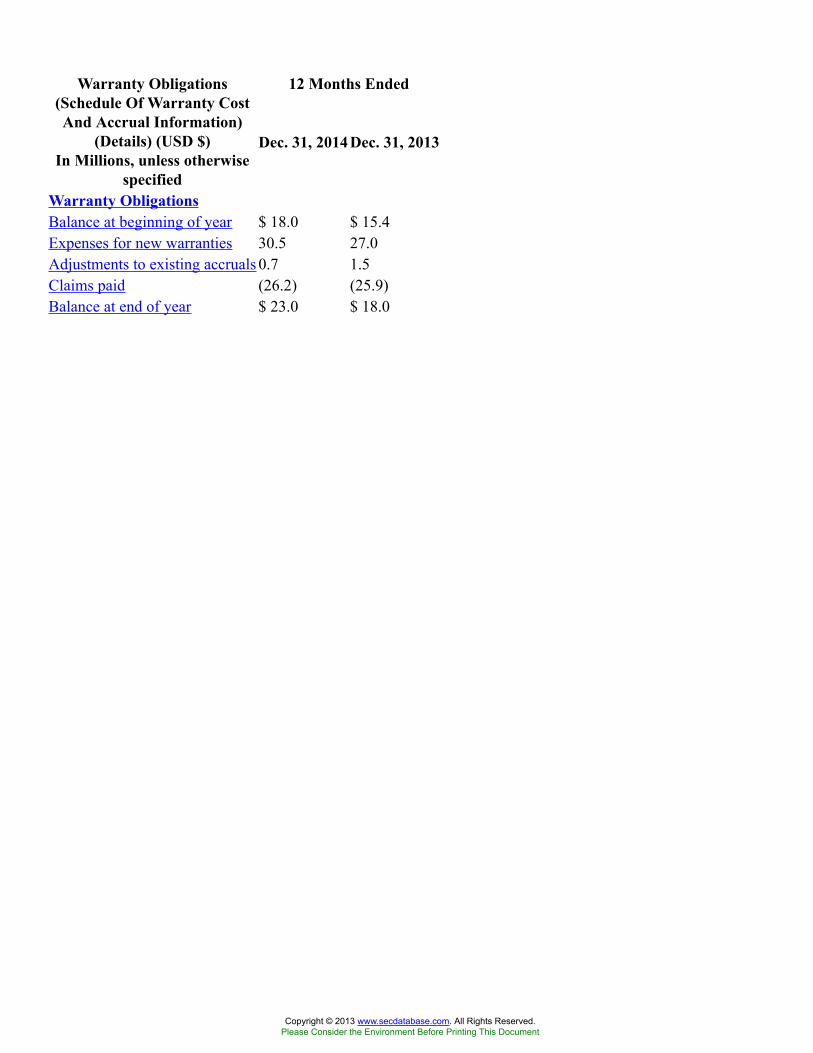
12 Months EndedWarranty Obligations(Schedule Of Warranty CostAnd Accrual Information)
(Details) (USD $)In Millions, unless otherwise
specified
Dec. 31, 2014 Dec. 31, 2013
Warranty ObligationsBalance at beginning of year $ 18.0 $ 15.4Expenses for new warranties 30.5 27.0Adjustments to existing accruals 0.7 1.5Claims paid (26.2) (25.9)Balance at end of year $ 23.0 $ 18.0
Copyright © 2013 www.secdatabase.com. All Rights Reserved.Please Consider the Environment Before Printing This Document
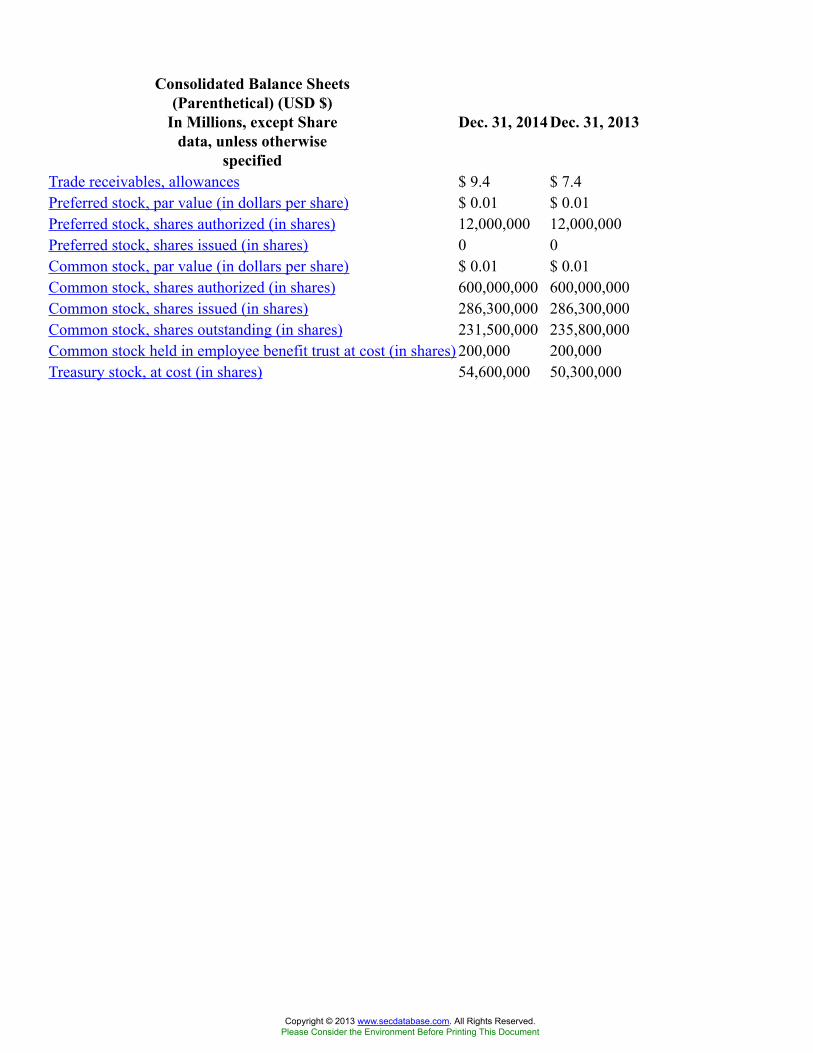
Consolidated Balance Sheets(Parenthetical) (USD $)
In Millions, except Sharedata, unless otherwise
specified
Dec. 31, 2014 Dec. 31, 2013
Trade receivables, allowances $ 9.4 $ 7.4Preferred stock, par value (in dollars per share) $ 0.01 $ 0.01Preferred stock, shares authorized (in shares) 12,000,000 12,000,000Preferred stock, shares issued (in shares) 0 0Common stock, par value (in dollars per share) $ 0.01 $ 0.01Common stock, shares authorized (in shares) 600,000,000 600,000,000Common stock, shares issued (in shares) 286,300,000 286,300,000Common stock, shares outstanding (in shares) 231,500,000 235,800,000Common stock held in employee benefit trust at cost (in shares) 200,000 200,000Treasury stock, at cost (in shares) 54,600,000 50,300,000
Copyright © 2013 www.secdatabase.com. All Rights Reserved.Please Consider the Environment Before Printing This Document
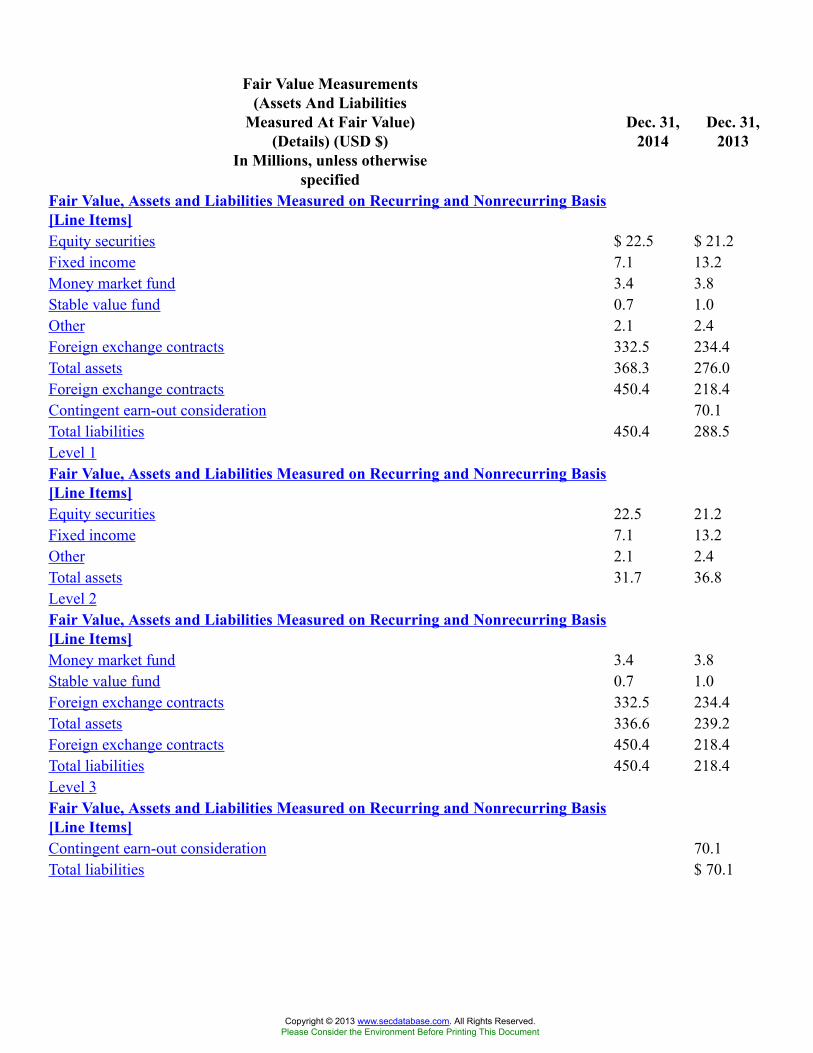
Fair Value Measurements(Assets And Liabilities
Measured At Fair Value)(Details) (USD $)
In Millions, unless otherwisespecified
Dec. 31,2014
Dec. 31,2013
Fair Value, Assets and Liabilities Measured on Recurring and Nonrecurring Basis[Line Items]Equity securities $ 22.5 $ 21.2Fixed income 7.1 13.2Money market fund 3.4 3.8Stable value fund 0.7 1.0Other 2.1 2.4Foreign exchange contracts 332.5 234.4Total assets 368.3 276.0Foreign exchange contracts 450.4 218.4Contingent earn-out consideration 70.1Total liabilities 450.4 288.5Level 1Fair Value, Assets and Liabilities Measured on Recurring and Nonrecurring Basis[Line Items]Equity securities 22.5 21.2Fixed income 7.1 13.2Other 2.1 2.4Total assets 31.7 36.8Level 2Fair Value, Assets and Liabilities Measured on Recurring and Nonrecurring Basis[Line Items]Money market fund 3.4 3.8Stable value fund 0.7 1.0Foreign exchange contracts 332.5 234.4Total assets 336.6 239.2Foreign exchange contracts 450.4 218.4Total liabilities 450.4 218.4Level 3Fair Value, Assets and Liabilities Measured on Recurring and Nonrecurring Basis[Line Items]Contingent earn-out consideration 70.1Total liabilities $ 70.1
Copyright © 2013 www.secdatabase.com. All Rights Reserved.Please Consider the Environment Before Printing This Document
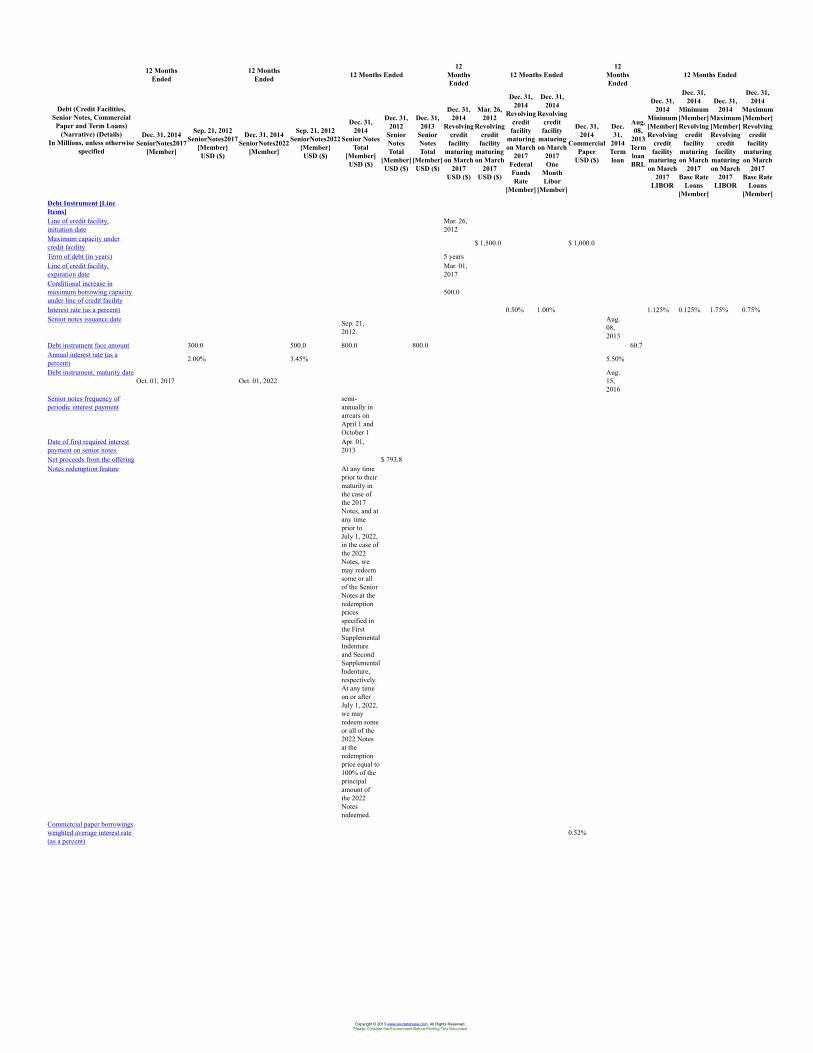
12 MonthsEnded
12 MonthsEnded 12 Months Ended
12MonthsEnded
12 Months Ended12
MonthsEnded
12 Months Ended
Debt (Credit Facilities,Senior Notes, Commercial
Paper and Term Loans)(Narrative) (Details)
In Millions, unless otherwisespecified
Dec. 31, 2014SeniorNotes2017
[Member]
Sep. 21, 2012SeniorNotes2017
[Member]USD ($)
Dec. 31, 2014SeniorNotes2022
[Member]
Sep. 21, 2012SeniorNotes2022
[Member]USD ($)
Dec. 31,2014
Senior NotesTotal
[Member]USD ($)
Dec. 31,2012
SeniorNotesTotal
[Member]USD ($)
Dec. 31,2013
SeniorNotesTotal
[Member]USD ($)
Dec. 31,2014
Revolvingcreditfacility
maturingon March
2017USD ($)
Mar. 26,2012
Revolvingcreditfacility
maturingon March
2017USD ($)
Dec. 31,2014
Revolvingcreditfacility
maturingon March
2017FederalFundsRate
[Member]
Dec. 31,2014
Revolvingcreditfacility
maturingon March
2017One
MonthLibor
[Member]
Dec. 31,2014
CommercialPaper
USD ($)
Dec.31,
2014Termloan
Aug.08,
2013TermloanBRL
Dec. 31,2014
Minimum[Member]Revolving
creditfacility
maturingon March
2017LIBOR
Dec. 31,2014
Minimum[Member]Revolving
creditfacility
maturingon March
2017Base Rate
Loans[Member]
Dec. 31,2014
Maximum[Member]Revolving
creditfacility
maturingon March
2017LIBOR
Dec. 31,2014
Maximum[Member]Revolving
creditfacility
maturingon March
2017Base Rate
Loans[Member]
Debt Instrument [LineItems]Line of credit facility,initiation date
Mar. 26,2012
Maximum capacity undercredit facility $ 1,500.0 $ 1,000.0
Term of debt (in years) 5 yearsLine of credit facility,expiration date
Mar. 01,2017
Conditional increase inmaximum borrowing capacityunder line of credit facility
500.0
Interest rate (as a percent) 0.50% 1.00% 1.125% 0.125% 1.75% 0.75%Senior notes issuance date Sep. 21,
2012
Aug.08,2013
Debt instrument face amount 300.0 500.0 800.0 800.0 60.7Annual interest rate (as apercent) 2.00% 3.45% 5.50%
Debt instrument, maturity dateOct. 01, 2017 Oct. 01, 2022
Aug.15,2016
Senior notes frequency ofperiodic interest payment
semi-annually inarrears onApril 1 andOctober 1
Date of first required interestpayment on senior notes
Apr. 01,2013
Net proceeds from the offering $ 793.8Notes redemption feature At any time
prior to theirmaturity inthe case ofthe 2017Notes, and atany timeprior toJuly 1, 2022,in the case ofthe 2022Notes, wemay redeemsome or allof the SeniorNotes at theredemptionpricesspecified inthe FirstSupplementalIndentureand SecondSupplementalIndenture,respectively.At any timeon or afterJuly 1, 2022,we mayredeem someor all of the2022 Notesat theredemptionprice equal to100% of theprincipalamount ofthe 2022Notesredeemed.
Commercial paper borrowingsweighted average interest rate(as a percent)
0.52%
Copyright © 2013 www.secdatabase.com. All Rights Reserved.Please Consider the Environment Before Printing This Document
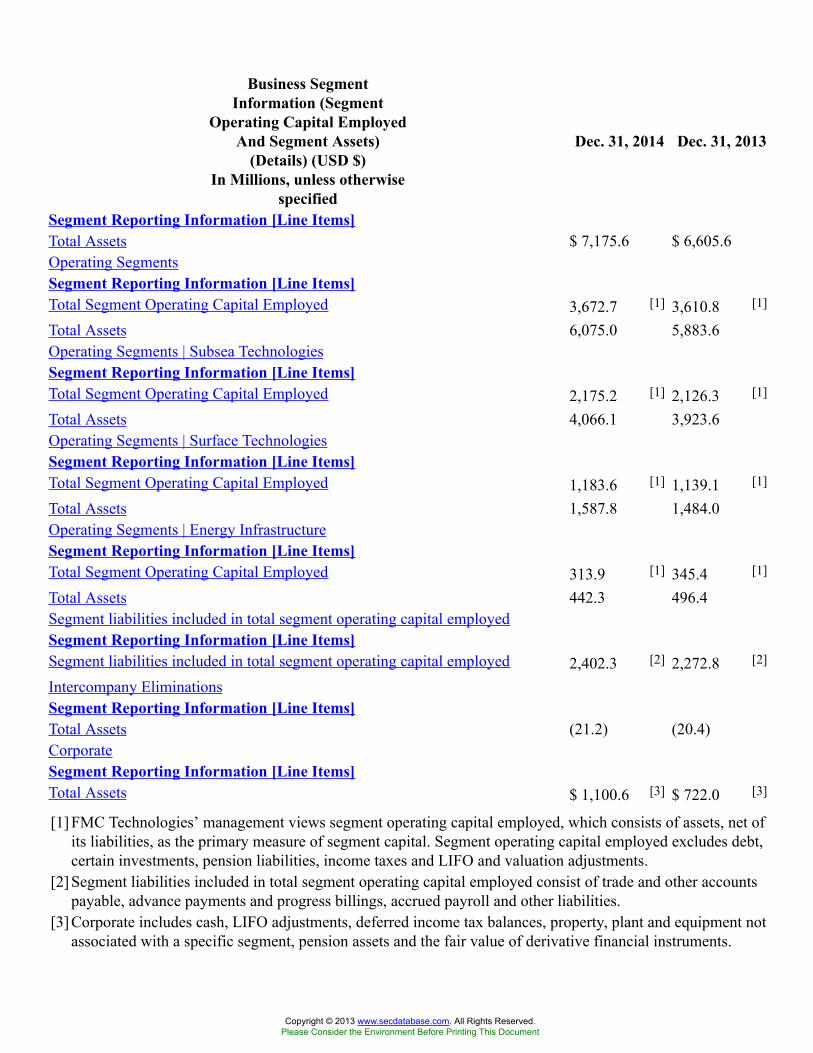
Business SegmentInformation (Segment
Operating Capital EmployedAnd Segment Assets)
(Details) (USD $)In Millions, unless otherwise
specified
Dec. 31, 2014 Dec. 31, 2013
Segment Reporting Information [Line Items]Total Assets $ 7,175.6 $ 6,605.6Operating SegmentsSegment Reporting Information [Line Items]Total Segment Operating Capital Employed 3,672.7 [1] 3,610.8 [1]
Total Assets 6,075.0 5,883.6Operating Segments | Subsea TechnologiesSegment Reporting Information [Line Items]Total Segment Operating Capital Employed 2,175.2 [1] 2,126.3 [1]
Total Assets 4,066.1 3,923.6Operating Segments | Surface TechnologiesSegment Reporting Information [Line Items]Total Segment Operating Capital Employed 1,183.6 [1] 1,139.1 [1]
Total Assets 1,587.8 1,484.0Operating Segments | Energy InfrastructureSegment Reporting Information [Line Items]Total Segment Operating Capital Employed 313.9 [1] 345.4 [1]
Total Assets 442.3 496.4Segment liabilities included in total segment operating capital employedSegment Reporting Information [Line Items]Segment liabilities included in total segment operating capital employed 2,402.3 [2] 2,272.8 [2]
Intercompany EliminationsSegment Reporting Information [Line Items]Total Assets (21.2) (20.4)CorporateSegment Reporting Information [Line Items]Total Assets $ 1,100.6 [3] $ 722.0 [3]
[1] FMC Technologies’ management views segment operating capital employed, which consists of assets, net ofits liabilities, as the primary measure of segment capital. Segment operating capital employed excludes debt,certain investments, pension liabilities, income taxes and LIFO and valuation adjustments.
[2] Segment liabilities included in total segment operating capital employed consist of trade and other accountspayable, advance payments and progress billings, accrued payroll and other liabilities.
[3] Corporate includes cash, LIFO adjustments, deferred income tax balances, property, plant and equipment notassociated with a specific segment, pension assets and the fair value of derivative financial instruments.
Copyright © 2013 www.secdatabase.com. All Rights Reserved.Please Consider the Environment Before Printing This Document
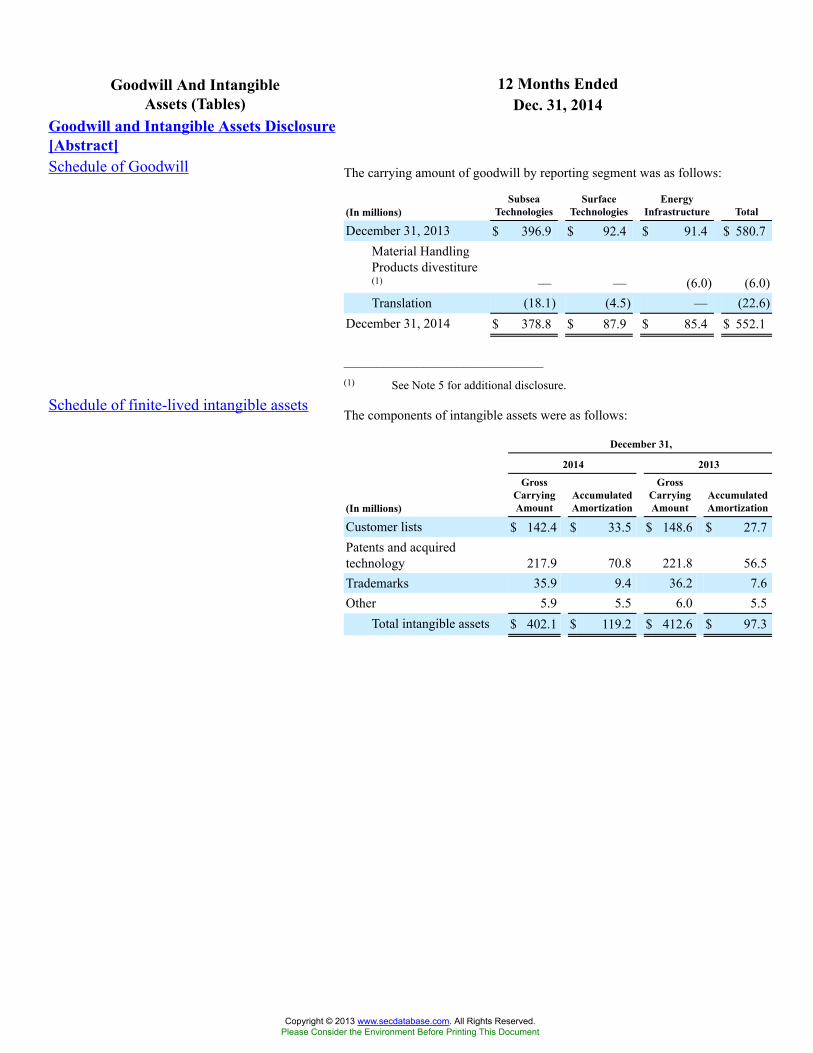
12 Months EndedGoodwill And IntangibleAssets (Tables) Dec. 31, 2014
Goodwill and Intangible Assets Disclosure[Abstract]Schedule of Goodwill The carrying amount of goodwill by reporting segment was as follows:
(In millions)Subsea
TechnologiesSurface
TechnologiesEnergy
Infrastructure Total
December 31, 2013 $ 396.9 $ 92.4 $ 91.4 $ 580.7Material HandlingProducts divestiture(1) — — (6.0) (6.0)Translation (18.1) (4.5) — (22.6)
December 31, 2014 $ 378.8 $ 87.9 $ 85.4 $ 552.1
______________________________(1) See Note 5 for additional disclosure.
Schedule of finite-lived intangible assetsThe components of intangible assets were as follows:
December 31,
2014 2013
(In millions)
GrossCarryingAmount
AccumulatedAmortization
GrossCarryingAmount
AccumulatedAmortization
Customer lists $ 142.4 $ 33.5 $ 148.6 $ 27.7Patents and acquiredtechnology 217.9 70.8 221.8 56.5Trademarks 35.9 9.4 36.2 7.6Other 5.9 5.5 6.0 5.5
Total intangible assets $ 402.1 $ 119.2 $ 412.6 $ 97.3
Copyright © 2013 www.secdatabase.com. All Rights Reserved.Please Consider the Environment Before Printing This Document
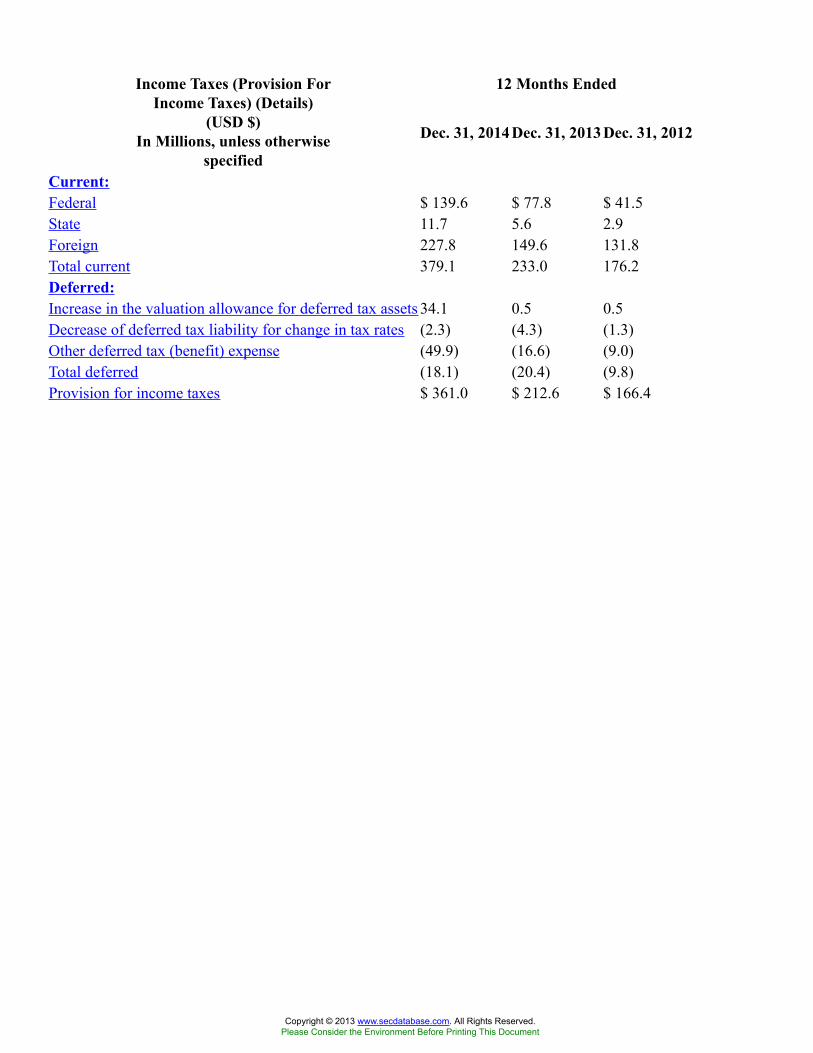
12 Months EndedIncome Taxes (Provision ForIncome Taxes) (Details)
(USD $)In Millions, unless otherwise
specified
Dec. 31, 2014 Dec. 31, 2013 Dec. 31, 2012
Current:Federal $ 139.6 $ 77.8 $ 41.5State 11.7 5.6 2.9Foreign 227.8 149.6 131.8Total current 379.1 233.0 176.2Deferred:Increase in the valuation allowance for deferred tax assets 34.1 0.5 0.5Decrease of deferred tax liability for change in tax rates (2.3) (4.3) (1.3)Other deferred tax (benefit) expense (49.9) (16.6) (9.0)Total deferred (18.1) (20.4) (9.8)Provision for income taxes $ 361.0 $ 212.6 $ 166.4
Copyright © 2013 www.secdatabase.com. All Rights Reserved.Please Consider the Environment Before Printing This Document
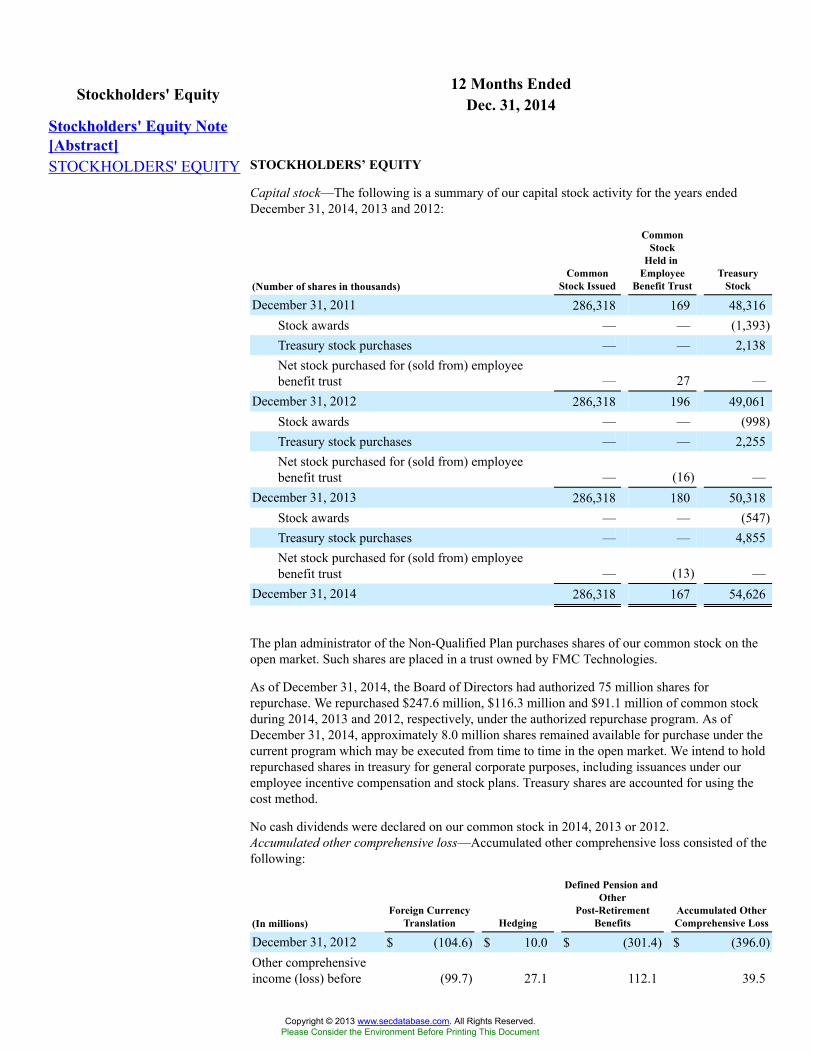
12 Months EndedStockholders' Equity Dec. 31, 2014Stockholders' Equity Note[Abstract]STOCKHOLDERS' EQUITY STOCKHOLDERS’ EQUITY
Capital stock—The following is a summary of our capital stock activity for the years endedDecember 31, 2014, 2013 and 2012:
(Number of shares in thousands)Common
Stock Issued
CommonStock
Held inEmployee
Benefit TrustTreasury
Stock
December 31, 2011 286,318 169 48,316Stock awards — — (1,393)Treasury stock purchases — — 2,138Net stock purchased for (sold from) employeebenefit trust — 27 —
December 31, 2012 286,318 196 49,061Stock awards — — (998)Treasury stock purchases — — 2,255Net stock purchased for (sold from) employeebenefit trust — (16) —
December 31, 2013 286,318 180 50,318Stock awards — — (547)Treasury stock purchases — — 4,855Net stock purchased for (sold from) employeebenefit trust — (13) —
December 31, 2014 286,318 167 54,626
The plan administrator of the Non-Qualified Plan purchases shares of our common stock on theopen market. Such shares are placed in a trust owned by FMC Technologies.
As of December 31, 2014, the Board of Directors had authorized 75 million shares forrepurchase. We repurchased $247.6 million, $116.3 million and $91.1 million of common stockduring 2014, 2013 and 2012, respectively, under the authorized repurchase program. As ofDecember 31, 2014, approximately 8.0 million shares remained available for purchase under thecurrent program which may be executed from time to time in the open market. We intend to holdrepurchased shares in treasury for general corporate purposes, including issuances under ouremployee incentive compensation and stock plans. Treasury shares are accounted for using thecost method.
No cash dividends were declared on our common stock in 2014, 2013 or 2012.Accumulated other comprehensive loss—Accumulated other comprehensive loss consisted of thefollowing:
(In millions)Foreign Currency
Translation Hedging
Defined Pension andOther
Post-RetirementBenefits
Accumulated OtherComprehensive Loss
December 31, 2012 $ (104.6) $ 10.0 $ (301.4) $ (396.0)Other comprehensiveincome (loss) before (99.7) 27.1 112.1 39.5
Copyright © 2013 www.secdatabase.com. All Rights Reserved.Please Consider the Environment Before Printing This Document

reclassifications, net oftaxReclassificationadjustment for net(gains) losses includedin net income, net of tax — (5.2) 21.0 15.8Other comprehensiveincome (loss), net of tax (99.7) 21.9 133.1 55.3December 31, 2013 (204.3) 31.9 (168.3) (340.7)Other comprehensiveincome (loss) beforereclassifications, net oftax (107.6) (108.4) (154.4) (370.4)Reclassificationadjustment for net(gains) losses includedin net income, net of tax — (0.8) 28.2 27.4Other comprehensiveincome (loss), net of tax (107.6) (109.2) (126.2) (343.0)December 31, 2014 $ (311.9) $ (77.3) $ (294.5) $ (683.7)
Reclassifications out of accumulated other comprehensive loss—Reclassifications out ofaccumulated other comprehensive loss consisted of the following:
Year Ended
(In millions) December 31, 2014 December 31, 2013
Details about Accumulated OtherComprehensive Loss Components
Amount Reclassified out of AccumulatedOther Comprehensive Loss
Affected Line Item in theConsolidated Statement ofIncome
Gains (losses) on hedginginstrumentsForeign exchange contracts: $ (36.2) $ (11.7) Revenue
34.2 14.8 Costs of sales
(0.2) —Selling, general andadministrative expense
(2.2) 3.1Income before incometaxes
3.0 2.1Income tax (expense)benefit
$ 0.8 $ 5.2 Net incomeDefined pension and other post-retirement benefitsSettlements $ (24.9) $ (5.1) (a)
Amortization of actuarial loss (18.6) (31.7) (a)
Amortization of prior servicecredit (0.3) 0.5 (a)
Amortization of transition asset 0.1 0.1 (a)
(43.7) (36.2)Income before incometaxes
15.5 15.2Income tax (expense)benefit
Copyright © 2013 www.secdatabase.com. All Rights Reserved.Please Consider the Environment Before Printing This Document
$ (28.2) $ (21.0) Net income_______________________(a) These accumulated other comprehensive income components are included in the computation of
net periodic pension cost (see Note 12 for additional details).
Copyright © 2013 www.secdatabase.com. All Rights Reserved.Please Consider the Environment Before Printing This Document
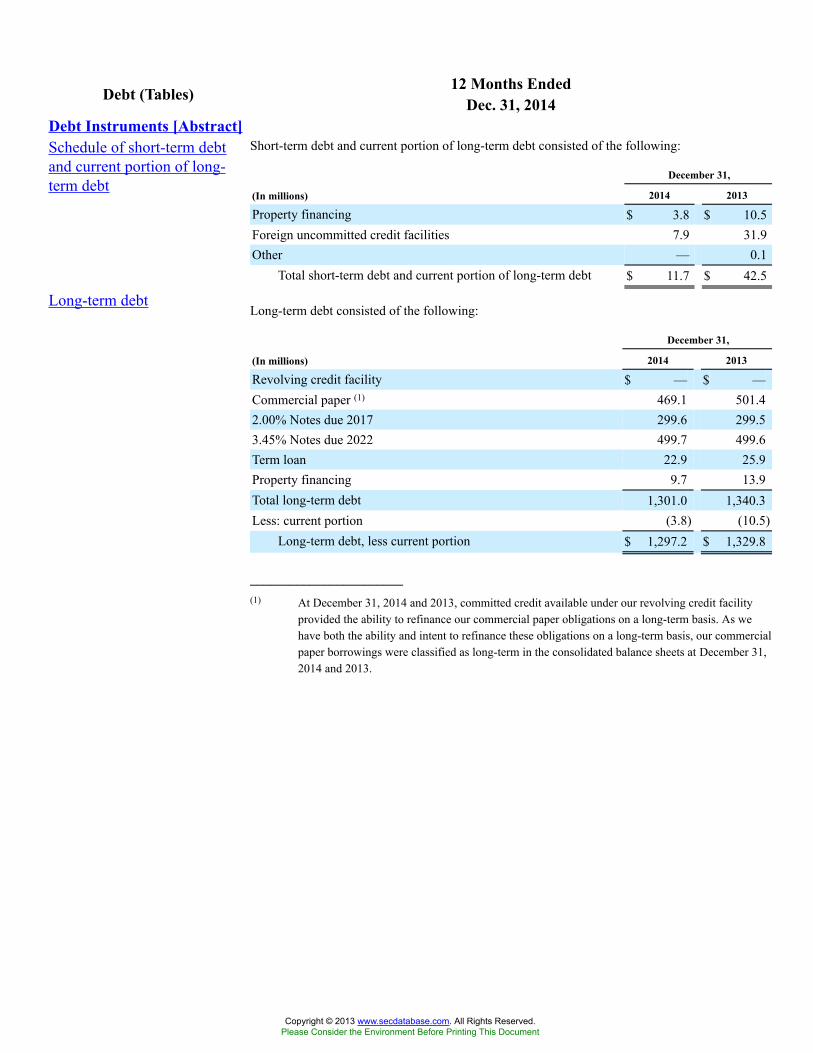
12 Months EndedDebt (Tables) Dec. 31, 2014Debt Instruments [Abstract]Schedule of short-term debtand current portion of long-term debt
Short-term debt and current portion of long-term debt consisted of the following:
December 31,
(In millions) 2014 2013
Property financing $ 3.8 $ 10.5Foreign uncommitted credit facilities 7.9 31.9Other — 0.1
Total short-term debt and current portion of long-term debt $ 11.7 $ 42.5
Long-term debtLong-term debt consisted of the following:
December 31,
(In millions) 2014 2013
Revolving credit facility $ — $ —Commercial paper (1) 469.1 501.42.00% Notes due 2017 299.6 299.53.45% Notes due 2022 499.7 499.6Term loan 22.9 25.9Property financing 9.7 13.9Total long-term debt 1,301.0 1,340.3Less: current portion (3.8) (10.5)
Long-term debt, less current portion $ 1,297.2 $ 1,329.8
_______________________(1) At December 31, 2014 and 2013, committed credit available under our revolving credit facility
provided the ability to refinance our commercial paper obligations on a long-term basis. As wehave both the ability and intent to refinance these obligations on a long-term basis, our commercialpaper borrowings were classified as long-term in the consolidated balance sheets at December 31,2014 and 2013.
Copyright © 2013 www.secdatabase.com. All Rights Reserved.Please Consider the Environment Before Printing This Document
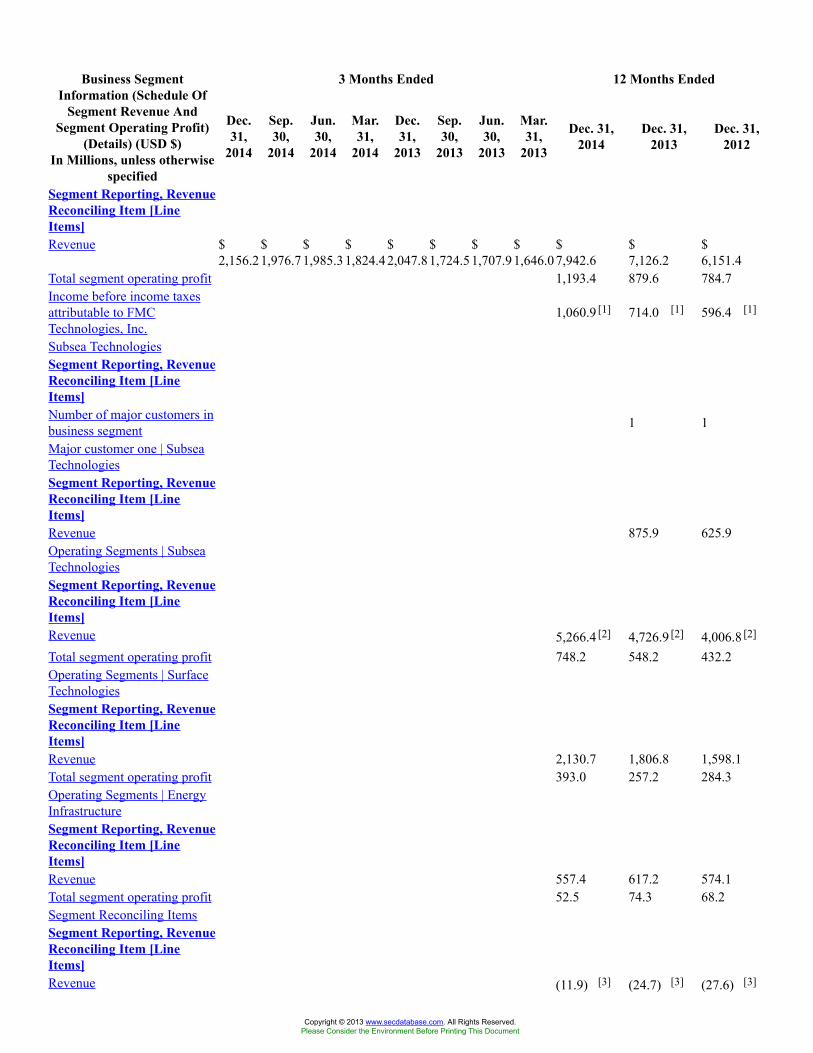
3 Months Ended 12 Months EndedBusiness SegmentInformation (Schedule Of
Segment Revenue AndSegment Operating Profit)
(Details) (USD $)In Millions, unless otherwise
specified
Dec.31,
2014
Sep.30,
2014
Jun.30,
2014
Mar.31,
2014
Dec.31,
2013
Sep.30,
2013
Jun.30,
2013
Mar.31,
2013
Dec. 31,2014
Dec. 31,2013
Dec. 31,2012
Segment Reporting, RevenueReconciling Item [LineItems]Revenue $
2,156.2$1,976.7
$1,985.3
$1,824.4
$2,047.8
$1,724.5
$1,707.9
$1,646.0
$7,942.6
$7,126.2
$6,151.4
Total segment operating profit 1,193.4 879.6 784.7Income before income taxesattributable to FMCTechnologies, Inc.
1,060.9 [1] 714.0 [1] 596.4 [1]
Subsea TechnologiesSegment Reporting, RevenueReconciling Item [LineItems]Number of major customers inbusiness segment 1 1
Major customer one | SubseaTechnologiesSegment Reporting, RevenueReconciling Item [LineItems]Revenue 875.9 625.9Operating Segments | SubseaTechnologiesSegment Reporting, RevenueReconciling Item [LineItems]Revenue 5,266.4 [2] 4,726.9 [2] 4,006.8 [2]
Total segment operating profit 748.2 548.2 432.2Operating Segments | SurfaceTechnologiesSegment Reporting, RevenueReconciling Item [LineItems]Revenue 2,130.7 1,806.8 1,598.1Total segment operating profit 393.0 257.2 284.3Operating Segments | EnergyInfrastructureSegment Reporting, RevenueReconciling Item [LineItems]Revenue 557.4 617.2 574.1Total segment operating profit 52.5 74.3 68.2Segment Reconciling ItemsSegment Reporting, RevenueReconciling Item [LineItems]Revenue (11.9) [3] (24.7) [3] (27.6) [3]
Copyright © 2013 www.secdatabase.com. All Rights Reserved.Please Consider the Environment Before Printing This Document
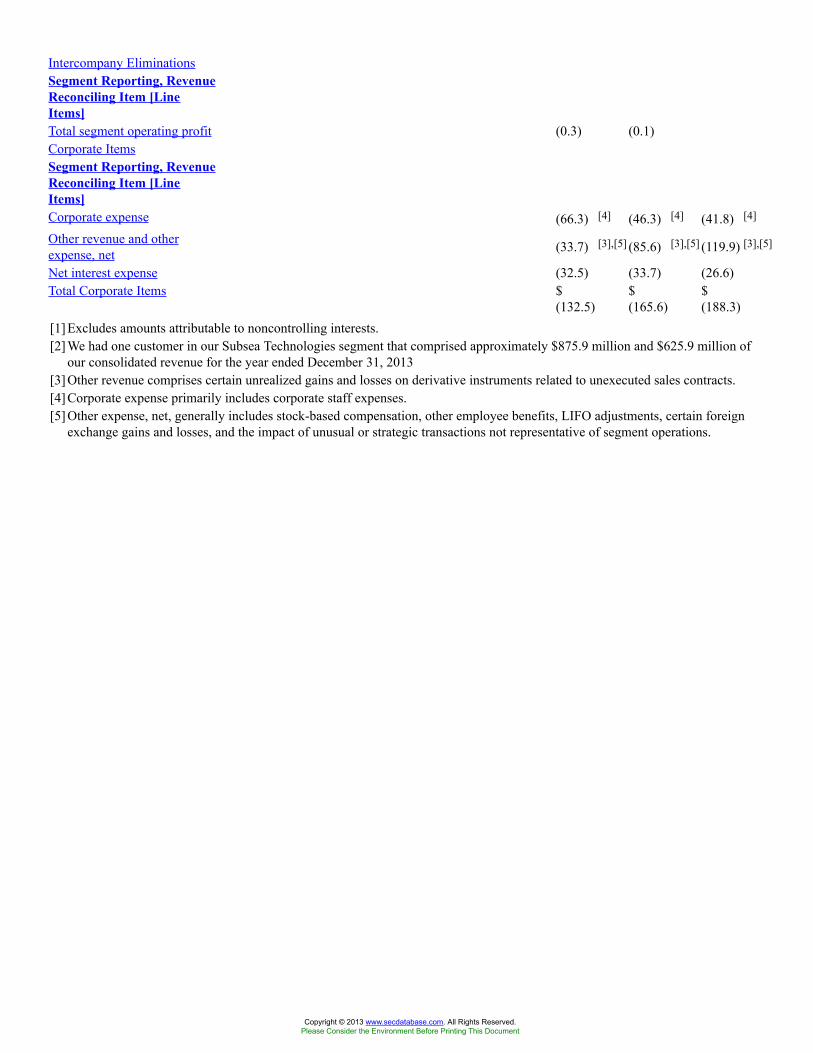
Intercompany EliminationsSegment Reporting, RevenueReconciling Item [LineItems]Total segment operating profit (0.3) (0.1)Corporate ItemsSegment Reporting, RevenueReconciling Item [LineItems]Corporate expense (66.3) [4] (46.3) [4] (41.8) [4]
Other revenue and otherexpense, net (33.7) [3],[5] (85.6) [3],[5] (119.9) [3],[5]
Net interest expense (32.5) (33.7) (26.6)Total Corporate Items $
(132.5)$(165.6)
$(188.3)
[1] Excludes amounts attributable to noncontrolling interests.[2] We had one customer in our Subsea Technologies segment that comprised approximately $875.9 million and $625.9 million of
our consolidated revenue for the year ended December 31, 2013[3] Other revenue comprises certain unrealized gains and losses on derivative instruments related to unexecuted sales contracts.[4] Corporate expense primarily includes corporate staff expenses.[5] Other expense, net, generally includes stock-based compensation, other employee benefits, LIFO adjustments, certain foreign
exchange gains and losses, and the impact of unusual or strategic transactions not representative of segment operations.
Copyright © 2013 www.secdatabase.com. All Rights Reserved.Please Consider the Environment Before Printing This Document
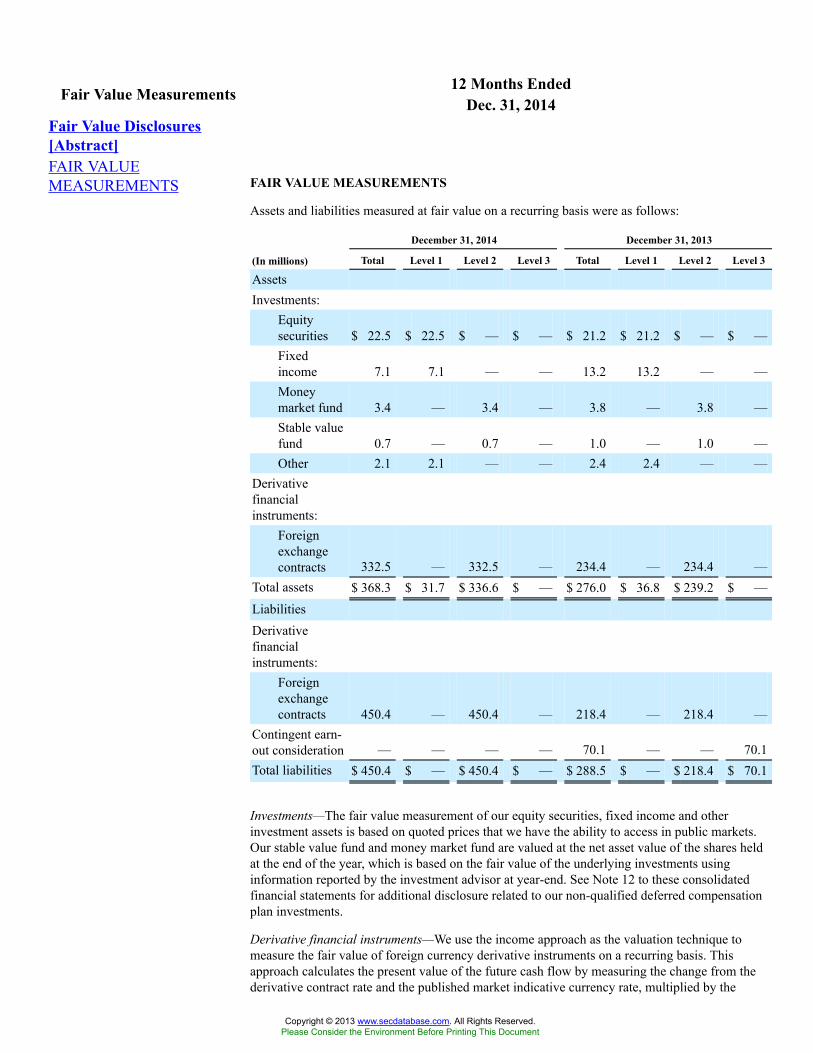
12 Months EndedFair Value Measurements Dec. 31, 2014Fair Value Disclosures[Abstract]FAIR VALUEMEASUREMENTS FAIR VALUE MEASUREMENTS
Assets and liabilities measured at fair value on a recurring basis were as follows:
December 31, 2014 December 31, 2013
(In millions) Total Level 1 Level 2 Level 3 Total Level 1 Level 2 Level 3
AssetsInvestments:
Equitysecurities $ 22.5 $ 22.5 $ — $ — $ 21.2 $ 21.2 $ — $ —Fixedincome 7.1 7.1 — — 13.2 13.2 — —Moneymarket fund 3.4 — 3.4 — 3.8 — 3.8 —Stable valuefund 0.7 — 0.7 — 1.0 — 1.0 —Other 2.1 2.1 — — 2.4 2.4 — —
Derivativefinancialinstruments:
Foreignexchangecontracts 332.5 — 332.5 — 234.4 — 234.4 —
Total assets $ 368.3 $ 31.7 $ 336.6 $ — $ 276.0 $ 36.8 $ 239.2 $ —LiabilitiesDerivativefinancialinstruments:
Foreignexchangecontracts 450.4 — 450.4 — 218.4 — 218.4 —
Contingent earn-out consideration — — — — 70.1 — — 70.1Total liabilities $ 450.4 $ — $ 450.4 $ — $ 288.5 $ — $ 218.4 $ 70.1
Investments—The fair value measurement of our equity securities, fixed income and otherinvestment assets is based on quoted prices that we have the ability to access in public markets.Our stable value fund and money market fund are valued at the net asset value of the shares heldat the end of the year, which is based on the fair value of the underlying investments usinginformation reported by the investment advisor at year-end. See Note 12 to these consolidatedfinancial statements for additional disclosure related to our non-qualified deferred compensationplan investments.
Derivative financial instruments—We use the income approach as the valuation technique tomeasure the fair value of foreign currency derivative instruments on a recurring basis. Thisapproach calculates the present value of the future cash flow by measuring the change from thederivative contract rate and the published market indicative currency rate, multiplied by the
Copyright © 2013 www.secdatabase.com. All Rights Reserved.Please Consider the Environment Before Printing This Document
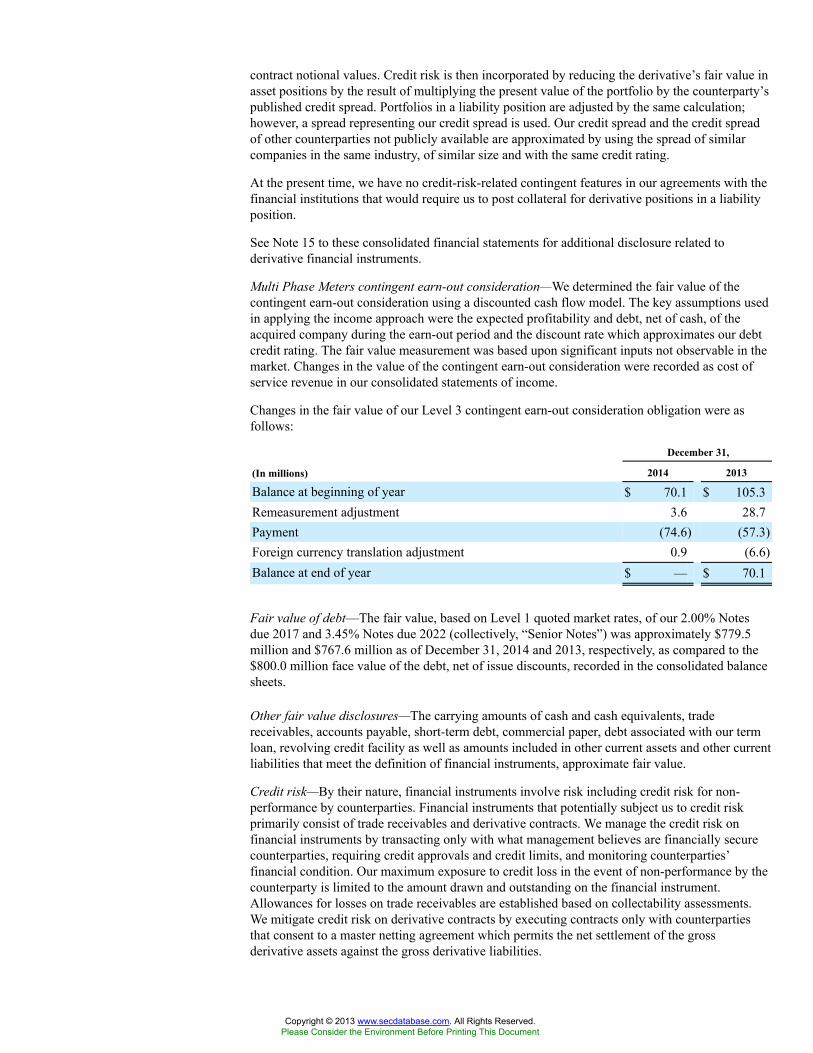
contract notional values. Credit risk is then incorporated by reducing the derivative’s fair value inasset positions by the result of multiplying the present value of the portfolio by the counterparty’spublished credit spread. Portfolios in a liability position are adjusted by the same calculation;however, a spread representing our credit spread is used. Our credit spread and the credit spreadof other counterparties not publicly available are approximated by using the spread of similarcompanies in the same industry, of similar size and with the same credit rating.
At the present time, we have no credit-risk-related contingent features in our agreements with thefinancial institutions that would require us to post collateral for derivative positions in a liabilityposition.
See Note 15 to these consolidated financial statements for additional disclosure related toderivative financial instruments.
Multi Phase Meters contingent earn-out consideration—We determined the fair value of thecontingent earn-out consideration using a discounted cash flow model. The key assumptions usedin applying the income approach were the expected profitability and debt, net of cash, of theacquired company during the earn-out period and the discount rate which approximates our debtcredit rating. The fair value measurement was based upon significant inputs not observable in themarket. Changes in the value of the contingent earn-out consideration were recorded as cost ofservice revenue in our consolidated statements of income.
Changes in the fair value of our Level 3 contingent earn-out consideration obligation were asfollows:
December 31,
(In millions) 2014 2013
Balance at beginning of year $ 70.1 $ 105.3Remeasurement adjustment 3.6 28.7Payment (74.6) (57.3)Foreign currency translation adjustment 0.9 (6.6)Balance at end of year $ — $ 70.1
Fair value of debt—The fair value, based on Level 1 quoted market rates, of our 2.00% Notesdue 2017 and 3.45% Notes due 2022 (collectively, “Senior Notes”) was approximately $779.5million and $767.6 million as of December 31, 2014 and 2013, respectively, as compared to the$800.0 million face value of the debt, net of issue discounts, recorded in the consolidated balancesheets.
Other fair value disclosures—The carrying amounts of cash and cash equivalents, tradereceivables, accounts payable, short-term debt, commercial paper, debt associated with our termloan, revolving credit facility as well as amounts included in other current assets and other currentliabilities that meet the definition of financial instruments, approximate fair value.
Credit risk—By their nature, financial instruments involve risk including credit risk for non-performance by counterparties. Financial instruments that potentially subject us to credit riskprimarily consist of trade receivables and derivative contracts. We manage the credit risk onfinancial instruments by transacting only with what management believes are financially securecounterparties, requiring credit approvals and credit limits, and monitoring counterparties’financial condition. Our maximum exposure to credit loss in the event of non-performance by thecounterparty is limited to the amount drawn and outstanding on the financial instrument.Allowances for losses on trade receivables are established based on collectability assessments.We mitigate credit risk on derivative contracts by executing contracts only with counterpartiesthat consent to a master netting agreement which permits the net settlement of the grossderivative assets against the gross derivative liabilities.
Copyright © 2013 www.secdatabase.com. All Rights Reserved.Please Consider the Environment Before Printing This Document
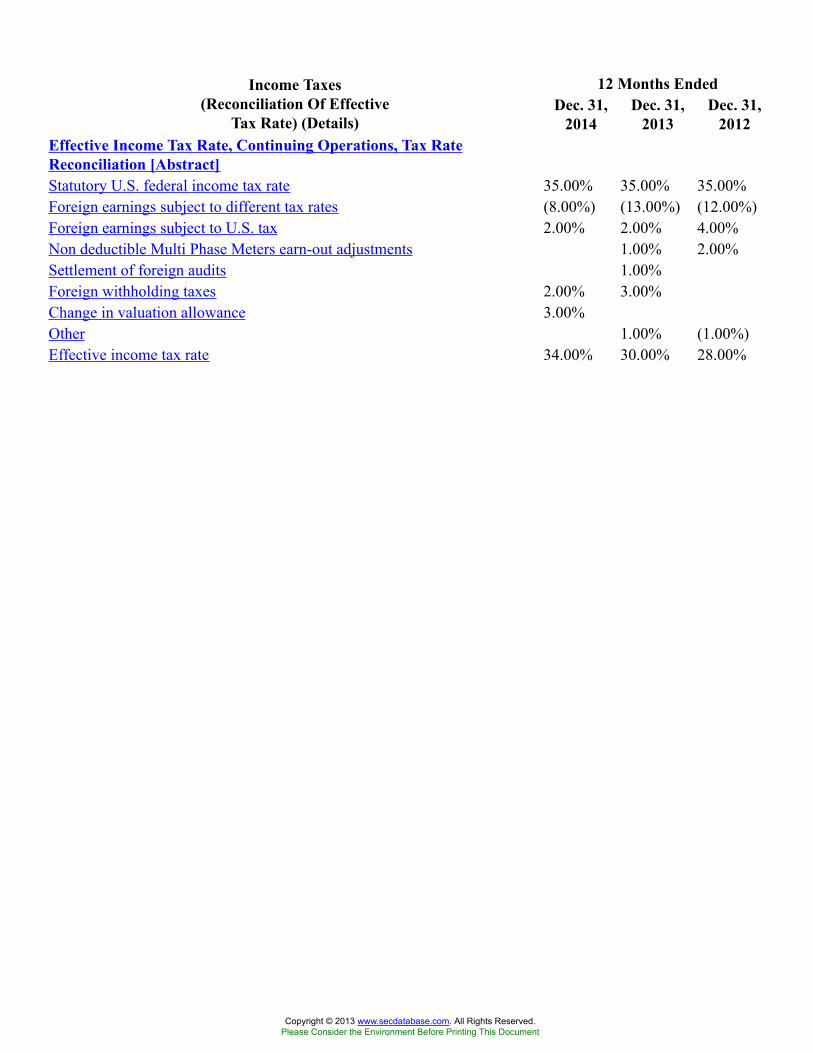
12 Months EndedIncome Taxes(Reconciliation Of Effective
Tax Rate) (Details)Dec. 31,
2014Dec. 31,
2013Dec. 31,
2012Effective Income Tax Rate, Continuing Operations, Tax RateReconciliation [Abstract]Statutory U.S. federal income tax rate 35.00% 35.00% 35.00%Foreign earnings subject to different tax rates (8.00%) (13.00%) (12.00%)Foreign earnings subject to U.S. tax 2.00% 2.00% 4.00%Non deductible Multi Phase Meters earn-out adjustments 1.00% 2.00%Settlement of foreign audits 1.00%Foreign withholding taxes 2.00% 3.00%Change in valuation allowance 3.00%Other 1.00% (1.00%)Effective income tax rate 34.00% 30.00% 28.00%
Copyright © 2013 www.secdatabase.com. All Rights Reserved.Please Consider the Environment Before Printing This Document
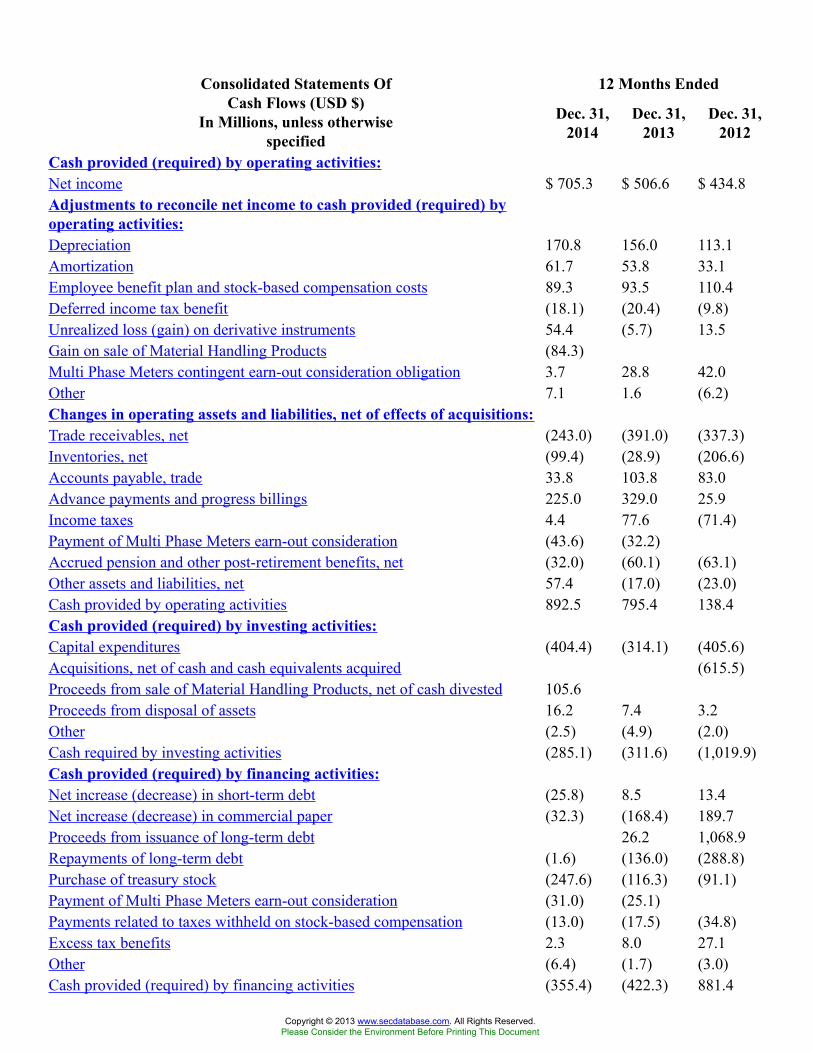
12 Months EndedConsolidated Statements OfCash Flows (USD $)
In Millions, unless otherwisespecified
Dec. 31,2014
Dec. 31,2013
Dec. 31,2012
Cash provided (required) by operating activities:Net income $ 705.3 $ 506.6 $ 434.8Adjustments to reconcile net income to cash provided (required) byoperating activities:Depreciation 170.8 156.0 113.1Amortization 61.7 53.8 33.1Employee benefit plan and stock-based compensation costs 89.3 93.5 110.4Deferred income tax benefit (18.1) (20.4) (9.8)Unrealized loss (gain) on derivative instruments 54.4 (5.7) 13.5Gain on sale of Material Handling Products (84.3)Multi Phase Meters contingent earn-out consideration obligation 3.7 28.8 42.0Other 7.1 1.6 (6.2)Changes in operating assets and liabilities, net of effects of acquisitions:Trade receivables, net (243.0) (391.0) (337.3)Inventories, net (99.4) (28.9) (206.6)Accounts payable, trade 33.8 103.8 83.0Advance payments and progress billings 225.0 329.0 25.9Income taxes 4.4 77.6 (71.4)Payment of Multi Phase Meters earn-out consideration (43.6) (32.2)Accrued pension and other post-retirement benefits, net (32.0) (60.1) (63.1)Other assets and liabilities, net 57.4 (17.0) (23.0)Cash provided by operating activities 892.5 795.4 138.4Cash provided (required) by investing activities:Capital expenditures (404.4) (314.1) (405.6)Acquisitions, net of cash and cash equivalents acquired (615.5)Proceeds from sale of Material Handling Products, net of cash divested 105.6Proceeds from disposal of assets 16.2 7.4 3.2Other (2.5) (4.9) (2.0)Cash required by investing activities (285.1) (311.6) (1,019.9)Cash provided (required) by financing activities:Net increase (decrease) in short-term debt (25.8) 8.5 13.4Net increase (decrease) in commercial paper (32.3) (168.4) 189.7Proceeds from issuance of long-term debt 26.2 1,068.9Repayments of long-term debt (1.6) (136.0) (288.8)Purchase of treasury stock (247.6) (116.3) (91.1)Payment of Multi Phase Meters earn-out consideration (31.0) (25.1)Payments related to taxes withheld on stock-based compensation (13.0) (17.5) (34.8)Excess tax benefits 2.3 8.0 27.1Other (6.4) (1.7) (3.0)Cash provided (required) by financing activities (355.4) (422.3) 881.4
Copyright © 2013 www.secdatabase.com. All Rights Reserved.Please Consider the Environment Before Printing This Document
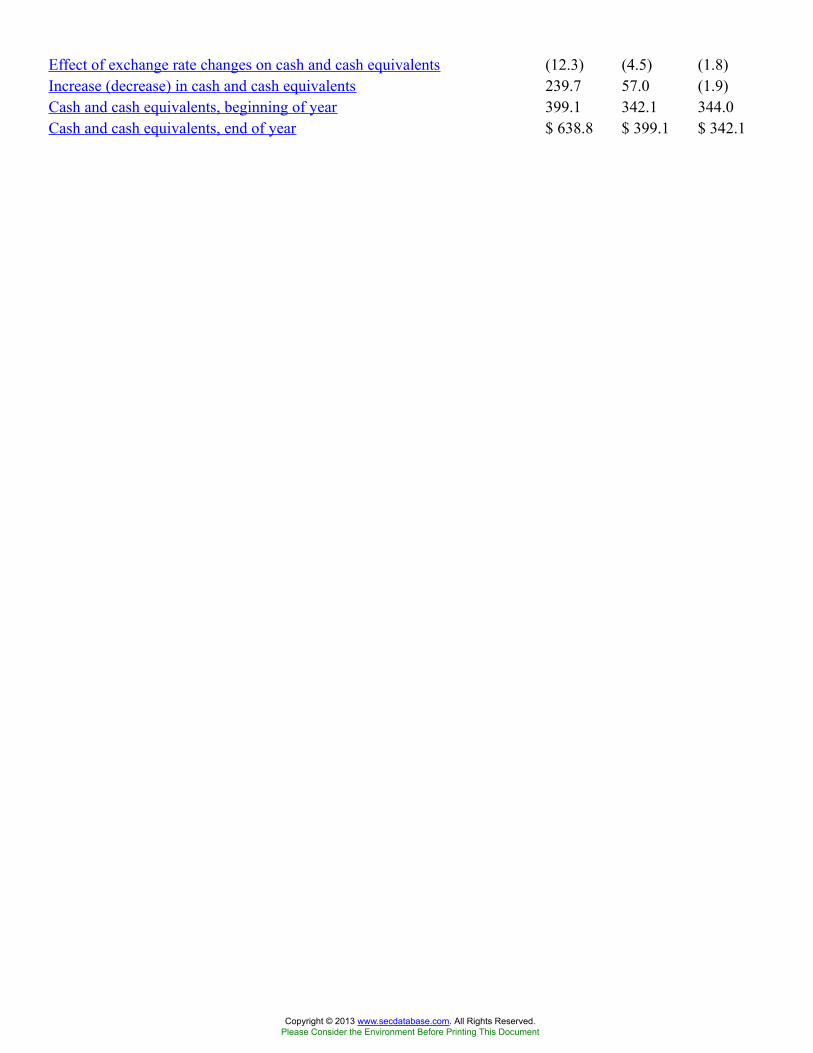
Effect of exchange rate changes on cash and cash equivalents (12.3) (4.5) (1.8)Increase (decrease) in cash and cash equivalents 239.7 57.0 (1.9)Cash and cash equivalents, beginning of year 399.1 342.1 344.0Cash and cash equivalents, end of year $ 638.8 $ 399.1 $ 342.1
Copyright © 2013 www.secdatabase.com. All Rights Reserved.Please Consider the Environment Before Printing This Document
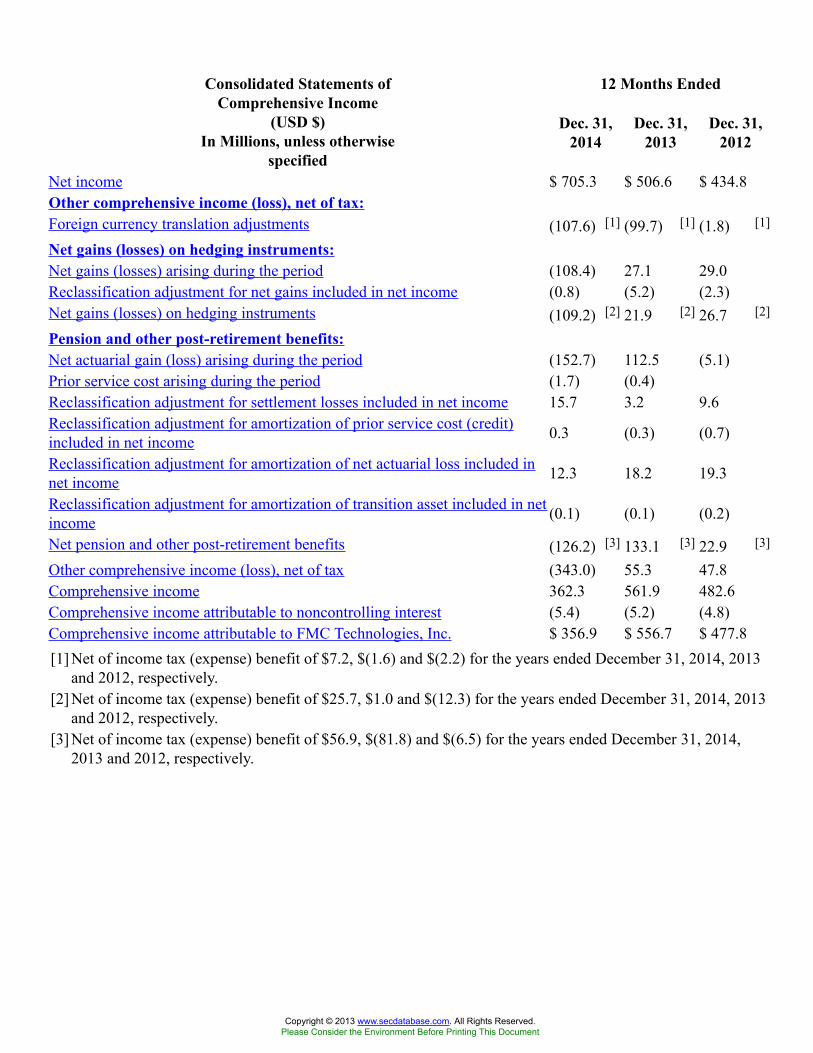
12 Months EndedConsolidated Statements ofComprehensive Income
(USD $)In Millions, unless otherwise
specified
Dec. 31,2014
Dec. 31,2013
Dec. 31,2012
Net income $ 705.3 $ 506.6 $ 434.8Other comprehensive income (loss), net of tax:Foreign currency translation adjustments (107.6) [1] (99.7) [1] (1.8) [1]
Net gains (losses) on hedging instruments:Net gains (losses) arising during the period (108.4) 27.1 29.0Reclassification adjustment for net gains included in net income (0.8) (5.2) (2.3)Net gains (losses) on hedging instruments (109.2) [2] 21.9 [2] 26.7 [2]
Pension and other post-retirement benefits:Net actuarial gain (loss) arising during the period (152.7) 112.5 (5.1)Prior service cost arising during the period (1.7) (0.4)Reclassification adjustment for settlement losses included in net income 15.7 3.2 9.6Reclassification adjustment for amortization of prior service cost (credit)included in net income 0.3 (0.3) (0.7)
Reclassification adjustment for amortization of net actuarial loss included innet income 12.3 18.2 19.3
Reclassification adjustment for amortization of transition asset included in netincome (0.1) (0.1) (0.2)
Net pension and other post-retirement benefits (126.2) [3] 133.1 [3] 22.9 [3]
Other comprehensive income (loss), net of tax (343.0) 55.3 47.8Comprehensive income 362.3 561.9 482.6Comprehensive income attributable to noncontrolling interest (5.4) (5.2) (4.8)Comprehensive income attributable to FMC Technologies, Inc. $ 356.9 $ 556.7 $ 477.8[1] Net of income tax (expense) benefit of $7.2, $(1.6) and $(2.2) for the years ended December 31, 2014, 2013
and 2012, respectively.[2] Net of income tax (expense) benefit of $25.7, $1.0 and $(12.3) for the years ended December 31, 2014, 2013
and 2012, respectively.[3] Net of income tax (expense) benefit of $56.9, $(81.8) and $(6.5) for the years ended December 31, 2014,
2013 and 2012, respectively.
Copyright © 2013 www.secdatabase.com. All Rights Reserved.Please Consider the Environment Before Printing This Document
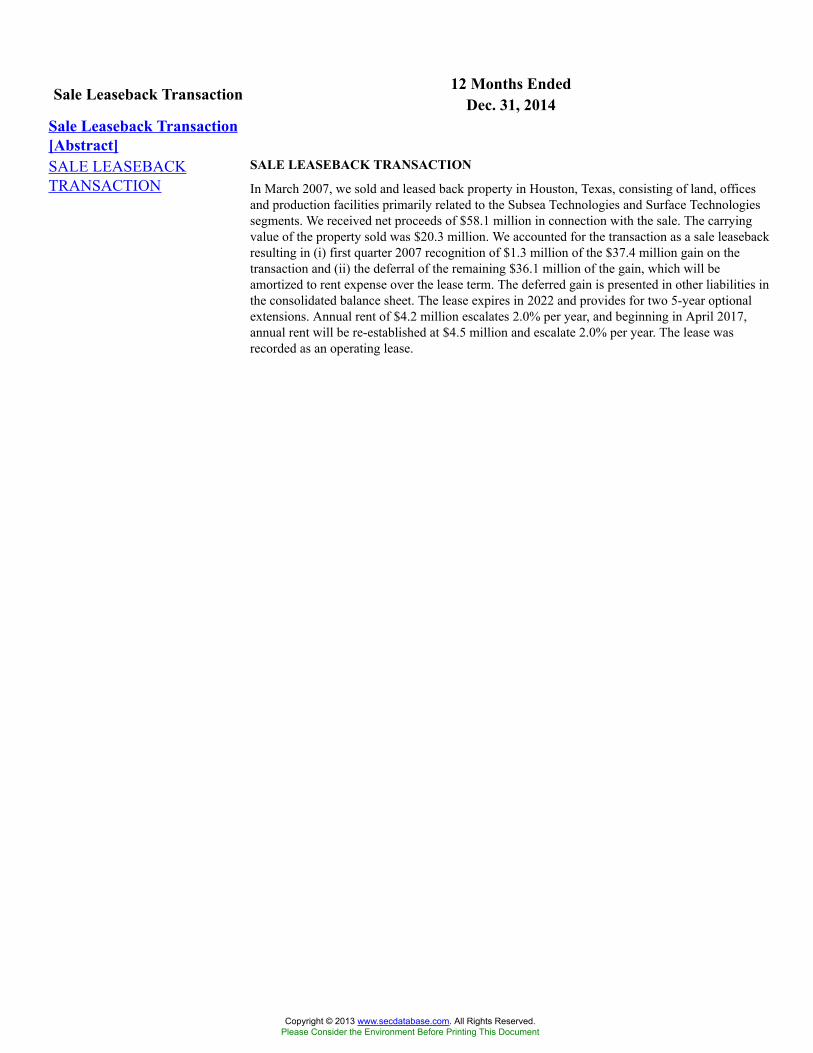
12 Months EndedSale Leaseback Transaction Dec. 31, 2014Sale Leaseback Transaction[Abstract]SALE LEASEBACKTRANSACTION
SALE LEASEBACK TRANSACTION
In March 2007, we sold and leased back property in Houston, Texas, consisting of land, officesand production facilities primarily related to the Subsea Technologies and Surface Technologiessegments. We received net proceeds of $58.1 million in connection with the sale. The carryingvalue of the property sold was $20.3 million. We accounted for the transaction as a sale leasebackresulting in (i) first quarter 2007 recognition of $1.3 million of the $37.4 million gain on thetransaction and (ii) the deferral of the remaining $36.1 million of the gain, which will beamortized to rent expense over the lease term. The deferred gain is presented in other liabilities inthe consolidated balance sheet. The lease expires in 2022 and provides for two 5-year optionalextensions. Annual rent of $4.2 million escalates 2.0% per year, and beginning in April 2017,annual rent will be re-established at $4.5 million and escalate 2.0% per year. The lease wasrecorded as an operating lease.
Copyright © 2013 www.secdatabase.com. All Rights Reserved.Please Consider the Environment Before Printing This Document

Other Information (Details)(USD $)
In Millions, unless otherwisespecified
Dec. 31, 2014 Dec. 31, 2013
Cash Flow Information and Other Information [Abstract]Unbilled receivables included in trade receivables $ 804.3 $ 777.0Trading securities included in investments 35.8 41.6Net capitalized software costs included in other assets $ 57.3 $ 56.9
Copyright © 2013 www.secdatabase.com. All Rights Reserved.Please Consider the Environment Before Printing This Document
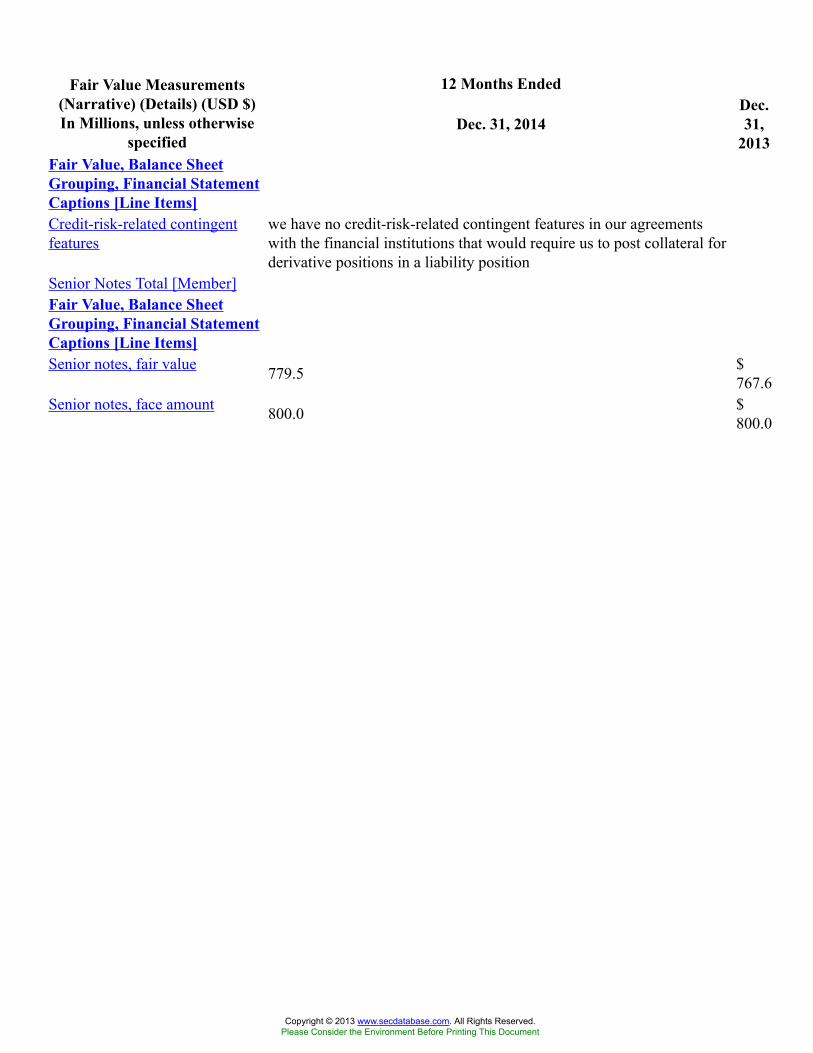
12 Months EndedFair Value Measurements(Narrative) (Details) (USD $)In Millions, unless otherwise
specifiedDec. 31, 2014
Dec.31,
2013Fair Value, Balance SheetGrouping, Financial StatementCaptions [Line Items]Credit-risk-related contingentfeatures
we have no credit-risk-related contingent features in our agreementswith the financial institutions that would require us to post collateral forderivative positions in a liability position
Senior Notes Total [Member]Fair Value, Balance SheetGrouping, Financial StatementCaptions [Line Items]Senior notes, fair value 779.5 $
767.6Senior notes, face amount 800.0 $
800.0
Copyright © 2013 www.secdatabase.com. All Rights Reserved.Please Consider the Environment Before Printing This Document
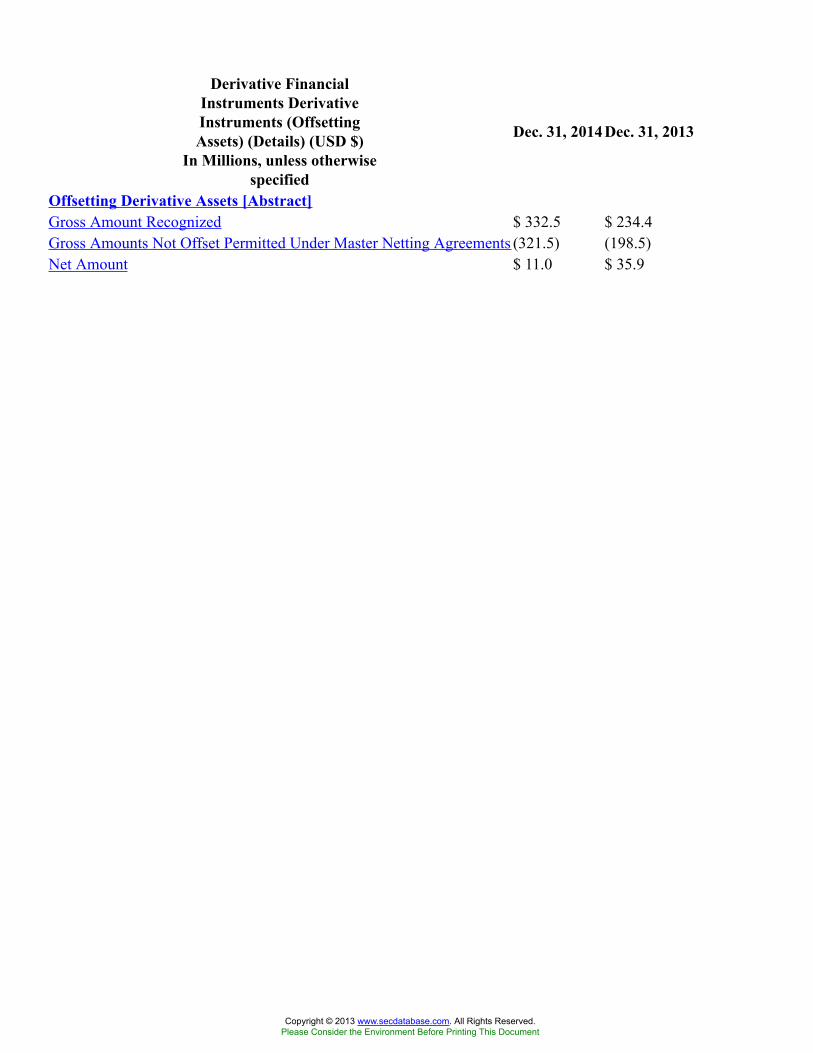
Derivative FinancialInstruments DerivativeInstruments (OffsettingAssets) (Details) (USD $)
In Millions, unless otherwisespecified
Dec. 31, 2014 Dec. 31, 2013
Offsetting Derivative Assets [Abstract]Gross Amount Recognized $ 332.5 $ 234.4Gross Amounts Not Offset Permitted Under Master Netting Agreements (321.5) (198.5)Net Amount $ 11.0 $ 35.9
Copyright © 2013 www.secdatabase.com. All Rights Reserved.Please Consider the Environment Before Printing This Document
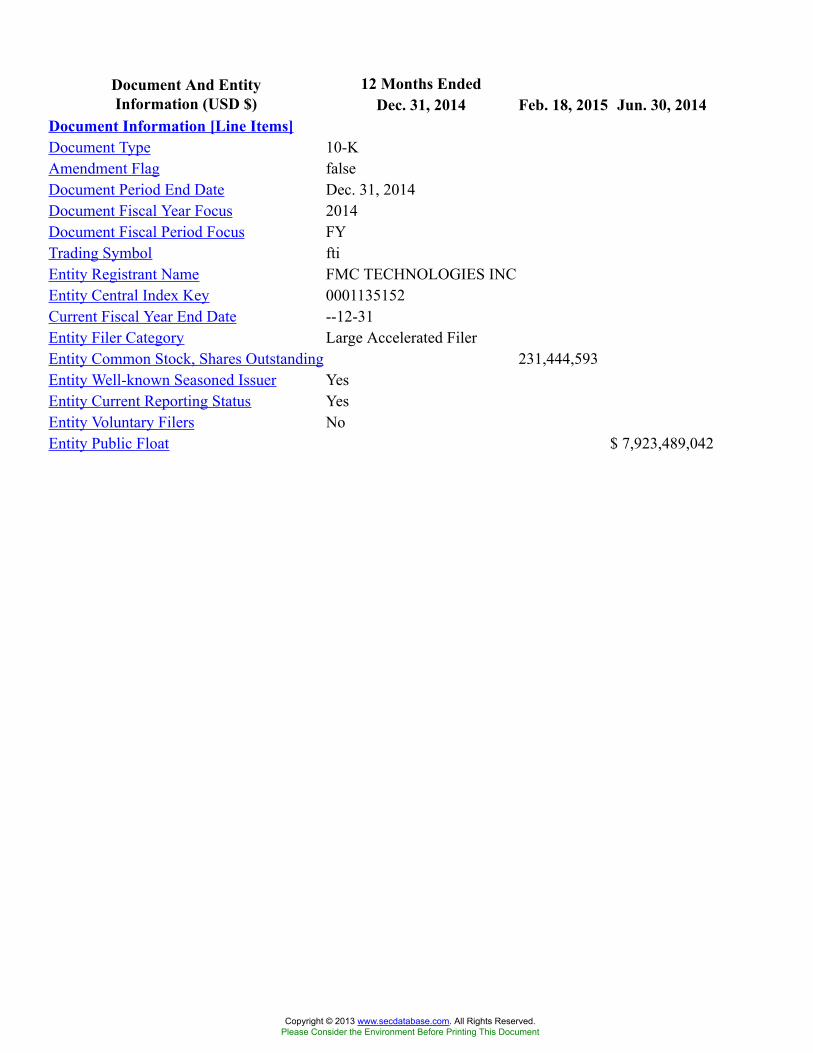
12 Months EndedDocument And EntityInformation (USD $) Dec. 31, 2014 Feb. 18, 2015 Jun. 30, 2014
Document Information [Line Items]Document Type 10-KAmendment Flag falseDocument Period End Date Dec. 31, 2014Document Fiscal Year Focus 2014Document Fiscal Period Focus FYTrading Symbol ftiEntity Registrant Name FMC TECHNOLOGIES INCEntity Central Index Key 0001135152Current Fiscal Year End Date --12-31Entity Filer Category Large Accelerated FilerEntity Common Stock, Shares Outstanding 231,444,593Entity Well-known Seasoned Issuer YesEntity Current Reporting Status YesEntity Voluntary Filers NoEntity Public Float $ 7,923,489,042
Copyright © 2013 www.secdatabase.com. All Rights Reserved.Please Consider the Environment Before Printing This Document
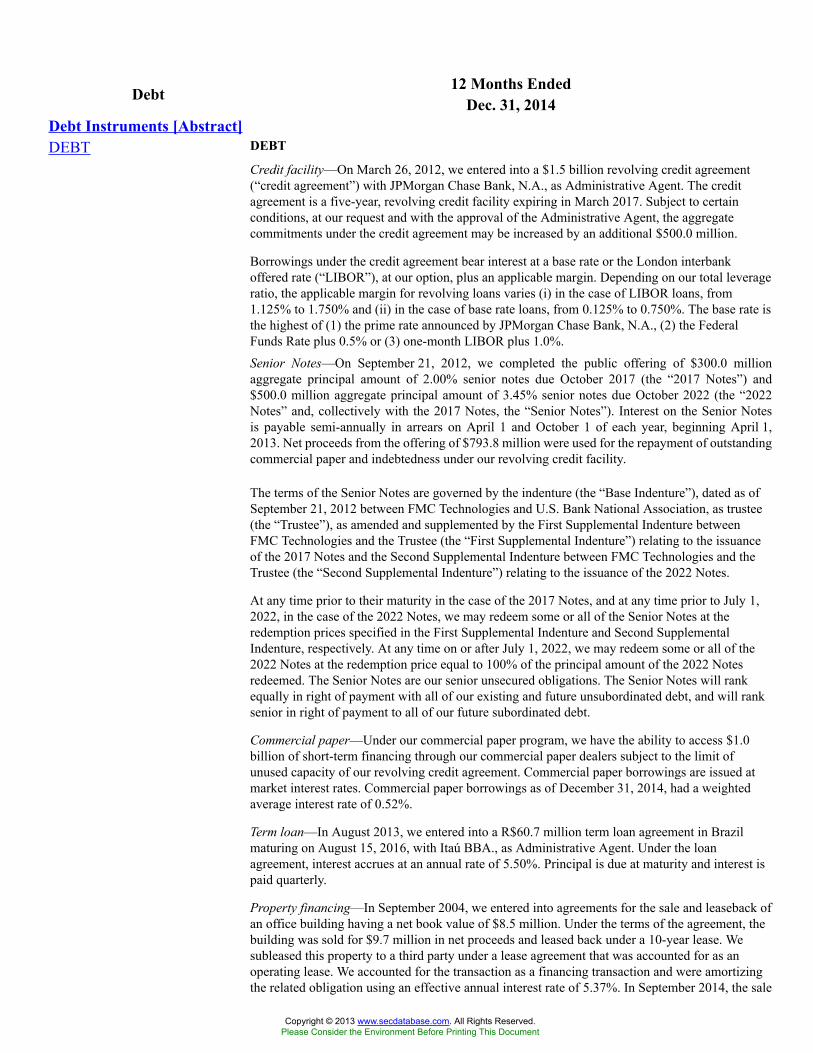
12 Months EndedDebt Dec. 31, 2014Debt Instruments [Abstract]DEBT DEBT
Credit facility—On March 26, 2012, we entered into a $1.5 billion revolving credit agreement(“credit agreement”) with JPMorgan Chase Bank, N.A., as Administrative Agent. The creditagreement is a five-year, revolving credit facility expiring in March 2017. Subject to certainconditions, at our request and with the approval of the Administrative Agent, the aggregatecommitments under the credit agreement may be increased by an additional $500.0 million.
Borrowings under the credit agreement bear interest at a base rate or the London interbankoffered rate (“LIBOR”), at our option, plus an applicable margin. Depending on our total leverageratio, the applicable margin for revolving loans varies (i) in the case of LIBOR loans, from1.125% to 1.750% and (ii) in the case of base rate loans, from 0.125% to 0.750%. The base rate isthe highest of (1) the prime rate announced by JPMorgan Chase Bank, N.A., (2) the FederalFunds Rate plus 0.5% or (3) one-month LIBOR plus 1.0%.
Senior Notes—On September 21, 2012, we completed the public offering of $300.0 millionaggregate principal amount of 2.00% senior notes due October 2017 (the “2017 Notes”) and$500.0 million aggregate principal amount of 3.45% senior notes due October 2022 (the “2022Notes” and, collectively with the 2017 Notes, the “Senior Notes”). Interest on the Senior Notesis payable semi-annually in arrears on April 1 and October 1 of each year, beginning April 1,2013. Net proceeds from the offering of $793.8 million were used for the repayment of outstandingcommercial paper and indebtedness under our revolving credit facility.
The terms of the Senior Notes are governed by the indenture (the “Base Indenture”), dated as ofSeptember 21, 2012 between FMC Technologies and U.S. Bank National Association, as trustee(the “Trustee”), as amended and supplemented by the First Supplemental Indenture betweenFMC Technologies and the Trustee (the “First Supplemental Indenture”) relating to the issuanceof the 2017 Notes and the Second Supplemental Indenture between FMC Technologies and theTrustee (the “Second Supplemental Indenture”) relating to the issuance of the 2022 Notes.
At any time prior to their maturity in the case of the 2017 Notes, and at any time prior to July 1,2022, in the case of the 2022 Notes, we may redeem some or all of the Senior Notes at theredemption prices specified in the First Supplemental Indenture and Second SupplementalIndenture, respectively. At any time on or after July 1, 2022, we may redeem some or all of the2022 Notes at the redemption price equal to 100% of the principal amount of the 2022 Notesredeemed. The Senior Notes are our senior unsecured obligations. The Senior Notes will rankequally in right of payment with all of our existing and future unsubordinated debt, and will ranksenior in right of payment to all of our future subordinated debt.
Commercial paper—Under our commercial paper program, we have the ability to access $1.0billion of short-term financing through our commercial paper dealers subject to the limit ofunused capacity of our revolving credit agreement. Commercial paper borrowings are issued atmarket interest rates. Commercial paper borrowings as of December 31, 2014, had a weightedaverage interest rate of 0.52%.
Term loan—In August 2013, we entered into a R$60.7 million term loan agreement in Brazilmaturing on August 15, 2016, with Itaú BBA., as Administrative Agent. Under the loanagreement, interest accrues at an annual rate of 5.50%. Principal is due at maturity and interest ispaid quarterly.
Property financing—In September 2004, we entered into agreements for the sale and leaseback ofan office building having a net book value of $8.5 million. Under the terms of the agreement, thebuilding was sold for $9.7 million in net proceeds and leased back under a 10-year lease. Wesubleased this property to a third party under a lease agreement that was accounted for as anoperating lease. We accounted for the transaction as a financing transaction and were amortizingthe related obligation using an effective annual interest rate of 5.37%. In September 2014, the sale
Copyright © 2013 www.secdatabase.com. All Rights Reserved.Please Consider the Environment Before Printing This Document
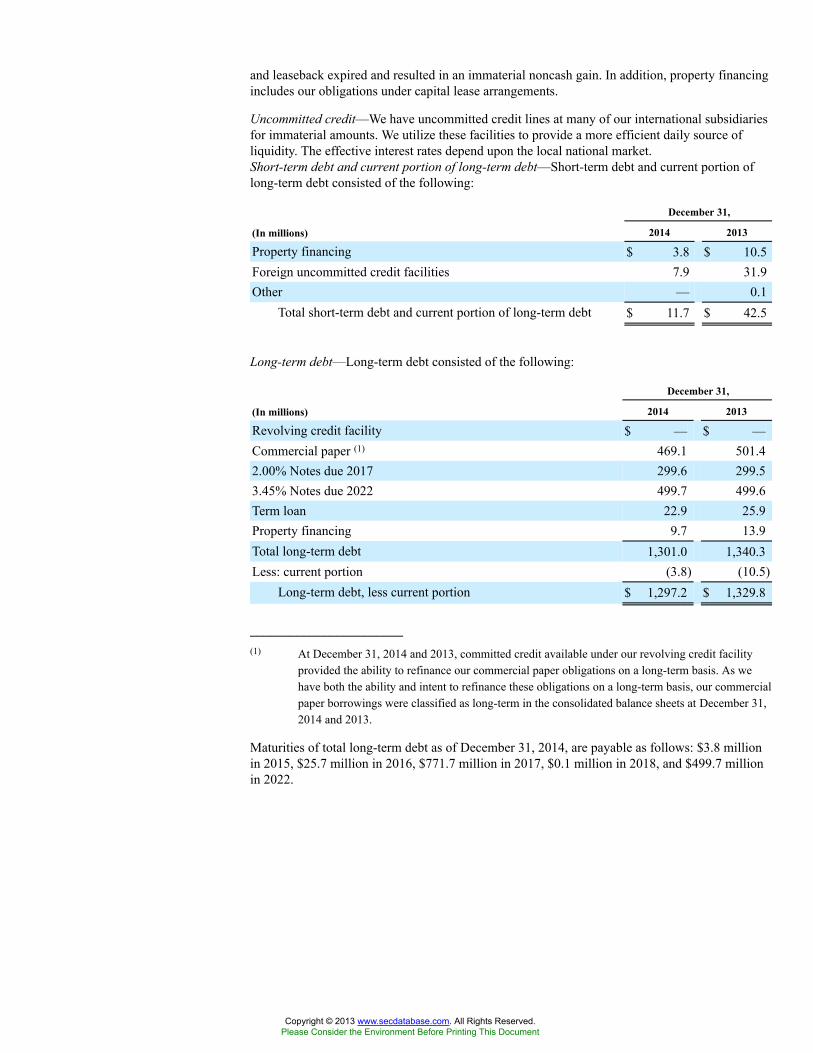
and leaseback expired and resulted in an immaterial noncash gain. In addition, property financingincludes our obligations under capital lease arrangements.
Uncommitted credit—We have uncommitted credit lines at many of our international subsidiariesfor immaterial amounts. We utilize these facilities to provide a more efficient daily source ofliquidity. The effective interest rates depend upon the local national market.Short-term debt and current portion of long-term debt—Short-term debt and current portion oflong-term debt consisted of the following:
December 31,
(In millions) 2014 2013
Property financing $ 3.8 $ 10.5Foreign uncommitted credit facilities 7.9 31.9Other — 0.1
Total short-term debt and current portion of long-term debt $ 11.7 $ 42.5
Long-term debt—Long-term debt consisted of the following:
December 31,
(In millions) 2014 2013
Revolving credit facility $ — $ —Commercial paper (1) 469.1 501.42.00% Notes due 2017 299.6 299.53.45% Notes due 2022 499.7 499.6Term loan 22.9 25.9Property financing 9.7 13.9Total long-term debt 1,301.0 1,340.3Less: current portion (3.8) (10.5)
Long-term debt, less current portion $ 1,297.2 $ 1,329.8
_______________________(1) At December 31, 2014 and 2013, committed credit available under our revolving credit facility
provided the ability to refinance our commercial paper obligations on a long-term basis. As wehave both the ability and intent to refinance these obligations on a long-term basis, our commercialpaper borrowings were classified as long-term in the consolidated balance sheets at December 31,2014 and 2013.
Maturities of total long-term debt as of December 31, 2014, are payable as follows: $3.8 millionin 2015, $25.7 million in 2016, $771.7 million in 2017, $0.1 million in 2018, and $499.7 millionin 2022.
Copyright © 2013 www.secdatabase.com. All Rights Reserved.Please Consider the Environment Before Printing This Document
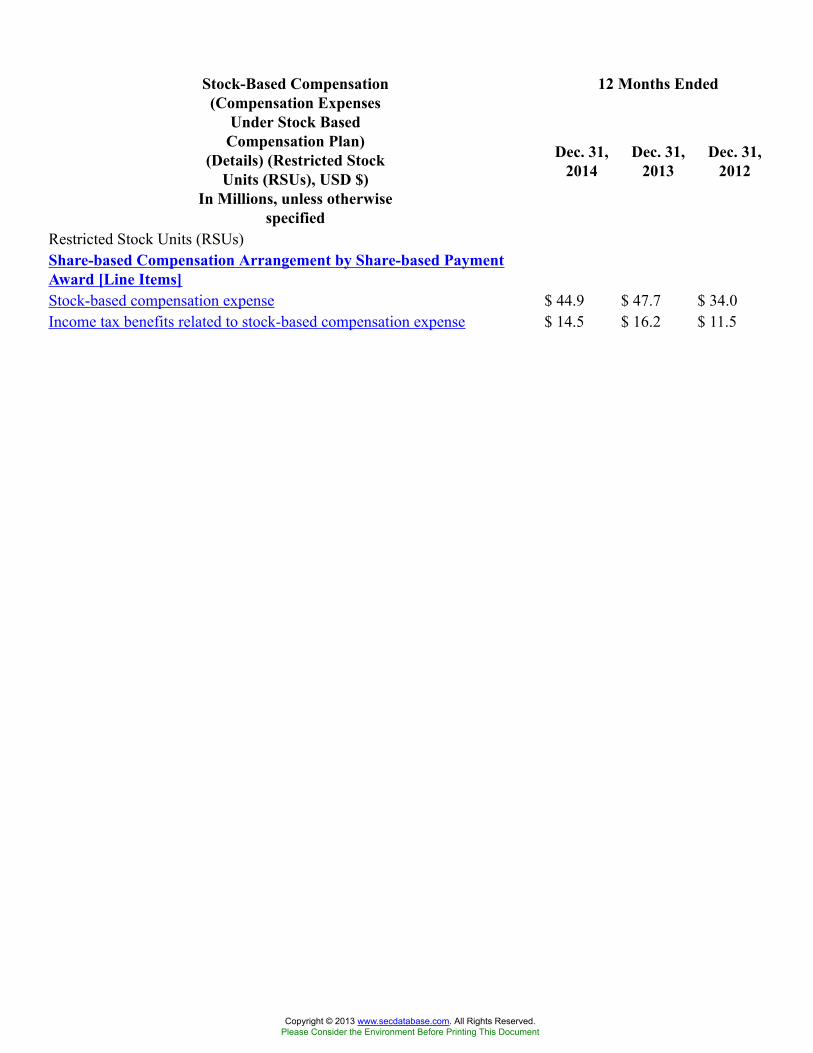
12 Months EndedStock-Based Compensation(Compensation Expenses
Under Stock BasedCompensation Plan)
(Details) (Restricted StockUnits (RSUs), USD $)
In Millions, unless otherwisespecified
Dec. 31,2014
Dec. 31,2013
Dec. 31,2012
Restricted Stock Units (RSUs)Share-based Compensation Arrangement by Share-based PaymentAward [Line Items]Stock-based compensation expense $ 44.9 $ 47.7 $ 34.0Income tax benefits related to stock-based compensation expense $ 14.5 $ 16.2 $ 11.5
Copyright © 2013 www.secdatabase.com. All Rights Reserved.Please Consider the Environment Before Printing This Document
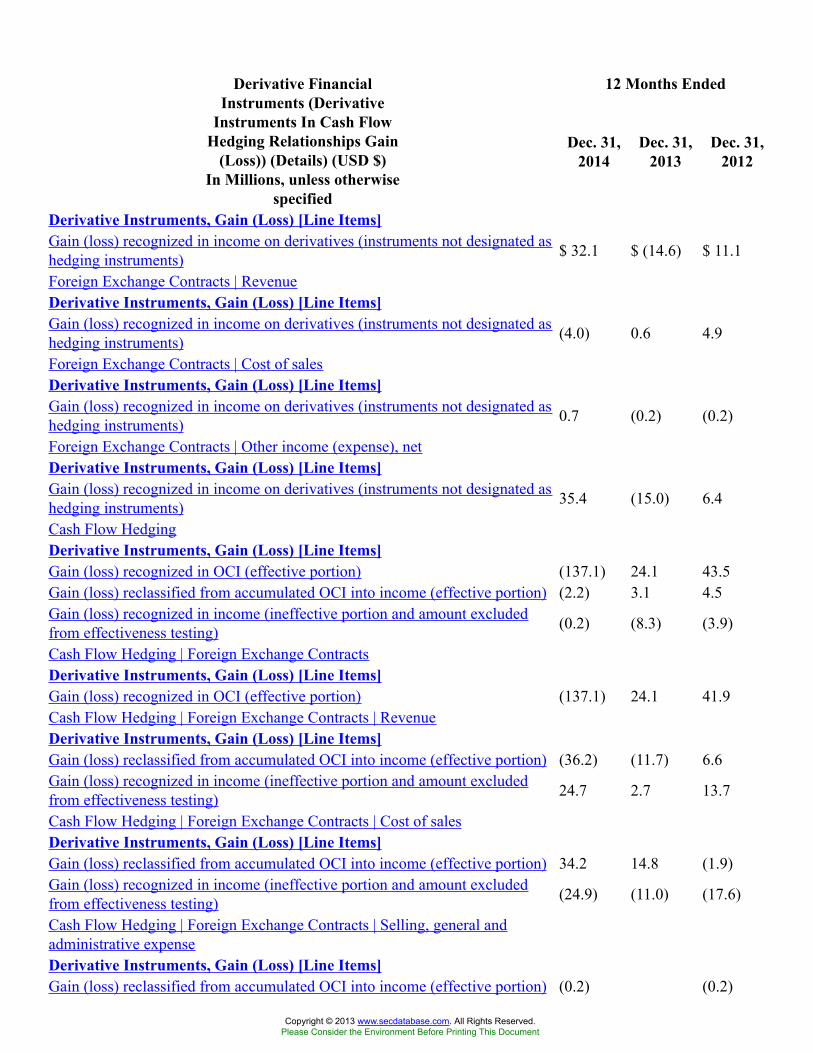
12 Months EndedDerivative FinancialInstruments (Derivative
Instruments In Cash FlowHedging Relationships Gain
(Loss)) (Details) (USD $)In Millions, unless otherwise
specified
Dec. 31,2014
Dec. 31,2013
Dec. 31,2012
Derivative Instruments, Gain (Loss) [Line Items]Gain (loss) recognized in income on derivatives (instruments not designated ashedging instruments) $ 32.1 $ (14.6) $ 11.1
Foreign Exchange Contracts | RevenueDerivative Instruments, Gain (Loss) [Line Items]Gain (loss) recognized in income on derivatives (instruments not designated ashedging instruments) (4.0) 0.6 4.9
Foreign Exchange Contracts | Cost of salesDerivative Instruments, Gain (Loss) [Line Items]Gain (loss) recognized in income on derivatives (instruments not designated ashedging instruments) 0.7 (0.2) (0.2)
Foreign Exchange Contracts | Other income (expense), netDerivative Instruments, Gain (Loss) [Line Items]Gain (loss) recognized in income on derivatives (instruments not designated ashedging instruments) 35.4 (15.0) 6.4
Cash Flow HedgingDerivative Instruments, Gain (Loss) [Line Items]Gain (loss) recognized in OCI (effective portion) (137.1) 24.1 43.5Gain (loss) reclassified from accumulated OCI into income (effective portion) (2.2) 3.1 4.5Gain (loss) recognized in income (ineffective portion and amount excludedfrom effectiveness testing) (0.2) (8.3) (3.9)
Cash Flow Hedging | Foreign Exchange ContractsDerivative Instruments, Gain (Loss) [Line Items]Gain (loss) recognized in OCI (effective portion) (137.1) 24.1 41.9Cash Flow Hedging | Foreign Exchange Contracts | RevenueDerivative Instruments, Gain (Loss) [Line Items]Gain (loss) reclassified from accumulated OCI into income (effective portion) (36.2) (11.7) 6.6Gain (loss) recognized in income (ineffective portion and amount excludedfrom effectiveness testing) 24.7 2.7 13.7
Cash Flow Hedging | Foreign Exchange Contracts | Cost of salesDerivative Instruments, Gain (Loss) [Line Items]Gain (loss) reclassified from accumulated OCI into income (effective portion) 34.2 14.8 (1.9)Gain (loss) recognized in income (ineffective portion and amount excludedfrom effectiveness testing) (24.9) (11.0) (17.6)
Cash Flow Hedging | Foreign Exchange Contracts | Selling, general andadministrative expenseDerivative Instruments, Gain (Loss) [Line Items]Gain (loss) reclassified from accumulated OCI into income (effective portion) (0.2) (0.2)
Copyright © 2013 www.secdatabase.com. All Rights Reserved.Please Consider the Environment Before Printing This Document

Cash Flow Hedging | Interest Rate ContractDerivative Instruments, Gain (Loss) [Line Items]Gain (loss) recognized in OCI (effective portion) $ 1.6
Copyright © 2013 www.secdatabase.com. All Rights Reserved.Please Consider the Environment Before Printing This Document
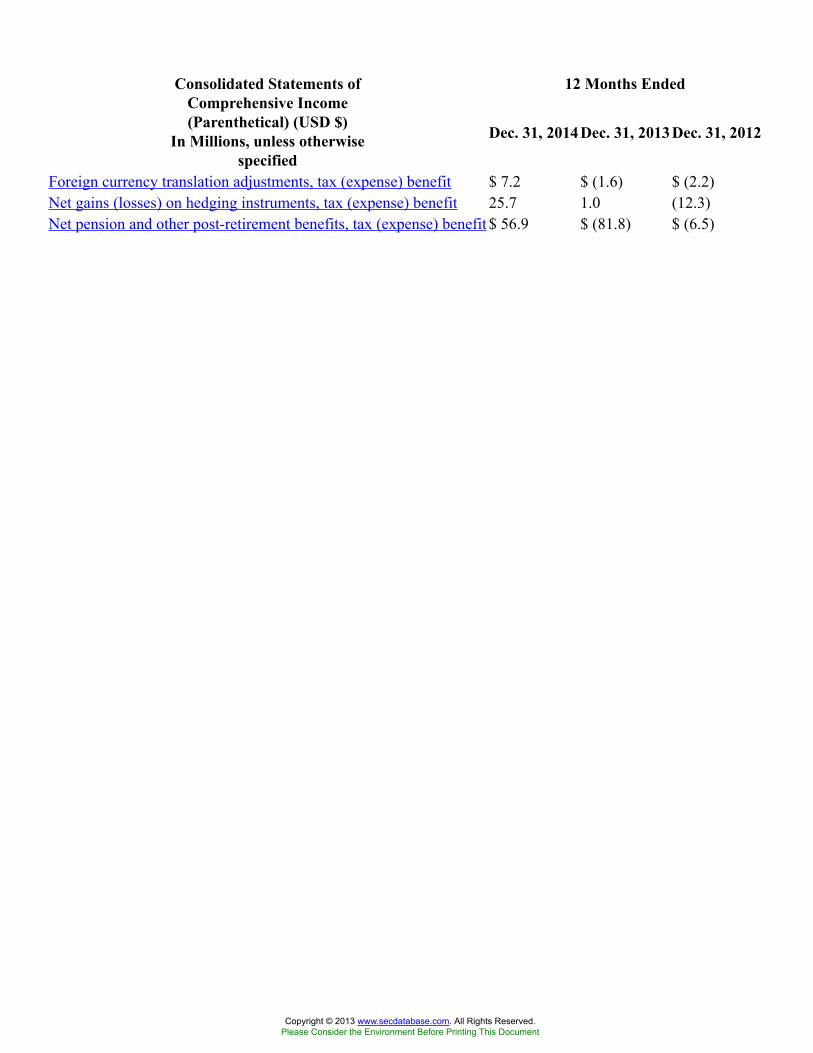
12 Months EndedConsolidated Statements ofComprehensive Income(Parenthetical) (USD $)
In Millions, unless otherwisespecified
Dec. 31, 2014 Dec. 31, 2013 Dec. 31, 2012
Foreign currency translation adjustments, tax (expense) benefit $ 7.2 $ (1.6) $ (2.2)Net gains (losses) on hedging instruments, tax (expense) benefit 25.7 1.0 (12.3)Net pension and other post-retirement benefits, tax (expense) benefit $ 56.9 $ (81.8) $ (6.5)
Copyright © 2013 www.secdatabase.com. All Rights Reserved.Please Consider the Environment Before Printing This Document
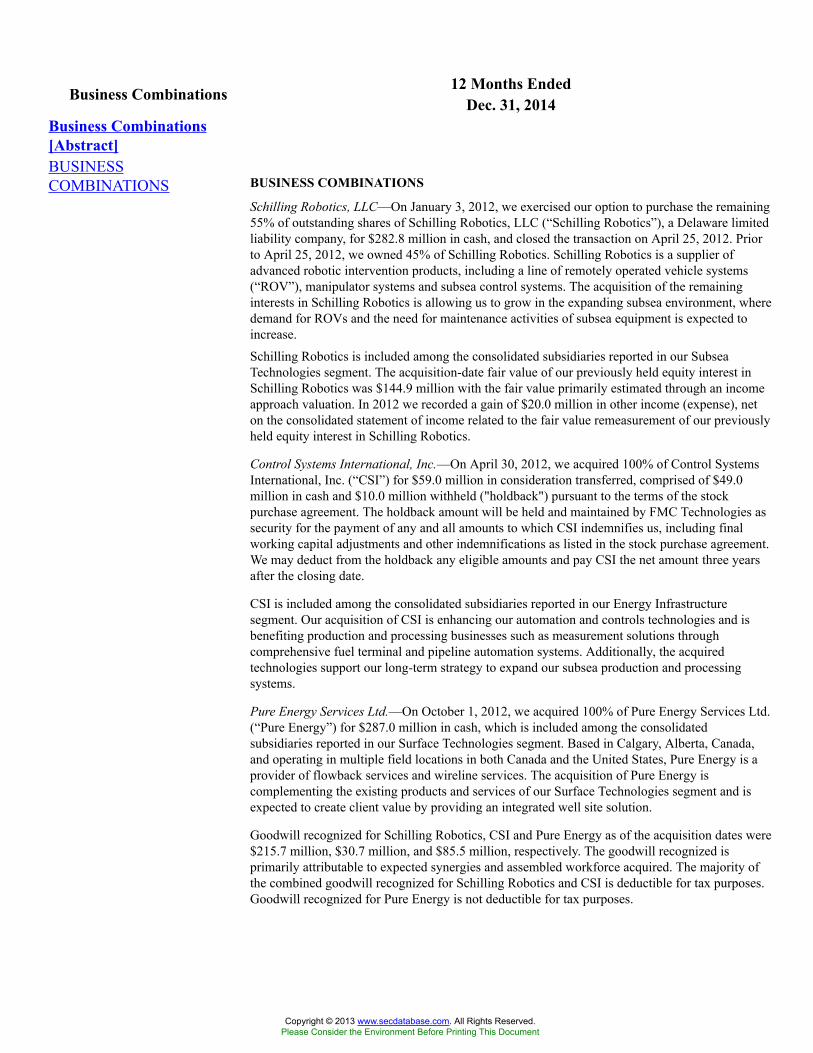
12 Months EndedBusiness Combinations Dec. 31, 2014Business Combinations[Abstract]BUSINESSCOMBINATIONS BUSINESS COMBINATIONS
Schilling Robotics, LLC—On January 3, 2012, we exercised our option to purchase the remaining55% of outstanding shares of Schilling Robotics, LLC (“Schilling Robotics”), a Delaware limitedliability company, for $282.8 million in cash, and closed the transaction on April 25, 2012. Priorto April 25, 2012, we owned 45% of Schilling Robotics. Schilling Robotics is a supplier ofadvanced robotic intervention products, including a line of remotely operated vehicle systems(“ROV”), manipulator systems and subsea control systems. The acquisition of the remaininginterests in Schilling Robotics is allowing us to grow in the expanding subsea environment, wheredemand for ROVs and the need for maintenance activities of subsea equipment is expected toincrease.
Schilling Robotics is included among the consolidated subsidiaries reported in our SubseaTechnologies segment. The acquisition-date fair value of our previously held equity interest inSchilling Robotics was $144.9 million with the fair value primarily estimated through an incomeapproach valuation. In 2012 we recorded a gain of $20.0 million in other income (expense), neton the consolidated statement of income related to the fair value remeasurement of our previouslyheld equity interest in Schilling Robotics.
Control Systems International, Inc.—On April 30, 2012, we acquired 100% of Control SystemsInternational, Inc. (“CSI”) for $59.0 million in consideration transferred, comprised of $49.0million in cash and $10.0 million withheld ("holdback") pursuant to the terms of the stockpurchase agreement. The holdback amount will be held and maintained by FMC Technologies assecurity for the payment of any and all amounts to which CSI indemnifies us, including finalworking capital adjustments and other indemnifications as listed in the stock purchase agreement.We may deduct from the holdback any eligible amounts and pay CSI the net amount three yearsafter the closing date.
CSI is included among the consolidated subsidiaries reported in our Energy Infrastructuresegment. Our acquisition of CSI is enhancing our automation and controls technologies and isbenefiting production and processing businesses such as measurement solutions throughcomprehensive fuel terminal and pipeline automation systems. Additionally, the acquiredtechnologies support our long-term strategy to expand our subsea production and processingsystems.
Pure Energy Services Ltd.—On October 1, 2012, we acquired 100% of Pure Energy Services Ltd.(“Pure Energy”) for $287.0 million in cash, which is included among the consolidatedsubsidiaries reported in our Surface Technologies segment. Based in Calgary, Alberta, Canada,and operating in multiple field locations in both Canada and the United States, Pure Energy is aprovider of flowback services and wireline services. The acquisition of Pure Energy iscomplementing the existing products and services of our Surface Technologies segment and isexpected to create client value by providing an integrated well site solution.
Goodwill recognized for Schilling Robotics, CSI and Pure Energy as of the acquisition dates were$215.7 million, $30.7 million, and $85.5 million, respectively. The goodwill recognized isprimarily attributable to expected synergies and assembled workforce acquired. The majority ofthe combined goodwill recognized for Schilling Robotics and CSI is deductible for tax purposes.Goodwill recognized for Pure Energy is not deductible for tax purposes.
Copyright © 2013 www.secdatabase.com. All Rights Reserved.Please Consider the Environment Before Printing This Document
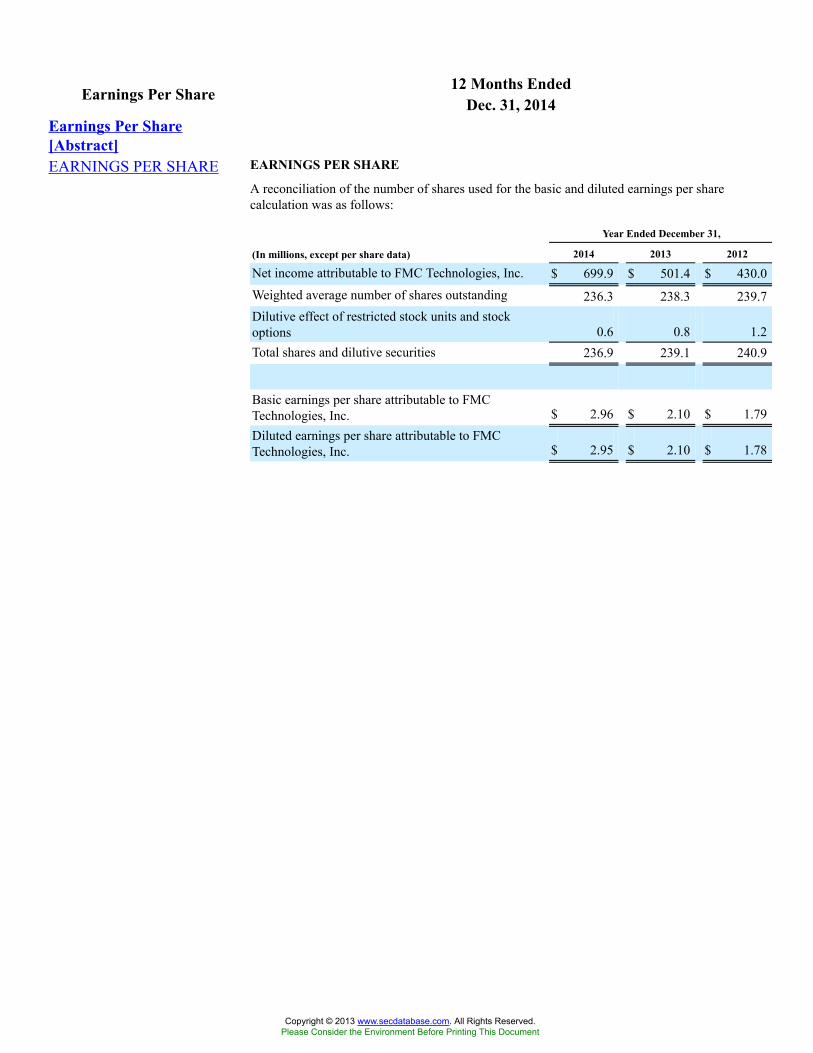
12 Months EndedEarnings Per Share Dec. 31, 2014Earnings Per Share[Abstract]EARNINGS PER SHARE EARNINGS PER SHARE
A reconciliation of the number of shares used for the basic and diluted earnings per sharecalculation was as follows:
Year Ended December 31,
(In millions, except per share data) 2014 2013 2012
Net income attributable to FMC Technologies, Inc. $ 699.9 $ 501.4 $ 430.0Weighted average number of shares outstanding 236.3 238.3 239.7Dilutive effect of restricted stock units and stockoptions 0.6 0.8 1.2Total shares and dilutive securities 236.9 239.1 240.9
Basic earnings per share attributable to FMCTechnologies, Inc. $ 2.96 $ 2.10 $ 1.79Diluted earnings per share attributable to FMCTechnologies, Inc. $ 2.95 $ 2.10 $ 1.78
Copyright © 2013 www.secdatabase.com. All Rights Reserved.Please Consider the Environment Before Printing This Document
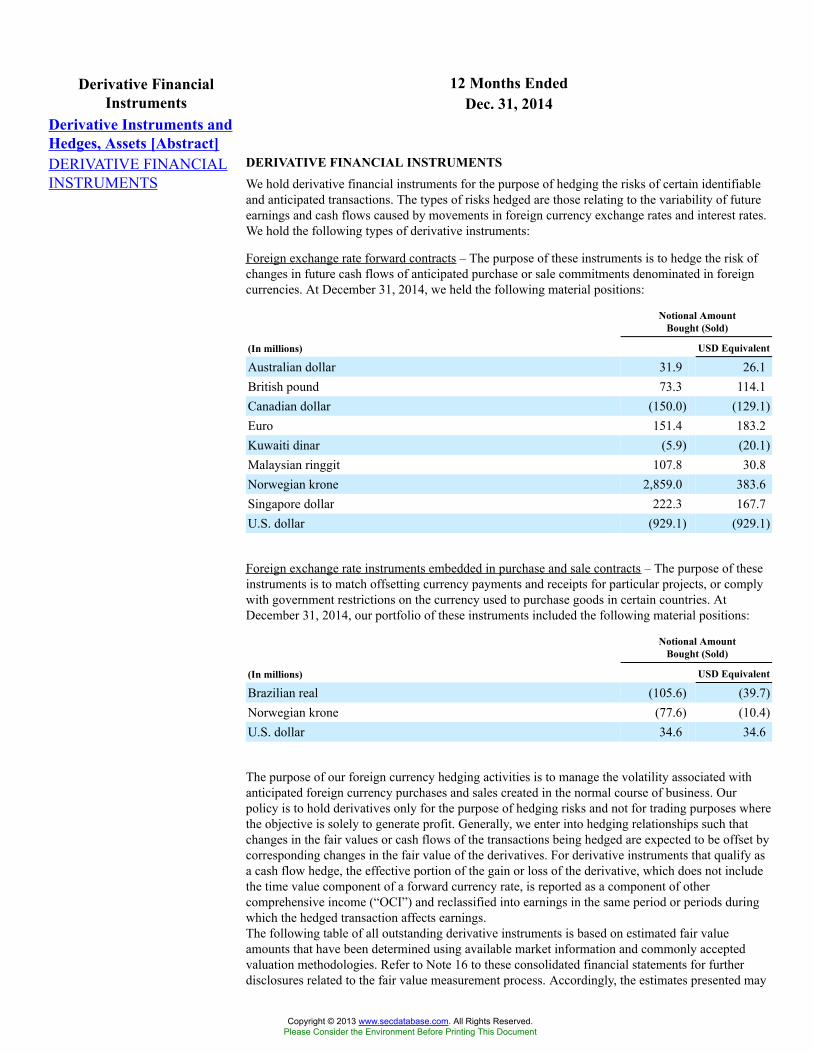
12 Months EndedDerivative FinancialInstruments Dec. 31, 2014
Derivative Instruments andHedges, Assets [Abstract]DERIVATIVE FINANCIALINSTRUMENTS
DERIVATIVE FINANCIAL INSTRUMENTSWe hold derivative financial instruments for the purpose of hedging the risks of certain identifiableand anticipated transactions. The types of risks hedged are those relating to the variability of futureearnings and cash flows caused by movements in foreign currency exchange rates and interest rates.We hold the following types of derivative instruments:
Foreign exchange rate forward contracts – The purpose of these instruments is to hedge the risk ofchanges in future cash flows of anticipated purchase or sale commitments denominated in foreigncurrencies. At December 31, 2014, we held the following material positions:
Notional AmountBought (Sold)
(In millions) USD Equivalent
Australian dollar 31.9 26.1British pound 73.3 114.1Canadian dollar (150.0) (129.1)Euro 151.4 183.2Kuwaiti dinar (5.9) (20.1)Malaysian ringgit 107.8 30.8Norwegian krone 2,859.0 383.6Singapore dollar 222.3 167.7U.S. dollar (929.1) (929.1)
Foreign exchange rate instruments embedded in purchase and sale contracts – The purpose of theseinstruments is to match offsetting currency payments and receipts for particular projects, or complywith government restrictions on the currency used to purchase goods in certain countries. AtDecember 31, 2014, our portfolio of these instruments included the following material positions:
Notional AmountBought (Sold)
(In millions) USD Equivalent
Brazilian real (105.6) (39.7)Norwegian krone (77.6) (10.4)U.S. dollar 34.6 34.6
The purpose of our foreign currency hedging activities is to manage the volatility associated withanticipated foreign currency purchases and sales created in the normal course of business. Ourpolicy is to hold derivatives only for the purpose of hedging risks and not for trading purposes wherethe objective is solely to generate profit. Generally, we enter into hedging relationships such thatchanges in the fair values or cash flows of the transactions being hedged are expected to be offset bycorresponding changes in the fair value of the derivatives. For derivative instruments that qualify asa cash flow hedge, the effective portion of the gain or loss of the derivative, which does not includethe time value component of a forward currency rate, is reported as a component of othercomprehensive income (“OCI”) and reclassified into earnings in the same period or periods duringwhich the hedged transaction affects earnings.The following table of all outstanding derivative instruments is based on estimated fair valueamounts that have been determined using available market information and commonly acceptedvaluation methodologies. Refer to Note 16 to these consolidated financial statements for furtherdisclosures related to the fair value measurement process. Accordingly, the estimates presented may
Copyright © 2013 www.secdatabase.com. All Rights Reserved.Please Consider the Environment Before Printing This Document
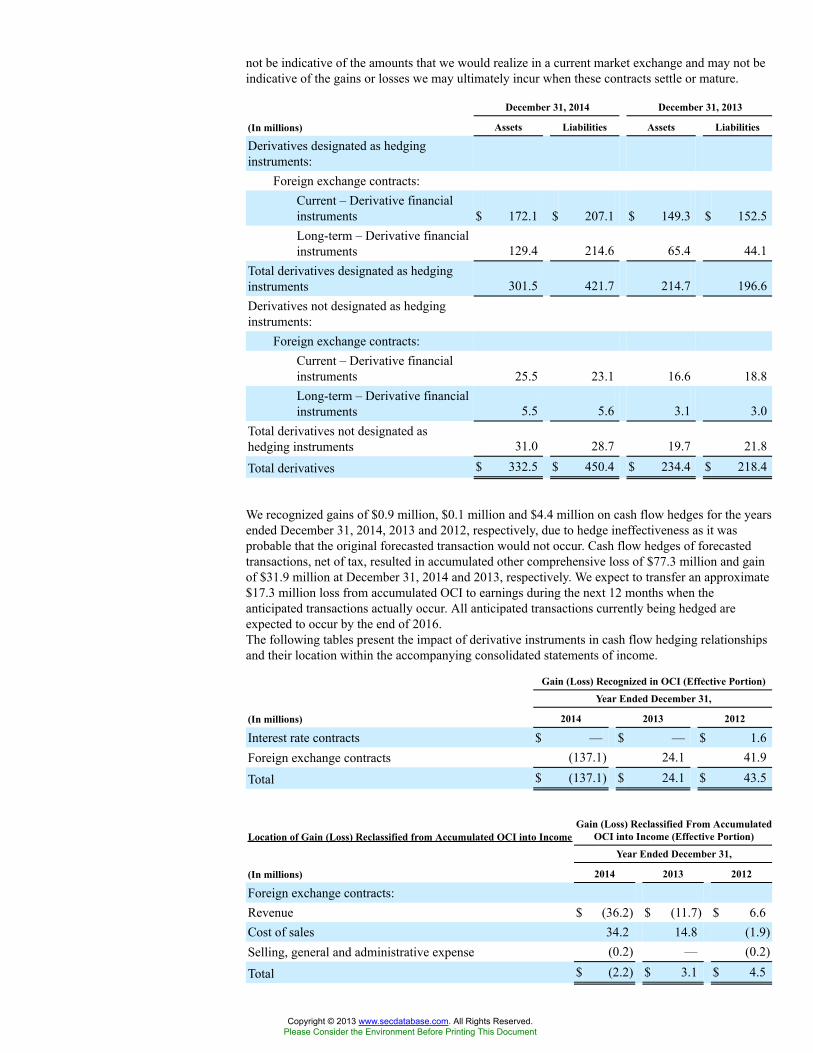
not be indicative of the amounts that we would realize in a current market exchange and may not beindicative of the gains or losses we may ultimately incur when these contracts settle or mature.
December 31, 2014 December 31, 2013
(In millions) Assets Liabilities Assets Liabilities
Derivatives designated as hedginginstruments:
Foreign exchange contracts:Current – Derivative financialinstruments $ 172.1 $ 207.1 $ 149.3 $ 152.5Long-term – Derivative financialinstruments 129.4 214.6 65.4 44.1
Total derivatives designated as hedginginstruments 301.5 421.7 214.7 196.6Derivatives not designated as hedginginstruments:
Foreign exchange contracts:Current – Derivative financialinstruments 25.5 23.1 16.6 18.8Long-term – Derivative financialinstruments 5.5 5.6 3.1 3.0
Total derivatives not designated ashedging instruments 31.0 28.7 19.7 21.8
Total derivatives $ 332.5 $ 450.4 $ 234.4 $ 218.4
We recognized gains of $0.9 million, $0.1 million and $4.4 million on cash flow hedges for the yearsended December 31, 2014, 2013 and 2012, respectively, due to hedge ineffectiveness as it wasprobable that the original forecasted transaction would not occur. Cash flow hedges of forecastedtransactions, net of tax, resulted in accumulated other comprehensive loss of $77.3 million and gainof $31.9 million at December 31, 2014 and 2013, respectively. We expect to transfer an approximate$17.3 million loss from accumulated OCI to earnings during the next 12 months when theanticipated transactions actually occur. All anticipated transactions currently being hedged areexpected to occur by the end of 2016.The following tables present the impact of derivative instruments in cash flow hedging relationshipsand their location within the accompanying consolidated statements of income.
Gain (Loss) Recognized in OCI (Effective Portion)
Year Ended December 31,
(In millions) 2014 2013 2012
Interest rate contracts $ — $ — $ 1.6Foreign exchange contracts (137.1) 24.1 41.9
Total $ (137.1) $ 24.1 $ 43.5
Location of Gain (Loss) Reclassified from Accumulated OCI into IncomeGain (Loss) Reclassified From Accumulated
OCI into Income (Effective Portion)
Year Ended December 31,
(In millions) 2014 2013 2012
Foreign exchange contracts:Revenue $ (36.2) $ (11.7) $ 6.6Cost of sales 34.2 14.8 (1.9)Selling, general and administrative expense (0.2) — (0.2)
Total $ (2.2) $ 3.1 $ 4.5
Copyright © 2013 www.secdatabase.com. All Rights Reserved.Please Consider the Environment Before Printing This Document
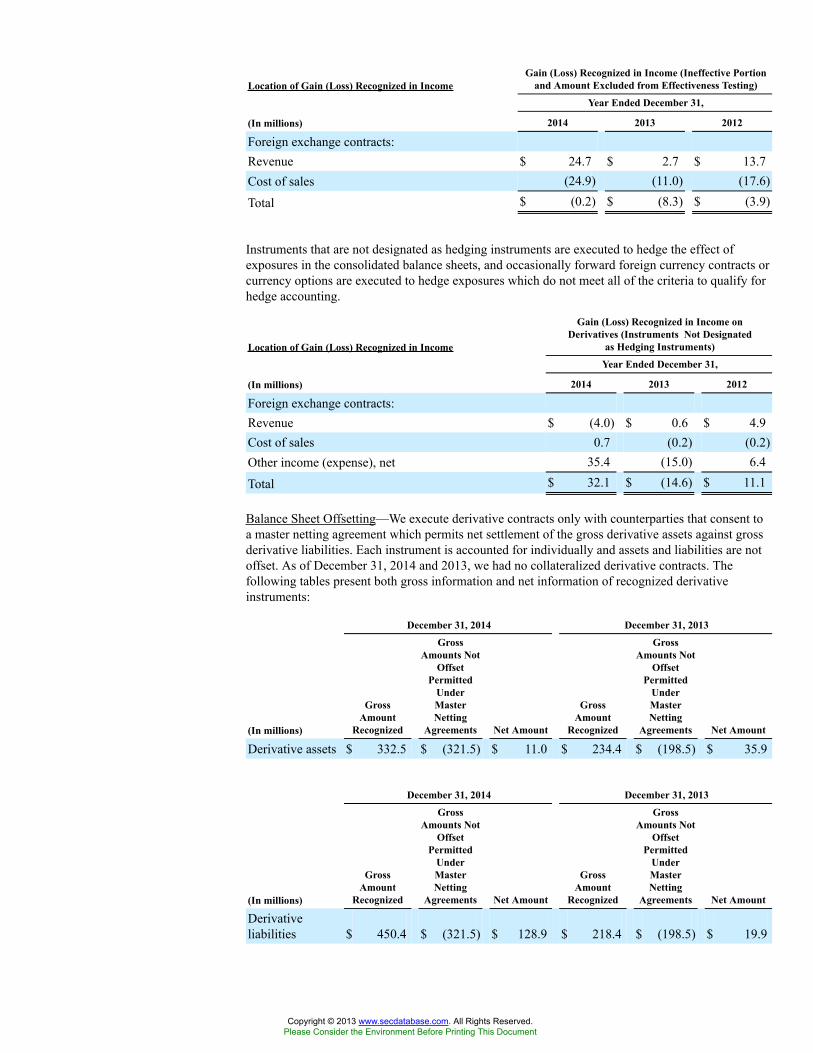
Location of Gain (Loss) Recognized in IncomeGain (Loss) Recognized in Income (Ineffective Portion
and Amount Excluded from Effectiveness Testing)
Year Ended December 31,
(In millions) 2014 2013 2012
Foreign exchange contracts:Revenue $ 24.7 $ 2.7 $ 13.7Cost of sales (24.9) (11.0) (17.6)
Total $ (0.2) $ (8.3) $ (3.9)
Instruments that are not designated as hedging instruments are executed to hedge the effect ofexposures in the consolidated balance sheets, and occasionally forward foreign currency contracts orcurrency options are executed to hedge exposures which do not meet all of the criteria to qualify forhedge accounting.
Location of Gain (Loss) Recognized in Income
Gain (Loss) Recognized in Income onDerivatives (Instruments Not Designated
as Hedging Instruments)
Year Ended December 31,
(In millions) 2014 2013 2012
Foreign exchange contracts:Revenue $ (4.0) $ 0.6 $ 4.9Cost of sales 0.7 (0.2) (0.2)Other income (expense), net 35.4 (15.0) 6.4
Total $ 32.1 $ (14.6) $ 11.1
Balance Sheet Offsetting—We execute derivative contracts only with counterparties that consent toa master netting agreement which permits net settlement of the gross derivative assets against grossderivative liabilities. Each instrument is accounted for individually and assets and liabilities are notoffset. As of December 31, 2014 and 2013, we had no collateralized derivative contracts. Thefollowing tables present both gross information and net information of recognized derivativeinstruments:
December 31, 2014 December 31, 2013
(In millions)
GrossAmount
Recognized
GrossAmounts Not
OffsetPermitted
UnderMasterNetting
Agreements Net Amount
GrossAmount
Recognized
GrossAmounts Not
OffsetPermitted
UnderMasterNetting
Agreements Net Amount
Derivative assets $ 332.5 $ (321.5) $ 11.0 $ 234.4 $ (198.5) $ 35.9
December 31, 2014 December 31, 2013
(In millions)
GrossAmount
Recognized
GrossAmounts Not
OffsetPermitted
UnderMasterNetting
Agreements Net Amount
GrossAmount
Recognized
GrossAmounts Not
OffsetPermitted
UnderMasterNetting
Agreements Net Amount
Derivativeliabilities $ 450.4 $ (321.5) $ 128.9 $ 218.4 $ (198.5) $ 19.9
Copyright © 2013 www.secdatabase.com. All Rights Reserved.Please Consider the Environment Before Printing This Document
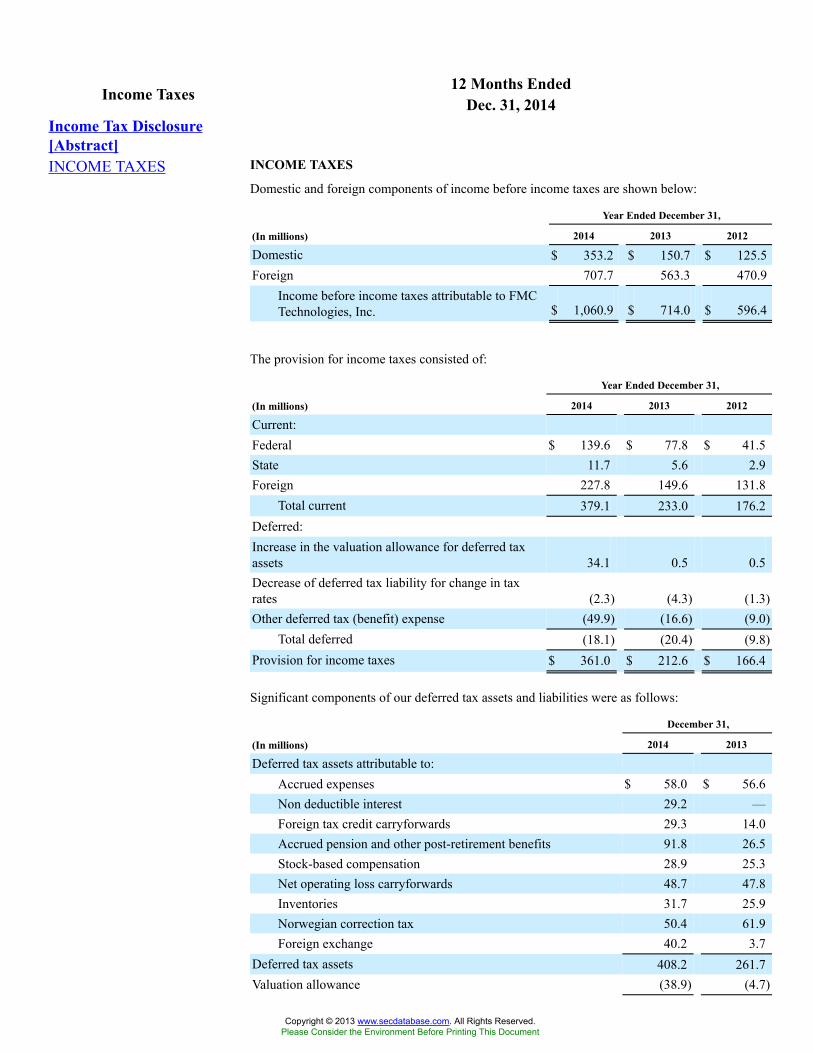
12 Months EndedIncome Taxes Dec. 31, 2014Income Tax Disclosure[Abstract]INCOME TAXES INCOME TAXES
Domestic and foreign components of income before income taxes are shown below:
Year Ended December 31,
(In millions) 2014 2013 2012
Domestic $ 353.2 $ 150.7 $ 125.5Foreign 707.7 563.3 470.9
Income before income taxes attributable to FMCTechnologies, Inc. $ 1,060.9 $ 714.0 $ 596.4
The provision for income taxes consisted of:
Year Ended December 31,
(In millions) 2014 2013 2012
Current:Federal $ 139.6 $ 77.8 $ 41.5State 11.7 5.6 2.9Foreign 227.8 149.6 131.8
Total current 379.1 233.0 176.2Deferred:Increase in the valuation allowance for deferred taxassets 34.1 0.5 0.5Decrease of deferred tax liability for change in taxrates (2.3) (4.3) (1.3)Other deferred tax (benefit) expense (49.9) (16.6) (9.0)
Total deferred (18.1) (20.4) (9.8)Provision for income taxes $ 361.0 $ 212.6 $ 166.4
Significant components of our deferred tax assets and liabilities were as follows:
December 31,
(In millions) 2014 2013
Deferred tax assets attributable to:Accrued expenses $ 58.0 $ 56.6Non deductible interest 29.2 —Foreign tax credit carryforwards 29.3 14.0Accrued pension and other post-retirement benefits 91.8 26.5Stock-based compensation 28.9 25.3Net operating loss carryforwards 48.7 47.8Inventories 31.7 25.9Norwegian correction tax 50.4 61.9Foreign exchange 40.2 3.7
Deferred tax assets 408.2 261.7Valuation allowance (38.9) (4.7)
Copyright © 2013 www.secdatabase.com. All Rights Reserved.Please Consider the Environment Before Printing This Document
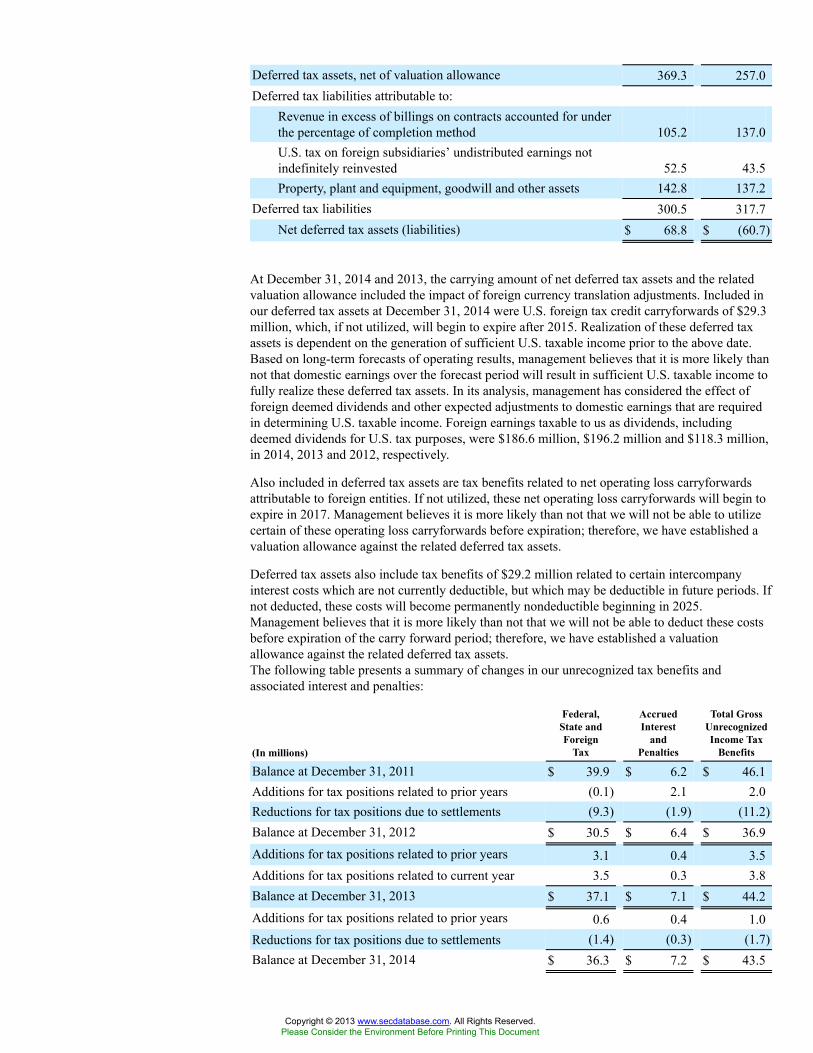
Deferred tax assets, net of valuation allowance 369.3 257.0Deferred tax liabilities attributable to:
Revenue in excess of billings on contracts accounted for underthe percentage of completion method 105.2 137.0U.S. tax on foreign subsidiaries’ undistributed earnings notindefinitely reinvested 52.5 43.5Property, plant and equipment, goodwill and other assets 142.8 137.2
Deferred tax liabilities 300.5 317.7Net deferred tax assets (liabilities) $ 68.8 $ (60.7)
At December 31, 2014 and 2013, the carrying amount of net deferred tax assets and the relatedvaluation allowance included the impact of foreign currency translation adjustments. Included inour deferred tax assets at December 31, 2014 were U.S. foreign tax credit carryforwards of $29.3million, which, if not utilized, will begin to expire after 2015. Realization of these deferred taxassets is dependent on the generation of sufficient U.S. taxable income prior to the above date.Based on long-term forecasts of operating results, management believes that it is more likely thannot that domestic earnings over the forecast period will result in sufficient U.S. taxable income tofully realize these deferred tax assets. In its analysis, management has considered the effect offoreign deemed dividends and other expected adjustments to domestic earnings that are requiredin determining U.S. taxable income. Foreign earnings taxable to us as dividends, includingdeemed dividends for U.S. tax purposes, were $186.6 million, $196.2 million and $118.3 million,in 2014, 2013 and 2012, respectively.
Also included in deferred tax assets are tax benefits related to net operating loss carryforwardsattributable to foreign entities. If not utilized, these net operating loss carryforwards will begin toexpire in 2017. Management believes it is more likely than not that we will not be able to utilizecertain of these operating loss carryforwards before expiration; therefore, we have established avaluation allowance against the related deferred tax assets.
Deferred tax assets also include tax benefits of $29.2 million related to certain intercompanyinterest costs which are not currently deductible, but which may be deductible in future periods. Ifnot deducted, these costs will become permanently nondeductible beginning in 2025.Management believes that it is more likely than not that we will not be able to deduct these costsbefore expiration of the carry forward period; therefore, we have established a valuationallowance against the related deferred tax assets.The following table presents a summary of changes in our unrecognized tax benefits andassociated interest and penalties:
(In millions)
Federal,State andForeign
Tax
AccruedInterest
andPenalties
Total GrossUnrecognizedIncome Tax
Benefits
Balance at December 31, 2011 $ 39.9 $ 6.2 $ 46.1Additions for tax positions related to prior years (0.1) 2.1 2.0Reductions for tax positions due to settlements (9.3) (1.9) (11.2)Balance at December 31, 2012 $ 30.5 $ 6.4 $ 36.9Additions for tax positions related to prior years 3.1 0.4 3.5Additions for tax positions related to current year 3.5 0.3 3.8Balance at December 31, 2013 $ 37.1 $ 7.1 $ 44.2Additions for tax positions related to prior years 0.6 0.4 1.0Reductions for tax positions due to settlements (1.4) (0.3) (1.7)Balance at December 31, 2014 $ 36.3 $ 7.2 $ 43.5
Copyright © 2013 www.secdatabase.com. All Rights Reserved.Please Consider the Environment Before Printing This Document
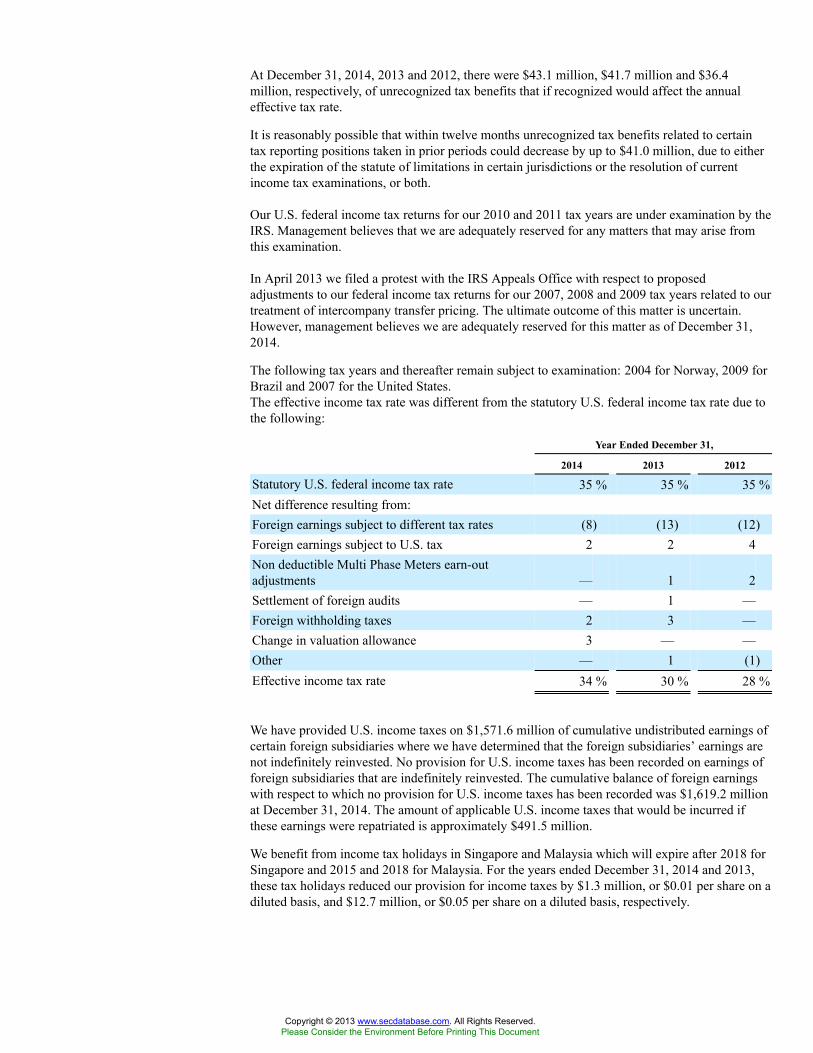
At December 31, 2014, 2013 and 2012, there were $43.1 million, $41.7 million and $36.4million, respectively, of unrecognized tax benefits that if recognized would affect the annualeffective tax rate.
It is reasonably possible that within twelve months unrecognized tax benefits related to certaintax reporting positions taken in prior periods could decrease by up to $41.0 million, due to eitherthe expiration of the statute of limitations in certain jurisdictions or the resolution of currentincome tax examinations, or both.
Our U.S. federal income tax returns for our 2010 and 2011 tax years are under examination by theIRS. Management believes that we are adequately reserved for any matters that may arise fromthis examination.
In April 2013 we filed a protest with the IRS Appeals Office with respect to proposedadjustments to our federal income tax returns for our 2007, 2008 and 2009 tax years related to ourtreatment of intercompany transfer pricing. The ultimate outcome of this matter is uncertain.However, management believes we are adequately reserved for this matter as of December 31,2014.
The following tax years and thereafter remain subject to examination: 2004 for Norway, 2009 forBrazil and 2007 for the United States.The effective income tax rate was different from the statutory U.S. federal income tax rate due tothe following:
Year Ended December 31,
2014 2013 2012
Statutory U.S. federal income tax rate 35 % 35 % 35 %Net difference resulting from:Foreign earnings subject to different tax rates (8) (13) (12)Foreign earnings subject to U.S. tax 2 2 4Non deductible Multi Phase Meters earn-outadjustments — 1 2Settlement of foreign audits — 1 —Foreign withholding taxes 2 3 —Change in valuation allowance 3 — —Other — 1 (1)Effective income tax rate 34 % 30 % 28 %
We have provided U.S. income taxes on $1,571.6 million of cumulative undistributed earnings ofcertain foreign subsidiaries where we have determined that the foreign subsidiaries’ earnings arenot indefinitely reinvested. No provision for U.S. income taxes has been recorded on earnings offoreign subsidiaries that are indefinitely reinvested. The cumulative balance of foreign earningswith respect to which no provision for U.S. income taxes has been recorded was $1,619.2 millionat December 31, 2014. The amount of applicable U.S. income taxes that would be incurred ifthese earnings were repatriated is approximately $491.5 million.
We benefit from income tax holidays in Singapore and Malaysia which will expire after 2018 forSingapore and 2015 and 2018 for Malaysia. For the years ended December 31, 2014 and 2013,these tax holidays reduced our provision for income taxes by $1.3 million, or $0.01 per share on adiluted basis, and $12.7 million, or $0.05 per share on a diluted basis, respectively.
Copyright © 2013 www.secdatabase.com. All Rights Reserved.Please Consider the Environment Before Printing This Document
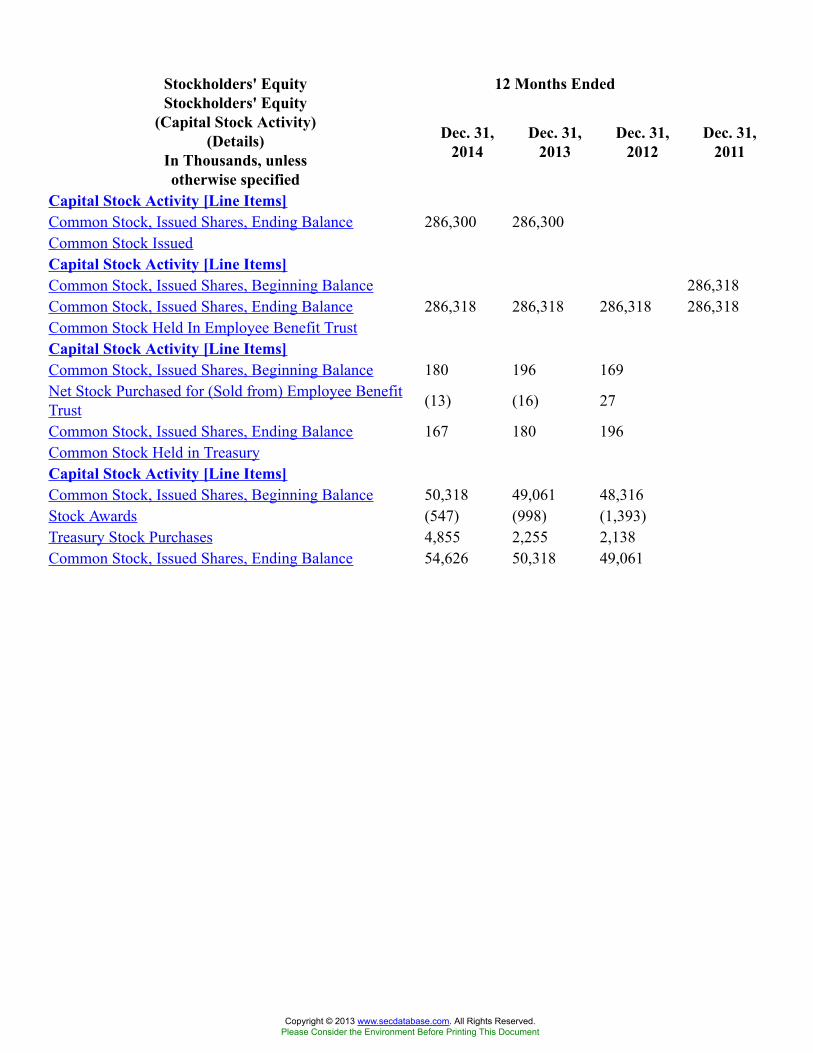
12 Months EndedStockholders' EquityStockholders' Equity
(Capital Stock Activity)(Details)
In Thousands, unlessotherwise specified
Dec. 31,2014
Dec. 31,2013
Dec. 31,2012
Dec. 31,2011
Capital Stock Activity [Line Items]Common Stock, Issued Shares, Ending Balance 286,300 286,300Common Stock IssuedCapital Stock Activity [Line Items]Common Stock, Issued Shares, Beginning Balance 286,318Common Stock, Issued Shares, Ending Balance 286,318 286,318 286,318 286,318Common Stock Held In Employee Benefit TrustCapital Stock Activity [Line Items]Common Stock, Issued Shares, Beginning Balance 180 196 169Net Stock Purchased for (Sold from) Employee BenefitTrust (13) (16) 27
Common Stock, Issued Shares, Ending Balance 167 180 196Common Stock Held in TreasuryCapital Stock Activity [Line Items]Common Stock, Issued Shares, Beginning Balance 50,318 49,061 48,316Stock Awards (547) (998) (1,393)Treasury Stock Purchases 4,855 2,255 2,138Common Stock, Issued Shares, Ending Balance 54,626 50,318 49,061
Copyright © 2013 www.secdatabase.com. All Rights Reserved.Please Consider the Environment Before Printing This Document
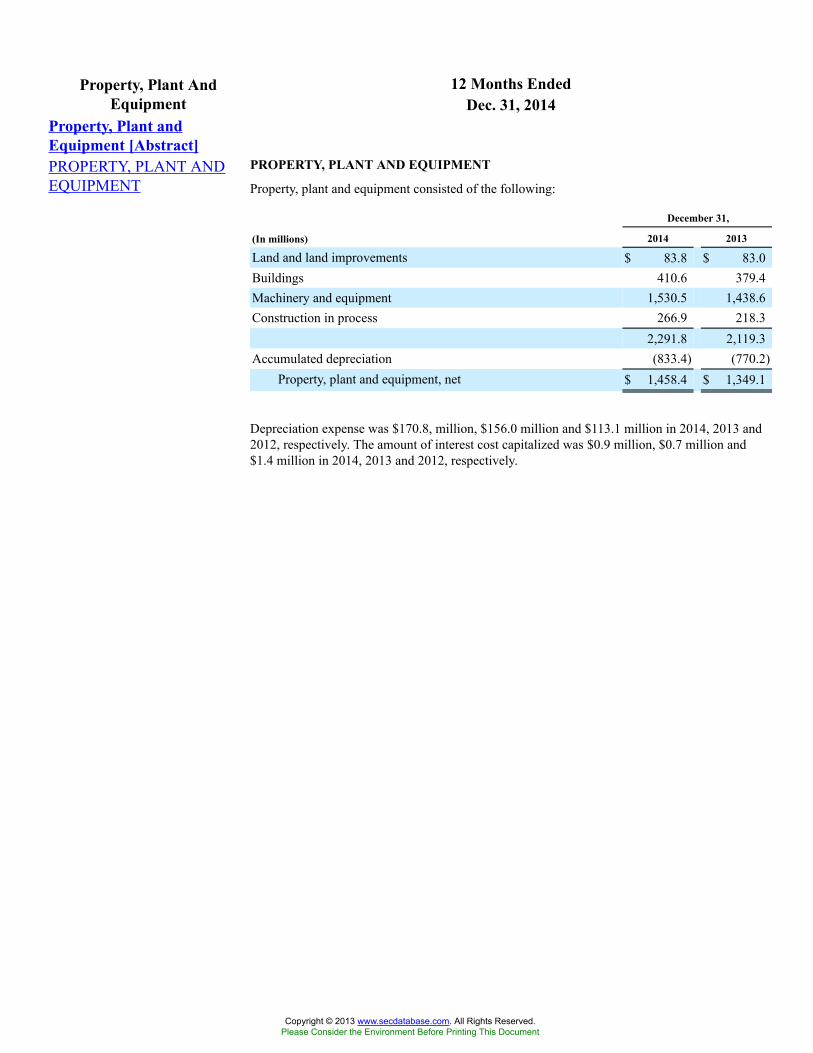
12 Months EndedProperty, Plant AndEquipment Dec. 31, 2014
Property, Plant andEquipment [Abstract]PROPERTY, PLANT ANDEQUIPMENT
PROPERTY, PLANT AND EQUIPMENT
Property, plant and equipment consisted of the following:
December 31,
(In millions) 2014 2013
Land and land improvements $ 83.8 $ 83.0Buildings 410.6 379.4Machinery and equipment 1,530.5 1,438.6Construction in process 266.9 218.3
2,291.8 2,119.3Accumulated depreciation (833.4) (770.2)
Property, plant and equipment, net $ 1,458.4 $ 1,349.1
Depreciation expense was $170.8, million, $156.0 million and $113.1 million in 2014, 2013 and2012, respectively. The amount of interest cost capitalized was $0.9 million, $0.7 million and$1.4 million in 2014, 2013 and 2012, respectively.
Copyright © 2013 www.secdatabase.com. All Rights Reserved.Please Consider the Environment Before Printing This Document
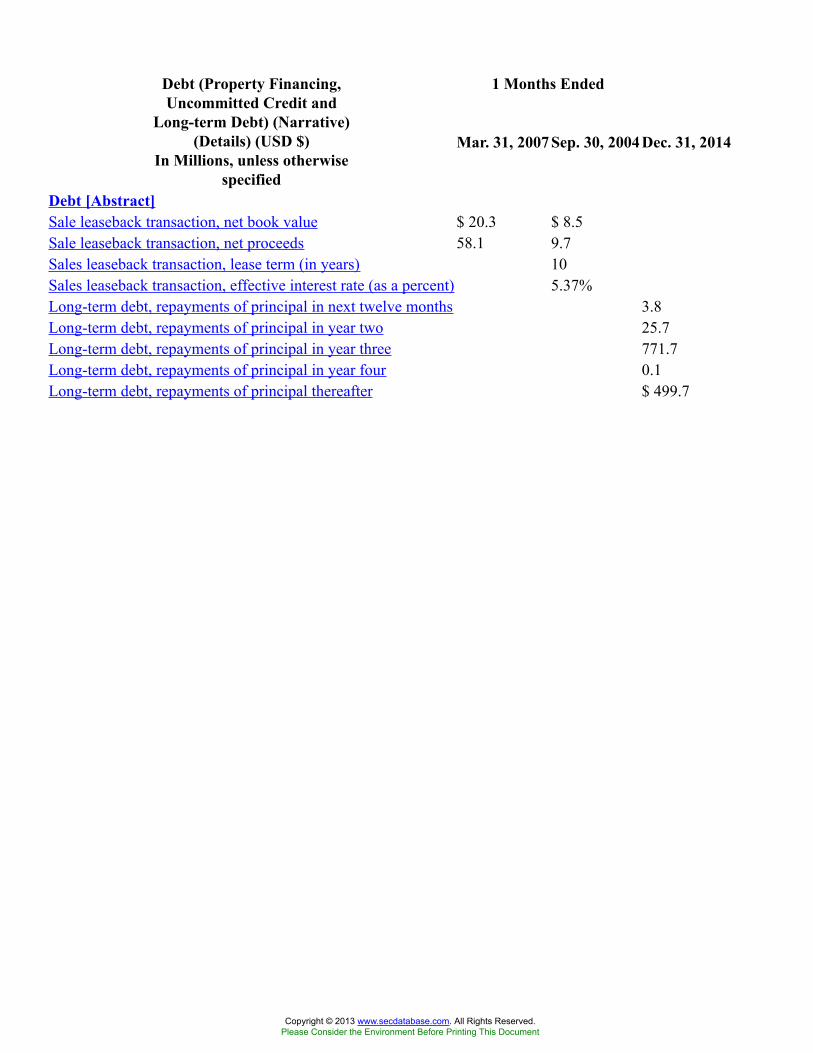
1 Months EndedDebt (Property Financing,Uncommitted Credit and
Long-term Debt) (Narrative)(Details) (USD $)
In Millions, unless otherwisespecified
Mar. 31, 2007Sep. 30, 2004 Dec. 31, 2014
Debt [Abstract]Sale leaseback transaction, net book value $ 20.3 $ 8.5Sale leaseback transaction, net proceeds 58.1 9.7Sales leaseback transaction, lease term (in years) 10Sales leaseback transaction, effective interest rate (as a percent) 5.37%Long-term debt, repayments of principal in next twelve months 3.8Long-term debt, repayments of principal in year two 25.7Long-term debt, repayments of principal in year three 771.7Long-term debt, repayments of principal in year four 0.1Long-term debt, repayments of principal thereafter $ 499.7
Copyright © 2013 www.secdatabase.com. All Rights Reserved.Please Consider the Environment Before Printing This Document

12 Months EndedSale of Material HandlingProducts Dec. 31, 2014
Disposal Group [Abstract]SALE OF MATERIALHANDLING PRODUCTS SALE OF MATERIAL HANDLING PRODUCTS
On April 30, 2014, we completed the sale of our equity interests of Technisys, Inc., a Utahcorporation, and FMC Technologies Energy Holdings Ltd., a private limited liability companyorganized under the laws of Hong Kong, and assets primarily representing a product line of ourmaterial handling business (“Material Handling Products”) to Syntron Material Handling, LLC,an affiliate of Levine Leichtman Capital Partners Private Capital Solutions II, L.P. MaterialHandling Products was historically reported in our Energy Infrastructure segment. Net of workingcapital adjustments, we recognized a pretax gain of $84.3 million on the sale during the yearended December 31, 2014.
Copyright © 2013 www.secdatabase.com. All Rights Reserved.Please Consider the Environment Before Printing This Document
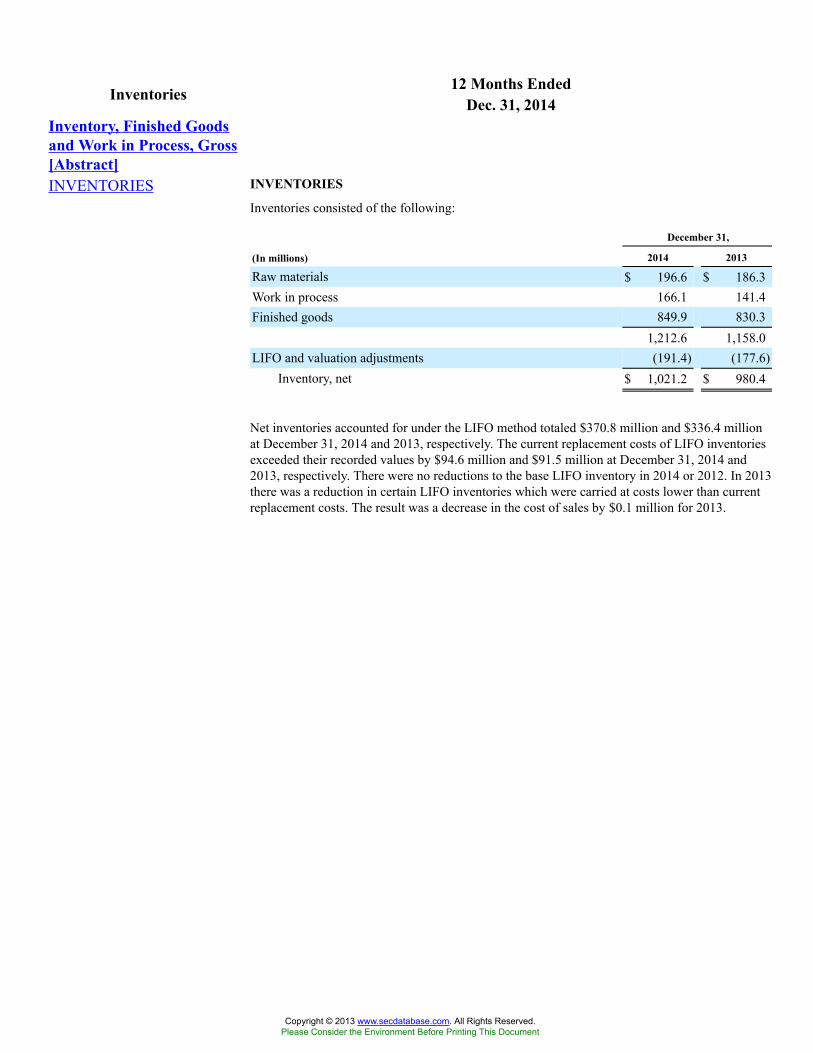
12 Months EndedInventories Dec. 31, 2014Inventory, Finished Goodsand Work in Process, Gross[Abstract]INVENTORIES INVENTORIES
Inventories consisted of the following:
December 31,
(In millions) 2014 2013
Raw materials $ 196.6 $ 186.3Work in process 166.1 141.4Finished goods 849.9 830.3
1,212.6 1,158.0LIFO and valuation adjustments (191.4) (177.6)
Inventory, net $ 1,021.2 $ 980.4
Net inventories accounted for under the LIFO method totaled $370.8 million and $336.4 millionat December 31, 2014 and 2013, respectively. The current replacement costs of LIFO inventoriesexceeded their recorded values by $94.6 million and $91.5 million at December 31, 2014 and2013, respectively. There were no reductions to the base LIFO inventory in 2014 or 2012. In 2013there was a reduction in certain LIFO inventories which were carried at costs lower than currentreplacement costs. The result was a decrease in the cost of sales by $0.1 million for 2013.
Copyright © 2013 www.secdatabase.com. All Rights Reserved.Please Consider the Environment Before Printing This Document
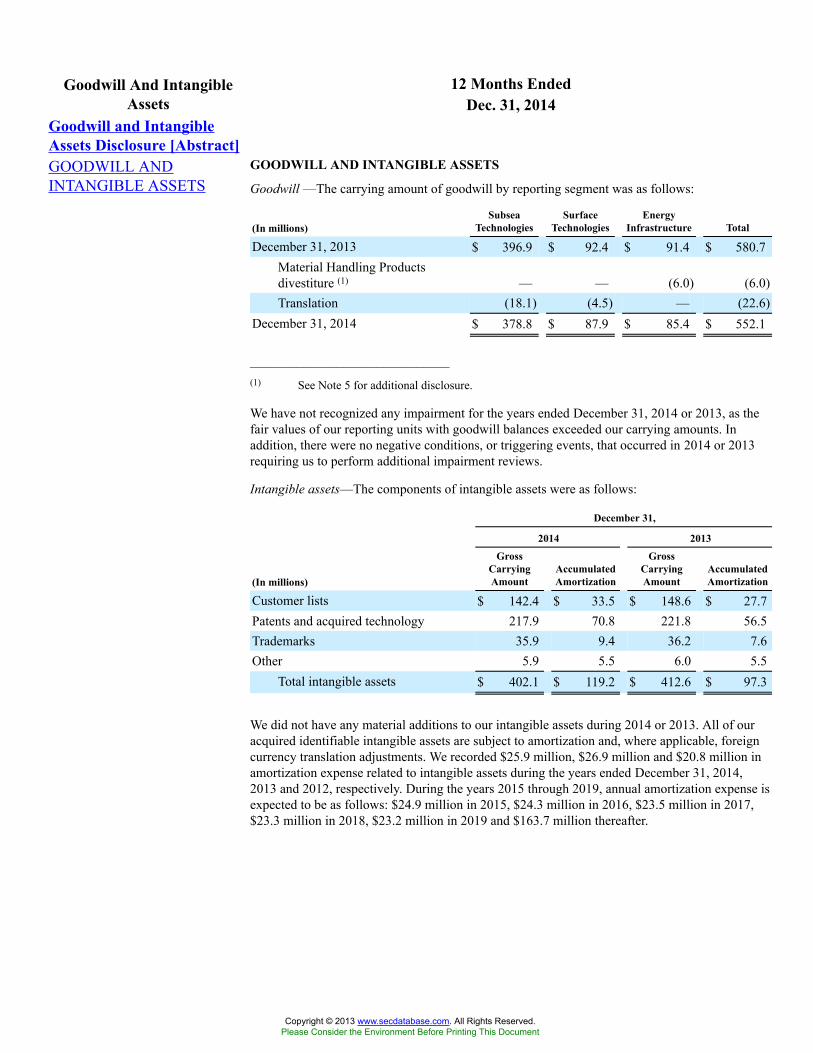
12 Months EndedGoodwill And IntangibleAssets Dec. 31, 2014
Goodwill and IntangibleAssets Disclosure [Abstract]GOODWILL ANDINTANGIBLE ASSETS
GOODWILL AND INTANGIBLE ASSETS
Goodwill —The carrying amount of goodwill by reporting segment was as follows:
(In millions)Subsea
TechnologiesSurface
TechnologiesEnergy
Infrastructure Total
December 31, 2013 $ 396.9 $ 92.4 $ 91.4 $ 580.7Material Handling Productsdivestiture (1) — — (6.0) (6.0)Translation (18.1) (4.5) — (22.6)
December 31, 2014 $ 378.8 $ 87.9 $ 85.4 $ 552.1
______________________________(1) See Note 5 for additional disclosure.
We have not recognized any impairment for the years ended December 31, 2014 or 2013, as thefair values of our reporting units with goodwill balances exceeded our carrying amounts. Inaddition, there were no negative conditions, or triggering events, that occurred in 2014 or 2013requiring us to perform additional impairment reviews.
Intangible assets—The components of intangible assets were as follows:
December 31,
2014 2013
(In millions)
GrossCarryingAmount
AccumulatedAmortization
GrossCarryingAmount
AccumulatedAmortization
Customer lists $ 142.4 $ 33.5 $ 148.6 $ 27.7Patents and acquired technology 217.9 70.8 221.8 56.5Trademarks 35.9 9.4 36.2 7.6Other 5.9 5.5 6.0 5.5
Total intangible assets $ 402.1 $ 119.2 $ 412.6 $ 97.3
We did not have any material additions to our intangible assets during 2014 or 2013. All of ouracquired identifiable intangible assets are subject to amortization and, where applicable, foreigncurrency translation adjustments. We recorded $25.9 million, $26.9 million and $20.8 million inamortization expense related to intangible assets during the years ended December 31, 2014,2013 and 2012, respectively. During the years 2015 through 2019, annual amortization expense isexpected to be as follows: $24.9 million in 2015, $24.3 million in 2016, $23.5 million in 2017,$23.3 million in 2018, $23.2 million in 2019 and $163.7 million thereafter.
Copyright © 2013 www.secdatabase.com. All Rights Reserved.Please Consider the Environment Before Printing This Document
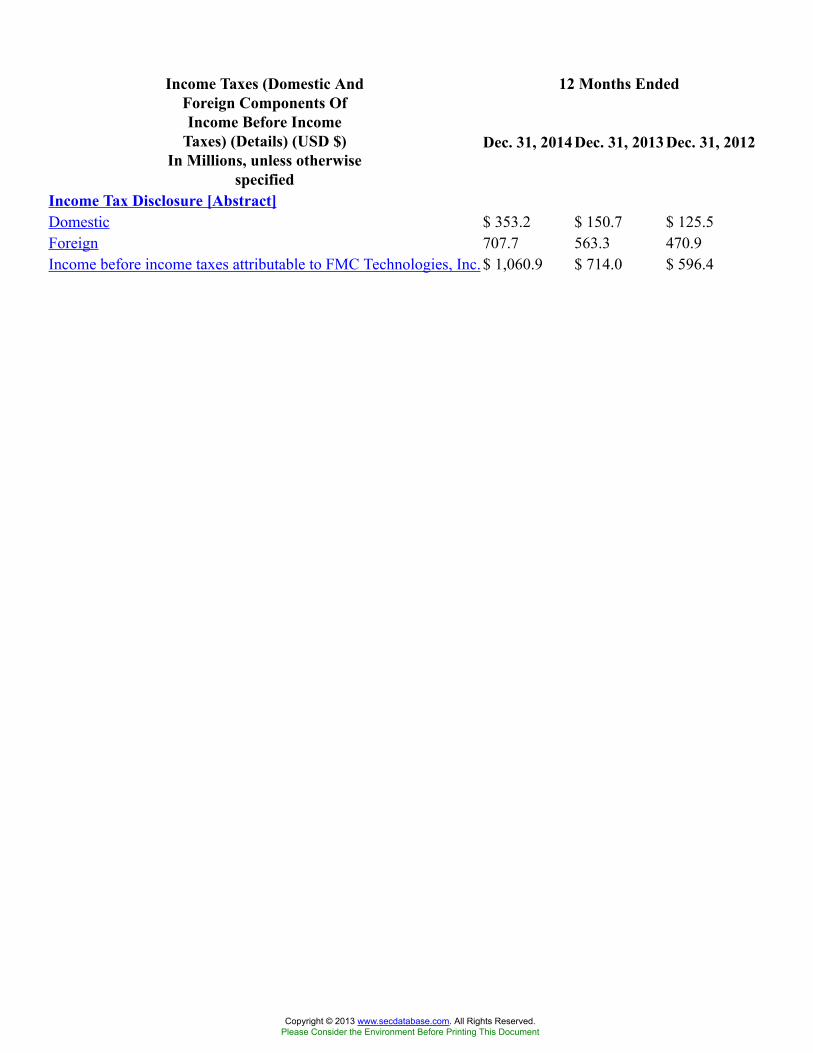
12 Months EndedIncome Taxes (Domestic AndForeign Components OfIncome Before Income
Taxes) (Details) (USD $)In Millions, unless otherwise
specified
Dec. 31, 2014 Dec. 31, 2013 Dec. 31, 2012
Income Tax Disclosure [Abstract]Domestic $ 353.2 $ 150.7 $ 125.5Foreign 707.7 563.3 470.9Income before income taxes attributable to FMC Technologies, Inc. $ 1,060.9 $ 714.0 $ 596.4
Copyright © 2013 www.secdatabase.com. All Rights Reserved.Please Consider the Environment Before Printing This Document
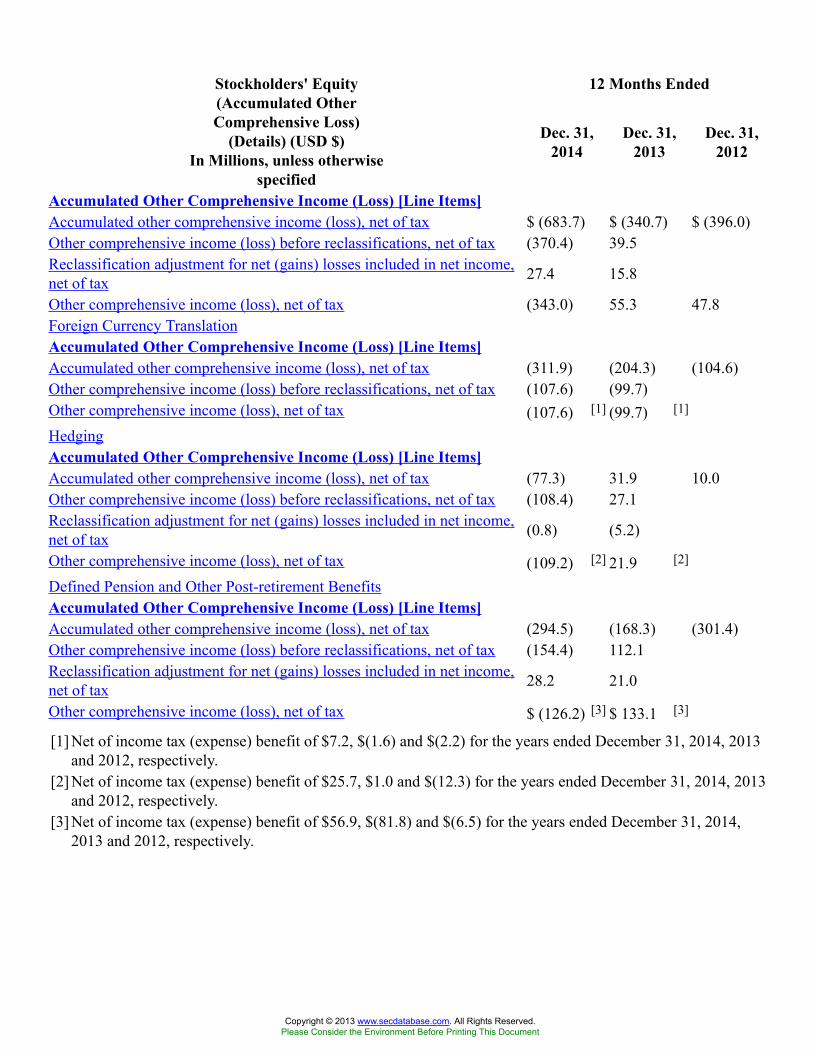
12 Months EndedStockholders' Equity(Accumulated OtherComprehensive Loss)
(Details) (USD $)In Millions, unless otherwise
specified
Dec. 31,2014
Dec. 31,2013
Dec. 31,2012
Accumulated Other Comprehensive Income (Loss) [Line Items]Accumulated other comprehensive income (loss), net of tax $ (683.7) $ (340.7) $ (396.0)Other comprehensive income (loss) before reclassifications, net of tax (370.4) 39.5Reclassification adjustment for net (gains) losses included in net income,net of tax 27.4 15.8
Other comprehensive income (loss), net of tax (343.0) 55.3 47.8Foreign Currency TranslationAccumulated Other Comprehensive Income (Loss) [Line Items]Accumulated other comprehensive income (loss), net of tax (311.9) (204.3) (104.6)Other comprehensive income (loss) before reclassifications, net of tax (107.6) (99.7)Other comprehensive income (loss), net of tax (107.6) [1] (99.7) [1]
HedgingAccumulated Other Comprehensive Income (Loss) [Line Items]Accumulated other comprehensive income (loss), net of tax (77.3) 31.9 10.0Other comprehensive income (loss) before reclassifications, net of tax (108.4) 27.1Reclassification adjustment for net (gains) losses included in net income,net of tax (0.8) (5.2)
Other comprehensive income (loss), net of tax (109.2) [2] 21.9 [2]
Defined Pension and Other Post-retirement BenefitsAccumulated Other Comprehensive Income (Loss) [Line Items]Accumulated other comprehensive income (loss), net of tax (294.5) (168.3) (301.4)Other comprehensive income (loss) before reclassifications, net of tax (154.4) 112.1Reclassification adjustment for net (gains) losses included in net income,net of tax 28.2 21.0
Other comprehensive income (loss), net of tax $ (126.2) [3] $ 133.1 [3]
[1] Net of income tax (expense) benefit of $7.2, $(1.6) and $(2.2) for the years ended December 31, 2014, 2013and 2012, respectively.
[2] Net of income tax (expense) benefit of $25.7, $1.0 and $(12.3) for the years ended December 31, 2014, 2013and 2012, respectively.
[3] Net of income tax (expense) benefit of $56.9, $(81.8) and $(6.5) for the years ended December 31, 2014,2013 and 2012, respectively.
Copyright © 2013 www.secdatabase.com. All Rights Reserved.Please Consider the Environment Before Printing This Document
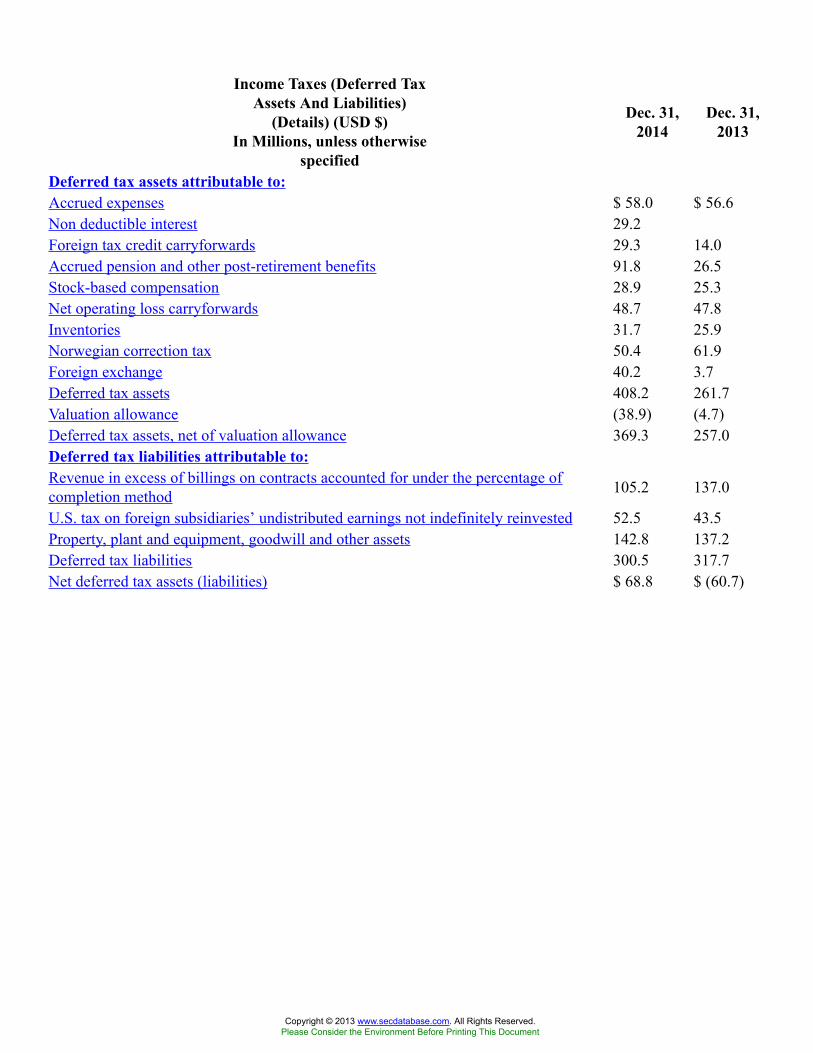
Income Taxes (Deferred TaxAssets And Liabilities)
(Details) (USD $)In Millions, unless otherwise
specified
Dec. 31,2014
Dec. 31,2013
Deferred tax assets attributable to:Accrued expenses $ 58.0 $ 56.6Non deductible interest 29.2Foreign tax credit carryforwards 29.3 14.0Accrued pension and other post-retirement benefits 91.8 26.5Stock-based compensation 28.9 25.3Net operating loss carryforwards 48.7 47.8Inventories 31.7 25.9Norwegian correction tax 50.4 61.9Foreign exchange 40.2 3.7Deferred tax assets 408.2 261.7Valuation allowance (38.9) (4.7)Deferred tax assets, net of valuation allowance 369.3 257.0Deferred tax liabilities attributable to:Revenue in excess of billings on contracts accounted for under the percentage ofcompletion method 105.2 137.0
U.S. tax on foreign subsidiaries’ undistributed earnings not indefinitely reinvested 52.5 43.5Property, plant and equipment, goodwill and other assets 142.8 137.2Deferred tax liabilities 300.5 317.7Net deferred tax assets (liabilities) $ 68.8 $ (60.7)
Copyright © 2013 www.secdatabase.com. All Rights Reserved.Please Consider the Environment Before Printing This Document
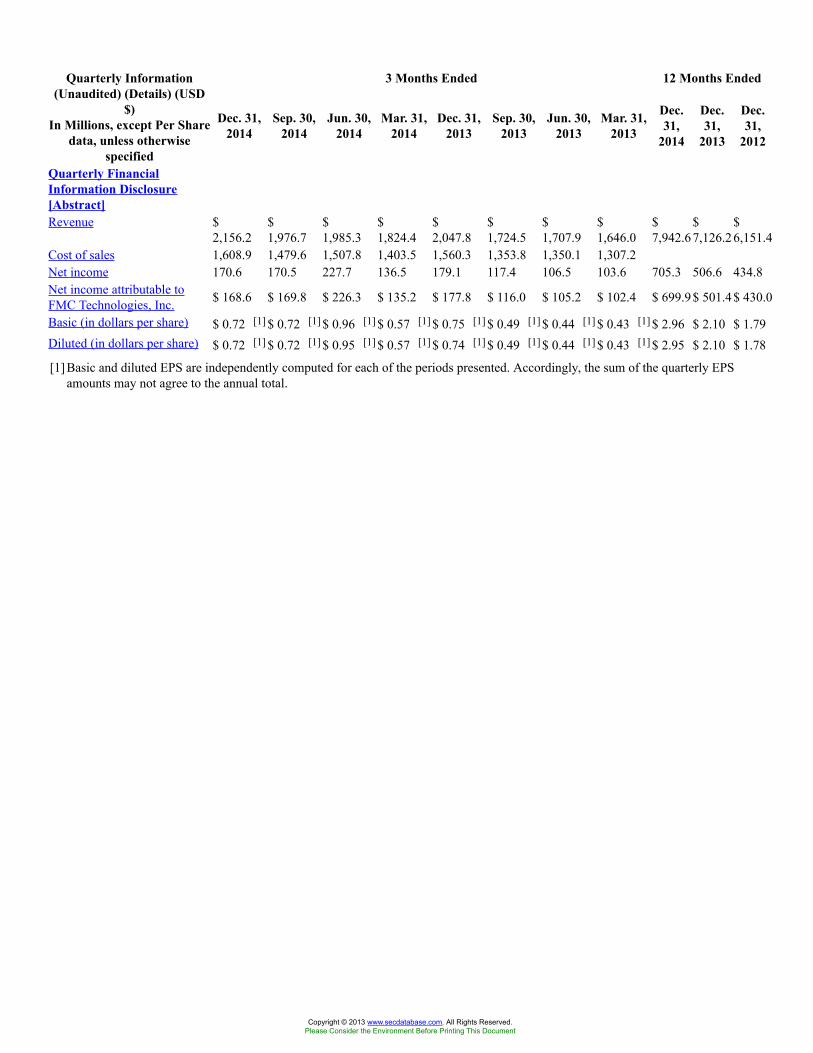
3 Months Ended 12 Months EndedQuarterly Information(Unaudited) (Details) (USD
$)In Millions, except Per Share
data, unless otherwisespecified
Dec. 31,2014
Sep. 30,2014
Jun. 30,2014
Mar. 31,2014
Dec. 31,2013
Sep. 30,2013
Jun. 30,2013
Mar. 31,2013
Dec.31,
2014
Dec.31,
2013
Dec.31,
2012
Quarterly FinancialInformation Disclosure[Abstract]Revenue $
2,156.2$1,976.7
$1,985.3
$1,824.4
$2,047.8
$1,724.5
$1,707.9
$1,646.0
$7,942.6
$7,126.2
$6,151.4
Cost of sales 1,608.9 1,479.6 1,507.8 1,403.5 1,560.3 1,353.8 1,350.1 1,307.2Net income 170.6 170.5 227.7 136.5 179.1 117.4 106.5 103.6 705.3 506.6 434.8Net income attributable toFMC Technologies, Inc. $ 168.6 $ 169.8 $ 226.3 $ 135.2 $ 177.8 $ 116.0 $ 105.2 $ 102.4 $ 699.9$ 501.4$ 430.0
Basic (in dollars per share) $ 0.72 [1] $ 0.72 [1] $ 0.96 [1] $ 0.57 [1] $ 0.75 [1] $ 0.49 [1] $ 0.44 [1] $ 0.43 [1] $ 2.96 $ 2.10 $ 1.79Diluted (in dollars per share) $ 0.72 [1] $ 0.72 [1] $ 0.95 [1] $ 0.57 [1] $ 0.74 [1] $ 0.49 [1] $ 0.44 [1] $ 0.43 [1] $ 2.95 $ 2.10 $ 1.78
[1] Basic and diluted EPS are independently computed for each of the periods presented. Accordingly, the sum of the quarterly EPSamounts may not agree to the annual total.
Copyright © 2013 www.secdatabase.com. All Rights Reserved.Please Consider the Environment Before Printing This Document
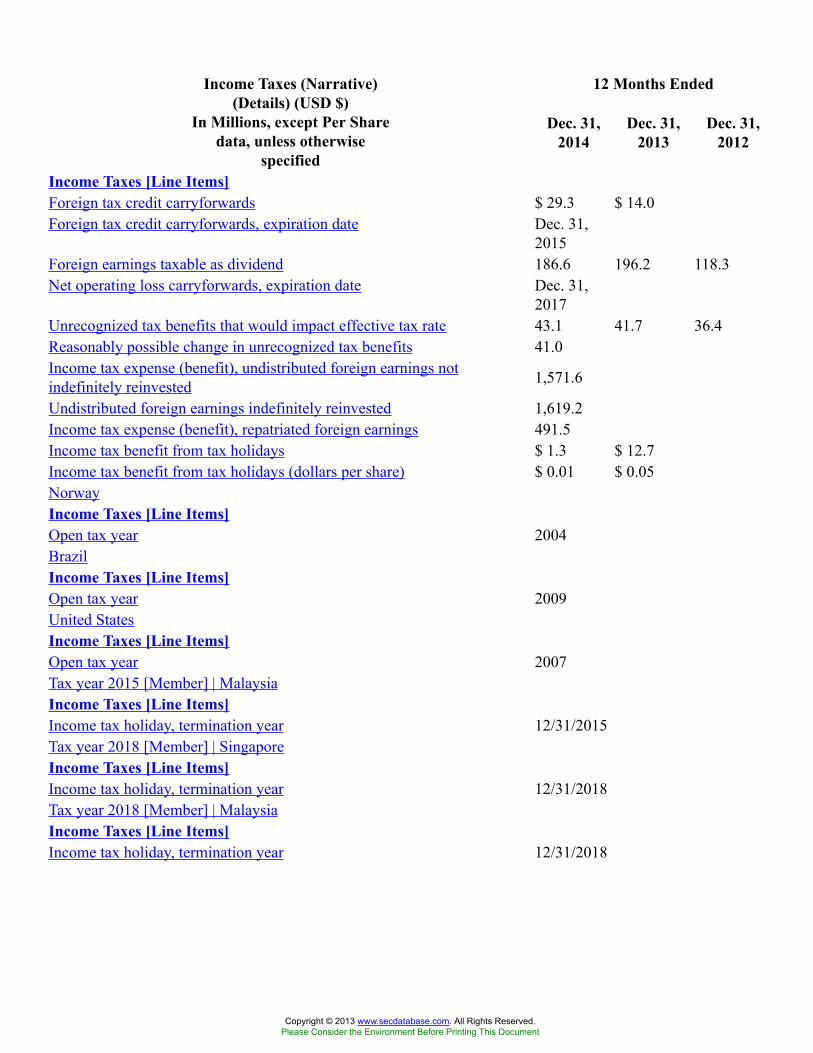
12 Months EndedIncome Taxes (Narrative)(Details) (USD $)
In Millions, except Per Sharedata, unless otherwise
specified
Dec. 31,2014
Dec. 31,2013
Dec. 31,2012
Income Taxes [Line Items]Foreign tax credit carryforwards $ 29.3 $ 14.0Foreign tax credit carryforwards, expiration date Dec. 31,
2015Foreign earnings taxable as dividend 186.6 196.2 118.3Net operating loss carryforwards, expiration date Dec. 31,
2017Unrecognized tax benefits that would impact effective tax rate 43.1 41.7 36.4Reasonably possible change in unrecognized tax benefits 41.0Income tax expense (benefit), undistributed foreign earnings notindefinitely reinvested 1,571.6
Undistributed foreign earnings indefinitely reinvested 1,619.2Income tax expense (benefit), repatriated foreign earnings 491.5Income tax benefit from tax holidays $ 1.3 $ 12.7Income tax benefit from tax holidays (dollars per share) $ 0.01 $ 0.05NorwayIncome Taxes [Line Items]Open tax year 2004BrazilIncome Taxes [Line Items]Open tax year 2009United StatesIncome Taxes [Line Items]Open tax year 2007Tax year 2015 [Member] | MalaysiaIncome Taxes [Line Items]Income tax holiday, termination year 12/31/2015Tax year 2018 [Member] | SingaporeIncome Taxes [Line Items]Income tax holiday, termination year 12/31/2018Tax year 2018 [Member] | MalaysiaIncome Taxes [Line Items]Income tax holiday, termination year 12/31/2018
Copyright © 2013 www.secdatabase.com. All Rights Reserved.Please Consider the Environment Before Printing This Document
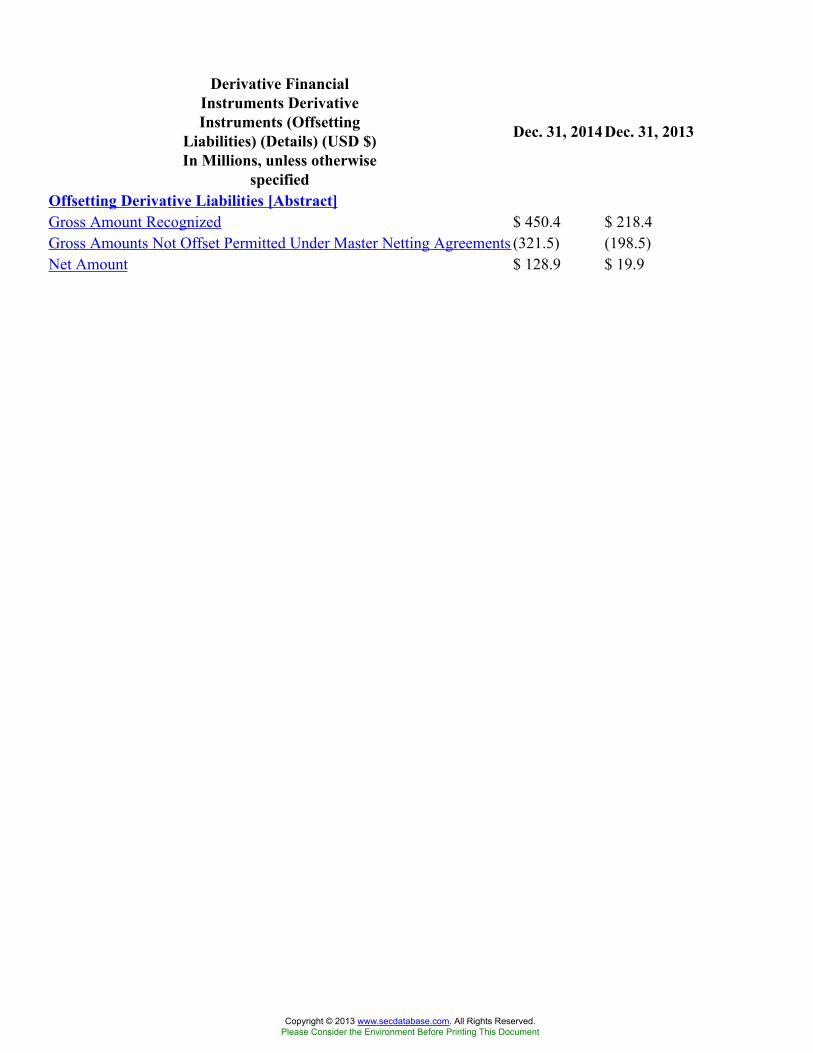
Derivative FinancialInstruments DerivativeInstruments (Offsetting
Liabilities) (Details) (USD $)In Millions, unless otherwise
specified
Dec. 31, 2014 Dec. 31, 2013
Offsetting Derivative Liabilities [Abstract]Gross Amount Recognized $ 450.4 $ 218.4Gross Amounts Not Offset Permitted Under Master Netting Agreements (321.5) (198.5)Net Amount $ 128.9 $ 19.9
Copyright © 2013 www.secdatabase.com. All Rights Reserved.Please Consider the Environment Before Printing This Document
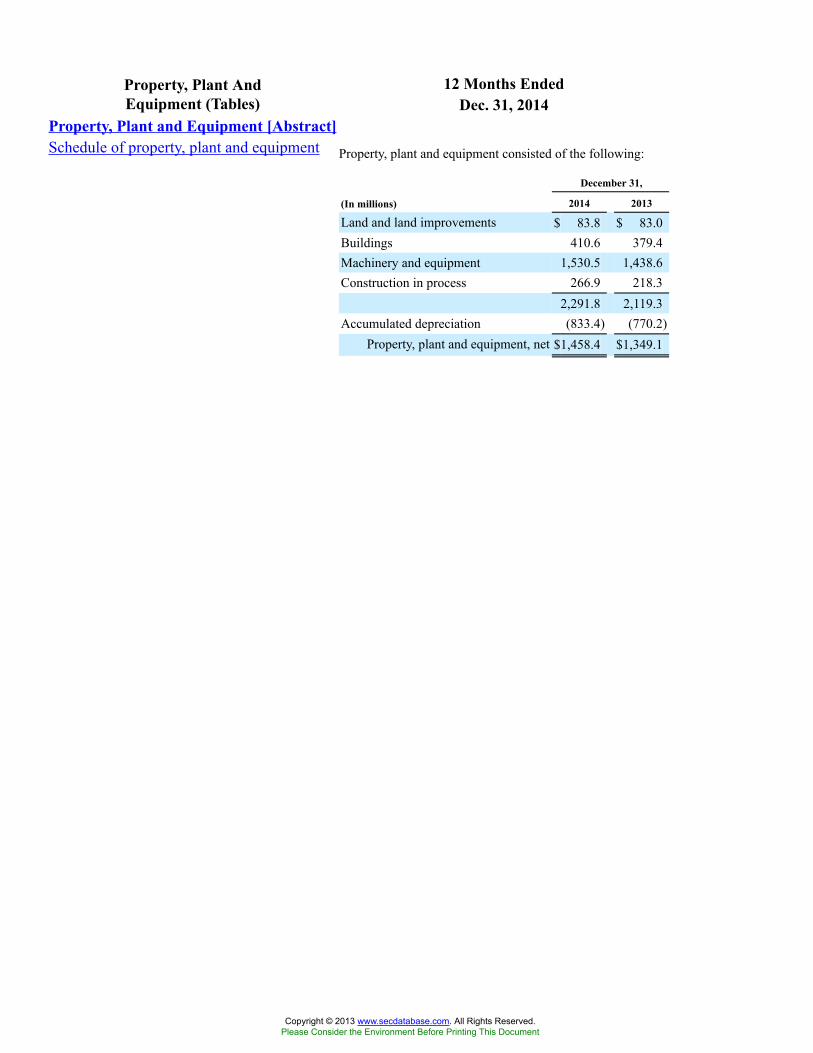
12 Months EndedProperty, Plant AndEquipment (Tables) Dec. 31, 2014
Property, Plant and Equipment [Abstract]Schedule of property, plant and equipment Property, plant and equipment consisted of the following:
December 31,
(In millions) 2014 2013
Land and land improvements $ 83.8 $ 83.0Buildings 410.6 379.4Machinery and equipment 1,530.5 1,438.6Construction in process 266.9 218.3
2,291.8 2,119.3Accumulated depreciation (833.4) (770.2)
Property, plant and equipment, net $1,458.4 $1,349.1
Copyright © 2013 www.secdatabase.com. All Rights Reserved.Please Consider the Environment Before Printing This Document
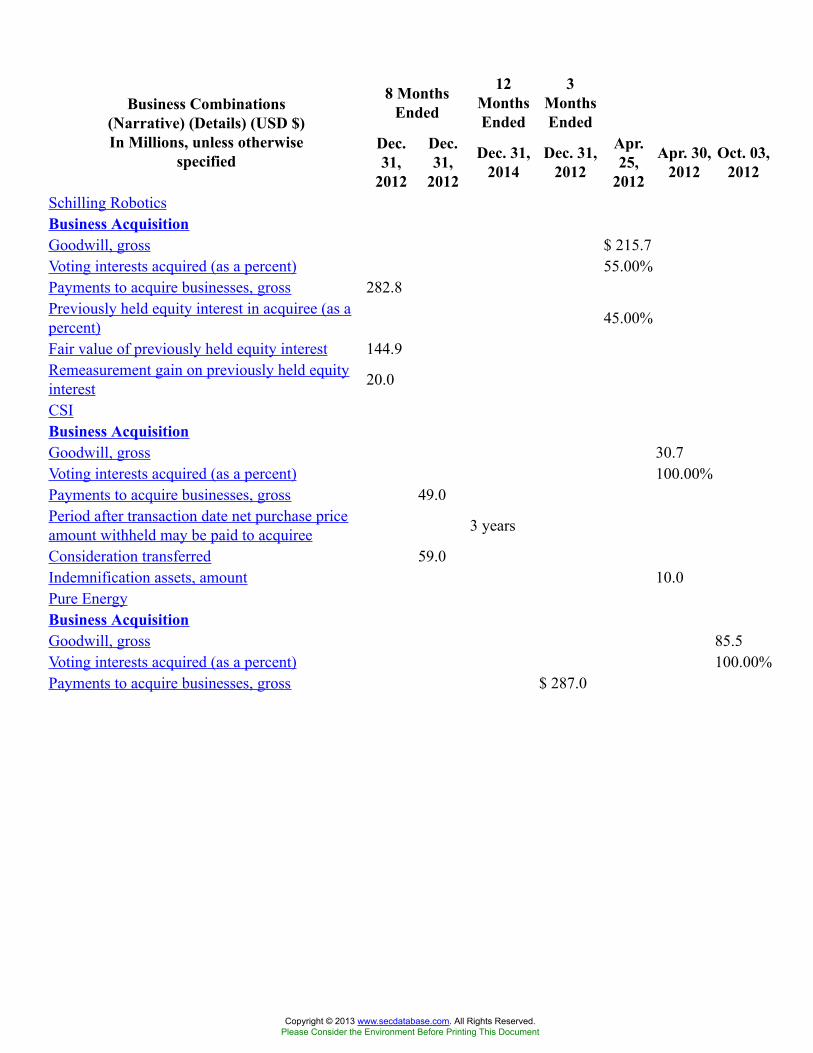
8 MonthsEnded
12MonthsEnded
3MonthsEnded
Business Combinations(Narrative) (Details) (USD $)In Millions, unless otherwise
specifiedDec.31,
2012
Dec.31,
2012
Dec. 31,2014
Dec. 31,2012
Apr.25,
2012
Apr. 30,2012
Oct. 03,2012
Schilling RoboticsBusiness AcquisitionGoodwill, gross $ 215.7Voting interests acquired (as a percent) 55.00%Payments to acquire businesses, gross 282.8Previously held equity interest in acquiree (as apercent) 45.00%
Fair value of previously held equity interest 144.9Remeasurement gain on previously held equityinterest 20.0
CSIBusiness AcquisitionGoodwill, gross 30.7Voting interests acquired (as a percent) 100.00%Payments to acquire businesses, gross 49.0Period after transaction date net purchase priceamount withheld may be paid to acquiree 3 years
Consideration transferred 59.0Indemnification assets, amount 10.0Pure EnergyBusiness AcquisitionGoodwill, gross 85.5Voting interests acquired (as a percent) 100.00%Payments to acquire businesses, gross $ 287.0
Copyright © 2013 www.secdatabase.com. All Rights Reserved.Please Consider the Environment Before Printing This Document
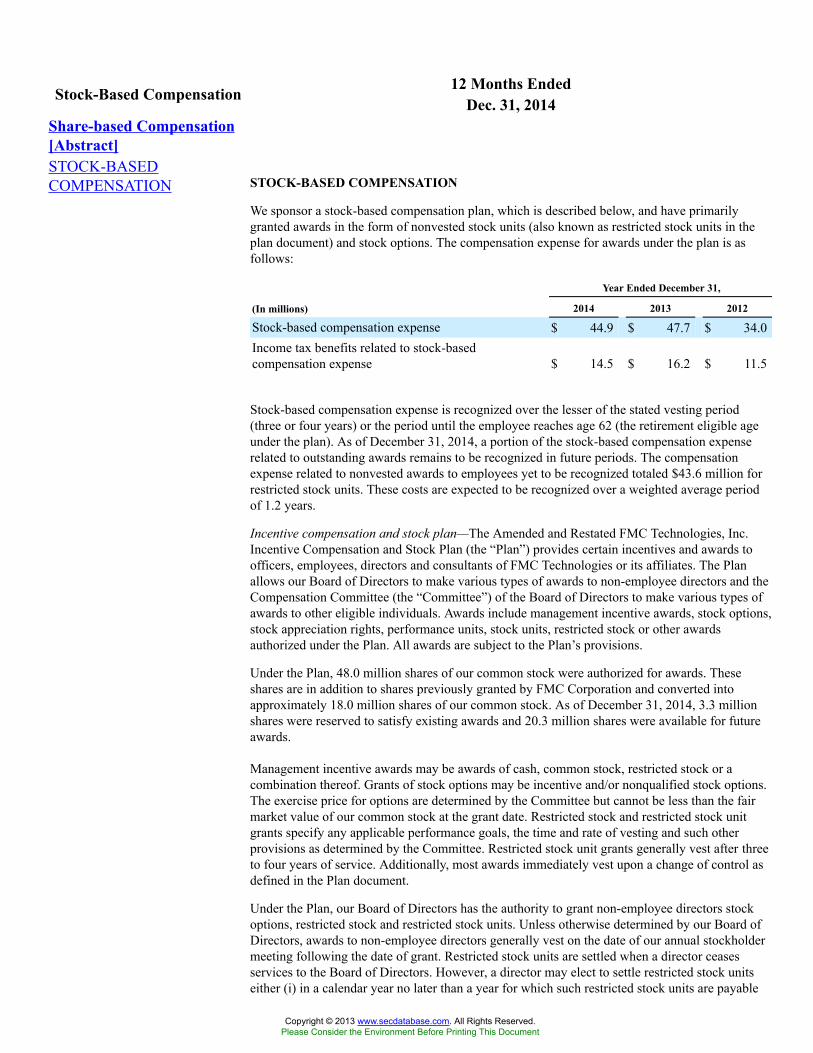
12 Months EndedStock-Based Compensation Dec. 31, 2014Share-based Compensation[Abstract]STOCK-BASEDCOMPENSATION STOCK-BASED COMPENSATION
We sponsor a stock-based compensation plan, which is described below, and have primarilygranted awards in the form of nonvested stock units (also known as restricted stock units in theplan document) and stock options. The compensation expense for awards under the plan is asfollows:
Year Ended December 31,
(In millions) 2014 2013 2012
Stock-based compensation expense $ 44.9 $ 47.7 $ 34.0Income tax benefits related to stock-basedcompensation expense $ 14.5 $ 16.2 $ 11.5
Stock-based compensation expense is recognized over the lesser of the stated vesting period(three or four years) or the period until the employee reaches age 62 (the retirement eligible ageunder the plan). As of December 31, 2014, a portion of the stock-based compensation expenserelated to outstanding awards remains to be recognized in future periods. The compensationexpense related to nonvested awards to employees yet to be recognized totaled $43.6 million forrestricted stock units. These costs are expected to be recognized over a weighted average periodof 1.2 years.
Incentive compensation and stock plan—The Amended and Restated FMC Technologies, Inc.Incentive Compensation and Stock Plan (the “Plan”) provides certain incentives and awards toofficers, employees, directors and consultants of FMC Technologies or its affiliates. The Planallows our Board of Directors to make various types of awards to non-employee directors and theCompensation Committee (the “Committee”) of the Board of Directors to make various types ofawards to other eligible individuals. Awards include management incentive awards, stock options,stock appreciation rights, performance units, stock units, restricted stock or other awardsauthorized under the Plan. All awards are subject to the Plan’s provisions.
Under the Plan, 48.0 million shares of our common stock were authorized for awards. Theseshares are in addition to shares previously granted by FMC Corporation and converted intoapproximately 18.0 million shares of our common stock. As of December 31, 2014, 3.3 millionshares were reserved to satisfy existing awards and 20.3 million shares were available for futureawards.
Management incentive awards may be awards of cash, common stock, restricted stock or acombination thereof. Grants of stock options may be incentive and/or nonqualified stock options.The exercise price for options are determined by the Committee but cannot be less than the fairmarket value of our common stock at the grant date. Restricted stock and restricted stock unitgrants specify any applicable performance goals, the time and rate of vesting and such otherprovisions as determined by the Committee. Restricted stock unit grants generally vest after threeto four years of service. Additionally, most awards immediately vest upon a change of control asdefined in the Plan document.
Under the Plan, our Board of Directors has the authority to grant non-employee directors stockoptions, restricted stock and restricted stock units. Unless otherwise determined by our Board ofDirectors, awards to non-employee directors generally vest on the date of our annual stockholdermeeting following the date of grant. Restricted stock units are settled when a director ceasesservices to the Board of Directors. However, a director may elect to settle restricted stock unitseither (i) in a calendar year no later than a year for which such restricted stock units are payable
Copyright © 2013 www.secdatabase.com. All Rights Reserved.Please Consider the Environment Before Printing This Document
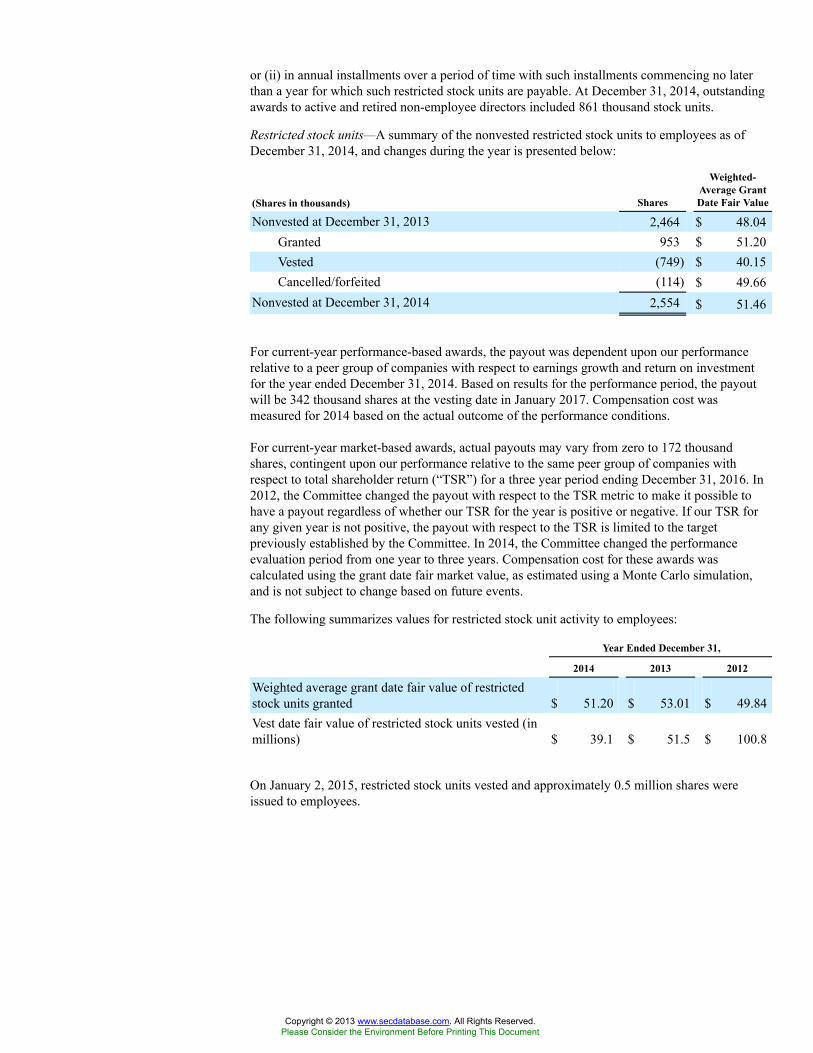
or (ii) in annual installments over a period of time with such installments commencing no laterthan a year for which such restricted stock units are payable. At December 31, 2014, outstandingawards to active and retired non-employee directors included 861 thousand stock units.
Restricted stock units—A summary of the nonvested restricted stock units to employees as ofDecember 31, 2014, and changes during the year is presented below:
(Shares in thousands) Shares
Weighted-Average GrantDate Fair Value
Nonvested at December 31, 2013 2,464 $ 48.04Granted 953 $ 51.20Vested (749) $ 40.15Cancelled/forfeited (114) $ 49.66
Nonvested at December 31, 2014 2,554 $ 51.46
For current-year performance-based awards, the payout was dependent upon our performancerelative to a peer group of companies with respect to earnings growth and return on investmentfor the year ended December 31, 2014. Based on results for the performance period, the payoutwill be 342 thousand shares at the vesting date in January 2017. Compensation cost wasmeasured for 2014 based on the actual outcome of the performance conditions.
For current-year market-based awards, actual payouts may vary from zero to 172 thousandshares, contingent upon our performance relative to the same peer group of companies withrespect to total shareholder return (“TSR”) for a three year period ending December 31, 2016. In2012, the Committee changed the payout with respect to the TSR metric to make it possible tohave a payout regardless of whether our TSR for the year is positive or negative. If our TSR forany given year is not positive, the payout with respect to the TSR is limited to the targetpreviously established by the Committee. In 2014, the Committee changed the performanceevaluation period from one year to three years. Compensation cost for these awards wascalculated using the grant date fair market value, as estimated using a Monte Carlo simulation,and is not subject to change based on future events.
The following summarizes values for restricted stock unit activity to employees:
Year Ended December 31,
2014 2013 2012
Weighted average grant date fair value of restrictedstock units granted $ 51.20 $ 53.01 $ 49.84Vest date fair value of restricted stock units vested (inmillions) $ 39.1 $ 51.5 $ 100.8
On January 2, 2015, restricted stock units vested and approximately 0.5 million shares wereissued to employees.
Copyright © 2013 www.secdatabase.com. All Rights Reserved.Please Consider the Environment Before Printing This Document
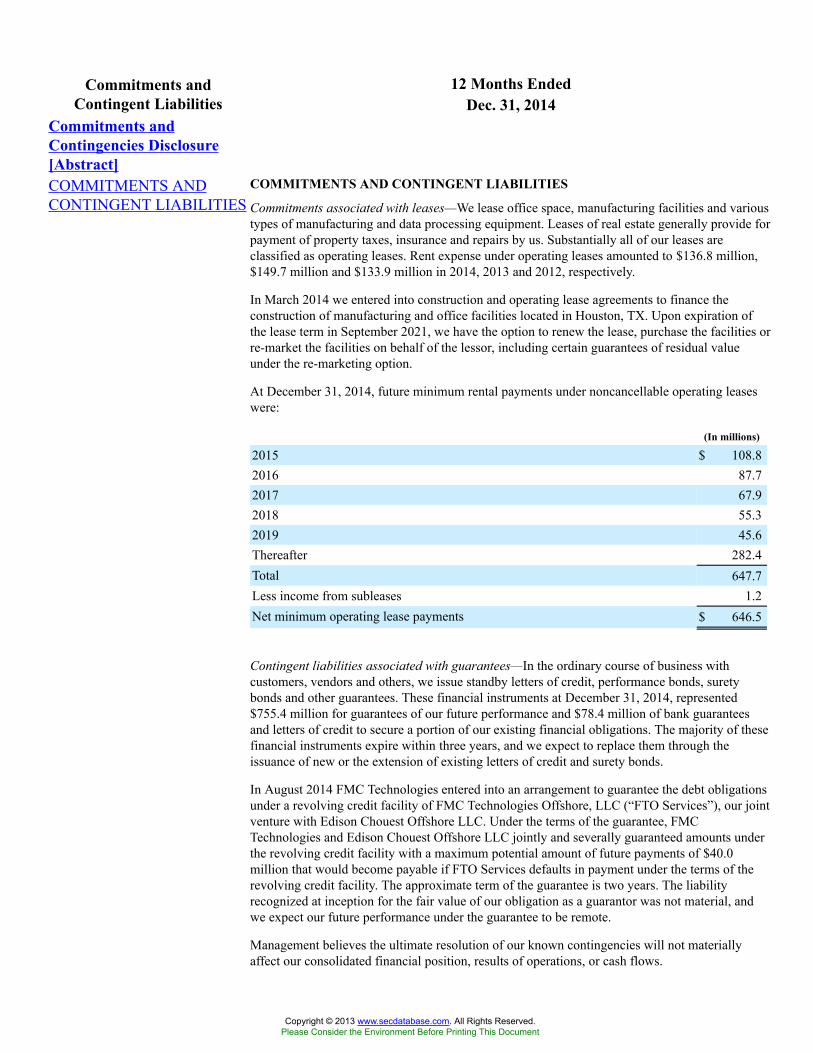
12 Months EndedCommitments andContingent Liabilities Dec. 31, 2014
Commitments andContingencies Disclosure[Abstract]COMMITMENTS ANDCONTINGENT LIABILITIES
COMMITMENTS AND CONTINGENT LIABILITIES
Commitments associated with leases—We lease office space, manufacturing facilities and varioustypes of manufacturing and data processing equipment. Leases of real estate generally provide forpayment of property taxes, insurance and repairs by us. Substantially all of our leases areclassified as operating leases. Rent expense under operating leases amounted to $136.8 million,$149.7 million and $133.9 million in 2014, 2013 and 2012, respectively.
In March 2014 we entered into construction and operating lease agreements to finance theconstruction of manufacturing and office facilities located in Houston, TX. Upon expiration ofthe lease term in September 2021, we have the option to renew the lease, purchase the facilities orre-market the facilities on behalf of the lessor, including certain guarantees of residual valueunder the re-marketing option.
At December 31, 2014, future minimum rental payments under noncancellable operating leaseswere:
(In millions)
2015 $ 108.82016 87.72017 67.92018 55.32019 45.6Thereafter 282.4Total 647.7Less income from subleases 1.2Net minimum operating lease payments $ 646.5
Contingent liabilities associated with guarantees—In the ordinary course of business withcustomers, vendors and others, we issue standby letters of credit, performance bonds, suretybonds and other guarantees. These financial instruments at December 31, 2014, represented$755.4 million for guarantees of our future performance and $78.4 million of bank guaranteesand letters of credit to secure a portion of our existing financial obligations. The majority of thesefinancial instruments expire within three years, and we expect to replace them through theissuance of new or the extension of existing letters of credit and surety bonds.
In August 2014 FMC Technologies entered into an arrangement to guarantee the debt obligationsunder a revolving credit facility of FMC Technologies Offshore, LLC (“FTO Services”), our jointventure with Edison Chouest Offshore LLC. Under the terms of the guarantee, FMCTechnologies and Edison Chouest Offshore LLC jointly and severally guaranteed amounts underthe revolving credit facility with a maximum potential amount of future payments of $40.0million that would become payable if FTO Services defaults in payment under the terms of therevolving credit facility. The approximate term of the guarantee is two years. The liabilityrecognized at inception for the fair value of our obligation as a guarantor was not material, andwe expect our future performance under the guarantee to be remote.
Management believes the ultimate resolution of our known contingencies will not materiallyaffect our consolidated financial position, results of operations, or cash flows.
Copyright © 2013 www.secdatabase.com. All Rights Reserved.Please Consider the Environment Before Printing This Document
Contingent liabilities associated with legal matters—We are involved in various pending orpotential legal actions in the ordinary course of our business. Management is unable to predict theultimate outcome of these actions, because of the inherent uncertainty of litigation. However,management believes that the most probable, ultimate resolution of these matters will not have amaterial adverse effect on our consolidated financial position, results of operations or cash flows.
Contingent liabilities associated with liquidated damages—Some of our contracts contain penaltyprovisions that require us to pay liquidated damages if we are responsible for the failure to meetspecified contractual milestone dates and the applicable customer asserts a conforming claimunder these provisions. These contracts define the conditions under which our customers maymake claims against us for liquidated damages. Based upon the evaluation of our performanceand other commercial and legal analysis, management believes we have appropriately accrued forprobable liquidated damages at December 31, 2014 and 2013, and that the ultimate resolution ofsuch matters will not materially affect our consolidated financial position, results of operations, orcash flows.
Copyright © 2013 www.secdatabase.com. All Rights Reserved.Please Consider the Environment Before Printing This Document
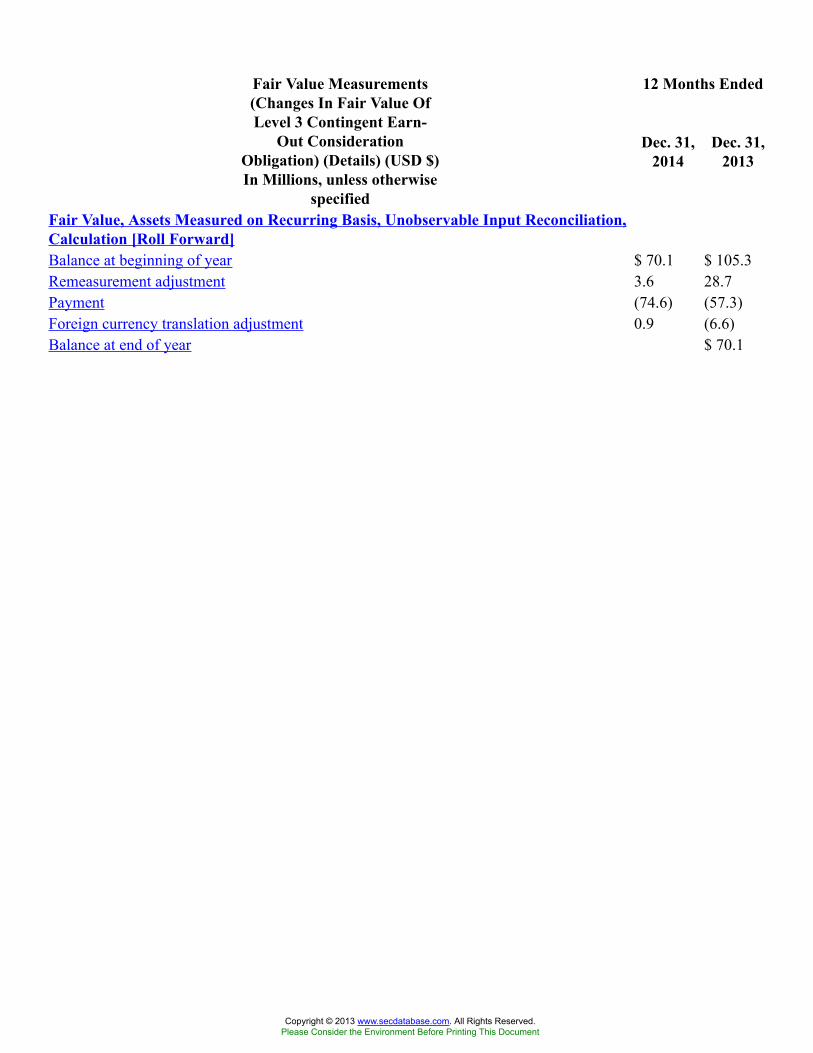
12 Months EndedFair Value Measurements(Changes In Fair Value OfLevel 3 Contingent Earn-
Out ConsiderationObligation) (Details) (USD $)In Millions, unless otherwise
specified
Dec. 31,2014
Dec. 31,2013
Fair Value, Assets Measured on Recurring Basis, Unobservable Input Reconciliation,Calculation [Roll Forward]Balance at beginning of year $ 70.1 $ 105.3Remeasurement adjustment 3.6 28.7Payment (74.6) (57.3)Foreign currency translation adjustment 0.9 (6.6)Balance at end of year $ 70.1
Copyright © 2013 www.secdatabase.com. All Rights Reserved.Please Consider the Environment Before Printing This Document
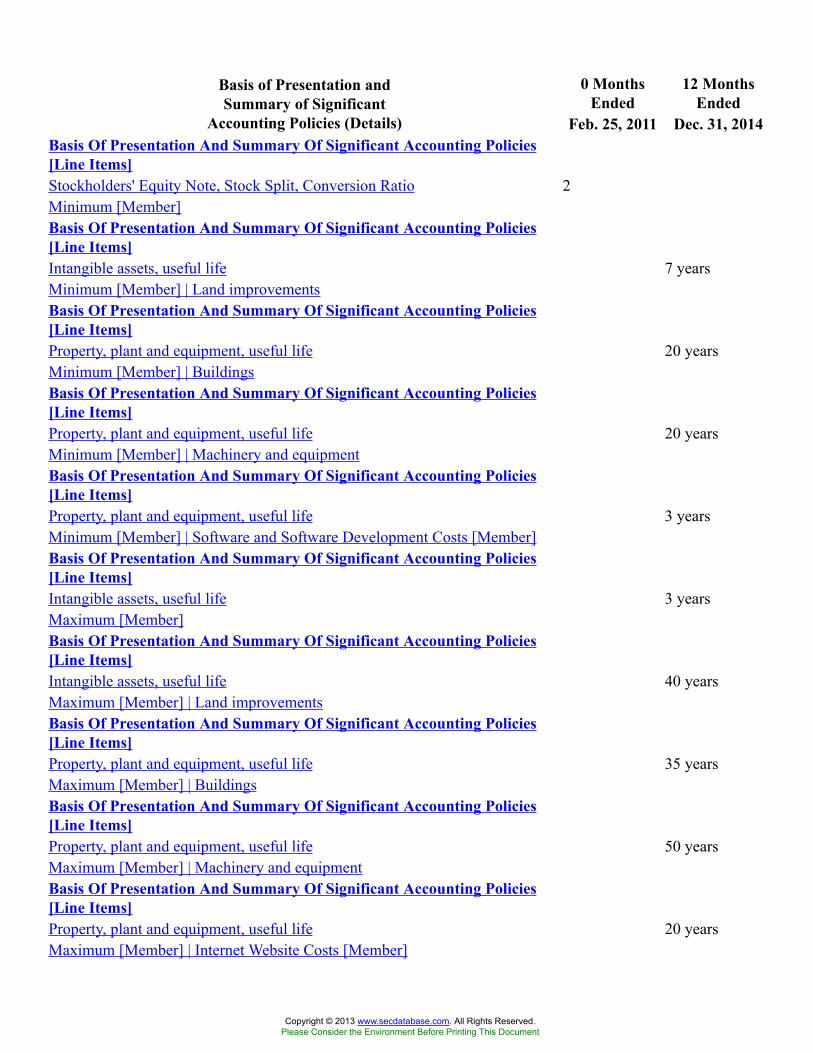
0 MonthsEnded
12 MonthsEnded
Basis of Presentation andSummary of Significant
Accounting Policies (Details) Feb. 25, 2011 Dec. 31, 2014Basis Of Presentation And Summary Of Significant Accounting Policies[Line Items]Stockholders' Equity Note, Stock Split, Conversion Ratio 2Minimum [Member]Basis Of Presentation And Summary Of Significant Accounting Policies[Line Items]Intangible assets, useful life 7 yearsMinimum [Member] | Land improvementsBasis Of Presentation And Summary Of Significant Accounting Policies[Line Items]Property, plant and equipment, useful life 20 yearsMinimum [Member] | BuildingsBasis Of Presentation And Summary Of Significant Accounting Policies[Line Items]Property, plant and equipment, useful life 20 yearsMinimum [Member] | Machinery and equipmentBasis Of Presentation And Summary Of Significant Accounting Policies[Line Items]Property, plant and equipment, useful life 3 yearsMinimum [Member] | Software and Software Development Costs [Member]Basis Of Presentation And Summary Of Significant Accounting Policies[Line Items]Intangible assets, useful life 3 yearsMaximum [Member]Basis Of Presentation And Summary Of Significant Accounting Policies[Line Items]Intangible assets, useful life 40 yearsMaximum [Member] | Land improvementsBasis Of Presentation And Summary Of Significant Accounting Policies[Line Items]Property, plant and equipment, useful life 35 yearsMaximum [Member] | BuildingsBasis Of Presentation And Summary Of Significant Accounting Policies[Line Items]Property, plant and equipment, useful life 50 yearsMaximum [Member] | Machinery and equipmentBasis Of Presentation And Summary Of Significant Accounting Policies[Line Items]Property, plant and equipment, useful life 20 yearsMaximum [Member] | Internet Website Costs [Member]
Copyright © 2013 www.secdatabase.com. All Rights Reserved.Please Consider the Environment Before Printing This Document

Basis Of Presentation And Summary Of Significant Accounting Policies[Line Items]Intangible assets, useful life 3 yearsMaximum [Member] | Software and Software Development Costs [Member]Basis Of Presentation And Summary Of Significant Accounting Policies[Line Items]Intangible assets, useful life 10 years
Copyright © 2013 www.secdatabase.com. All Rights Reserved.Please Consider the Environment Before Printing This Document
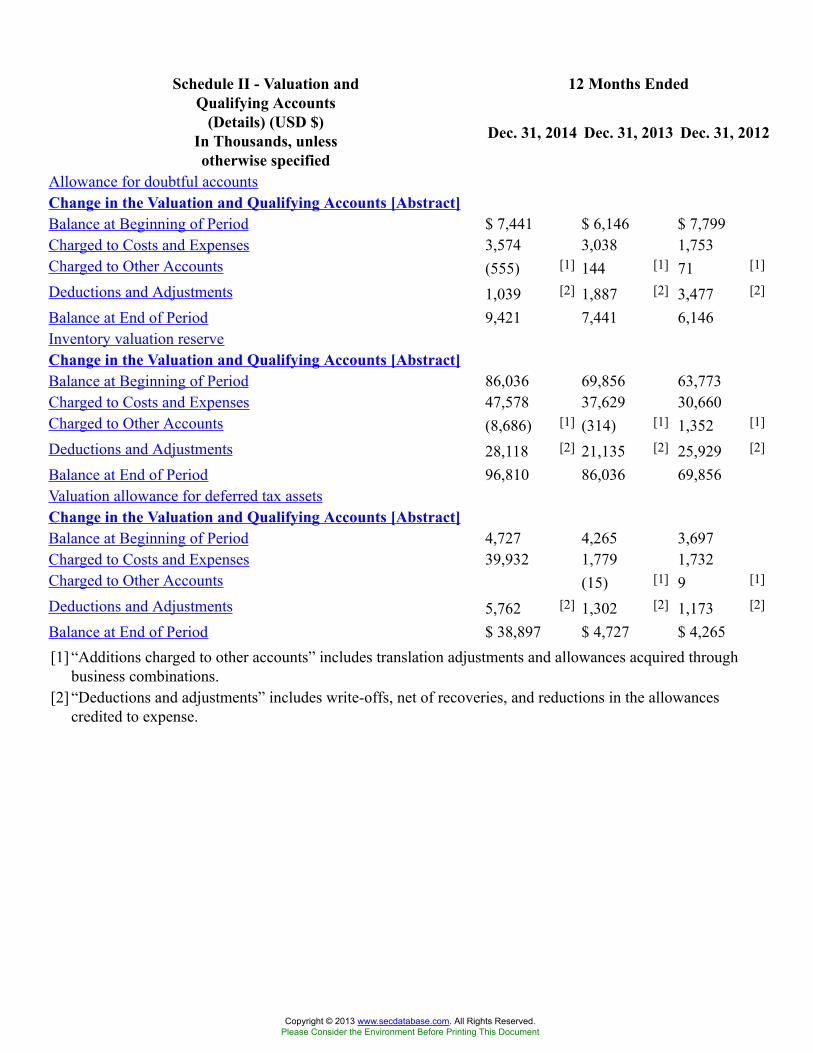
12 Months EndedSchedule II - Valuation andQualifying Accounts
(Details) (USD $)In Thousands, unlessotherwise specified
Dec. 31, 2014 Dec. 31, 2013 Dec. 31, 2012
Allowance for doubtful accountsChange in the Valuation and Qualifying Accounts [Abstract]Balance at Beginning of Period $ 7,441 $ 6,146 $ 7,799Charged to Costs and Expenses 3,574 3,038 1,753Charged to Other Accounts (555) [1] 144 [1] 71 [1]
Deductions and Adjustments 1,039 [2] 1,887 [2] 3,477 [2]
Balance at End of Period 9,421 7,441 6,146Inventory valuation reserveChange in the Valuation and Qualifying Accounts [Abstract]Balance at Beginning of Period 86,036 69,856 63,773Charged to Costs and Expenses 47,578 37,629 30,660Charged to Other Accounts (8,686) [1] (314) [1] 1,352 [1]
Deductions and Adjustments 28,118 [2] 21,135 [2] 25,929 [2]
Balance at End of Period 96,810 86,036 69,856Valuation allowance for deferred tax assetsChange in the Valuation and Qualifying Accounts [Abstract]Balance at Beginning of Period 4,727 4,265 3,697Charged to Costs and Expenses 39,932 1,779 1,732Charged to Other Accounts (15) [1] 9 [1]
Deductions and Adjustments 5,762 [2] 1,302 [2] 1,173 [2]
Balance at End of Period $ 38,897 $ 4,727 $ 4,265[1] “Additions charged to other accounts” includes translation adjustments and allowances acquired through
business combinations.[2] “Deductions and adjustments” includes write-offs, net of recoveries, and reductions in the allowances
credited to expense.
Copyright © 2013 www.secdatabase.com. All Rights Reserved.Please Consider the Environment Before Printing This Document
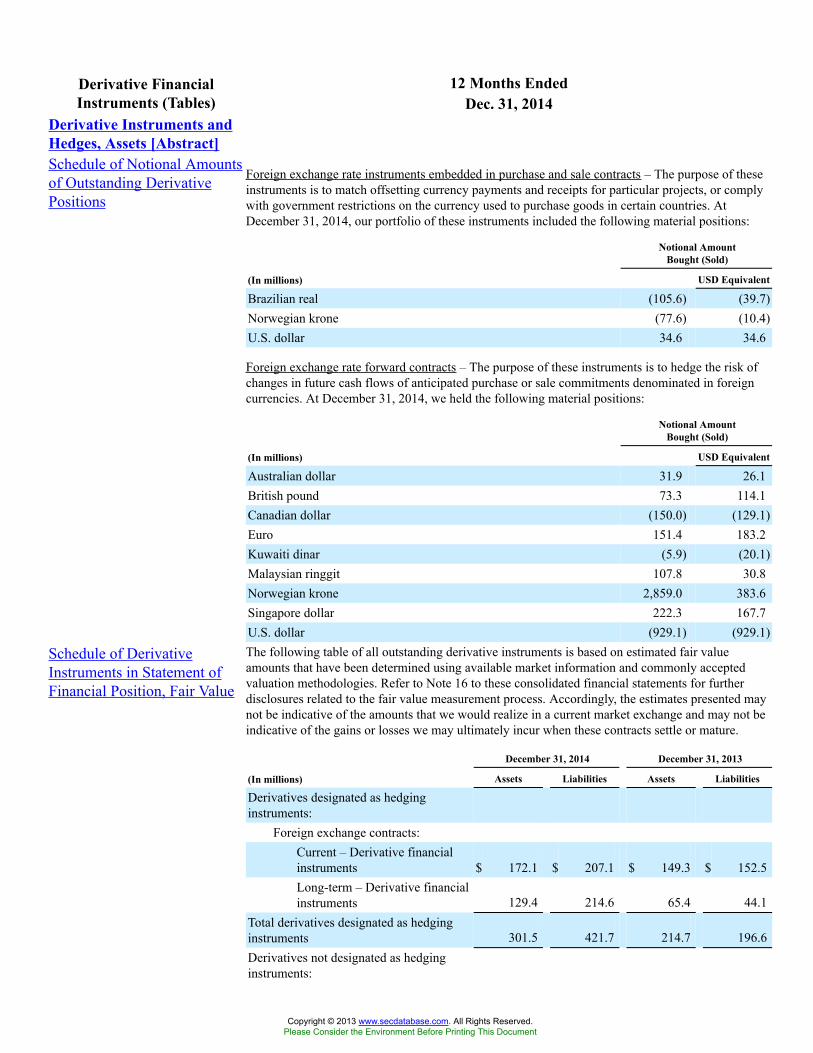
12 Months EndedDerivative FinancialInstruments (Tables) Dec. 31, 2014
Derivative Instruments andHedges, Assets [Abstract]Schedule of Notional Amountsof Outstanding DerivativePositions
Foreign exchange rate instruments embedded in purchase and sale contracts – The purpose of theseinstruments is to match offsetting currency payments and receipts for particular projects, or complywith government restrictions on the currency used to purchase goods in certain countries. AtDecember 31, 2014, our portfolio of these instruments included the following material positions:
Notional AmountBought (Sold)
(In millions) USD Equivalent
Brazilian real (105.6) (39.7)Norwegian krone (77.6) (10.4)U.S. dollar 34.6 34.6
Foreign exchange rate forward contracts – The purpose of these instruments is to hedge the risk ofchanges in future cash flows of anticipated purchase or sale commitments denominated in foreigncurrencies. At December 31, 2014, we held the following material positions:
Notional AmountBought (Sold)
(In millions) USD Equivalent
Australian dollar 31.9 26.1British pound 73.3 114.1Canadian dollar (150.0) (129.1)Euro 151.4 183.2Kuwaiti dinar (5.9) (20.1)Malaysian ringgit 107.8 30.8Norwegian krone 2,859.0 383.6Singapore dollar 222.3 167.7U.S. dollar (929.1) (929.1)
Schedule of DerivativeInstruments in Statement ofFinancial Position, Fair Value
The following table of all outstanding derivative instruments is based on estimated fair valueamounts that have been determined using available market information and commonly acceptedvaluation methodologies. Refer to Note 16 to these consolidated financial statements for furtherdisclosures related to the fair value measurement process. Accordingly, the estimates presented maynot be indicative of the amounts that we would realize in a current market exchange and may not beindicative of the gains or losses we may ultimately incur when these contracts settle or mature.
December 31, 2014 December 31, 2013
(In millions) Assets Liabilities Assets Liabilities
Derivatives designated as hedginginstruments:
Foreign exchange contracts:Current – Derivative financialinstruments $ 172.1 $ 207.1 $ 149.3 $ 152.5Long-term – Derivative financialinstruments 129.4 214.6 65.4 44.1
Total derivatives designated as hedginginstruments 301.5 421.7 214.7 196.6Derivatives not designated as hedginginstruments:
Copyright © 2013 www.secdatabase.com. All Rights Reserved.Please Consider the Environment Before Printing This Document
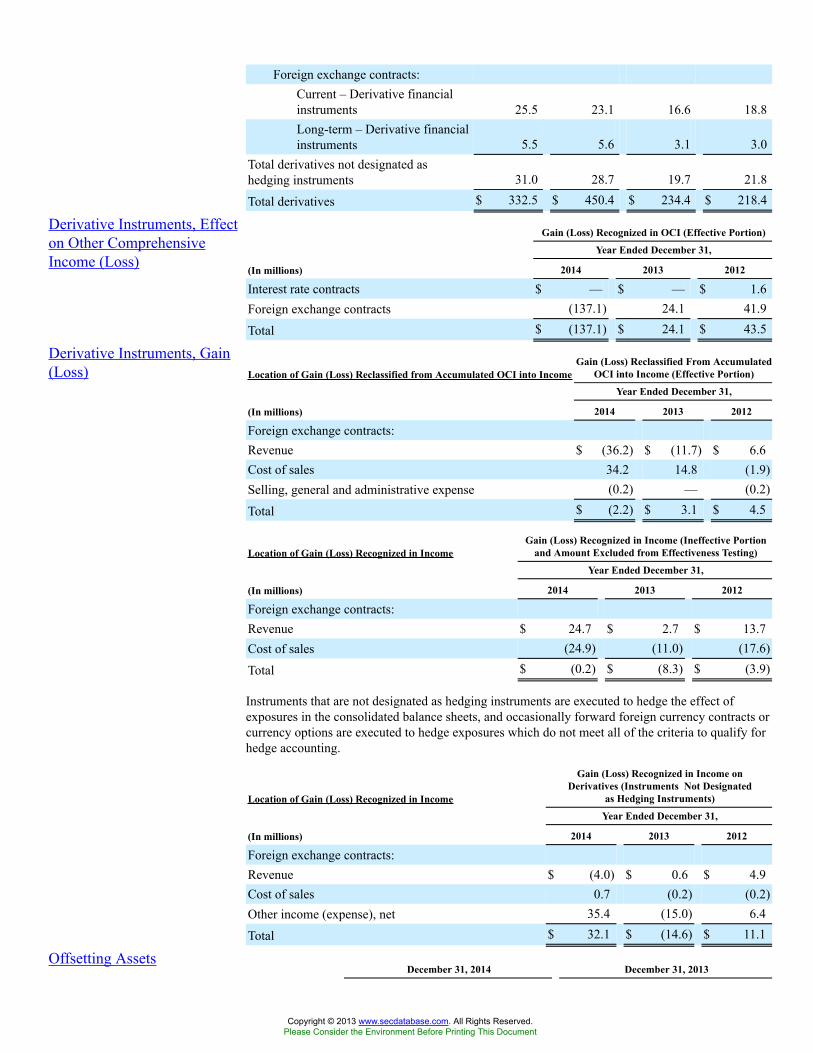
Foreign exchange contracts:Current – Derivative financialinstruments 25.5 23.1 16.6 18.8Long-term – Derivative financialinstruments 5.5 5.6 3.1 3.0
Total derivatives not designated ashedging instruments 31.0 28.7 19.7 21.8
Total derivatives $ 332.5 $ 450.4 $ 234.4 $ 218.4
Derivative Instruments, Effecton Other ComprehensiveIncome (Loss)
Gain (Loss) Recognized in OCI (Effective Portion)
Year Ended December 31,
(In millions) 2014 2013 2012
Interest rate contracts $ — $ — $ 1.6Foreign exchange contracts (137.1) 24.1 41.9
Total $ (137.1) $ 24.1 $ 43.5
Derivative Instruments, Gain(Loss) Location of Gain (Loss) Reclassified from Accumulated OCI into Income
Gain (Loss) Reclassified From AccumulatedOCI into Income (Effective Portion)
Year Ended December 31,
(In millions) 2014 2013 2012
Foreign exchange contracts:Revenue $ (36.2) $ (11.7) $ 6.6Cost of sales 34.2 14.8 (1.9)Selling, general and administrative expense (0.2) — (0.2)
Total $ (2.2) $ 3.1 $ 4.5
Location of Gain (Loss) Recognized in IncomeGain (Loss) Recognized in Income (Ineffective Portion
and Amount Excluded from Effectiveness Testing)
Year Ended December 31,
(In millions) 2014 2013 2012
Foreign exchange contracts:Revenue $ 24.7 $ 2.7 $ 13.7Cost of sales (24.9) (11.0) (17.6)
Total $ (0.2) $ (8.3) $ (3.9)
Instruments that are not designated as hedging instruments are executed to hedge the effect ofexposures in the consolidated balance sheets, and occasionally forward foreign currency contracts orcurrency options are executed to hedge exposures which do not meet all of the criteria to qualify forhedge accounting.
Location of Gain (Loss) Recognized in Income
Gain (Loss) Recognized in Income onDerivatives (Instruments Not Designated
as Hedging Instruments)
Year Ended December 31,
(In millions) 2014 2013 2012
Foreign exchange contracts:Revenue $ (4.0) $ 0.6 $ 4.9Cost of sales 0.7 (0.2) (0.2)Other income (expense), net 35.4 (15.0) 6.4
Total $ 32.1 $ (14.6) $ 11.1
Offsetting AssetsDecember 31, 2014 December 31, 2013
Copyright © 2013 www.secdatabase.com. All Rights Reserved.Please Consider the Environment Before Printing This Document
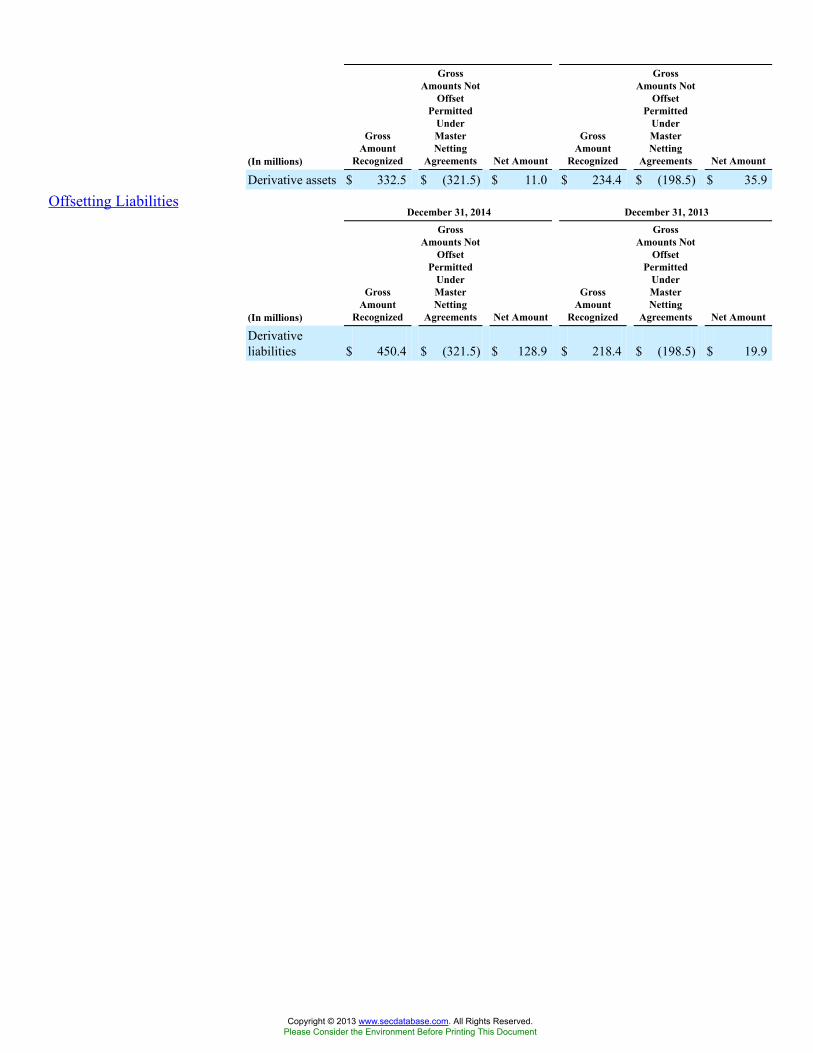
(In millions)
GrossAmount
Recognized
GrossAmounts Not
OffsetPermitted
UnderMasterNetting
Agreements Net Amount
GrossAmount
Recognized
GrossAmounts Not
OffsetPermitted
UnderMasterNetting
Agreements Net Amount
Derivative assets $ 332.5 $ (321.5) $ 11.0 $ 234.4 $ (198.5) $ 35.9
Offsetting LiabilitiesDecember 31, 2014 December 31, 2013
(In millions)
GrossAmount
Recognized
GrossAmounts Not
OffsetPermitted
UnderMasterNetting
Agreements Net Amount
GrossAmount
Recognized
GrossAmounts Not
OffsetPermitted
UnderMasterNetting
Agreements Net Amount
Derivativeliabilities $ 450.4 $ (321.5) $ 128.9 $ 218.4 $ (198.5) $ 19.9
Copyright © 2013 www.secdatabase.com. All Rights Reserved.Please Consider the Environment Before Printing This Document
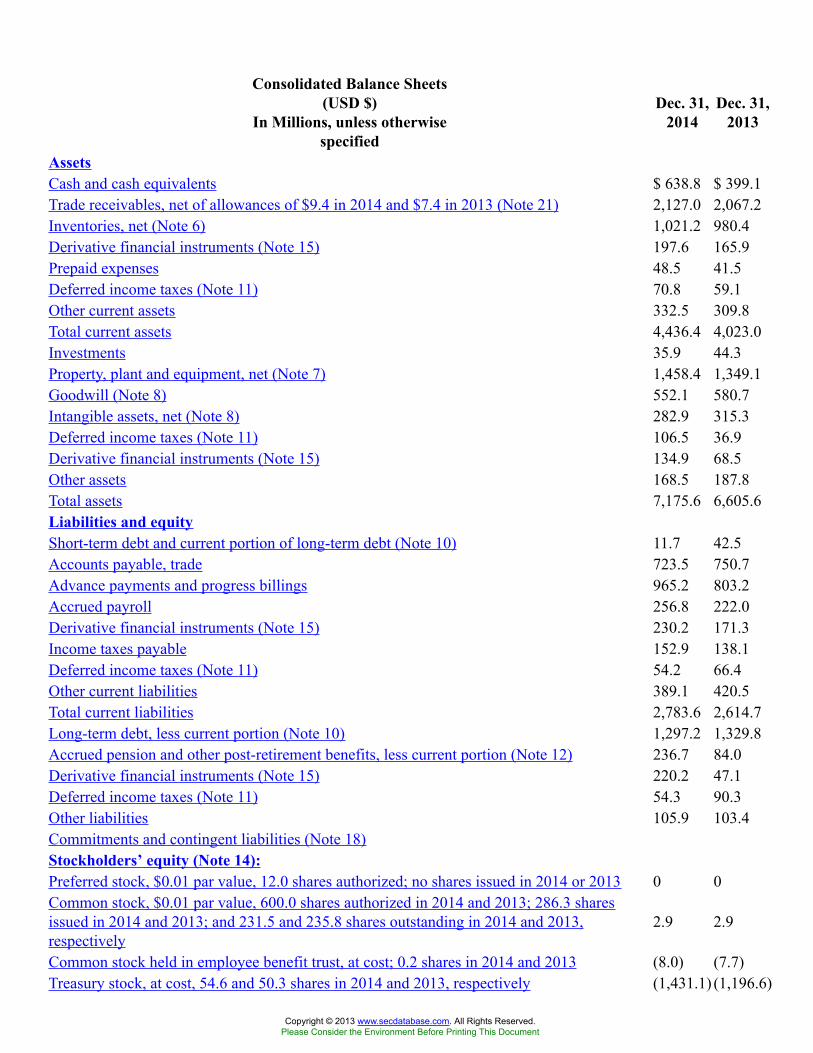
Consolidated Balance Sheets(USD $)
In Millions, unless otherwisespecified
Dec. 31,2014
Dec. 31,2013
AssetsCash and cash equivalents $ 638.8 $ 399.1Trade receivables, net of allowances of $9.4 in 2014 and $7.4 in 2013 (Note 21) 2,127.0 2,067.2Inventories, net (Note 6) 1,021.2 980.4Derivative financial instruments (Note 15) 197.6 165.9Prepaid expenses 48.5 41.5Deferred income taxes (Note 11) 70.8 59.1Other current assets 332.5 309.8Total current assets 4,436.4 4,023.0Investments 35.9 44.3Property, plant and equipment, net (Note 7) 1,458.4 1,349.1Goodwill (Note 8) 552.1 580.7Intangible assets, net (Note 8) 282.9 315.3Deferred income taxes (Note 11) 106.5 36.9Derivative financial instruments (Note 15) 134.9 68.5Other assets 168.5 187.8Total assets 7,175.6 6,605.6Liabilities and equityShort-term debt and current portion of long-term debt (Note 10) 11.7 42.5Accounts payable, trade 723.5 750.7Advance payments and progress billings 965.2 803.2Accrued payroll 256.8 222.0Derivative financial instruments (Note 15) 230.2 171.3Income taxes payable 152.9 138.1Deferred income taxes (Note 11) 54.2 66.4Other current liabilities 389.1 420.5Total current liabilities 2,783.6 2,614.7Long-term debt, less current portion (Note 10) 1,297.2 1,329.8Accrued pension and other post-retirement benefits, less current portion (Note 12) 236.7 84.0Derivative financial instruments (Note 15) 220.2 47.1Deferred income taxes (Note 11) 54.3 90.3Other liabilities 105.9 103.4Commitments and contingent liabilities (Note 18)Stockholders’ equity (Note 14):Preferred stock, $0.01 par value, 12.0 shares authorized; no shares issued in 2014 or 2013 0 0Common stock, $0.01 par value, 600.0 shares authorized in 2014 and 2013; 286.3 sharesissued in 2014 and 2013; and 231.5 and 235.8 shares outstanding in 2014 and 2013,respectively
2.9 2.9
Common stock held in employee benefit trust, at cost; 0.2 shares in 2014 and 2013 (8.0) (7.7)Treasury stock, at cost, 54.6 and 50.3 shares in 2014 and 2013, respectively (1,431.1) (1,196.6)
Copyright © 2013 www.secdatabase.com. All Rights Reserved.Please Consider the Environment Before Printing This Document
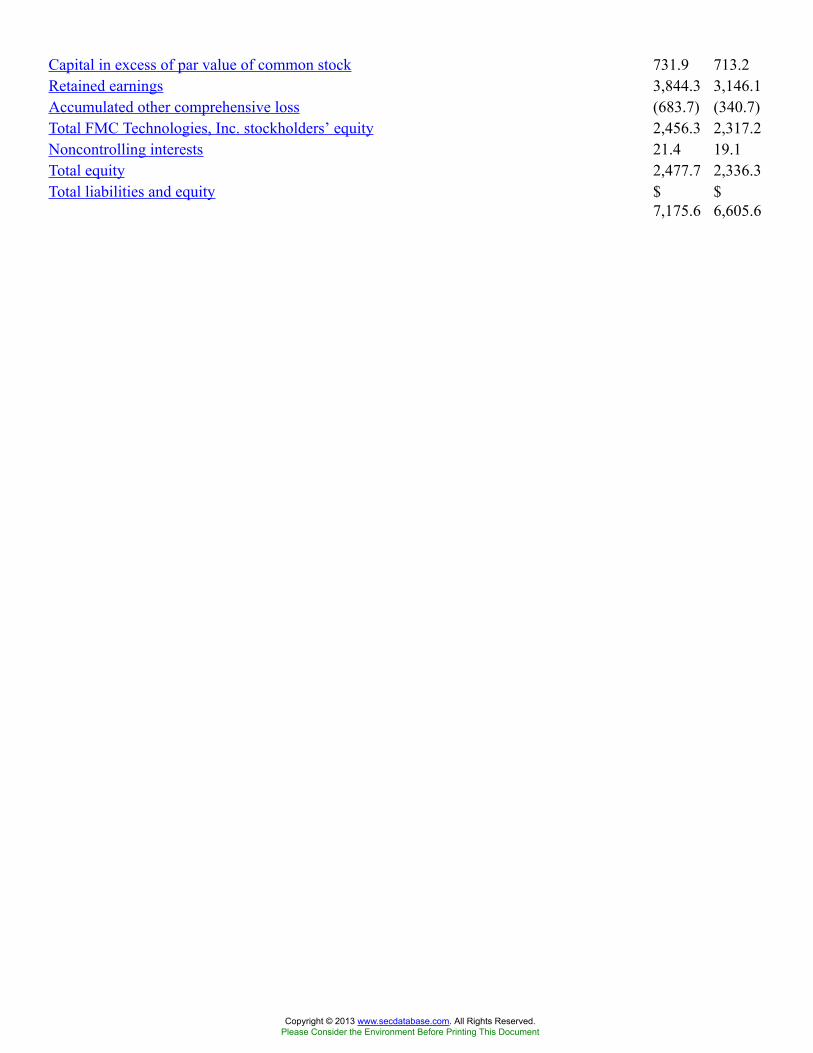
Capital in excess of par value of common stock 731.9 713.2Retained earnings 3,844.3 3,146.1Accumulated other comprehensive loss (683.7) (340.7)Total FMC Technologies, Inc. stockholders’ equity 2,456.3 2,317.2Noncontrolling interests 21.4 19.1Total equity 2,477.7 2,336.3Total liabilities and equity $
7,175.6$6,605.6
Copyright © 2013 www.secdatabase.com. All Rights Reserved.Please Consider the Environment Before Printing This Document

Derivative FinancialInstruments (Schedule Of
Notional Amounts OfOutstanding Derivative
Positions (Details)In Millions, unless otherwise
specified
Dec. 31,2014
ForeignExchangeForwardAustralia
dollarsNotionalamountboughtUSD ($)
Dec. 31,2014
ForeignExchangeForwardAustralia
dollarsNotionalamountboughtAUD
Dec. 31,2014
ForeignExchangeForwardBritishpound
NotionalamountboughtUSD ($)
Dec. 31,2014
ForeignExchangeForwardBritishpound
NotionalamountboughtGBP (£)
Dec. 31,2014
ForeignExchangeForwardCanadian
dollarNotionalamount
soldUSD ($)
Dec. 31,2014
ForeignExchangeForwardCanadian
dollarNotionalamount
soldCAD
Dec. 31,2014
ForeignExchangeForward
EuroNotionalamountboughtUSD ($)
Dec. 31,2014
ForeignExchangeForward
EuroNotionalamountbought
EUR (€)
Dec. 31,2014
ForeignExchangeForwardKuwaiti
dinarNotionalamount
soldUSD ($)
Dec. 31,2014
ForeignExchangeForwardKuwaiti
dinarNotionalamount
soldKWD
Dec. 31,2014
ForeignExchangeForward
Malaysianringgit
NotionalamountboughtUSD ($)
Dec. 31,2014
ForeignExchangeForward
Malaysianringgit
NotionalamountboughtMYR
Dec. 31,2014
ForeignExchangeForward
Norwegiankrone
NotionalamountboughtUSD ($)
Dec. 31,2014
ForeignExchangeForward
Norwegiankrone
NotionalamountboughtNOK
Dec. 31,2014
ForeignExchangeForward
Singaporedollar
NotionalamountboughtUSD ($)
Dec. 31,2014
ForeignExchangeForward
Singaporedollar
NotionalamountboughtSGD
Dec. 31,2014
ForeignExchangeForward
U.S.dollar
Notionalamount
soldUSD ($)
Dec. 31,2014
EmbeddedDerivativeFinancial
InstrumentsBrazilian
realNotionalamount
soldUSD ($)
Dec. 31,2014
EmbeddedDerivativeFinancial
InstrumentsBrazilian
realNotionalamount
soldBRL
Dec. 31,2014
EmbeddedDerivativeFinancial
InstrumentsNorwegian
kroneNotionalamount
soldUSD ($)
Dec. 31,2014
EmbeddedDerivativeFinancial
InstrumentsNorwegian
kroneNotionalamount
soldNOK
Dec. 31,2014
EmbeddedDerivativeFinancial
InstrumentsU.S. dollarNotionalamountboughtUSD ($)
Derivative [Line Items]Derivative, Notional Amount $ 26.1 31.9 $ 114.1 £ 73.3 $ 129.1 150.0 $ 183.2 € 151.4 $ 20.1 5.9 $ 30.8 107.8 $ 383.6 2,859.0 $ 167.7 222.3 $ 929.1 $ 39.7 105.6 $ 10.4 77.6 $ 34.6
Copyright © 2013 www.secdatabase.com. All Rights Reserved.Please Consider the Environment Before Printing This Document
12 Months EndedRecently AdoptedAccounting Standards Dec. 31, 2014
New AccountingPronouncements andChanges in AccountingPrinciples [Abstract]RECENTLY ADOPTEDACCOUNTINGSTANDARDS
RECENTLY ADOPTED ACCOUNTING STANDARDS
Effective January 1, 2014, we adopted Accounting Standards Update (“ASU”) No. 2013-11,“Presentation of an Unrecognized Tax Benefit When a Net Operating Loss Carryforward, aSimilar Tax Loss, or a Tax Credit Carryforward Exists” issued by the Financial AccountingStandards Board (“FASB”). This update requires the netting of unrecognized tax benefits againsta deferred tax asset for a loss or other carryforward that would apply in settlement of theuncertain tax positions. Under the amended guidance, unrecognized tax benefits are nettedagainst all available same-jurisdiction loss or other tax carryforwards that would be utilized,rather than only against carryforwards that are created by the unrecognized tax benefits. Theupdated guidance is applied prospectively, effective January 1, 2014. The adoption of this updateconcerns presentation and disclosure only as it relates to our consolidated financial statements.
Effective January 1, 2014, we adopted ASU No. 2014-08, “Reporting Discontinued Operationsand Disclosures ofDisposals of Components of an Entity” issued by the FASB. This update changes therequirements of reporting discontinued operations. Under the amended guidance, a disposal of acomponent of an entity or a group of components of an entity is required to be reported indiscontinued operations if the disposal represents a strategic shift that has (or will have) a majoreffect on an entity’s operations and financial results. The amendments in this update are effectivefor all disposals (or classifications as held for sale) of components of an entity that occur withinannual periods beginning on or after December 15, 2014, and interim periods within those years,with early adoption permitted. The adoption of this update concerns presentation and disclosureonly as it relates to our consolidated financial statements.
Effective December 31, 2014, we adopted ASU No. 2014-15, “Presentation of FinancialStatements - Going Concern.” This update provides guidance about management’s responsibilityto evaluate whether there is substantial doubt about an entity’s ability to continue as a goingconcern and on determining when and how entities must disclose going concern uncertainties inthe financial statements. The update requires management to perform interim and annualassessments of an entity’s ability to continue as a going concern within one year of the date ofissuance of the entity’s financial statements. The amendments in this ASU are effective for theCompany for annual periods ending after December 15, 2016, and interim periods thereafter, withearly adoption permitted. The adoption of this update concerns disclosure only and did not haveany financial impact on our consolidated financial statements.
Copyright © 2013 www.secdatabase.com. All Rights Reserved.Please Consider the Environment Before Printing This Document
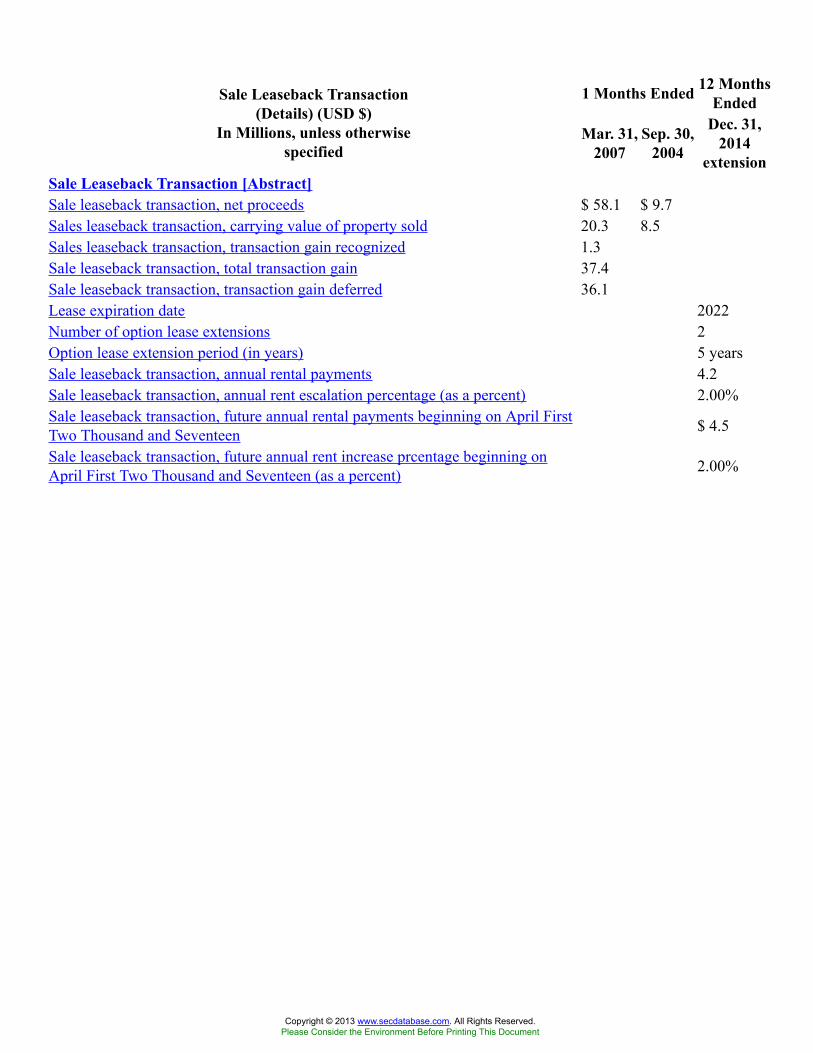
1 Months Ended 12 MonthsEndedSale Leaseback Transaction
(Details) (USD $)In Millions, unless otherwise
specifiedMar. 31,
2007Sep. 30,
2004
Dec. 31,2014
extensionSale Leaseback Transaction [Abstract]Sale leaseback transaction, net proceeds $ 58.1 $ 9.7Sales leaseback transaction, carrying value of property sold 20.3 8.5Sales leaseback transaction, transaction gain recognized 1.3Sale leaseback transaction, total transaction gain 37.4Sale leaseback transaction, transaction gain deferred 36.1Lease expiration date 2022Number of option lease extensions 2Option lease extension period (in years) 5 yearsSale leaseback transaction, annual rental payments 4.2Sale leaseback transaction, annual rent escalation percentage (as a percent) 2.00%Sale leaseback transaction, future annual rental payments beginning on April FirstTwo Thousand and Seventeen $ 4.5
Sale leaseback transaction, future annual rent increase prcentage beginning onApril First Two Thousand and Seventeen (as a percent) 2.00%
Copyright © 2013 www.secdatabase.com. All Rights Reserved.Please Consider the Environment Before Printing This Document
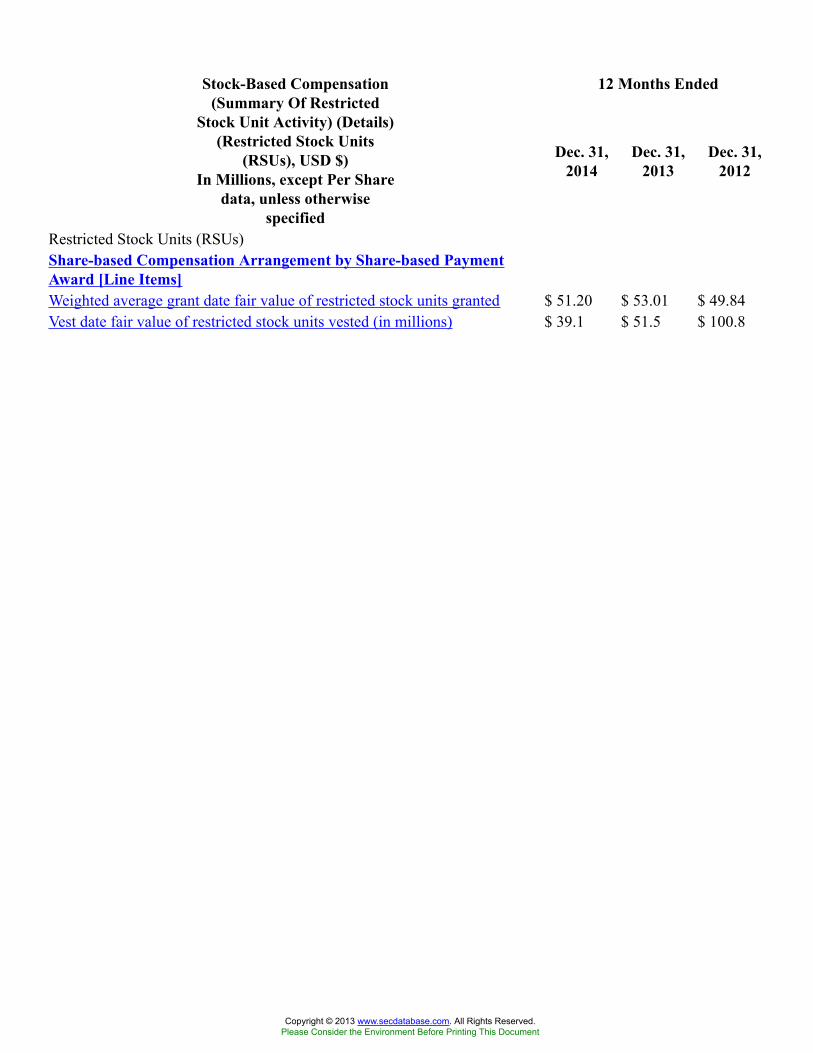
12 Months EndedStock-Based Compensation(Summary Of Restricted
Stock Unit Activity) (Details)(Restricted Stock Units
(RSUs), USD $)In Millions, except Per Share
data, unless otherwisespecified
Dec. 31,2014
Dec. 31,2013
Dec. 31,2012
Restricted Stock Units (RSUs)Share-based Compensation Arrangement by Share-based PaymentAward [Line Items]Weighted average grant date fair value of restricted stock units granted $ 51.20 $ 53.01 $ 49.84Vest date fair value of restricted stock units vested (in millions) $ 39.1 $ 51.5 $ 100.8
Copyright © 2013 www.secdatabase.com. All Rights Reserved.Please Consider the Environment Before Printing This Document
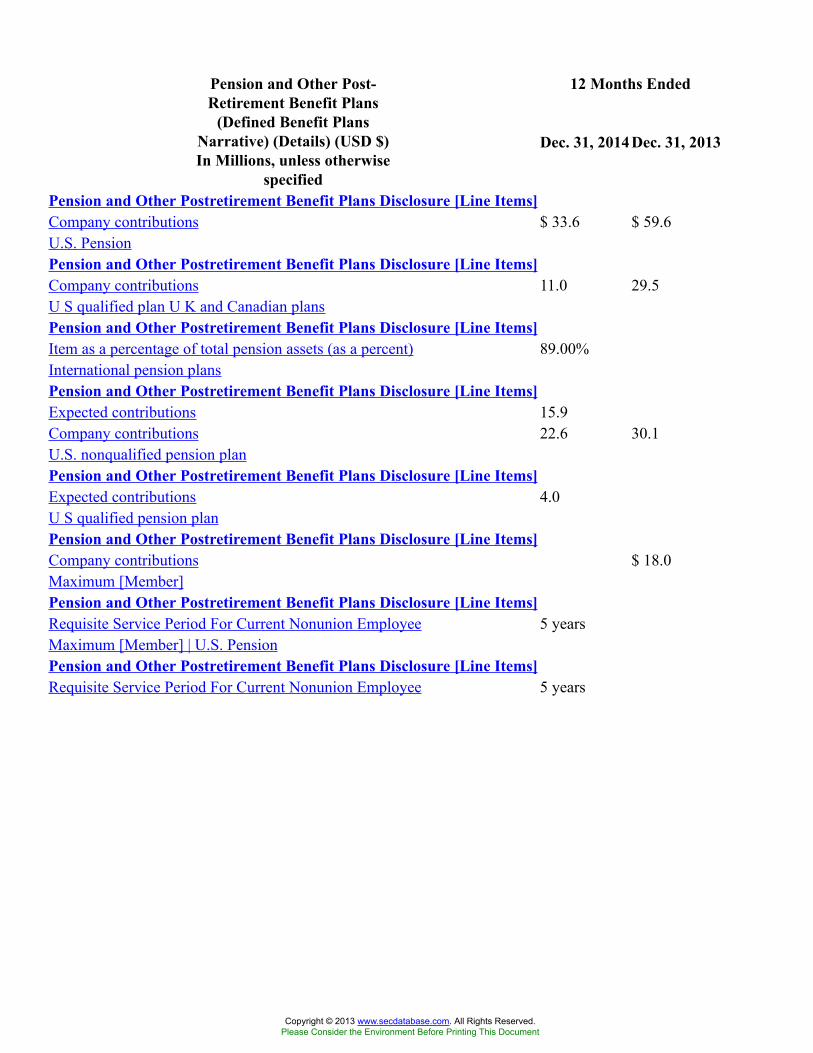
12 Months EndedPension and Other Post-Retirement Benefit Plans
(Defined Benefit PlansNarrative) (Details) (USD $)In Millions, unless otherwise
specified
Dec. 31, 2014 Dec. 31, 2013
Pension and Other Postretirement Benefit Plans Disclosure [Line Items]Company contributions $ 33.6 $ 59.6U.S. PensionPension and Other Postretirement Benefit Plans Disclosure [Line Items]Company contributions 11.0 29.5U S qualified plan U K and Canadian plansPension and Other Postretirement Benefit Plans Disclosure [Line Items]Item as a percentage of total pension assets (as a percent) 89.00%International pension plansPension and Other Postretirement Benefit Plans Disclosure [Line Items]Expected contributions 15.9Company contributions 22.6 30.1U.S. nonqualified pension planPension and Other Postretirement Benefit Plans Disclosure [Line Items]Expected contributions 4.0U S qualified pension planPension and Other Postretirement Benefit Plans Disclosure [Line Items]Company contributions $ 18.0Maximum [Member]Pension and Other Postretirement Benefit Plans Disclosure [Line Items]Requisite Service Period For Current Nonunion Employee 5 yearsMaximum [Member] | U.S. PensionPension and Other Postretirement Benefit Plans Disclosure [Line Items]Requisite Service Period For Current Nonunion Employee 5 years
Copyright © 2013 www.secdatabase.com. All Rights Reserved.Please Consider the Environment Before Printing This Document
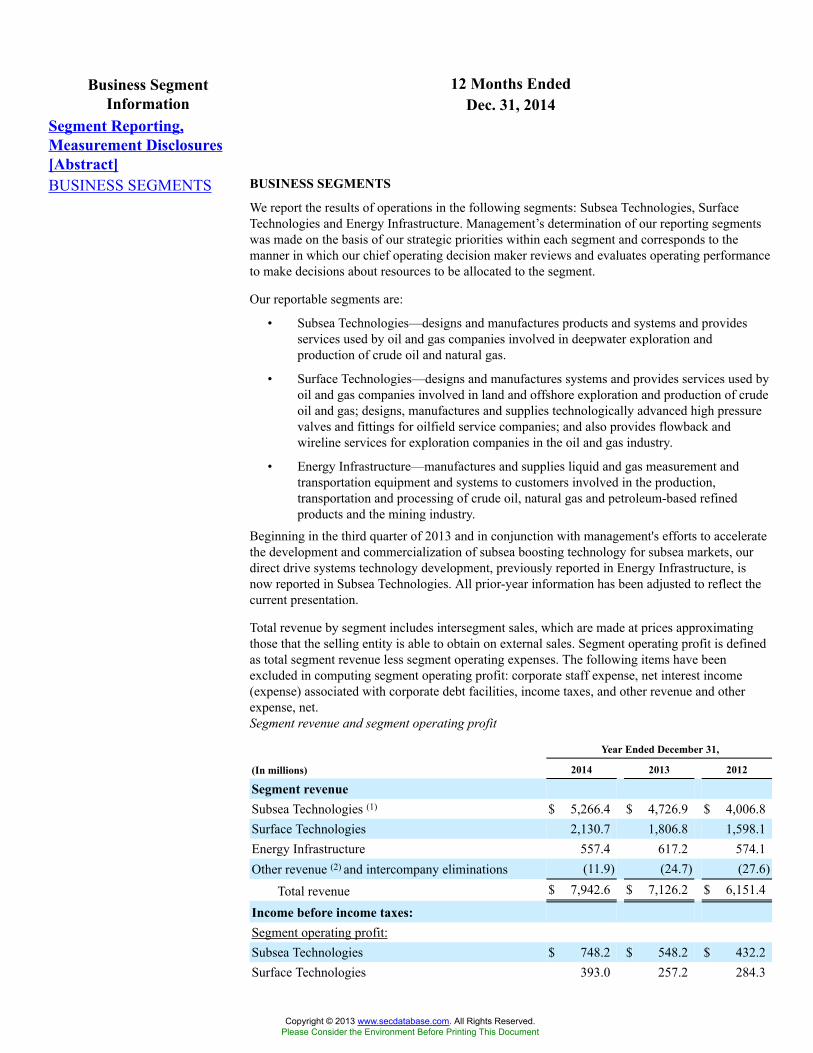
12 Months EndedBusiness SegmentInformation Dec. 31, 2014
Segment Reporting,Measurement Disclosures[Abstract]BUSINESS SEGMENTS BUSINESS SEGMENTS
We report the results of operations in the following segments: Subsea Technologies, SurfaceTechnologies and Energy Infrastructure. Management’s determination of our reporting segmentswas made on the basis of our strategic priorities within each segment and corresponds to themanner in which our chief operating decision maker reviews and evaluates operating performanceto make decisions about resources to be allocated to the segment.
Our reportable segments are:
• Subsea Technologies—designs and manufactures products and systems and providesservices used by oil and gas companies involved in deepwater exploration andproduction of crude oil and natural gas.
• Surface Technologies—designs and manufactures systems and provides services used byoil and gas companies involved in land and offshore exploration and production of crudeoil and gas; designs, manufactures and supplies technologically advanced high pressurevalves and fittings for oilfield service companies; and also provides flowback andwireline services for exploration companies in the oil and gas industry.
• Energy Infrastructure—manufactures and supplies liquid and gas measurement andtransportation equipment and systems to customers involved in the production,transportation and processing of crude oil, natural gas and petroleum-based refinedproducts and the mining industry.
Beginning in the third quarter of 2013 and in conjunction with management's efforts to acceleratethe development and commercialization of subsea boosting technology for subsea markets, ourdirect drive systems technology development, previously reported in Energy Infrastructure, isnow reported in Subsea Technologies. All prior-year information has been adjusted to reflect thecurrent presentation.
Total revenue by segment includes intersegment sales, which are made at prices approximatingthose that the selling entity is able to obtain on external sales. Segment operating profit is definedas total segment revenue less segment operating expenses. The following items have beenexcluded in computing segment operating profit: corporate staff expense, net interest income(expense) associated with corporate debt facilities, income taxes, and other revenue and otherexpense, net.Segment revenue and segment operating profit
Year Ended December 31,
(In millions) 2014 2013 2012
Segment revenueSubsea Technologies (1) $ 5,266.4 $ 4,726.9 $ 4,006.8Surface Technologies 2,130.7 1,806.8 1,598.1Energy Infrastructure 557.4 617.2 574.1Other revenue (2) and intercompany eliminations (11.9) (24.7) (27.6)
Total revenue $ 7,942.6 $ 7,126.2 $ 6,151.4
Income before income taxes:Segment operating profit:Subsea Technologies $ 748.2 $ 548.2 $ 432.2Surface Technologies 393.0 257.2 284.3
Copyright © 2013 www.secdatabase.com. All Rights Reserved.Please Consider the Environment Before Printing This Document
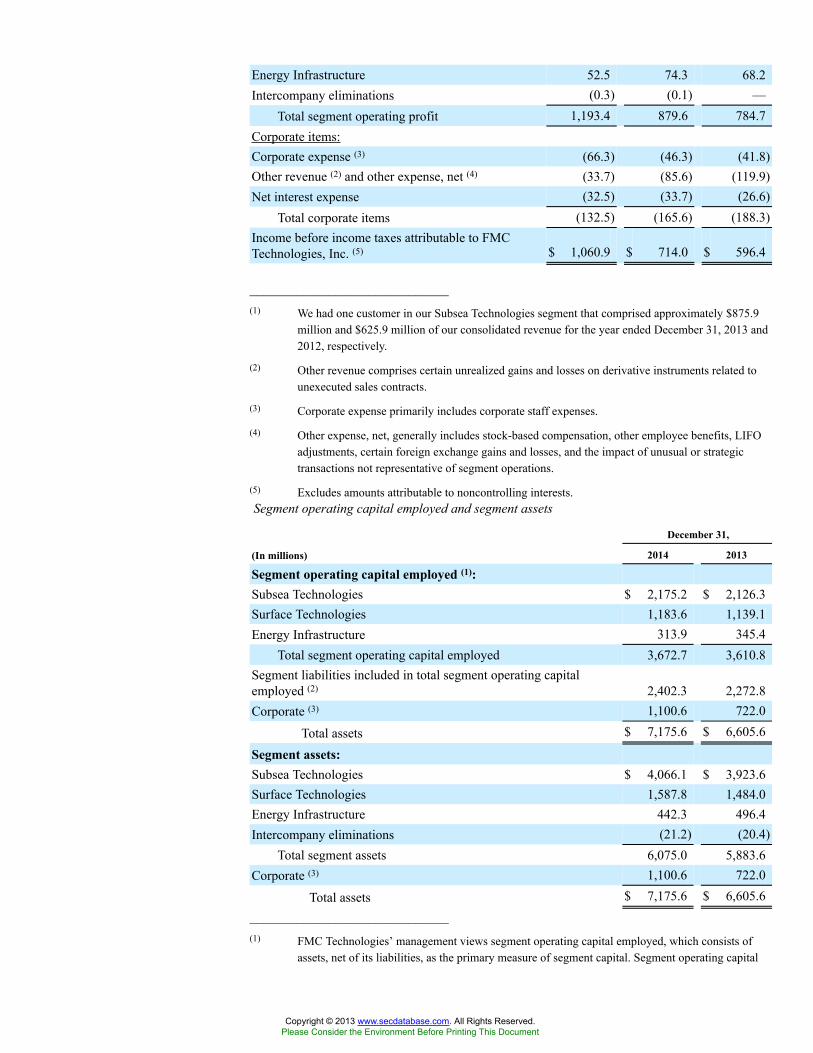
Energy Infrastructure 52.5 74.3 68.2Intercompany eliminations (0.3) (0.1) —
Total segment operating profit 1,193.4 879.6 784.7Corporate items:Corporate expense (3) (66.3) (46.3) (41.8)Other revenue (2) and other expense, net (4) (33.7) (85.6) (119.9)Net interest expense (32.5) (33.7) (26.6)
Total corporate items (132.5) (165.6) (188.3)Income before income taxes attributable to FMCTechnologies, Inc. (5) $ 1,060.9 $ 714.0 $ 596.4
______________________________(1) We had one customer in our Subsea Technologies segment that comprised approximately $875.9
million and $625.9 million of our consolidated revenue for the year ended December 31, 2013 and2012, respectively.
(2) Other revenue comprises certain unrealized gains and losses on derivative instruments related tounexecuted sales contracts.
(3) Corporate expense primarily includes corporate staff expenses.
(4) Other expense, net, generally includes stock-based compensation, other employee benefits, LIFOadjustments, certain foreign exchange gains and losses, and the impact of unusual or strategictransactions not representative of segment operations.
(5) Excludes amounts attributable to noncontrolling interests.Segment operating capital employed and segment assets
December 31,
(In millions) 2014 2013
Segment operating capital employed (1):Subsea Technologies $ 2,175.2 $ 2,126.3Surface Technologies 1,183.6 1,139.1Energy Infrastructure 313.9 345.4
Total segment operating capital employed 3,672.7 3,610.8Segment liabilities included in total segment operating capitalemployed (2) 2,402.3 2,272.8Corporate (3) 1,100.6 722.0
Total assets $ 7,175.6 $ 6,605.6
Segment assets:Subsea Technologies $ 4,066.1 $ 3,923.6Surface Technologies 1,587.8 1,484.0Energy Infrastructure 442.3 496.4Intercompany eliminations (21.2) (20.4)
Total segment assets 6,075.0 5,883.6Corporate (3) 1,100.6 722.0
Total assets $ 7,175.6 $ 6,605.6______________________________(1) FMC Technologies’ management views segment operating capital employed, which consists of
assets, net of its liabilities, as the primary measure of segment capital. Segment operating capital
Copyright © 2013 www.secdatabase.com. All Rights Reserved.Please Consider the Environment Before Printing This Document
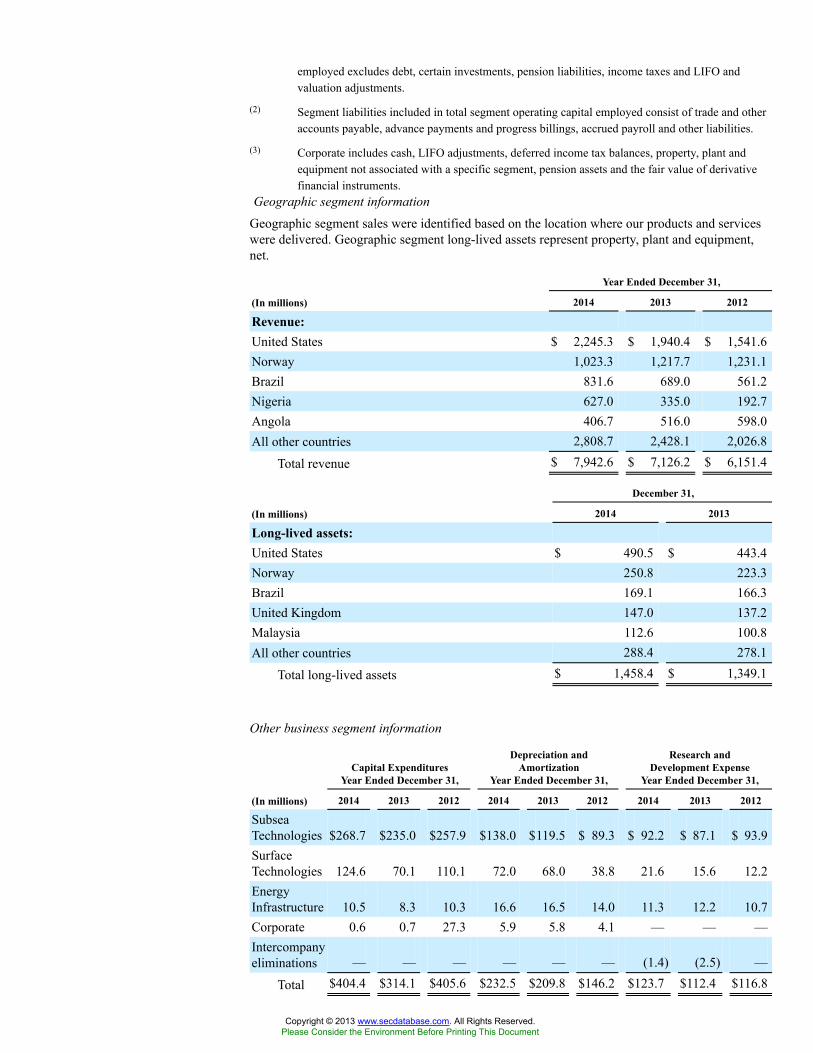
employed excludes debt, certain investments, pension liabilities, income taxes and LIFO andvaluation adjustments.
(2) Segment liabilities included in total segment operating capital employed consist of trade and otheraccounts payable, advance payments and progress billings, accrued payroll and other liabilities.
(3) Corporate includes cash, LIFO adjustments, deferred income tax balances, property, plant andequipment not associated with a specific segment, pension assets and the fair value of derivativefinancial instruments.
Geographic segment informationGeographic segment sales were identified based on the location where our products and serviceswere delivered. Geographic segment long-lived assets represent property, plant and equipment,net.
Year Ended December 31,
(In millions) 2014 2013 2012
Revenue:United States $ 2,245.3 $ 1,940.4 $ 1,541.6Norway 1,023.3 1,217.7 1,231.1Brazil 831.6 689.0 561.2Nigeria 627.0 335.0 192.7Angola 406.7 516.0 598.0All other countries 2,808.7 2,428.1 2,026.8
Total revenue $ 7,942.6 $ 7,126.2 $ 6,151.4
December 31,
(In millions) 2014 2013
Long-lived assets:United States $ 490.5 $ 443.4Norway 250.8 223.3Brazil 169.1 166.3United Kingdom 147.0 137.2Malaysia 112.6 100.8All other countries 288.4 278.1
Total long-lived assets $ 1,458.4 $ 1,349.1
Other business segment information
Capital ExpendituresYear Ended December 31,
Depreciation andAmortization
Year Ended December 31,
Research andDevelopment Expense
Year Ended December 31,
(In millions) 2014 2013 2012 2014 2013 2012 2014 2013 2012
SubseaTechnologies $268.7 $235.0 $257.9 $138.0 $119.5 $ 89.3 $ 92.2 $ 87.1 $ 93.9SurfaceTechnologies 124.6 70.1 110.1 72.0 68.0 38.8 21.6 15.6 12.2EnergyInfrastructure 10.5 8.3 10.3 16.6 16.5 14.0 11.3 12.2 10.7Corporate 0.6 0.7 27.3 5.9 5.8 4.1 — — —Intercompanyeliminations — — — — — — (1.4) (2.5) —
Total $404.4 $314.1 $405.6 $232.5 $209.8 $146.2 $123.7 $112.4 $116.8
Copyright © 2013 www.secdatabase.com. All Rights Reserved.Please Consider the Environment Before Printing This Document
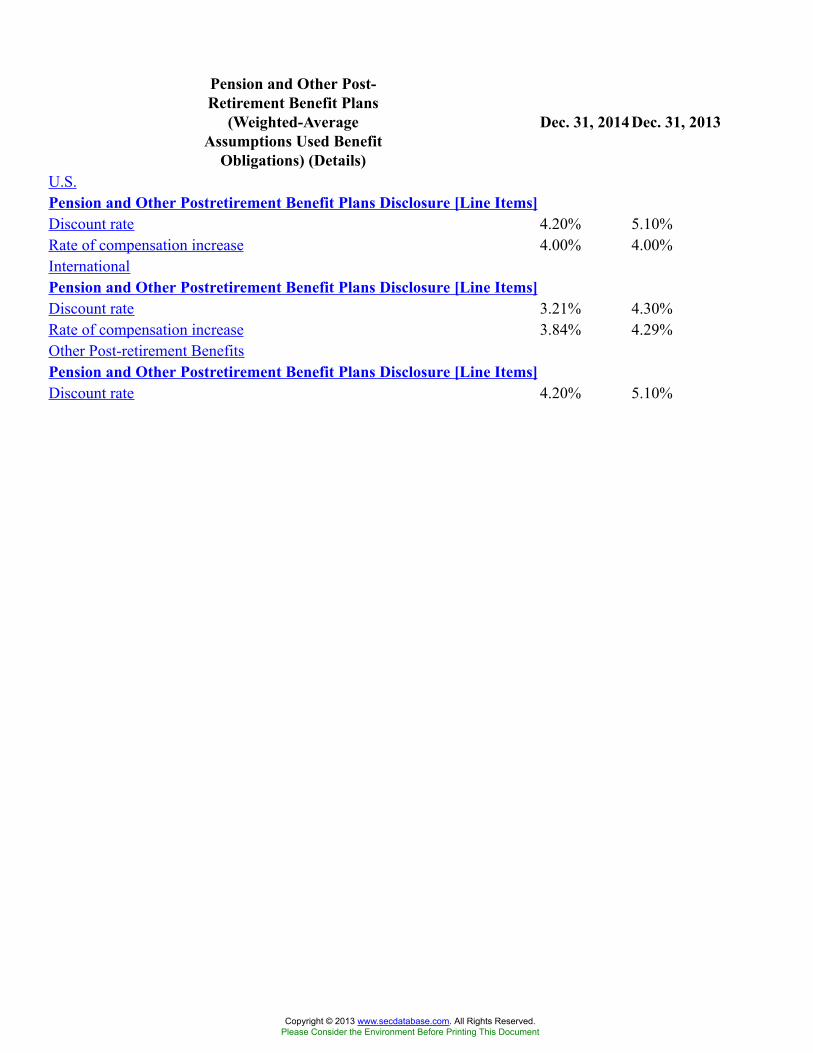
Pension and Other Post-Retirement Benefit Plans
(Weighted-AverageAssumptions Used Benefit
Obligations) (Details)
Dec. 31, 2014 Dec. 31, 2013
U.S.Pension and Other Postretirement Benefit Plans Disclosure [Line Items]Discount rate 4.20% 5.10%Rate of compensation increase 4.00% 4.00%InternationalPension and Other Postretirement Benefit Plans Disclosure [Line Items]Discount rate 3.21% 4.30%Rate of compensation increase 3.84% 4.29%Other Post-retirement BenefitsPension and Other Postretirement Benefit Plans Disclosure [Line Items]Discount rate 4.20% 5.10%
Copyright © 2013 www.secdatabase.com. All Rights Reserved.Please Consider the Environment Before Printing This Document
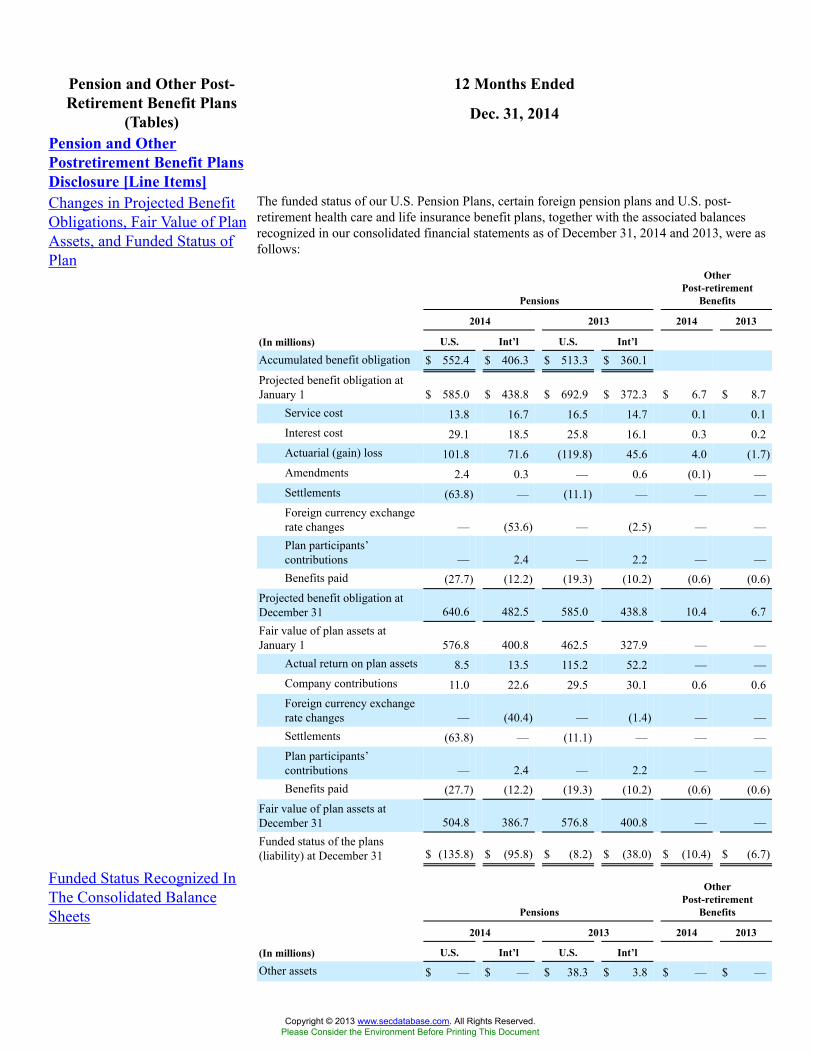
12 Months EndedPension and Other Post-Retirement Benefit Plans
(Tables) Dec. 31, 2014
Pension and OtherPostretirement Benefit PlansDisclosure [Line Items]Changes in Projected BenefitObligations, Fair Value of PlanAssets, and Funded Status ofPlan
The funded status of our U.S. Pension Plans, certain foreign pension plans and U.S. post-retirement health care and life insurance benefit plans, together with the associated balancesrecognized in our consolidated financial statements as of December 31, 2014 and 2013, were asfollows:
Pensions
OtherPost-retirement
Benefits
2014 2013 2014 2013
(In millions) U.S. Int’l U.S. Int’l
Accumulated benefit obligation $ 552.4 $ 406.3 $ 513.3 $ 360.1
Projected benefit obligation atJanuary 1 $ 585.0 $ 438.8 $ 692.9 $ 372.3 $ 6.7 $ 8.7
Service cost 13.8 16.7 16.5 14.7 0.1 0.1Interest cost 29.1 18.5 25.8 16.1 0.3 0.2Actuarial (gain) loss 101.8 71.6 (119.8) 45.6 4.0 (1.7)Amendments 2.4 0.3 — 0.6 (0.1) —Settlements (63.8) — (11.1) — — —Foreign currency exchangerate changes — (53.6) — (2.5) — —Plan participants’contributions — 2.4 — 2.2 — —Benefits paid (27.7) (12.2) (19.3) (10.2) (0.6) (0.6)
Projected benefit obligation atDecember 31 640.6 482.5 585.0 438.8 10.4 6.7Fair value of plan assets atJanuary 1 576.8 400.8 462.5 327.9 — —
Actual return on plan assets 8.5 13.5 115.2 52.2 — —Company contributions 11.0 22.6 29.5 30.1 0.6 0.6Foreign currency exchangerate changes — (40.4) — (1.4) — —Settlements (63.8) — (11.1) — — —Plan participants’contributions — 2.4 — 2.2 — —Benefits paid (27.7) (12.2) (19.3) (10.2) (0.6) (0.6)
Fair value of plan assets atDecember 31 504.8 386.7 576.8 400.8 — —Funded status of the plans(liability) at December 31 $ (135.8) $ (95.8) $ (8.2) $ (38.0) $ (10.4) $ (6.7)
Funded Status Recognized InThe Consolidated BalanceSheets Pensions
OtherPost-retirement
Benefits
2014 2013 2014 2013
(In millions) U.S. Int’l U.S. Int’l
Other assets $ — $ — $ 38.3 $ 3.8 $ — $ —
Copyright © 2013 www.secdatabase.com. All Rights Reserved.Please Consider the Environment Before Printing This Document
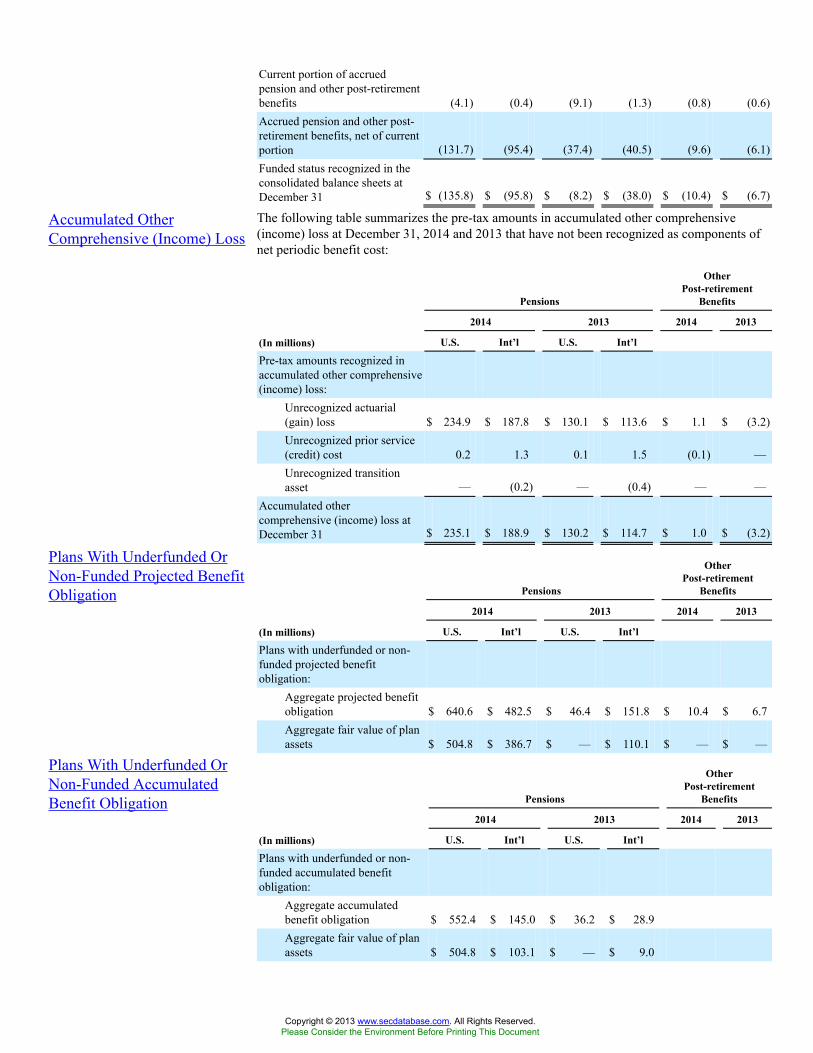
Current portion of accruedpension and other post-retirementbenefits (4.1) (0.4) (9.1) (1.3) (0.8) (0.6)Accrued pension and other post-retirement benefits, net of currentportion (131.7) (95.4) (37.4) (40.5) (9.6) (6.1)Funded status recognized in theconsolidated balance sheets atDecember 31 $ (135.8) $ (95.8) $ (8.2) $ (38.0) $ (10.4) $ (6.7)
Accumulated OtherComprehensive (Income) Loss
The following table summarizes the pre-tax amounts in accumulated other comprehensive(income) loss at December 31, 2014 and 2013 that have not been recognized as components ofnet periodic benefit cost:
Pensions
OtherPost-retirement
Benefits
2014 2013 2014 2013
(In millions) U.S. Int’l U.S. Int’l
Pre-tax amounts recognized inaccumulated other comprehensive(income) loss:
Unrecognized actuarial(gain) loss $ 234.9 $ 187.8 $ 130.1 $ 113.6 $ 1.1 $ (3.2)Unrecognized prior service(credit) cost 0.2 1.3 0.1 1.5 (0.1) —Unrecognized transitionasset — (0.2) — (0.4) — —
Accumulated othercomprehensive (income) loss atDecember 31 $ 235.1 $ 188.9 $ 130.2 $ 114.7 $ 1.0 $ (3.2)
Plans With Underfunded OrNon-Funded Projected BenefitObligation Pensions
OtherPost-retirement
Benefits
2014 2013 2014 2013
(In millions) U.S. Int’l U.S. Int’l
Plans with underfunded or non-funded projected benefitobligation:
Aggregate projected benefitobligation $ 640.6 $ 482.5 $ 46.4 $ 151.8 $ 10.4 $ 6.7Aggregate fair value of planassets $ 504.8 $ 386.7 $ — $ 110.1 $ — $ —
Plans With Underfunded OrNon-Funded AccumulatedBenefit Obligation Pensions
OtherPost-retirement
Benefits
2014 2013 2014 2013
(In millions) U.S. Int’l U.S. Int’l
Plans with underfunded or non-funded accumulated benefitobligation:
Aggregate accumulatedbenefit obligation $ 552.4 $ 145.0 $ 36.2 $ 28.9Aggregate fair value of planassets $ 504.8 $ 103.1 $ — $ 9.0
Copyright © 2013 www.secdatabase.com. All Rights Reserved.Please Consider the Environment Before Printing This Document
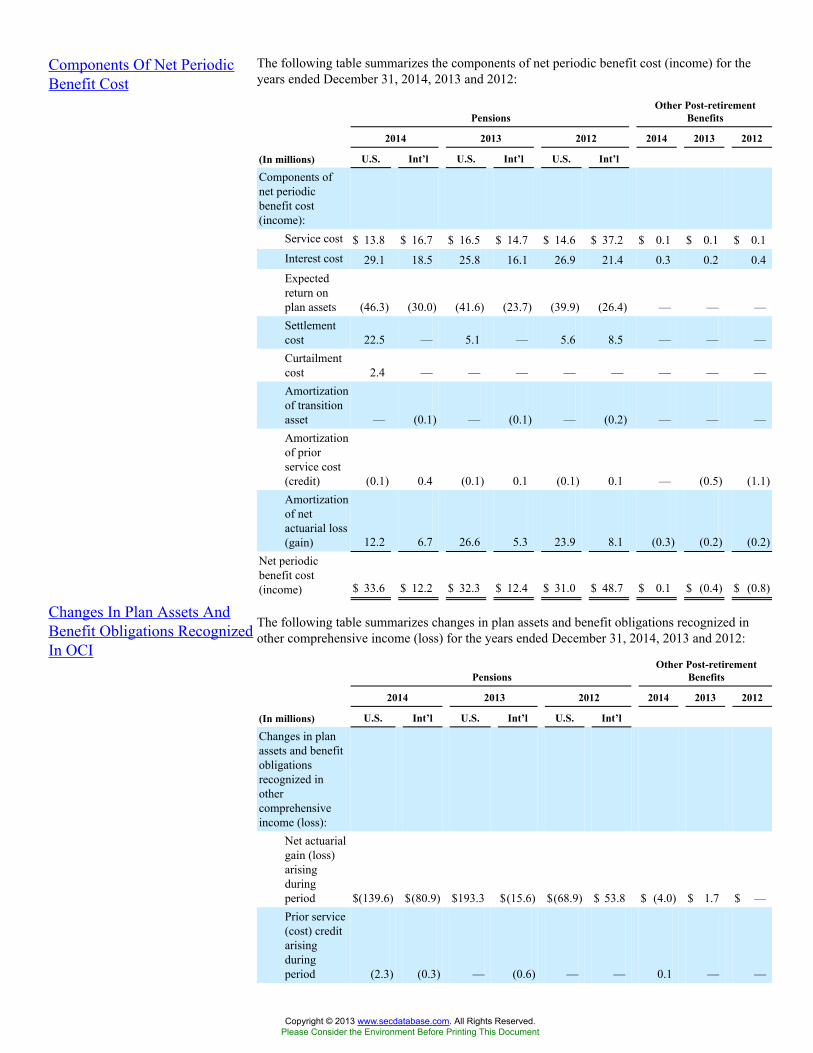
Components Of Net PeriodicBenefit Cost
The following table summarizes the components of net periodic benefit cost (income) for theyears ended December 31, 2014, 2013 and 2012:
PensionsOther Post-retirement
Benefits
2014 2013 2012 2014 2013 2012
(In millions) U.S. Int’l U.S. Int’l U.S. Int’l
Components ofnet periodicbenefit cost(income):
Service cost $ 13.8 $ 16.7 $ 16.5 $ 14.7 $ 14.6 $ 37.2 $ 0.1 $ 0.1 $ 0.1Interest cost 29.1 18.5 25.8 16.1 26.9 21.4 0.3 0.2 0.4Expectedreturn onplan assets (46.3) (30.0) (41.6) (23.7) (39.9) (26.4) — — —Settlementcost 22.5 — 5.1 — 5.6 8.5 — — —Curtailmentcost 2.4 — — — — — — — —Amortizationof transitionasset — (0.1) — (0.1) — (0.2) — — —Amortizationof priorservice cost(credit) (0.1) 0.4 (0.1) 0.1 (0.1) 0.1 — (0.5) (1.1)Amortizationof netactuarial loss(gain) 12.2 6.7 26.6 5.3 23.9 8.1 (0.3) (0.2) (0.2)
Net periodicbenefit cost(income) $ 33.6 $ 12.2 $ 32.3 $ 12.4 $ 31.0 $ 48.7 $ 0.1 $ (0.4) $ (0.8)
Changes In Plan Assets AndBenefit Obligations RecognizedIn OCI
The following table summarizes changes in plan assets and benefit obligations recognized inother comprehensive income (loss) for the years ended December 31, 2014, 2013 and 2012:
PensionsOther Post-retirement
Benefits
2014 2013 2012 2014 2013 2012
(In millions) U.S. Int’l U.S. Int’l U.S. Int’l
Changes in planassets and benefitobligationsrecognized inothercomprehensiveincome (loss):
Net actuarialgain (loss)arisingduringperiod $(139.6) $(80.9) $193.3 $(15.6) $(68.9) $ 53.8 $ (4.0) $ 1.7 $ —Prior service(cost) creditarisingduringperiod (2.3) (0.3) — (0.6) — — 0.1 — —
Copyright © 2013 www.secdatabase.com. All Rights Reserved.Please Consider the Environment Before Printing This Document
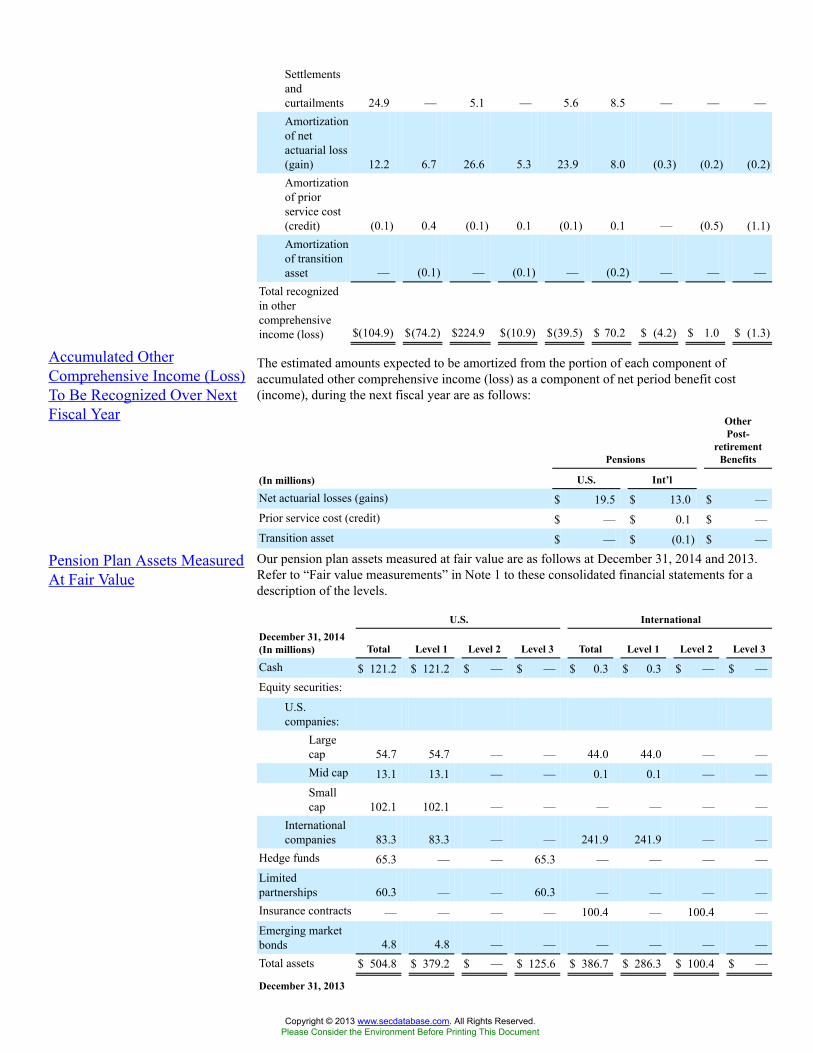
Settlementsandcurtailments 24.9 — 5.1 — 5.6 8.5 — — —Amortizationof netactuarial loss(gain) 12.2 6.7 26.6 5.3 23.9 8.0 (0.3) (0.2) (0.2)Amortizationof priorservice cost(credit) (0.1) 0.4 (0.1) 0.1 (0.1) 0.1 — (0.5) (1.1)Amortizationof transitionasset — (0.1) — (0.1) — (0.2) — — —
Total recognizedin othercomprehensiveincome (loss) $(104.9) $(74.2) $224.9 $(10.9) $(39.5) $ 70.2 $ (4.2) $ 1.0 $ (1.3)
Accumulated OtherComprehensive Income (Loss)To Be Recognized Over NextFiscal Year
The estimated amounts expected to be amortized from the portion of each component ofaccumulated other comprehensive income (loss) as a component of net period benefit cost(income), during the next fiscal year are as follows:
Pensions
OtherPost-
retirementBenefits
(In millions) U.S. Int’l
Net actuarial losses (gains) $ 19.5 $ 13.0 $ —Prior service cost (credit) $ — $ 0.1 $ —Transition asset $ — $ (0.1) $ —
Pension Plan Assets MeasuredAt Fair Value
Our pension plan assets measured at fair value are as follows at December 31, 2014 and 2013.Refer to “Fair value measurements” in Note 1 to these consolidated financial statements for adescription of the levels.
U.S. InternationalDecember 31, 2014(In millions) Total Level 1 Level 2 Level 3 Total Level 1 Level 2 Level 3
Cash $ 121.2 $ 121.2 $ — $ — $ 0.3 $ 0.3 $ — $ —Equity securities:
U.S.companies:
Largecap 54.7 54.7 — — 44.0 44.0 — —Mid cap 13.1 13.1 — — 0.1 0.1 — —Smallcap 102.1 102.1 — — — — — —
Internationalcompanies 83.3 83.3 — — 241.9 241.9 — —
Hedge funds 65.3 — — 65.3 — — — —Limitedpartnerships 60.3 — — 60.3 — — — —Insurance contracts — — — — 100.4 — 100.4 —Emerging marketbonds 4.8 4.8 — — — — — —Total assets $ 504.8 $ 379.2 $ — $ 125.6 $ 386.7 $ 286.3 $ 100.4 $ —
December 31, 2013
Copyright © 2013 www.secdatabase.com. All Rights Reserved.Please Consider the Environment Before Printing This Document
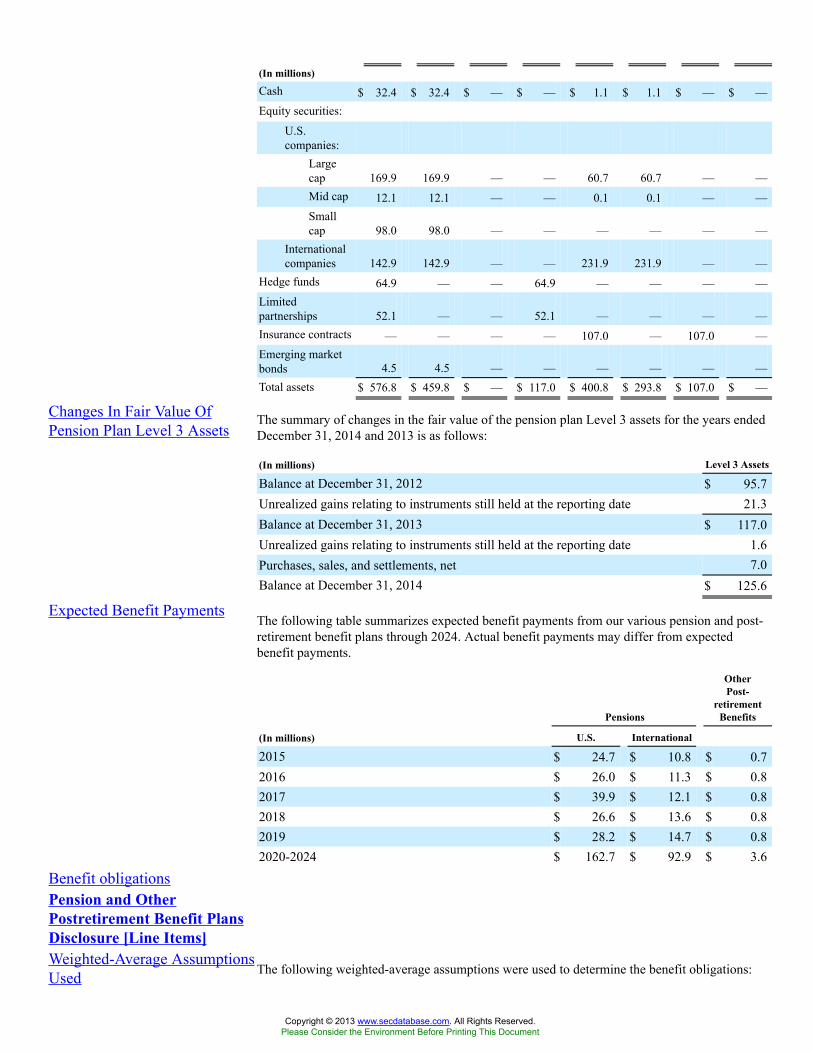
(In millions)
Cash $ 32.4 $ 32.4 $ — $ — $ 1.1 $ 1.1 $ — $ —Equity securities:
U.S.companies:
Largecap 169.9 169.9 — — 60.7 60.7 — —Mid cap 12.1 12.1 — — 0.1 0.1 — —Smallcap 98.0 98.0 — — — — — —
Internationalcompanies 142.9 142.9 — — 231.9 231.9 — —
Hedge funds 64.9 — — 64.9 — — — —Limitedpartnerships 52.1 — — 52.1 — — — —Insurance contracts — — — — 107.0 — 107.0 —Emerging marketbonds 4.5 4.5 — — — — — —Total assets $ 576.8 $ 459.8 $ — $ 117.0 $ 400.8 $ 293.8 $ 107.0 $ —
Changes In Fair Value OfPension Plan Level 3 Assets
The summary of changes in the fair value of the pension plan Level 3 assets for the years endedDecember 31, 2014 and 2013 is as follows:
(In millions) Level 3 Assets
Balance at December 31, 2012 $ 95.7Unrealized gains relating to instruments still held at the reporting date 21.3Balance at December 31, 2013 $ 117.0Unrealized gains relating to instruments still held at the reporting date 1.6Purchases, sales, and settlements, net 7.0Balance at December 31, 2014 $ 125.6
Expected Benefit PaymentsThe following table summarizes expected benefit payments from our various pension and post-retirement benefit plans through 2024. Actual benefit payments may differ from expectedbenefit payments.
Pensions
OtherPost-
retirementBenefits
(In millions) U.S. International
2015 $ 24.7 $ 10.8 $ 0.72016 $ 26.0 $ 11.3 $ 0.82017 $ 39.9 $ 12.1 $ 0.82018 $ 26.6 $ 13.6 $ 0.82019 $ 28.2 $ 14.7 $ 0.82020-2024 $ 162.7 $ 92.9 $ 3.6
Benefit obligationsPension and OtherPostretirement Benefit PlansDisclosure [Line Items]Weighted-Average AssumptionsUsed The following weighted-average assumptions were used to determine the benefit obligations:
Copyright © 2013 www.secdatabase.com. All Rights Reserved.Please Consider the Environment Before Printing This Document
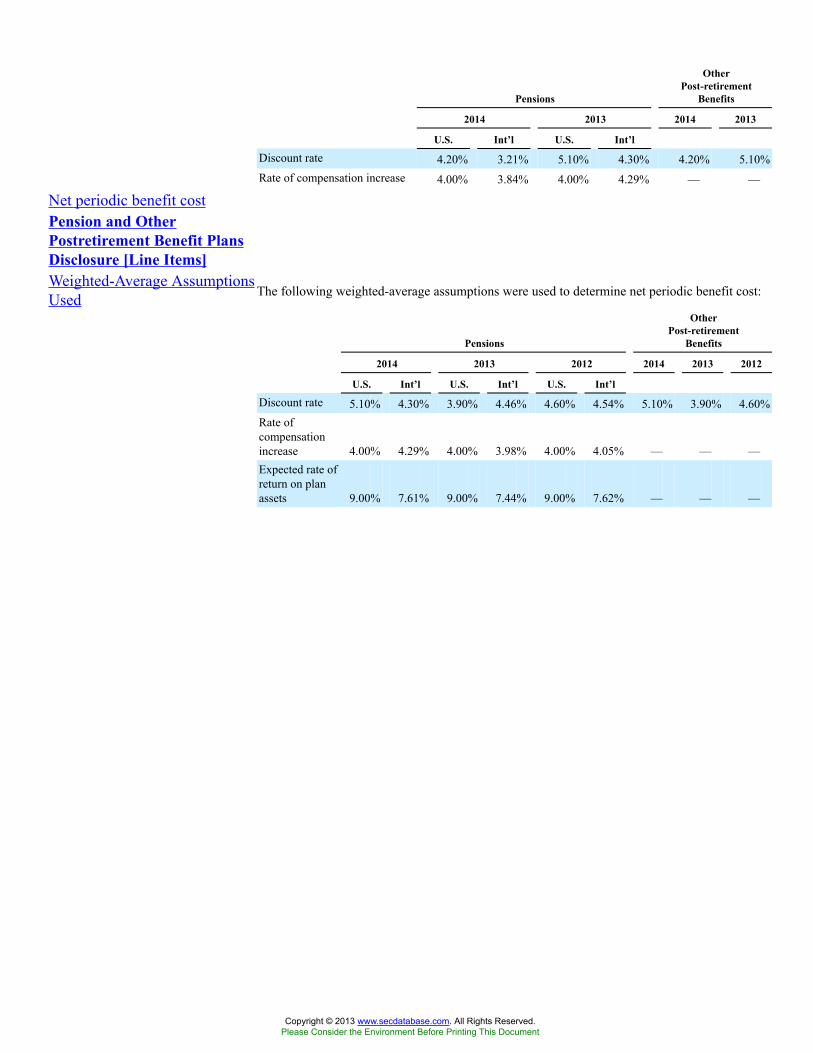
Pensions
OtherPost-retirement
Benefits
2014 2013 2014 2013
U.S. Int’l U.S. Int’l
Discount rate 4.20% 3.21% 5.10% 4.30% 4.20% 5.10%Rate of compensation increase 4.00% 3.84% 4.00% 4.29% — —
Net periodic benefit costPension and OtherPostretirement Benefit PlansDisclosure [Line Items]Weighted-Average AssumptionsUsed The following weighted-average assumptions were used to determine net periodic benefit cost:
Pensions
OtherPost-retirement
Benefits
2014 2013 2012 2014 2013 2012
U.S. Int’l U.S. Int’l U.S. Int’l
Discount rate 5.10% 4.30% 3.90% 4.46% 4.60% 4.54% 5.10% 3.90% 4.60%Rate ofcompensationincrease 4.00% 4.29% 4.00% 3.98% 4.00% 4.05% — — —Expected rate ofreturn on planassets 9.00% 7.61% 9.00% 7.44% 9.00% 7.62% — — —
Copyright © 2013 www.secdatabase.com. All Rights Reserved.Please Consider the Environment Before Printing This Document
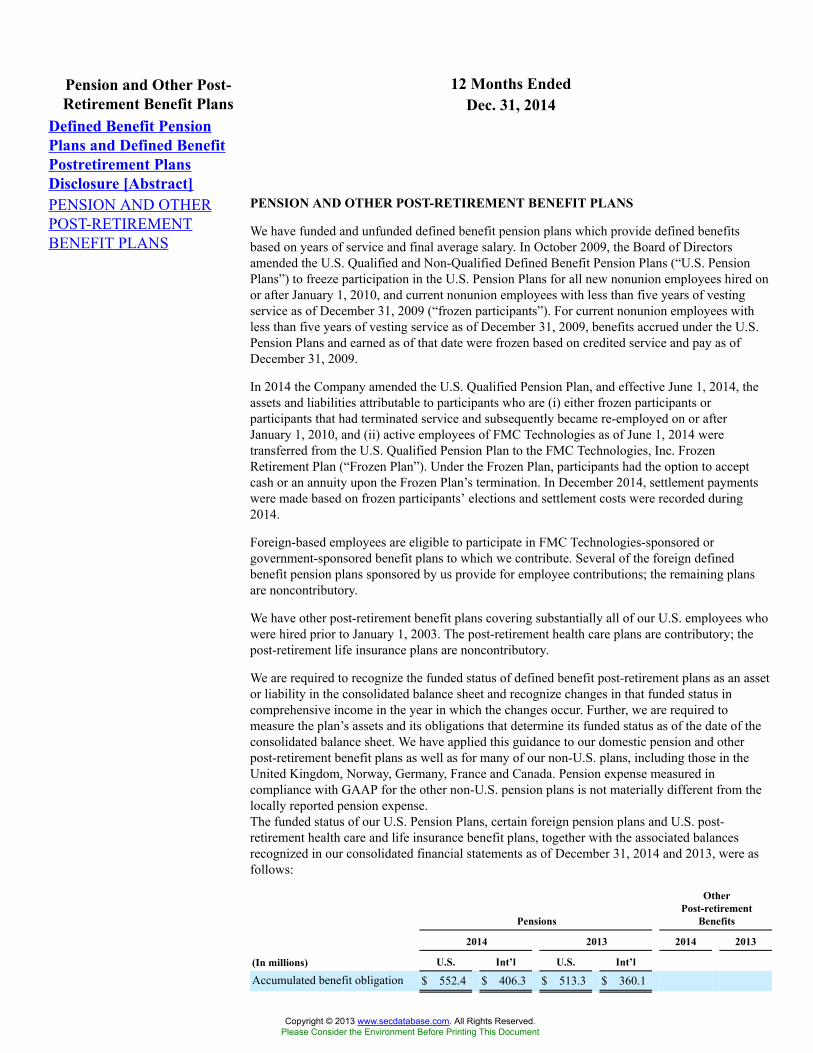
12 Months EndedPension and Other Post-Retirement Benefit Plans Dec. 31, 2014
Defined Benefit PensionPlans and Defined BenefitPostretirement PlansDisclosure [Abstract]PENSION AND OTHERPOST-RETIREMENTBENEFIT PLANS
PENSION AND OTHER POST-RETIREMENT BENEFIT PLANS
We have funded and unfunded defined benefit pension plans which provide defined benefitsbased on years of service and final average salary. In October 2009, the Board of Directorsamended the U.S. Qualified and Non-Qualified Defined Benefit Pension Plans (“U.S. PensionPlans”) to freeze participation in the U.S. Pension Plans for all new nonunion employees hired onor after January 1, 2010, and current nonunion employees with less than five years of vestingservice as of December 31, 2009 (“frozen participants”). For current nonunion employees withless than five years of vesting service as of December 31, 2009, benefits accrued under the U.S.Pension Plans and earned as of that date were frozen based on credited service and pay as ofDecember 31, 2009.
In 2014 the Company amended the U.S. Qualified Pension Plan, and effective June 1, 2014, theassets and liabilities attributable to participants who are (i) either frozen participants orparticipants that had terminated service and subsequently became re-employed on or afterJanuary 1, 2010, and (ii) active employees of FMC Technologies as of June 1, 2014 weretransferred from the U.S. Qualified Pension Plan to the FMC Technologies, Inc. FrozenRetirement Plan (“Frozen Plan”). Under the Frozen Plan, participants had the option to acceptcash or an annuity upon the Frozen Plan’s termination. In December 2014, settlement paymentswere made based on frozen participants’ elections and settlement costs were recorded during2014.
Foreign-based employees are eligible to participate in FMC Technologies-sponsored orgovernment-sponsored benefit plans to which we contribute. Several of the foreign definedbenefit pension plans sponsored by us provide for employee contributions; the remaining plansare noncontributory.
We have other post-retirement benefit plans covering substantially all of our U.S. employees whowere hired prior to January 1, 2003. The post-retirement health care plans are contributory; thepost-retirement life insurance plans are noncontributory.
We are required to recognize the funded status of defined benefit post-retirement plans as an assetor liability in the consolidated balance sheet and recognize changes in that funded status incomprehensive income in the year in which the changes occur. Further, we are required tomeasure the plan’s assets and its obligations that determine its funded status as of the date of theconsolidated balance sheet. We have applied this guidance to our domestic pension and otherpost-retirement benefit plans as well as for many of our non-U.S. plans, including those in theUnited Kingdom, Norway, Germany, France and Canada. Pension expense measured incompliance with GAAP for the other non-U.S. pension plans is not materially different from thelocally reported pension expense.The funded status of our U.S. Pension Plans, certain foreign pension plans and U.S. post-retirement health care and life insurance benefit plans, together with the associated balancesrecognized in our consolidated financial statements as of December 31, 2014 and 2013, were asfollows:
Pensions
OtherPost-retirement
Benefits
2014 2013 2014 2013
(In millions) U.S. Int’l U.S. Int’l
Accumulated benefit obligation $ 552.4 $ 406.3 $ 513.3 $ 360.1
Copyright © 2013 www.secdatabase.com. All Rights Reserved.Please Consider the Environment Before Printing This Document
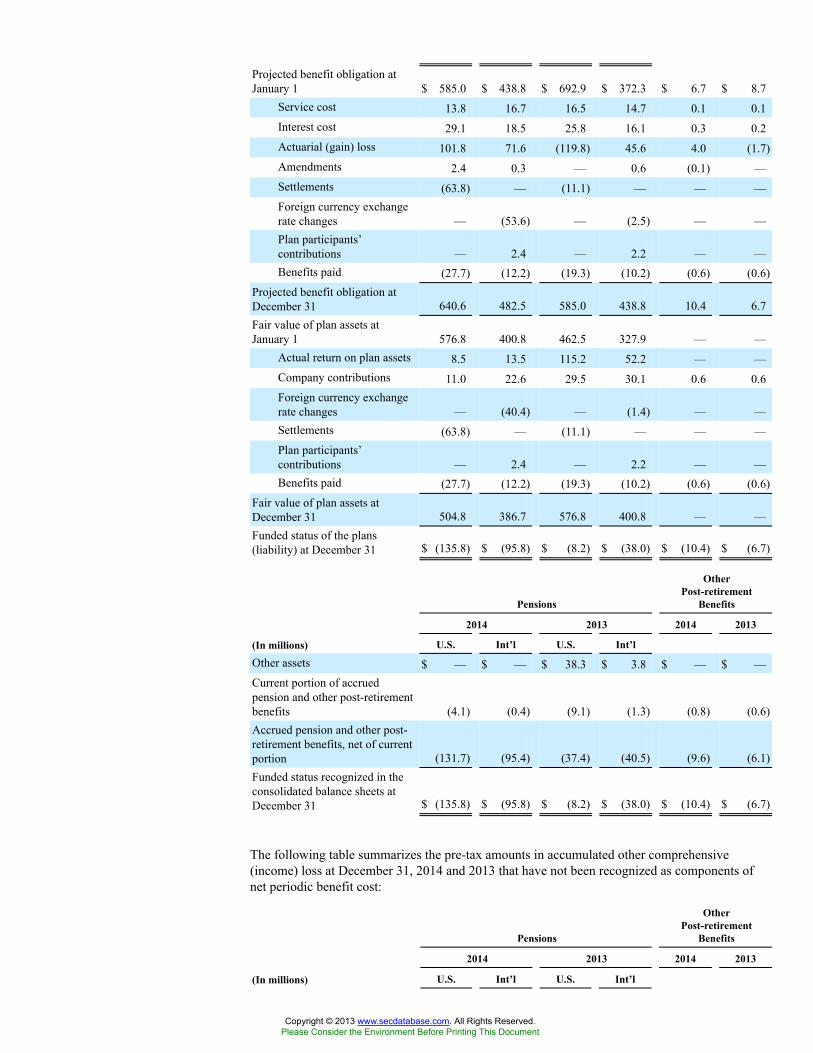
Projected benefit obligation atJanuary 1 $ 585.0 $ 438.8 $ 692.9 $ 372.3 $ 6.7 $ 8.7
Service cost 13.8 16.7 16.5 14.7 0.1 0.1Interest cost 29.1 18.5 25.8 16.1 0.3 0.2Actuarial (gain) loss 101.8 71.6 (119.8) 45.6 4.0 (1.7)Amendments 2.4 0.3 — 0.6 (0.1) —Settlements (63.8) — (11.1) — — —Foreign currency exchangerate changes — (53.6) — (2.5) — —Plan participants’contributions — 2.4 — 2.2 — —Benefits paid (27.7) (12.2) (19.3) (10.2) (0.6) (0.6)
Projected benefit obligation atDecember 31 640.6 482.5 585.0 438.8 10.4 6.7Fair value of plan assets atJanuary 1 576.8 400.8 462.5 327.9 — —
Actual return on plan assets 8.5 13.5 115.2 52.2 — —Company contributions 11.0 22.6 29.5 30.1 0.6 0.6Foreign currency exchangerate changes — (40.4) — (1.4) — —Settlements (63.8) — (11.1) — — —Plan participants’contributions — 2.4 — 2.2 — —Benefits paid (27.7) (12.2) (19.3) (10.2) (0.6) (0.6)
Fair value of plan assets atDecember 31 504.8 386.7 576.8 400.8 — —Funded status of the plans(liability) at December 31 $ (135.8) $ (95.8) $ (8.2) $ (38.0) $ (10.4) $ (6.7)
Pensions
OtherPost-retirement
Benefits
2014 2013 2014 2013
(In millions) U.S. Int’l U.S. Int’l
Other assets $ — $ — $ 38.3 $ 3.8 $ — $ —Current portion of accruedpension and other post-retirementbenefits (4.1) (0.4) (9.1) (1.3) (0.8) (0.6)Accrued pension and other post-retirement benefits, net of currentportion (131.7) (95.4) (37.4) (40.5) (9.6) (6.1)Funded status recognized in theconsolidated balance sheets atDecember 31 $ (135.8) $ (95.8) $ (8.2) $ (38.0) $ (10.4) $ (6.7)
The following table summarizes the pre-tax amounts in accumulated other comprehensive(income) loss at December 31, 2014 and 2013 that have not been recognized as components ofnet periodic benefit cost:
Pensions
OtherPost-retirement
Benefits
2014 2013 2014 2013
(In millions) U.S. Int’l U.S. Int’l
Copyright © 2013 www.secdatabase.com. All Rights Reserved.Please Consider the Environment Before Printing This Document

Pre-tax amounts recognized inaccumulated other comprehensive(income) loss:
Unrecognized actuarial(gain) loss $ 234.9 $ 187.8 $ 130.1 $ 113.6 $ 1.1 $ (3.2)Unrecognized prior service(credit) cost 0.2 1.3 0.1 1.5 (0.1) —Unrecognized transitionasset — (0.2) — (0.4) — —
Accumulated othercomprehensive (income) loss atDecember 31 $ 235.1 $ 188.9 $ 130.2 $ 114.7 $ 1.0 $ (3.2)
The following tables summarize the projected and accumulated benefit obligations and fair valuesof plan assets where the projected or accumulated benefit obligation exceeds the fair value of planassets at December 31, 2014 and 2013:
Pensions
OtherPost-retirement
Benefits
2014 2013 2014 2013
(In millions) U.S. Int’l U.S. Int’l
Plans with underfunded or non-funded projected benefitobligation:
Aggregate projected benefitobligation $ 640.6 $ 482.5 $ 46.4 $ 151.8 $ 10.4 $ 6.7Aggregate fair value of planassets $ 504.8 $ 386.7 $ — $ 110.1 $ — $ —
Pensions
OtherPost-retirement
Benefits
2014 2013 2014 2013
(In millions) U.S. Int’l U.S. Int’l
Plans with underfunded or non-funded accumulated benefitobligation:
Aggregate accumulatedbenefit obligation $ 552.4 $ 145.0 $ 36.2 $ 28.9Aggregate fair value of planassets $ 504.8 $ 103.1 $ — $ 9.0
The following table summarizes the components of net periodic benefit cost (income) for theyears ended December 31, 2014, 2013 and 2012:
PensionsOther Post-retirement
Benefits
2014 2013 2012 2014 2013 2012
(In millions) U.S. Int’l U.S. Int’l U.S. Int’l
Components ofnet periodicbenefit cost(income):
Service cost $ 13.8 $ 16.7 $ 16.5 $ 14.7 $ 14.6 $ 37.2 $ 0.1 $ 0.1 $ 0.1
Copyright © 2013 www.secdatabase.com. All Rights Reserved.Please Consider the Environment Before Printing This Document
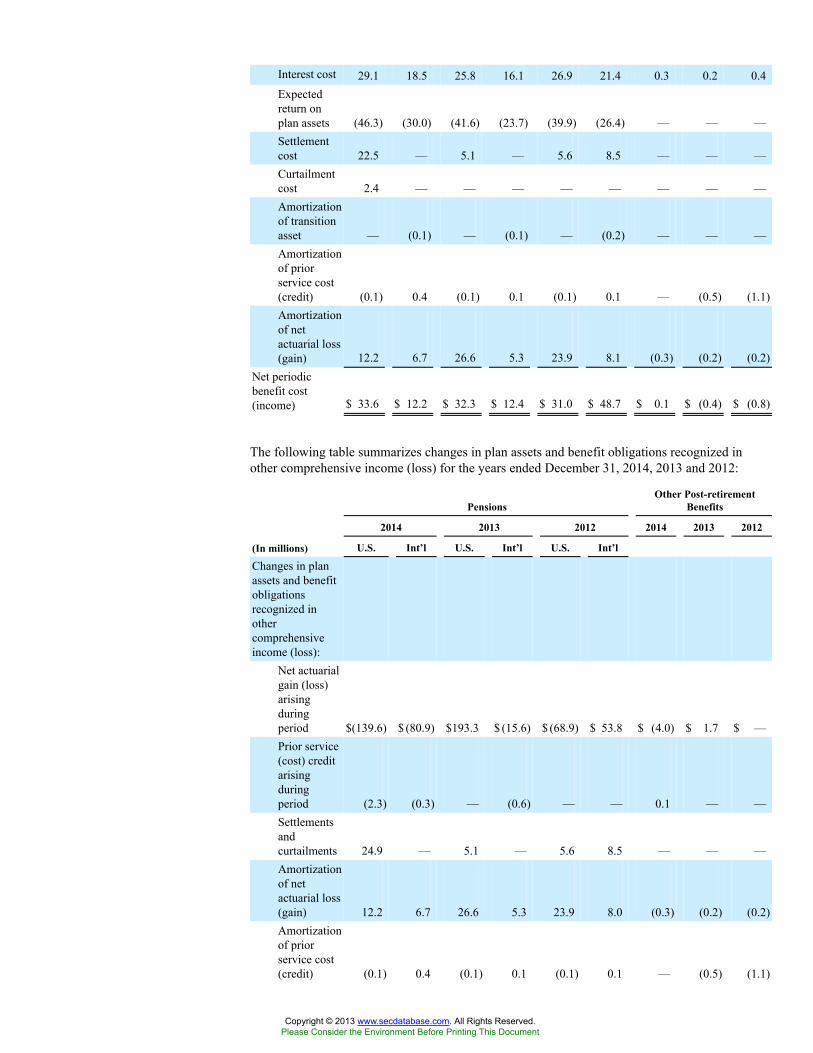
Interest cost 29.1 18.5 25.8 16.1 26.9 21.4 0.3 0.2 0.4Expectedreturn onplan assets (46.3) (30.0) (41.6) (23.7) (39.9) (26.4) — — —Settlementcost 22.5 — 5.1 — 5.6 8.5 — — —Curtailmentcost 2.4 — — — — — — — —Amortizationof transitionasset — (0.1) — (0.1) — (0.2) — — —Amortizationof priorservice cost(credit) (0.1) 0.4 (0.1) 0.1 (0.1) 0.1 — (0.5) (1.1)Amortizationof netactuarial loss(gain) 12.2 6.7 26.6 5.3 23.9 8.1 (0.3) (0.2) (0.2)
Net periodicbenefit cost(income) $ 33.6 $ 12.2 $ 32.3 $ 12.4 $ 31.0 $ 48.7 $ 0.1 $ (0.4) $ (0.8)
The following table summarizes changes in plan assets and benefit obligations recognized inother comprehensive income (loss) for the years ended December 31, 2014, 2013 and 2012:
PensionsOther Post-retirement
Benefits
2014 2013 2012 2014 2013 2012
(In millions) U.S. Int’l U.S. Int’l U.S. Int’l
Changes in planassets and benefitobligationsrecognized inothercomprehensiveincome (loss):
Net actuarialgain (loss)arisingduringperiod $(139.6) $ (80.9) $193.3 $ (15.6) $ (68.9) $ 53.8 $ (4.0) $ 1.7 $ —Prior service(cost) creditarisingduringperiod (2.3) (0.3) — (0.6) — — 0.1 — —Settlementsandcurtailments 24.9 — 5.1 — 5.6 8.5 — — —Amortizationof netactuarial loss(gain) 12.2 6.7 26.6 5.3 23.9 8.0 (0.3) (0.2) (0.2)Amortizationof priorservice cost(credit) (0.1) 0.4 (0.1) 0.1 (0.1) 0.1 — (0.5) (1.1)
Copyright © 2013 www.secdatabase.com. All Rights Reserved.Please Consider the Environment Before Printing This Document
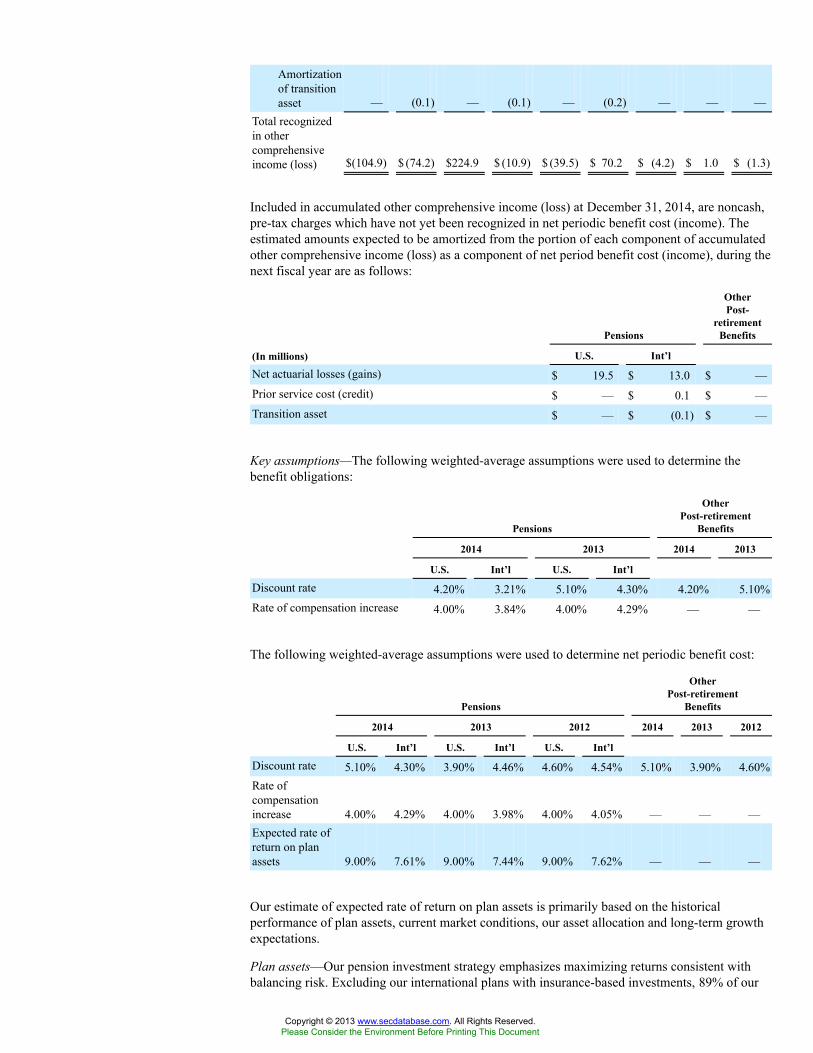
Amortizationof transitionasset — (0.1) — (0.1) — (0.2) — — —
Total recognizedin othercomprehensiveincome (loss) $(104.9) $ (74.2) $224.9 $ (10.9) $ (39.5) $ 70.2 $ (4.2) $ 1.0 $ (1.3)
Included in accumulated other comprehensive income (loss) at December 31, 2014, are noncash,pre-tax charges which have not yet been recognized in net periodic benefit cost (income). Theestimated amounts expected to be amortized from the portion of each component of accumulatedother comprehensive income (loss) as a component of net period benefit cost (income), during thenext fiscal year are as follows:
Pensions
OtherPost-
retirementBenefits
(In millions) U.S. Int’l
Net actuarial losses (gains) $ 19.5 $ 13.0 $ —Prior service cost (credit) $ — $ 0.1 $ —Transition asset $ — $ (0.1) $ —
Key assumptions—The following weighted-average assumptions were used to determine thebenefit obligations:
Pensions
OtherPost-retirement
Benefits
2014 2013 2014 2013
U.S. Int’l U.S. Int’l
Discount rate 4.20% 3.21% 5.10% 4.30% 4.20% 5.10%Rate of compensation increase 4.00% 3.84% 4.00% 4.29% — —
The following weighted-average assumptions were used to determine net periodic benefit cost:
Pensions
OtherPost-retirement
Benefits
2014 2013 2012 2014 2013 2012
U.S. Int’l U.S. Int’l U.S. Int’l
Discount rate 5.10% 4.30% 3.90% 4.46% 4.60% 4.54% 5.10% 3.90% 4.60%Rate ofcompensationincrease 4.00% 4.29% 4.00% 3.98% 4.00% 4.05% — — —Expected rate ofreturn on planassets 9.00% 7.61% 9.00% 7.44% 9.00% 7.62% — — —
Our estimate of expected rate of return on plan assets is primarily based on the historicalperformance of plan assets, current market conditions, our asset allocation and long-term growthexpectations.
Plan assets—Our pension investment strategy emphasizes maximizing returns consistent withbalancing risk. Excluding our international plans with insurance-based investments, 89% of our
Copyright © 2013 www.secdatabase.com. All Rights Reserved.Please Consider the Environment Before Printing This Document
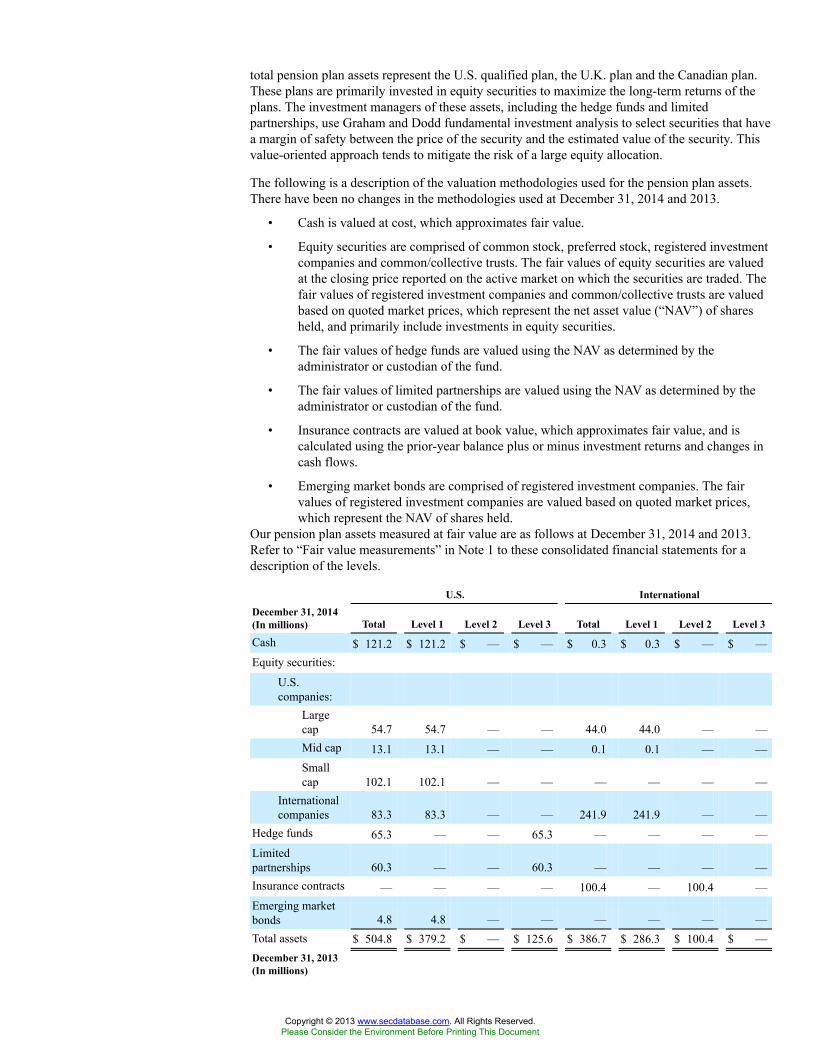
total pension plan assets represent the U.S. qualified plan, the U.K. plan and the Canadian plan.These plans are primarily invested in equity securities to maximize the long-term returns of theplans. The investment managers of these assets, including the hedge funds and limitedpartnerships, use Graham and Dodd fundamental investment analysis to select securities that havea margin of safety between the price of the security and the estimated value of the security. Thisvalue-oriented approach tends to mitigate the risk of a large equity allocation.
The following is a description of the valuation methodologies used for the pension plan assets.There have been no changes in the methodologies used at December 31, 2014 and 2013.
• Cash is valued at cost, which approximates fair value.
• Equity securities are comprised of common stock, preferred stock, registered investmentcompanies and common/collective trusts. The fair values of equity securities are valuedat the closing price reported on the active market on which the securities are traded. Thefair values of registered investment companies and common/collective trusts are valuedbased on quoted market prices, which represent the net asset value (“NAV”) of sharesheld, and primarily include investments in equity securities.
• The fair values of hedge funds are valued using the NAV as determined by theadministrator or custodian of the fund.
• The fair values of limited partnerships are valued using the NAV as determined by theadministrator or custodian of the fund.
• Insurance contracts are valued at book value, which approximates fair value, and iscalculated using the prior-year balance plus or minus investment returns and changes incash flows.
• Emerging market bonds are comprised of registered investment companies. The fairvalues of registered investment companies are valued based on quoted market prices,which represent the NAV of shares held.
Our pension plan assets measured at fair value are as follows at December 31, 2014 and 2013.Refer to “Fair value measurements” in Note 1 to these consolidated financial statements for adescription of the levels.
U.S. InternationalDecember 31, 2014(In millions) Total Level 1 Level 2 Level 3 Total Level 1 Level 2 Level 3
Cash $ 121.2 $ 121.2 $ — $ — $ 0.3 $ 0.3 $ — $ —Equity securities:
U.S.companies:
Largecap 54.7 54.7 — — 44.0 44.0 — —Mid cap 13.1 13.1 — — 0.1 0.1 — —Smallcap 102.1 102.1 — — — — — —
Internationalcompanies 83.3 83.3 — — 241.9 241.9 — —
Hedge funds 65.3 — — 65.3 — — — —Limitedpartnerships 60.3 — — 60.3 — — — —Insurance contracts — — — — 100.4 — 100.4 —Emerging marketbonds 4.8 4.8 — — — — — —Total assets $ 504.8 $ 379.2 $ — $ 125.6 $ 386.7 $ 286.3 $ 100.4 $ —December 31, 2013(In millions)
Copyright © 2013 www.secdatabase.com. All Rights Reserved.Please Consider the Environment Before Printing This Document
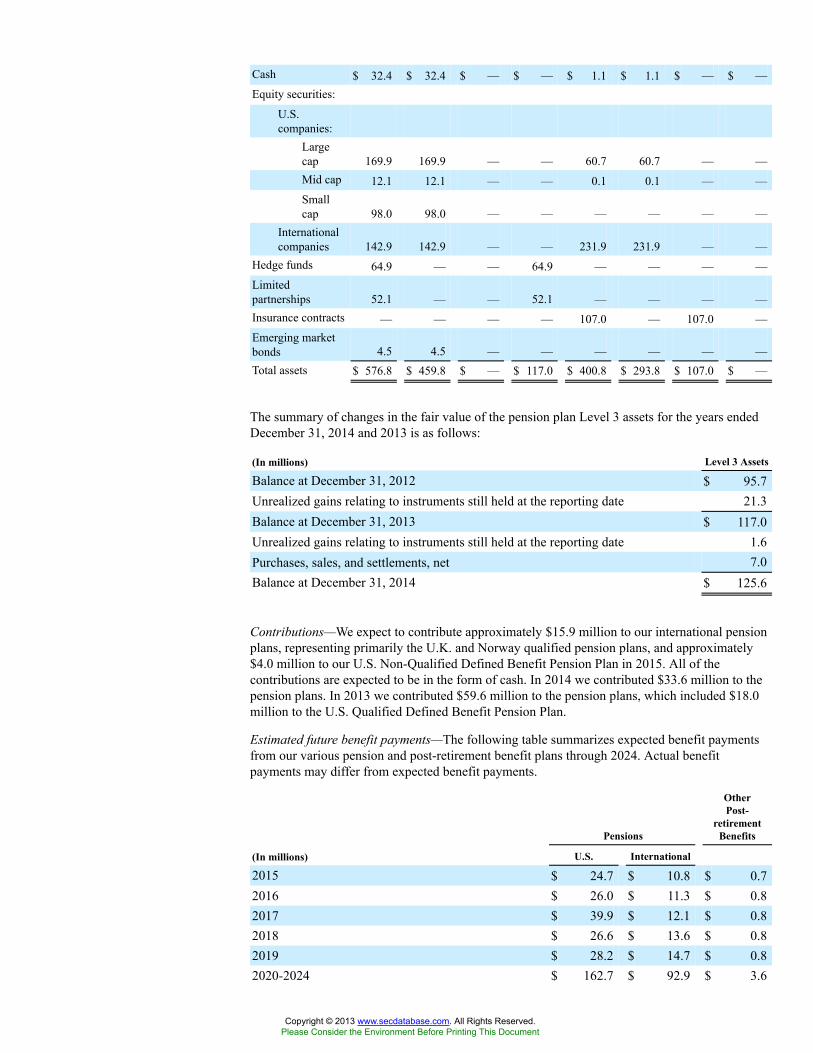
Cash $ 32.4 $ 32.4 $ — $ — $ 1.1 $ 1.1 $ — $ —Equity securities:
U.S.companies:
Largecap 169.9 169.9 — — 60.7 60.7 — —Mid cap 12.1 12.1 — — 0.1 0.1 — —Smallcap 98.0 98.0 — — — — — —
Internationalcompanies 142.9 142.9 — — 231.9 231.9 — —
Hedge funds 64.9 — — 64.9 — — — —Limitedpartnerships 52.1 — — 52.1 — — — —Insurance contracts — — — — 107.0 — 107.0 —Emerging marketbonds 4.5 4.5 — — — — — —Total assets $ 576.8 $ 459.8 $ — $ 117.0 $ 400.8 $ 293.8 $ 107.0 $ —
The summary of changes in the fair value of the pension plan Level 3 assets for the years endedDecember 31, 2014 and 2013 is as follows:
(In millions) Level 3 Assets
Balance at December 31, 2012 $ 95.7Unrealized gains relating to instruments still held at the reporting date 21.3Balance at December 31, 2013 $ 117.0Unrealized gains relating to instruments still held at the reporting date 1.6Purchases, sales, and settlements, net 7.0Balance at December 31, 2014 $ 125.6
Contributions—We expect to contribute approximately $15.9 million to our international pensionplans, representing primarily the U.K. and Norway qualified pension plans, and approximately$4.0 million to our U.S. Non-Qualified Defined Benefit Pension Plan in 2015. All of thecontributions are expected to be in the form of cash. In 2014 we contributed $33.6 million to thepension plans. In 2013 we contributed $59.6 million to the pension plans, which included $18.0million to the U.S. Qualified Defined Benefit Pension Plan.
Estimated future benefit payments—The following table summarizes expected benefit paymentsfrom our various pension and post-retirement benefit plans through 2024. Actual benefitpayments may differ from expected benefit payments.
Pensions
OtherPost-
retirementBenefits
(In millions) U.S. International
2015 $ 24.7 $ 10.8 $ 0.72016 $ 26.0 $ 11.3 $ 0.82017 $ 39.9 $ 12.1 $ 0.82018 $ 26.6 $ 13.6 $ 0.82019 $ 28.2 $ 14.7 $ 0.82020-2024 $ 162.7 $ 92.9 $ 3.6
Copyright © 2013 www.secdatabase.com. All Rights Reserved.Please Consider the Environment Before Printing This Document
Savings plans—The FMC Technologies, Inc. Savings and Investment Plan (“Qualified Plan”), aqualified salary reduction plan under Section 401(k) of the Internal Revenue Code, is a definedcontribution plan. Additionally, we have a non-qualified deferred compensation plan, the Non-Qualified Plan, which allows certain highly compensated employees the option to defer thereceipt of a portion of their salary. We match a portion of the participants’ deferrals to both plans.In October 2009, the Board of Directors approved amendments to the U.S. Qualified Plan andNon-Qualified Plan (“Amended Plans”). Under the Amended Plans, we are required to make anonelective contribution every pay period to all new nonunion employees hired on or afterJanuary 1, 2010, and current nonunion employees with less than five years of vesting service asof December 31, 2009. Nonelective contributions under the Amended Plans vest with three yearsof service with FMC Technologies.
Participants in the Non-Qualified Plan earn a return based on hypothetical investments in thesame options as our 401(k) plan, including FMC Technologies stock. Changes in the marketvalue of these participant investments are reflected as an adjustment to the deferred compensationliability with an offset to other income (expense), net. As of both December 31, 2014 and 2013,our liability for the Non-Qualified Plan was $38.5 million and was recorded in other non-currentliabilities. We hedge the financial impact of changes in the participants’ hypothetical investmentsby purchasing the investments that the participants have chosen. With the exception of FMCTechnologies stock, which is maintained at its cost basis, changes in the fair value of theseinvestments are recognized as an offset to other income (expense), net. As of December 31, 2014and 2013, we had investments for the Non-Qualified Plan totaling $30.7 million and $29.1million, respectively, at fair market value and FMC Technologies stock held in trust of $8.0million and $7.7 million, respectively, at its cost basis. Refer to Note 16 to these consolidatedfinancial statements for fair value disclosure of the Non-Qualified Plan investments.
We recognized expense of $28.4 million, $23.5 million and $18.4 million, for matchingcontributions to these plans in 2014, 2013 and 2012, respectively. Additionally, we recognizedexpense of $18.9 million, $16.2 million and $11.8 million for nonelective contributions in 2014,2013 and 2012, respectively.
Copyright © 2013 www.secdatabase.com. All Rights Reserved.Please Consider the Environment Before Printing This Document
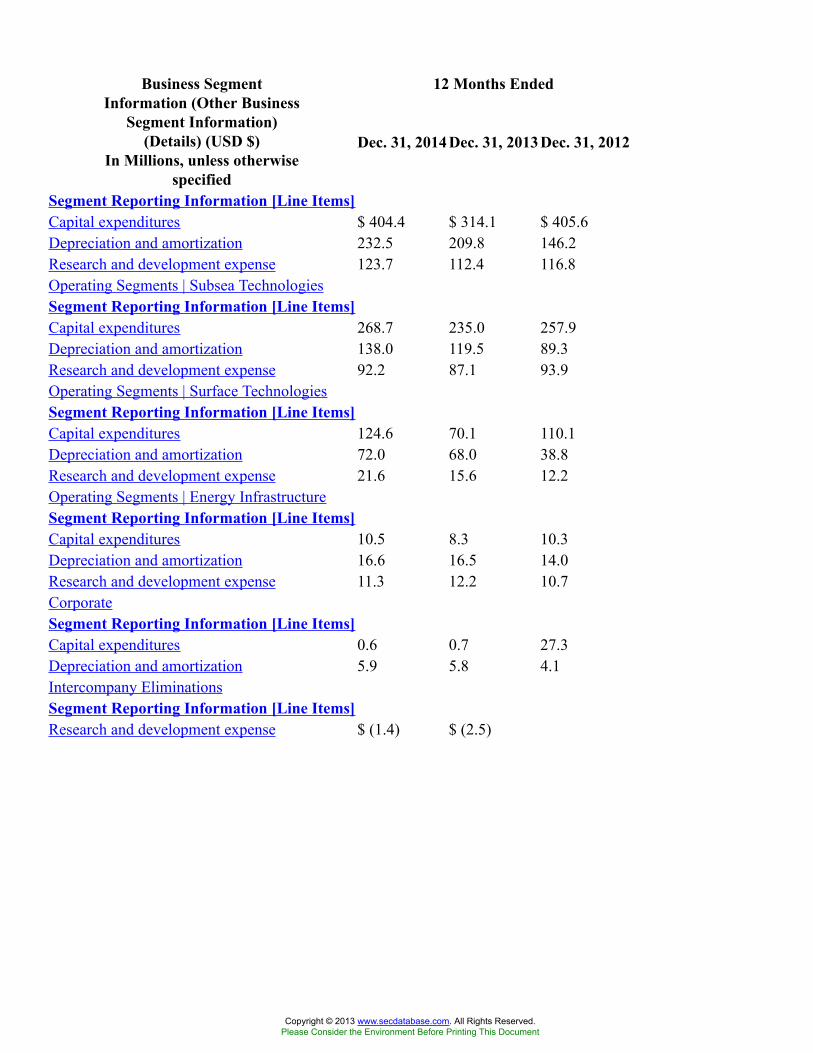
12 Months EndedBusiness SegmentInformation (Other Business
Segment Information)(Details) (USD $)
In Millions, unless otherwisespecified
Dec. 31, 2014 Dec. 31, 2013 Dec. 31, 2012
Segment Reporting Information [Line Items]Capital expenditures $ 404.4 $ 314.1 $ 405.6Depreciation and amortization 232.5 209.8 146.2Research and development expense 123.7 112.4 116.8Operating Segments | Subsea TechnologiesSegment Reporting Information [Line Items]Capital expenditures 268.7 235.0 257.9Depreciation and amortization 138.0 119.5 89.3Research and development expense 92.2 87.1 93.9Operating Segments | Surface TechnologiesSegment Reporting Information [Line Items]Capital expenditures 124.6 70.1 110.1Depreciation and amortization 72.0 68.0 38.8Research and development expense 21.6 15.6 12.2Operating Segments | Energy InfrastructureSegment Reporting Information [Line Items]Capital expenditures 10.5 8.3 10.3Depreciation and amortization 16.6 16.5 14.0Research and development expense 11.3 12.2 10.7CorporateSegment Reporting Information [Line Items]Capital expenditures 0.6 0.7 27.3Depreciation and amortization 5.9 5.8 4.1Intercompany EliminationsSegment Reporting Information [Line Items]Research and development expense $ (1.4) $ (2.5)
Copyright © 2013 www.secdatabase.com. All Rights Reserved.Please Consider the Environment Before Printing This Document