fmcg sector a step ahead - dhanlaxmi bank · which slashed prices in its laundry brands last year...
TRANSCRIPT

August 30, 2011
August 30, 2011
Highlights
Sector Showcases Pricing Prowess
Healthy Volume Growth Q1FY12 EBITDA Margin Decline Contained
Unabated Raw Material Price Hikes
FMCG Sector – A Step Ahead

August 30, 2011
FMCG Sector—A Step Ahead
The consumer goods or the FMCG sector has shown its
strong character for the June quarter indicating the under-
lying strength in domestic consumption story and the ad-
vantage the sector enjoys over similar consumption-led
sectors.
While the consumption-led sectors like auto and con-
sumer durables have been hit by high input cost, lower
demand, rising interest rates and inflation, the FMCG
companies have been able to hold their fort for the time
being.
The auto and consumer durables sector in a bid to propel
sales have resorted to higher discounts, freebies and at-
tractive finance schemes which has led to higher costs and
lower margins for these companies. The competitive envi-
ronment is doing no good to them as the players are losing
their pricing power rapidly in a bid to garner a higher
market share.
The FMCG companies on the other hand have been able
to pass on some of the rise in costs to the consumer. It is
commendable to see that even after a series of price hikes
throughout past 12 months, the consumer demand has
remained strong and most companies have recorded high
volume growth as the demand for FMCG products is
relatively price inelastic.
Hindustan Unilever Ltd (HUL), Colgate, Marico and ITC
have been successful in passing on the cost pressures in
the form of price hikes during the quarter, especially in
their flagship brands.
Companies like Britannia and ITC have also been able to
hike prices in the highly penetrated and intensely com-
petitive categories such as biscuits, soaps and detergents
where the market leaders have relatively low pricing
power.
The companies have hiked prices in the current quarter as well (Q2FY12) because of persistent raw material pressures. For instance, ITC
has hiked its cigarette prices by 10% and HUL has increased prices in the soaps (Pears) and detergent bars segment (Rin) by 7%. P&G,
which slashed prices in its laundry brands last year to start a price war, too has increased the price of Tide detergent by 5% in the first
week of August.
In the foods segment, while Amul has increased prices of milk by 4%, GSK Consumer and Nestle have hiked the prices of their milk
products, by 3-4%. Nestle has also raised chocolate prices by around 7% (Kitkat).
The average price of biscuits since the beginning of this fiscal year has increased by 4%. In fact, the hike has been taken in the month of
August 2011.
Y-o-Y Growth EBITDA Margin
Volume Price Sales
Company Q1FY12 Q1FY12 Q1FY11 Q4FY11
Britannia 11% 10% 21% 4.7% 4.8% 6.2%
Colgate 12% 2% 14% 21.5% 29.1% 24.0%
Dabur India 9% 22% 31% 14.3% 15.5% 18.5%
Emami 18% 6% 24% 13.5% 16.7% 15.2%
GSK Consumer 15% 7% 22% 17.7% 18.9% 22.4%
Godrej Consumer N/A N/A 20% 16.3% 19.3% 20.0%
HUL 10% 5% 14% 13.4% 13.9% 13.0%
ITC 9% 12% 21% 33.7% 33.8% 32.1%
Marico 14% 19% 33% 11.9% 13.4% 10.5%
Nestle India 10% 10% 20% 19.4% 19.8% 21.1%
95
100
105
110
115
120
125
130
135
140
Jan
-10
Fe
b-1
0
Ma
r-1
0
Ap
r-1
0
Ma
y-1
0
Jun
-10
Jul-
10
Au
g-1
0
Se
p-1
0
Oct
-10
No
v-1
0
De
c-1
0
Jan
-11
Fe
b-1
1
Ma
r-1
1
Ap
r-1
1
Ma
y-1
1
Jun
-11
Jul-
11
Au
g-1
1
Ind
exe
d
Pricing Power Across Categories
Amul Gold Milk Bread BiscuitsSoaps Detergent Powder Detergent BarUtensil Cleaner
August 30, 2011
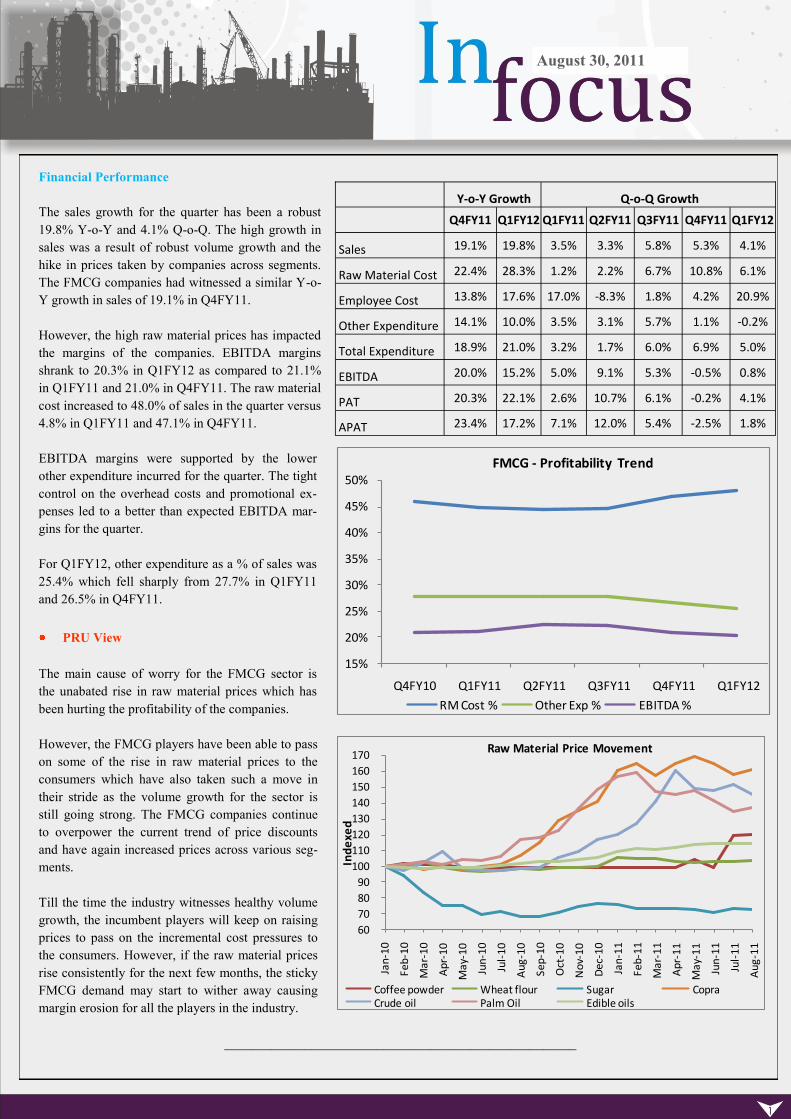
Financial Performance
The sales growth for the quarter has been a robust
19.8% Y-o-Y and 4.1% Q-o-Q. The high growth in
sales was a result of robust volume growth and the
hike in prices taken by companies across segments.
The FMCG companies had witnessed a similar Y-o-
Y growth in sales of 19.1% in Q4FY11.
However, the high raw material prices has impacted
the margins of the companies. EBITDA margins
shrank to 20.3% in Q1FY12 as compared to 21.1%
in Q1FY11 and 21.0% in Q4FY11. The raw material
cost increased to 48.0% of sales in the quarter versus
4.8% in Q1FY11 and 47.1% in Q4FY11.
EBITDA margins were supported by the lower
other expenditure incurred for the quarter. The tight
control on the overhead costs and promotional ex-
penses led to a better than expected EBITDA mar-
gins for the quarter.
For Q1FY12, other expenditure as a % of sales was
25.4% which fell sharply from 27.7% in Q1FY11
and 26.5% in Q4FY11.
PRU View
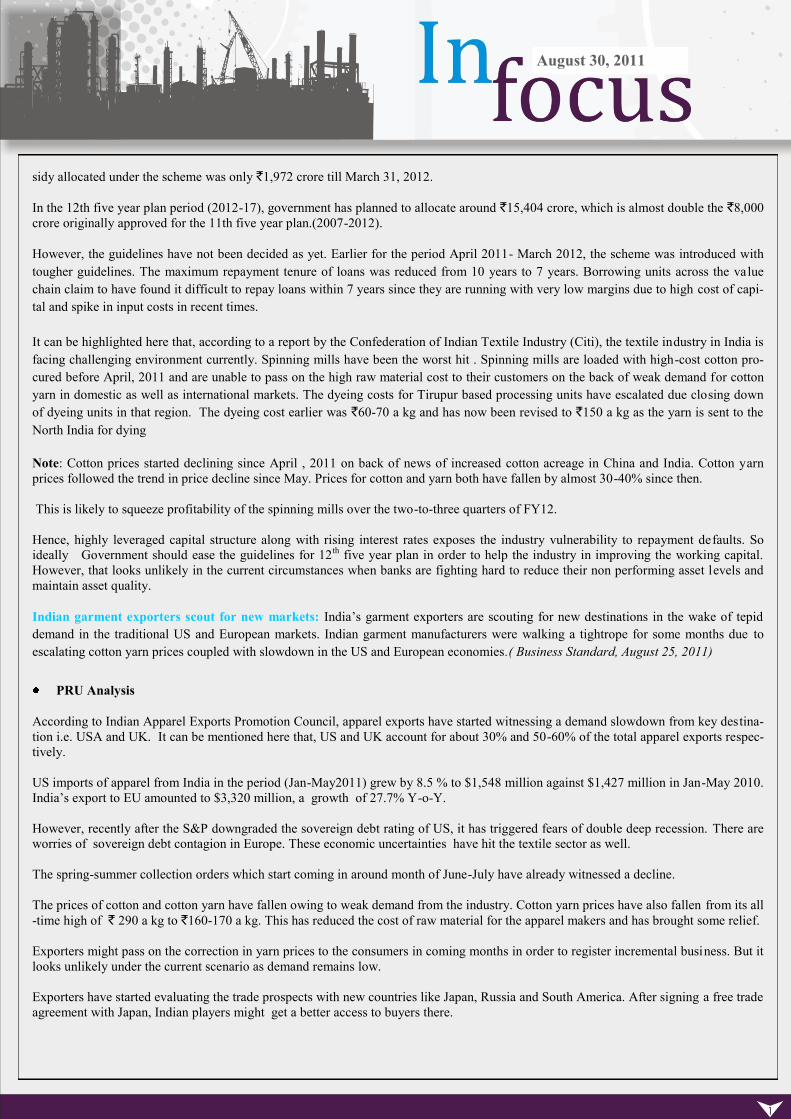
The main cause of worry for the FMCG sector is
the unabated rise in raw material prices which has
been hurting the profitability of the companies.
However, the FMCG players have been able to pass
on some of the rise in raw material prices to the
consumers which have also taken such a move in
their stride as the volume growth for the sector is
still going strong. The FMCG companies continue
to overpower the current trend of price discounts
and have again increased prices across various seg-
ments.
Till the time the industry witnesses healthy volume
growth, the incumbent players will keep on raising
prices to pass on the incremental cost pressures to
the consumers. However, if the raw material prices
rise consistently for the next few months, the sticky
FMCG demand may start to wither away causing
margin erosion for all the players in the industry.
_____________________________________________________
15%
20%
25%
30%
35%
40%
45%
50%
Q4FY10 Q1FY11 Q2FY11 Q3FY11 Q4FY11 Q1FY12
FMCG - Profitability Trend
RM Cost % Other Exp % EBITDA %
Y-o-Y Growth Q-o-Q Growth
Q4FY11 Q1FY12 Q1FY11 Q2FY11 Q3FY11 Q4FY11 Q1FY12
Sales 19.1% 19.8% 3.5% 3.3% 5.8% 5.3% 4.1%
Raw Material Cost 22.4% 28.3% 1.2% 2.2% 6.7% 10.8% 6.1%
Employee Cost 13.8% 17.6% 17.0% -8.3% 1.8% 4.2% 20.9%
Other Expenditure 14.1% 10.0% 3.5% 3.1% 5.7% 1.1% -0.2%
Total Expenditure 18.9% 21.0% 3.2% 1.7% 6.0% 6.9% 5.0%
EBITDA 20.0% 15.2% 5.0% 9.1% 5.3% -0.5% 0.8%
PAT 20.3% 22.1% 2.6% 10.7% 6.1% -0.2% 4.1%
APAT 23.4% 17.2% 7.1% 12.0% 5.4% -2.5% 1.8%
60
70
80
90
100
110
120
130
140
150
160
170
Jan
-10
Fe
b-1
0
Ma
r-1
0
Ap
r-1
0
Ma
y-1
0
Jun
-10
Jul-
10
Au
g-1
0
Se
p-1
0
Oct
-10
No
v-1
0
De
c-1
0
Jan
-11
Fe
b-1
1
Ma
r-1
1
Ap
r-1
1
Ma
y-1
1
Jun
-11
Jul-
11
Au
g-1
1
Ind
exe
d
Raw Material Price Movement
Coffee powder Wheat flour Sugar CopraCrude oil Palm Oil Edible oils

August 30, 2011
High Hopes For Commercial Vehicles?
Commercial Vehicles Market Set to Register 14% Growth During 2011-12: Commercial vehicles (CVs) segment in the country is
expected to register 13.6% growth during FY12, according to latest analysis of the automotive and transportation sector by leading
growth consulting company Frost & Sullivan. (The Economic Times, August 29, 2011)
PRU Analysis
The CV sector has grown by 16.6% Y-o-Y from April—July this fiscal on the back of high growth witnessed in the Light Commercial
Vehicles (LCVs) segment.
The LCV segment now constitutes more than 50% of the volumes in the CV segment. LCVs has grown by an impressive 25.8% in the
current fiscal despite various headwinds building up like high interest rates and overall slowing down of economy. The goods carrier
segment which accounts for around 45% of the volumes in CVs and 85-90% in LCVs has grown by 30.4%. The sub one tonne goods
segment (accounts for over 75% of the total volumes in LCVs) is supporting the growth driven by demand for transportation of con-
sumer goods within cities, migration from upper-end three wheelers and greater penetration in tier II & III cities.
The growth in medium and heavy commercial vehicles segment (M&HCVs) has
not been very encouraging, The M&HCVs sales growth has slowed down to by
6.4% this fiscal largely due to the disappointing performance of buses which has
witnessed a decline of 2.8%. The trucks have grown by a decent 8.2% largely due
to high volumes in the lower tonnage trucks. However, the volume growth in the
high tonnage M&HCVs has declined considerably and will likely impact the overall
growth of the segment.
Since the beginning of CY11, the M&HCV manufacturers have taken successive
price increases to pass on the impact of emission norms changes and increase in
commodity prices. This has led to a rise in the overall cost of ownership for fleet
owners. The rising diesel prices have also impacted the operating economics, as it
forms a major part of a freight operators’ cost structure.
In addition to this, lower demand from construction segment, the mining ban in some regions, rising interest rates and slowing indus-
trial output coupled with high-base effect of previous years has also affected overall demand.
April - July FY11 FY12 Y-o-Y
CVs 202202 235766 16.6%
M&HCVs 95985 102130 6.4%
Bus 15523 15084 -2.8%
Truck 80462 87046 8.2%
LCVs 106217 133636 25.8%
Passenger carrier 17043 17319 1.6%
Goods carrier 89174 116317 30.4%
-30%
-20%
-10%
0%
10%
20%
30%
40%
Oct
-10
No
v-1
0
De
c-1
0
Jan
-11
Fe
b-1
1
Ma
r-1
1
Ap
r-1
1
Ma
y-1
1
Jun
-11
Jul-
11
Sales Growth Trend
LCVs Passenger carrier Goods carrier
0%
3%
6%
9%
12%
-30%
-20%
-10%
0%
10%
20%
30%
Oct
-10
No
v-1
0
De
c-1
0
Jan
-11
Fe
b-1
1
Ma
r-1
1
Ap
r-1
1
Ma
y-1
1
Jun
-11
Jul-
11
Sales Growth Trend
M&HCVs Bus Truck IIP (RHS)

August 30, 2011
PRU View
In the current scenario, we are expecting a moderation in the CV sector growth for FY12. The high fuel prices, slowdown in economic
activity and rising interest rates will impact the M&HCVs and LCVs alike. While the LCVs will continue to see robust growth, the pace
of growth is likely to slow down in future. The M&HCV segment is expected to be more vulnerable to slowdown and is likely to experi-
ence much lower growth.
With global and local macro looking weak, we may witness a single digit growth for the entire CV sector for the current fiscal.
Consumer Durables In Hope Of A Better Show
LG India, Samsung, Godrej Appliances, Whirlpool hope festive season will spur growth: After a sluggish first half, consumer dura-
ble makers are now looking to ramp up growth during the upcoming festive season. (The Economic Times, August 25, 2011)
PRU Analysis
The consumer durables sector is passing through an interesting phase; whilst there is significant growth opportunities due to low pene-
tration levels in India, the rise in competition along with cost push factors are restraining the high profits that the industry players once
had hoped for.
We believe the sector is likely to maintain its double digit sales growth momentum in medium term but there may be a few obstacles to
overcome before the companies start improving their profitability.
Although the rising income levels will help keep the growth momentum, the current high interest rate scenario is likely to curb the
pace of growth. RBI hiked interest rates on July 26, 2011 for the eleventh time since March 2010; and with no end in sight for the
tightening measures, the disposable income may shrink for the consumer and may even lead to a change in consumption patterns.
With so many brands cropping up and many companies joining the bandwagon, the consumer durables industry is witnessing cut
throat competition today. This has led to higher ad spends and lesser pricing power which is hurting the margins and will continue
to impact profitability in future.
The raw material costs are also a concern as prices of various commodities like natural rubber, plastics, metals and polymers, etc
have been rising steadily which constitute as key raw materials to manufacture various consumer and electronic items.
The consumer durables industry in Q1FY12 has wit-
nessed a tepid sales growth of 7.9% Y-o-Y. Total expen-
diture increased by 8.5% Y-o-Y primarily due to a
12.3% growth in other expenditure as a result of the at-
tractive schemes offered by the companies. As a result,
other expenses constituted 16.2% of sales as compared
to 15.6% in Q1FY11. EBITDA margins consequently
declined from 12.2% in Q1FY11 to 11.7% in Q1FY12.
A high Y-o-Y growth of 30.6% in the interest cost led to
a 13.3% decline in PBT. High cost of interest was possi-
bly because of an increase in working capital and high
interest rates as the industry players offered attractive
finance options.
Adjusted PAT declined by 14.6% for the quarter.

August 30, 2011
PRU View
The consumer durables industry has over the years transformed
itself from a ‘high margin low volume’ business to a ‘low margin
high volume’ business.
The latest production data available on air conditioners (ACs), re-
frigerator and color television (TV) indicate a slowdown in demand
due to high interest rates as large part of total sales happen on
credit. For H1CY11, the refrigerator and TV production has wit-
nessed a Y-o-Y decline of 2% & 4% respectively. The ACs produc-
tion has been robust at 21% in the first half this year.
Broadly, a downward trend in the growth can be observed for the
three electronic items from the chart.
In times of high inflation, fierce competition, poor pricing power and high interest rate scenario, the industry has pinned very high
hopes on the upcoming festival season. However, at best this festival season may just be able to offer some sales growth as has always
been the case (Festival season generally brings home 20-30% of yearly revenues for these companies) with no up-tick in profitability.
Freight Movement: Needs A Faster Push
Two stretches of freight corridor project to start operations by 2012 end: Two stretches of the dedicated freight corridor project are
expected to commence operations by the end of 2014, two years ahead of schedule. The `77,000-crore dedicated freight corridor project
will build new tracks to transport containers and goods at speeds up to 100 km per hour, reducing travel time by a third, and creating one
of the world's largest and freight operations built with the latest technology. (ET Bureau, 29 August, 2011)
PRU Analysis
The Indian Railways constitute a critical component of India’s transport network, both for passenger as well as freight services. Rail-
ways are cost effective and also environment friendly. Yet, capacity and efficiency constraints in the freight segment have, over the
years, led to a significant shift from railways to road
transport.
Increase in traffic movement demands rapid expansion
of rail network in the country. A proposal to set up
dedicated freight corridors was initiated by the govern-
ment several years ago. Dedicated Freight Corridor
Corporation of India (DFCCIL) --a special purpose
vehicle has been set up under the administrative con-
trol of Ministry of Railways to undertake planning &
development, mobilisation of financial resources and
construction, maintenance & operation of the dedicated
freight corridors.
A roadmap for the construction and operation of the
dedicated freight corridors is set by the ministry. These
corridors would be constructed, operated and main-
tained by a corporate entity on commercial principles.
The proposed corporate entity would provide the rail

August 30, 2011
infrastructure, but would not engage itself in freight business, thus providing non-discriminatory track access on payment of haulage
charges by train operators.
The dedicated freight corridors proposed will connect north India with Mumbai and West Bengal. The Eastern freight corridor would
ease movement of coal and other commodities to north India. The corridor between Delhi and Mumbai will be developed with a series
of industrial parks, airports, power plants and new townships. The Delhi-Mumbai route would facilitate container movement. Also,
busy ports such as Kandla, Pipavav and Mundra would benefit from the western corridor.
The railways have tied up with Japanese lending agency JICA for `30,000 crore for the development of 1,490-km western corridor
stretching from Dadri in Haryana to Jawaharlal Nehru Port Trust. The World Bank is expected to lend about $2.4 billion for the 1,800-
km eastern corridor that would connect Ludhiana in Punjab to Dankuni in West Bengal.
The only area of concern is acquisition of land, requirement of which is estimated at around 11,000 hectares. As on December 2010,
only 2,509 hectares was acquired. This may result in delays which may eventually raise the project cost from `77,000 crore that was
initially estimated.
Private Port Infrastructure: On A Firm Ground
India to seek funds to build ports costing $7.6 billion to ease congestion: India will seek private funds for seven new ports costing
350 billion rupees ($7.6 billion) as the government tackles transport bottlenecks that are hindering plans to triple exports of agricultural
and manufactured goods. (Bloomberg, August 24, 2011)
PRU Analysis
The 13 major ports in India handle about 600 million tonnes of cargo. The government plans to boost the major ports’ annual capacity to
1.46 billion tonnes by March 2020.
The average turnaround time for ships at Indian ports was about 4.4 days
in the year ended in March 2010, compared with about six hours in Singa-
pore and Hong Kong.
India plans to triple its exports of gems and jewelry, textiles, auto parts
and other goods to $750 billion by March 2017 from $225 billion last
year. The development of another seven ports will aid this ambition.
While the development of ports in India has been slow, private port opera-
tors have better operational performance than their public sector counter-
parts.
The table appended shows that private ports in India outperformed overall
cargo growth during the June 2011 quarter. The private port companies
include Mundra Port & SEZ, Essar Ports, Gujarat Pipavav Ports and Marg.
Traffic growth at these four ports registered a 20% year-on-year growth in
traffic compared to 5% growth registered by major ports in India. This is
mainly driven by 29% growth in container cargo movement.
These ports registered higher realisations on account of a sharp increase in traffic and improvement in cargo-mix with higher composi-
tion of container traffic. Thus, private sector participation is expected to boost both international and domestic trade with better profit
margins.
Cargo Traffic Movement in June 2011 quarter (in million tonnes)
Bulk Con-tainer Total
Mundra 10.9 4.1 15.1
% y-o-y growth 17% 21% 20%
Essar 11.2 0 11.2
% y-o-y growth 14% 14%
Pipavav 1.4 1.7 3
% y-o-y growth 56% 55% 50%
Marg 1.5 0 1.5
% y-o-y growth 25% 25%
Private ports (total of above) 25 5.8 30.8
% y-o-y growth 18% 29% 20%
Major ports 122.2 24.4 146.6
% y-o-y growth 6% 3% 5%

August 30, 2011
Hydro Power: Not Flowing Enough
Only 4,710 mw hydro capacity commissioned so far in 11th Plan:
A hydro capacity of 4,710 mw has been commissioned so far, as against the mid-term review target of 8,237 mw for the 11th Plan. An-
other hydro capacity of 1,491 mw is likely to be commissioned during the remaining current financial year. (PIB, August 26, 2011)
PRU Analysis
While the power ministry has been boasting about recording the highest
power capacity in any plan period so far, the figures look tiny when com-
pared to the original target set for the period.
The ministry is expecting hydro power capacity addition of 6,201 mw in
2007-12. This is less than half of 15,627 mw target set initially. In fact, it
is also 25% lower than the revised target set during the mid-term review
of the plan.
Major reasons for the delay in commissioning of hydro projects include:
Delay in forest clearance
Delay in land acquisition
Resettlement & rehabilitation problems
Given that availability of coal is increasingly becoming difficult and
costly, stress needs to be laid on development of renewable sources of
power, particularly hydro.
It is historically seen that power deficit in India contracts during the
monsoon months each year. From the demand side, one reason is lower demand from agriculture due to natural availability of water and
second is slower industrial activity. On the supply side, a good monsoon enables higher generation. Also, increase in water levels at ma-
jor reservoirs pushes generation in the remaining months of the year. While the cost of setting up hydro unit is higher than thermal unit,
generation cost in case of hydro power is lower compared to thermal. Hence, its rapid development has become essential.
Iron Ore Mining Banned In Karnataka
SC extends iron ore mining ban to Tumkur, Chitradurga districts: The blanket iron ore mining ban imposed in Karnataka’s Bellary
district one month ago was extended to Tumkur and Chitradurga districts by the Supreme Court (SC) on Friday.(Mint, August 27, 2011)
PRU Analysis
In a recent development, Supreme Court of India has ordered suspension of all mining activities in Tumkur and Chitradurga districts of
Karnataka on grounds of environmental degradation. It can be highlighted here that on July 29, 2011 court had imposed a complete ban
on iron ore mining in Bellary district of the same state. The order had affected about 100 iron ore mines accounting for about 80% of the
mines in the state.
Besides, supplying raw material for steel production capacities of around 16 million tonnes, including major producers like JSW Steel,
the state also supplies iron ore for production of approximately 5.6 million tonnes of sponge iron and pig iron. Now, the steel manufac-
turers as well as small sponge and pig iron units will have to look out the state for alternative sources of supply which will increase their
raw material procurement cost due to increased freight costs. This ban might also result in shortage of iron ore supply and fuel another
round of price hike. Profit margin of the steel manufacturers in India has squeezed recently due to sharp rise in raw material cost, includ-
ing iron ore costs.
Original Capacity Addition Target For 11th Plan Period (in mw)
Type/Sector Central State Private Total
Thermal 24,840 23,301 11,552 59,693
Hydro 8,654 3,482 3,491 15,627
Nuclear 3,380 0 0 3,380
Total 36,874 26,783 15,043 78,700
Revised Capacity Addition Target For 11th Plan Period (in mw)
Type/Sector Central State Private Total
Thermal 14,920 18,501 17,336 50,757
Hydro 2,922 2,854 2,461 8,237
Nuclear 3,380 0 0 3,380
Total 21,222 21,355 19,797 62,374

August 30, 2011
Manufacturers will be forced to raise prices of steel in spite of demand weakening in order to pass on the raw material price hike. Most
of the manufactures had raised prices in February and March by 10-15%. Some of them had increased prices in June. The overall de-
mand for steel has softened due to slowdown in industrial growth. Industrial growth has slowed down due to a number of reasons, one of
them being the rising cost of capital, driven by rising interest rates.
The price hike can cascade down to the user industries like automobile and consumer durables, which uses flat steel. The demand for
long steel during monsoon is negligible as construction activity comes to a near halt. Hence, construction sector wont be affected by the
rise in steel prices.
As mentioned in the earlier edition of Infocus dated August
24, 2011, around 5,000 foundry units and a similar number
in the sponge and pig iron sector have been facing a big
shortage of iron ore supply . Most of these small units have
production capacity of around 1 million or less, hence lack
economies of scale. Price hike of raw material hits their mar-
gins leading to a complete shutdown.
Note: The foundry sector makes key equipment for the auto
and engineering industries.
Currently, there is an inventory of about 25 million tonnes
(which is almost 40% of the total iron ore production from
the state) of iron ore in Karnataka, which can be provided to
the steel makers in the region on basis of payment of 10%
royalty on the market price. This comes as a bit of relief to
the companies operating in the state and neighbouring re-
gions.
Mining of iron ore in the area is restricted to only NMDC
which produces about 1 million tonne per month. This is inadequate to meet the requirement of sponge and pig iron units as well as the
steel producers. Hence, there will be iron ore supply crunch in near future and we expect price hike.
Textiles
Govt extends TUFS to 12th Plan with double allocation: Prompted by the success of the Technology Upgradation Funds Scheme
(TUFS) for the textile sector in its previous regime, the government is now planning to extend the restructured TUFS into the 12th Plan
period (2012-2017).(Business Standard , August 26 , 2011)
PRU Analysis
Technology Upgradation Fund scheme (TUFs) was launched in 1999 in order to modernise and upgrade the textile industry. The main
focus of the scheme was to catalyse investment in the industry by providing credit at reduced rates to the entrepreneurs both in the organ-
ised as well as unorganised sectors. The financial support was extended across the value chain — spinning, weaving, processing and
garmenting with 5 % interest reimbursement.
Initially, the scheme was approved for a span of five years till March 2004. Subsequently, it was extended in 2004 and again in 2007
with minor modifications. However, it was discontinued with effect from June 28 2010 due to lack of allocation of funds.
TUFS gained significant pace in the past three years, where in about 72% of the total subsidy was disbursed. Since its inception, total
subsidy of `8,665 crore has been disbursed in a span of 11 years by the Government.(This doesn't include any disbursement during
2010-11)
TUFs was reintroduced on April 28 this year with certain modifications to focus on small scale units and the weaving sector. The sub-
August 30, 2011
sidy allocated under the scheme was only `1,972 crore till March 31, 2012.
In the 12th five year plan period (2012-17), government has planned to allocate around `15,404 crore, which is almost double the `8,000
crore originally approved for the 11th five year plan.(2007-2012).
However, the guidelines have not been decided as yet. Earlier for the period April 2011- March 2012, the scheme was introduced with
tougher guidelines. The maximum repayment tenure of loans was reduced from 10 years to 7 years. Borrowing units across the value
chain claim to have found it difficult to repay loans within 7 years since they are running with very low margins due to high cost of capi-
tal and spike in input costs in recent times.
It can be highlighted here that, according to a report by the Confederation of Indian Textile Industry (Citi), the textile industry in India is
facing challenging environment currently. Spinning mills have been the worst hit . Spinning mills are loaded with high-cost cotton pro-
cured before April, 2011 and are unable to pass on the high raw material cost to their customers on the back of weak demand for cotton
yarn in domestic as well as international markets. The dyeing costs for Tirupur based processing units have escalated due closing down
of dyeing units in that region. The dyeing cost earlier was `60-70 a kg and has now been revised to `150 a kg as the yarn is sent to the
North India for dying
Note: Cotton prices started declining since April , 2011 on back of news of increased cotton acreage in China and India. Cotton yarn
prices followed the trend in price decline since May. Prices for cotton and yarn both have fallen by almost 30-40% since then.
This is likely to squeeze profitability of the spinning mills over the two-to-three quarters of FY12.
Hence, highly leveraged capital structure along with rising interest rates exposes the industry vulnerability to repayment defaults. So
ideally Government should ease the guidelines for 12th five year plan in order to help the industry in improving the working capital.
However, that looks unlikely in the current circumstances when banks are fighting hard to reduce their non performing asset levels and
maintain asset quality.
Indian garment exporters scout for new markets: India’s garment exporters are scouting for new destinations in the wake of tepid
demand in the traditional US and European markets. Indian garment manufacturers were walking a tightrope for some months due to
escalating cotton yarn prices coupled with slowdown in the US and European economies.( Business Standard, August 25, 2011)
PRU Analysis
According to Indian Apparel Exports Promotion Council, apparel exports have started witnessing a demand slowdown from key destina-
tion i.e. USA and UK. It can be mentioned here that, US and UK account for about 30% and 50-60% of the total apparel exports respec-
tively.
US imports of apparel from India in the period (Jan-May2011) grew by 8.5 % to $1,548 million against $1,427 million in Jan-May 2010.
India’s export to EU amounted to $3,320 million, a growth of 27.7% Y-o-Y.
However, recently after the S&P downgraded the sovereign debt rating of US, it has triggered fears of double deep recession. There are
worries of sovereign debt contagion in Europe. These economic uncertainties have hit the textile sector as well.
The spring-summer collection orders which start coming in around month of June-July have already witnessed a decline.
The prices of cotton and cotton yarn have fallen owing to weak demand from the industry. Cotton yarn prices have also fallen from its all
-time high of ` 290 a kg to `160-170 a kg. This has reduced the cost of raw material for the apparel makers and has brought some relief.
Exporters might pass on the correction in yarn prices to the consumers in coming months in order to register incremental business. But it
looks unlikely under the current scenario as demand remains low.
Exporters have started evaluating the trade prospects with new countries like Japan, Russia and South America. After signing a free trade
agreement with Japan, Indian players might get a better access to buyers there.

August 30, 2011
Precious Metals Decline
Gold, silver prices see sharp decline: Recent rise may be nearing peak, analysts say long-term trend remains bullish. Gold and silver
are on a correction course, as prices have fallen sharply in the past two days. (Business standard, August 26, 2011)
PRU Analysis
Gold prices have witnessed a sharp fall in the international as well as domestic market since August 22, 2011. International gold prices
fell by almost 6.3% to hit $1,776 per ounce on August 25, 2011. It can be mentioned here that gold prices registered the highest daily
decline of (4.3%) since December 2008.
Silver prices also tumbled by 9.19% in the same period.
In the domestic market also gold price declined by 8.2% to reach `25, 591 per 10 grams.
This is attributable to the profit taking by the investors on back of the uncertainty over the fed’s future stimulus plans.
US Federal Reserve might go for another round of quantitative easing (QE3) in future in order to boost the economy there by increasing
the money supply . This will further weaken dollar. Hence investors are likely to shift their investment to precious metals rather than
dollar.
This might lead to another rally in precious metals.
The rally in precious metals have been sustained by weaker dollar, rising inflation and economic uncertainty which makes gold is safe
heaven investment.
However, Chairman Ben Bernanke hasn’t disclosed the details further action as yet.
Margin requirement for gold was hiked by almost 27% during this
month for gold contracts on the Chicago Mercantile Exchange
(CME).
This could have led to some amount of sell off in the gold market,
as traders must close contracts if they cannot meet the new mainte-
nance margin requirements.
Note: Margins are deposits paid by investors in futures markets,
where full payment is made when contracts mature to an exchange
or clearing house to cover the risk of default by that investor. These
are based on the most-likely daily market moves.
It can be highlighted here that the margin required for gold trading
might have gone up in the current circumstances to bring down the
speculative activity in the market.
0
10
20
30
40
50
60
0
500
1000
1500
2000
28-Aug-07 28-Aug-08 28-Aug-09 28-Aug-10 28-Aug-11
International Gold And Silver Price
Movement($/ounce)
Gold Silver(RHS)
Source: Bloomberg
Losing The Glitter
22-Aug-11 26-Aug-11 Net Change Change (%)
International Gold Price($/Ounce) 1,897 1,776 120.72 6.3
International Silver Price($/Ounce) 43.75 40.67 3.08 9.19
Domestic Gold Price(`/10g) 27,877 25,591 2,286 8.2
Domestic Silver Price(`/1 kg) 65,730 59,295 6,435 9.79

August 30, 2011
Disclaimer Clause
This report is for customer ‘information’ only and does not constitute investment advice or an offer to purchase or subscribe for any investment.
This document is not intended to provide professional advice and should not be relied upon in that regard. Persons accessing this document are ad-
vised to obtain appropriate professional advice where necessary. This document is not directed to or intended for display, downloading, printing,
reproducing or for distribution to or use by any person or entity who is a citizen or resident or located in any locality, state, country or other juris-
diction where such distribution, publication, reproduction, availability or use would be contrary to law or regulation or would subject Dhanlaxmi
Bank Limited or its associates or group companies to any registration or licensing requirement within such jurisdiction. If this document is inadver-
tently sent or has reached any individual in such country, the same may be ignored and brought to the attention of the sender. This document may
not be reproduced, distributed or published for any purpose without prior written approval of Dhanlaxmi Bank Limited.