fmvss no. 136 electronic stability control systems on ... · overall, the rule would save $13.9 to...
TRANSCRIPT

U.S. Department Of Transportation
National Highway Traffic Safety Administration
PRELIMINARY REGULATORY IMPACT ANALYSIS
FMVSS No. 136 Electronic Stability Control Systems
On Heavy Vehicles
Office of Regulatory Analysis and Evaluation National Center for Statistics and Analysis
May 2012
People Saving People

TABLE OF CONTENTS EXECUTIVE SUMMARY------------------------------------------------------ E-1
I. INTRODUCTION --------------------------------------------------- I-1 II. PROPOSED REQUIREMENTS ---------------------------------- II-1
A. Definition of ESC ------------------------------------------- II-3 B. Performance Requirements ---------------------------------II-4
1. Slowly Increasing Steer Maneuver ------------------- II-5 2. Sine With Dwell Maneuver ---------------------------- II-6
C. ESC Malfunction Telltale and Symbol ------------------- II-13 D. ESC Off Switch, Telltale and Symbol -------------------- II-14
III. HOW ESC WORKS ------------------------------------------------ III-1
A. ESC Systems ------------------------------------------------- III-1 B. How ESC Prevents Rollovers ------------------------------ III-1 C. How ESC Prevents Loss of Control ---------------------- III-3
IV. BENEFITS ----------------------------------------------------------- IV-1
A. Effectiveness of ESC and RSC ---------------------------- IV-3 B. Initial Target Population ------------------------------------ IV-7 C. Projected Target Population ------------------------------- IV-13 D. Benefits ------------------------------------------------------ IV-21 E. Travel Delay and Property Damage Savings ------------ IV-24 F. Summary ----------------------------------------------------- IV-33
V. COSTS and LEADTIME ------------------------------------------- V-1
A. Technology Costs ------------------------------------------- V-1 B. Leadtime ------------------------------------------------------ V-13
VI. COST EFFECTIVENESS AND BENEFIT-COST ------------ VI-1
A. Discounting Factors ----------------------------------------- VI-3 B. Fatal Equivalents -------------------------------------------- VI-6 C. Net Costs ----------------------------------------------------- VI-8 D. Cost-Effectiveness ------------------------------------------ VI-9

E. Net Benefits -------------------------------------------------- VI-9 F. Summary ----------------------------------------------------- VI-10
VII. ALTERNATIVES -------------------------------------------------- VII-1
A. Alternative 1 – RSC for All Applicable Vehicles ------- VII-2 B. Alternative 2 – Trailer-RSC for All New Trailers ------ VII-4
VIII. REGULATORY FLEXIBILITY ACT, UNFUNDED --------- VIII-1 MANDATES REFORM ACT
A. Regulatory Flexibility Act -------------------------------- VIII-1 B. Unfunded Mandates Reform Act ------------------------- VIII-6
APPENDIX A. RETROFITTING ----------------------------------------- A-1 APPENDIX B. REVISED COMPREHENSIVE COSTS -------------- B-1

E-1
EXECUTIVE SUMMARY
This Preliminary Regulatory Impact Analysis examines the impact of the proposal to establish
Federal Motor Vehicle Safety Standard (FMVSS) No. 136, Electronic Stability Control Systems
(ESC) on Heavy Vehicles. At this time, the proposal would apply to only truck tractors and
buses with a GVWR greater than 11,793 kilograms (26,000 pounds). Specifically, the applicable
buses (large buses) are those that have 16 or more designated seating positions (including the
driver), and at least 2 rows of passenger seats, rearward of the driver’s seating position, that are
forward-facing or can convert to forward-facing without the use of tools. This proposal does not
apply to school buses and urban transit buses sold for operation as a common carrier in urban
transportation along a fixed route with frequent stops.
ESC is one of two types of stability control systems that have been developed for heavy vehicles.
The other one is roll stability control (RSC) which is designed primarily to mitigate on-road, un-
tripped rollovers. ESC, on the other hand, not only includes the RSC functions but also is
designed to mitigate loss-of-control (LOC) crashes that are caused by yaw instability. The
National Highway Traffic Safety Administration (NHTSA, the agency) is proposing ESC for
addressing both first-event rollover and LOC crashes.
The proposal is based on a thorough examination of three Alternatives including the proposal.
Based on this analysis, the proposal is highly cost-effective measured against a comprehensive

E-2
baseline of $6.4 million1 per life value (2010 economics). The proposal would also generate a
positive net benefit.
Note that RSC can be implemented on truck tractors and trailers. Therefore, for clarification,
hereafter, RSC and ESC are used exclusively as tractor-based or bus-based systems. Trailer-
RSC as implied by the name is a trailer-based system. No tractor-trailer combination systems2
are discussed in the analysis since the tractor-based systems are found to be the dominant
systems.
Requirements The proposal would require that truck tractors and buses with a gross vehicle weight rating
(GVWR) greater than 11,793 kilograms (kg; 26,000 pounds) be equipped with an ESC system
that meets the equipment, functional, and performance requirements specified in the proposed
FMVSS No. 136. The proposal requires ESC to comply with two compliance tests and four
performance criteria. The proposed compliance tests are 1) Slowly Increasing Steer
Characterization test and 2) Sine with Dwell test. The proposed performance criteria are 1)
Engine Torque Reduction, 2) Lateral Acceleration Ratio, 3) Yaw Rate Ratio, and 4) Lateral
Displacement. These proposed performance requirements complemented by the equipment and
functional requirements would ensure that ESC would mitigate the on-road untripped rollover
and LOC crashes but not at the expense of vehicle steering responsiveness when it was activated.
The truck tractors and large buses covered by the proposal are called applicable vehicles in this
analysis. On-road untripped first event rollovers are called target rollovers. 1 Contains both economic costs and values for intangible consequences such as lost quality of life 2 i.e., the tractor is equipped with an ESC and the trailer is equipped with a trailer-RSC

E-3
In addition, the proposal would require manufacturers to install an ESC malfunction telltale
(warning lamp) using specific symbols and/or text for the malfunction telltale. An On/Off
switch to turn off ESC would not be allowed.
Technical Feasibility/Baseline
ESC is increasingly being offered as standard or optional equipment in new model year truck
tractors and large buses. Based on manufacturers’ product plans submitted to the agency in late
2009, the agency estimated that 14 percent of model year (MY) 2009 truck tractors and an
extremely small percent of buses were equipped with ESC. By 2012, ESC installation rates are
expected to increase to 26 percent for truck tractors and 80 percent for large buses. The agency
believes that these ESC systems, some of which may need slight modifications, would otherwise
already comply with the proposed “ESC” performance requirements.
For this analysis, the projected MY 2012 installation rates serve as the baseline compliance rates.
As described earlier, with slight modifications, current ESC systems would pass the proposed
compliance tests. Therefore, this analysis assumes that the 2012 model year ESC-equipped
vehicles would all comply with the proposed test. Benefits and costs of the proposal thus reflect
increasing ESC installation rates from 26 percent in truck tractors and 80 percent in large buses
to 100 percent in both vehicle types.

E-4
Benefits3
ESC is estimated to reduce the target rollover and LOC crashes by 28 to 36 percent. Therefore,
the proposal would eliminate 1,807 – 2,329 crashes annually including 1,332 – 1,854 rollover
crashes and 475 LOC crashes once all truck tractors and large buses have ESC. As a result,
annually, the proposal would save (undiscounted) 49 – 60 lives, reduce 649 – 858 MAIS 1-5
injuries4, and eliminate 1,187 – 1,499 property damage only (PDOVs) vehicles. Of these
benefits, 27 – 38 lives and 537 – 746 MAIS 1-5 injuries were from rollover crashes and 22 lives
and 112 MAIS 1-5 injuries were from LOC crashes. For PDOVs, 797 – 1,109 vehicles were
from target rollover crashes and 390 were from LOC crashes. Table E-1 lists these benefits.
Note that benefits for target rollover crashes are presented as a range in this analysis. This is the
result of using a range of ESC effectiveness against the target rollover crashes. By contrast, at
the time of publication, there is only one available effectiveness estimate for LOC. Therefore,
the benefits for LOC are presented as a single point estimate. Also note that the estimated
benefits were basically all from truck tractors. This is due to the small 2012-based large bus
target crash population and a high ESC installation rate for large buses.
3 Benefits of the rule are measured from a baseline of 26% ESC installation to 100% installation for truck tractors and 80% to 100% for large buses. However, the overall benefits of ESC could be measured from “no ESC” to 100% penetration rate with 0% RSC penetration rate. Overall, ESC would prevent 2,876 – 3,758 crashes, save a total of 74 – 92 lives, and eliminate 1,047 – 1,401 MAIS 1-5 injuries and 1,870 – 2,397 PDOVs annually. 4 MAIS (Maximum Abbreviated Injury Scale) represents the maximum injury severity of an occupant at an Abbreviated Injury Scale (AIS) level. AIS ranks individual injuries by body region on a scale of 1 to 6: 1=minor, 2=moderate, 3=serious, 4=severe, 5=critical, and 6=maximum (untreatable).

E-5
Table E-1 Summary of Benefits
(Undiscounted) Low Range of Benefits High Range of Benefits Rollover
Crashes Loss-of-Control Crashes
Total
Rollover Crashes
Loss-of-Control Crashes
Total Crashes 1,332 475 1,807 1,854 475 2,329 Fatalities 27 22 49 38 22 60 Injuries (AIS 1-5) 537 112 649 746 112 858 PDOVs 797 390 1,187 1,109 390 1,499 PDOVs: property damage only vehicles
Vehicle Technology Costs
The ESC system cost is estimated to be $1,160 (in 2010 dollars) per vehicle which includes all
the components for ESC and the ESC malfunction telltale. The total incremental cost of the
proposal (over the MY 2012 installation rates and assuming 150,000 unit truck tractors and 2,200
large buses sold per year) is estimated to be $113.6 million to install ESC and malfunction
indicator lamps. The average incremental cost is estimated to be $746 per vehicle. Separately
by vehicle type, the estimated average incremental cost is $754 per truck tractor and $232 per
bus. These figures reflect the fact that 26 percent of the baseline MY 2012 truck tractors and 80
percent of MY 2012 large buses are projected to already come equipped with ESC. The costs
also take into account that 16.0 percent of MY 2012 truck tractors, in addition to the 26 percent
mentioned above, would already have RSC. Table E-2 summarizes the vehicle costs.

E-6
Table E-2 Summary of Vehicle Technology Costs
(2010 dollars) Average Vehicle Costs Total Costs Truck Tractors $754 $113.1 M Large Buses $232 $0.5 M
Combined $746 $113.6 M M: million
Other Impacts
Property Damage and Travel Delay
The proposal would prevent crashes and thus would reduce property damage costs and travel
delay associated with those crashes avoided. Overall, the rule would save $13.9 to $17.8 million
at a 3 percent discount rate or $11.0 to $14.1 million at a 7 percent discount rate in property
damage and travel delay.
Fuel Economy
The added weight from ESC, which consists primarily of just electronic sensors and wiring, is
insignificant relative to the 11,793 kg (26,000 pounds) plus weight of the truck tractors and large
buses. Consequently, the increase in their lifetime use of fuel is considered to be negligible.
Net Cost Per Equivalent Life Saved
As shown in Table E-3, the net cost per equivalent life saved, discounted at a 3 percent and 7
percent discount rate will range between $1.5 million and $2.6 million.

E-7
Table E-3 Cost Per Equivalent Life Saved
(2010 dollars) 3% Discount Rate 7% Discount Rate Low High Low High Net Cost per Equivalent Life Saved
$1.5 M $2.0 M $2.0 M $2.6 M
M: million
Net Benefits
A net benefit analysis differs from a cost effectiveness analysis in that it requires that benefits be
assigned a monetary value. This value is compared to the monetary value of costs to derive a net
benefit. The proposal would accrue $155 to $310 million in net benefits as shown in Table E-4.
The high net benefit of $310 million was based on a 3 percent discount rate and the low end of
$155 million was based on a 7 percent discount rate. Both of these are based on a $6.4 million
comprehensive value for preventing a fatality.
Table E-4 Net Benefits
With $6.4 M Cost Per Life (2010 dollars)
At 3% Discount At 7% Discount Low High Low High Net Benefits $228 M $310 M $155 M $222 M M: million Alternatives
In addition to the proposal requiring ESC, the agency also examined two less stringent
alternatives that would require RSC and trailer-RSC:

E-8
• Alternative 1 would require all new applicable vehicles (i.e.., truck tractors and large
buses) to be equipped with RSC,
• Alternative 2 would require trailer-RSC for all new trailers
Alternative 1 is slightly more cost-effective and lower in total costs than the proposal. However,
this Alternative would save fewer lives and accrue less net benefits than the proposal.
Furthermore, Alternative 1 would have significantly less impact on LOC crashes, a sizeable
safety population that the agency intends to address. Therefore, Alternative 1 was not proposed.
Alternative 2 would save even fewer lives than Alternative 1. Moreover, Alternative 2 is
significantly less cost-effective than both the proposal and Alternative 1 and would produce
negative net benefits. Table E-5 lists the costs, equivalent lives saved, cost per equivalent life
saved, and net benefits of these two Alternatives by discount rate. Therefore, Alternative 2 was
not selected.
Table E-5
Cost-Benefit Measures for Alternatives 1 and 2 by Discount Rate (2010 dollars)
Cost-Benefit Measures
Alternative 1 Alternative 2 At 3% Discount At 7% Discount At 3% Discount At 7% Discount
Equivalent Lives Saved 31 - 43 24 – 34 5 – 7 3 – 5
Vehicle Cost* $55.8 M $55.8 M $81.2 M $81.2 M Cost per Equivalent Life Saved
$1.0 - $1.5 M $1.3 - $2.0 M $11.2 - $15.9 M $16.0 - $26.7 M
Net Benefits $153 - $235 M $106 - $174 M -$35 to -$49 M** -$50 to -$60 M** * Not discounted since the costs occur when the vehicle is purchased ** Negative benefits indicate that costs are greater than the dollar value of benefits M: million

E-9
Retrofitting
The analysis also examines the practicability of extending applicable vehicles to include in-
service vehicles. Retrofitting ESC or RSC does not appear to be feasible because of the
complexity of integration which involves the calibration of these technologies with the vehicles’
engine, braking, local communication, and electronic control unit systems. Moreover, no ESC or
RSC retrofitting tools are currently available. In contrast, retrofitting trailer-RSC systems are
commercially available. However, retrofitting in-service trailers is extremely costly ($3.3 - $4.2
billion) and not cost effective ($0.5 - $1.7 billion per equivalent life saved). Therefore, the
agency has determined that retrofitting ESC or RSC is not practical, and that retrofitting trailer-
RSC is not cost beneficial.
Leadtime
The agency proposes a two-year leadtime for typical 4x2 and 6x4 truck tractors5 and large buses.
For severe service tractors, which typically have a GVWR greater than 27,000 kg (59,600
pounds), and other specialty truck tractors with three axles or more, the agency proposes a
leadtime of four years.
The agency believes that the proposed leadtime would ensure that the only two current suppliers
of heavy vehicle stability control systems, Bendix and Meritor WABCO, would have enough
time to produce sufficient units of stability control systems to meet the demand of truck tractor
5 The 6x4 description for a tractor represents the total number of wheel positions (six) and the total number of wheel positions that are driven (four), which means that the vehicle has three axles with two of them being drive axles. Similarly, a 4x2 tractor has four wheel positions, two of which are driven, meaning that the vehicle has two axles, one of which is a drive axle.

E-10
and bus manufacturers. It also should enable truck/bus manufacturers to make necessary design
changes to their vehicles’ instrumentation, brake, and electronic systems as to accommodate the
new ESC systems. Consequently, this would minimize the compliance costs to manufacturers.
Summary of Annual Costs and Benefits
Table E-6 summaries the total annual costs, injury benefits, property damage and travel delay
savings, cost per equivalent life saved, and net benefits of the proposal by two discount rates.
Table E-6
Estimated Annual Cost, Benefits, and Net Benefits of the Proposal (in million of 2010 dollars)
Costs
Injury
Benefits
Property Damage and Travel Delay
Savings
Cost Per Equivalent Live
Saved
Net
Benefits At 3% Discount
$113.6 $328 – $405 $13.9 - $17.8 $1.5 - $2.0 $228 - $310
At 7% Discount
$113.6 $257 – $322 $11.0 - $14.1 $2.0 - $2.6 $155 - $222

I-1
CHAPTER I. INTRODUCTION
This Preliminary Regulatory Impact Analysis (PRIA) accompanies NHTSA’s Notice for
Proposed Rulemaking (NPRM) to establish Federal Motor Vehicle Safety Standard (FMVSS)
No. 136, Electronic Stability Control Systems (ESC) for Heavy Vehicles. At this time, the
proposal would require truck tractors and buses that have a gross vehicle weight rating (GVWR)
greater than 11,793 kilograms (kg, 26,000 pounds) be equipped with ESC. This proposal would
apply to these buses that have 16 or more designated seating positions (including the driver), and
at least 2 rows of passenger seats, rearward of the driver’s seating position, that are forward-
facing or can convert to forward-facing without the use of tools. The applicable bus does not
include a school bus, multifunction school activity bus, or urban transit bus sold for operation as
a common carrier in urban transportation along a fixed route with frequent stops (i.e., transit bus
designed for an “urban area” as defined in 49 U.S.C. Section 5301(16). These applicable buses
are referred as “large buses”, hereafter.
ESC and Roll Stability Control (RSC) are two types of stability control systems that have been
developed for heavy vehicles. RSC is designed to mitigate on-road, un-tripped truck rollovers by
automatically decelerating the vehicle by applying the foundation brakes and reducing engine
torque output. ESC includes the RSC function described previously. In addition, ESC has added
capability for mitigating severe oversteer or understeer conditions that can lead to vehicle loss-
of-control (LOC), by automatically applying selective brakes to generate a yawing moment that
helps the driver maintain directional control of the vehicle. Thus, ESC for truck tractors and
large buses are designed to mitigate both untripped rollover and LOC crashes, which is different

I-2
from that specified in Federal Motor Vehicle Safety Standard No. 126 (FMVSS No. 126) for
light vehicles with a GVWR of 4,536 kg (10,000 pounds) or less. Note that manufacturers also
developed trailer-based roll stability control technology. This technology is specified as trailer-
RSC in this analysis. Therefore, ESC and RSC in this analysis represent specifically the truck
tractor- or bus-based systems.
Rollover and LOC crashes comprised a significant portion of truck tractor and bus crashes.
Based on 2006-2008 General Estimates System (GES) and Fatality Analysis Reporting System
(FARS), annually, truck tractors and large buses were involved in 201,600 crashes (198,800 non-
fatal and 2,800 fatal crashes). There crashes caused 3,721 fatalities and 60,400 non-fatal police-
reported injuries. Of these truck tractor and large bus crashes, 13,200 crashes (5,700 first event
rollover and 7,500 LOC crashes) would be impacted by the proposal. Consequently, the
proposal would potentially further reduce the 415 fatalities and 5,400, non-fatal police-reported
injuries that were associated with these rollover and LOC crashes.
Since the early 1990’s, the agency has been actively addressing the heavy vehicle rollover and
LOC safety problems. In 1995, the agency published a final rule mandating antilock braking
systems (ABS) on truck tractors manufactured on or after March 1, 1997 and for other air-braked
heavy vehicles, including single unit trucks, buses, and trailers manufactured on or after March
1, 1998. ABS, an advanced braking technology, has helped to reduce jackknife crashes and
other directional loss-of-control crashes that were caused by wheel lockup during braking.
However, many rollovers and LOC crashes are not caused by wheel lockup but by steering
maneuvers. To specifically address these types of crashes, in the mid-1990s, the agency

I-3
sponsored the development of a prototype roll stability advisor (RSA) system - a precursor of an
RSC system. RSA relays stability related information such as the truck’s roll stability threshold
and the peak lateral acceleration achieved during cornering maneuvers to the driver.
In 2006, with the further advancement of avoidance technologies and the agency’s experience
with ESC on light vehicles6, the agency initiated a test program at the Vehicle Research and Test
Center (VRTC) to evaluate the performance of heavy vehicle stability control systems and to
develop objective test procedures and performance measures. Researchers tested three tractors,
each equipped with either RSC or ESC systems, one semi-trailer equipped with a trailer-based
RSC system, and three buses equipped with an ESC system. Additionally, the agency tested five
baseline semi-trailers not equipped with a stability control system, including an unbraked control
trailer that is used to conduct tractor braking tests as prescribed by FMVSS No. 121, Air brake
systems. These research efforts form the basis of this proposal. Research results are summarized
in one paper and two technical reports:
a. NHTSA’s Class 8 Truck-Tractor Stability Control Test Track Effectiveness, 2009 ESV
paper, No. 09-05527,
b. Tractor-Semitrailer Stability Objective Performance Test Research – Roll Stability, May
2011, DOT HS 811 467, and
c. Tractor-Semitrailer Stability Objective Performance Test Research – Yaw Stability (to be
published)
6 On April 6, 2007, the agency issued a final rule (72 FR 17236) that established Federal Motor Vehicle Standard (FMVSS) No. 126, Electronic Stability Control Systems, which requires passenger cars, multipurpose passenger vehicles, trucks and buses with a gross vehicle weight rating of 4,536 kg (10,000 lb) or less to be equipped with an electronic stability control system beginning model year 2012. 7 Available from www.regulations.gov; see Docket No. NHTSA-2010-0034-0008

I-4
Furthermore, NHTSA has sponsored several research programs with stability control system
developers and manufactures and universities to study the effectiveness of the RSC and ESC on
truck tractors against untripped first-event rollovers (i.e., target rollovers) and LOC crashes.
These studies include:
• A study with Meritor WABCO and the University of Michigan Transportation Research
Institute (UMTRI) to examine the potential safety effectiveness of RSC and ESC systems
for five-axle tractor-trailer combination vehicles (UMTRI study)8,
• A study with the University of Iowa using the National Advanced Driving Simulator
(NADS)9 to determine the effectiveness of RSC and ESC for scenarios that were most
likely to induce rollover and jackknife crashes, and
• An ongoing project started in February 2009 with Virginia Tech Transportation Institute
(VTTI) to assess the real-world safety benefits of the Bendix stability system. The
project is focused on RSC and the project report is still underway at the publication of the
analysis.
After the completion of the UMTRI’s study, the agency published a Research Note10 which
describes the process of deriving the effectiveness rates of ESC and RSC in truck tractors. The
Research Note was built upon the UMTRI study and revised the effectiveness of RSC and ESC.
The Research Note concluded that ESC would prevent 28 to 36 percent of target rollovers and
LOC crashes. RSC would prevent 21 to 30 percent of these crashes. 8 Safety Benefits of Stability Control Systems for Tractor-Semitrailers, DOT HS 811 205, October 2009, available from www.regulations.gov; see Docket No. NHTSA-2010-0034-0006 9 Heavy Truck ESC Effectiveness Study Using NADS, DOT HS 811 233, November 2009, The final report is available from www.regulations.gov, Docket No. NHTSA-2010-0034-0007 10 Wang, Jing-Shiarn, Research Note “Effectiveness of Stability Systems for Truck Tractors” , DOT HS 811 437, January 2011

I-5
As for large buses, in October 2009, NHTSA issued a Vehicle Safety Priority Plan, which
describes the agency plans for rulemaking and research for calendar years 2009 to 2011. The
Priority Plan includes stability control on Heavy Vehicles, and states that the agency plans to
develop test procedures for a Federal motor vehicle safety standard on stability control for truck
tractors, with the countermeasures of roll stability control and electronic stability control, which
are aimed at addressing rollover and loss-of-control crashes. In addition, the Department of
Transportation Motorcoach Safety Action Plan11, issued in November 2009, includes an action
item for NHTSA to assess the safety benefits for stability control on motorcoaches and develop
objective performance standards for these systems.
Following the Motorcoach Safety Priority Plan, NHTSA’s VRTC has evaluated the performance
of ESC on three motorcoaches using the test maneuvers and performance criteria developed for
truck tractors. The three motorcoaches were two 2007 MCI D4500 with the Meritor WABCO
ESC system and a 2009 Prevost H3 with the Bendix ESC system. Overall this research
concluded that an identical set of test maneuvers and similar performance criteria can be applied
to both motorcoaches and truck tractors to discern ESC performance in preventing target
rollovers and LOC crashes.
The National Transportation Safety Board (NTSB) has issued several safety recommendations
relevant to ESC systems on heavy and other vehicles. Recommendation H-08-15 addresses ESC
systems on commercial vehicles. Recommendations H-10-05 and H-10-06 address stability
control systems on buses with a GVWR above 10,000 pounds. Two other safety
recommendations, H-01-06 and H-01-07, on adaptive cruise control and collision warning 11 Motorcoach definition used in the action plan is equivalent to the bus terminology used in this proposal.

I-6
systems on commercial vehicles are indirectly related to ESC on heavy vehicles because the
addressed technologies and ESC all require active braking without driver input12.
The trucking industry has implemented the stability control technologies to mitigate rollover and
LOC crashes. The industry first introduced RSC in the U.S. for truck tractors in 2002 and later
ESC in 2005. Based on the trucking industry’s input and product plans submitted to the agency,
the agency estimates that about 7.4 percent of truck tractors sold in 2007 were already equipped
with ESC and additional 10.5 percent were equipped with RSC only systems. The ESC
installation rate is expected to increase to 26.2 percent and RSC to 16.0 percent for model year
(MY) 2012 truck tractors. The stability control systems were introduced for large buses much
later. The agency estimates that the ESC and RSC installations were extremely low for those
sold in 2007. However, ESC installation is expected to rapidly rise to 80.0 percent for MY 2012
large buses.
Given that the agency’s research has developed feasible and repeatable test maneuvers and
viable performance criteria, that ESC is found to be effective in reducing rollover and LOC
crashes, and that the ESC technologies are mature, the agency has decided to propose requiring
ESC on truck tractors and buses with a GVWR greater than 11,793 kg (26,000 pounds) to reduce
the occurrence of rollovers and LOC crashes in these new heavy vehicles.
12 Active braking involves using the vehicle’s brakes to maintain a certain, preset distance between vehicles.

I-7
Organization of the Remaining Analysis
This PRIA estimates the benefits, cost, cost-effectiveness, and net benefits of the rule. The
following discussion outlines the remaining structure of this document. Chapter II describes the
requirements of the proposed Standard No. 136. Chapter III discusses current ESC systems and
their functional capabilities. This Chapter also summarizes the test results performed by the
agency. Chapter IV estimates the benefits. Chapter V discusses the costs and leadtime. Chapter
VI provides cost-effectiveness and net benefits analysis. Chapter VII discusses alternatives.
Finally, Chapter VIII examines the impacts of the proposal on small business entities. In
addition, Appendix A examines the practicability of retrofitting. Appendix B revises
comprehensive costs to reflect the value of a statistical life (VSL) of $6.0 million that was
specified in a 2009 DOT guideline on value of life.

II-1
CHAPTER II. PROPOSED REQUIREMENTS
The proposal would establish Federal Motor Vehicle Safety Standard (FMVSS) No. 136,
Electronic Stability Control Systems (ESC) for Heavy Vehicles, which requires truck tractors
and buses having a gross vehicle weight rating (GVWR) greater than 11,793 kilograms (26,000
pounds) to be equipped with an ESC system that meets the requirements of the standard. This
proposal would apply to these buses with 16 or more designated seating positions (including the
driver), and at least 2 rows of passenger seats, rearward of the driver’s seating position, that are
forward-facing or can convert to forward-facing without the use of tools. 13 Applicable buses
include those that were sold for intercity, tour, and commuter bus service, but do not include
school buses, or urban transit buses sold for operation in urban transportation along a fixed route
with frequent stops..
Note that the agency is not proposing to include single unit trucks with a GVWR greater than
4,536 kg (10,000 pounds) and buses with a GVWR 11,793 kg (26,000 pounds) or less at this
time, primarily because stability control systems are not yet available for a broad segment of
these vehicles. Substantial variations in brake type, vehicle weight, wheelbase, number of axles,
center of gravity height, and cargo type, exist among single unit trucks. Furthermore, the
development of stability control system for heavy vehicles has been focused on air-braked
vehicles which include truck tractors and large buses that were covered by the proposed rule.
These factors have made it challenging for the agency to devise test procedures and conduct
vehicle testing to evaluate stability control system performance on single unit trucks.
13 Definition was proposed in an NPRM for motorcoach seat belt, 75 FR 50,958 (Aug. 18, 2010).

II-2
The agency also is not proposing to apply this standard to in-service vehicles due to the lack of
feasibility of retrofitting ESC. The integration of the systems into in-service vehicles involves
the vehicle’s chassis, engine, braking, and other stability related systems (e.g., traction control),
vehicle local network communication systems, and electronic control units, which would place a
tremendous financial burden especially on bus operators, of which 80 percent operate with a bus
fleet size of less than 10 vehicles14. Moreover, the agency is not aware of any available ESC
retrofitting service, most likely due to integration complexity. See Appendix A for a more
detailed analysis of retrofitting issues.
In addition to retrofitting ESC, the agency also studied the impacts of retrofitting trailer-RSC
since this retrofitting tool is commercially available. Based on the available cost information
and the agency’s test data on trailer-RSC, the agency determined that retrofitting trailer-RSC is
not cost-effective. Thus, it is also not practical to require retrofitting trailer-RSC. Appendix A
provides the agency’s analysis on retrofitting issues.
The proposal specifies (a) the Definition of ESC, (b) the Equipment and Functional
Requirements of ESC, (c) the Performance Requirements of ESC, and (d) ESC Activation,
Malfunction, Telltale, and Symbol Requirements. The following sections summarize these
requirements. Interested parties should consult the preamble of the NPRM for the details. In
addition, comprehensive technical background information for deriving the requirements can be
found in the agency research reports listed in Chapter I.
14 Motorcoach Facts, 2009, American Bus Association, www.buses.org

II-3
A. DEFINITION OF ESC
The definition of ESC compliments the performance-based criteria to ensure the ESC is
operational at a full range of rollover and vehicle stability conditions without the burden of
requiring a battery of tests to cover a wide array of possible loading configurations and operating
ranges for heavy vehicles. ESC is defined as a system that has all of the following attributes:
1) Augments vehicle directional stability by applying and adjusting vehicle brake torques
individually at each wheel position on at least one front and at least one rear axle of the
vehicle to induce correcting yaw moment to limit vehicle oversteer and to limit vehicle
understeer.
2) Enhances rollover stability by applying and adjusting the vehicle brake torques
individually at each wheel position on at least one front and at least one rear axle of the
vehicle to reduce lateral acceleration of a vehicle.
3) Computer-controlled with the computer using a closed-loop algorithm to induce
correcting yaw moment and enhance rollover stability.
4) Has a means to determine the vehicle’s lateral acceleration.
5) Has a means to determine the vehicle’s yaw rate and to estimate its side slip or side slip
derivative with respect to time.
6) Has a means to estimate vehicle mass or, if applicable, combination vehicle mass.
7) Has a means to monitor driver steering input.
8) Has a means to modify engine torque, as necessary, to assist the driver in maintaining
control of the vehicle.
9) When installed on a truck tractor, has the means to provide brake pressure to
automatically apply and modulate the brake torques of a towed semi-trailer.

II-4
To ensure that a vehicle is equipped with an ESC system that meets the proposed definition and
to allow the agency to verify that the ESC system meets operational requirements that may not
necessarily be validated under the proposed performance tests, the agency is proposing that
vehicle manufacturers make the following information available to the agency:
(1) A system diagram that identifies all ESC system hardware,
(2) A written explanation describing the ESC system’s basic operational characteristics,
(3) A discussion of the pertinent inputs to the computer and how its algorithm uses that
information to mitigate rollover and limit oversteer and understeer, and
(4) For truck tractors, information that shows how the tractor provides brake pressure to a
towed trailer.
The requested information would enable the agency to ascertain that an ESC system includes the
proposed components and attributes. This information also would aid the test engineers with
execution and completion of the proposed compliance tests.
B. PERFORMANCE REQUIREMENTS
An ESC-equipped vehicle must satisfy performance test criteria to ensure sufficient rollover
stability and oversteer or understeer intervention (i.e., mitigating the tendency for the vehicle to
spinout or plow out in a curve). The agency is proposing the two compliance tests and four
performance criteria:
(1) Slowly Increasing Steer Maneuver (SIS)
• Engine Torque Output Criterion
(2) Sine with Dwell Maneuver (SWD)
• Lateral Acceleration Ratio (LAR)

II-5
• Yaw Rate Ratio (YRR)
• Lateral Displacement (LD)
Slowly Increasing Steer Maneuver (SIS)
The SIS maneuver is used to determine a steering wheel angle which then is used to normalize
the severity of the subsequent SWD maneuver. SIS is also used to evaluate the engine torque
reducing capability of ESC to demonstrate that it mitigates both rollover and understeer.
Test Maneuver
The SIS maneuver is conducted at a constant speed of 48.3 kilometer per hour (km/h) with 1.6
km/h acceptable speed variation (i.e., 30 mph + 1mph). A steering controller gradually increases
the steering wheel angle from 0 to 270 degrees at continuous rate of 13.5 degrees per second.
The 270 degrees is held constant for one second and the maneuver concludes. Each vehicle is
subjected to two series of runs, with three tests performed for each series (i.e., a total of 6 runs).
One series uses counterclockwise steering and the other uses clockwise steering. During each
test run, ESC system activation must be confirmed. If ESC system activation does not occur
during the maneuver, then the steering wheel angle is increased in 270-degree increments until
the vehicle’s maximum allowable steering wheel angle is reached or until ESC activation is
confirmed.
The steering wheel angle determined by SIS would be used to program the automated steering
machine for subsequent SWD test. The steering wheel angle is that which would produce 0.5 g
of lateral acceleration in the test vehicle at a constant speed of 30 mph. This angle is determined
by extrapolating the linear regression results of the steering wheel angle and lateral acceleration

II-6
from the SIS test data. The 0.5 g lateral acceleration at 30mph is a level at which a loaded heavy
vehicle is highly likely to experience roll instability. As we understand, the relationship
between the steering wheel angle and lateral acceleration varies with vehicles due to differences
in steering gear ratios, suspension systems, wheelbase, and other vehicle characteristics. Using
the established steering wheel angle in the subsequent SWD tests is to ensure that each vehicle is
subjected to the same test severity and is likely to experience the same instability condition.
Engine Torque Reduction Criterion
ESC would be required to reduce the engine torque output by a minimum of 10 percent from the
torque output requested by the driver at 1.5 seconds after it is activated. For the confirmation of
ESC activation and evaluating the engine torque reduction capability by ESC, engine torque
output and driver requested torque are collected from the vehicle’s J1939 communication data
link and compared. During the initial stages of an SIS test, the rate of change over a period of
time for engine torque output and driver requested torque will be consistent. If ESC is activated,
engine torque will be reduced and the rate of change for engine torque output and driver
requested torque will diverge over time. The agency believes that 1.5 seconds after the ESC is
activated, appreciable engine torque reduction can be measured.
Sine With Dwell Maneuver (SWD)
The proposed SWD maneuver subjects a vehicle to both roll and yaw instabilities and thus
allows the agency to verify the performance of ESC in mitigating those instabilities. ESC would
be required to comply with the proposed lateral stability, yaw stability, and responsiveness
criteria.

II-7
Test Maneuver
SWD is a maneuver based on a 0.5 Hz (half cycle per second) sinusoidal steering input with a
pause (i.e., dwell) of 1.0 second after completion of the third quarter-cycle of the sinusoid.
Hence, the total time for the steering maneuver is three seconds. Figure II-1 depicts the SWD
maneuver. To ensure accurate, repeatable, and reproducible results, the performance test uses a
steering machine to deliver the maneuver to the steering wheel. Steering is initiated at 72 km/h
(45 mph) with an allowable variation in initial speed of 1.6 km/h (i.e., 45 mph + 1.0 mph). One
series uses counterclockwise steering for the first half cycle. The other series uses clockwise
steering for the first half cycle. The steering amplitude for the initial run of each series is 0.3A,
where A is the steering wheel angle determined from the SIS maneuvers. In each of the
successive test runs, the steering amplitude would be increased by increments of 0.1A until a
steering amplitude of 1.3A, or 400 degrees maximum is achieved.
Figure II-1
Sine with Dwell by Steering Wheel Angle Inputs
For a truck tractor, the SWD test would be conducted with the tractor coupled to a test trailer and
loaded to 80 percent of the tractor’s GVWR. The trailer is equipped with outriggers in case the

II-8
ESC system does not function properly to prevent the tractor-trailer combination from rolling
over. The trailer loaded with ballast that has a low center-of-gravity (CG) height which
minimizes the likelihood of trailer rollover. This load and test configuration enables the tractor’s
ESC mass estimation program to sense that the tractor is heavily loaded and thus provide full
tractor braking intervention during the SWD maneuver.
For a bus, the vehicle is loaded with a 68 kg (150 pounds) water dummy in each of the vehicle’s
designated seating positions, which would bring the bus’ weight to less than its GVWR. No
additional ballast is required to maintain the desired CG height of the test load.
Initially, the agency examined six maneuvers for roll stability and six maneuvers for yaw
stability performance. Maneuvers for roll stability included: SIS, SWD, Constant Radius
Increasing Velocity, 150-foot Radius J-turns, Double-Lane-Change, and Ramp Steer Maneuver
(RSM). Maneuvers for testing roll stability performance included SIS, SWD, Half Sine with
Dwell, RSM, Ramp with Dwell, and 150-foot Radius Braking-in-a-Curve. In addition, the
agency also reviewed test maneuvers suggested by the industry and suppliers of stability control
systems. These maneuvers include: a 500-foot Wet Jennite Curve Drive-Through from the
Truck & Engine Manufacturers Association (EMA)15 for yaw stability, a sinusoidal steering
maneuver and a ramp with dwell maneuver from Bendix, and a lane change maneuver (on a
large diameter circle) from Volvo.
After completing this research, SIS and SWD maneuvers were selected. Specifically, SWD was
selected over other maneuvers due to its objectivity, practicability, repeatability, and 15 Previously, Truck Manufacturers Association (TMA)

II-9
representativeness. SWD is highly objective because it will initiate roll, oversteer, and
understeer intervention for every tested ESC system and because it will discriminate strongly
between many vehicles with and without ESC (or with ESC disabled). The maneuver is
practicable because it can easily be programmed into the steering machine and because it
simplifies the test instrumentation due to its lack of closed-loop feedback control (e.g., yaw
acceleration). It is repeatable due to the use of a steering machine thereby minimizing driver
effects. In addition, the maneuver, similar to the test maneuver specified in the FMVSS No. 126,
is representative of steering inputs produced by human drivers in an emergency obstacle
avoidance situation such as performing severe lane change maneuver. Furthermore, SWD is
able to address rollover, lateral stability, and responsiveness while other maneuvers are required
to be paired in order to achieve the similar test condition. Finally, the SWD maneuver can be
applied to both truck tractors and large buses for evaluating ESC performance while other tests
may not be able to. Thus, proposing SWD reduces the number of required performance tests for
ESC. Readers interested in the detailed test maneuvers and test results can consult the NHTSA
research reports that were listed in Chapter I.
Performance Criteria
Lateral Acceleration Ratio (LAR)
LAR is developed to evaluate the ability of ESC in mitigating rollovers, i.e., to evaluate the RSC
function of the ESC system. LAR is the ratio of lateral acceleration corrected for the vehicle’s
roll angle at a specific time to the maximum lateral acceleration measured between 4.5 seconds
after the beginning of steering and the time when steering is completed. The beginning of
steering is the point at which the maneuver begins and the steering wheel angle begins to change

II-10
from 0 degree. The completion of steering is the point at which the maneuver ends and the
steering wheel angle returns to 0 degree. ESC would be required to meet two LAR performance
limits (i.e., the maximum allowable value of the ratio):
(1) 0.75 second after completion of the steering input for the 0.5 Hz, 72 km/h Sine with Dwell
maneuver, LAR has to be less than or equal to 30 percent.
(2) 1.50 second after completion of the steering input for the 0.5 Hz, 72 km/h Sine with Dwell
maneuver, LAR has to be less than or equal to 10 percent.
LAR can be represented in mathematical notations as follows:
%30100max
)75.0( 0 <=×+
imum
t
AA
and
%10100max
)75.1( 0 <=×+
imum
t
AA
Where,
inputsteering of completiontoTimet tandinput sterring of 1.0 between onaccelerati lateral MaximumA
seconds) (int at time onaccelerati LateralA
0
0maximum
t
===
LAR is considered as the normalized lateral acceleration measure which is found to be a more
robust measurement than simply the lateral acceleration for assessing roll stability performance.
Based on the agency’s test experience, LAR adequately differentiated vehicles equipped with
RSC (i.e., the RSC function of the ESC) and without RSC under the roll stability test conditions.

II-11
Other than LAR and lateral acceleration, the agency also examined a wheel lift measurement for
roll stability performance. Although wheel lift is the most straightforward measure among all
the measurements that were evaluated by the agency, its indication of an imminent rollover is
less certain than LAR and the lateral acceleration. Certain vehicle suspensions are designed to
permit wheel lift during severe cornering maneuvers. Non-uniform road surfaces also can cause
brief wheel lift events. These wheel lifted conditions do not necessarily imply that rollover is
imminent. Thus, wheel lift is not considered as a performance measure in the agency’s proposal.
Yaw Rate Ratio (YRR)
YRR is developed to evaluate the ability of ESC in mitigating LOC crashes. YRR is the ratio of
vehicle yaw rate at a specified time to the first local peak yaw rate generated by the 0.5 Hz Sine
with Dwell steering reversal. The performance limits (i.e., the two maximum allowable values
of the ratio) establish a five percent spinout threshold when ESC intervenes. In other words, an
ESC-equipped vehicle has a less than five percent probability of not satisfying NHTSA’s spinout
definition if the vehicle meets the required lateral criteria. More specifically, YRR measures
how quickly the vehicle stops turning or rotating about its vertical axis, after the steering wheel
is returned to the straight-ahead position. A vehicle that continues to turn or rotate about its
vertical axis for an extended period after the steering wheel has been returned to a straight-ahead
position is most likely experiencing loss of control. ESC is required to meet the following two
YRR performance limits:
(1) 0.75 seconds after completion of the steering input for the 0.5 Hz Sine with Dwell maneuver,
the yaw rate of the vehicle has to be less than or equal to 40 percent of the first local peak
yaw rate produced by the steering reversal.

II-12
(2) 1.50 seconds after completion of the steering input, the yaw rate of the vehicle has to be less
than or equal to 15 percent of the first local peak yaw rate produced by the steering reversal.
The YRR criteria can be noted as:
%40100)75.0( 0 <=×+
Peak
t
ψψ
, and
%15100)50.1( 0 <=×+
Peak
t
ψψ
Where,
inputsteering of completiontoTimetinput sterring Dwell withSine Hz0.5 by the generated rateyawpeak localFirst ψ
seconds) (int timeatrateYawψ
0
Peak
t
===
Based on the agency’s analysis, we anticipate that an ESC system meeting these lateral stability
criteria would significantly prevent the probability of a spinout during the conduct of the SWD
maneuvers.
Lateral Displacement (LD)
LD will be used to measure the ability of a vehicle to respond to the driver’s inputs during an
ESC intervention. The criterion is defined as the lateral displacement of the vehicle’s center of
gravity with respect to its initial straight path during the initial stage of the sine with dwell
maneuver. The criterion performance limit establishes the displacement threshold to ensure that
the ESC intervention used to achieve acceptable lateral stability does not compromise the ability
of the vehicle to respond to the driver’s input. The proposal requires that an ESC-equipped

II-13
vehicle would have a lateral displacement of at least 2.13 meters (7 feet) at 1.50 seconds after the
initiation of steering for truck tractors, and 1.52 meters (5 feet) for large buses. The lateral
displacement at 1.50 seconds after initiation of the steering input (the 1.50-seconds-lateral-
displacement) can be calculated using the following double integration formula:
Where, t0 = Steering wheel input starting time
AC.G = Lateral acceleration, corrected for the effects of roll angle and sensor offset from the vehicle C.G. position.
The double integration technique for calculating the lateral displacement was presented by the
Alliance on September 7, 2005.16 The technique was adapted by the agency and is incorporated
in FMVSS No. 126.
C. ESC Malfunction Telltale and Symbol
The proposal would require a yellow ESC malfunction telltale identified by either the acronym
“ESC” or the following symbol:
16 Docket Number NHTSA-2005-19951
≥≥
= ∫ ∫+ +
esmotorcoachfor meters, 1.52tractorsfor truck meters, 2.13
(t)dtAyent DisplacemLateral1.50t
t
1.50t
t C.G.0
0
0
0

II-14
This symbol and the alternative text are included in Table 1 of FMVSS No. 101, Controls and
Displays. The malfunction telltale is required to be mounted inside the occupant compartment in
front of and in clear view of the driver. The malfunction telltale is required to illuminate after
the occurrence of one or more ESC malfunctions that affect the generation or transmission of
control or response signals in the vehicle’s ESC system. Such telltale is required to remain
continuously illuminated for as long as the malfunction exists, whenever the ignition locking
system is in the “On” (“Run”) position. The ESC malfunction telltale must extinguish at the
initiation of the next ignition cycle after any malfunctions have been corrected.
D. ESC Off Switch, Telltale and Symbol
The proposal would not allow an ESC on/off switch in truck tractors or large buses. Based on
our observation on light vehicle ESC systems, although ESC on/off switches are permitted in
FMVSS No. 126, disabling the ESC system reduces the potential safety benefits of the system.
The agency believes that heavy vehicles handling and control characteristics differ substantially
compared to light vehicles and as a result the agency does not believe there is a needs for
allowing an ESC on/off switch in heavy vehicles. The agency believes that all truck tractors
currently sold with ESC systems are also equipped with traction control systems. Therefore,
there would be no need to turn off the ESC when starting to move the vehicle on a slippery or
loosely-packed road surface.

III-1
CHAPTER III. HOW ESC WORKS
A. ESC SYSTEMS
Meritor WABCO pioneered the ESC system for commercial vehicles in 2001 when the company
offered the system as an option on the company's electronic braking system (EBS). The company
is one of the leading providers of electronic braking, stability, suspension and transmission
control systems for the commercial vehicle industry. Currently, ESC for heavy trucks and large
buses primarily are produced by two companies17: Meritor WABCO and Bendix.
An ESC system utilizes computers to control individual wheel brake torque and assists the driver
in maintaining control of the vehicle by keeping the vehicle headed in the direction the driver is
steering even when the vehicle nears or reaches the limits of road traction. For example, during
sudden lane changes or while cornering at excessive speed, ESC can help prevent truck-trailer
combinations from rolling-over, skidding, or jack-knifing. Stabilization of the vehicle is
achieved by selective braking on each wheel, or simultaneous application the brakes on several
wheels, concurrent with automatic reductions in engine power.
A. How ESC Prevents Rollovers
Lateral acceleration is the primary cause of rollovers. Figure III-1 depicts a simplified rollover
condition. As shown, when the lateral force (i.e., lateral acceleration) is sufficient large and
17 Haldex also produce stability control systems but for trailers only

III-2
exceeds the roll stability threshold of the tractor-trailer combination vehicle, the vehicle will roll
over. Many factors related to the drivers’ maneuvers, heavy vehicle loading conditions, vehicle
handling characteristics, roadway design, and road surface properties would result in various
lateral accelerations and influences on the rollover propensity of a vehicle. For example, given
other factors are equal, a vehicle entering a curve at a higher speed is more likely to roll than a
vehicle entering the curve at a lower speed. Transporting a high center of gravity (CG) load
would increase the rollover probability more than transporting a relatively lower CG load.
Contributing factors in truck rollover crashes include: the driver making an abrupt steering input
during a lane-change maneuver, or attempting to recover from a run-off-road event; driving with
improperly secured cargo that can shift in transit; other shifting or sloshing loads ((such as
transporting cattle or partial loads of liquids in tanker trailers), ); vehicle in-service defects such
as worn or broken suspension components or underinflated or worn (low tread depth) tires;
improper superelevation design or construction of curved roadways; driving on roadway
shoulders that may have the wrong superelevation direction for a given curve; and improper or
missing curve speed warning signs. These operational issues can all lead to an increased
likelihood of a truck rollover.

III-3
Figure III-1 Rollover Condition
The RSC function within an ESC system uses a lateral accelerometer to measure lateral
acceleration. When RSC detects the acceleration reaching the estimated roll stability threshold
of the truck, it intervenes and decelerates the vehicle by reducing engine throttle and engaging
the tractor drive axle and trailer brakes to reduce the lateral acceleration of the vehicle and
prevent a rollover from occurring.
Lateral Force
G Force
Center of Gravity

III-4
B. How ESC Prevents Loss of Control
In addition to a lateral acceleration sensor, ESC uses two additional sensors to monitor the
vehicle for yaw instability (oversteer) or for loss of directional control (understeer). One is a
steering wheel angle sensor which senses the intended direction of a vehicle. The other one is a
yaw rate sensor which measures the actual turning movement of the vehicle. When imbalance
between these two measures occurs, the vehicle is either in an understeering (plowing out) or
oversteering (spinning out) condition. When ESC detects an imbalance, it automatically
intervenes by using selective braking of individual wheels on the tractor. ESC is further
differentiated from RSC in that it has the ability to selectively apply the front steer axle brakes
whereas the RSC system does not incorporate this feature.
Figure III-2 illustrates the oversteering and understeering conditions18. While Figure III-1 may
suggest that a particular vehicle lose control due to either oversteer or understeer, it is quite
possible that a vehicle could require both understeering and oversteering interventions during
progressive phases of a complex crash avoidance maneuver such as a double lane change.
Oversteering. Figure III-2, the right side shows that the truck tractor entered a right curve that is
too sharp for the speed that the tractor is traveling. The rear of the vehicle begins to slide which
would lead to a non-ESC vehicle spinning out. If the tractor is towing a trailer, this is also called
a jackknife crash; the tractor spins around and may make physical contact with the side of the
trailer. An oversteering vehicle is considered to be yaw-unstable because the tractor rotation
18 Adopted from the report “Concept of Operation and Voluntary Operational Requirements for Vehicle Stability Systems (VSS) On-Board Commercial Motor Vehicles”, Federal Motor Carrier Safety Administration, July 2005, FMCSA-MCRR-05-006

III-5
occurs without a corresponding increase in steering wheel angle by the driver, and the driver has
also lost directional control of the vehicle (i.e., loss-of-control or LOC).
Understeering. Figure III-2, the left side shows a similar situation faced by a truck tractor whose
response as it exceeds the limits of road traction is first sliding at the front (“plowing out” ).
Such a vehicle is considered to be yaw-stable because no increase in tractor rotation occurs when
the driver increases the steering wheel angle. However, the driver has lost directional control of
the tractor.
An ESC system maintains what is known as “yaw” (or heading) control by determining the
driver’s intended heading via steering wheel angle sensors, measuring the vehicle’s actual
response, and automatically adjusting the turning behavior of the vehicle if its response does not
match the driver’s intention. However, with ESC, turning is accomplished by unbalanced forces
at the tire-road interface from the brake torque being applied at a particular corner of the vehicle,
from the brake torque rather than from steering input. Speed and steering angle measurements
are used to determine the driver’s intended heading. The vehicle response is measured in terms
of lateral acceleration and yaw rate by onboard sensors. If the vehicle is responding properly to
the driver, the vehicle is considered to be yaw-stable and the driver has full directional control of
the vehicle.
The concept of “yaw rate” can be illustrated by imagining the view from above of a truck
following a large circle painted on a parking lot. One is looking at the top of the roof of the

III-6
vehicle and seeing the circle. If the truck starts in a heading pointed north and drives half way
around circle, its new heading is south. Its yaw angle has changed 180 degrees. If it takes 10
seconds to go half way around the circle, the “yaw rate” is 180 degrees per 10 seconds (deg/sec)
or 18 deg/sec. If the speed stays the same, the truck is constantly rotating at a rate of 18 deg/sec
around a vertical axis that passes through the vehicle’s center of gravity. If the speed is doubled,
the yaw rate increases to 36 deg/sec.
As depicted in Figure III-2, for example, while driving in a circle, the driver notices that he must
hold the steering wheel tightly to avoid sliding toward the passenger seat. The bracing force is
necessary to overcome the lateral acceleration that is caused by the truck tractor following the
curve. When the speed is doubled, the lateral acceleration increases by a factor of four if the
truck follows the same circle. There is a fixed physical relationship between the truck’s speed,
the radius of its circular path, and its lateral acceleration. Since the ESC system measures the
truck’s speed and its lateral acceleration, it can compute the radius of the circle and subsequently
the correct yaw rate for a vehicle following the path. The ESC system then compares the actual
measured yaw rate acquired from the onboard yaw rate sensor to that computed for the path the
truck is following. When the computed and measured yaw rates begin to diverge as the vehicle’s
speed is increased to the point where the driver is beginning to lose control, A vehicle unassisted
by ESC soon would have a heading significantly different from the desired path and would be
out-of-control either by spinning out or plowing out. An ESC system has the ability to detect
the imbalance and attempts to correct it by automatically applying brake torque (typically at one
corner of the vehicle, but sometimes at more than one corner of the vehicle) - rather than by

III-7
redirecting the vehicle’s steer tires. The intervention of ESC will cause the vehicle’s heading to
change thus allow the driver to regain control of the vehicle.
Figure III-2 Loss-of-Control Conditions
Oversteering (“Spinning Understeering (“Plowing

IV-1
CHAPTER IV. BENEFITS
ESC is a crash avoidance countermeasure that would prevent crashes from occurring. Preventing
crashes not only saves lives and reduces injuries. ESC also alleviates crash-related travel delays
and property damage. Therefore, the estimated benefits include both injury and non-injury
components. The “injury benefits” discussed in this chapter are the estimated fatalities and
injuries that would be prevented by the proposal. The non-injury benefits include the travel
delay and property damage savings from crashes that would be avoided by ESC.
Basically, the size of the benefits depends on two elements: (1) the target crash population (P)
and (2) the ESC effectiveness (e) against that population. The overall injury reduction benefit of
the proposal is equal to the product of these two elements and can be expressed mathematically
by the following generic formula:
B = P * e
Where, B = Benefit of the rule,
P = Target crash population, and
e = Effectiveness of ESC.
The target population includes fatalities, non-fatal injuries measured by the maximum
abbreviated injury scale (MAIS), and property damage only vehicles (PDOVs). Fatalities and
MAIS injuries are used for estimating injury reduction benefits. They also combined with

IV-2
PDOVs for for calculating non-injury benefits, i.e., property damage and travel delay savings.
The estimated injury benefits are then translated into fatal equivalents to derive cost-
effectiveness and net benefit estimates of the proposal. The estimated property damage and
travel delay savings are included in the cost to derive the “net cost” of the proposal.
Annual benefits and costs are expressed for a future time when all new vehicles must comply
with the standard and the full on-road vehicle fleet has been converted to comply with the
standard. Under these circumstances, assuming a constant rate of sales over time, the lifetime
impacts on a single model year’s fleet will equal the full on-road fleet impacts in any given
calendar year. The target population was initially derived from the most current available real-
world crash data. The initial target population was then projected to the 2012 level through a
series of adjustments in order to correspond to the cost estimates for ESC which are based on the
2012 model year applicable vehicles. The projection takes into account the impacts of ESC and
RSC that are estimated to be increasingly voluntarily implemented in the future fleet (i.e., 2012
model year vehicles). The impact of stability control system technology not only depends upon
its installation rate on vehicles but also on its effectiveness in preventing crashes. Therefore, the
technology effectiveness is discussed first. Initial target crashes, projected target crashes, and
benefits are discussed in the subsequent sections.

IV-3
A. Effectiveness of ESC and RSC
As stated previously, the agency’s 2011 Research Note on the effectiveness of stability control
systems for truck tractors found overall that ESC is 28 – 36 percent effective in reducing
untripped rollover (i.e., target rollovers) and LOC crashes19. When segregated by crash type,
ESC would reduce 40 – 56 percent of target rollover crashes and 14 percent of LOC crashes. By
comparison, RSC is 21 – 30 percent effective against the same target rollover and LOC crashes.
Separately, RSC is 37 – 53 effective against target rollovers and 3 percent effective against LOC
crashes20. Table IV-1 lists these effectiveness rates which are used in the PRIA for the benefit
analysis.
Table IV-1 Effectiveness Rates for ESC and RSC by Target Crashes
(Current NHTSA Estimates)* Technology Overall Rollover LOC ESC 28 – 36 40 - 56 14 RSC 21 – 30 37 - 53 3
*Adopted from the 2011 NHTSA Research Note “Effectiveness of Stability Control Systems for Truck Tractors”
These effectiveness rates were built upon two earlier studies: (1) a 2008 study on RSC that was
conducted by American Transportation Research Institute and sponsored by the Federal Motor
Carrier Safety Administration (FMCSA)21 and (2) a 2009 study that was conducted by the
University of Michigan Transportation Research Institute (UMTRI) and Meritor WABCO and 19 Effectiveness of Stability Control for Truck Tractor, Research Note, DOT HS 811 437, January 2011 20 these LOC were followed by rollovers 21 Murray, D., Shackelford S., House, A., Analysis of Benefits and Costs of Roll Stability Control Systems, FMCSA-PRT-08-007 October 2008

IV-4
sponsored by NHTSA22. The effectiveness rates from both studies were based on computer
simulation results, expert panel assessments of available crash data, input from trucking fleets
that had adopted the technology, and research experiments. A statistical analysis of vehicles
with and without the technology using real-world crash data was not feasible (even now) since
ESC and RSC penetration in the national in truck tractors is still small since these are relatively
new technologies that have only been installed on a small percentage of new tractors over the
past few years.
The 2008 FMCSA study examined only the effectiveness of RSC and was limited to rollover
crashes. The study estimated that RSC is 37 - 53 percent effective against rollover crashes. The
high end of the effectiveness was based on simulation results for rollovers on curved roadways
due to excessive speed (i.e., untripped rollovers). The low end of the effectiveness was based on
motor carriers’ feedback on 106 rollover cases, of which 39 were considered to have been
preventable by RSC.
The 2009 NHTSA study examined both the effectiveness of RSC and ESC. The study found that
ESC would reduce rollovers by 0 to 75 percent and LOC crashes by18 to 40 percent. The
magnitude of the effect varies depending on roadway alignment (straight, curved) and roadway
surface conditions (dry, wet). These effectiveness estimates were aggregated from the initial
effectiveness rates of these technologies for 159 cases that were identified from FMCSA’s large
truck crash causation study (LTCCS) as candidate target crashes. Eventually, the effectiveness
rates of ESC and RSC against untripped rollover and LOC crashes were aggregated by roadway
22 Woodroffe, J., Blower, D., and Green, P., Safety Benefits of Stability Control Systems for Tractor-Semitrailers, DOT HS 811 205, October 2009

IV-5
alignment (straight versus curved) and roadway condition (dry versus wet). Four sets of
aggregated effectiveness estimates were established for ESC and for RSC. However, these
aggregated effectiveness rates did not take into account the probability of occurrence for
individual cases. Furthermore, in 2010 NHTSA revised the effectiveness of ESC and RSC
downwards for six LTCCS cases and re-categorized the crash type for another two other cases.
After these case revisions, the range of estimated ESC effectiveness against rollovers is 0 percent
on straight, not dry roadways to 75 percent on curved, dry roadways. The ESC effectiveness
against LOC crashes ranged from 7 percent on straight, dry roadways to 19 percent on curved,
dry roadways. For RSC, the corresponding range was 0 to 72 percent against rollovers and 0 to 7
percent against LOC crashes. The effectiveness rates estimated in the 2011 Research Note were
modified by considering the probability of occurrence of each of the 159 LTCCS cases and by
incorporating the mentioned changes for 8 cases. The revised estimated effectiveness for ESC is
a 47 percent reduction of first-event rollovers and a 14 percent reduction of LOC crashes. The
corresponding revised effectiveness for RSC is 44 and 3 percent for rollover and LOC crashes,
respectively.
The revised RSC effectiveness of 44 percent is close to the mid-point between the 37 and 53
percent that were estimated by the 2008 FMCSA study. For the consideration of uncertainty
inherent in the study methodologies, the 2011 Research Note adopted the range of 37 to 53
percent as the effectiveness of RSC for rollover crashes. The effectiveness of ESC against
rollover crashes ranged from 40 to 56 percent, 3 percent higher than those of RSC. The 3
percent is the difference between the RSC and ESC effects that were derived from the 2009
NHTSA study. Due to only one available study that examined the LOC crashes, a point

IV-6
effectiveness estimate is used for LOC crashes. ESC and RSC would reduce LOC crashes by 14
and 3 percent, respectively.
As described previously, only ESC has the ability to apply individual brakes at the corners of a
vehicle to generate re-stabilizing yaw moments about the vehicle’s center of gravity, to prevent a
vehicle from going into a severe understeer or oversteer event. RSC on the other hand typically
applies all of the tractor drive axle brakes using a uniform braking air pressure at all of the drive
axle brakes. As the lateral acceleration of a vehicle increases during a hard cornering event, the
RSC is able to detect this condition and apply the brakes to slow the vehicle down, thus
preventing the vehicle from exceeding the limits of lateral tire traction. This is how RSC is able
to mitigate loss of control. However, when the vehicle is on a slippery road surface and begins
to lose control23, only an ESC system can intervene to maintain vehicle control, since the lateral
acceleration at the limit of lateral tire traction may be low enough not to activate an RSC system
(provided that the vehicle is, for example, in a lightly-loaded condition such that RSC would
allow up to 0.6 g of lateral acceleration before activating). This is why the effectiveness rate for
preventing LOC crashes is higher for ESC than for RSC.
Note that due to limited large bus crash data, it is not feasible to conduct a statistical analysis of
RSC/ESC performance for large buses. Therefore, the RSC/ESC effectiveness developed for
truck tractors is also applied to large buses.
23 For example, LTCCS cases 821005770 and 808006121 are examples of LOC on a slippery road surface. However, these cases were not included in the agency’s effectiveness estimates, since one involved a bobtail tractor and the other involved double trailers. The agency’s effectiveness estimates only included tractor-semitrailer crash-involved vehicles.

IV-7
B. Initial Target Population
The initial target population for benefit estimates includes all occupant fatalities, MAIS 1+ non-
fatal injuries, and PDOVs in: (a) first-event untripped rollover crashes (i.e., target rollovers) and
(b) LOC crashes (e.g., jackknife, cargo shift, avoiding, swerving) that involved the applicable
vehicles and might be prevented if the subject vehicle were equipped with an ESC. For this
analysis, the subject vehicle, specifically in multi-vehicle crashes, is defined as at-fault or the
striking applicable vehicles (i.e., truck tractor/large buses). The target crashes are the two crash
types described above. The criteria used to define target rollovers and LOC crashes are
consistent with or comparable to that used in the 2009 NHTSA report for truck tractors24 and that
used by VOLPE in defining safety problems25. Furthermore, crashes in which vehicle
mechanical problems with tires, braking systems, or transmission were cited as contributing
factors, or in which the driver was drowsy or blacked-out or incapacitated were also excluded
from the target crashes. Generally, the target fatalities and non-fatal injuries should be limited
to target crashes where ESC and RSC were not already standard safety devices in any of the
involved subject vehicles. However, due to insufficient information, the agency was unable to
identify ESC- or RSC-equipped truck-tractors or large buses in the current FARS and GES crash
24 John Woodrooffe, Daniel Blower, Timothy Gordon, Paul E. Green, Brad Liu, Peter Sweatman, Safety Benefits of Stability Control Systems for Tractor-Semitrailers, Final Report, The University of Michigan Transportation Research Institute, October 2009, DOT HS 811 205 http://www.nhtsa.dot.gov/staticfiles/DOT/NHTSA/NRD/Multimedia/PDFs/Crash%20Avoidance/2009/811205.pdf 25 Marco P. daSilva, Greg Ayres, and Wassim G. Najm, Crash Problem Definition and Safety Benefits methodology for Stability Control for Single-Unit Medium and Heavy Trucks and Large Platform Buses, Research and Innovative Technology Administration John A. Volpe National Transportation Systems Center, October 2009, DOT HS 811 099 http://www.nhtsa.dot.gov/staticfiles/DOT/NHTSA/NRD/Multimedia/PDFs/Crash%20Avoidance/2009/811099.pdf

IV-8
data systems26. Thus, the fatalities and injuries in these vehicles were not excluded from the
initial target population. These populations, however, will be excluded from the projected target
population in the next section by using adjustment factors.
Target crashes involving LOC with tractor jackknife included crashes caused by braking-related
lockup of the tractor drive axle wheels for which the countermeasure is the installation of an
antilock brake system (ABS). Since the agency required ABS to be installed on heavy vehicles
starting in 1997, braking-related jackknife crashes have been reduced, but have not been
eliminated due to older tractors remaining in service and due to some ABS-equipped tractors not
having the ABS maintained in proper working condition. Braking-related jackknife crashes have
been accounted for in the effective estimates of RSC and ESC, so that they are not double-
counted as being preventable by both ABS and RSC/ESC27
The initial target populations were retrieved from the 2006-2008 FARS and GES. FARS is a
census of fatalities that occurred in fatal crashes on public roadways. FARS was used to derive
the incidence of fatal target crashes and associated fatalities and non-fatal injuries. GES is a
sampling system of all police-reported crashes. GES was used to derive the MAIS 1+ injuries in
non-fatal target crashes and PDOVs. The purpose of using multiple years of crash data primarily
was to limit variations of large bus crashes and reduce the effects of the recent recession on
crashes involving heavy trucks. Tractor tractors were identified by the vehicle body type
26 The agency notes, however, that the tractor model years from the LTCCS study typically pre-dated the availability of RSC and ESC technologies. Thus the derived effectiveness rates assumes that none of the crash-involved tractors in that study were equipped with RSC or ESC. 27 For example, in the NHTSA 2011 Research Note, LTCSS Case 333006958 was removed from the RSC/ESC applicable categories since tractor and trailer ABS were considered by the agency to be the correct countermeasures to the crash.

IV-9
variable (body type = 66) in both GES and FARS. Large buses were identified as
“Intercity/cross country” bus type or unknown bus types but with a GVWR greater than 26,000
lbs.
As described previously, the 2009 NHTSA study estimated the effectiveness of ESC based on
computer simulations and engineering judgment on 159 LTCCS cases. Then, the study
established comparable target crash definitions in GES that were represented by those 159 cases.
The PRIA adopted these GES definitions for identifying non-fatal target crashes.
FARS was used for establishing fatal target crashes. Variables, data attributes, and data structure
are different between FARS and GES. Fatal target crashes thus cannot be defined as precisely as
those in the GES. Alternatively, a comparable definition was developed by mapping the GES-
variables closely to those in the FARS. FARS variables that were used to define the target
crashes included vehicle forms submitted, vehicle body type, trailing unit, striking/struck status,
the first harmful event, relation to roadway, roadway alignment, roadway condition, rollover
type, jackknife status, driver contributing factor, and vehicle contributing factor. Of these
variables, driver contributing factor, vehicle contributing factors, and vehicle striking/stuck
status were used to refine the target population to exclude crashes in which incapacitated or
drowsy drivers, or vehicle mechanical failures such as brake systems, tires, steering, and
transmissions were cited as contributing factors.

IV-10
Based on 2006-2008 GES and FARS, annually, there were 10,313 policed-reported target
crashes (5,510 first event rollover crashes; 4,803 LOC crashes) 28 that involved truck tractors. A
total of 327 fatalities (K-Injuries), 1,042 incapacitating injuries (A-Injuries), 1,635 non-
capacitating injuries (B-Injuries) and 1,075 possible injuries (C-Injuries) were associated with
these target crashes29. In addition to these injuries, there were 7,332 vehicles subjected to
property-damage only impacts (PDOVs). Table IV-2 shows these initial target crashes, injuries,
PDOVs by crash type (target rollover, LOC crashes), and crash severity (fatal, nonfatal).
From the same crash data sources, the agency estimates that, annually, an average of one target
rollover and one LOC crash involving large buses would be impacted by the proposal. The small
initial population for large buses combined with a high projected voluntary ESC installation in
MY 2012 large buses results in negligible benefits. Therefore, hereafter, target population and
subsequent benefit estimates for large buses are not presented in the analysis. The target
population for truck tractors thus represents the target population of the proposal.
Table IV-2 Initial Target Crashes, KABCO injuries, and PDOVs
by Crash Type, Crash Severity, and Injury Severity Crash Police-Reported KABCO Injuries Type Crashes K A B C O PDOVs Rollover 5,510 111 630 1,107 754 275 3,297 LOC 4,803 216 412 528 321 243 3,935 Total 10,313 327 1,042 1,635 1,075 518 7,332 Source: 2006 - 2008 FARS, 2006 - 2008 GES Rollover: first event rollover crashes; LOC: loss-of-control crashes; PDOVs: property damage only vehicles
28 This estimate excludes first event rollover and LOC crashes where (1) the subject vehicles were the struck vehicles, (2) drivers of the subject vehicles were drowsy and used alcohol, (3) and tire, brake, transmission, steering column is cited as contributing factor. 29 Police-reported injury severity (KABCO), K: fatality, A: incapacitated injury, B: non-incapacitated injury, C: possible injury, and O: no injury.

IV-11
The next step is to translate the initial target population from police-reported KABCO injuries to
AIS 1-5 injuries through a KABCO-AIS conversion table. The conversion allows the use of the
crash unit costs which were developed by the agency and were based on the Abbreviated Injury
Scale (AIS) system30. A conversion table was established using two data systems: 2000 – 2008
Crashworthiness Data Systems (CDS) and 1982 – 1986 National Accident Sampling System
(Old NASS). CDS is a sample system of passenger vehicle crashes in which at least one
passenger vehicle was towed away from the crash site. CDS collects injury information only for
passenger vehicle occupants in a more severe crash environment (i.e., at least one passenger
vehicle was towed). Therefore, a KABCO-to-AIS translation table derived solely from CDS
might not be representative of the overall injury outcomes especially for those involving heavy
vehicles. The Old NASS data, on the other hand, were a nationally representative sample of all
crashes of all vehicle types on public roadways. However, as the name indicated, the Old NASS
system is a relatively ancient crash database. The crash environment and vehicle technologies
have changed since 1986, the last year of the Old NASS system. Further, the AIS system was
revised several times (1995, 1998, and 2005)31 to take into account the improvement of
emergency response and advancement of medical technologies. A conversion table derived
solely from the Old NASS thus might not appropriately reflect the current injury outcomes. In
order to balance the representation of crash sample, sample size, and the reflection of AIS coding
updates, non-CDS types of crashes from Old NASS were combined with CDS incidents to
generate the conversion table. The translated AIS injuries are assumed to be the maximum
severity injuries (i.e., MAIS) for associated occupants. Table IV-3 shows the KABCO-to-MAIS
30 See Footnote 3. 31 The 1995 version is implemented in the current CDS up to 2009.

IV-12
conversion table. Note that the police-reported fatal injuries (K) were all attributed to fatalities
in MAIS system.
Table IV-3 KABCO-to-MAIS Conversion Table
Police-Reported Injury Severity System MAIS O C B A K U
No
Injury Possible Injury
Non Incapacita-
ting Incapacita-
ting Fatality
Injured, Severity
Unknown Unknown 0 0.92535 0.23431 0.08336 0.03421 0.00000 0.21528 0.42930 1 0.07257 0.68929 0.76745 0.55195 0.00000 0.62699 0.41027 2 0.00198 0.06389 0.10884 0.20812 0.00000 0.10395 0.08721 3 0.00008 0.01071 0.03187 0.14371 0.00000 0.03856 0.04735 4 0.00000 0.00142 0.00619 0.03968 0.00000 0.00442 0.00606 5 0.00003 0.00013 0.00101 0.01775 0.00000 0.01034 0.00274
Killed 0.00000 0.00025 0.00128 0.00458 1.00000 0.00046 0.01707 Total 1.00001 1.00000 1.00000 1.00000 1.00000 1.00000 1.00000 Source: 1982-1986 Old NASS; 2000-2008 CDS
Applying the KABCO-to-MAIS conversion factors to corresponding initial KABCO non-fatal
injuries reported in Table IV-2 derives the initial non-fatal MAIS injuries. For example, of the A
injuries, 3.34 percent would be MAIS 0 injuries, 55.20 percent would be MAIS 1 injuries, 20.81
percent would be MAIS 2 injuries, 14.37 percent would be MAIS 3 injuries, 3.97 percent would
be MAIS 4 injuries, 1.78 percent would be MAIS 5 injuries, and 0.46 percent would be fatalities.
Thus, the 1,042 A injuries reported in Table IV-25 were translated into MAIS injuries according
to these percentages and became: 575 MAIS 1 injuries, 217 MAIS 2 injuries, 150 MAIS 3
injuries, 41 MAIS 4 injuries, 18 MAIS 5 injuries. Table IV-4 reported these translated initial
MAIS 1-5 injuries. As shown in Tables IV-4, there were a total of 3,358 target MAIS non-fatal
injuries. Of these, 2,217 were associated with the target rollover crashes and 1,141 were
associated with LOC crashes.

IV-13
Table IV-4 Initial Target Crashes, MAIS injuries, and PDOVs
by Crash Type, Crash Severity, Injury Severity, and Vehicle Type Crash
Crashes
MAIS Non-Fatal Injuries Type
Fatalities 1 2 3 4 5
1-5 PDOVs Rollover 5,510 111 1,738 300 134 33 12 2,217 3,297 LOC 4,803 216 871 164 79 19 8 1,141 3,935 Total 10,313 327 2,609 464 213 52 20 3,358 7,332 Source: 2006 - 2008 FARS, 2006 - 2008 GES Rollover: first event rollover crashes; LOC: loss-of-control crashes; PODVs: property damage only vehicles
C. Projected Target Population
As described earlier, the projected target population is the target crashes at the 2012 level. The
2012 level was chosen to correspond to the cost estimate (Chapter V) that was based on the 2012
model applicable vehicles. Basically, the projection takes into account the impact of higher
ESC/RSC installation rates in the 2012 model applicable vehicles. ESC and RSC both are found
to reduce rollover and LOC crashes. Therefore, their effects are required to be considered
simultaneously when projecting the target population.
Generally, the “potential” target crashes, i.e., initial target crashes combined with those that will
have been prevented by the ESC and RSC technologies is the base for projecting the future level
of target crashes. Those crashes that will be prevented by ESC and RSC can be estimated if their
installation rates in the initial target crashes can be established. Due to a lack of detailed truck
information in GES and FARS, which were used to establish the initial target population, the
ESC/RSC installation rates for truck tractors cannot be obtained. Alternatively, the analysis used

IV-14
the initial target crashes as the base for projection and used adjustment factors to address this
issue.
Two crash-based adjustment factors are developed to account for both the impacts of the
increased RSC/ESC installation rates and the impacts of using the initial target crashes as the
base. These adjustment factorswere established by using the ESC and RSC installation rates
among the operational fleet of truck tractors in calendar year 2006 to 2008 to correspond the
years of crash data that were used to derive the initial target population and the estimated
installation rates in MY 2012 truck tractors. Therefore, the process eliminates the need for
acquiring the installation rates in the real-world crash database. The estimated/projected ESC
and RSC installation rates for MY 2005 to 2012 truck tractors are presented in Chapter V, Cost
and Leadtime. Of these, installation rates for MY 2005 to 2008 and were used for deriving the
overall ESC and RSC installation rates in the operational fleet of truck tractors. Installation rates
for MY 2004 and older truck tractors are assumed to be zero percent.
These two factors are: (1) the ratio of projected rollover and LOC crashes in 2012 that would not
involve ESC- and RSC-equipped applicable vehicles to those at the baseline level (f1) and (2) the
relative portion of projected target crashes that already had RSC and can be further impacted by
ESC (f2) to those projected crashes without either ESC and RSC. Applying the first factor, f1, to
the initial target crashes derives the projected target crashes in which the involved applicable
vehicles would have neither ESC nor RSC (Base 1). Applying the second factor, f2, to Base 1
derives additional crashes in which the involved applicable vehicles would already have RSC but
can be further benefited by ESC (Base 2). Base 1 and Base 2 combined is the total target

IV-15
population for calculating the benefits of ESCs. However, Base 1 would benefit from the overall
effectiveness of ESC. Base 2 would benefit from ESC incrementally over RSC.
The base target population of the proposal thus can be represented as:
PP = (Base 1) + (Base 2)
= IP * f1 + IP * f1* f2
Where, PP = target crashes (rollovers or LOC crashes)
IP = initial target crashes
f1 = ratio of 2012 target crashes with no RSC or ESC to the initial target crashes
f2 = ratio of 2012 target crashes with RSC to Base 1.
These crash-based adjustment factors are also applied to the initial target fatalities, injuries, and
PDOVs to derive the base injury population and PDOVs.
The First Adjustment Factor f1
For each target crash type (i.e., rollovers or LOC), the adjustment factor, f1, is the ratio of that
crash type without ESC or RSC at the 2012 level to the initial target crashes of that type. The
ratio can be derived from ESC/RSC effectiveness and ESC/RSC installation rates in the 2012
model fleet and those in the on-road fleet of truck tractors from the base years 2006 to 2008. For
each target crash type, f1 can be mathematically expressed as follows:
)(1I)(1I)I(1
)I(1
eefRSCESC
Combined
1 IRSC
IESC
ICombined
F
−+−+−
−=
Where, FCombinedI = Future combined ESC and RSC installation rate (i.e., 2012)

IV-16
IiI = Initial installation rate for technology i (i=ESC, RSC, or ESC and RSC combined)
ie = Effectiveness of technology i (i = ESC or RSC) against a specific target crash type.
Of the parameters in f1, the installation rates (ei) were based on the industry’s response to the
agency’s request for historic and projected ESC and RSC installation information. From their
submissions32, the agency estimates that about 1.9 percent of the on-road fleet of truck tractors
(up to 2008 models) were equipped with ESC and 3.3 percent were equipped with RSC. In
2012, about 26.2 percent of truck tractors manufactured that year would be equipped with ESC
and an additional 16.0 percent would be equipped with RSC.
The effectiveness rates of ESC and RSC against rollovers each is represented by a range.
Therefore, the values of f1 (f2 also, see the following section) for rollovers should also be a range.
However, the range is narrow enough that it would not significantly affect the projected target
population and subsequent benefit analysis. Therefore, to simplify the projection process, the
average between the lower and higher effectiveness of ESC (RSC also) against rollovers were
used to derive the mean f1 (also f2).
Therefore, for truck tractors, the following numbers were used to drive the f1 factor for rollover
crashes: IESCI = 1.9 percent, IRSC
I = 3.3 percent, ICombinedI = 5.2 percent (= 1.9 + 3.3),
ICombinedF = 42.2 percent (= 26.2 + 16.0), eESC= 48 percent, and eRSC= 45 percent. Thus, f1 = 59.2
percent. Of these, the 48 percent effectiveness for ESC and 45 percent effectiveness for RSC, as
described, are the average of the lower and upper bounds of the rollover effectiveness. For LOC 32 There are only 7 heavy truck manufacturers. Since the number of submissions is small, their data are not published here to ensure confidentiality and preserve each company’s competitiveness.

IV-17
crashes, f1 = 58.0 percent. In this case, values for various installation rates are the same as
shown above. The only changes are the effectiveness rates: eESC= 14 percent and
eRSC= 3 percent.
For large buses, no on-road vehicles in the fleet for the base years were equipped with ESC or
RSC (i.e., ICombinedI = IESC
I= IRSC
I = 0.0 percent). About 80.0 percent of MY 2012 large buses
would be equipped with ESC and 0 percent would with RSC. Therefore, ICombinedF = 80.0 percent.
Using the same effectiveness that was found for truck tractors, f1 = 20.0 percent for both
rollovers and LOC crashes.
The Second Adjustment Factor f2
The factor determines the size of Base 2 relative to Base 1. It can be mathematically represented
as:
)I(1If F
Combined
FRSC
2 −=
Where, F
RSCI = Future RSC installation rate (i.e., 2012)
FCombinedI = Future combined ESC and RSC installation rate (i.e., 2012)
Substituting the above parameters with appropriate values derives 27.7 percent for f2, i.e., f2 =
27.7 percent. This percentage indicates that the size of the additional rollovers and LOC crashes

IV-18
(i.e., crashes among tractors equipped with RSC) that can be incrementally benefited by ESC is
about 27.7 percent of the Base 1. Table IV-5 summarizes the values of f1 and f2 factors. Table
IV-6 lists all the values that are used to calculate f1 and f2.
Table IV-5
Adjustment Factors for Establishing Projected Baseline Population Crash Type
f1
f2 Rollover 59.2% 27.7% LOC 58.0% 27.7%
Table IV-6 Values for Deriving f1 and f2 Adjustment Factors
Initial Future (2012) ESC RSC Combined ESC RSC Combined Installation Rate ( j
iI ) 1.9% 3.3% 5.2% 26.0% 16.0% 42.2%
Effectiveness Against Rollover (ei)*
48% 45% NA 48% 45% NA
Effectiveness Against LOC (ei)
14% 3% NA 14% 3% NA
* Average of low and high effectiveness rates

IV-19
Projected Population
Applying the adjustment factors shown in Table IV-5 to the corresponding initial target crash
population (Table IV-4) derives the projected 2012 baseline population. Table IV-7 lists the
projected baseline population. The first potion of the table presents the Base 1 population. The
second potion is the Base 2 population and the third potion is the total projected population (i.e.,
Base 1 + Base 2).
As shown in Table VI-7, the proposal would eliminate a portion of 7,723 crashes. Thus it would
further reduce the 244 fatalities, 2,522 MAIS 1-5 injuries, and 5,407 PDOVs that were associated
with these crashes (i.e., Base 1 + Base 2). When separating by target crash type, for rollover
crashes, the proposal would impact 4,166 target rollovers, 84 fatalities, 1,677 MAIS 1-5 injuries,
and 2,492 PDOVs. For LOC crashes, the proposal would impact 3,557 LOC crashes, 160
fatalities, 845 MAIS 1-5 injuries, and 2,915 PDOVs. When separating the projected safety
population by the degree to which it would be impacted by the proposed ESC technology, 6,049
crashes, 191 fatalities, 1,975 MAIS 1-5 injuries, and 4,235 PDOVs would be benefited by the
full effectiveness of ESC (i.e., Base 1 population). The remaining 1,674 crashes, 53 fatalities,
547 MAIS 1-5 injuries, and 1,172 PDOVs would be impacted by ESC incrementally over RSC
(i.e., Base 2 population).

IV-20
Table IV-7 Projected Baseline Crashes, MAIS injuries, and PDOVs for 2012 Level
Base 1
Crash
Crashes
MAIS Non-Fatal Injuries Type
Fatalities 1 2 3 4 5
1-5 PDOVs Rollover 3,263 66 1,029 178 79 20 7 1,313 1,952 LOC 2,786 125 505 95 46 11 5 662 2,283 Total 6,049 191 1,534 273 125 31 12 1,975 4,235
Base 2
Crash
Crashes
MAIS Non-Fatal Injuries Type
Fatalities 1 2 3 4 5
1-5 PDOVs Rollover 903 18 285 49 22 6 2 364 540 LOC 771 35 140 26 13 3 1 183 632 Total 1,674 53 425 75 35 9 3 547 1,172
Base 1 + Base 2 (Projected Target Population)
Crash
Crashes
MAIS Non-Fatal Injuries Type
Fatalities 1 2 3 4 5
1-5 PDOVs Rollover 4,166 84 1,314 227 101 26 9 1,677 2,492 LOC 3,557 160 645 121 59 14 6 845 2,915 Total 7,723 244 1,959 348 160 40 15 2,522 5,407 Source: 2006 - 2008 FARS, 2006 - 2008 GES Rollover: first event rollover crashes; LOC: loss-of-control crashes; PODVs: property damage only vehicles
Note that the analysis does not adjust the projected baseline population to address the effects of
current finalized safety regulations and regulations that have not yet been fully phased in.
Current finalized safety regulations on truck tractors and buses that the Agency anticipates will
have an influence on fatalities and injuries include reduced stopping distance requirements for
truck tractors under FMVSS No. 121, Air brake systems. The agency believes that the new
FMVSS No. 121, stopping distance requirements would not impact this rule significantly since

IV-21
rollover and LOC crashes generally are vehicle stability issues involving the modulation and
balance of brake as opposed to the braking force problems addressed by the FMVSS No. 121
final rule. Similarly, the analysis does not adjust the baseline to account for possible increases in
vehicle miles traveled (VMT), a historical trend. Without adjusting for VMT, the benefits
estimated in this analysis would be relatively conservative comparing to those with the VMT
adjustment.
D. Benefits
The benefits of the proposal were derived by multiplying the projected target population (i.e.,
crashes, fatalities, MAIS 1-5 injuries, and PDOVs) by the corresponding effectiveness rates.
Table IV-8-A shows the estimated benefits in which MAIS 1-5 injury benefits are aggregated.
The subsequent Table IV-8-B presents only the MAIS injury benefits but by individual MAIS
level. Both tables summarize the benefits in an identical three-part format. The first part of the
table lists the benefits from the Base 1 population, the second part presents the benefits from
Base 2 population, and the third part is the estimated overall benefits of the proposal (i.e., Base 1
and Base 1 combined).
As shown in Tables IV-8-A, the proposal would prevent 1,807 – 2,329 target crashes, save 49 –
60 fatalities, and reduce 649 – 858 MAIS 1-5 injuries that were associated with these avoided
crashes. Furthermore, the proposal would eliminate 1,187 – 1,499 PDOVs. When disaggregated
by target crash type, the proposal would eliminate 1,332 - 1,854 target rollover crashes and 475
LOC crashes. It is estimated that 27 – 38 fatalities, 537 – 746 MAIS injuries, and 797 – 1,109
PDOVs associated with the prevented target rollovers would be reduced by the proposal. By
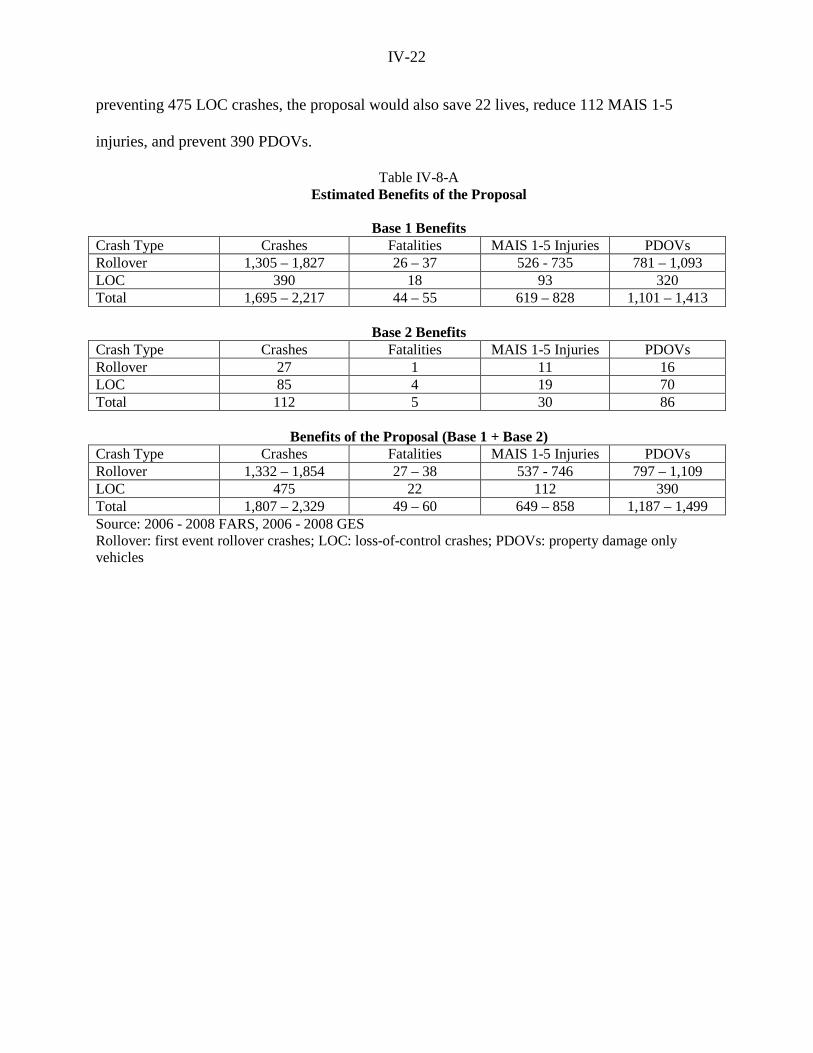
IV-22
preventing 475 LOC crashes, the proposal would also save 22 lives, reduce 112 MAIS 1-5
injuries, and prevent 390 PDOVs.
Table IV-8-A Estimated Benefits of the Proposal
Base 1 Benefits
Crash Type Crashes Fatalities MAIS 1-5 Injuries PDOVs Rollover 1,305 – 1,827 26 – 37 526 - 735 781 – 1,093 LOC 390 18 93 320 Total 1,695 – 2,217 44 – 55 619 – 828 1,101 – 1,413
Base 2 Benefits Crash Type Crashes Fatalities MAIS 1-5 Injuries PDOVs Rollover 27 1 11 16 LOC 85 4 19 70 Total 112 5 30 86
Benefits of the Proposal (Base 1 + Base 2) Crash Type Crashes Fatalities MAIS 1-5 Injuries PDOVs Rollover 1,332 – 1,854 27 – 38 537 - 746 797 – 1,109 LOC 475 22 112 390 Total 1,807 – 2,329 49 – 60 649 – 858 1,187 – 1,499 Source: 2006 - 2008 FARS, 2006 - 2008 GES Rollover: first event rollover crashes; LOC: loss-of-control crashes; PDOVs: property damage only vehicles

IV-23
Table IV-8-B Estimated Expanded MAIS 1-5 Injury Benefits of the Proposal
Base 1 Benefits
Crash Type MAIS 1 MAIS 2 MAIS 3 MAIS 4 MAIS 5 Rollover 412 - 576 71 - 100 32 – 44 8 - 11 3 – 4 LOC 71 13 6 2 1 Total 483 - 647 84 – 113 38 – 50 10 - 13 4 - 5
Base 2 Benefits
Crash Type MAIS 1 MAIS 2 MAIS 3 MAIS 4 MAIS 5 Rollover 9 1 1 0 0 LOC 15 3 1 0 0 Total 24 4 2 0 0
MAIS 1-5 Injury Benefits of the Proposal (Base 1 + Base 2)
Crash Type MAIS 1 MAIS 2 MAIS 3 MAIS 4 MAIS 5 Rollover 421 - 585 72 - 101 33 – 45 8 - 11 3 – 4 LOC 86 16 7 2 1 Total 507 - 671 88 – 117 40 – 52 10 - 13 4 - 5 Source: 2006 - 2008 FARS, 2006 - 2008 GES Rollover: first event rollover crashes; LOC: loss-of-control crashes; PODVs: property damage only vehicles
Note that these benefits were derived by applying the full effectiveness of ESC to the Base 1
target population and an incremental effectiveness of ESC over RSC to the Base 2 population.
The range of benefits is a reflection of the effectiveness range that is used against rollover
crashes. Although the effectiveness rates are crash-based (i.e., against crashes), these rates are
applied directly to fatalities, injuries, and PDOVs to derive benefits. This approach is considered
to be appropriate since preventing a crash would prevent all injuries that would have resulted
from that crash. In addition, the effectiveness rates were derived for all crash severity levels and
thus were uniformly applied to crashes regardless of crash severity (e.g., fatal, nonfatal, or PDO).
Further note that, as described earlier, these estimated benefits were exclusively from truck
tractors. With an extremely small number of target crashes and a projected high ESC installation
rate for MY 2012 large buses, the impact of the proposal on large bus target crashes is negligible.

IV-24
E. Travel Delay and Property Damage Savings
The non-injury component of the benefits includes savings from the elimination of crash-related
travel delay and vehicle property damage. These unit costs are expressed on a per person basis
for all MAIS injury levels and on a per vehicle basis for PDOVs. In 2002, NHTSA estimated
these unit costs based on the value of statistical life (VSL) of $3.0 million and in 2000
economics33. Recently, the DOT issued two new guidelines on VSL. One was in 2008 that
revised the value of VSL from $3.0 million to $5.8 million (2007 economics). Then in 2009, the
value of VSL was revised again to $6.0 million (2008 economics). In response, NHTSA revised
the unit costs by MAIS injury level and fatality accordingly. Appendix B describes the process
of revising the unit costs based on a VSL of $6.0 million (2008 economics). These unit costs
presented in Appendix B were then further adjusted to a 2010 value using a factor of 1.01884 (=
110.668/108.598). This factor was derived using the implicit price deflator for the gross
domestic product (GDP)34.
However, the unit costs estimated by NHTSA are the average costs of all the vehicle crashes and
thus were dominated by the costs of light vehicle crashes. Given the greater mass of the heavy
trucks, the varied cargoes and sometimes hazardous materials that they carry, and the types of
roadways they travel, heavy truck crashes are expected to cause greater property damage and
33 Table 2, Blincoe, L., et al., The Economic Impact of Motor Vehicle Crashes 2000, Washington, DC, DOT HS 809 446, May 2002
(in 2000 $) MAIS 1 MAIS 2 MAIS 3 MAIS 4 MAIS 5 Fatality PDO Travel Delay $777 $846 $940 $999 $9,148 $9,148 $803 Property Damage $3,844 $3,954 $6,799 $9,833 $9,446 $10,273 $1,484
34 Published by Bureau of Economic Analysis, U.S. Department of Commerce, as of May 26, 2011

IV-25
travel delay than do light vehicles. Therefore, NHTSA’s unit travel delay and property damage
costs which were based on all vehicle types might underestimate the costs for heavy truck and
large bus crashes. Due to this concern, in 2009 when the agency issued a final rule for FMVSS
No. 121 Air Brake Systems, amending the stopping distance requirements for truck tractors,
revised property damage costs (including travel delay) based on a 1991 assessment by the
Federal Highway Administration (FHWA)35 were used in the Final Regulatory Impact Analysis
(FRIA) for that rule. The revised unit property damage costs in that 2009 FRIA were in 2007
economics.
However, the 1991 unit cost estimates that the 2009 FRIA was based on are now 20 years old.
Since then, vehicle safety technologies, roadway design, traffic congestion, and emergency
medical response systems have evolved. Therefore, the 1991 cost estimates might not be
representative for the current heavy vehicle crash patterns and injury profile. Furthermore, the
1991 cost estimates did not separate PDO and travel delay and was not specifically for truck
tractors. Therefore, the analysis used the unit costs that were developed specifically for truck
tractor crashes by the Pacific Institute in December 200636. The Pacific Institute produced two
sets of KABCO-based unit costs. One set of costs is per-person based costs and the other set is
per-crash based costs. Property damage and travel delay unit costs that were used in this analysis
are a weighted average of those for truck-tractors with one trailer and those for truck-tractors
with two or three trailers. The KABCO-based weighted unit costs were then translated into
MAIS-based costs through a MAIS-KABCO translator.
35 Final Regulatory Impact Analysis, FMVSS No. 121, Air Brake Systems, Amending Stopping Distance, July 27, 2009, Docket No. 2009-0083-0002.1 (74 FR 37122) 36 Zaloshnja, E. and Miller, T., Unit Costs of Medium and Heavy Truck Crashes, Pacific Institute, December 2006

IV-26
The Pacific Institute did not provide unit costs per PDOV in their 2006 estimates. Therefore, the
unit costs for PDOV were produced from the unit cost per PDO crash (PDOC) by dividing the
weighted average unit costs per PDOC from the two truck tractor categories by a factor of 1.82,
the average number of vehicles per truck tractor PDOC. This factor was derived from the 2006-
2008 GES truck tractor PDOCs. Afterwards, all these unit costs were revised to 2010 economics
by multiplying by a GDP deflator of 1.1067 (= 110.668/100).
Table IV-9 presents the weighted average KABCO-based unit costs and the initial unit costs and
corresponding incidents that were used to derive the weighted costs (2005 economics). Table
IV-10 presents the MAIS-KABCO translator that was used to translate the KABCO-based unit
costs to the MAIS-based costs. The translator was derived using the same process and data
sources as was used for KABCO-MAIS translator which was presented in the target population
section. Table IV-11 presents the translated MAIS-based injury unit costs in 2005 economics.
Table IV-12 shows these unit costs in 2010 economics. For comparison, Table IV-12 also
provides the unit costs that were developed by NHTSA for all vehicles and those published in the
2009 FRIA for truck tractor stopping distance requirements.
As shown in Table IV-12, the revised property damage unit costs grow progressively higher
with the severity level. The property damage unit costs ranged from $4,110 to $28,906 with the
lower value for PDOVs and the higher value for fatalities. The travel delay unit costs ranged
from $3,048 to $6,798.

IV-27
The following shows the calculation of property damage unit costs for MAIS 1. This is used as
an example to demonstrate the process for developing the unit costs that were shown in Table
IV-12.
Example: the development of revised property damage cost for MAIS 1
Step 1: deriving the weighted KABCO-based unit costs as shown in Table IV-9
The weighted cost for O = $2,423 = $2,313*215,614+$1,794*5,593221,207
Where, $2,313 in the numerator is the property damage unit cost per O injury and 215,614 is the
total number of O injuries in crashes involving truck tractors with one trailer. The numbers
$1,794 and 5,593 in the second term of the numerator represent the corresponding unit cost and
incidents for O injuries for truck tractors with two or three trailers, respectively. The weighted
property unit costs for other policed-reported injury severities and PDOCs can be derived using
the same process.
Step 2: translating KABCO-based unit costs to MAIS-based unit costs (Table IV-11)
The property damage unit cost for MAIS 1
= $5,651
=$2,423*0.34403 + $6,681*0.29350+ $8,175*0.19569 +
$2,423*0.34403 + $6,681*0.29350+ $8,175*0.19569 +
$3,488*0.06507
Where, the dollar numbers represent the weighed property damage costs for O, C, B, A K, U
(injured, unknown severity), and unknown if injured (from Table IV-9). The fractions (from
Table IV-10) represent the proportion of each KABCO-based weighted unit cost that is

IV-28
contributed to the unit cost for MAIS 1. Unit costs for the remaining MAIS injury levels and
fatalities can be derived using the same format.
Step 3, revising the costs to 2010 economics (Table IV-12)
Property damage unit cost for MAIS 1 in 2010 economics = $6,254
= $5,651 * 1.1067.
Table IV-9 Process of Deriving Weighted KABCO-Based Unit Costs for Truck Tractors
(2005 $)
Injury Severity Number of Incidents
Cost Per Incident
1 Trailer (d)
2+ Trailers (f)
Weighted Unit Cost (g)
1 Trailer (a)
2+ Trailers (b)
Total (c) PD TD PD TD PD TD
O 215,614 5,593 221,207 $2,313 $1,794 $6,673 $1,844 $2,423 $1,795 C 29,283 1,064 30,347 $6,274 $4,109 $17,877 $4,138 $6,681 $4,110 B 27,240 939 28,179 $7,708 $4,477 $21,713 $4,451 $8,175 $4,476 A 15,429 1,603 17,032 $9,314 $4,740 $26,294 $4,751 $10,912 $4,741 K 3,296 214 3,510 $23,509 $6,143 $66,336 $6,143 $26,120 $6,143 U 1,172 28 1,200 $4,601 $3,036 $10,102 $1,880 $4,729 $3,009 Unknown 13,843 456 14,299 $3,381 $1,891 $6,744 $2,051 $3,488 $1,896 PDOC 179,181 4,976 184,157 $6,493 $5,024 $16,350 $4,568 $6,759 $5,012
U: injured, severity unknown; PD: property damage; TD: travel delay; PDOC: property damage only crashes Note: unit costs for PDOC is per crash, the remaining is cost per injured person g= a*d+b*f
c

IV-29
Table IV-10 MAIS to KABCO Translator
MAIS O C B A K Injured Unknown
No Injury Poss Inj Non Incap Incapaci Killed Severity U
0 0.94853 0.02735 0.00526 0.00126 0.00002 0.00119 0.01638 1 0.34403 0.29350 0.19569 0.08836 0.00011 0.01324 0.06507 2 0.08242 0.23931 0.24411 0.29306 0.00014 0.01930 0.12166 3 0.00887 0.10263 0.18282 0.51754 0.00087 0.01831 0.16898 4 0.00185 0.06244 0.16386 0.65931 0.00292 0.00970 0.09992 5 0.03346 0.01478 0.06555 0.71902 0.00116 0.05510 0.11094
Killed 0.00000 0.00000 0.00000 0.00000 1.00000 0.00000 0.00000 Source: 1982-1986 Old NASS; 2000-2008 CDS
Table IV-11
Property Damage and Travel Delay Unit Costs by MAIS (2005 $)
MAIS Property Damage Travel Delay 0 $2,601 $1,879 1 $5,651 $3,283 2 $7,511 $3,903 3 $8,548 $4,091 4 $9,426 $4,356 5 $9,239 $4,206
Killed $26,120 $6,143 PDOC $3,714 $2,754
PDOC: property damage only crashes
Table IV-12 Property Damage and Travel Delay Unit Costs
(2010 $) Injury Severity
Unit Costs
Used in This PRIA*
2009 FRIA for FMVSS No. 121**
NHTSA Estimates for All
Vehicles*** PD TD PD+TD PD + TD PD TD PD + TD
MAIS 1 $6,254 $3,633 $9,887 $10,268 $4,898 $1,037 $5,935 MAIS 2 $8,312 $4,319 $12,631 $10,644 $5,038 $1,129 $6,167 MAIS 3 $9,460 $4,527 $13,987 $10,490 $8,663 $1,254 $9,917 MAIS 4 $10,432 $4,821 $15,253 $10,712 $12,528 $1,333 $13,861 MAIS 5 $10,225 $4,655 $14,880 $10,699 $12,035 $12,210 $24,245 Fatality $28,906 $6,798 $35,704 $27,824 $13,089 $12,210 $25,299 PDO Vehicle $4,110 $3,048 $7,158 $10,002 $1,890 $1,072 $2,962 * Based on the unit costs derived by the Pacific Institute ** Revised from the 1991 FHWA estimates *** Based on value of statistical life of $6.0 million for all vehicles, not just truck tractors

IV-30
The total travel delay and property damage costs for each MAIS level and PDOVs are simply the
product of the individual unit cost (Table IV-12) and the corresponding incidences that would be
prevented by the proposal (Table IV-8). Table IV-13 presents the travel delay and property
damage unit costs, MAIS incidences, PDOVs, and the total travel delay and property damage
savings. Table IV-14 shows these savings separately by target crash type. As shown in Table
IV-13, the proposal would save (undiscounted) $17.1 to $22.0 million from travel delay and
property damage associated with the crashes that would be prevented by the proposal. Of these
savings, $15.2 to $21.2 million are from target rollover crashes and $4.8 million is from LOC
crashes. All of these costs are in 2010 dollars.

IV-31
Table IV-13 Total Travel Delay and Property Damage Savings
(Undiscounted 2010 $)
Lower Bound Unit Cost* Total Costs MAIS
Property Damage
Travel Delay
Incidents Prevented**
Property Damage
Travel Delay
Property Damage + Travel Delay
1 $6,254 $3,633 507 $3,170,778 $1,841,931 $5,012,709 2 $8,312 $4,319 88 $731,456 $380,072 $1,111,528 3 $9,460 $4,527 40 $378,400 $181,080 $559,480 4 $10,432 $4,821 10 $104,320 $48,210 $152,530 5 $10,225 $4,655 4 $40,900 $18,620 $59,520 Fatal $28,906 $6,798 49 $1,416,394 $333,102 $1,749,496 PDOV $4,110 $3,048 1,187 $4,878,570 $3,617,976 $8,496,546 Total $10,720,818 $6,420,991 $17,141,809
Higher Bound Unit Cost* Total Costs MAIS
Property Damage
Travel Delay
Incidents Prevented**
Property Damage
Travel Delay
Property Damage + Travel Delay
1 $6,254 $3,633 671 $4,196,434 $2,437,743 $6,634,177 2 $8,312 $4,319 117 $972,504 $505,323 $1,477,827 3 $9,460 $4,527 52 $491,920 $235,404 $727,324 4 $10,432 $4,821 13 $135,616 $62,673 $198,289 5 $10,225 $4,655 5 $51,125 $23,275 $74,400 Fatal $28,906 $6,798 60 $1,734,360 $407,880 $2,142,240 PDOV $4,110 $3,048 1,499 $6,160,890 $4,568,952 $10,729,842 Total $13,742,849 $8,241,250 $21,984,099 * from Tables IV-12 ** from IV-8-A and IV-8-B PDOV: property damage only vehicle

IV-32
Table IV-14 Total Travel Delay and Property Damage Savings by Crash Type
(Undiscounted 2010 $)
Rollover(1) – Low Benefit Unit Cost** Total Costs Total MAIS
Property Damage
Travel Delay
Incidents Prevented***
Property Damage
Travel Delay
Property Damage + Travel Delay
1 $6,254 $3,633 421 $2,632,934 $1,529,493 $4,162,427 2 $8,312 $4,319 72 $598,464 $310,968 $909,432 3 $9,460 $4,527 33 $312,180 $149,391 $461,571 4 $10,432 $4,821 8 $83,456 $38,568 $122,024 5 $10,225 $4,655 3 $30,675 $13,965 $44,640 Fatal $28,906 $6,798 27 $780,462 $183,546 $964,008 PDOV $4,110 $3,048 797 $3,275,670 $2,429,256 $5,704,926 Total $7,713,841 $4,655,187 $12,369,028
Rollover(1) – High Benefit Unit Cost** Total Costs Total MAIS
Property Damage
Travel Delay
Incidents Prevented***
Property Damage
Travel Delay
Property Damage + Travel Delay
1 $6,254 $3,633 585 $3,658,590 $2,125,305 $5,783,895 2 $8,312 $4,319 101 $839,512 $436,219 $1,275,731 3 $9,460 $4,527 45 $425,700 $203,715 $629,415 4 $10,432 $4,821 11 $114,752 $53,031 $167,783 5 $10,225 $4,655 4 $40,900 $18,620 $59,520 Fatal $28,906 $6,798 38 $1,098,428 $258,324 $1,356,752 PDOV $4,110 $3,048 1,109 $4,557,990 $3,380,232 $7,938,222 Total $10,735,872 $6,475,446 $17,211,318
LOC(2)
Unit Cost** Total Costs Total MAIS
Property Damage
Travel Delay
Incidents Prevented***
Property Damage
Travel Delay
Property Damage + Travel Delay
1 $6,254 $3,633 86 $537,844 $312,438 $850,282 2 $8,312 $4,319 16 $132,992 $69,104 $202,096 3 $9,460 $4,527 7 $66,220 $31,689 $97,909 4 $10,432 $4,821 2 $20,864 $9,642 $30,506 5 $10,225 $4,655 1 $10,225 $4,655 $14,880 Fatal $28,906 $6,798 22 $635,932 $149,556 $785,488 PDOV $4,110 $3,048 390 $1,602,900 $1,188,720 $2,791,620 Total $3,006,977 $1,765,804 $4,772,781 (1) first event rollovers (2) point estimate only, i.e., low benefit = high benefit * from Tables IV-12 ** from IV-8-A and IV-8-B PDOV: property damage only vehicle LOC: loss-of-control crashes

IV-33
F. Summary
The following summarizes the estimated benefits of the proposal. The estimated injury benefits,
PDOV reductions, and property damage and travel delay savings of the proposal are measured
from a baseline of a 26.2 percent ESC installation rate in truck tractors and an 80 percent
installation rate in large buses, to a 100 percent installation rate among both vehicle types.
Furthermore, the benefits also reflect the impact from the 16.0 percent of truck tractors that
would have RSC only systems. Note that due to rounding, the sum of benefits from individual
crash types might not equal the total.
Overall Benefits of the Proposal
• Prevent 1,807 – 2,329 crashes
▪ 1,332 – 1,854 rollover crashes
▪ 475 LOC crashes
• Save 49 – 60 lives
▪ 27 - 38 from rollover crashes
▪ 22 from LOC crashes
• Eliminate 649 – 858 MAIS 1-5 injuries
▪ 537 – 746 from rollover crashes
▪ 112 from LOC crashes
• Eliminate 1,187 – 1,409 PDOVs
▪ 797 – 1,109 from rollover crashes
▪ 390 from loss-of-control crashes
• Save $17.1 – $22.0 million (undiscounted) from travel delay and property damage

IV-34
▪ $12.4 – $17.2 million from rollover crashes
▪ $4.8 million from loss-of-control crashes.
The benefits of the ESC system itself (including both voluntary installations and regulated
installations), which are measured from a baseline of no ESC installation to 100 percent
installations and 0 percent RSC-only installations, are summarized below. Due to rounding, the
sum of subgroups might not equal the total.
ESC Benefits (0% to 100% ESC Installation)
• Prevent 2,876 – 3,758 crashes
▪ 2,204 – 3,086 rollover crashes
▪ 672 loss-of-control crashes
• Save 74 – 92 lives
▪ 44 - 62 from rollover crashes
▪ 30 from loss-of-control crashes
• Eliminate 1,047 – 1,401 MAIS 1-5 injuries
▪ 887 – 1,241 from rollover crashes
▪ 160 from loss-of-control crashes
• Eliminate 1,870 – 2,397 PDOVs
▪ 1,319 – 1,846 from rollover crashes
▪ 551 from loss-of-control crashes

IV-35
• Save $27.2 - $35.3 million (undiscounted) from travel delay and property damage
▪ $20.4 - $28.6 million from rollover crashes
▪ $6.7 million from loss-of-control crashes.

V-1
CHAPTER V. COSTS AND LEADTIME
The cost of the proposal comprises only the technology costs. Generally, fuel economy impacts
of any regulations are included in the cost assessment. For this proposal, however, the required
ESC (and also RSC) technology is built upon the ABS platform. Thus, the added weight for the
installation of ESC (and RSC) primarily is from additional sensors and air brake system valves.
The total additional weight is estimated to be less than 5 pounds and is considered negligible
compared to the 15,000 pound or greater curb weight of truck tractors and large buses.
Therefore, the proposal is not expected to impact fuel economy.
A. Technology Costs
As stated, the cost of the proposal comprises only the technology cost which includes the costs
for all the components and the telltale malfunction indicator lamp. Basically, the technology cost
is the product of two values: (a) average unit cost and (b) the number of applicable vehicles that
would be impacted by the proposal (impacted vehicles). The impacted vehicles are either those
vehicles that would need the full installation of ESC, or those that would need an upgrade from
RSC to ESC. The numbers of impacted vehicles can be derived from the total new vehicle sales
and technology installation rates. The average unit cost varies with the type of installation (i.e.,
full ESC or an RSC upgrade) needed. Therefore, technology cost can be expressed as the
following mathematical formula:
TC = UESC* VESC+(UESC - URSC)* VRSC
= UESC*(1− IESCF − IRSCF )* V+(UESC - URSC)*IRSCF * V
Where:

V-2
TC = Total technology cost
UESC = Average unit cost of a full ESC
URSC = Average unit cost of RSC
VESC = Total units needing a full ESC
VRSC+ = Total units needing an upgrade from RSC to ESC
V = Total annual production of applicable vehicles
IESCF = Projected future (i.e., 2012) ESC installation rate
IRSCF = Projected future RSC installation rate.
In the formula, 1 − IESCF − IRSCF represents the portion of applicable vehicles that do not have
ESC or RSC. The RSC installation rate, IRSCF , represents the portion that already had RSC and
would need an upgrade.
To establish unit costs (i.e., UESC and URSC) and projected baseline ESC and RSC installation
rates (i.e., IESCF and IRSCF ), in 2009 the agency requested cost and product plan information from
the seven truck tractor manufacturers. The seven manufacturers are: Daimler Trucks North
America, Ford Motor Company, Isuzu Manufacturing Services of America, Mack Trucks,
Navistar, PACCAR, and Volvo Group of North America. Five of these manufacturers provided
the requested information. MY 2012 was chosen as the baseline because it was the last year for
which available/projected data were submitted to the agency. Therefore, MY 2012 serves as the
baseline against which both costs and benefits are measured. ESC and RSC installation rates for
new truck tractors beyond MY 2012 are assumed to be at the MY 2012 levels. Thus, the cost of
the proposal is the incremental cost of going from the MY 2012 planned installations to the 100
percent installation of ESC.

V-3
Note that the agency also requested RSC and ESC installation plans from bus manufacturers.
The agency did not receive any cost information specific to large buses. Given that Bendix and
Meritor WABCO are the only two system suppliers that produce ESC and RSC and that the
components used for these technologies are not substantially different between truck tractors and
large buses, unit costs estimated for truck tractors are also used for large buses.
Technology Unit Costs
Unit costs of ESC (UESC) and RSC (URSC) for both truck tractors and large buses, as described,
are based on truck tractor manufacturers’ submissions. The unit cost of ESC per vehicle
submitted by five responding manufacturers ranged from $470 to $2,080. The unit cost of RSC
per vehicle ranged from $300 to $1,500. For the remaining two vehicle manufacturers, one
stated that it did not produce truck tractors and one did not respond. The one manufacturer that
did not respond has a significant market share of truck tractor sales. In order to account for it,
the analysis used the minimal installation rates reported from the responding manufacturers for
this particular manufacturer. The rationale is that we believe for competitiveness reasons, this
manufacturer will follow the industry trend and will gradually offer ESC or RSC. The average
unit costs reported by those responders were also used for this manufacturer. After factoring in
their respectively average Class 8 truck tractor sales volumes between 2005 and 200937, the
analysis estimated that the average unit cost for RSC is $640 and for ESC is $1,160. Thus, the
incremental cost of upgrading from RSC to full ESC is estimated to be $520 per vehicle.
37 2006 to 2010 Ward’s Automotive Yearbook

V-4
The calculation of average unit cost of ESC and RSC is based on the weighted average of all unit
costs that were submitted by the truck tractor manufacturers. Market shares are used as the
weights. The weighted average unit cost formula can be noted as:
U= ∑ mi*uin1∑ mi
n1
Where, U = the weighted average unit cost
mi = market share for manufacturer i
ui = unit cost for manufacturer i
n = number of manufacturers.
To ensure confidentiality and prevent the possibility that cost information for individual
manufacturers can be identified through the few submissions within a small group of
manufacturers, the agency will not publish the detailed company responses on cost data and
production information.
The agency is planning to perform an ESC/RSC cost tear-down study to assess the required
components and their unit costs but that has not been accomplished in time for this NPRM.
Therefore, the primary components for ESC and RSC that are summarized below are based on
information the agency has acquired and on the manufacturers’ and suppliers’ publications.
Additionally, primary components for trailer-RSC, which is one of the alternatives the agency
has examined (see the Alternatives Chapter), are also presented here. Note that the agency
expects to revise the cost estimates in the final rule based on the ESC/RSC tear-down study.

V-5
RSC components include: two electro-pneumatic brake application valves (one for the tractor
drive axles, and one for the trailer brake control line); one lateral accelerometer; an ECU
including software; associated wiring and air brake hoses and fittings; brackets; and the
instrument panel warning lamp.
ESC components include all of the above RSC components as well as the following: an ESC
ECU in lieu of the RSC ECU; one additional air application valve to control the tractor steer axle
brakes; one steering angle sensor; one yaw rate sensor; and a service brake application pressure
sensor. Moreover, the ESC ECU is relatively more complex than the RSC ECU since ESC has
both yaw and roll sensing capabilities and thus it requires more signal processing capability and
it also provides additional vehicle control outputs. The steering angle sensor also needs to be
carefully calibrated using diagnostic tools to initialize the ESC system when the vehicle is new
or when this sensor requires servicing
Trailer-RSC components include: one electro-pneumatic brake application valve; one lateral
accelerometer; and an ECU. No additional wiring, air brake hose/fittings, or brackets are
believed to be required for the installation of trailer-RSC compared to a baseline trailer equipped
with an ABS system.
To further illustrate the difference among these three systems in terms of data that are collected
by the sensors, processed by the ECUs, and transmitted through the vehicle communication
networks, Table V-1 lists the sensor inputs and outputs that are marked by “X”38 for each
38 Adopted from Table 2.1, Tractor Semitrailer Stability Objective Performance Test Research – Roll Stability, May 2011, DOT 811 467

V-6
system. As shown in Table V-1, ESC is the most complex technology among these stability
control systems. ESC acquires relatively more sensor inputs and has a greater array of braking
strategies than the tractor RSC or trailer-RSC systems.
Table V-1
Sensor Inputs and Outputs for the Three Stability Technologies Inputs Outputs Wheel
Speed Lateral
Accelera-tion
Steer Angle
Yaw Rate
Engine Torque
Engine Retarder
Drive Axle
Brakes
Steer Axle
Brakes
Trailer Brakes
ESC X X X X X X X X X RSC X X X X X X Trailer-RSC
X X X
Source: Tractor-Semitrailer Stability Objective Performance Test Research – Roll Stability, May 2011, DOT HS 811 467
Cost Increase Impacts on Sales
The agency assumes that costs will be fully passed on to consumers, which are trucking
companies and bus transit companies. All of the consumers are businesses, and the trucks or
buses are vital to their operations. Sales are much more affected by demand for freight
movement or passengers (and even the price of diesel) than they are by increased new vehicle
prices. The additional cost per vehicle of $1,160 for ESC is a business expense that will have
very little bearing on the demand for new trucks or large buses. If the demand for their services
is there, they will provide trucks or large buses and raise the price for their services. Of course,
price can affect demand.
V-7
We have looked into truck freight demand elasticity and it ranges between -1.0 and -1.5 (and
averages around -1.174 over the variety of goods delivered) 39. The average cost of a truck
tractor is estimated to be $110,000 which is based on the average of one quoted price and three
prices40 paid by the agency for vehicles used in field testing. The price of a heavy truck would
go up by 1.05% ($1,160/$110,000). However, the price charged by companies that provide
freight service includes the amortized cost of the truck, the cost of fuel, the drivers wages and
benefits, rent on company buildings, energy costs, salaries for non-driver personal, other
overhead, and profit. Data indicate that payments for the purchase or lease of trucks and trailers
account for roughly 21% of truck operating costs41, which are a subset of the total costs incurred
by trucking companies. Based on an average elasticity of (-1.174), a 1.05% increase in truck
prices could reduce demand for truck shipping services by 0.259% (.0105x.21x-1.174). If you
assumed a direct relationship between freight demand and truck purchases, with sales of 150,000
heavy trucks per year, the impact on truck sales would be only 388 units. Given that costs other
than direct operating costs as well as profits influence freight rates, and since these costs would
not be affected by the cost of ESC, the actual impact on sales would be less than 388 units.
Most large bus operators have determined that ESC makes good business sense for them, as sales
of ESC are expected to hit 80% by 2012. For large buses, ESC is even a smaller percent (.29% =
$1,160/$400,000) of the new vehicle price. We don’t have a specific elasticity for large
buses. Assuming it were the same as trucks and 2,200 large bus sales a year, the impact would
39 Clark, C., Naughton, HT., Proulx, B., and Thoma, P., A Survey of the Freight Transportation Demand Literature and a Comparison of Elasticity Estimates, January 2005 40 The quoted price is $93,945 and the purchasing price for the three truck tractors are $100,000, 115,000, and 125,000, respectively. The average cost of these vehicles is rounded to $110,000. 41 American Transportation Research Institute, An Analysis of the Operational Costs of Trucking, December 2008

V-8
be an impact on sales of a loss of 2 large buses per year (2,200*.0.21*0.0029*-1.174 = 2 large
buses).
ESC/RSC Installation Rates
The ESC installation rate in truck tractors has gradually increased since the introduction of the
technologies in 2002. Based on manufacturer’s product plans, the ESC installation rate was
about 0.2 percent in MY 2005 truck tractors and it is expected to reach 26.2 percent in 2010. As
for RSC, the installation rate is estimated to peak at 17.0 percent in 2009 and remain around15-
16 percents thereafter. After 2012, its installation rate is expected to steadily decrease due to
industry’s moving towards equipping their trucks with ESC. The RSC system installation rate is
projected to be 16.0 percent in 2012. Table V-2 lists the estimated installation rates for truck
tractors from 2005 to 2012. Note that not all manufacturer’s product plans are uniformly
provided up to 2012. Installation rates for those model years that were not provided by
individual tractor manufacturers were assumed to be the same rates for the last model year that
was reported.
Table V-2 Estimated RSC and ESC Installations for Truck Tractors by Model Year
(% of the fleet)
Model Year 2005 2006 2007 2008 2009 2010 2011 2012 RSC 5.4 6.4 10.5 12.0 17.0 12.3 14.8 16.0 ESC 0.2 3.2 7.4 12.1 13.8 21.8 23.3 26.2 None 94.4 90.4 82.1 75.9 69.2 65.9 61.9 57.8

V-9
For large buses, manufacturers have indicated that most likely they will equip their large buses
with ESC and bypass RSC to fully realize the full safety benefits of the ESC technology. Based
on their input, the analysis estimates that 80 percent of MY 2012 large buses (primarily Class 8
buses) would be equipped with ESC. The remaining 20 percent will not be equipped with any of
the technologies. Data provided by the bus manufacturers were not sufficient to establish the
installation trends as was done for truck tractors. Note that for confidentiality purposes, this
analysis does not publish the detailed installation rates provided by the manufacturers.
Based on the assumptions stated above and the data provided in Table V-2, the percent of the
MY 2012 fleet that needs ESC and that needs an incremental system upgrade over RSC, in order
to reach 100 percent of the fleet with ESC are shown in the Table V-3.
Table V-3
Percent of Fleet Needing Technology to Achieve 100% ESC ESC Incremental ESC None Truck Tractors 57.8 16.5 26.2 Large Buses 20.0 0.0 80.0
NHTSA estimated a future annual production volume of 150,000 truck tractors and 2,200 large
buses. The truck tractor production was derived from the Class 7 and 8 truck sales data from
2000 to 2009 published in Ward’s Automotive Yearbooks42. Tenyears of historic truck output
data were used rather than more recent years in order to address the impact of the recent
recession on truck production43. During those 10 years, an average of 76,352 Class 7 trucks and
42 Yearbook from 2000 to 2010 43 Based on Ward’s Automotive Yearbook 2008, in 2007, the sales for Class 8 heavy-duty trucks fell about 47% while Class 6 and 7 heavy trucks fell 22 percent from the 2006 level. Furthermore, the Yearbook 2009 indicated that Class 8 order in February 2009 fell 60% versus February 2008. Ward’s indicated that the freight market possibly would contract a further 10 percent in 2009.

V-10
175,840 Class 8 trucks were produced annually. Truck tractors were not separately reported in
the Ward’s Yearbook but the agency estimates that about 10 percent of Class 7 and 80 percent of
Class 8 trucks are truck tractors and the remainders are single-unit trucks. Therefore, it is
estimated that an average of 148,307 new truck tractors were produced annually. Furthermore,
based on 2000-2009 R. L. Polk registration data, the average number of age one and two (years
old) tractors (a proxy for new truck tractors) is close to 134,000 and 149,000, respectively44.
Therefore, the analysis uses the round number of 150,000 tractors produced annually.
For large buses, the agency used sales data published from several sources45,46,47. Based on these
sources, from 1993 to 2007 the average annual sales were about 2,260 units. Since the recession,
sales have dropped significantly. In 2007, the industry purchased 2,173 new large buses, down
8.7 percent from 2006. Sales between years 2008 and 2010 dropped further below 2,000 units.
As the economy stabilizes, the annual sales are expected to be more in line with the historical
trend. Therefore, the analysis used the rounded number of 2,200 units for the average annual
new large bus output.
Combining stability control system unit costs shown in the previous section with the technology
needs in Table V-3, and using the assumed production volumes, yields the costs in Table V-4 for
44 Ages 1 and 2 truck tractors both were used as proxy for new truck tractors because the number of age 2 truck tractors is higher than that of age 1. This might due to the coding of vehicle model year. 45 National Bus Trader / January, 2011, http://www.busmag.com/PDF/MCIPOC.pdf 46 ABA Motorcoach Census (http://www.buses.org/ABA-Foundation/Research) 47 Damuth, R., “The Economic Impacts and Social Benefits of the U.S. Motorcoach” by Nathan Associates, December 2008. Statistics cited in this report was based on the data published in Bus&MotorcoachesNEWs, Feb. 15, 2008.

V-11
the proposal. As shown, 57.8 percent of truck tractors would be required to be equipped with the
full ESC system at a cost of about $100.6 million. In addition, the cost for upgrading from RSC
to ESC for an additional 16.0 percent of the truck tractors would cost $12.5 million. For large
buses, the estimated cost for the 20 percent of large buses that would need to be equipped with
the full ESC system is $0.5 million. The remaining 80 percent of large buses are expected to
already be equipped with ESC. Thus, no other additional costs would be needed for those large
buses.
Table V-4 Total Costs for the Proposal
(2010 $) Technology Upgrade Needed Truck Tractors None Incremental ESC ESC % Needing Improvements 26.2% 16.0% 57.8% 150,000 Sales Estimated 39,300 24,000 86,700 Costs per Affected Vehicle 0 $520 $1,160 Total Costs 0 $12.5 M $100.6 M Large Buses
% Needing Improvements 80% 0% 20% 2,200 Sales Estimated 1,760 0 440 Costs per Affected Vehicle 0 $520 $1,160 Total Costs 0 $0 M $0.5 M M: million Overall, as summarized in Table V-5, the incremental vehicle costs of providing ESC compared
to manufacturer’s planned production for the MY 2012 fleet will add $113.6 million to new truck
tractors and large buses at a cost averaging $746.1 per vehicle. The total cost for truck tractors
is estimated to be $113.1 million with an average cost of $753.7 per truck tractor. The total cost
for large buses is estimated to be 0.5 million with an average cost of $232.0 per motocoach.
Table V-5 Summary of Vehicle Costs
(2010 $) Average Vehicle Costs Total Costs Truck Tractors $ 753.7 $ 113.1 M Large Buses $ 232.0 $ 0.5 M Total $ 746.1 $ 113.6 M

V-12
Compliance Cost
The agency estimates that the compliance cost for executing both of the proposed SIS and SWD
maneuvers per tractor would be $15,000 assuming that the manufacturers already have access to
test facilities, tracks, and vehicles. The estimated costs include:
(1) $10,000 for preparing for and executing the proposed maneuvers,
(2) $2,000 for executing FMVSS No. 121 brake burnish test, and
(3) $3,000 for other miscellaneous preparations and required equipment such as
Brake conditioning between maneuvers,
Jackknife cable maintenance,
ballast loading, and
Post data processing, i.e., LAR and Torque reduction process.
Due to the lack of information on the number of tests that manufacturers might choose to run to
certify a specific make model and whether a certification test for a specific make model would
also be applicable to other similar models, the agency does not provide the total compliance cost
estimate for manufacturers. Compliance costs in the analysis are considered as Research and
Development or overhead costs to the manufacturers. Compliance costs are already implicitly
included in the estimated consumer cost, since consumer cost (or the retail price equivalent) is
determined by taking variable costs and multiplying by a 1.5 markup to account for fixed and
overhead costs. In other words, compliance costs are already included in the estimated vehicle
technology costs in this analysis.

V-13
Note that the 1.5 markup factor is based on an examination of historical financial data contained
in 10-K reports filed by light vehicle manufacturers with the Securities and Exchange
Commission (SEC). It represents the ratio between the retail price of motor vehicles and the
direct costs of all of the activities that manufacturers engage in, including the design,
development, manufacturing, assembly, and sales of new vehicles, refreshed vehicle designs, and
modifications to meet safety or fuel economy standards. These data indicate that over the last 30
years, the retail price of motor vehicles has, on average, been roughly 50 percent above the direct
cost expenditures of manufacturers. This ratio has been remarkably consistent, averaging
roughly 1.5.
C. Leadtime
For truck tractors, the agency is proposing a leadtime of two years for typical 4x2 and 6x4 truck
tractors, and a leadtime of four years for severe service tractors that typically have a GVWR
greater than 27,000 kg (59,600 pounds), and other specialty truck tractors with four or more
axles.
For large buses, the agency is proposing a leadtime of two years after the final rule is published.
Although, the agency estimated that in 2012, almost all Class 8 buses will be equipped with ESC
as standard equipment, ESC is not expected to be available for Class 7 buses. Therefore, to
accommodate manufacturers of Class 7 buses, the agency believes two year leadtime is adequate
for these manufacturers to develop, test, and install ESC on Class 7 buses.

VI-1
CHAPTER VI. COST-EFFECTIVENESS AND BENEFIT-COST
This chapter provides cost-effectiveness and benefit-cost analysis for the proposed ESC rule. The
Office of Management and Budget (OMB) requires all agencies to perform both analyses in
support of rules, effective January 1, 2004.48
Cost-effectiveness measures the net cost per equivalent life saved (i.e., per equivalent fatality),
while benefit-cost measures the net benefit which is the difference between the monetized value
of the benefits and the net costs. The net cost in this analysis is equal to the technology cost
minus the savings from the prevention of crash-related travel delays and property damage. Thus,
injury reduction benefits, travel delay and property damage savings, and vehicle technology costs
are the primary components for deriving these two measures. In cost-effectiveness, injury
benefits are expressed as fatal equivalents which are further translated into a monetary value in
the benefit-cost analysis. Injury benefits (i.e., fatal equivalents) and travel delays and property
damage savings represent savings throughout the vehicle’s life, and are discounted to reflect their
present values (2009 $ value). The discounting procedure for future benefits and costs in
regulatory impact analyses is based on the guidelines published in Appendix V of the
"Regulatory Program of the United States Government", April 1, 1990 - March 31, 1991.
There is general agreement within the economic community that the appropriate basis for
determining discount rates is the marginal opportunity costs of lost or displaced funds. When
these funds involve capital investment, the marginal, real rate of return on capital must be
considered. However, when these funds represent lost consumption, the appropriate measure is 48 See OMB Circular A-4.

VI-2
the rate at which society is willing to trade-off future for current consumption. This is referred to
as the "social rate of time preference," and it is generally assumed that the consumption rate of
interest, i.e., the real, after-tax rate of return on widely available savings instruments or
investment opportunities, is the appropriate measure of its value.
Estimates of the social rate of time preference have been made by a number of authors. Robert
Lind49 estimated that the social rate of time preference is between zero and six percent, reflecting
the rates of return on Treasury bills and stock market portfolios. Kolb and Sheraga50 put the rate
at between one and five percent, based on returns of stocks and three-month Treasury bills.
Moore and Viscusi51 calculated a two percent real time rate of time preference for health, which
they characterize as being consistent with financial market rates for the period covered by their
study. Moore and Viscusi's estimate was derived by estimating the implicit discount rate for
deferred health benefits exhibited by workers in their choice of job risk. OMB Circular A-4
recommends the use of a 3 percent discount rate as the social rate of time preference.
OMB Circular A-4 states that a real discount rate of 7 percent should be used as a base-case for
regulatory analysis. The 7 percent rate is an estimate of the average before-tax rate of return to
private capital in the U.S. economy. It is a broad measure that reflects the return of real estate
49 Lind, R.C., "A Primer on the Major Issues Relating to the Discount Rate for Evaluating National Energy Options," in Discounting for Time and Risks in Energy Policy, 1982, (Washington, D.C., Resources for the Future, Inc.). 50 J. Kolb and J.D. Sheraga, "A Suggested Approach for Discounting the Benefits and Costs of Environmental Regulations,: unpublished working papers. 51 Moore, M.J. and Viscusi, W.K., "Discounting Environmental Health Risks: New Evidence and Policy Implications," Journal of Environmental Economics and Management, V. 18, No. 2, March 1990, part 2 of 2.

VI-3
and small business capital as well as corporate capital. It approximates the opportunity cost of
capital, and it is the appropriate rate whenever the main effect of a regulation is to displace or
alter the use of capital in private sector. OMB recommends that agencies use both 3 percent and
7 percent discount rates for their regulatory analyses.
A. Discounting Factors
Safety benefits can occur at any point in time during the vehicle's lifetime and are discounted at
both 3 and 7 percent to reflect their values in 2010 dollars. For this analysis, the agency
assumes that the distribution of weighted yearly vehicle miles traveled (VMT) is an appropriate
proxy measure for the distribution of such crashes over the vehicle's lifetime. This measure
takes into account both vehicle survival rates and changes over time in annual average VMT.
Multiplying the percent of a vehicle's total lifetime mileage that occurs in each year by the
discount factor and summing these percentages over the years of the vehicle's operating life,
results in the discount factor at that discount rate. Table VI-1 shows the process of deriving the
3-percent and 7-percent discount factors for truck tractors. In these tables, columns c, d, e, and f
are derived separately using the formulas: c = a * b, d = c of total
c , e = 0.5agerate)discount (11
−+,
and f = d * e.
As shown, a 3-percent discount factor is 0.8087 and a 7-percent discount factor is 0.6421. These
multipliers are applied to the estimated number of equivalent fatalities prevented to give the
present values of estimated safety benefits for the respective discount rates. For example, the

VI-4
present value of the benefits of the proposal at the 3 percent discounted rate is equivalent to a
0.8087 of the initial estimates.
Note that VMT data in the tables are based on the Census Bureau’s 2002 Vehicle Inventory and
Use Survey (VIUS)52. Survivability is based on 1991 to 2008 R. L. Polk Registration data. A
detailed description of the process for deriving the discount factors can be found in the agency
report on vehicle survivability and travel mileage schedules53. For truck tractors specifically, the
process is explained in a 2009 NHTSA report “An In-Service Analysis of Maintenance and
Repair Expenses for Tractors and Trailers” by Kirk Allen54.
52 U.S. Census Bureau, Service Sector Statistics Division; http://www.census.gov/svsd/www/vius/products.html 53 Lu, S., “Vehicle Survivability and Travel Mileage Schedules”, NHTSA Technical Report, January 2006, DOT 809 952 54 Allen, K., An In-Service Analysis of Maintenance and Repair Expenses for the Anti-Lock Brake System and Underride Guard for Tractors and Trailers, March 2009, DOT HS 811 109

VI-5
Table VI-1 Mid-Year Discount Factors, Truck Tractors
Age
Total Annual Miles
Traveled (a)
Surviva-bility (b)
Weighted Miles
Traveled (c)
Percent of Total Weighted
Miles (d)
Raw Discount Factors
(e)
Weighted Discount Factors
(f) 3% 7% 3% 7%
1 240,737 1.0000 240,737 9.90 0.9853 0.9667 0.0975 0.0957 2 226,110 0.9930 224,535 9.20 0.9566 0.9035 0.0880 0.0831 3 212,378 0.9810 208,351 8.60 0.9288 0.8444 0.0799 0.0726 4 199,486 0.9642 192,351 7.90 0.9017 0.7891 0.0712 0.0623 5 187,381 0.9432 176,733 7.30 0.8755 0.7375 0.0639 0.0538 6 176,017 0.9181 161,599 6.70 0.8500 0.6893 0.0570 0.0462 7 165,346 0.8894 147,061 6.10 0.8252 0.6442 0.0503 0.0393 8 155,327 0.8575 133,198 5.50 0.8012 0.6020 0.0441 0.0331 9 145,919 0.8230 120,085 4.90 0.7778 0.5626 0.0381 0.0276
10 137,085 0.7860 107,748 4.40 0.7552 0.5258 0.0332 0.0231 11 128,789 0.7473 96,239 4.00 0.7332 0.4914 0.0293 0.0197 12 120,999 0.7071 85,559 3.50 0.7118 0.4593 0.0249 0.0161 13 113,683 0.6660 75,708 3.10 0.6911 0.4292 0.0214 0.0133 14 106,813 0.6244 66,689 2.70 0.6710 0.4012 0.0181 0.0108 15 100,360 0.5826 58,471 2.40 0.6514 0.3749 0.0156 0.0090 16 94,300 0.5411 51,028 2.10 0.6324 0.3504 0.0133 0.0074 17 88,609 0.5003 44,332 1.80 0.6140 0.3275 0.0111 0.0059 18 83,263 0.4604 38,338 1.60 0.5961 0.3060 0.0095 0.0049 19 78,242 0.4217 32,998 1.40 0.5788 0.2860 0.0081 0.0040 20 73,526 0.3845 28,273 1.20 0.5619 0.2673 0.0067 0.0032 21 69,096 0.3490 24,112 1.00 0.5456 0.2498 0.0055 0.0025 22 64,935 0.3152 20,470 0.80 0.5297 0.2335 0.0042 0.0019 23 61,026 0.2835 17,300 0.70 0.5142 0.2182 0.0036 0.0015 24 57,354 0.2537 14,552 0.60 0.4993 0.2039 0.0030 0.0012 25 53,905 0.2260 12,180 0.50 0.4847 0.1906 0.0024 0.0010 26 50,664 0.2004 10,155 0.40 0.4706 0.1781 0.0019 0.0007 27 47,620 0.1769 8,424 0.30 0.4569 0.1665 0.0014 0.0005 28 44,759 0.1554 6,957 0.30 0.4436 0.1556 0.0013 0.0005 29 42,072 0.1359 5,718 0.20 0.4307 0.1454 0.0009 0.0003 30 39,547 0.1183 4,677 0.20 0.4181 0.1359 0.0008 0.0003 31 37,175 0.1025 3,809 0.20 0.4059 0.1270 0.0008 0.0003 32 34,945 0.0884 3,090 0.10 0.3941 0.1187 0.0004 0.0001 33 32,851 0.0759 2,493 0.10 0.3826 0.1109 0.0004 0.0001 34 30,883 0.0649 2,004 0.10 0.3715 0.1037 0.0004 0.0001 35 29,033 0.0552 1,602 0.10 0.3607 0.0969 0.0004 0.0001
Total 3,530,235 2,427,576 Lifetime Discount Factor 0.8087 0.6421
c = a*b; d = c/total miles; e= 11+Discount Rate
age-0.5; f = d * e

VI-6
A. Fatal Equivalents
To calculate a cost per equivalent fatality, nonfatal injuries must be expressed in terms of
fatalities. This is done by comparing the values of preventing nonfatal injuries to the value of
preventing a fatality. Comprehensive values, which include both economic impacts and loss of
quality (or value) of life considerations, will be used to determine the relative value of nonfatal
injuries to fatalities. Value-of-life measurements inherently include a value for lost quality of
life plus a valuation of lost material consumption that is represented by measuring consumers’
after-tax lost productivity. In addition to these factors, preventing a motor vehicle fatality will
reduce costs for medical care, emergency services, insurance administrative costs, workplace
costs, and legal costs. If the countermeasure is one that also prevents a crash from occurring,
such as ESC and RSC, property damage and travel delay would be prevented as well. The sum
of both value-of-life and economic cost impacts is referred to as the comprehensive cost savings
from reducing fatalities. However, travel delay and property damage were measured separately
in this analysis, and are thus not included in the calculations of the comprehensive ratio for
injuries.
In the past, these values were adopted from the most recent study of vehicle crash-related
economic impacts published by NHTSA in 200055. The adopted costs were then adjusted to a
present value using an appropriate consumer price index56. In 2008, the DOT issued new
guidelines on the value of a statistical life (VSL) and raised the VSL from $3.0 million to $5.8
55 Blincoe, L., et al., The Economic Impact of Motor Vehicle Crashes 2000, Washington, DC, DOT HS 809 446, May 2002. 56 Gross Domestic Product – Implicit Price Deflators, for example

VI-7
million. In late 2009, the DOT again revised the guideline and raised the VSL to $6.0 million.
In response to the new guideline, the agency updated all relative values for non-fatal MAIS
injuries as well. Currently, the agency is conducting research to revise these relative values and
will publish these estimates when they become available. In the interim, the agency adjusted the
comprehensive costs for MAIS injuries by preserving the relative injury/fatal rations as estimated
in the 2000 report. Appendix B describes the process to derive these costs in 2008 economics.
These 2008 dollars were further adjusted to 2010 dollars by using the GDP deflator of 1.01906
(= 110.668/108.598)57. Table VI-4 shows the adjusted comprehensive costs excluding travel
delay and property damage in 2010 economics for each MAIS injury level and the relative
fatality ratios.
Table VI-4 Calculation of Fatal Equivalents
Injury Severity Comprehensive Cost* (2010 $)
Relative Fatality Ratio
MAIS 1 $17,706 0.0028 MAIS 2 $280,378 0.0436 MAIS 3 $516,883 0.0803 MAIS 4 $1,286,378 0.1999 MAIS 5 $4,282,726 0.6655 Fatality $6,435,237 1.00000 * Excluding traffic delay and property damage
Fatal equivalents are derived by applying the relative fatality ratios (Table VI-4) to the estimated
MAIS 1-5 injury benefits (Table IV-8-A). As discussed earlier, benefits are realized throughout
a vehicle’s life. Thus, fatal equivalents are required to be discounted at 3 and 7 percent. Table
VI-5 shows the undiscounted and discounted fatal equivalents. Undiscounted, the proposal
57 National Income and Product Account Table, Price Indexes for Gross Domestic Product as of January 28, 2011

VI-8
would save 63 to 78 fatal equivalents. Of these, 38 - 53 were from rollover crashes and 25 were
from LOC crashes. At a 3 percent discount, 51 – 63 equivalent lives would be saved, 31 – 43
were from rollover crashes and 20 were from LOC crashes. At a 7 discount rate, 40 – 50
equivalent lives would be saved, 24 – 34 were saving from rollover crashes and 16 were from
LOC crashes.
Table VI-5 Injury Benefits of the Proposal in Fatal Equivalents
Rollovers LOC Total Undiscounted 38 - 53 25 63 – 78 3% Discount 31 - 43 20 51 – 63 7% Discount 24 – 34 16 40 – 50
B. Net Costs
The net cost is the difference between the cost to implement the technology and the savings from
reduced travel delay and property damage. The total technology cost of the rule as estimated in
the cost chapter is $113.6 million. The technology cost represents the investment paid at the
time of vehicle purchase for future benefits and thus no discounting is needed.
By contrast, travel delay and property damage savings are realized throughout the vehicle’s life,
and thus must be discounted. At a 3 percent discount rate, the travel delay and property damage
savings range from $13.9 to $17.8 million. At a 7 percent discount rate, the savings are
estimated to range from $11.0 to $14.1 million. Subtracting the travel delay and property
damage savings from the vehicle technology cost derives the net cost. The net cost is estimated

VI-9
to range from $95.8 to $99.7 million at a 3 percent discount rate and $99.4 to $102.6 million at a
7 percent discount rate.
C. Cost-Effectiveness
The cost-effectiveness analysis derives the cost per equivalent life saved (i.e., cost per equivalent
fatality), which is equal to the net cost divided by the fatal equivalents. The net cost per
equivalent fatality would range from $1.5 to $2.0 million at a 3 percent discount rate, and $2.0 to
$2.6 million at a 7 percent discount rate.
D. Net Benefits
The benefit-cost analysis derives the net benefits which is the difference between the injury
benefits and the net costs of the rule in monetary terms. Thus, the benefit-cost analysis differs
from cost-effectiveness analysis in that it requires that the benefits be assigned a monetary value,
and that this value be compared to the monetary value of costs to derive the net benefits. As
shown in Table VI-4, a fatality was valued at $6.44 million in 2010 dollars. Multiplying this unit
cost by the total fatal equivalents (Table VI-5) derives the monetary values for the injury benefits
of the rule. The value of injury benefits is estimated to range from $328 to $405 million at a 3
percent discount rate and $257 to $322 million at a 7 percent discount rate.
After translating the injury benefits into monetary values and deriving the net cost annually, the
net benefits simply is the difference of these values. The net benefits of the proposal would

VI-10
range from $228 to $310 million at a 3 percent discount rate and $155 to $222 million at a 7
percent discount rate.
E. Summary
In summary, this proposal would prevent 1,807 to 2,329 crashes. By eliminating these crashes,
the proposal would save 49 to 60 lives and eliminate 649 to 858 MAIS 1-5 injuries. The
proposal would also eliminate 1,187 to 1,499 PDOVs. These fatalities and injuries translate to a
total of 63 to 78 undiscounted fatal equivalents, 51 to 63 fatal equivalents at a 3 percent discount,
40 to 50 fatal equivalents at a 7 percent discount rate.
The cost per equivalent life saved would range from $1.5 to $2.0 million at a 3 percent discount
rate and $2.0 to $2.6 million at a 7 percent discount rate. The net benefit is estimated to range
from $228 to $310 million at a 3 percent discount rate and $155 to $222 million at a 7 percent
discount rate. Table VI-6 summarizes the fatal equivalents, cost-effectiveness, and net benefit
statistics. The low and high figures correspond to the low and high bounds of the injury benefits.
Based on these cost/benefit statistics, the proposal is considered to be cost-effective compared to
a $6.44 million comprehensive value per life. The net cost per equivalent life saved, at both 3
and 7 discount rates, is estimated to be less than $3.0 million. At both 3 and 7 discount rates, the
rule would generate over $150 million in net benefits.

VI-11
Table VI-6 Summary of Cost-Effectiveness and Net Benefits by Discount Rate
(2010 $) 3% Discount 7% Discount Low High Low High Fatal Equivalents 51 63 40 50 Injury Benefits (1) $328,197,087 $405,419,931 $257,409,480 $321,761,850 PD&TD Savings $13,862,581 $17,778,541 $11,006,756 $14,115,990 Vehicle Costs* $113,562,400 $113,562,400 $113,562,400 $113,562,400 Net Costs (2) $99,699,819 $95,783,859 $102,555,644 $99,446,410 Net Cost Per Fatal Equivalent (3) $1,954,898 $1,520,379 $2,563,891 $1,988,928 Net Benefits (4) $228,497,268 $309,636,072 $154,853,836 $222,315,440 PD&TD: property damage and travel delay * Vehicle costs are not discounted, since they occur when the vehicle is purchased, whereas benefits occur over the vehicle’s lifetime and are discounted back to the time of purchase. (1) = $6,435,237 * Fatal Equivalents (2) = Vehicle Costs - PD&TD (3) = Net Costs/Fatal Equivalents (4) = Injury Benefits – Net Costs

VII-1
CHAPTER VII. ALTERNATIVES
The agency considered two alternatives to the proposal. These alternatives would require the
less-expensive RSC technology. Alternative 1 would require only RSC for all applicable
vehicles, i.e., all truck tractors and large buses that have a gross vehicle weight rating (GVWR)
greater than 11,793 kg (26,000 pounds). Alternative 2 would require trailer-RSC for all new
trailers. The cost-effectiveness and net benefit analysis conducted for these two alternatives are
based on the assumption that the current RSC and trailer-RSC systems would comply with the
proposed tests for roll stability, but not necessarily for vehicle yaw control. Also for
clarification, ESC and RSC are technologies specifically for truck tractors. Trailer-RSC as the
name implied is for trailers.
Cost and benefit estimates for these alternatives follow the same approach that was used for the
proposal. Therefore, the detailed processes for deriving these measures are not repeated here.
Only critical information that has not previously presented (mostly relating to trailers for
Alternative 2) is discussed in depth here. The critical information includes:
(1) Effectiveness of trailer-RSC
(2) Unit cost per trailer-RSC
(3) Average annual trailer output
(4) Baseline trailer-RSC installation rate (i.e., for 2012 MY new trailers)

VII-2
A. Alternative 1 – RSC for All Applicable Vehicles
RSC is designed primarily to mitigate on-road, un-tripped rollovers and thus has minimal impact
on LOC. As described in Chapter IV, RSC is estimated to be 37 to 53 percent effective against
the target rollover crashes and 3 percent effective against LOC crashes. Applying these
effectiveness rates to Base 1 of the projected target population (Table IV-7) derives the benefits
of this alternative.
RSC is estimated to cost $640 per unit, which is based on confidential industry submissions in
response to the agency’s request for RSC/ESC product plans and costs in 2009. As provided in
the earlier Chapters, about 57.8 percent of truck tractors and 20 percent of large buses would be
required to install RSC if this Alternative were proposed. Assuming an annual production of
150,000 truck tractors and 2,200 large buses, the total affected applicable vehicles for this
Alternative are estimated to be 87,140 units (86,700 truck tractors and 440 large buses).
Applying the unit cost to the affected vehicles derives the costs of Alternative 1. Similarly,
applying the travel delay and property damage unit costs to the corresponding benefit units
derives the associated travel delay and property damage savings. Table VII-1 summarizes the
undiscounted benefits and costs of the alternative. Table VII-2 summarizes cost-effectiveness
and net benefits of Alternative 1 for the two discount rates.
Comparing these benefit measures to those of the proposal, Alternative 1 is slightly more cost-
effective than the proposal. However, Alternative 1 would save fewer lives and accrue less net
benefits than the proposal. Furthermore, Alternative 1 would have significantly less impact on

VII-3
LOC crashes, a sizeable safety population that the agency intends to address. Therefore,
Alternative 1 was not proposed.
Table VII-1 Summary of Undiscounted Benefits
Alternative 1 Benefit Category Low High Crashes Prevented 1,291 1,813 Lives Saved 28 39 MAIS 1-5 Injuries Eliminated 505 715 Equivalent Lives Saved 38 53 PDOV Reduced 790 1,103 PD & TD Savings $12,012,344 $16,878,401 PDOV: property damage only vehicles PD & TD: property damage and travel delay
Table VII-2 Summary of Cost-Effectiveness and Net Benefits by Discount Rate
Alternative 1 (2010 $)
3% Discount 7% Discount Low High Low High Fatal Equivalents 31 43 24 34 Injury Benefits (1) $199,492,347 $276,715,191 $154,445,688 $218,798,058 PD&TD Savings $9,714,383 $13,649,563 $7,713,126 $10,837,621 Vehicle Costs* $55,769,600 $55,769,600 $55,769,600 $55,769,600 Net Costs (2) $46,055,217 $42,120,037 $48,056,474 $44,931,979 Net Cost Per Fatal Equivalent (3) $1,485,652 $979,536 $2,002,353 $1,321,529 Net Benefits (4) $153,437,130 $234,595,154 $106,389,214 $173,866,079 PD&TD: property damage and travel delay * Vehicle costs are not discounted, since they occur when the vehicle is purchased, whereas benefits occur over the vehicle’s lifetime and are discounted back to the time of purchase. (1) = $6,435,237 * Fatal Equivalents (2) = Vehicle Costs - PD&TD (3) = Net Costs/Fatal Equivalents (4) = Injury Benefits – Net Costs

VII-4
B. Alternative 2 – Trailer-RSC for All New Trailers
This alternative would require a trailer-RSC on all new models of trailers. The design of trailer-
RSC is expected to impact only the target rollover crashes, and as described below would be less
effective in preventing rollovers than a tractor-based RSC. Based on 2006-2008 GES, about 98
percent of target rollovers involved a truck-tractor towing one or more trailers. Therefore, the
base population for the benefit estimate of Alternative 2 is 98 percent of projected target
rollovers for the proposal, i.e., only the rollover potion of the Base 1 population shown in Table
IV-7.
For effectiveness, the agency conducted tests on trailer-RSC under the 150-foot J-turn maneuver
with three different trailer loadings. The 150-foot J-turn maneuver is one of the maneuvers that
the agency has investigated. The maneuver can adequately differentiate the performance of ESC
and trailer-RSC. Table VII-3 presents these test results which were used to derive the
effectiveness of trailer-RSC. Interested readers can consult the agency technical report for
detailed test conditions and test results58. As shown in the table, under the High-CG condition,
the truck tractor (Volvo) wheel-lifted at 36 mph when trailer-RSC was off and ESC was off.
Wheel-lift was used as proxy for rollovers. The 33 mph serves as the baseline performance
(ESC off, Trailer-RSC off). When ESC is on and the trailer-RSC is off (ESC on, Trailer-RSC
off), the truck tractor completed the test run (noted as TC in the table) up to 50 mph. When ESC
is off, and trailer-RSC is on (ESC off, Trailer-RSC On) the truck tractors wheel-lifted occurred at
36 mph. Therefore, for ESC the speed difference between with and without the technology is 17
mph (= 50 – 33). For trailer-RSC, the speed difference for possible rollovers with the technology
and without is 3 mph (= 36 – 33). Therefore, trailer-RSC effectiveness against target rollovers is 58 NHTSA’s Class 8 Truck-Tractor Stability Control Test Track Effectiveness, 2009 ESV paper, No. 09-0552

VII-5
estimated to be 17.6 percent (= 3/17) of that of tractor-based ESC systems. Applying this
percentage to the effectiveness of ESC against target rollovers results the effectiveness estimates
of trailer-RSC. Thus, the effective of trailer-RSC against target rollovers ranges from 7 to 10
percent. The relatively low effectiveness of trailer-RSC to that of ESC and RSC are expected
since trailer- RSC applies only the trailer brakes while ESC and RSC apply both the tractor
brakes and the trailer brakes. Furthermore, ESC and RSC intervene earlier in a near-rollover
event and allow tractor-trailers to decelerate more rapidly than did trailer-RSC.
Table VII-3
Wheel Lift Speed within the Speed Test Limit 150-foot J-turn maneuver
Speed (MPH) at Wheel Lift
LLVW Load Condition
Low CG High CG
Trailer RSC Trailer RSC Trailer RSC
OFF ON OFF ON OFF ON
Freightliner
ESC OFF 50^ X 38* X 31* X
ESC ON TC TC TC TC TC TC
Volvo
ESC OFF 48* TC 40* TC 33* 36*
ESC ON TC TC TC TC TC TC
* - Denotes wheel lift. ^ - Denotes no wheel lift, but severe understeer X – Denotes not tested. TC – Test complete up to the maximum speed of 50 mph
As described earlier, the target rollover population of this alternative is about 98 percent of that
of the proposal. The effectiveness of trailer-RSC is about 17.6 percent of that of ESC.
Therefore, the benefit of this alternative basically is about 17.2 percent (= 0.98 * 0.176) of that of
the proposal. Tables VII-4 summarizes the undiscounted benefits.

VII-6
Table VII-4 Summary of Undiscounted Benefits
Alternative 2 Benefit Category Low High Crashes Prevented 229 319 Lives Saved 5 7 MAIS 1-5 Injuries Eliminated 92 129 Equivalent Lives Saved 7 10 PDOV Reduced 137 191 PD&TD Savings $2,137,258 $2,985,898 PDOV: property damage only vehicles PD&TD: property damage and travel delay
The agency estimates that about 203,000 new trailers are produced annually. This annual
production estimate is based on 2000-2010 trailer production data that were posted on the
Trailer-Body Builders website59. Over the 10 year period, the top 30 producers manufactured an
average of 184,531 new trailers. The agency estimated that the top 30 producers had 90 percent
of the market share, therefore, the estimated total annual trailer output would be 202,985 which
rounds up to 203,000 units.
The agency estimates that a trailer-RSC would cost $400 per trailer based on the industry’s input
and expert judgment within the agency. The agency believes that the current trailer-RSC
installation rate on new trailers is extremely low, and is likely to be less than 0.2 percent of the
annual production. Therefore, the analysis assumes that the current trailer-RSC installation rate
is zero percent. In other words, all 203,000 new trailers produced annually, all of them would be
affected by this Alternative. The cost of this Alternative thus is estimated to be $81.2 million
(=$400 * 203,000).
59 http://trailer-bodybuilders.com/trailer-output

VII-7
For the cost-effectiveness and net benefit measures, the estimated benefits shown in Table VII-4
are first discounted at 3 and 7 percent. As described earlier, vehicle survival probability and
VMT are essential elements for deriving adjustment factors. However, due to lack of VMT and
historic registration data for trailers, survival probabilities of trailers cannot be established as
rigorously as was done for truck tractors. The survival probabilities of trailers were established
by considering the relationship between the average annual production and the average number
of operational truck-trailers and comparing this relationship to that of truck tractors. Based on
the annual new trailer production of 203,000 units and the total annual number of operational
truck-trailers of 5.24 million units, it would take 26 production years to reach the annual
operational level if there was no scrappage for those models. By contrast, it would take about 12
years for truck tractors to reach the average annual operational level. In addition, by the nature
of usage of trailers, the operational life of a trailer is expected to be much longer than that of a
truck tractor and the scrappage rate for trailers is expected to be more gradual than that for truck
tractors.
In this analysis, the operational life of a trailer is assumed to be 45 years. The survival
probabilities reflect a smooth, gradual reduction over 45 years and are constrained by the
condition that the total survival trailers of various ages would be close to the 5.24 million. The
rate of reduction in survivability modulated with that of truck tractors but with a slower pace.
The weighted survival rate at a specific age for trailer is the percentage of survival trailers at that
age among an operational fleet of trailers. These weighted survival rates serve as the surrogate
for VMT adjusted survival rates as shown in the discount factor for truck tractors in Table VI-I
to derive discount factors for trailers. Table VII-5 shows the process of deriving discount factors

VII-8
for trailers. As shown in the table, the discount factor for the 3 percent discount rate is 68.26
percent and for the 7 percent discount rate it is 49.95 percent. Therefore, the lifetime benefits of
the alternative are 68.26 percent of the initial undiscounted estimates using a 3 percent discount
rate. At 7 percent, the lifetime benefits are 49.95 percent of the initial estimates.
Table VII-6 presents cost-effectiveness and net benefits of Alternative 2 by discount rate. As
shown, Alternative 2 would save 5 to 7 lives, even fewer than Alternative 1. In addition, this
Alternative would have no impact on LOC crashes. Moreover, not only is Alternative 2
significantly less cost-effective than both the proposal and Alternative 1, it would also produce
negative net benefits. Therefore, Alternative 2 is not proposed.

VII-9
Table VII-5 Mid-Year Discount Factors for Trailers
Age Survival Rate (a)
# of Trailers
(b)
Weighted Survival Rate (%) (c)
Raw Discount Factors
(d)
Weighted Discounted Factors
(e) 3% 7% 3% 7% 1 1.0000 203,000 3.99 0.9853 0.9667 0.0393 0.0386 2 1.0000 203,000 3.99 0.9566 0.9035 0.0382 0.0360 3 1.0000 203,000 3.99 0.9288 0.8444 0.0371 0.0337 4 1.0000 203,000 3.99 0.9017 0.7891 0.0360 0.0315 5 1.0000 203,000 3.99 0.8755 0.7375 0.0349 0.0294 6 0.9950 201,985 3.97 0.8500 0.6893 0.0337 0.0274 7 0.9900 200,970 3.95 0.8252 0.6442 0.0326 0.0254 8 0.9850 199,955 3.93 0.8012 0.6020 0.0315 0.0237 9 0.9800 198,940 3.91 0.7778 0.5626 0.0304 0.0220 10 0.9750 197,925 3.89 0.7552 0.5258 0.0294 0.0205 11 0.9530 193,459 3.80 0.7332 0.4914 0.0279 0.0187 12 0.9310 188,993 3.71 0.7118 0.4593 0.0264 0.0170 13 0.9090 184,527 3.62 0.6911 0.4292 0.0250 0.0155 14 0.8870 180,061 3.54 0.6710 0.4012 0.0238 0.0142 15 0.8650 175,595 3.45 0.6514 0.3749 0.0225 0.0129 16 0.8330 169,099 3.32 0.6324 0.3504 0.0210 0.0116 17 0.8010 162,603 3.19 0.6140 0.3275 0.0196 0.0104 18 0.7690 156,107 3.06 0.5961 0.3060 0.0182 0.0094 19 0.7370 149,611 2.94 0.5788 0.2860 0.0170 0.0084 20 0.7050 143,115 2.81 0.5619 0.2673 0.0158 0.0075 21 0.6630 134,589 2.64 0.5456 0.2498 0.0144 0.0066 22 0.6210 126,063 2.48 0.5297 0.2335 0.0131 0.0058 23 0.5790 117,537 2.31 0.5142 0.2182 0.0119 0.0050 24 0.5370 109,011 2.14 0.4993 0.2039 0.0107 0.0044 25 0.4950 100,485 1.97 0.4847 0.1906 0.0095 0.0038 26 0.4630 93,989 1.85 0.4706 0.1781 0.0087 0.0033 27 0.4310 87,493 1.72 0.4569 0.1665 0.0079 0.0029 28 0.3990 80,997 1.59 0.4436 0.1556 0.0071 0.0025 29 0.3670 74,501 1.46 0.4307 0.1454 0.0063 0.0021 30 0.3350 68,005 1.34 0.4181 0.1359 0.0056 0.0018 31 0.3030 61,509 1.21 0.4059 0.1270 0.0049 0.0015 32 0.2710 55,013 1.08 0.3941 0.1187 0.0043 0.0013 33 0.2390 48,517 0.95 0.3826 0.1109 0.0036 0.0011 34 0.2070 42,021 0.83 0.3715 0.1037 0.0031 0.0009 35 0.1750 35,525 0.70 0.3607 0.0969 0.0025 0.0007 36 0.1530 31,059 0.61 0.3502 0.0905 0.0021 0.0006 37 0.1310 26,593 0.52 0.3400 0.0846 0.0018 0.0004 38 0.1090 22,127 0.43 0.3301 0.0791 0.0014 0.0003 39 0.0870 17,661 0.35 0.3205 0.0739 0.0011 0.0003 40 0.0650 13,195 0.26 0.3111 0.0691 0.0008 0.0002 41 0.0530 10,759 0.21 0.3021 0.0646 0.0006 0.0001 42 0.0410 8,323 0.16 0.2933 0.0603 0.0005 0.0001 43 0.0290 5,887 0.12 0.2847 0.0564 0.0003 0.0001 44 0.0170 3,451 0.07 0.2764 0.0527 0.0002 0.0000 45 0.0050 1,015 0.02 0.2684 0.0493 0.0001 0.0000 Total 5,093,270 Lifetime Discount Factor 0.6827 0.4595
b = a*203,000; c = b/total units; d= 11+Discount Rate
age-0.5; e = c * d

VII-10
Table VII-6 Summary of Cost-Effectiveness and Net Benefits by Discount Rate
Alternative 2 (2010 $)
At 3% Discount At 7% Discount Low High Low High Fatal Equivalents 5 7 3 5 Injury Benefits (1) $30,754,672 $43,935,246 $20,700,937 $29,572,767 PD&TD Savings $1,459,169 $2,038,560 $982,165 $1,372,153 Vehicle Costs* $81,200,000 $81,200,000 $81,200,000 $81,200,000 Net Costs (2) $79,740,831 $79,161,440 $80,217,835 $79,827,847 Net Cost Per Fatal Equivalent (3) $15,948,166 $11,308,777 $26,739,278 $15,965,569 Net Benefits (4) -$48,986,159 -$35,226,194 -$59,516,898 -$50,255,080 PD&TD: property damage and travel delay * Vehicle costs are not discounted, since they occur when the vehicle is purchased, whereas benefits occur over the vehicle’s lifetime and are discounted back to the time of purchase. (1) = $6,435,237 * Fatal Equivalents (2) = Vehicle Costs - PD&TD (3) = Net Costs/Fatal Equivalents (4) = Injury Benefits – Net Costs

VIII-1
CHAPTER VIII. REGULATORY FLEXIBILITY ACT AND UNFUNDED MANDATES REFORM ACT
A. Regulatory Flexibility Act
The Regulatory Flexibility Act of 1980 (5 U.S.C. §601 et seq.), as amended by the Small
Business Regulatory Enforcement Fairness Act (SBREFA) of 1996, requires agencies to evaluate
the potential effects of their proposed and final rules on small businesses, small organizations,
and small governmental jurisdictions in the United States.
5 U.S.C. §603 requires agencies to prepare and make available for public comment an initial
and a final regulatory flexibility analysis (RFA) describing the impact of proposed and final rules
on small entities if the agency decides that the rule may have a significant economic impact on a
substantial number of small entities. Each RFA must contain:
(1) A description of the reasons why action by the agency is being considered;
(2) A succinct statement of the objectives of, and legal basis for, a proposal or final rule;
(3) A description of and, where feasible, an estimate of the number of small entities to which
the proposal or final rule will apply;
(4) A description of the projected reporting, record keeping and other compliance
requirements of a proposal or final rule including an estimate of the classes of small
entities which will be subject to the requirement and the type of professional skills
necessary for preparation of the report or record;
(5) An identification, to the extent practicable, of all relevant Federal rules which may
duplicate, overlap, or conflict with the proposal or final rule;

VIII-2
(6) Each final regulatory flexibility analysis shall also contain a description of any significant
alternatives to the final rule which accomplish the stated objectives of applicable statutes
and which minimize any significant economic impact of the final rule on small entities.
1. Description of the reasons why action by the agency is being considered
NHTSA is considering this action to require an ESC system in truck tractors and large buses in
order to reduce the number of rollover and loss-of-control crashes and associated fatalities and
injuries. ESC has been found to be effective in reducing these two types of crashes which
account for 13 percent of the fatal truck tractor and large bus crashes.
2. Objectives of, and legal basis for, the proposal or final rule
Under 49 U.S.C. 322(a), the Secretary of Transportation (the “Secretary”) has authority to
prescribe regulations to carry out the duties and powers of the Secretary. One of the duties of the
Secretary is to administer the National Traffic and Motor Vehicle Safety Act, as amended (49
U.S.C. 30101 et seq.). The Secretary is authorized to issue Federal motor vehicle safety
standards (FMVSS) that are practicable, meet the need for motor vehicle safety, and are stated in
objective terms60. The Secretary has delegated the responsibility for carrying out the National
Traffic and Motor Vehicle Safety Act to NHTSA61. NHTSA is adopting this rule under the
Authority of 49 U.S.C. 322, 30111, 30115, 30117, and 30166; delegation of authority at 49 CFR
1.50.
60 49 U.S.C. 30111(a) 61 49 U.S.C. 105 and 322; delegation of authority at 49 CFR 1.50.

VIII-3
Furthermore, this final rule satisfies the congressional mandate in Section 10301 of the Safe,
Accountable, Flexible, Efficient, Transportation Equity Act: A Legacy for Users of 2005
(SAFETEA-LU).62 Under that provision, the Secretary of Transportation must conduct a
rulemaking to “establish performance criteria to reduce the occurrence of rollovers consistent
with stability enhancing technologies” and issue “a final rule by April 1, 2009.” This
responsibility was subsequently delegated to NHTSA.
3. Description and estimate of the number of small entities to which the proposal or final rule
will apply
The proposal applies to truck tractor and large bus manufacturers who produce these types of
vehicles with a GVWR greater than 11,793 kg (26,000 pounds). The proposal also will impact
manufacturers of ESC systems. Business entities are defined as small businesses using the North
American Industry Classification System (NAICS 2007) code63, for the purposes of receiving
Small Business Administration assistance. One of the criteria for determining size, as stated in
13 CFR 121.20164, is the number of employees in the firm. Affected business categories
include: (a) To qualify as a small business in Heavy Duty Truck Manufacturing (NAICS
336120), the firm must have fewer than 1000 employees, (b) In Truck Trailer Manufacturing
(NAICS 336212), the firm must have fewer than 500 employees, (c) In Other Motor Vehicle
Electronic and Electronic Equipment Manufacturing (NAICS 336322), the firm must have fewer
than 750 employees, (d) In Motor Vehicle Brake System Manufacturing (NAICS 336340), the
62 Pub. L. 109-59, 119 Stat. 1144 (2005) 63 The latest version modified by the Office of Management and Budget in 2007 64 Effectiveness August 22, 2008

VIII-4
firm must have fewer than 750 employees, and (e) In All Other Motor Vehicle Parts
Manufacturing (NAICS 336399), the firm must have fewer than 750 employees.
Small volume truck tractor and large bus manufacturers
The heavy truck industry is highly concentrated with large manufacturers, including Daimler
Trucks North America (Freightliner, Western Star), Navistar International, Mack Trucks Inc.,
PACCAR (Peterbilt and Kenworth), and Volvo Trucks North America, accounting for more than
99% of the annual productions. The remaining heavy truck manufacturers with a collective
production less than 1 percent of annual heavy truck output are mostly likely small business.
The agency believes there are approximately 37 bus manufacturers in the United States. Of
these, ten manufacturers can be classified as small business, with fewer than 1,000 employees.
They are Advanced Bus Industries, Ebus Inc., Enova Systems, Gillig Corporation, Krystal
Koach65 Inc., Liberty Bus, Sunliner Coach Group LLC66, TMC Group Inc., TMC Group Inc.,
Transportation Collaborative, Inc.67, and Van-Con, Inc.
However, most of these companies do not manufacture large buses. A review of online product
information indicates that only Sunliner Coach Group LLC specifically includes a bus in its
product offering, but it is primarily a producer of travel trailers, campers, shuttle buses, and
service buses. Other companies either manufacture other types of buses (school buses, transit
buses, etc.) or perform a variety of bus related modifications. One company, Liberty Coach,
65 owned by Krystal Enterprises; $175M revenue; 800 employees 66 Its parent holding company is Stallion Bus Industries, LLC, which is the distribution arm of the organization. 67 employs 140

VIII-5
manufacturers “bus homes”, which, although based on a bus body, would typically not include
the 16 designated seating positions, including 8 forward facing seating positions rearward of the
driver, that would define the final product as a bus. The agency thus concludes that this standard
would not have a significant impact on a significant number of small businesses.
Small ESC system manufacturers
No ESC system manufacturers would qualify as a small business under the definition (c) Other
Motor Vehicle Electronic and Electronic Equipment Manufacturing, (d) Motor Vehicle Brake
System Manufacturing, and (e) In All Other Motor Vehicle Parts Manufacturing above.
Nevertheless, the proposal is expected to have positive economic impacts on ESC manufacturers.
4. Description of the projected reporting, record keeping and other compliance requirements for
small entities
The rule requires manufacturers to equip their vehicles with ESC and to certify that their
products comply with the standard. There is no record keeping for this proposal.
5. Duplication with other Federal rules
There are no relevant Federal regulations that duplicate, overlap, or conflict with the final rule.
6. Description of any significant alternatives to the proposed rule
The agency considered one alternative based on the development and the implementation of the
stability control technologies and cost. The alternative was to require RSC for proposed
applicable truck tractors and large buses. In essence, the alternative focuses on reducing

VIII-6
rollover crashes and cost. The agency decided not to adopt this alternative since (1) the
alternative is slightly less cost-effective than the proposal, (2) significant benefits from loss-of-
control crashes would be lost, and (3) the industry trend is moving towards equipping their truck
tractors and large buses with ESC.
B. Unfunded Mandates Reform Act
The Unfunded Mandates Reform Act of 1995 (Public Law 104-4) requires agencies to prepare a
written assessment of the costs, benefits, and other effects of proposed or final rules that include
a Federal mandate likely to result in the expenditures by State, local or tribal governments, in the
aggregate, or by the private sector, of more than $100 million annually (adjusted annually for
inflation with base year of 1995). Adjusting this amount by the implicit gross domestic product
price deflator for the year 2010 results in $136 million (110.668/81.533 = 1.36). The assessment
may be included in conjunction with other assessments, as it is here.
This proposed rule is not estimated to result in expenditures by State, local or tribal governments
of more than $136 million annually. It also would not result in an expenditure of much more
than that magnitude by the automobile manufacturers and/or their suppliers. The estimated
annual cost would be $115 million annually. These effects have been discussed previously in
this Preliminary Regulatory Impact Analysis (see Chapter V, Costs).

A-1
APPENDIX A. RETROFITTING
The agency examined the practicability of retrofitting ESC, RSC, and trailer-RSC for in-service
truck tractors, large buses, and trailers. To retrofit in-service truck tractors and large buses with
ESC and RSC would be complex because it involves the integration between these systems with
vehicle’s chassis, engine, braking, other stability related systems (e.g., traction control), vehicle
local network communication systems, and electronic control units. Changes necessary to
originally manufactured vehicles include but are not limited to plumbing for new air brake
valves, adding wires and sensors, and implementing a new electronic control unit for a revised
antilock brake system. The ESC/RSC modules and required sensors need to be calibrated using
special tools. Therefore, it does not appear feasible to retrofit ESC and RSC. Furthermore, the
component costs and associated labor costs is expected to be very high and would not be cost-
effective. Specially, retrofitting in-service large buses with ESC or RSC would not be cost-
effective due to the small safety target population that would be impacted by retrofitting (about 1
rollover and 1 LOC crashes annually). In addition, retrofitting would impact 80 percent of large
bus operators with a large bus fleet size of less than the 10 vehicles68. For these reasons, the
agency has determined that it is not practical to retrofit applicable vehicles with ESC or RSC.
For trailer-RSC on the other hand, retrofitting service and equipment is already available.
Retrofitting trailer-RSC involves installing few additional components. The integration of a
trailer-RSC with an operational trailer includes replacing the ABS ECU/valve assembly with a
trailer-RSC ECU valve assembly, mounting an electronic sensor to measure the deflection of the
68 Motorcoach Facts, 2009, American Bus Association, www.buses.org

A-2
suspension springs or to sense the air pressure in an air suspension system, and possibly
installing wheel-speed sensors and cables (if the trailer is not already equipped with ABS).
Based on industry information, retrofitting trailer-RSC would cost $1,200 per unit plus four to
six hours of labor69.
The costs and benefits of retrofitting would depend on the retrofitting schedule of existing
trailers in the fleet, and the trailer-RSC installation rate in new models of trailers, and the
effectiveness of the technology in preventing rollovers. Therefore, the cost and benefit of
retrofitting trailer-RSC were estimated under the following assumptions:
(1) Retrofitting cost is estimated to be $1,305 which includes $1,200 for parts and five hours of
labor at a labor rate of $21 per hour. The five hours is the average of four and six hours
quoted above.
(2) The unit cost cited above is for trailers that are already equipped with ABS. Therefore, only
trailers manufactured after September 1998, the effective date for requiring ABS, would be
retrofitted. Retrofitting older, non-ABS trailers would likely be cost-prohibitive since the
wheel hubs and axles would need to be replaced or modified.
(3) The timeframe for retrofitting and the retrofitting schedule within that timeframe would
impact the cost and benefit estimates. For simplicity, the timeframe is set to be 10 years
starting 2014. The analysis examines two retrofitting schedules. One is the maximum
benefit scenario which assumes retrofitting would be completed within the first year. The
other one is the least cost scenario which assumes that retrofitting would be completed by the
last year of the 10 years period, i.e., 2023.
69http://www.todaystrucking.com/

A-3
(4) All 2015 trailers and newer would have trailer-RSC. The number of trailers older than the
2015 model year that would have the factory -installed trailer-RSC is believed to be
extremely small relatively to their annual production. Thus, the trailer-RSC installation rates
for trailers older than 2015 were assumed to be zero percent.
(5) Trailers operate in tandem with truck tractors. Therefore, the benefits from retrofitting
trailer-RSC would also be impacted by the ESC and RSC installation rates in truck tractors.
ESC and RSC installation rates for truck tractors newer than 2012 model are assumed at the
2012 level. Their installation rates for tractor models up to 2012 were estimated from
industry’s historic data and future product plans that were submitted in response to the
agency’s request in 2009.
(6) The retrofitted trailer-RSC is assumed to be as effective as the factory installed trailer-RSC.
Thus, the effectiveness of trailer-RSC against target rollovers ranges from 7 to 10 percent.
Table A-1 provides the ESC, RSC, and trailer-RSC installation rates by retrofitting scenario and
model year based on the above assumptions. For a given technology, its installation rates were
weighted by the appropriate survival probabilities (Table VII-4 for trailers and Table VI-1 for
truck tractors) to derive an overall installation rate for that technology among the in-service
vehicles (i.e., truck tractors for ESC/RSC, trailers for trailer-RSC). The overall installation rates
were used to estimate adjustment factors to discount the initial target population in order to
account for the impacts of the increasing installation of these stability technologies on future
crashes. The process of deriving an overall installation rate for a given technology can be
expressed as:

A-4
OI= � Si*Ii
OL
i=1
Where:
OI = an overall installation rate of a technology among a operational fleet
i = age of the vehicles
Si = survival probability at age i
OL = operational life, 45 years for trailers and 35 years for truck tractors
Ii = installation rate of a technology for year i model vehicles.

A-5
Table A-1 ESC, RSC, and Trailer-RSC Installation Percentage
by Retrofitting Scenario and Applicable Vehicle Model Year* Maximum Benefit Scenario Least Cost Scenario Age Model
Year ESC RSC Trailer-
RSC Model Year
ESC RSC Trailer-RSC
1 2014 26.2 16.0 2023 26.2 16.0 100.0 2 2013 26.2 16.0 2022 26.2 16.0 100.0 3 2012 26.2 16.0 2021 26.2 16.0 100.0 4 2011 23.3 14.8 2020 26.2 16.0 100.0 5 2010 21.8 12.3 2019 26.2 16.0 100.0 6 2009 13.8 17.0 2018 26.2 16.0 100.0 7 2008 12.1 12.0 2017 26.2 16.0 100.0 8 2007 7.4 10.5 2016 26.2 16.0 100.0 9 2006 3.2 6.4 2015 26.2 16.0 100.0 10 2005 0.2 5.4 2014 26.2 16.0 11 2004 2013 26.2 16.0 12 2003 2012 26.2 16.0 13 2002 2011 23.3 14.8 14 2001 2010 21.8 12.3 15 2000 2009 13.8 17.0 16 1999 2008 12.1 12.0 17 2007 7.4 10.5 18 2006 3.2 6.4 19 2005 0.2 5.4 20 2004 21 2003 22 2002 23 2001 24 2000 15 1999 *1999 and newer Bold-faced model year is the latest model information submitted by the manufacturers

A-6
Adjustment factors for ESC and RSC can be derived using the f1 formula that was previously
presented in the Chapter IV. The adjustment factor to account for the impact of trailer-RSC
installation among new trailers during the retrofitting period is merely one minus the overall
trailer-RSC installation rate.
The trailer-RSC installation rates shown in Table A-1 and trailers’ survival probabilities (Table
VII-5) are also used to derive the percent of operational trailers that would be retrofitted.
Applying this percentage to the total of 5.24 million in-service trailer units derives the number of
affected trailers. Table A-2 presents all the measures mentioned above, i.e., the total number of
affected trailers, the overall ESC, RSC, and trailer-RSC installation rates, and adjustment factors.
Table A-2 Affected Trailers, Technology Installation Rates, and
Target Population Adjustment Factors by Retrofitting Scenarios Maximum Benefit Least Cost Affected Percent of Trailers 61.0% 48.9% Total Affected Trailers (1) 3,199,918 2,561,926 Installation Rate (%) ESC 12.3% 22.3% RSC 9.4% 14.3% Trailer-RSC 0.0% 35.7% Adjustment Factors Account for ESC and RSC 80.3% 65.0% Account for Trailer-RSC 100.0% 64.3% Final Adjustment Factor (2) 80.3% 41.8% (1) = affected percent * 5.24 million (2) = ESC/RSC factor * Trailer-RSC factor
The following tables, A-3 to A-5, separately represent the adjusted baseline population,
undiscounted benefits, the summary cost-effectiveness and net benefits by retrofitting scenario.
As shown in Table A-5, retrofitting trailer-RSC would cost $3.3 to $4.2 billion. Retrofitting
trailer-RSC is extremely non cost-effective. The cost per equivalent live saved would range

A-7
from $463 million to $1.7 billion. Therefore, the agency has determined that it is impractical to
consider retrofitting trailer-RSC.
Table A-3 Target Population by Retrofitting Scenarios
Maximum Benefits Least Cost
Crashes 4,336 2,257 MAIS Injuries
1 1,368 712 2 236 123 3 105 55 4 26 14 5 9 5
MAIS 1-5 1,744 909 Fatality 87 45 PDOV 2,595 1,350
PDOV: property damage only vehicles
Table A-4 Undiscounted Benefits by Retrofitting Scenarios
Maximum Benefits Least Cost
Low High Low High
Crashes 304 434 158 226 MAIS Injuries
1 96 137 50 71 2 17 24 9 12 3 7 11 4 6 4 2 3 1 1 5 1 1 0 1
MAIS 1-5 123 176 64 91 Fatality 6 9 3 5 PDOV 182 260 95 135
PDOV: property damage only vehicles

A-8
Table A-5 Summary of Cost-Effectiveness and Net Benefits by Retrofitting Scenarios
(2010 $)
At 3 Percent Maximum Benefits Least Cost Low High Low High Fatal Equivalents 6 9 3 5 Injury Benefits (1) $39,541,721 $57,115,820 $17,574,098 $30,754,672 PD&TD Savings $1,928,133 $2,768,177 $1,001,121 $1,442,234 Vehicle Costs* $4,175,892,990 $4,175,892,990 $3,343,313,430 $3,343,313,430 Net Costs (2) $4,173,964,857 $4,173,124,813 $3,342,312,309 $3,341,871,196 Net Cost Per Fatal Equivalent (3) $695,660,810 $463,680,535 $1,114,104,103 $668,374,239 Net Benefits (4) -$4,134,423,136 -$4,116,008,993 -$3,324,738,211 -$3,311,116,524
At 7 Percent Maximum Benefits Least Cost Low High Low High Fatal Equivalents 4 6 2 3 Injury Benefits (1) $26,615,491 $38,444,598 $11,829,107 $20,700,937 PD&TD Savings $1,297,824 $1,863,257 $673,854 $970,766 Vehicle Costs* $4,175,892,990 $4,175,892,990 $3,343,313,430 $3,343,313,430 Net Costs (2) $4,174,595,166 $4,174,029,733 $3,342,639,576 $3,342,342,664 Net Cost Per Fatal Equivalent (3) $1,043,648,792 $695,671,622 $1,671,319,788 $1,114,114,221 Net Benefits (4) -$4,147,979,675 -$4,135,585,135 -$3,330,810,469 -$3,321,641,727 PD&TD: property damage and travel delay * Vehicle costs are not discounted, since they occur when the vehicle is purchased, whereas benefits occur over the vehicle’s lifetime and are discounted back to the time of purchase. (1) = $6,435,237 * Fatal Equivalents (2) = Vehicle Costs - PD&TD (3) = Net Costs/Fatal Equivalents (4) = Injury Benefits – Net Costs

B-1
APPENDIX B. REVISED COMPREHENSIVE COSTS
Comprehensive costs which include both economic impacts and lost quality (or value) are used
in the cost-effectiveness and net benefit analyses. The agency develops the comprehensive costs
for fatalities and MAIS injuries periodically by thoroughly surveying all cost components that
are associated with automobile accidents. Cost components include costs for medical care,
emergency service (EMS), market productivity, household productivity, insurance
administration, workplace loss, legal costs, travel delay, property damage, and lost quality of life
(QALYs). The most recent estimates were developed in 200070. Table B-1 shows estimated
costs by injury severity levels for both crash avoidance and crashworthiness countermeasures.
The difference between these two sets of costs is that travel delay and property damage costs
which were typically associated with crash avoidance countermeasures were excluded from the
costs for crashworthiness countermeasures.
Table B-1 Comprehensive Costs
(2000 $) Injury Severity Comprehensive Cost
(for Crash Avoidance) Comprehensive Cost* (for Crashworthiness)
MAIS 1 $15,017 $10,396 MAIS 2 $157,958 $153,157 MAIS 3 $314,204 $306,465 MAIS 4 $731,580 $720,747 MAIS 5 $2,402,997 $2,384,403 Fatality $3,366,388 $3,346,966 Source: Table VIII-9 of “The Economic Impact of Motor Vehicle Crashes 2000” * Excluding traffic delay and property damage
70 Blincoe, L., et al., The Economic Impact of Motor Vehicle Crashes 2000, Washington, DC, DOT HS 809 446, May 2002.

B-2
In the 2002 report, the comprehensive costs were derived using an earlier DOT guideline on the
value of a statistical life (VSL) of $3.0 million. In 2007, the DOT revised this guideline and
raised the VSL from $3.0 million to $5.8 million. In 2009, the DOT revised the VSL again to
$6.0 million. VSL includes QALYs, household productivity, and the after-tax portion of market
productivity. In response to the new guideline, the agency needs to revise all relative costs for
non-fatal MAIS injuries. Currently, the agency is conducting research to estimate the relative
values for injuries. The revised estimates will be published when they become available. In the
interim, the agency has adjusted the unit comprehensive costs first by adjusting each of the cost
components to the 2008 value using an appropriate consumer price index. Then, QALYs for
MAIS injuries were adjusted further to reflect the revised VSL but the relative injury-to-fatal
ratios of QALYs were maintained as estimated in the 200 report. Table B-2 shows the adjusted
unit cost estimates in 2008 values by cost category. As shown, the revised comprehensive cost
for a fatality is now estimated to be $6.34 million for crash avoidance countermeasures and
$6.31 million for crashworthiness countermeasure. The QALYs for a fatality is estimated to be
$5.1 million. QALYs for MAIS injuries were derived by applying QALY injury-to-fatal ratios
published in the 2000 report to the $5.1 million. The relative injury/fatal ratios under
“comprehensive cost” are used to derive fatal equivalents for benefits accrued from crash
avoidance countermeasures and ratios under “injury comprehensive cost” are used for
crashworthiness countermeasures.

B-3
Table B-2 Unit Costs Reflecting the $6.0 Million Value of a Statistical Life (VSL)
(2008 $)
CPI Cost Item MAIS 1 MAIS 2 MAIS 3 MAIS 4 MAIS 5 Fatal 1.395955 Medical $3,322 $21,812 $64,905 $183,297 $464,095 $30,844 1.250308 EMS $121 $265 $460 $1,038 $1,065 $1,042 1.309809 Market Productivity $2,291 $32,767 $93,591 $139,415 $574,620 $779,805 1.309809 Household Produce $749 $9,590 $27,604 $36,686 $195,565 $250,882 1.250308 Insurance. Admin. $926 $8,638 $23,622 $40,429 $85,267 $46,411 1.309809 Workplace Cost $330 $2,558 $5,588 $6,153 $10,729 $11,398 1.250308 Legal Costs $188 $6,228 $19,765 $42,117 $99,845 $127,704 1.309809 Travel Delay $1,018 $1,108 $1,231 $1,308 $11,982 $11,982 1.250308 Property Damage $4,806 $4,944 $8,501 $12,294 $11,810 $12,844 1.309809 QALYs $9,448 $193,276 $271,680 $813,183 $2,771,438 $5,066,789
Revised Comprehensive Costs $23,199 $281,186 $516,947 $1,275,920 $4,226,416 $6,339,701
Injury Subtotal* $17,375 $275,134 $507,215 $1,262,318 $4,202,624 $6,314,875 Relative Injury-To-Fatal Ratios
QALYs 0.0019 0.0381 0.0536 0.1605 0.5470 1.0000 Comprehensive Cost 0.0037 0.0444 0.0815 0.2013 0.6667 1.0000
Injury Comprehensive Cost* 0.0028 0.0436 0.0803 0.1999 0.6655 1.0000 QALYs: Quality-Adjusted Life Years * Excluding travel delay and property damage and specifically used for crashworthiness countermeasures