fnetfibre cabling handbook
DESCRIPTION
Regarding fire cable installation,testingTRANSCRIPT

Optical Fiber Cabling for Data Communication – Test and Troubleshooting Handbook
N E T W O R K S U P E R V I S I O N

1
N E T W O R K S U P E R V I S I O N
Table of Contents
1. Introduction .............................................................................................. 2
2. An Overview of the Principles of Transmission over Optical Fiber . . . . . . . . . . . . 3
• Construction . . . . . . . . . . . . . . . . . . . . . . . . . . . . . . . . . . . . . . . . . . . . . . . . . . . . . . . . . . . . . 3
• Reflectionandrefraction . . . . . . . . . . . . . . . . . . . . . . . . . . . . . . . . . . . . . . . . . . . . . . . . . 3
• Signaling . . . . . . . . . . . . . . . . . . . . . . . . . . . . . . . . . . . . . . . . . . . . . . . . . . . . . . . . . . . . . . . . 4
• Requirementsforreliabletransmission . . . . . . . . . . . . . . . . . . . . . . . . . . . . . . . . . . . . 5
3. Testing Theory – Performance of Optical Fiber Cabling . . . . . . . . . . . . . . . . . . . . . 12
• Industryperformancestandards . . . . . . . . . . . . . . . . . . . . . . . . . . . . . . . . . . . . . . . . . . 12
• Cablingcertification . . . . . . . . . . . . . . . . . . . . . . . . . . . . . . . . . . . . . . . . . . . . . . . . . . . . . 16
4. Fiber Verification Testing . . . . . . . . . . . . . . . . . . . . . . . . . . . . . . . . . . . . . . . . . . . . . . . . . . 25
5. How to Certify Fiber Optic Cabling with OLTS and LSPM . . . . . . . . . . . . . . . . . . . . 26
6. How to Certify Fiber Optic Cabling with an OTDR . . . . . . . . . . . . . . . . . . . . . . . . . . . 32
• Cablecertificationteststrategy . . . . . . . . . . . . . . . . . . . . . . . . . . . . . . . . . . . . . . . . . . 36
7. Common Faults . . . . . . . . . . . . . . . . . . . . . . . . . . . . . . . . . . . . . . . . . . . . . . . . . . . . . . . . . . . . 37
8. How to Troubleshoot Common Faults with an OTDR . . . . . . . . . . . . . . . . . . . . . . . . . 39
• FindingfaultswithanOTDR . . . . . . . . . . . . . . . . . . . . . . . . . . . . . . . . . . . . . . . . . . . . . 39
9. End-Face Inspection and Cleaning . . . . . . . . . . . . . . . . . . . . . . . . . . . . . . . . . . . . . . . . . 44
• Inspection . . . . . . . . . . . . . . . . . . . . . . . . . . . . . . . . . . . . . . . . . . . . . . . . . . . . . . . . . . . . . . 44
• Cleaning. . . . . . . . . . . . . . . . . . . . . . . . . . . . . . . . . . . . . . . . . . . . . . . . . . . . . . . . . . . . . . . . 45
10. Conclusion . . . . . . . . . . . . . . . . . . . . . . . . . . . . . . . . . . . . . . . . . . . . . . . . . . . . . . . . . . . . . . . . 46
11. Glossary . . . . . . . . . . . . . . . . . . . . . . . . . . . . . . . . . . . . . . . . . . . . . . . . . . . . . . . . . . . . . . . . . . . 47
12. Appendices . . . . . . . . . . . . . . . . . . . . . . . . . . . . . . . . . . . . . . . . . . . . . . . . . . . . . . . . . . . . . . . . 48

2
1. IntroductionAs fiber links support higher speed network bandwidths with increasingly stringent require-
ments, it is becoming all the more important to ensure that your backbone links meet
tightening loss standards. The need for higher data transmission capacity continues to grow
as network applications grow and expand. These higher transmission speeds demand cabling
that delivers higher bandwidth support. This testing guide outlines cabling performance
requirements, field testing, certification and troubleshooting techniques and instruments to
ensure that the installed optical fiber cabling supports the high data rate applications such
as 1 and 10 Gigabit per second (Gbps) Ethernet, Fibre Channel and the anticipated 40 and
100 Gbps Ethernet applications.
A local area network (LAN) or an enterprise (“premises”) network connects users up to a
distance of 2 to 5 km. It encompasses the intra-building connectivity as well as inter-build-
ing cabling or the campus cabling. Optical fiber cabling is primarily used for longer distance,
higher bandwidth connectivity while twisted pair copper cabling typically provides the
connection to the end-user or to the edge devices. This copper cabling can support network
connectivity to a distance of 100 meters (328 feet). Optical fiber cabling is the preferred
medium for distances beyond 100 meter such as riser cables in the building.
This booklet reviews best practices for test and troubleshooting methods as well as the test
tools to ensure that installed Optical Fiber cabling provides the transmission capability to
reliably support LAN or enterprise network applications. “Certification,” or the process of
testing the transmission performance of an installed cabling system to a specified standard,
ensures a quality installation. It also provides official documentation and proof that the
requirements set by various standards committees are fully satisfied.
Fiber optics is a reliable and cost effective transmission medium, but due to the need for
precise alignment of very small fibers, problems ranging from end-face contamination to link
damage can occur. Regardless, narrowing down the source(s) of failure is often a time-con-
suming and resource-intensive task.
For this reason, Fluke Networks has created an enterprise-focused fiber troubleshooting guide
to assist in ensuring: 1) proper assessment of cable installation quality, and 2) efficient
troubleshooting to reduce the time spent identifying the root cause of a problem before tak-
ing corrective action to fix it. Note that this guide does not address issues that are especially
germane to the long-haul telecommunications application of the fiber optics technology.

3
N E T W O R K S U P E R V I S I O N
2. An Overview of the Principles of Transmission over Optical Fiber
ConstructionOpticalfibercableconsistsofextremelythinstrandsofultra-pureglassdesignedtotrans-
mit light signals. Figure 1 depicts the construction of the buffered glass strand that is the
basiccomponentinmanyopticalfibercableconstructions.Thecenterofthefiberstrand
iscalledthe‘core’.Thecoreactuallycontainsthelightsignalstobetransmitted.Aglass
layercalledthe‘cladding’surroundsthecore.Thecladdingconfinesthelightinthecore.
Theouterregionoftheopticalfiberisthecoatingor‘buffer’.Thebuffer,typicallyaplastic
material,providesprotectionandpreservesthestrengthoftheglassfiber.
Acommonouterdiameterforthecladdingis125micron(μm)or0.125mm.Thediameter
ofthecoreforopticalfibercablecommonlyusedinpremisesinfrastructuresiseither62.5,
50or9μm.Thelarger62.5and50μmdiameterdefinesmultimodefibertypes;singlemode
fiberhasthesmallerdiameterwithanominalvalueof9μm.
Reflection and refractionTheoperationofopticalfiberisbasedontheprincipleoftotalinternalreflection.
Figure 2 illustrates this principle when light travels from air into water. When light arrives
at the water surface at an incident angle θ less than the critical angle θc, it travels into
thewaterbutchangesdirectionattheboundarybetweenairandwater(refraction). When
a light beam strikes the water surface at an angle greater than the critical angle, the light
reflectsonthewatersurface.Eachmaterialischaracterizedbyanindexofrefraction,
whichisrepresentedbythesymboln.Thisindex,alsocalledrefractiveindex,istheratio
ofthevelocityoflightinvacuum(c)toitsvelocityinaspecificmedium(v).
n=c/v
Therefractiveindexinvacuum(outerspace)is1(v = c).Therefractiveindexforair(n1)
is1.003orslightlyhigherthanthatofavacuumwhiletherefractiveindexforwateris
1.333. A higher value of the refractive index n of a material indicates that the light travels
slower in that material. Light travels faster through the air than in water.
CoreCladding
Coating or Buffer
Figure 1 – Cross section of an optical fiber

4
Figure 2 - Principle of total reflection
Thecoreofanopticalfiberhasahigherrefractiveindexthanthecladding.Thelightthat
strikestheboundarybetweenthecoreandthecladdingatanincidentanglegreaterthan
thecriticalanglereflectsandcontinuestotravelwithinthecore.Thisprincipleoftotal
reflectionisthebasisfortheoperationofopticalfiber.Thecriticalangleisafunctionof
the refractive index of the two media, in this case the glass in the core and the glass in
thecladding.Therefractiveindexforthecoretypicallyisaround1.47whiletherefractive
indexforthecladdingisapproximately1.45.
Becauseofthisprinciple,wecandescribeanimaginaryconewithanangle α which is
related to the critical angle (see Figure 3).Ifthelightislaunchedintothefiberendfrom
withinthiscone,itissubjecttototalreflectionandtravelsinthecore.Thenotionof
thisconeisrelatedtothetermnumericalaperture,thelightgatheringabilityofthefiber.
Lightlaunchedintothefiberendoutsideofthisconewillrefractintothecladdingwhenit
meetsthecore-claddingboundary;itdoesnotstaywithinthecore.
Figure 3 - Numerical aperture and total reflection: Light that enters the fiber within an angle α travels in the core
SignalingLocal area networks like Ethernet and Fibre Channel transmit pulses that represent digital
information.Thebit–shortforbinarydigit–isthebasicunitofdigitalinformation.This
unitcanonlytakeoneoftwovalues:0or1.Numericdataistransformedintoadigital
number. Other data such as characters are coded in a string of bits. An ‘On’ or an ‘Off’
A) Angle of incidenceθ < θcritical
B) Critical Angleθ = θcritical
C) Total Reflectionθ > θcritical
θθ θ
n1n2
n1n2
90
n1n2
θ
n2n1α
Core index of refraction n1 = 1.47Cladding index of refraction n2 = 1.45

5
N E T W O R K S U P E R V I S I O N
stateelectronicallyrepresentsthevalueofabit.Similarly,aserialstringoflightpulses
representsthedigitalinformationtransmittedoveranopticalfiberlink.The‘On’state
represents a bit with value 1 and the ‘Off’ state represents a bit with value 0. Figure 4
representssuchasampleofdigitalinformationastransmittedoveranopticalfibercable.
Figure 4 - A typical pulse train that represents the digital data
TherepresentationofthepulsesinFigure 4 is “idealized”. In the real world, pulses have
limited rise and fall times. Figure 5 describes the main characteristics of a pulse. Rise
timeindicatestheamountoftimerequiredtoturnthelighttothe‘On’state;itistypi-
callycharacterizedbythetimerequiredtotransitionfrom10%to90%oftheamplitude.
Fall time is the opposite of rise time and represents the duration to turn the light from ‘On’
to‘Off’.Risetimeandfalltimearecriticalparameters;theydeterminetheupperlimitfor
therateatwhichthesystemcancreateandtransmitpulses.
Figure 5 - Analysis of a pulse
Whentransmittingonebillionormorebitspersecond(datarateof1Gbpsormore),LED
lightsourcescannolongerbeusedduetotheriseandfalltimeoftheLEDlightsources.
Thesehigher-speedsystemsonlyuselaserlightsources.Averycommonlightsourcein
premisesnetworksistheVCSEL(VerticalCavitySurfaceEmittingLaser)thattransmitslight
at the 850 nm wavelength.
Requirements for reliable transmissionWhen the light source in the transmitting device generates a pulse train like the one
depicted in Figure 4,theopticalfiberlinkmusttransmitthispulsetrainwithsufficient
signalfidelitysothatthedetectoratthereceivingdevicecandetecteachpulsewithits
true value of ‘On’ or ‘Off’.
0
High state(ON)
Bit time slot
Low state(OFF)
1 1 1 1 10 0 0 0
90%
50%
10%
Rise time
Width
Amplitude
Fall time

6
Minimally, two things are required to ensure reliable reception and transmission:
Channel insertion loss: the maximum signal loss or signal attenuation allowed over
thetransmissionmediumfromthetransmittingdevicetothereceivingdevice.Theterm
‘channel’definestheend-to-endtransmissionmediumbetweentransmitterandreceiver.
Thesignallossconsistsofthecumulativelossesintheopticalfibercablingandineach
connection or splice.
Signal dispersion:Aswewilldiscuss,thelightpulseshaveatendencytospreadoutas
theyaretravelingalongthefiberopticallinkduetodispersion.Thespreadingmustbe
limited to prevent the pulses from running together or overlapping at the receiving end.
Bothoftheseparameters–channellossandsignaldispersion–playacriticalroleines-
tablishingreliableanderror-freetransmission.Dispersioncannotbemeasuredinthefield.
Thenetworkstandardsdefineamaximumchannellengthforanopticalfiberchannel;the
maximumlengthisafunctionofdatarateandthebandwidthratingoftheopticalfiber.
Thebandwidthrating,inturn,isbasedonlaboratorymeasurementstocharacterizethe
modaldispersioninmultimodeopticalfibers.
LossLoss or attenuation has been a well-established performance parameter in the cabling
andnetworkapplicationstandards.Thesignalmustarriveattheendofthefiberoptic
link–theinputtothedetectoratthereceivingdevice–withsufficientstrengthtobe
properlydetectedanddecoded.Ifthedetectorcannotclearly“see”thesignal,transmis-
sioncertainlyhasfailed.
Attenuationorsignallossinopticalfiberiscausedbyseveralintrinsicandextrinsic
factors.Twointrinsicfactorsarescatteringandabsorption.Themostcommonformof
scattering,called‘RayleighScattering’,iscausedbymicroscopicnon-uniformitiesinthe
opticalfiber.Thesenon-uniformitiescauseraysoflighttopartiallyscatterastheytravel
alongthefibercoreandthussomelightenergyislost.Rayleighscatteringisresponsible
forroughly90%oftheintrinsiclossinmodernopticalfibers.Ithasagreaterinfluence
when the size of the impurities in the glass is comparable to the wavelength of the light.
Longer wavelengths are therefore less affected than shorter wavelengths and longer wave-
lengths are subject to less loss than the shorter wavelengths.
Extrinsic causes of attenuation include cabling manufacturing stresses and bends in the
fiber.Bendscanbedistinguishedintwocategories:microbendingandmacrobending.
Microbendingiscausedbymicroscopicimperfectionsinthegeometryofthefiberresulting
fromthemanufacturingprocesssuchasrotationalasymmetry,minorchangesinthecore
diameter, or rough boundaries between the core and cladding. Mechanical stress, tension,
pressureortwistingofthefibercanalsocausemicrobending.Figure 6 depicts microbend-
inginafiberanditseffectonthelightpath.

7
N E T W O R K S U P E R V I S I O N
Figure 6 – A microbend in an optical fiber causes some light to escape the core which adds to the signal loss
Theprimarycauseofmacrobendingis
acurvaturewithasmallradius.The
standards describe the bend radius limits
as follows: “Cables with four or fewer
fibersintendedforCablingSubsystem1
(horizontal or centralized cabling) shall
support a bend radius of 25 mm (1 in)
when not subject to tensile load. Cables
withfourorfewerfibersintendedtobe
pulledthroughpathwaysduringinstalla-
tion shall support a bend radius of
50 mm (2 in) under a pull load of
220N(50lbf).Allotheropticalfiber
cables shall support a bend radius of 10 times the cable outside diameter when not subject
to tensile load, and 20 times the cable outside diameter when subject to tensile loading
up to the cable’s rated limit.”
Figure 7 shows the effect of a bend with smaller radius on the path of the light in the
fiber.Somelightinthehigherordermodegroupsisnolongerreflectedandguidedwithin
the core.
Thelengthofthefiberandthewavelengthofthelighttravelingthroughthefiberprimar-
ilydeterminetheamountofattenuation.Thelossinaninstalledopticalfiberlinkconsists
ofthelossinthefiberplusthelossinconnectionsandsplices.Thelossesinconnections
andsplicesrepresentthemajorityofthelossesinshorterfiberopticallinkstypicalinthe
premisesnetworkapplication.AtroubleshootingtoollikeanOpticalTimeDomainReflec-
tometer(OTDR)willallowyoutogaugeandinspectthelossateachconnectionorsplice.
DispersionDispersiondescribesthespreadingofthelightpulsesastheytravelalongtheopticalfiber.
Dispersionlimitsthebandwidthofthefiber,therebyreducingtheamountofdatathefiber
can transmit. We will limit the discussion of dispersion to modal dispersion in multimode
fiber.
Theterm‘multimode’referstothefactthatnumerousmodesoflightrayspropagatesimul-
taneouslythroughthecore.Figure 8showshowtheprincipleoftotalinternalreflection
appliestomultimodestepindexopticalfiber.Theterm‘stepindex’referstothefactthat
Figure 7 – A macrobend or bend with a tight bending radius cause higher order mode light to escape from the multimode core and thus cause signal loss.

8
the refractive index of the core is a step above the index of the cladding. When the light
entersthefiber,itseparatesindifferentpathsknownas‘modes’.Theprincipleoftotalin-
ternalreflectiondescribedaboveandshowninFigure 3 guides each path or mode through
thefibercore.Onemodetravelsstraightdownthecenterofthefiber.Othermodestravel
atdifferentanglesandbouncebackandforthduetotheinternalreflection.Themodes
bouncingthemostarecalledthe‘higherordermodes’.Themodesbouncingverylittleare
the‘lowerordermodes’.Theshortestpathisthestraightline.Allotherpathstakenby
the light (modes) are longer than the straight line path – the steeper the angle, the more
bounces taken, and the longer the path traveled. As the path length varies, so varies the
traveltimetoreachtheendofthefiberlink.Thedisparitybetweenarrivaltimesofthe
differentlightraysalsoknownasdifferentialmodedelay(DMD),isthereasonfordisper-
sionorspreadingofthelightpulseasittravelsalongthefiberlink.
Figure 8 – The optical fiber gathers all the light that enters within the angle determined by the Numerical Aperture. The light reflects at the boundary between the core and the cladding and travels along different paths. A path is also called a mode. Multimode optical fiber guides the light along multiple paths or modes. The light that enters at the wider angle takes more bounces and travels a longer way. It represents the higher order modes.
Theeffectofdispersionincreaseswiththelengthoftheopticalfiberlink.Aspulsestravel
farther, the difference in the path length increases, therefore the difference in arrival
timesincreasesandthespreadingofthepulsescontinuestogrow.Theeffectisthatthe
lightpulsesarrivingattheendofthelongerfiberlinkrunintoeachotherandthatthe
receiver can no longer distinguish them, let alone decode their state (value). Higher data
ratesareachievedbysendingshorterpulsesatrapidsuccession.Dispersionlimitstherate
at which pulses can be transmitted. In other words, dispersion limits the bandwidth of the
cabling.
Figure 9 – The net effect of dispersion causes the transmitted pulses to run together and overlap at the end of the link (input to the detector). The detector can no longer recognize and decode the state of individual pulses.
α
n2n1
Core index of refraction n1 = 1.47Cladding index of refraction n2 = 1.45

9
N E T W O R K S U P E R V I S I O N
Tocompensateforthedispersioninherentinmultimodestepindexfiber,multimode
gradedindexfiberwasdeveloped.‘Gradedindex’referstothefactthattherefractiveindex
ofthecoregraduallydecreasesfartherawayfromthecenterofthecore.Theglassinthe
center of the core has the highest refractive index which causes the light in the center
ofthecoretotravelattheslowestspeed.Thelightthattakestheshorterpaththrough
thefiberistravelingataslowerspeed.Thiscoreconstructionallowsallthelightraysto
reachthereceivingendinapproximatelythesametime,reducingthemodaldispersionin
thefiber.As Figure 10depicts,thelightingradedindexmultimodefibernolongertravels
instraightlinesfromedgetoedgebutfollowsaserpentinepath;itisgraduallyreflected
backtowardthecenterofthecorebythecontinuouslydecliningrefractiveindexofthe
glass in the core.
Figure 10 – Graded index multimode fiber. The refraction index of the core changes throughout the core. It is highest in the center and gradually decreases toward the boundary with the cladding. This creates light paths (modes) that follow a serpentine path as shown in the left panel of this figure. The lower modes light (center of the core) travels slowest while the modes in the outer regions that travel the longer distances travel faster. Graded index multimode fiber therefore provides better band-width.
Laser-optimizedmultimodefiberthatistobeusedforthenewerhigh-speednetwork
application (data rates in the Gigabit per second range) is constructed as graded index
multimodefiber.Thislaser-optimizedmultimodefiberalsousesthesmaller50μmcore
diameter.Thesmallercorediameteralsodecreasesthedispersioneffectinthefiberby
limiting the number of modes.
‘Singlemode’fiber,asthenameimplies,onlyallowsonemodeofpropagationatwave-
lengths longer then the cutoff wavelength1.The1310nmwavelengththatisusedbymost
premisesnetworkapplicationoversinglemodefiber(9μmcorediameter)iswellabove
thecutoffwavelengthwhichisbetween1150nmand1200nm.Singlemodefibersusing
thelongerwavelengthsretainthefidelityofeachlightpulseoverlongerdistancessince
theyexhibitnomodaldispersion(causedbymultiplemodes).Thus,moreinformationcan
1 Cutoff Wavelength:Thewavelengthbelowwhichasinglemodeopticalfiberceasestotransmitinasinglemode.
OverfilledLED
sourceCore
C
C
ncoreCladding
Buffer

10
be transmitted per unit of time over longer distances (intrinsic loss is less at the higher
wavelengths).Thisgivessinglemodefibershigherbandwidthcomparedtomultimodefiber.
Singlemodefiberdesignhasevolvedovertimeaswell.Otherdispersionmechanismsand
non-linearitiesexistwhichwewillnotcoversincetheyplayamuchlessimportantrole
intheopticalfiberapplicationinpremisesnetworks.Singlemodefiberhassomedisad-
vantages.Thesmallercorediametermakescouplinglightintothecoremoredifficult.The
tolerances for singlemode connectors and splices are more demanding to achieve good
alignment of the smaller core. Furthermore, the longer wavelength laser light sources are
more expensive than the VCSEL operating at 850 nm.
BandwidthAkeyfiberperformancecharacteristicisbandwidth,orinformation-carryingcapacityof
theopticalfiber.Indigitalterms,bandwidthisexpressedinabitrateatwhichsignalscan
be sent a given distance without one bit interfering with the bit before it or following it.
BandwidthisexpressedintheproductMHz•km.Theinterferenceoccursbecauseofthe
dispersion phenomenon we discussed above.
Bandwidthcanbedefinedandmeasuredinavarietyofways.Thethreestandardized
bandwidthspecificationsandapplicablemeasurementsareOverfilledBandwidth,Restricted
ModalBandwidthandLaserBandwidthorEffectiveModalBandwidth(EMB).Thereason
for these different methods stems from the differences in the characteristics of the light
sources used to transmit information.
Thetraditionallightsourcefor10Mbpsand100MbpsEthernethasbeentheLightEmit-
tingDiode(LED),anexcellentoptionforapplicationsoperatinguptospeedsof622Mbps.
LEDsproduceauniformlightoutputthatfillstheentirecoreoftheopticalfiberand
excitesallofitsmodes.Tobestpredictthebandwidthofconventionalmultimodefibers
whenusedwithLEDlightsources,theindustryusesamethodcalledOverfilledBandwidth
(OFL).
Asmentionedabove,LEDscannotbemodulatedfastenoughtotransmittheonebillionor
morepulsespersecondrequiredforGbpsdatarates.Acommonlightsourcetosupportthe
gigabittransmissionspeedsinpremisesnetworkapplicationsistheVCSEL(VerticalCavity
SurfaceEmittingLaser)at850μmwavelength.UnlikeanLED,thelightoutputofaVCSEL
isnotuniform.ItchangesfromVCSELtoVCSELacrosstheend-faceoftheopticalfiber.As
aresult,lasersdonotexciteallthemodesinmultimodefiberbutratherarestrictedsetof
modes.Andwhatmaybemoreimportant,eachlaserfillsadifferentsetofmodesinthe
fiberandwithdifferingamountsofpowerineachmode.
AsuperiormethodofensuringbandwidthinopticalfiberlinksforthedeploymentofGiga-
bitspeedsisthemeasurementofDMD(differentialmodedelay–seethepriordiscussion

11
N E T W O R K S U P E R V I S I O N
ondispersion).Thismeasurementtechniqueistheonlybandwidthspecificationmentioned
inthestandardsfor10Gbpsdatarates.TheLaserBandwidthorEMBismathematically
derivedfromtheDMDmeasurements.
Fiber TypesTheISO/IECstandard(std)11801definesfourtypesofopticalfiberstosupportvarious
classesofpremisesnetworkapplications.TheISO/IECstd11801orstd24702defines
threemultimodeopticalfibertypes(OM1,OM2andOM3)andtwosinglemodetypes
(OS1andOS2).ThesetypedesignationsarefindingacceptanceintheNorthAmerican
marketaswellandarelistedintheTIA-568-C.3document2.Thefollowingtableprovidesa
shortoverviewofthemaincharacteristicsofthesefibertypes.
Cable attenuation coefficient (dB/km)
Minimum modal bandwidth (MHz•km)
Overfilled Laser
Wavelength (nm) 850 1300 850 1300 850
Optical fiber type
Core diameter (μm)
OM1 50 or 62.5 3.5 1.5 200 500 Notspecified
OM2 50 or 62.5 3.5 1.5 500 500 Notspecified
OM3 50 3.5 1.5 1,500 500 2,000
OM4 (proposed)
50 3.5 1.5Tobedetermined
3,500 - 4,700
Table 1 – Multimode optical fiber types
Notethatolderorlegacymultimodefiberswithanoverfilledbandwidthratingbelow200
MHz•kmarenotincludedinthistableandarenolongerrecommendedinthedesignof
anynewinstallations.TheOM3designationdescribesthehigh-bandwidthlaser-optimized
multimodeopticalfibercable.Amongthedifferentfiberopticbasedtransmissionstan-
dards for 10 Gbps Ethernet, 10GBASE-SR (the serial transmission of 10 Gigabits per second
using the short wavelength VCSEL [850nm]) is the most economical implementation of this
high-speed network application in the premises local area network, the datacenter or the
storageareanetwork.Andforthisapplication,OM3isthepreferredfiberopticcabletype.
Manufacturersofopticalfiberhavedevelopedlaseroptimizedmultimodefiberwithmodal
bandwidthcharacteristicsthatarebetterthantheOM3typespecifications.Thismaylead
to the adoption of an ‘OM4’ rating with a proposed effective laser bandwidth in the range
from3,500to4,700MHz•km.
OS2iscommonlyreferredtoas“lowwaterpeak”singlemodefiberandischaracterizedby
havingalowattenuationcoefficientnear1383nm.
2TelecommunicationsIndustryAssociation(TIA).TIArepresentsthetelecommunicationindustryinassociationwiththeElectronicIndustriesAssociation.TIAisaccreditedbytheAmericanNationalStandardsInstitute(ANSI)asamajorcontributortovoluntarystandards.StandardANSI/EIA/TIA568CommercialBuildingTelecommunicationsCablingStandardistheprimarystandardrelatedtostructuredcablingsystemsinNorthAmerica.

12
3. Testing Theory – Performance of Optical Fiber Cabling
Certificationisthemostcompleteformoffield-testing.Asalludedtoearlier,the
certificationtestprocedureensuresthattheinstalledcablingconformstothetransmission
performancestandardsdefinedintheindustrystandardssuchastheapplicableInterna-
tional Organization for Standard/International Electrotechnical Commission (ISO/IEC) and
TIAstandards.
Industry performance standardsTwogroupsofstandardsshouldbeconsideredtoobtainacompletespecificationand
ensurethattheinstalledcablingwillsupporttherequirementsfortheintendednetwork
applications.Thegoalofcertificationtestingafterallistogaintheconfidencethatthe
cablingsystemwillnotbethesourceofanynetworkmalfunctionevenbeforethenetwork
equipmentisinstalled.Thetwogroupsofstandardsrecognizeeachother’srequirements
but do not provide a perfect overlap.
Generic installation standards Thegenericstandardsaddressthegeneralinstallationrulesandperformancespecifications.
TheapplicablestandardsaretheISOstd11801:2002andISO/IEC14763-3,Information
Technology–Implementationandoperationofcustomerpremisescabling–Testingof
opticalfibrecabling,andtheANSI/TIA568C.Thelatter–revision‘C’–consistsoffour
volumes.VolumeC.0GenericTelecommunicationsCablingforCustomerPremisesprovides
ageneraloverview.VolumeC.1CommercialBuildingTelecommunicationsCablingSystems
describes the recommended design for commercial buildings and volumes C.2 and C.3
describetheperformancespecificationsforthecablingcomponents;C.2addressestwisted
pairbalancedcablingandvolumeC.3opticalfibercabling.
Thesestandardsaddressfield-testspecificationsforpost-installationtransmission
performance which depends on cable characteristics, length, connecting hardware, cords,
cross-connectwiring,thetotalnumberofconnections,andthecarewithwhichtheyare
installedandmaintained.Forexample,severecablebends,poorlyinstalledconnectorsand
averycommonproblem–thepresenceofdust,dirtandothercontaminantsonthe
end-faceoffibersinconnections–negativelyinfluencelinkattenuation.
Theinstallationstandardsspecifyasaminimumtransmissionperformancethatthe
measured link loss be less than the allowed maximum (loss limit), which is based on the
numberofconnections,splicesandthetotallengthofopticalfibercable.Thiscertifica-
tionmustbeexecutedwithanaccurateOpticalLossTestSet(OLTS)oraLightSourceand
PowerMeter(LSPM).Thesetesttoolswillbedescribedinmoredetaillateraswellasthe
OpticalTimeDomainReflectometer(OTDR).AnOTDRprovidesagoodindicationoftotal
linklossbutisnotsufficientlyaccurateforlinklosscertificationtesting.Certification

13
N E T W O R K S U P E R V I S I O N
includestherequirementofdocumentationofthetestresults;thisdocumentationprovides
theinformationthatdemonstratestheacceptabilityofthecablingsystemorsupportof
specificnetworkingtechnologies.
The link attenuation allowance calculation:Link Attenuation Allowance (dB) = Cable Attenuation Allowance (dB) + Connector Insertion Loss
Allowance (dB) + Splice Insertion Loss Allowance (dB)
Where:CableAttenuationAllowance(dB)=MaximumCableAttenuationCoefficient(dB/km)×Length(km)
ConnectorInsertionLossAllowance(dB)=NumberofConnectorPairs×ConnectorLossAllowance(dB)
SpliceInsertionLossAllowance(dB)=NumberofSplices×SpliceLossAllowance(dB)
Table 1liststhecableattenuationcoefficientbycabletype;thiscoefficientis3.5dB/km
forallmultimodeopticalfibertypesrecommendedforpremisescablingsystems.Indoor
ratedsinglemodefiberhasanattenuationcoefficientof1.5dB/kmwhileoutdoorrated
singlemodefiberhasacoefficientof1dB/kmorlower.Thestandardsalsospecifythe
maximum connector loss allowance as 0.75 dB and the maximum splice loss allowance
as0.3dB.Well-executedcablinginstallationsshouldgenerallydeliverconnectionsthat
exhibitsignificantlylowerconnectionlosses.Thesamestatementappliestosplicelosses.
Notethatthelengthofthefiberlinkmustbeknownormustbemeasuredbythetesttool
to determine the loss limit.
Table 2showsanexampleapplicationofthelosslimitcalculations.Thecalculationis
performedfora300mOM3fiberlinksegmentwithjusttwoendconnectorsandnosplices
that is used with an 850 nm light source.
Max. loss per unit length or per item Length/ number Calculated loss (dB)
Max. loss in fiber 3.5 dB/km 0.3 1.05
Max. loss in connections 0.75 dB 2 1.5
Max. loss in splices 0.3 dB 0 0.0
Link loss limit 2.55
Table 2 – Loss limit calculation for a 300 m MM link segment with 850 nm light source
Wavelength and directional requirements
(1)HorizontalcablingorCablingSubsystem1linksegments(TIA-568-C.0)needtobe
tested in one direction at one wavelength, either 850 nm or 1300 nm for multimode, and
either 1310 nm or 1550 nm for single-mode.
(2)Backbone/risercabling(CablingSubsystem2andCablingSubsystem3linksegments)
shall be tested in at least one direction at both operating wavelengths to account for
attenuation differences associated with wavelength. Multimode link segments shall be
testedat850nmand1300nm;singlemodelinksegmentsshallbetestedat1310nmand
1550nm.Linksthatusekeyedconnectorstoimplementthefiberpolaritycanonlybe
testedinthedirectionprescribedbythekeyingoftheconnectors.

14
Network application standardForcertification,thenetworkapplicationstandardssuchastheIEEEstandard802.3
for Ethernet or the ANSI standard for FibreChannel (FC) must also be considered. High
throughputapplications(Gbpsrangeandabove)requiremorestringentlimitsonchannel
lengthandchannellossthatisdependingonthetypeandbandwidthratingoftheoptical
fiberandthelightsourcesusedinthenetworkdevices.Table 3 shows the maximum
supported distance and the maximum allowable channel loss for a number of common
networkapplicationsandforthedifferentfibertypeswedescribedearlierinTable 1.
Themaximumchannellength(maximumdistancesupported)isaproxyspecificationfor
dispersion. As long as the channel length does not exceed the maximum stated in the
standard, dispersion will not cause a communication breakdown.
Fieldcertificationshallverifythatfiberopticchannellengthdoesnotexceedthe
maximumsupporteddistance(thelengthlimit).Theinstallationstandardsdiscussed
aboverequirethemeasurementofcablelengthinordertocalculatethe‘maximumlink
attenuation allowance’ but the installation standards impose a generic maximum length,
whichmayfarexceedthelengthspecifiedfortheapplication.Table 3 documents that the
length is limited and that it decreases for higher data rate applications depending on the
bandwidthratingofeachfibertype(afunctionofthemodaldispersioncharacteristicsof
thefiber).Themaximumchannellosslimitsdecrease(becomesmorestringent)withthe
higherthroughputsystems.
OM1 OM2 OM3
Application Wavelength Dist.(m) Loss (dB) Dist.(m) Loss (dB) Dist.(m) Loss (dB)
10/100BASE-SX 850 300 4.0 300 4.0 300 4.0
100BASE-FX 1300 2000 11.0 2000 6.0 2000 6.0
1000BASE-SX 850 275 2.6 550 3.6 800 4.5
1000BASE-LX 1300 550 2.3 550 2.3 550 2.3
10GBASE-S 850 33 2.4 82 2.3 300 2.6
FC 100-MX-SN-I (1062 Mbaud)
850 300 3.0 500 3.9 860 4.6
FC 200-MX-SN-I (2125 Mbaud)
850 150 2.1 300 2.6 500 3.3
FC 400-MX-SN-I (4250 Mbaud)
850 70 1.8 150 2.1 270 2.5
FC 1200-MX-SN-I (10,512 Mbaud)
850 33 2.4 82 2.2 300 2.6
FDDI PMD (ANSI X3.166)
1300 2000 11.0 2000 6.0 2000 6.0
Table 3 – Maximum Channel Distance and Loss for multimode optical fiber application by fiber type.
Thechannelisthetotalcablinglinkincludingallpatchcordsorequipmentcordsthatlink
the active devices. Figure 11 depicts the difference between channel and permanent link.
Thepermanentlinkdescribesthelinkthatisconsideredapermanentpartofthebuilding

15
N E T W O R K S U P E R V I S I O N
ordatacenterinfrastructure.Thenetworkequipmentisconnectedtothepermanentlink
usingpatchcordsorequipmentcords.Careshouldbetakentoselectcordsmadeofthe
samefibertypeasthepermanentlinkopticalfibercabling.
Figure 11 – The channel represents the end-to-end link connecting transmitter and receiver. The fixed cabling – a subsegment of the channel – is called the permanent link. The figure shows a generic horizontal link model that contains optional connections such as the CP (Consolidation Point).
Oftenanopticalfiberlinkisconstructedwithseveralsegmentsorsectionsandthenet-
workequipmentisoftennotinstalledyetwhenthecablinginstallationiscertified.Itis
notsufficienttotesteachsegmentagainsttheinstallationstandards.Ensuringthatthe
installedcablingsystemwillsupporttheintendednetworkapplicationrequiresthatthe
installedchannels(end-to-endfiberlinks)meetthelengthandlossrequirementsdefined
intheapplicationspecificationasshowninTable 3.
Youmayselectoneoftwomethodstoassurethattheinstalledchannelmeetsthe
applicationrequirementsbeforeyouturnupthenetworkservice.
(1)Calculatethechannellossbyaddingthedataforeachlinksegmentinthechannel
and adding the expected loss contribution of the interconnecting patch cords. IEC stan-
dard14763-3makesexplicitassumptionsaboutthelossofaTRCconnectionwithalink
(0.3dB;seeTableA3-1)versusthemaximumlossofconnectionsmadewithcommercial
patch cords (0.75 dB).
(2)MeasurethechannellossasdemonstratedinFigure12.Theend-connectionsofthe
channel–connectionsmadewiththenetworkequipment–arenotincludedinthechan-
nellosslimit.ByreplacingtheequipmentcordswithTRCs,thelossintheendconnections
isnotpartofthetestresult.ThedifferenceinlengthbetweentheTRCsandthecombined
lengthoftheequipmentcordsrepresentsaverysmallerrorinlossof0.0035dBpermeter.
Ifwebelievethatthematedlossbetweenthelink-under-testandtheTRCsislowerthan
the loss with patch cords, the test in Figure 12 understates the channel loss somewhat.
Fluke Networks expects this difference to be much less than the assumptions made in IEC
14763-3.
Equipmentcord
EquipmentcordPatch cord
Fixed cabling
CP
Channel
Permanent link
Networkequipment
Networkequipment

16
Figure 12 – The end connections in Fig 12 are not part of the channel specification. By replacing the equipment cords with the Test Reference Cords (TRCs) for the channel loss and length measurement, the “error” in the loss measurement is represented by the difference in length between one TRC and the sum of the two equipment cords used to complete the channel. 1 m of cord represents 0.0035 dB.
Optical fiber link polarity Localareanetworkinstallationssupportbi-directionalcommunicationbyusingseparate
opticalfibersineachdirection.Thecablingsystemshallprovidemeanstomaintaincorrect
signalpolaritysothatthetransmitterononeendofthechannelwillconnecttothere-
ceiverontheotherendofthechannel.Severalmethodsareusedtomaintainpolarityfor
opticalfibercablingsystems.GuidelinesaredescribedandillustratedinAnnexBofTIA-
568-C.0.Duplexconnectortypesandarrayconnectorsystemsthatallowthefiberordering
arrangementtobemaintainedrelativetotheplug’skeyingfeaturesshouldbeselected.
Cabling Certification Select the performance standard
The standards define a minimum test procedure consisting of:
1. Measurementandevaluationofthelinklossusingan‘opticallosstestset’(OLTS)
– some standards refer to this test tool as a ‘light source and power meter’ (LSPM).
OLTSandLSPMtendtobeusedinterchangeably.Inthisdocumentwewillchoosethe
terminologyOLTSforcertificationtesttoolsthatautomaticallymeasurethelengthof
the link-under-test whereas we will use the term LSPM to designate test sets that do
notmeasurethelinklength–andthereforemayrequiresomemanualcalculationsto
interpretthemeasuredvalues.Thelightsourceisconnectedtooneendofthefiber-
under-test while the power meter is connected at the other end.
2. Measurementandevaluationofthelinklength.Thelengthmustbeknowntocalculate
thelosstestlimitformanyinstallationstandards–themaximumlosstobecontrib-
utedbytheopticalfiberinthelinklosslimitvalue.
Thelengthalsoplaysanimportantroletocertifythelinkforaspecificnetworkap-
plication. As shown in Table 3,themaximumlengthofafiberchannelforagiven
networkapplicationdependsonthefibertypeandbandwidthratingofthefiber.
Test referencecord Test reference
cordPatch cord
CP
Channel
Testeqp
Testeqp

17
N E T W O R K S U P E R V I S I O N
3. Verificationoflinkpolarity
Steps1through3constitutetheminimumcertificationtestingrequirement,alsoreferred
toas‘BasicCertification’or‘Tier1’testing.‘Tier2’testingalsoknownas‘Extended
Certification’testisoptionalandincludestheTier1testsplustheadditionofanOTDRlink
analysis(withtraceand/oreventtable).TheOTDRanalysiscanbeusedtocharacterize
thecomponentswithintheinstalledfiberlinkresultinginanindicationoftheuniformity
of cable attenuation and individual connector insertion loss, individual splice insertion
lossandother“events”thatmaybedetected.AnOTDRanalysisprovidesanoverallloss
measurementforthelink.Thestandardsdefinethatthebasiccertification(Tier1)loss
measurementmustbeexecutedusingOLTSorLSPMequipmentwhichwhenproperlyused
providesahigheraccuracylossanalysis.
Theend-usershouldspecifytheteststandardtobechosenfortheopticalfibercertifica-
tiontestprocedure.Ateststandarddefinestheteststobeexecutedandthelimitsor
maximumallowablevaluesforthetests.Aswehavediscussed,whentestingorcertifying
links that must support high-throughput applications (data rates in the Gbps range), the
application standards impose exacting limits for channel length and channel loss. When
youneedtocertifythecablingtosupportsuchapplicationsitisimportantthat(a)you
selectthecorrespondingapplicationstandardintheOLTSsetupand(b)certifythechan-
nelconfiguration.
Certification – Process and equipment requirementsTable 3 illustrates that the channel loss limits for high-throughput network applications
arerelativelysmall.InordertomakethePass/Faildecisionswithconfidence,thetestpro-
ceduremustbeexecutedwithprecisionandwithaccurateOLTSorLSPMequipment.When
the loss limit value is 2.6 dB (10GBASE-S), a measurement error of even 0.25 dB consti-
tutesanerrorapproaching10%ofthelimitvalue.Thissectionwillreviewtheprocedural
stepsandequipmentrequirementstoachieveaccurateandrepeatablemeasurements.
Twoissueshaveproventomakeacriticalcontributiontothetopicofmeasurement
accuracy:
(1)Thereferenceforthelossmeasurement
(2)Thelaunchconditionofthelightsourceintothelink-under-test
18
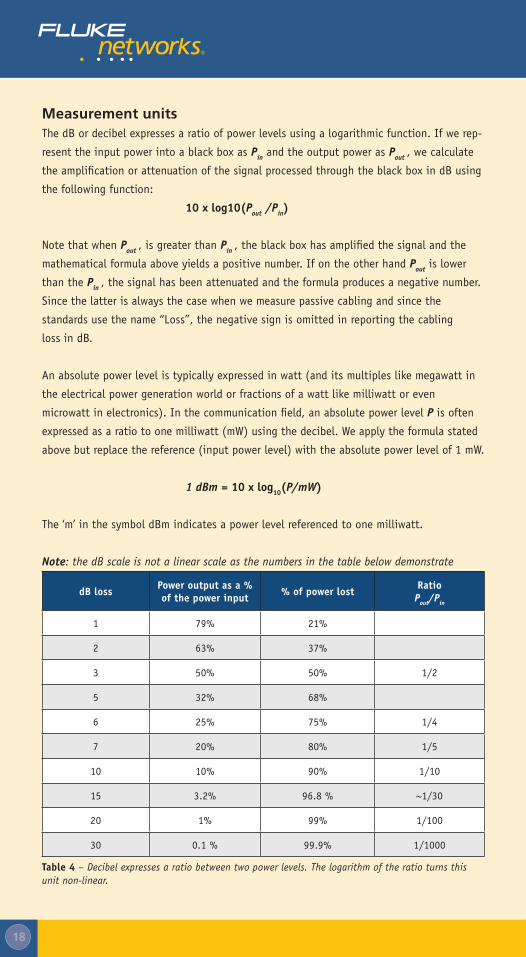
Measurement units ThedBordecibelexpressesaratioofpowerlevelsusingalogarithmicfunction.Ifwerep-
resent the input power into a black box as Pin and the output power as Pout , we calculate
theamplificationorattenuationofthesignalprocessedthroughtheblackboxindBusing
the following function:
10 x log10(Pout /Pin)
Note that when Pout , is greater than Pin ,theblackboxhasamplifiedthesignalandthe
mathematicalformulaaboveyieldsapositivenumber.Ifontheotherhand Pout is lower
than the Pin , the signal has been attenuated and the formula produces a negative number.
Sincethelatterisalwaysthecasewhenwemeasurepassivecablingandsincethe
standards use the name “Loss”, the negative sign is omitted in reporting the cabling
loss in dB.
Anabsolutepowerlevelistypicallyexpressedinwatt(anditsmultipleslikemegawattin
the electrical power generation world or fractions of a watt like milliwatt or even
microwattinelectronics).Inthecommunicationfield,anabsolutepowerlevelP is often
expressedasaratiotoonemilliwatt(mW)usingthedecibel.Weapplytheformulastated
above but replace the reference (input power level) with the absolute power level of 1 mW.
1 dBm = 10 x log10(P/mW)
The‘m’inthesymboldBmindicatesapowerlevelreferencedtoonemilliwatt.
Note: the dB scale is not a linear scale as the numbers in the table below demonstrate
dB loss Power output as a % of the power input % of power lost Ratio
Pout/Pin
1 79% 21%
2 63% 37%
3 50% 50% 1/2
5 32% 68%
6 25% 75% 1/4
7 20% 80% 1/5
10 10% 90% 1/10
15 3.2% 96.8% ~1/30
20 1% 99% 1/100
30 0.1% 99.9% 1/1000
Table 4 – Decibel expresses a ratio between two power levels. The logarithm of the ratio turns this unit non-linear.
19
N E T W O R K S U P E R V I S I O N
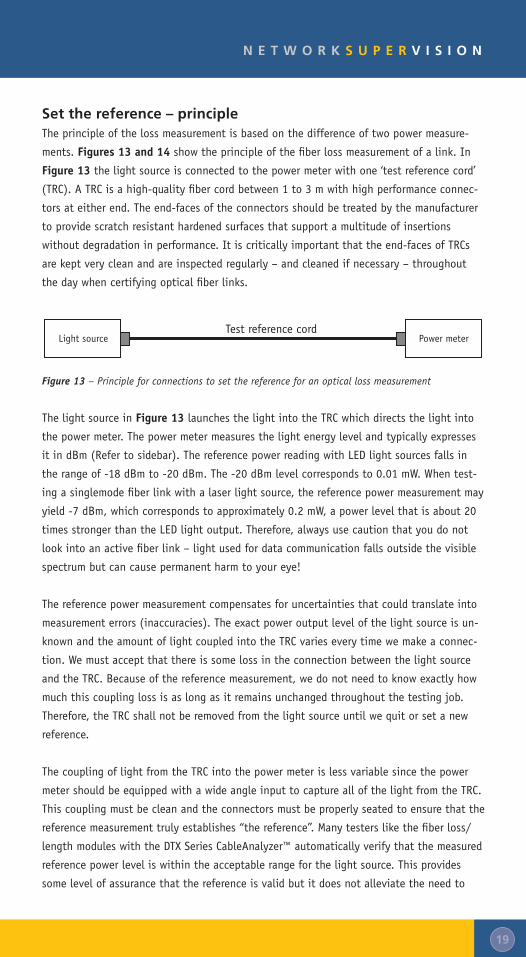
Set the reference – principleTheprincipleofthelossmeasurementisbasedonthedifferenceoftwopowermeasure-
ments. Figures 13 and 14showtheprincipleofthefiberlossmeasurementofalink.In
Figure 13 the light source is connected to the power meter with one ‘test reference cord’
(TRC).ATRCisahigh-qualityfibercordbetween1to3mwithhighperformanceconnec-
torsateitherend.Theend-facesoftheconnectorsshouldbetreatedbythemanufacturer
to provide scratch resistant hardened surfaces that support a multitude of insertions
withoutdegradationinperformance.Itiscriticallyimportantthattheend-facesofTRCs
arekeptverycleanandareinspectedregularly–andcleanedifnecessary–throughout
thedaywhencertifyingopticalfiberlinks.
Figure 13 – Principle for connections to set the reference for an optical loss measurement
ThelightsourceinFigure 13launchesthelightintotheTRCwhichdirectsthelightinto
thepowermeter.Thepowermetermeasuresthelightenergylevelandtypicallyexpresses
itindBm(Refertosidebar).ThereferencepowerreadingwithLEDlightsourcesfallsin
therangeof-18dBmto-20dBm.The-20dBmlevelcorrespondsto0.01mW.Whentest-
ingasinglemodefiberlinkwithalaserlightsource,thereferencepowermeasurementmay
yield-7dBm,whichcorrespondstoapproximately0.2mW,apowerlevelthatisabout20
timesstrongerthantheLEDlightoutput.Therefore,alwaysusecautionthatyoudonot
lookintoanactivefiberlink–lightusedfordatacommunicationfallsoutsidethevisible
spectrumbutcancausepermanentharmtoyoureye!
Thereferencepowermeasurementcompensatesforuncertaintiesthatcouldtranslateinto
measurementerrors(inaccuracies).Theexactpoweroutputlevelofthelightsourceisun-
knownandtheamountoflightcoupledintotheTRCvarieseverytimewemakeaconnec-
tion. We must accept that there is some loss in the connection between the light source
andtheTRC.Becauseofthereferencemeasurement,wedonotneedtoknowexactlyhow
much this coupling loss is as long as it remains unchanged throughout the testing job.
Therefore,theTRCshallnotberemovedfromthelightsourceuntilwequitorsetanew
reference.
ThecouplingoflightfromtheTRCintothepowermeterislessvariablesincethepower
metershouldbeequippedwithawideangleinputtocaptureallofthelightfromtheTRC.
Thiscouplingmustbecleanandtheconnectorsmustbeproperlyseatedtoensurethatthe
referencemeasurementtrulyestablishes“thereference”.Manytesterslikethefiberloss/
lengthmoduleswiththeDTXSeriesCableAnalyzer™automaticallyverifythatthemeasured
referencepowerleveliswithintheacceptablerangeforthelightsource.Thisprovides
some level of assurance that the reference is valid but it does not alleviate the need to
Test reference cordLight source Power meter

20
makesureyouusehigh-qualityTRCsthathavebeeninspectedtobeclean.
After we have established this reference power level, we move to the measurement
connections as shown in Figure 14 with the following actions:
(1) First,doNOTtamperwiththeconnectionbetweenthelightsourceandtheTRCinany
way.
(2) ConnectthelightsourceandTRCatoneendofthelink-under-test(connectorC1).
(3) ConnectasecondTRC(“AddedTRC”)betweentheotherendofthelink-under-test
(C2)andthepowermeter.ThissecondTRCshouldexhibitthesamequalityasthefirst
one (used to set the reference). It too must be inspected to ensure that both end
connections are clean.
(4) Make a power measurement while the light source transmits the light through the
link-under-test to the power meter.
(5) Thepowermetermeasuresthelightenergythroughthelink-under-testandproduces
a result in dBm.
Assume that the power measurement through the link under test is -23.4 dBm and the
referencepowerlevelis-20dBm.Bysubtractingthesetwomeasurementreadings,wefind
the loss caused in the link-under-test. In this example, the loss is -20 –(-23.4) or 3.4 dB.
Note that a loss is expressed in dB (in contrast with absolute power measurements
expressedindBm).AnOLTSautomaticallycalculatesthedifferenceinpowerlevels(the
loss of the link-under-test) in dB and compares the result to the limit for the link-under-
test.Ifthemeasuredlossislessthanorequaltothelimit,thetestpasses.
Figure 14 – Connection of ‘Light Source’ and ‘Power Meter’ for an optical loss measurement
Different methods to set the referenceTheimplementationofthelossmeasurementprincipleshowninFigures 13 and 14 is the
‘one-jumper’method.OnejumperoroneTRCisusedtosetthereference.Thismethodis
preferredforthelosstestofallpremiseswiringcabling.Thesecablingsystemsare
characterizedbyrelativelyshortfiberlengthsbutmaycontainseveralconnections.Asthe
example loss calculation in Table 2 demonstrates, the maximum loss allowed in a short
300mlinkbythetwoconnectorsis1.5dBoutofthetotalbudgetof2.55dB;the
connectinghardwarelossconstitutes59%.Thisunderscorestheneedtomakesure
thatallconnectionlossesmustbeproperlyincludedinthelossmeasurement.
Added‘TRC’
Testreferencecord
C1
Light sourceLink segment under test
Power meter
C2

21
N E T W O R K S U P E R V I S I O N
WhenweanalyzethereferencemethodshowninFigure 13,theTRCdoesnotintroduce
aconnectionbetweenthelightsourceandpowermeter.TheTRCconnectstoeachdevice
butdoesnotaddanyconnections.Followthelightpathbetweenlightsourceandpower
meter in Figure 14 to realize that the loss in connection C1, the loss in the link-under-
testandthelossinconnectionC2arefullyaccountedforinthemeasurement.Theloss
measurementalsoincludesthelossofthe“AddedTRC.”Themaximumlossrepresentedin
a2mTRCis0.007dB(Table 1showsthatthemaximumlossforthefibertypesusedin
premises wiring is 3.5 dB/km or 0.0035 dB/m). Another difference between the refer-
ence measurement and the link loss measurement is a new connection between the ‘Added
TRC’andthepowermeter.Thisdifferenceisalsoverysmall(assumingtheend-facesof
the‘AddedTRC’areindeedclean)sincethemeterisequippedwithawide-anglelensto
captureallthelighttransmittedbythelink-under-test.Wejudgethemeasurementerror
duetothe‘AddedTRC’tobelessthan0.01dBwhichalsohappenstobetheresolutionof
a power meter.
Theone-jumpermethodcanonlybeappliediftheconnectorinthepowermeterandthe
end-connectorsofthelink-under-testarethesametype(forexample,SCconnectors).
Aftersettingthereference,wedisconnecttheTRCfromthepowermeterandareonlyable
toconnectthisTRCtothelink-under-testiftheend-connectorofthelink(C1inFigure
14)properlymateswiththisTRC.
Tobeabletousethepreferredone-jumpermethodwithdifferentconnectortypes,many
ofFlukeNetworks’powermeters,toincludetheSimpliFiberPro,areequippedwitha
removableadapter.AsetofhybridTRCsassurespropermeasurementconnectionswhile
takingfulladvantageoftheaccuracyoftheone-jumpermethod.
TheapplicablestandardslistedinTable 5 make provisions for three different methods to
setthereferenceforanopticalfiberlosstest.Thenamesofthesemethodsinthedifferent
standards documents can be confusing. We will use the following names in this document:
one-jumpermethod,thetwo-jumpermethodandthethree-jumpermethod.Thetwo-
jumper method and the three-jumper method are discussed in Appendix 3.
Name in this document
IEC14763-3
IEC 61280-4-1
(multimode)
IEC 61280-4-2
(singlemode)
TIA-526-14A (multimode)
TIA-526-7 (singlemode)
One-jumper One-jumper Method 2 Method A1 Method B Method A.1
Two-jumper – Method 1 Method A2 Method A Method A.2
Three-jumper Three-jumper Method 3 Method A3 Method C Method A.3
Table 5 – Reference to test method names in the installation standards

22
Launch conditionsThegoalofanycertificationmeasurementistoprovidePass/Failindicationstheend-user
andtheinstallationcontractorcanrelyon.The‘launchconditions’haveproventohavea
majorinfluenceontheaccuracy,consistencyofopticalfiberlossmeasurements.
Wereviewedthatthelightingraded-indexmultimodefiberpropagatesinmanymodes.The
numberofmodesthatareexcitedbythelaunchandtheenergylevelineachmodeaffects
the power measurements. If the launch conditions are not controlled from test tool to test
tool,eachtoolmayprovideadifferentmeasurementandtestresults;thisisacertain
indicationthatnoneofthemarecorrectortrustworthy.
Thegoalistocontrolthelaunchconditionssuchthatcomplianttesttoolsproduceresults
that fall within a narrow range around the true loss value.
Factors that influence the launch conditions.LEDsarethepreferredlightsourcestotest
thelinklossformultimodefiberlinks.WediscussedhowVCSELshavebecomethelight
sourceofchoiceforallhigher-throughputnetworkapplicationsusingmultimodefiber
becauseVCSELsmeetthemodulationcapabilitytoprovideshortpulsesinrapidsuccession
to support the data rate for the 1 and 10 Gbps applications. But VCSELs are not well suited
forlosstestingbecauseeachVCSELmayexciteadifferentsetofmodeswithvarying
energylevelsinthesemodes.Furthermore,losstestingisperformedwithaconstantlight
wave rather than a modulated signal.
LEDsproduceaconeoflightthatisevenlyspreadovertheend-faceofthefiber,even
beyondthecore.LEDscreatean“overfilledlaunch”condition.Thedegreeofoverfill,how-
ever,producessignificantvariationsinthelossmeasurement.Alaserlightsourceinclud-
ingaVCSELcreatesan“underfilledlaunch”condition.Thesesourcesshineanarrowcone
oflightinthecenterofthecore.Anunderfilledlaunchconditionmaynotproperlydetect
problemsinthefiberlinkandmayconsequentlyprovideamoreoptimistictestresult.
Figure 15 – Testing the two connections shown with underfilled launch conditions may not detect the misalignment problem in the optical cable
Connection (a) – Properly aligned
Connection (b) – Improperly aligned

23
N E T W O R K S U P E R V I S I O N
ThemisalignedconnectioninFigure 15 (b) provides an example in which the loss mea-
surementwithanunderfilledlaunchcannotdetectthefullimpactofthemisalignment.It
reportsalowerlossvalue(optimisticlossvalue)thanatestexecutedwithanoverfilled
light source.
Controlling launch conditions.Overtheyears,bettermethodshavebeendevisedto
controltheseoverfilledlaunchconditionintoanarrowrangewiththegoaltoproducere-
peatableandaccuratelosstestresults.Thestandardsestablishedtwoindependentmetrics
tocharacterizeandcontrolthelaunchconditions.TheyaretheModalPowerDistribution
and the Coupled Power Ratio.
The Modal Power Distribution measures the relative power level in the different modes
transferredbetweenthelightsourceandtheTRC.Thismetricmustbesatisfiedbythe
designoftheequipmentsuchastheselectionoftheLEDdiodeandthecouplinginside
thelightsourceinstrumentbetweentheLEDandtheinternalfiberconnection.(Allfiber
optictestmodulesdesignedandmanufacturedbyFlukeNetworksafter2002satisfythe
MPDrequirements.)
Coupled Power Ratio(CPR)isameasureoftheamountofmodalfillinginamultimode
fiber(testreferencecord).Itbecamepopularbecauseitcouldbemeasuredinthefield.
BoththelightsourceandtheTRCcanberatedwithaCPRindex.ACPRvalueismeasured
asthelossbetweenamultimodeTRCcoupledintoasinglemodeTRC.Whenthelightin
themultimodefibercontainssignificantenergyinthehighordermodes,thelossinthis
couplingwillbegreaterthanwhenthemultimodefibercarrieslessenergyinthehigher
ordermodes.Thevalueofthislossmeasurementdefinesthedesiredoverfilledcondition
whenanMPDcompliantlightsourceisused.ThestandardsspecifyCPRlossvalues;aCPR
indexof1isthedesiredandrecommendedratingforthecertificationmeasurementsof
multimodeopticalfiberlinks.
Mandrel.SincetestequipmentwithanMPDcompliantlightsourceincombinationwith
TRCswithCPRrating1maydelivervaryinglosstestresults,furtherstepshavebeen
designedtolimitthisvariabilityinresults.Theuseofamandrelfortestingmultimode
opticalfiberlinksisrequiredinordertoobtainmoreaccuratelossmeasurements.The
propermandrellimitsmeasurementuncertaintiesandenhancestheaccuracyoftheloss
measurement.
Amandrelisasmallcylinderwithaspecifieddiameterthatdependsonthecoresizeand
theconstructionoftheTRCfiber.Table 4showsthemandrelsizesdefinedintheANSI/
TIA-568-C.0documentforseveralfiberconstructions.

24
Fiber core/clad-ding size (μm)
900 um buff-ered fiber (mm)
2.0 mm jacketed TRC (mm)
2.4 mm jacketed TRC (mm)
3.0 mm jacketed TRC (mm)
50/125 25 23 23 22
62.5/125 20 18 18 17
Table 6 – Acceptable mandrel diameters for multimode cable types (five wraps)
ThemultimodeTRCistobewrappedfivetimesaroundthiscylindertoachievethedesired
effectoffilteringorstrippingthehigherundesirablemodesfromthelaunchcondition.
Recall that the higher order modes – modes traveling through the outer range of the core
–refractoutofthecorewhenthefiberisbent.
Thefivewell-definedwrapscontrolthemodesthatwillenterthelink-under-testto
measuretheloss.TheTRCconnectedtothelightsourcemustbeattachedtothe
mandrel as shown in Figure 16 and remain attached for all testing.
Figure 16 – How to wrap the optical fiber test reference cord correctly around a mandrel
Themandrelalsoimprovestheaccuracyofthemeasurementsbyestablishingarealistic
test reference value. When we examine the setup in Figure 13,theoverfilledlaunchcondi-
tionexcitesthehighestordermodesintheTRCandmayalsolaunchsomelightintothe
claddingoftheTRC.Thehigherordermodesinthecoreandthelightinthecladdingwill
nottravelveryfarbutmaytraveltheshortdistanceoftheTRCiftheTRCisnotsubjected
toanybends.Thewide-angleinputtothepowermetercapturesthelightenergyinthe
cladding.Thislightwillhowevernot“survive”inthelink-under-test(unlessitwouldbea
veryshortandstraightfiberrun).Withoutamandrel,thepowermetermeasureslightener-
gyduringthereferencesettingthatwillnottravelthroughthelink-under-test.Thepower
level established during the reference test is higher than it should be which will overstate
the loss. In the example discussed above, we assumed that the power meter measured
-20 dBm for the reference setting. When we do not use a mandrel wrap, the power level
mayactuallybeashighas-18dBmwiththesamepowersource.Thelosscalculationnow
yields[-18-(-23.4)]dBor5.4dBratherthan3.4dB.Inessence,weoverstatedtheloss
by2dB.Thisahugeerrorsincethehighestordermodesandthelightenteringthe
claddingcannottravelveryfarinthelink-under-test.
Wrap 5 timesin grooves
Place top wrap in groove underretainer
Right:no bendsat retainer Wrong:
bends atretainer

25
N E T W O R K S U P E R V I S I O N
Future launch condition control method
Atthetimeofthiswriting,standardscommitteesaredefiningamethodthatimproves
onthelaunchconditionstodaycontrolledbyMPD,CPRandmandrelwraps.Theproposed
methodisbasedontheconceptof‘EncircledFlux’(EF),whichfinetunesandcontrolsthe
modeslaunchedinthelink-under-test.Thismethodiscurrentlystillunderstudywiththe
ultimategoaltofurtherimprovetheaccuracyandconsistencyofpowermeasurementsand
loss tests in multimode links.
4. Fiber Verification TestingFiberverificationtesting(includingend-faceinspectionandcleaning)shouldbepracticed
continuallyasstandardoperatingprocedure.Throughoutthecableinstallationprocessand
priortocertification,lossofcablingsegmentsshouldbemeasuredtoensurethequalityof
theinstallationworkmanship.ThistypeofatestisnormallyaccomplishedwithanLSPM
testset.Fiberverificationtesttoolsaretypicallylessexpensivetools;theycanalsoef-
fectivelybeusedtotroubleshoottroublesomelinks.Aquickinspectionoftheend-to-end
linklossmayprovidetheindicationwhetherornottheopticalfibercableissuspector
whether other network functions are the cause of the detected malfunction.
AnLSPMdeterminesthetotallightlossalongafiberlinkbyusingaknownlightsource
atoneendofthefiberandapowermeterattheother.Butbeforethetestcanbedone,
as described earlier, a reference power level from the source is measured and recorded to
set a baseline for the power loss calculation. After this reference is established, the meter
andsourcearepluggedintotheoppositesidesofthefiberlinktobetested.Thesource
emits a continuous wave at the selected wavelength. On the distant end, the power meter
measures the level of optical power it is receiving and compares it to the reference power
level to calculate the total amount of light loss (Figure 17). If this total loss is within
thespecifiedparametersforthelink-under-test,thetestpasses.
A loss budget should be well established and used as a benchmark during cabling installa-
tion.Ifthistypeofverificationtestingisperformedduringinstallation,itcanbeexpected
thatyieldwillincreaseandcertificationtestingwillgosmoother.
LSPMtestsetshavehistoricallybeenmoredifficulttouse,requiringmanualcalculations
andsubjectiveinterpretationbyanexperiencedtechnician.However,newerinstruments
haveeliminatedtime-consuminglosscalculationsbyautomatingtheprocessofcomparing
power measurements versus set references.
Figure 17 – Conducting an LSPM test
Fiber under test
*Mandrel used only for850/1300 nm testing

26
Whileconvenient,basicverificationofend-to-endlossusinganLSPMsetdoesnotspecify
wherethetroubleareasare,makingfailuresdifficulttolocate.Evenininstanceswhere
thelossiswithinaspecifiedthreshold,theLSPMsetdoesnotprovideanywarningor
indicationofwhereadefectorproblemmaybelocated.Inotherwords,althoughan
entirelinkmaypass,itispossiblethatindividualsplicesorconnectionswithinitmayfail
industryspecifications,creatingapotentialprobleminthefutureduringadds,moves,or
changeswheremultipledirtyconnectorscanpotentiallybegroupedtogethertoresultin
afailure.AnOTDRisthepropertesttooltopinpointlocations(connections)displayinga
highlossorreflectance.
5. How to Certify Fiber Optic Cabling with OLTS and LSPM
IndustrystandardsrequiretestingwithanLSPMorOLTStocertifythatthelossofeach
linkmeetsperformancestandards.Asmentionedpreviously,thisisreferredtoas‘basic’or
Tier1Certification.
It is a double-ended test which produces an absolute loss measurement which is then
compared with installation cabling standards and/or channel application standards. Fluke
Networks’DTXCableAnalyzerandOptiFiberOTDRcanbeequippedwithoptionalmultimode
orsinglemodefibertestmodulesthatautomatemostofthetestandmake‘basic’orTier1
certificationveryeasy.
NotethatanOTDRalsoprovidesalossresultsforthetotallinkbutthismeasurementis
basedonthereflectedlightenergy.Thestandardsdemandthatthebasiccertificationbe
executedwithanOLTSorLSPM.Theselinklossresultsprovidedbyusingalightsourceon
oneendandalightmeterattheoppositeendaremoreaccurateifproperlyexecuted.
Thefollowingstepsshouldbefollowedtoperformabasiclosslengthcertificationtest.Establish Pass/Fail test limits•
Choose a test method and set a reference•
Run the test and save results•
ExporttoLinkWaretomanageandarchivethetestresults;LinkWareisFlukeNetworks’•popularandwidely-usedfreedatamanagementsoftwarethatletsyoucreateprintedorelectronics reports.
1. Establish Pass/Fail limitsinaccordancetowhatyourcertificationgoalsare.Inthis
example, we will establish limits for the total allowable loss based on an application
standardusingtheFlukeNetworksDTXSeriestesterequippedwiththeDTX-MFM2fiber
losstestmodules(formultimode).Ifyouneedtocertifysinglemodefiberusethe
DTX-SFM2modules.
a. Oncethetesteristurnedon,turntherotaryswitchto‘Setup’andselect‘Instrument
Settings’ to input the operator name, job name etc.

27
N E T W O R K S U P E R V I S I O N
b. Select ‘Fiber Loss’ from the Setup screen as
shown in Figure 18a. Under this setup screen,
youwillchoosefromamenuofstandardsto
selectthecorrectlimits.Selectthe‘Testlimit’
option as shown in Fig 18b. Note that the
selectedfibertypelimitsthetestlimitchoices.
Popularfibertypesarealsoincludedinthe
instrument menu.
As Figure 18b shows, the same setup screen
allowsyoutoselectthe‘RemoteEndSetup’.When
usingtheDTXSmartRemoteequippedwiththe
fibertestmodule,select‘SmartRemote’aswe
have done in this example. In this mode, the
testerautomaticallymeasuresthelengthofthe
link-under-test.
Lastly,thisscreenprovidestheoptiontotellthe
testerwhetheryouneedtotestthelink-under-
test in both directions. If this is the case, remem-
bernevertodisconnecttheTRCfromthetest
modules;alwaysswaptheTRCattheconnection
with the link-under-test.
2. Choose a reference method and set a
reference. As described earlier, setting a
reference is a critical aspect of a loss test to
obtainaccuratetestresults.Thepowermeter
and light source are connected together and the
powerlevelismeasuredbythelightmeterto
establish the ‘reference’ for loss calculations.
Thestepsforsettingareferenceareasfollows:
StepA. Turntherotaryswitchto‘Special
Functions’ and choose ‘Set Reference’
StepB. Nowpress‘Enter’andconnecttheTRCs
between main and remote as shown on
the screen and press test to make the
reference measurement.
Figure 18a
Figure 18b
Figure 18c

28
Theearlierdiscussiononsettingthereference
showed the preferred one-jumper method Figure
13 and Figure 14 which is called ‘Method B’ in
thetestinstrument.NotethatwiththeDTXSeries
in Smart Remote setup, we are going to test the
twofibersthatmakeupthetransmissionlinkin
onetest.Eachfibertestmoduleisequippedwith
a light source and light meter. In the setup, we
willusetwoduplexTRCs.Onefiberwillconnect
the Output (light source) at the main unit to
theInput(lightmeter)attheremoteunit.The
second connects the Output at the remote unit to
the input at the main unit.
SpecialNote:TheDTXTRCsusethefollowing
conventioninordertoquicklymakeconnectionsandverifythepolarityofthelink-un-
der-test:Thelightentersthecordattheredboot;thelightleavestheTRCattheblack
boot.So,oneendofaTRChasaredbootandattheotherendofthatsamecordisa
blackboot.Thelighttravelsfromredtoblack.TheDTXscreendisplayshowstheboot
color (Figure 18d).
Figure 18eshowsaschematicrepresentationofthisreferencesetup.Thisfigureuses
adifferentcolorforthetwoduplexcords.Thesecolorsdonotrelatetotherealcords
butwerechosentoaddclaritytothefigure.TheyellowcordconnectstheOutput(light
source)ofthemainunit’sfibermoduletotheInput(lightmeter)oftheremoteunit.
Oneoftheyellowcordsisnotconnectedinthereferencesetting.Oneofthedarker
colored cords makes the connection in the opposite direction. Figure 18e also shows
the location of the mandrel near the end with the red boot that is to be connected to
thelightsource.Theduplexcordshaveonelongerlegwiththeredboot.Afterthisleg
has been wrapped around the mandrel, the lengths of both cords in the duplex arrange-
mentareequal.
TheDTXfibermodules’OutputportsarealwaysSCconnectors.Theremovableadapters
fortheInputportsarechosentomatchtheendconnectorsofthelink-under-test.The
example in Figure 18edepictstheexampleinwhichthelink-under-testisequipped
with LC connectors.
Figure 18d

29
N E T W O R K S U P E R V I S I O N
Figure 18e – Schematic representation of setting the reference with duplex TRCs for a link-under-test ending with LC connectors. The ring near the red boot indicates the location of the mandrel (for multimode fiber).
Step C. After the tester measures the reference
powerlevel,itdisplaysthesevaluesas
shown in Figure 18f.Ifyourreference
values are acceptable, press the F2 soft-
keytostorethesevaluesandtoproceed
withlinkcertification.
i. Acceptable reference with
DTX-MFMorDTX-MFM2
1. -20dBm nominal level with
LED62.5μm
2. -22 dBm nominal level with
LED50μm
ii. Acceptable reference with
DTX-GFM,DTX-SFM,DTX-
GFM2orDTX-SFM2
1. -7dBm nominal level
with VCSEL or laser
StepD.NowdisconnectyourTRCsat the Input
ports only and create the connection that
is shown on the screen (Figure 18g).
Disconnecttheblackbootsfromtheinput
ports and connect the unused ends with
the black boots in the duplex cord set to
the adapter on the input port of the unit
to which the duplex mate has been con-
nected.Nowyouhaveseparatedthemain
andremoteunitssothatyoucanconnect
aunitateachendoftheopticalfiberlink
to be tested.Figure 18g
Figure 18f
Main to Remote
Main Unit
Out In Out In
Remote UnitLC Adapters
Remote to Main
LC
LC
LC
LC
LC
SC SC

30
IfyouneedtotestalinkforwhichFlukeNetworksdoesnotorcannotofferadapters
suchasMT-RJconnectors,consultAppendix 3 to review alternate methods the set the
reference.
Guidelines for setting a reference
• Usehigh-qualityTRCs
• CleanTRCendsbeforeyousetthereference
• Letthetesterwarmuptoasteady-stateinternaltemperature
(about 10 min. with ambient temp and storage temp difference of <20°F)
• Usepreferredone-jumperreferencemethod
• PlugtheSCadapterwithredbootplugsintothetransmitter(OUTconnection)
• Donotunplugredboot(onsource)aftersettingthereference
• AfterthereferenceissetdoNOTdisconnectTRCfromlightsource
• Foramultimodeopticallink,usethepropermandrel
• Referencemustbere-setaftereachtimetheunitsarepowereddown
• Ensuretomaintainpreciselaunchconditionsofthereference
3. Run an autotest
Select“Autotest”.TheteststandardyouselectedforanAutotestdeterminesthetest
parameters to be measured and the Pass/Fail criteria for each test
Polarity.WhenyourunasuccessfulAutotestusingtheDTXFiberModules,youwillbe
abletoensurepolarity.ConnecttheblackbootoftheTRCtothefiberinthelink-under-testthatistransmit-•ting the light and needs to connect at this end of the link to the transmitter of the networkdevice.(LightleavestheTRCattheblackboot;theredbootendofthatcordis connected to the Output on the tester)
ConnecttheredbootoftheTRCtothefiberinthelink-under-testthatisreceiving•the light from the other end of the link.
When the connections to the link-under-test are established, the instrument will •chirpa“happytone”toletyouknowwhetherpolarityhasbeenestablished.
Length.Thetestermeasuresthelengthaswellasthelinkloss.Whenyouselectanap-
plication standard during the setup, it includes the maximum length for the application
dependingonthebandwidthratingoffiberusedinthelink-under-test.Table 3 provides
anoverviewofthisdependency.
Makesurethatyouareusingtheappropriatefibertestadapterwithaconnectorthat
matchesthefiberpatchcordorthepatchpanel.
ConnectTRCstothelinkorchanneltobetested:repeattheprocessexplainedin
Figure 18g.

31
N E T W O R K S U P E R V I S I O N
Bidirectional testing.Ifyouwanttotesteachfiberinbothdirections,donotforgetto
select that option in the setup screen (see Figure 18b).Whenthetesterpromptsyou
to make the connection to test in the second direction, remember to switch the
TRCatthelinkend.DONOTremovetheTRCsfromthetesterconnections.
Test Results.Besuretosaveresultsbeforemovingontothenextfiberortestinginthe
other direction. Figure 19showsthedetailedmeasurementsofafiber;notethateach
fiberistestedatbothofthewavelengthsdemandedbytheinstallationstandard.
Applicationsstandards,ontheotherhand,only
specifyperformanceforthewavelengthofthe
applications. For example, the 10GBASE-S standard
specifiesthelinkrequirementsat850nm.The
name“input”fiberor“ouput”fiberinthetest
result screen of the tester refers to the port in the
mainunittowhichthefiberisconnected.The
result shown in Figure 19pertainstothefiberthat
is connected to the input port at the main tester
unit.Thescreentitle“Loss(R->M)”whichmeans
Loss from the Remote unit to the Main unit also
indicatesthefiberforwhichtheresultisdisplayed.
Onceyouhavetestedallthelinksandsavedeach
record, results can be downloaded to a PC and man-
aged with LinkWare Results Management software.
LinkWareallowsyoutomanageandinspectany
storedtestresultonyourPCscreen.YoucanalsoprintaSummaryTestReportforthe
jobaswellasaprofessionalreportforeachlinktested.LinkWareletsyoucreateor
emailedreportsinPDFform.
Figure 19 – Loss test results for the fiber connected to the input port on the main tester unit. The result includes the loss for both multimode wavelengths (installation test standard)

32
6. How to Certify Optical Fiber Cabling with an OTDR
TIATSB140&ISO14763-3recommendOTDRtestingasacomplementarytesttoensure
thatthequalityoffiberinstallationsmeetcomponentspecifications.Thestandardsdonot
designatePass/Faillimitsforthistest.Itisrecommendedthatgenericcablingrequire-
mentsforcomponentsanddesigncriteriaforthespecificjobbeconsidered.AnOTDRcan
beusedbi-directionallyasasingleendedtesterfororwithareceivefiberforcertification
testing.
What you need to know about OTDRs.OTDRswereoncelaboratoryequipmentthatwere
difficulttooperateandimpracticalforfielduse.Theywerebig,heavyandcomplicated
forinexperiencedtechnicianstosetupforatestandoperateaccurately.Onceatestwas
performed,itwasdifficulttounderstandtestresults.Thisledtoastigmaoffearand
confusion.However,manynewOTDRstodaymanynewOTDRsaresmall,light,andeasyto
use.Anordinarytechniciancannowperformtroubleshootinglikeanexpert–butabasic
understandingofhowanOTDRworksisstillhelpful.
Basic operation• .AnOTDRinfersloss,reflectance,andlocationofevents.Itsendspulsesoflightintoafiberandusesasensitivephotodetectortoseethereflectionsandplotthemgraphicallyovertime.Inordertoaccuratelytest,theopticalcharacteris-ticsofthefibermustbedeterminedandsetpriortorunningthetest.
OTDR trace• .TheOTDRplotsthereflectanceandlossovertimeinagraphical“trace”ofthefiber.Experiencedtechnicianscan“readatrace”andexplainit.Forexample,onthebelowtrace,anexperiencedeyecanspotthatonesideofacrossconnectisexhibitingexcessive loss.
Sample OTDR trace with high loss connector at 137m
130 m 7 m 80 m

33
N E T W O R K S U P E R V I S I O N
Event analysis software• .ThelatestOTDRsrunsophisticatedsoftwarethatautomatetraceanalysisandenableautomatictestsetupparameters.FlukeNetworks’OTDRscanautomaticallychoosesetupparameters,notonlytellingyouwhereevents(instancesofreflectanceandloss)areonthetrace,butalsotellingyouwhattheeventsarewhilequalifyingeachofthem.
Dead zone• .ThisistheshortestfiberlengthanOTDRcandetect.Itcanalsobede-scribedasthedistanceafterareflectiveeventafterwhichanotherreflectioncanbedetected.AllOTDRshavedeadzonesandshouldbeusedwithanappropriatelaunchfibersothatyoucanmeasurethefirstconnectiononthelink.
Dynamic range• .Determinesthelengthoffiberthatcanbetested.Thehigherthedynamicrange,thelongerthefiber-under-testcanbe.Thereisadrawback,however,asthedynamicrangeincreases,thewidertheOTDRpulsebecomes–andasaresult,thedeadzone increases.
Ghosts• .Notasscaryastheymightseem,ghostingiscausedbyanechoduetohighlyreflectiveeventsinthelinkundertest.FlukeNetworks’OTDRsidentifyghostsonthetraceandtellyouwherethesourceoftheghostissothatyoucaneliminateit.
Gainers.• AnothermisunderstoodphenomenononanOTDRtraceiscalledagainer.Simplyput,againerisanapparentnegativelossataneventwherethereisachangeintheopticalperformance.Thisisusuallyduetoamismatchbetweentheindexofrefrac-tionoftwosplicedfibersorconnectionofa50μmmultimodefiberintoa62.5μmfiber.Thistypeofeventwilloftenexhibitexcessivelossintheotherdirection.

34
OTDR Certification Set-upSetting up for OTDR Certification Testing
Setup:Turntherotaryswitchto‘Setup’andchoose‘Settings’frommenusinfivesetup
screens.
1.First,selectwhichportyouwanttotestfrom(multimodeorsinglemode),whattest
limityouwanttouse,thefibertype,anddesiredwavelength.
• ItispossibletocreatemultiplesetsofOTDRtestlimitsandselectonefora
particularjob.EachOTDRtestpasses(Figure 21) or fails (Figure 22) based on a
comparison against the selected set of test limits.
2.Onthesecondsetupscreen,youmaythensetlaunchfibercompensation,designate
whichendyouaretestingfrom,andnotatewhatyouwanttocalleachendofthefiber.
Using Launch Fiber Compensation LFC
Launchfibercompensationisusedtosimplifytesting
andremovethelaunchandreceivefibers’lossesand
lengths from measurements.
• Itshowsyouwhereyourlaunch(and/orreceive)
fiberisonthetrace,andeliminatesitfromthe
certificationtestresults.Ifyouareacontractor,
yourcustomerswanttoknowwhereanevent
isintheirfiberplant,notwhereitisonyour
testsetup.Whenyouenable‘LFC’,aconnector
that is 50m from the patch panel will show up
at50m,not150monthetrace.Justturnthe
rotaryswitchto‘Setup’,gotothe2ndtab,and
enable‘LaunchFiberCompensation’.Thenturn
it again to ‘Special Functions’, and choose ‘Set
Launch Fiber Compensation’. Choose ‘Launch’
onlyifyouarejustusingalaunchfiber,or
‘OtherOptions’ifyouarealsousingareceive
fiber.
3.Third,designatethefibercharacteristicsorallow
defaulttotheselectedfiberinthefirststepor
choose‘UserDefined’andselect‘Numerical
Aperture’and‘Back-scattercoefficient’forthe
fiber-under-test.
Figure 21 – “Pass” Screen on the DTX Compact OTDR
Figure 22 – “Fail” Screen on the DTX Compact OTDR

35
N E T W O R K S U P E R V I S I O N
4.Nowchoosefromamenutoset‘DistanceRange’,
‘AveragingTime’.
5.Finally,choosefromthemenutoset‘PulseWidths’
and‘LossThreshold’.
WiththeDTXCompactOTDR,manysettingssuch
as‘DistanceRange’,‘AveragingTime’,‘Pulse
Widths’,and‘LossThreshold’canbeautomatically
set.Justturntherotaryswitchto‘Autotest’,and
whenyoupushthetestbutton,theOTDRwill
choosethemostappropriatesettingforthefiber
thatyouaretesting.
Running an autotest.Nowthatyouareallsetup
fortesting,turnthedialto‘Autotest’,pluginyour
launchfiberandpress‘Test’.Ifitpasses,press’Save’,
namethetest,andtestthenextfiber.Ifyouwantto
seeatracejustpressthef1softkey.Theeventtable
andlimitsarealsoaccessibleviasoftkeysonthe
main screen.
Summary of extended certificationOTDRtracescharacterizetheindividualcompo-•nentsofafiberlink:connectors,splicesandotherlossevents.Extendedcertificationcomparesthedatatospecificationsfortheseeventstodeter-mineiftheyareacceptable
Criticalbecauseitidentifiesfaultsthatmaybe•invisibletobasiccertification
Evidencethateverycomponentinafiberopticcablingsystemwasproperlyinstalled•
Figure 23 – Trace Screenshot on the DTX Compact OTDR
Figure 24 – “Pass” Trace Screenshot on the DTX Compact OTDR

36
Aswiththefirsttieroftesting,resultscanbedownloadedtoaPCandmanagedwith
LinkWareResultsManagementSoftware.ItiseasytomergeOTDRtestresultswiththe
otherrecordsifthesamenamingsequenceisused.TheFiberInspectoroptionforOptiFiber
also allows end-face images to be merged into the same records to prove cleanliness and
combined to generate professional reports that combine all the test data into one docu-
ment.ThesecanbeeasilycreatedandprintedoutoremailedinPDFform.
Cable certification test strategyThereareseveralpossiblewaystoperformacompletecertificationtestoffiberoptic
cabling.Thestandardsareclearaboutdefiningrequiredandoptionaltests,testlimitsand
testequipmentthatmaybeused.Buttheydonotsuggesthowthetestingshouldbeper-
formedforoptimumefficiencyinthefield.Basedondecadesofworkingwithcontractors,
installers, technicians, Fluke Networks has developed proven, best-practice procedures to
performacompletefibercertificationinthemostefficientway.
Make sure that design criteria and test limits are established before installation•
Confirmproperfiberstrandpolarity,•end-faceconditions,andverifylosswithsimpleverificationtoolsduringinstallation
Perform extended tests using the tier •2certificationtests(OTDRanalysis)asthefirstcertificationstep.Doingso:
- Ensures connector performance
meets generic cabling standards or
systemdesigner’srequirements
- Qualifiesworkmanshipforcabling
installation
- Identifiesproblemsforimmediate
troubleshootingwithOTDR
Secondly,performbasictier1testfor•the channel against the application
standard. Certifieschannellengthand
loss and calculates margin based on
the standard
Ifbidirectionaltestingisnotrequired,measurechannellossatthewavelengthofthe•application
Figure 25 – Sample LinkWare Results Management Software printout

37
N E T W O R K S U P E R V I S I O N
7. Common FaultsInsufficientpowerorsignaldisturbancesresult-
ing from common faults cause failures in optical
transmission.
Fiber optic connections involve the transmis-
sionoflightfromonefibercoreintoanother.
Fiber cores are smaller than the diameter of a
humanhair.Tominimizelossofsignalpower,
thisrequiresgoodmatingoftwofiberend-
faces.
Contaminated fiber connections• .Leadingcauseoffiberfailuresresultsfrompoorconnectorhygiene.Dust,fingerprints,andotheroilycontaminationcauseexcessivelossand permanent damage to connector end-faces.
Too many connections in a channel• . Simple, but it is important to consider the total allowableloss(perintendedapplicationstandard)andtypicallossforconnectortypeduringthedesignprocess.Eveniftheconnectorsareproperlyterminated,iftherearetoomanyinachannel,thelossmayexceedspecifications.
Misalignment• .Thebestwaytoachievegoodfiberalignmentistofusethetwofiberstogether with a precision splicing machine. But for several practical reasons, connection offibersisoftendonemechanicallywithfiberopticconnectors.Therearemanycom-merciallyavailableconnectortypesthatallhavetheiradvantagesanddisadvantages.Typicallossspecificationsareagoodproxyforhowgoodtheyareabletoalignfibers.AnysuchspecificationsusedfordatacommunicationsshouldbecompliantwithFOCISstandards.
- Poor quality connectors or faulty termination.Goodqualityconnectorshavevery
tight tolerances in order to maintain precise alignment
- End-face geometry.Performanceoffiberopticconnectorsislargelyafunctionofthe
geometryoftheend-face.Thisgeometrycanbemeasuredinalaboratorywithpreci-
sioninterferometryequipment.Inthefield,thefollowingparametersareinferredin
lossandreflectancemeasurementsRoughness• .Scratches,pitsandchipsproduceexcesslossandreflectance
Radius of curvature• .Theconvexsurfaceoftheconnectorshouldnicelymateupwithanother connector
Apex offset.• Thecoreofthefibershouldbecenterednearthehighestpointoftheconnector.
Fiber height• .Aprotruding(underpolished)fiberdoesnotmatewellandanundercut(overpolished)connectorwillperformpoorlyduetothepresenceofanairgap
- Unseated connectors.Aconnectormaybepluggedintoanadapterbulkheadbut
maynotbeseatedandconnectedwithitsmate.Wornordamagedlatchingmecha-
nisms on connectors or adapters are sometimes the culprit
- Poor cable management.Strainonaconnectormaycausemisalignmentdueto
becomingpartiallyretracted,broken,orunplugged
Figure 26 – Example of a common cause of a fiber failure

38
Polarity• .Perhapsthesimplestfibercablingfaultisareversaloftransmitandreceivefibers.Thisisusuallyeasytodetectandrepair.Butsometimesconnectorsareduplexedtogetherandmustbebrokenaparttobereversed.Standardsdesignatepolaritywithalabeling convention that is seldom taken advantage of, resulting in confusion.
- PolarityshouldbedesignatedwithAandBlabelsorcoloredboots
- AisfortransmitandBisforreceive;OR,redisfortransmitandblackisforreceive
Poorcablemanagement,systemdesign,ordamagedcablealsocausesfaultsinfibercabling
systems.Fiberhasaveryhightensilestrength,butissusceptibletocrushingandbreaking
if abused. Bends• .Macroandmicrobendingcausedbytightcabletiesorbendradiusviolationsresult in excessive and unexpected loss
Breaks• . Light will no longer propagate past a location where the glass is crushed or crackedinanopticalfiber.
Intersymbol interference (ISI)• .DisturbedSignalisafaultthatisusuallytheresultofpoorsystemdesign.Asystemthatisnotcertifiedwiththeapplicationstandardinmindis susceptible to ISI
- Modaldispersionfromviolationofdistancelimitationsonmultimodefibers
- Reflectionsfromtoomanyhighlyreflectiveconnectorscausingincreasedbiterrors
due to excessive return loss
Troubleshooting basicsKeep it clean• .Dirtyconnectionsaretheworstcauseoffailingconnectionsandtestingchallenges.Cleanfiberseachtimetheyareconnected.YoucanverifythatfibersarecleanbyusinganinstrumentsuchasaFiberInspectormicroscopetoexaminefiberendfaces.
- Dustblockslighttransmission
- Finger oil reduces light transmission
- Dirtonfiberconnectorsspreadstootherconnections
- Contaminatedend-facesmaketestingdifficult
- Remembertoinspectequipmentports,astheseequipmentports(routers,switches,
NICs)getdirtytooUse the correct test setup• .Teststandardperspecificationswillensurethatyougetthemost accurate, consistent, understandable and repeatable results
Userecommendedfibermandrelstoimprovelossmeasurementaccuracyand •repeatability.
HighqualityTRCsandlaunchfibersshouldalwaysbeused;Useofrandom, •questionablequalitytestcordsshouldalwaysbeavoided.
- AllTRCsforlosstestingshouldcomewithgoodtestresultdata
- Testcordsshouldmakepolarityeasyforyou–FlukeNetworks’cordsfeatureredboots
on the end at which light enters and black boots on the end at which light exits
- CordsshouldbekeptcleanandreplacedwhentheyshowsignsofwearChoose test limits that are appropriate to both generic cabling standards and application •standards

39
N E T W O R K S U P E R V I S I O N
8. How to Troubleshoot Common Faults with an OTDR
OTDRsarethemostpowerfultroubleshootingtoolforfiberopticcabling.Smartuseofan
OTDRcaneliminatetimeconsumingtrialanderrortroubleshooting.
Benefits of troubleshooting with an OTDR include:Single ended testing• .noneedplacetestequipmentatbothendsofafiberopticlink,makingiteasierforonetechniciantoefficientlytroubleshoot
Precise location of faults• .OTDRscanseethelocationofbreaks,tootightbends,dirtyconnectors
Qualification of known events such connectors and splices with their locations• infertheirassociatedlossandreflectance
Finding faults with an OTDR
1.Makesurethatopto-electronicsarenotliveonfiberlinks
2.TurntheOTDRonandplugagoodquality,cleanlaunchfiber(atleast100m)
intoOTDRport
3.Plugthelaunchfiberintooneendofthechannel(don’tforgettocleantheend-face
before connecting to tester)
Figure 27

40
4.SetuptheOTDRfortesting
a. Choosethefibertypetobetestedand/orcharacteristicsfromsetupmenu
b. Set a pass/fail limit of 0.3 dB for connectors and 0.1dB for splices
c. Choose‘DualWavelengthTesting’fromOTDRsetupmenu
d. Setlaunchfibercompensationtosimplifyyourtestingbysettingtheendofyour
launchfiberasthestartingpoint(zerofeet/meters)onthetrace
e. Check to make sure that pulsewidths, averaging time, distance range are set to
‘Automatic Mode’
f. Setlossthresholdto0.01dBandchoose‘DualWavelengthTesting’
5.Run‘Channelmap’tomakesurethatthelinklookslikewhatyoubelieveyouareplugged
into
Figure 27a
a. Ifyoucannotseepasttheendofyourlaunchfiber,theproblemisthattheconnec-
torisnotfullyseatedinthebackofthepatchpanel
b. Youshouldseeallconnectorsandcablingsegmentsthatyouexpectedtosee.If
not,youhaveabreakoranunpluggedcable
6.AnadvancedfeatureontheOptiFiberOTDRis‘Faultmap’(Figure 27b). ‘Faultmap’ uses
theeventanalyzertodeterminethequalityofeachconnectionwithoutanyusersetup
orprogramming.If‘Faultmap’identifiesaconnectorasquestionable,furtheranalysisis
warranted to ensure acceptable connector performance.

41
N E T W O R K S U P E R V I S I O N
Figure 27b
7.Nowyoushouldchangeto‘Autotest’andshootatrace
i. Ifthedisplaysaysthatyoufailedthetest,lookatthetraceoreventtableto
identifywherethefailingeventistolocateandidentifythefailure.
Figure 27c – Event Table on Fluke Networks’ OptiFiber OTDR
ii.Iftheendofthefiberismuchcloserthatitshouldbe,youhaveabrokenfiberat
that location
iii.Youmayuseavisualfaultlocatororcreateamacrobendwitharealtimetrace
runningtophysicallylocatethebreakorfailingevent

42
iv.Press‘NextTrace’toseethesamefiberatalongerwavelength.Thiswilloften
magnifypoorevents,aslongerwavelengthsaremoresusceptibletocertaintypes
of losses
v. Ifyouhaveconnectorsthatfaillimitsandhavelongsweepingtailingonthe
trace,youprobablyhavedirtyconnectors.YoumayuseaFiberInspectorto
physicallyinspecteachconnector.Makesuretohaveagoodcleaningkit
withyou!
b. Onceyoucleanandrepairanyfaults,retestthelink.
i. Ifitnowpassesyourtestlimits,savetheresultsandexportthemtoLinkWare
forrecordkeeping.IfyouhavetheFiberInspectoroption,youcanalsosaveyour
cleanfiberend-faceimagestothesamereport!
Figure 27d
ii.Ifyouwouldliketodoabeforeandaftercomparison,youcanuse‘TraceOverlay’to
display
Notethatwithsomebasictestingknowledge,efficientfirst-linetroubleshootingcanalso
bedonewithanLSPMkit.Forexample,basicpolarityverificationcanbeconductedusing
theSimpliFiberProFiberTestKit’s‘FindFiber’feature.Thissamecapabilitycanalsogreatly
simplifythenormallytime-consumingandpersonnel-intensiveprojectofcableidentifica-
tionbetweenpatchpanels.UsingFindFiberRemoteIDsources,asingletechniciancan
completeend-to-endtestingbypluggingthemintotheport(s)tobetestedbeforecheck-
ingtheportsonthedistantendwiththeSimpliFiberPropowermetertoreadtheunique
identifyingsignalstransmittedbytheFindFibersources.

43
N E T W O R K S U P E R V I S I O N
Asaninstrumentthattestsfromoneendofafiberplanttotheother,theLSPMcanalso
beusedtonarrowdownanyquestionableconnections.Byleavingalightsourceatone
end,atechniciancansystematicallydisassemblealinkbydisconnectingeachcomponent
attheconnectorstoinspectandcleanthefiberend-facebeforetestingtheplantup
untilthatpoint.Ifthelossmeasurementiswithinexpectations,youcanreconnect(after
inspecting and cleaning the end-face of the link to be mated, of course) and repeat at the
nextconnectiondownthelineuntiltheproblempointisidentifiedandcorrected.
DetectingintermittentpowerfluctuationsisalsoacommonissuewhereanLSPMcan
troubleshoot.Whetheritisafaultyswitchorashoddyconnectionintothebackendofa
connector,powerfluctuationsareproblematicbutdifficulttodetectandcapturebecause
theyaresofleeting.However,the‘Min/Max’featureontheSimpliFiberPropowermeter
helpsyoutoensurethattransmissionisstableoveralinkbyautomatingtheprecision
trackingofitspowerlevel.Byprovidingtheupperandlowerboundsofawavelength
measurementthroughoutthedurationofatestingsession,youattainbettervisibilityinto
whereanytroublepointsmaybe.

44
9. End-Face Inspection and CleaningInspectionProperinspectionhelpsindetectingtwoofthemostcommon(yeteasiesttoprevent)
causesoffailure:damagedanddirtyfiberend-faces.
Damageoccursintheformofchips,scratches,cracks,andpitstothecoreorcladdingand
canresultfrommatingcontaminatedend-faces.Tinyforeigndebrisleftonthecorecan
alsodamageend-facesduringthematingprocessastheyareconnectedtogether.
Sourcesofcontaminationareeverywhere,whetheritbefromatouchofafingerorthe
brush of a clothing fabric, much less the omnipresent dust or static-charged particles in
the air. Ports are also subject to the same contamination but are often overlooked. Mating
acleanconnectortoadirtyportnotonlycontaminatesthepreviouslycleanconnector
butcanalsocausefiberdamageorfailure.Eventheprotectivecoveringsor“dustcaps”on
straight-from-the-package connectors and assemblies can cause contamination due to the
nature of the production process and materials.
Thetypicalassumptionisthataquickvisualcheckoftheend-facesissufficienttoverify
cleanliness.Asmentionedpreviously,thecoresofthesefibersareextremelysmall–rang-
ingfromroughly9to62.5μm.Putintoperspective,withadiameterof90μm,theaverage
humanhairisanywherefrom1.5to9timeslarger!Withsuchatinycoresize,itisimpos-
sibleforanyend-facedefectstobespottedwithouttheaidofamicroscope.
There are two types of fiber inspection microscopes:Optical (Figure 28)• – tube-shaped and compact, signals transmit-tedbytheFindFibersources.youtoinspecttheend-facesdirectly.Popularbecausetheyareinexpensive;however,theyarenotabletoviewend-facesinsideequipmentorthroughbulkheads.
Video (Figure 29)• – small optical probe is connected to a handhelddisplay.Theprobesizemakesthemexcellentforexaminingportsthatareinhard-to-reachplaces;largedisplaysenableeasyidentificationofend-facede-fects.Theyarealsosaferastheyshowanimageandnotthe actual end-face being observed, reducing the risk of exposingone’seyetoharmfulradiation.
Withinthecontextofinspectingfiberoptics–showingthe
userwhatthenakedeyecannotsee,theprimarydesired
attributeisdetectioncapability–basicallythesmallest-
sized object that it can detect.
Figure 28 – Optical microscope
Figure 29 – Video microscope
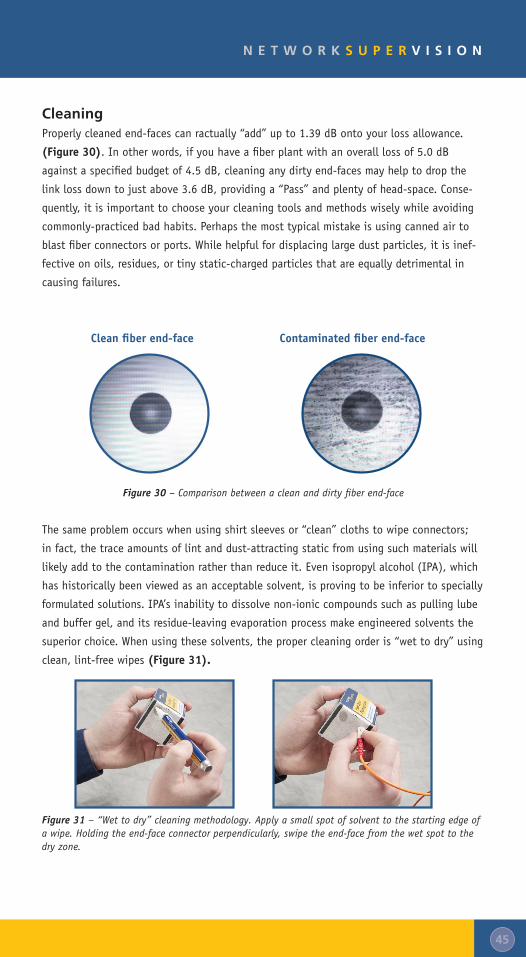
45
N E T W O R K S U P E R V I S I O N
CleaningProperlycleanedend-facescanractually“add”upto1.39dBontoyourlossallowance.
(Figure 30).Inotherwords,ifyouhaveafiberplantwithanoveralllossof5.0dB
againstaspecifiedbudgetof4.5dB,cleaninganydirtyend-facesmayhelptodropthe
linklossdowntojustabove3.6dB,providinga“Pass”andplentyofhead-space.Conse-
quently,itisimportanttochooseyourcleaningtoolsandmethodswiselywhileavoiding
commonly-practicedbadhabits.Perhapsthemosttypicalmistakeisusingcannedairto
blastfiberconnectorsorports.Whilehelpfulfordisplacinglargedustparticles,itisinef-
fectiveonoils,residues,ortinystatic-chargedparticlesthatareequallydetrimentalin
causing failures.
Figure 30 – Comparison between a clean and dirty fiber end-face
Thesameproblemoccurswhenusingshirtsleevesor“clean”clothstowipeconnectors;
in fact, the trace amounts of lint and dust-attracting static from using such materials will
likelyaddtothecontaminationratherthanreduceit.Evenisopropylalcohol(IPA),which
hashistoricallybeenviewedasanacceptablesolvent,isprovingtobeinferiortospecially
formulatedsolutions.IPA’sinabilitytodissolvenon-ioniccompoundssuchaspullinglube
and buffer gel, and its residue-leaving evaporation process make engineered solvents the
superiorchoice.Whenusingthesesolvents,thepropercleaningorderis“wettodry”using
clean, lint-free wipes (Figure 31).
Figure 31 – “Wet to dry” cleaning methodology. Apply a small spot of solvent to the starting edge of a wipe. Holding the end-face connector perpendicularly, swipe the end-face from the wet spot to the dry zone.
Clean fiber end-face Contaminated fiber end-face

46
Thetypesofcleaningresourcesvaryincomplexityandprice,rangingfromsimplewipes
todevicesthatincorporateultrasoundwithwater.Whichtoolyouusewillbedependent
uponneedandbudget–butforthemajorityofthecablingjobsandprojects,thepairing
oflint-freewipesandswabswithengineeredsolventsnowfoundinfiberinspection,certi-
fication,andcleaningkitswillbesufficient.
10. Conclusion Cablinginstallationisamulti-stepprocess.Itisaprudentpracticetocertifythecabling
systemafterinstallationtoensurethatallinstalledlinksmeettheirexpectedlevelof
performance.Certificationwilllikelyidentifysomefailingormarginallypassingresults.
Inordertodeliverahighqualitycablingsystem,thedefectsthatcausethefailuresand
marginal passes must be uncovered and corrected.
FlukeNetworks’fullsuiteoffibercertificationinstruments(Appendix2)haveaanun-
paralleledhistoryofprovidinguniqueandpowerfuldiagnosticsassistancetoinstallation
technicians.Byknowingthenatureoftypicalfaultsandhowthetester’sdiagnosticsreport
them,youcansignificantlyreducethetimetocorrectananomaly,aninstallationerror,or
adefectivecomponent.Personnelresponsibleforthenetwork’soperationcanalsobenefit
fromthediagnosticcapabilitiesofacertificationtesttool;withthetester’sassistance,
theycanlimitthedurationofnetworkdowntimeandrestoreservicequickly.
Wehighlyrecommendthatyouthoroughlyfamiliarizeyourselfwiththecapabilitiesofyour
testtool–itistrulyamodestinvestmentthatpaysforitselfmanytimesover.Inaddition
toyourprecisioninstrument,FlukeNetworksalsoprovidesawidevarietyofexpertand
timelysupportoptions.Whetheryouareaninstaller,networkowner,orcontractor,the
following resources are available:White papers and Knowledge Base articles• – insightful studies and helpful advice on relevant structured cabling topics
Unsurpassed technical assistance• fromthehighlytrainedFlukeNetworksTechnicalAssistanceCenter(TAC)
Certified Test Technician Training (CCTT) classes• available around the world
Gold Support program • –comprehensivemaintenanceandsupportincludingpriorityrepair with loaner, annual
calibrationandpriorityTACsupportwithafterhoursandweekendcoverage•

47
N E T W O R K S U P E R V I S I O N
11. GlossaryCertification testing – the process of testing the transmission performance of an installed
cablingsystemtoaspecifiedstandard;requiresanOLTSfor“Tier1”certificationandanOTDRfor“Tier2”certification
Channel – end to end transmission medium between a transmitter and receiver dB – logarithmic unit of measurement used to express magnitude of power relative to a specificorimpliedreferencelevel;usuallyassociatedwithloss
dBm – power level expressed as the logarithm of the ratio relative to one milliwatt
FiberInspector–FlukeNetworks’popularlineofhandheldfiberend-faceandbulkheadport inspection instruments, ranging from tube to video microscopes
Gbps – gigabits per second
Launch cord fiber –lengthoffiberplacedbetweenthelinksegmentundertestandtheOTDRtoimprovetheOTDR’sabilitytogradethenear-endconnectorandanyabnor-malitiesnthefirstconnection
LED–LightEmittingDiode,arelativelylow-intensitylightsource
Link–thephysicalcablingforatransmission
Mbps – megabits per second
OLTS–OpticalLossTestSet,abaseline“Tier1”certificationinstrumentthatmeasurestheloss of a link over its length
LSPM–LightSourcePowerMeter,basicfiberverificationinstrumentcomposedofapowermeter and a source to measure loss over a link
TRC–TestReferenceCord,ahigh-qualityfibercordbetween1to3meterslongwithhighperformanceconnectors,ideallywithend-faceswithspecialscratchresistanthardened surfaces that enable numerous insertions without degradation in loss performance
VCSEL –VerticalCavitySurfaceEmittingLaser,commonlyusedinmultimodelightsources
Verification testing – the process of testing the transmission performance of an installed cablingsystemtoensurethatitmeetsaminimumthreshold
VFL–VisualFaultLocator,opticalsourcethattransmitsalow-poweredlasertoidentifybreaksinfiberlinks

48
Verification Troubleshooting Certification
Check connectivity Check polarity
Verify loss over entire link to ensure loss budget not exceeded
Check for fiber end-face
contamination* or damage
Clean contamination Find faults Basic (Tier 1) Extended
(Tier 2)
Specialized Fiber Cleaning Supplies
3
VisiFault VFL 3
FindFiber Remote ID 3 3
SimpliFiber Pro Optical Loss Test Kit
3 3 3
CertiFiber OLTS
3 3 3
FiberInspector Video Microscope
3
DTX Series with Fiber Module
3
DTX Compact OTDR
3
OptiFiber OTDR
3 3 3
Appendix 1 – Fluke Networks Fiber Test and Troubleshooting Instruments
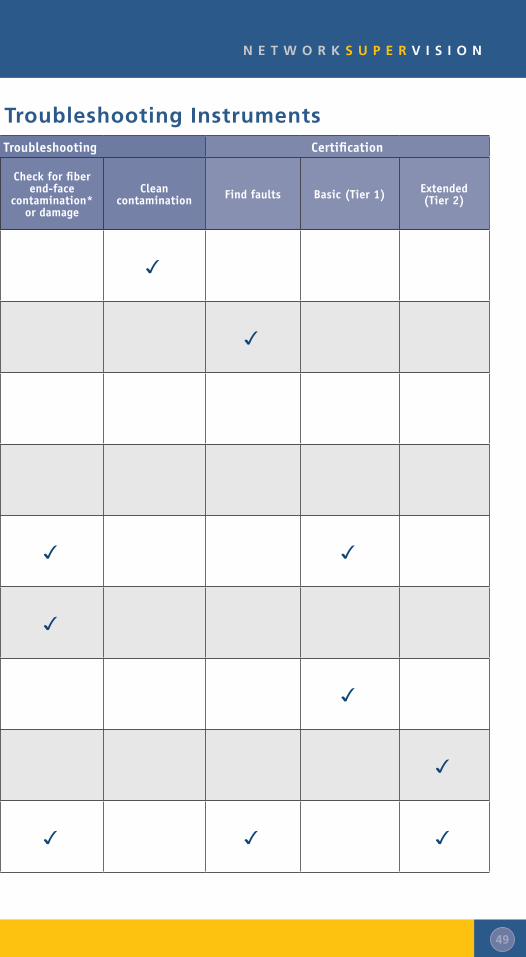
49
N E T W O R K S U P E R V I S I O N
Verification Troubleshooting Certification
Check connectivity Check polarity
Verify loss over entire link to ensure loss budget not exceeded
Check for fiber end-face
contamination* or damage
Clean contamination Find faults Basic (Tier 1) Extended
(Tier 2)
Specialized Fiber Cleaning Supplies
3
VisiFault VFL 3
FindFiber Remote ID 3 3
SimpliFiber Pro Optical Loss Test Kit
3 3 3
CertiFiber OLTS
3 3 3
FiberInspector Video Microscope
3
DTX Series with Fiber Module
3
DTX Compact OTDR
3
OptiFiber OTDR
3 3 3
Appendix 1 – Fluke Networks Fiber Test and Troubleshooting Instruments

50
Appendix 2 – Test Reference MethodsWereviewedthetheoryofthelinklosstestforopticalfiberlinksin’ProcessandEquip-
mentRequirements’underthe‘CablingCertification’sectionofChapter3,‘TestingTheory
–PerformanceofOpticalFiberCabling.’Thelossmeasurementofaninstalledopticalfiber
linkisderivedfromtwopowermeasurements.The“testreferencemeasurement”establish-
es the “no loss” power level against which the test tool compares the power through the
linkundertest.Thedifferencebetweenthesetwopowerlevelsyieldsthelossofthelink
undertest.Wehavepointedoutthatitiscriticallyimportantthatthelossmeasurement
is executed with the same source and light launch conditions as used in the reference
measurement.
Manystandardsrecommendtheone-jumpertestreferencemeasurementforpremiseswiring
cabling.Relativelyshortlengthsandmultipleconnectionscharacterizeenterprise-cabling
systemswithinabuildingorcampus.Accessorlonghaulopticalfiberlinksmayonlyhave
one connector at either end of the link which can be hundreds of times longer than the
longerenterprisecablinglinks.Itisveryimportantthatthetestofanenterprisecabling
systemcorrectlyandaccuratelyaccountsforthelosscontributionofeveryconnections.
Theevaluationofthedifferentmethodsforsettingthetestreferenceevolveinthefirst
instancearoundthewaythesemethodsaccountforthetwoendconnectorsofthelink
segmentundertest.Eachofthetestreferencemethodswewillreviewtreatanyconnec-
tionorsplicebetweentheendconnectionsofthelinkundertestinthesameway.Table 2
demonstrates that for a simple segment of 300 m with one end connection at either end,
the loss allowance in these end connections represents 1.5 db out of a budget (maximum
losslimit)of2.55dB.Thisis59%ofthelinklossbudget.
The one-jumper methodRefer back to the explanations of Figure 13 and Figure 14.Thelossesineachofthetwo
endconnectionsofthelinkundertestarecompletelyandaccuratelyincluded.Thecritique
of the one-jumper method is two fold:
a.Theconnectorsinthetesttoolmustmatchtheconnectorsattheendofthelinkunder
test
b. A second test reference cord must be added to connect the power meter to the far end
ofthelink;itsqualityandperformancemaybeunknown.
Fluke Networks has dealt with this critique in a number of ways.
1. TheDTXSeriesfibertestmodulesaswellasotherLSPMtesttoolsofrecentvintage
suchastheSimpliFiberProofferreplaceableadaptersforthepowermeter.Thetes-
terstypicallyincludeasstandardequipmenttheSCconnectorwithoptionaladapters
andtestreferencecordsavailabletotestST,LCorFCconnectorsystemswiththe
preferred one-jumper test method.

51
N E T W O R K S U P E R V I S I O N
2.AllTRCsaremanufacturedtothesameexactingspecificationswithendfacesthat
have been hardened using a patented method to provide scratch resistant and du-
rablecordswithanoptimumgeometryforlightcoupling.Theoveralllosslimitsfor
theseTRCsis0.1dB.
InthecaseoftheDTXSeriesfibertestmodules,theTRCsareimplementedasduplexcords.
TheaddedTRCisthereforeattachedandisofequalqualityandperformanceasthecord
usedtosetthereference.ThefactthattheaddedTRCisattachedassuresthatahigh
qualitycordisreadilyavailabletothetesttechniciansinthefield.
Ofcourse,thereareconnectorsystemsforwhichtheone-jumpertestreferencemethod
cannotbeadopted.ThemostprevalentexampleistheMT-RJconnectortype.Wewillfirst
explain the two-jumper method and follow that section with an adaptation of the two-
jumpermethodwhichwewillcallthe“modifiedone-jumpermethod”becauseitmeetsthe
requirementtoproperlyandaccuratelyaccountforthelossesintheendconnectionsof
the link segment under test.
The two-jumper methodFigure A3-1 demonstrates the connections for the two-jumper reference measurement.
ThepowermeterisconnectedtothetestreferencecordTRC1whilethepowermeteris
connectedtoasimilartestreferencecordTRC2.Forthereferencemeasurement,thetwo
TRCsareconnectedwiththeappropriatereferenceadapter(CR1).Werecommendtouse
adapters manufactured for singlemode applications since these adapters are manufactured
tomoreexactingmechanicalspecificationsthatensurebetterandmorerepeatablealign-
mentofthefibercores.
Figure A3-1 Two-jumper reference method – The optical loss reference measurement captures the loss in the connection of Test Reference Cord 1 (TRC1) and the Light Source, the loss in TRC1, the loss of the reference connection CR1, the loss in TRC2 and the loss in the connection between TRC2 and the power meter.
Wewillrepeattheanalysisofthereferencepowermeasurementaswedidinouranalysis
of the one-jumper reference measurement illustrated in Figure 13. It is worthwhile to
emphasize once more the importance of the launch conditions from the light source into
TRC1.Wehavenotshownthemandrelbuttheinstallationanduseofthepropermandrel
ismandatorytoobtainreliableandrepeatabletestresults.Ouranalysisfollowsthelight
path from the light source to the power meter.
ThecouplingoflightenergyfromthelightsourceintoTRC1willbeaffectedbythestatus
oftheconnectionbetweenthetestinstrumentandTRC1.Thisdoesnotneedtobeperfect
Light source Power meterTRC1 TRC2
CR1

52
and its condition does not have to be known in detail as long as it remains stable for the
durationofthetest.Therefore,donotmodifyinanywaytheconnectionbetweenTRC1
andthelightsource.AminorlossoccursineachoftheshortTRCs;recallthatthetypical
loss for the 850 nm wavelength is about 0.0035 dB per meter. For the 1300 nm wave-
length,thislossis0.0015dB.AssumingwewillnotabusetheTRCs,thelossinthefiber
do not change while we test the links in the network. A loss occurs in the adapter CR1
betweenthetwotestreferencecords.Wewilldiscussitsinfluenceinamoment.Thereis
alsosomelossinthecouplingofTRC2intothepowermeter.Usingthismethod,wewill
not have to touch this coupling as we connect to the link segment under test. Look ahead
at Figure A-2 which shows the test connections for the link segment loss test.
Figure A3-2 Two-jumper method optical loss measurement – The “difference” between the reference power level and the loss test power level is the power loss in the link under test, loss in connection C2 and the difference in the loss between CR1 (reference connection) and C1. This difference can vary; the total loss in connection C1 is not included in the link loss test result.
We will now examine the difference in the light loss between the reference measurement
andthelinkmeasurementtoensurethatthisdifferenceaccuratelyrepresentsthelossin
thelinksegmentundertest.Thedifferencefullycoversthelinksegmentundertestand
connectionC2butnotC1.Thereferencemeasurementincludesthelossoftheconnector
CR1.Duringthelinkmeasurement,wemeasurethedifferencebetweenthereferencecon-
nectionCR1andconnectionC1.ThisdifferencedoesnotequalthelossinconnectionC1.
Thisdifferencecannotbeknownorpredicted.Thetwo-jumperlossmeasurementmethod
doesnotfullyevaluatethelinksegmentandbothoftheconnectionsatitsends.
Ifyouaretestingagainstanapplicationstandard,theresultislikelylowwith0.5dB–
moreorless.Thisisnotacceptablewhenlosslimitsareinthe2.6to3.5dBrange.A0.5
dBerrorrepresentsanerrorof25%or14%.
Ifyouhadselectedaninstallationteststandard,thismethodcansomewhatbeadjusted
byensuringthatyouexcludetheC1connectionfromthecountofconnectionsinthelink.
Thetestlimitcalculationthenexcludesthelossallocatedtooneconnection.Wesaid
‘somewhat’ because the advantage of the LSPM loss measurement rests on the fact that the
contributionofeachelementisaccuratelycounted.
The “modified one-jumper” methodWecanadjustfortheerrorinthetwo-jumpermethodbyaddingaTRCwhenmeasuringthe
linklossasshownbyTRC3inFigure A3-4.Thereferencemeasurementforthismethodis
identical to the method for the two-jumper method we just reviewed as is shown in
Figure A3-3.
Light source
Link segment under test
Power meterTRC1 TRC2
C1 C2

53
N E T W O R K S U P E R V I S I O N
We have colored the connections in Figure A3-3 and A3-4 to show that the connectors in
thetesttoolsandthoseattheendofthelinkundertestdonotneedtobethesametype.
FlukeNetworksrecommendsthismethodforaconnectortypeliketheMT-RJforwhichthe
“true”one-jumpermethodcannotbeused.TheseTRCsarehybridcordswhichmeansthat
theyareterminatedwithdifferentconnectorsateitherend.TRC3fortheMT-RJapplica-
tionmusthavealignmentpinsinstalledtoproperlymatewiththetwostandardconnec-
tions.AnMT-RJTRCkitisavailablefromFlukeNetworks.Recallthatremovableadaptersat
the power meter offer the preferred method to use the true one-jumper method when this
alternative is available.
Figure A3-3 – The “modified one-jumper” reference method uses the exact same reference method as the two-jumper reference method. Note that the TRCs are hybrid cords terminated at one end with a connector matching the test equipment and at the other end with a connector that matches the link under test. The figure highlights the different connector types by using different colors.
TheanalysisofthelossesthroughtheconfigurationshowninFigure A-4 shows that the
lossinconnectionC1isfullyaccountedfor,aswellasthelossinthelinkundertestand
inconnectionC2.WealsomeasurethelossinTRC3–theaddedTRC–andthedifference
ofthelossbetweenconnectionsCR1andCR2.Thelossintheone-meterTRC3issmall
(with850nmlightthislossis0.0035dB).Thedifferencebetweenthetworeferencecon-
nectionsislessthat0.05dB–halfofthetotallossspecificationforreferencecords.The
errorobservedormeasurementuncertaintyofthetwo-jumpermethodhasapproximately
beenreducedto1/10thusingthe“modifiedone-jumper”method.
Figure A3-4 – The “Modified One-jumper” method optical loss measurement – The “difference” be-tween the reference power level and the loss test power level is the power loss in the link under test, connections C1 and C2, the added TRC3 and the difference between the loss in CR1 and in CR2 (two reference connections).
The three-jumper methodISO/IEC standard 147363-3 emphasizes the three-jumper method as a generic method that
canbeappliedregardlessofthetypeofconnectorsusedattheendsofthelinkundertest
orinthetestequipment.Figure A3-5 shows the reference connection. As the name of
thismethodimplies,youusethreeTRCstomaketheconnectionforthereferencemeasure-
ment.ThenyouremovethemiddleTRC(TRC3inFigure A3-5)and“replace”thisTRCwith
Light source Power meterTRC1 TRC2
CR1
Light source
Link segment under test
Power meterTRC1 TRC2
C1 C2AddedTRC3
CR2

54
the link under test as shown in Figure A3-6. “Replace” means that the light source with
TRC1attachedmovestooneendofthelinksegmentundertestandthepowermeterwith
TRC2attachedmovestotheoppositeendofthelinksegmentundertest.
TheopticallossreferencemeasurementcapturesthelossintheconnectionofTestRefer-
enceCord1(TRC1)andtheLightSource,thelossinTRC1,TRC2,TRC3,thelossofthe
referenceconnectionsCR1,CR2andthelossintheconnectionbetweenTRC2andthe
Power Meter.
Figure A3-5 – Three-jumper reference method – The optical loss reference measurement captures the loss in the connection of Test Reference Cord 1 (TRC1) and the Light Source, the loss in TRC1, TRC2, TRC3, the loss of the reference connections CR1, CR2 and the loss in the connection between TRC2 and the Power Meter
TheanalysisofthelossesforthelinkmeasurementshowninFigure A3-6 shows that the
lossesinthelinkundertestarefullyincludedbutthatwearemeasuringthedifferencein
the loss between CR1 and C1 and the difference between C2 and CR2 rather than the full
lossesinC1andC2.Thelossinsidethelinksegmentundertestconsistsofthesumofthe
lossinfiber,internalconnections,andsplicesifpresent.Thefulllossinneitheroftheend
connections of the link under test is included in the measurement results.
Figure A3-6 – Three-jumper method optical loss measurement – The “difference” between the refer-ence power level and the loss test power level is the power loss in the link under test and the differ-ence in the power losses between the reference connection CR1 and connection C1 and between the reference connection CR2 and C2. The actual loss in connections C1 and C2 is not included in the link loss test result.
Light source Power meterTRC1 TRC2
CR1 CR2
TRC3
Light source
Link segment under test
Power meterTRC1 TRC2
C1 C2

55
N E T W O R K S U P E R V I S I O N
The IEC 147363-3 document specifies the following formula to calculate the pass or
fail outcome of this loss test:
Link Loss = (Loss in segment under test) + Loss (C1-CR1) + Loss (C2-CR2) (A3-1)
If the loss in CR1 and CR2 were zero, this formula would yield the desired results:
Link Loss = (Loss in segment under test) + Loss (in C1) +Loss (in C2).
Thestandardalsodefinestheallowablelosslimitsfor“testconnectors”whichwereferto
as “reference connectors” in this document – see Table A3-1.
Reference connector limitTestlimitforconnectorsmated
with a reference connector
Multimode 0.1 dB 0.3 dB
Singlemode 0.2 dB 0.5 dB
Table A3-1 Definition of maximum insertion loss of connections with reference connectors as specified in IEC 14763-3
When we insert the values in table A3-1 for multimode into formula (A3-1) above,
we obtain:
Link Loss = (Loss in segment under test) + (0.3 – 0.1) + (0.3 -0.1), or
Link Loss = (Loss in segment under test) + 0.4
In conclusion, the standard uses a “correction factor” of 0.4 dB to account for the fact
thattheactuallossesintheendconnectionsofthelinkundertestarenotmeasuredby
thethree-jumpermethod.ThequalityoftheTRCcordsiscritical:
Testingwithcordsthatareworseprovideamorelenientlimit•
Testingwithcordsthatarebetterprovideatougherlimit•
Thisiscounter-intuitivebutcreatesarealproblem•
DTXcustomerscanmeasurethepatchcordlossbutthisadditionalsteprepresentsahuge
inconvenience for the contractor and we are guessing that this additional step will not be
doneinthefield.Now,youprobablyunderstandwhyFlukeNetworksdoesnotrecommend
thismethodifthejobcanbeperformedusingamethodwithlessuncertainty(which
equalsmoreaccuracy),andadvocatestheone-jumpermethod.

N E T W O R K S U P E R V I S I O N
Fluke Networks, Inc.P.O. Box 777, Everett, WA USA 98206-0777(800) 283-5853 Fax (425) 446-5043
Western Europe 00800 632 632 00, +44 1923 281 300Fax 00800 225 536 38, +44 1923 281 301Email: [email protected]
Canada (800) 363-5853 Fax (905) 890-6866 EEMEA +31 (0)40 267 5119 Fax +31 (0)40 267 5180Other countries call (425) 446-4519 Fax (425) 446-5043
E-mail: [email protected] access: http://www.flukenetworks.com
©2009 Fluke Corporation. All rights reserved. Printed in U.S.A. 5/2009 3473059 Rev. A
Your authorized Fluke Networks distributor