focus-12 - rakesh-jhunjhunwala.inrakesh-jhunjhunwala.in/.../edelweiss-focus-12-december-2015.pdf ·...
TRANSCRIPT

Focus-12 December 2015

Our Core Investment Philosophy
Our Core Investment Philosophy and Approach
Corporate governance
Management background matters
Aggressive accounting policies etc.
Strong Management Credentials
Track record of past decisions
Comments v/s delivery etc.
Leadership position in sector
Market Share, Fragmented Industry
Bargaining power of the Industry
Opportunity Size
How big the sector can be (3x, 4x....)
Is there a saturation in the Industry
Moat Around Business
How different is the company
Edge, Entry barrier, competition etc
Strong Earnings Visibility
Can we predict earnings for next 2-3 years
Revenue growth, RoE, RoCE
Cash flow, Du-Pont
Our Stock Ideas are backed by thorough Research and Analysis
2
Edelweiss Focus-12
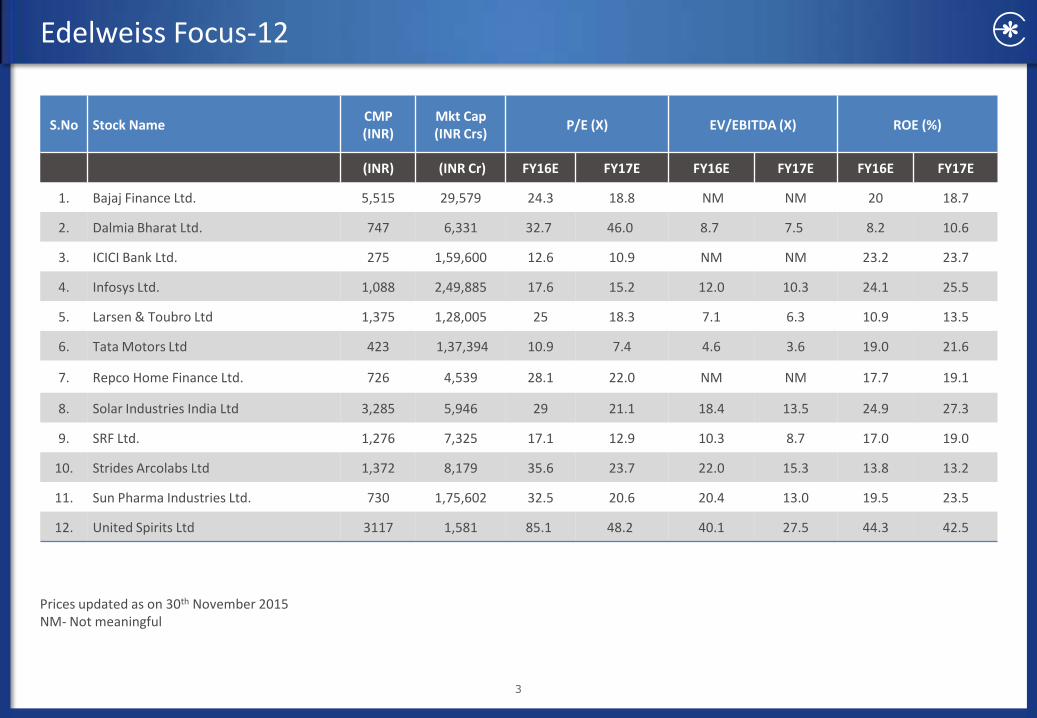
Prices updated as on 30th November 2015 NM- Not meaningful
S.No Stock Name CMP (INR)
Mkt Cap (INR Crs)
P/E (X) EV/EBITDA (X) ROE (%)
(INR) (INR Cr) FY16E FY17E FY16E FY17E FY16E FY17E
1. Bajaj Finance Ltd. 5,515 29,579 24.3 18.8 NM NM 20 18.7
2. Dalmia Bharat Ltd. 747 6,331 32.7 46.0 8.7 7.5 8.2 10.6
3. ICICI Bank Ltd. 275 1,59,600 12.6 10.9 NM NM 23.2 23.7
4. Infosys Ltd. 1,088 2,49,885 17.6 15.2 12.0 10.3 24.1 25.5
5. Larsen & Toubro Ltd 1,375 1,28,005 25 18.3 7.1 6.3 10.9 13.5
6. Tata Motors Ltd 423 1,37,394 10.9 7.4 4.6 3.6 19.0 21.6
7. Repco Home Finance Ltd. 726 4,539 28.1 22.0 NM NM 17.7 19.1
8. Solar Industries India Ltd 3,285 5,946 29 21.1 18.4 13.5 24.9 27.3
9. SRF Ltd. 1,276 7,325 17.1 12.9 10.3 8.7 17.0 19.0
10. Strides Arcolabs Ltd 1,372 8,179 35.6 23.7 22.0 15.3 13.8 13.2
11. Sun Pharma Industries Ltd. 730 1,75,602 32.5 20.6 20.4 13.0 19.5 23.5
12. United Spirits Ltd 3117 1,581 85.1 48.2 40.1 27.5 44.3 42.5
3

4
Bajaj Finance Ltd. (CMP: INR 5,515; Mkt Cap: INR 29,579 crs)
Business Overview
Retail finance company, promoted by Bajaj group. Bajaj Finserv (listed) owns 61.53% in Bajaj Finance
Out of total AUM of INR 32,410 crores, the consumer lending business constitutes 41% of the AUM
Within the consumer segment, the company has built strong capability in handling low ticket – high volume loans
SME business, which constitutes 53% of AUM, focuses on loan against property, Home loan and unsecured working capital loan
Over last 2 years, the focus has been on building rural lending book. The company has already broken even in rural lending business.
Opportunity Size: -
Over last 2 years, the company has been focusing on building rural lending book.
The company has been constantly adding new lines of segment like lifestyle financing, digital financing, MSME rural lending
Year to March FY13 FY14 FY15 FY16E FY17E
Net Interest Income (INR mn) 1,717 2,215 2,872 3,756 4,791
Net Profit after tax (INR Cr) 591 719 898 1,231 1,587
Adjusted BV per share 677 802 960 1,413 1,739
Dilute EPS (INR Cr) 119.4 143.7 178.5 226.8 292.9
Gross NPA ratio (%) 1.1 1.2 1.5 1.4 1.3
Net NPA ratio (%) 0.2 0.3 0.5 0.4 0.4
Price/Adj. Book Value(x) 8.2 6.9 5.7 3.9 3.2
Price/Earnings (x) 46.2 38.4 30.9 24.3 18.8
Name of the Shareholder Shares as % of Total No. of
Shares
Maharashtra Scooters Ltd 3.54
Government of Singapore 2.51
Acacia Partners LP 1.13
HDFC Trustee Company Ltd A/c HDFC Mid -Cap Opportunities Fund
1.07
Promoter 57.53
60
90
120
150
180
210
240
270
300
330
360
390
Jan
-14
Mar
-14
May
-14
Jul-
14
Sep
-14
No
v-1
4
Jan
-15
Mar
-15
May
-15
Jul-
15
Sep
-15
No
v-1
5
Bajaj Fin Sensex

5
Company Name
Diluted P/E (x)
P/BV(x) ROE (%)
FY16E FY17E FY16E FY17E FY16E FY17E
Bajaj Finance 18.9 14.9 3.1 2.5 20.1 18.8
Cholamandalam 16.8 14.0 2.5 2.1 15.7 16.4
Bajaj Finance Ltd. (CMP: INR 5,515; Mkt Cap: INR 29,579 crs)
Consumer Finance, 41%
SME business, 53%
Commercial, 5%
Q4FY15
7,270
12,283
16,744
22,971
31,199
FY11 FY12 FY13 FY14 FY15E
Loans (INR Cr)
Investment Hypothesis
Mix of scale and profitability. The consumer business provides
profitability and SME business provides scale
Addition of new business segments like rural lending, lifestyle
financing etc.
Constant improvement in efficiency despite steady increase in
geographic presence. The operating cost as % of assets has come
down from 6.7% in FY12 to 5.3% in FY15
Currently at the bottom of NPA cycle. Gross NPA at 1.5% and net NPA
at 0.45%. Asset quality is expected to improve constantly
Risks
Slowdown in retail segment will impact both asset quality and growth
profile
Slowdown in real estate will also exert pressure on asset quality
Peer Comparison

6
Dalmia Bharat Ltd (CMP: INR 747; Mkt Cap: INR 6,331 crs)
Business Overview
Dalmia Bharat Ltd (DBL) is India’s 3rd largest cement group, with a capacity of 24 MT spread across South, East and North East regions
DBL is currently operating at ~60% utilization on effective capacity of ~20.4 MT, with enough headroom for operating leverage to kick in.
With the incremental clinker capacity addition in the North East, the company is expected to witness substantial boost in profitability.
Opportunity Size: -
48% of the company’s capacity is concentrated in the South, where cement demand is expected to revive gradually on the back of infrastructure development and incremental demand from the split of states.
North East remains one of the most underpenetrated regions in terms of cement demand, with per capita consumption at 142 kgs v/s all India average of 210 kgs.
Year to March FY13 FY14 FY15 FY16E FY17E
Revenue 2,791 3,016 3,514 6,473 7,233
Revenue Growth (%) N/A 8.1% 16.5% 84.2% 11.7%
EBITDA 635 476 591 1,472 1,625
Net Profit 140 (87) (63) 314 432
Profit Growth (%) N/A -110.1% -141.2% 3126.2% 41.0%
Shares Outstanding (crs.) 8.1 8.1 8.1 8.1 8.1
Diluted EPS (INR) 24.2 (2.5) 1.0 32.7 46.0
EPS Growth (%) N/A -110.1% -141.2% 3126.2% 41.0%
Diluted P/E (x) 29.8 (293.6) 712.1 22.1 15.7
EV/EBITDA (x) 12.9 18.6 21.0 8.7 7.5
RoE (%) 6.6% -0.6% 0.3% 8.2% 10.6%
Name of the Shareholder Shares as % of Total No. of
Shares
Mayuka Investment Limited 22.03
Shree Nirman Limited 9.55
Sita Investment Company Limited 7.24
Ankita Pratisthan Limited 7.18
Promoter 62.79
0
50
100
150
200
250
300
350
400
450
500
Jan
-14
Mar
-14
May
-14
Jul-
14
Sep
-14
No
v-1
4
Jan
-15
Mar
-15
May
-15
Jul-
15
Sep
-15
No
v-1
5
Dalmia Sensex

7
Dalmia Bharat Ltd (CMP: INR 747; Mkt Cap: INR 6,331 crs)
Q4FY15 Investment Hypothesis
Third generation management has undertaken various initiatives to bring about scale and efficiency in the business, including:
● Unlocking value by restructuring the business
● Focusing on geographical diversification through foray into lucrative regions like East and North East and
● Introduction of cost efficiency measures, making it among the most cost efficient players in India
Southern recovery expected to be the key catalyst to propel long growth as utilization improves from current bottom levels of 60% in line with demand improvement
Turnaround in North East to drive near term growth and boost profitability, with higher EBITDA/tonne in the North East region
Risks
Change in Investment plans
Inability to pass on increase in cost
Changes in macro environment
Peer Comparison
Company Name Diluted P/E (x)
Diluted EV/EBITDA (x)
ROE (%)
FY16E FY17E FY16E FY17E FY16E FY17E
Dalmia Bharat Ltd 29.8 20.0 9.3 8.1 8.0 10.0
The Ramco Cement Ltd 19.6 15.6 10.9 9.0 16.0 17.0
Shree Cement Ltd 41.5 25.0 22.2 16.0 16.0 21.0
JK Lakshmi Cement Ltd 213.3 18.7 18.8 10.9 1.0 15.0
0
1000
2000
3000
4000
5000
6000
7000
8000
9000
FY14 FY15 FY16E FY17E FY18E
INR
crs
South Cement Sales East (Incl OCL) Cement Sales
North East Cement Sales Refractories & Others

8
ICICI Bank Ltd. (CMP: INR 275; Mkt Cap: INR 1,59,600 cr)
Business Overview
India’s second largest bank and largest private bank with total assets of about ~INR6.5tn as of FY15.
Focused on retail lending
Its subsidiaries have near market leadership in their respective segments (mortgages, auto loans, commercial vehicle loans, life insurance, general insurance, and asset management)
International and corporate lending can be the new growth drivers when environment improves.
Opportunity Size: -
As of FY15 , ICICI bank has only 5% market share in the Indian banking space.
Industry Credit growth is likely to sustain at 2X-3X real GDP growth rate: CAGR of ~21% (Historically, non-food gross bank credit has grown at ~2.5X real GDP growth rate .
Year to March FY13 FY14 FY15 FY16E FY17E
Net Interest Income (INR mn) 22,212 26,903 31,215 34,020 38,809
Net Profit after tax (INR Cr) 8,325 9,810 11,175 12,565 14,539
Adjusted BV per share 91.6 102 110.9 124.4 142.1
Dilute EPS (INR Cr) 14.4 16.9 19.2 21.6 25
Gross NPA ratio (%) 3.0 2.9 3.7 3.9 3.7
Net NPA ratio (%) 0.7 0.9 1.6 1.7 1.6
Price/Adj. Book Value(x) 2.9 2.6 2.4 2.2 1.9
Price/Earnings (x) 18.9 16.1 14.2 12.6 10.9
Name of the Shareholder Shares as % of Total No. of
Shares
Deutsche Bank Trust Company Americas 29.05
LIC of India 9.22
Dodge & Cox International Stock Fund 4.44
Europacific Growth Fund 2.24
Promoter –
60
80
100
120
140
160
180
200
Jan
-14
Mar
-14
May
-14
Jul-
14
Sep
-14
No
v-1
4
Jan
-15
Mar
-15
May
-15
Jul-
15
Sep
-15
No
v-1
5
ICICI Sensex

9
ICICI Bank Ltd. (CMP: INR 275; Mkt Cap: INR 1,59,600 cr)
Investment Hypothesis
ICICI Bank to be the biggest beneficiary of buoyant economic outlook, pick up in corporate credit, continued retail credit growth, given its extensive
reach and client relationships.
Around 44% of its deposits comprise low-cost current account and savings
account (CASA) deposits, which collectively enable the bank to contain its
deposit costs and generate best in class NIMS of 3.5%.
The bank has best in class operating efficiency with cost-to-income ratio at
37%.
Led by 16% CAGR in earnings on the back of a 17% loan growth and 3.3%
margin we expect core RoA/ RoE to be 2.0%/15-16%.
Risks
Execution risk
Higher than expected delinquencies
Slowdown in Economy
Peer Comparison
Retail continues to drive growth
Reducing Cost to Income Ratio
Company Name CMP Diluted P/E (x) P/BV(x) ROA (%)
FY16E FY17E FY16E FY17E FY16E FY17E
ICICI Bank 302 14.0 12.0 2.1 1.8 2.0 2.0
Axis Bank 578 15.0 12.0 2.6 2.2 1.8 1.9
HDFC Bank 1036 21.0 17.0 3.6 3.1 2.0 2.0
Kotak Bank 1393 31.0 26.0 4.6 3.9 2.8 2.9
38.30%
36.80% 36.80% 36.60%
35.00%
36.00%
37.00%
38.00%
39.00%
2014 2015 2016E 2017E

10
Infosys Ltd. (CMP: INR 1,088; Mkt Cap: INR 2,49,885 cr)
Business Overview
Second largest IT services company in India with 910 active clients spread across 50 countries with an employee force of 176,187
Leader in offshore services space with a pioneer in Global delivery model.
Provides consulting, application development and maintenance services in BFSI, Retail, Manufacturing, and Utilities verticals.
Own proprietary core banking software ‐ Finacle used by some of the leading banks in India, Middle East, Africa and Europe.
Opportunity Size: -
Of the worldwide technology spend of ~USD 2.2tn in 2015, Software Products, IT and BPM Services contributed over USD 1.2tn or 58% while Hardware accounted for the balance 42% (or ~USD1bn). Infosys still has a market share less than 10% of the overall spend.
As per Nasscom, Social Media, Analytics and Cloud is a potential USD 1Tn opportunity by 2020 with cloud expected to provide ~70% of the opportunity where Infosys is a leading player.
Year to March FY13 FY14 FY15 FY16E FY17E
Net revenues (INR Cr) 40,352 50,133 53,319 61,523 69,642
Rev growth (%) 19.6 24.2 6.3 15.3 13.1
EBITDA (INR Cr) 11,551 13,415 14,900 17,658 20,049
Adjusted PAT (INR Cr) 9,418 10,648 12,333 13,941 16,176
Adj. EPS (INR) 41.2 46.5 53.9 60.9 70.7
EPS growth (%) 13.2 13.0 15.8 13.0 16.0
P/E (x) 26.1 23.1 19.9 17.6 15.2
P/B (x) 6.1 5.1 4.5 4.0 3.7
RoACE (%) 35.5 34.3 34.7 35.1 36.8
RoAE (%) 25.7 24.3 24.1 24.1 25.5
Name of the Shareholder Shares as % of Total No. of
Shares
LIC of India 5.53
Abu Dhabi Investment Authority 2.45
Oppenheimer Developing Markets Fund 2.24
Government of Singapore 2.18
Promoter 13.08
60
70
80
90
100
110
120
130
140
150
Jan
-14
Mar
-14
May
-14
Jul-
14
Sep
-14
No
v-1
4
Jan
-15
Mar
-15
May
-15
Jul-
15
Sep
-15
No
v-1
5
Infosys Sensex

11
Infosys Ltd. (CMP: INR 1,088; Mkt Cap: INR 2,49,885 cr)
Investment Hypothesis
Dr. Sikka outlined the company’s long-term aspirations, viz., USD20bn with EBIT margin of 30% by CY20. This implies organic revenue CAGR of 14%
over FY16-21.
Infosys has started investments in newer technologies and imparting
training employees in these newer areas. These investments will bear fruit
in the near term.
Utilisation has seen an upward trend in FY14. Still scope exists as company
expects ~82% is the ideal utilisation level. from current 78% levels.
Strong demand to lead to expected earnings CAGR of 15% from FY15-FY17E
Risks
Currency Volatility
Slowdown in its key market US.
More senior level exits
Peer Comparison
Utilization still scope for improvement
Sales effectiveness seeing an improvement
Company Name CMP Diluted P/E (x) EV/EBITDA (x) ROE (%)
FY16E FY17E FY16E FY17E FY16E FY17E
Infosys 1077 16.0 14.0 12.0 10.0 24.0 25.0
TCS 2616 20.0 18.0 15.0 14.0 40.0 36.0
Wipro 563 14.0 13.0 11.0 10.0 21.0 20.0
Tech Mahindra 551 15.0 13.0 10.0 8.0 26.0 26.0
4,000
4,800
5,600
6,400
7,200
8,000
FY06 FY07 FY08 FY09 FY10 FY11 FY12 FY13 FY14
(USD
'00
0)
Revenue / Sales person
Onsite - Offshore (%) Q113 Q213 Q313 Q413 Q114 Q214 Q314 Q414 Q115
Onsite 49.7 50.7 51.4 52.1 53.2 52.5 51.1 51.1 NA
Offshore 50.3 49.3 48.6 47.9 46.8 47.5 48.9 48.9 NA
Utilization (%)
Including trainees 64.7 67.5 67.1 68.5 70.7 73.1 72.5 72.9 74.8
Excluding trainees 69.5 71.6 70.6 71.4 74.3 77.5 76.9 76.7 80.1
12
Larsen & Toubro Ltd (CMP: INR 1,375; Mkt Cap: INR 1,28,005 crs)
Business Overview
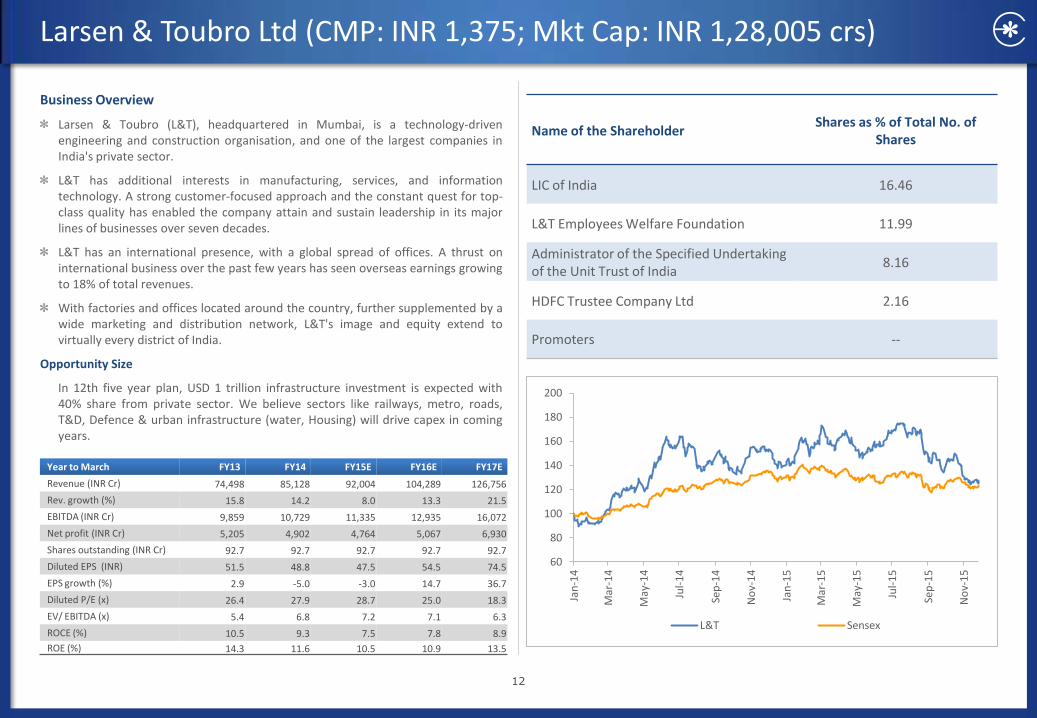
Larsen & Toubro (L&T), headquartered in Mumbai, is a technology-driven engineering and construction organisation, and one of the largest companies in India's private sector.
L&T has additional interests in manufacturing, services, and information technology. A strong customer-focused approach and the constant quest for top-class quality has enabled the company attain and sustain leadership in its major lines of businesses over seven decades.
L&T has an international presence, with a global spread of offices. A thrust on international business over the past few years has seen overseas earnings growing to 18% of total revenues.
With factories and offices located around the country, further supplemented by a wide marketing and distribution network, L&T's image and equity extend to virtually every district of India.
Opportunity Size
In 12th five year plan, USD 1 trillion infrastructure investment is expected with 40% share from private sector. We believe sectors like railways, metro, roads, T&D, Defence & urban infrastructure (water, Housing) will drive capex in coming years.
Year to March FY13 FY14 FY15E FY16E FY17E
Revenue (INR Cr) 74,498 85,128 92,004 104,289 126,756
Rev. growth (%) 15.8 14.2 8.0 13.3 21.5
EBITDA (INR Cr) 9,859 10,729 11,335 12,935 16,072
Net profit (INR Cr) 5,205 4,902 4,764 5,067 6,930
Shares outstanding (INR Cr) 92.7 92.7 92.7 92.7 92.7
Diluted EPS (INR) 51.5 48.8 47.5 54.5 74.5
EPS growth (%) 2.9 -5.0 -3.0 14.7 36.7
Diluted P/E (x) 26.4 27.9 28.7 25.0 18.3
EV/ EBITDA (x) 5.4 6.8 7.2 7.1 6.3
ROCE (%) 10.5 9.3 7.5 7.8 8.9
ROE (%) 14.3 11.6 10.5 10.9 13.5
Name of the Shareholder Shares as % of Total No. of
Shares
LIC of India 16.46
L&T Employees Welfare Foundation 11.99
Administrator of the Specified Undertaking of the Unit Trust of India
8.16
HDFC Trustee Company Ltd 2.16
Promoters --
60
80
100
120
140
160
180
200
Jan
-14
Mar
-14
May
-14
Jul-
14
Sep
-14
No
v-1
4
Jan
-15
Mar
-15
May
-15
Jul-
15
Sep
-15
No
v-1
5
L&T Sensex
13
Larsen & Toubro Ltd (CMP: INR 1,375; Mkt Cap: INR 1,28,005 crs)
Investment Hypothesis
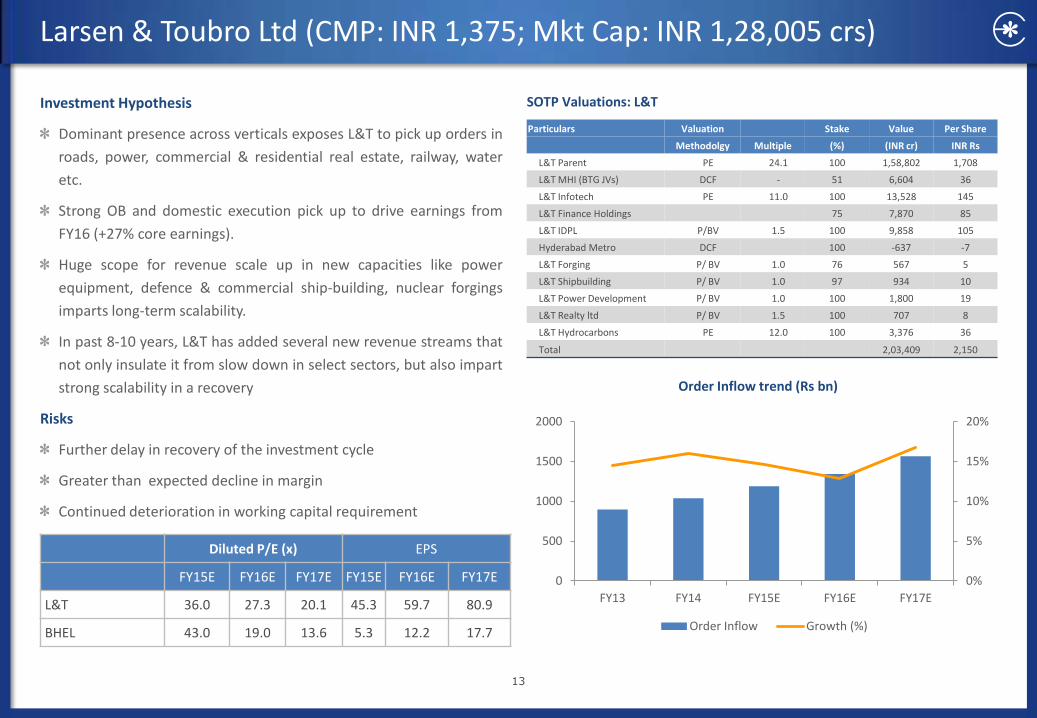
Dominant presence across verticals exposes L&T to pick up orders in
roads, power, commercial & residential real estate, railway, water
etc.
Strong OB and domestic execution pick up to drive earnings from
FY16 (+27% core earnings).
Huge scope for revenue scale up in new capacities like power
equipment, defence & commercial ship-building, nuclear forgings
imparts long-term scalability.
In past 8-10 years, L&T has added several new revenue streams that
not only insulate it from slow down in select sectors, but also impart
strong scalability in a recovery
Risks
Further delay in recovery of the investment cycle
Greater than expected decline in margin
Continued deterioration in working capital requirement
Order Inflow trend (Rs bn)
Particulars Valuation Stake Value Per Share
Methodolgy Multiple (%) (INR cr) INR Rs
L&T Parent PE 24.1 100 1,58,802 1,708
L&T MHI (BTG JVs) DCF - 51 6,604 36
L&T Infotech PE 11.0 100 13,528 145
L&T Finance Holdings 75 7,870 85
L&T IDPL P/BV 1.5 100 9,858 105
Hyderabad Metro DCF 100 -637 -7
L&T Forging P/ BV 1.0 76 567 5
L&T Shipbuilding P/ BV 1.0 97 934 10
L&T Power Development P/ BV 1.0 100 1,800 19
L&T Realty ltd P/ BV 1.5 100 707 8
L&T Hydrocarbons PE 12.0 100 3,376 36
Total 2,03,409 2,150
SOTP Valuations: L&T
Diluted P/E (x) EPS
FY15E FY16E FY17E FY15E FY16E FY17E
L&T 36.0 27.3 20.1 45.3 59.7 80.9
BHEL 43.0 19.0 13.6 5.3 12.2 17.7
0%
5%
10%
15%
20%
0
500
1000
1500
2000
FY13 FY14 FY15E FY16E FY17E
Order Inflow Growth (%)

14
Tata Motors (CMP: INR 423; Mkt Cap: INR 1,37,394 crs)
Business Overview
Tata Motors is India’s largest commercial vehicle manufacture in India with close to 45% market share.
The company entered the global premium passenger vehicle segment with the acquisition of two iconic British brands – Jaguar & Land-rover (JLR) from Ford in 2008.
As of FY15, JLR accounts for 86% of consolidated sales and more than 100% of the operating profitability of the overall entity. The standalone entity is operationally loss making currently.
Opportunity Size: -
Domestically, for improving economic growth an increase in freight transport is eminent which will result in higher fleet utilizations and corresponding fleet addition providing significant volume impetus to the MHCV segment (i.e FY15 MHCV sales 40% below peak sales in FY12). Progressively, a shift to higher tonnage payload vehicles will provide a fillip to realization per vehicle.
Internationally, the premium passenger vehicle market CY14 is estimated at around Euro 350 bn (Source :Industry Data). Additionally, the premium passenger vehicle market is additionally lesser cyclical than non-premium passenger vehicle industry.
Year to March FY13 FY14 FY15 FY16E FY17E
Revenue( crs) 188,817 232,833 262,796 274,213 306,622
Rev. growth (%) 13.9 23.3 12.8 4.3 11.8
EBITDA (crs) 24,773 33,208 39,278 36,704 46,423
Net profit (crs) 8,975 11,686 12,510 12,644 18,480
Shares outstanding (crs) 319 321 321 330 330
Diluted EPS (INR) 29.4 38.5 40.8 38.2 55.8
EPS growth (%) -30.0 30.8 5.9 -6.0 46.1
Diluted P/E (x) 14.1 10.8 10.2 10.9 7.4
EV/ EBITDA (x) 6.3 4.6 4.0 4.6 3.6
ROCE (%) 20.1 20.4 20.2 14.2 17.0
ROE (%) 26.6 23.9 21.5 19.0 21.6
Name of the Shareholder Shares as % of Total No. of
Shares
LIC of India 6.25
ICICI Prudential Life Insurance Company 2.01
Promoter 33.01
40
60
80
100
120
140
160
180
Jan
-14
Mar
-14
May
-14
Jul-
14
Sep
-14
No
v-1
4
Jan
-15
Mar
-15
May
-15
Jul-
15
Sep
-15
No
v-1
5
Tata Motors Sensex

15
Tata Motors (CMP: INR 423; Mkt Cap: INR 1,37,394 crs)
Investment Hypothesis
The company is the market leader in the CV segment in India (MHCV & LCV) with a 50% market share and is the 3rd largest company in the world in terms of annual CV sales (i.e behind Daimler & Dongfeng).
The recovery in the domestic MHCV industry since Q2FY15 has resulted in the standalone entity turning profitable in Q4FY15 post 5-quarters of operating loss.
The company’s JLR subsidiary contributes 86% to consol sales and close to 100% of profitability.
In the recent months the down-turn in China (i.e JLR China volume contribution fell from ~30% to ~20%) has affected subsidiary profitability.
Considering JLR’s strong product pipeline and assuming the China volume contribution to remain steady we believe that most of the risks have been priced into the stock.
The stock is currently available at 6.8x FY16E EPS.
Risks
80%-85% of the company’s revenues comes from international sales hence
unfavorable currency fluctuations (GBP vs other currencies)
Delay in launches of new models expected in Q3/Q4FY15 could affect sales volume.
Weak premium passenger vehicle demand could affect the company. Further
downside to the China regional mix could be detrimental profitability.
Peer Comparison
Global luxury car market size from 2010 to 2014
Company Name
Diluted P/E (x) Diluted EPS ROCE (%)
CMP (INR)
FY16E FY17E FY16E FY17E FY16E FY17E
Tata Motors 335 7.9 6.7 49.1 58.3 17.2 17.4
Maruti Suzuki 4156 23.9 17.1 185.2 258.3 29.9 34.5
M&M 1141 20.2 15.0 60.5 81.5 21.5 25.2
0%
2%
4%
6%
8%
10%
12%
14%
16%
-
50
100
150
200
250
300
350
400
2010 2011 2012 2013 2014
Euro
Bn
Global Luxury Car market size (LHS) % Change YoY (RHS)
MHCV Industry Sales : Quarterly volume recovery (% Change YoY)
-40%
-30%
-20%
-10%
0%
10%
20%
30%
40%
50%
Q1
FY1
2
Q2
FY1
2
Q3
FY1
2
Q4
FY1
2
Q1
FY1
3
Q2
FY1
3
Q3
FY1
3
Q4
FY1
3
Q1
FY1
4
Q2
FY1
4
Q3
FY1
4
Q4
FY1
4
Q1
FY1
5
Q2
FY1
5
Q3
FY1
5
Q4
FY1
5
Q1
FY1
6
16
Repco Home Finance (CMP: INR 726; Mkt Cap: INR 4,539 crs)
Business Overview
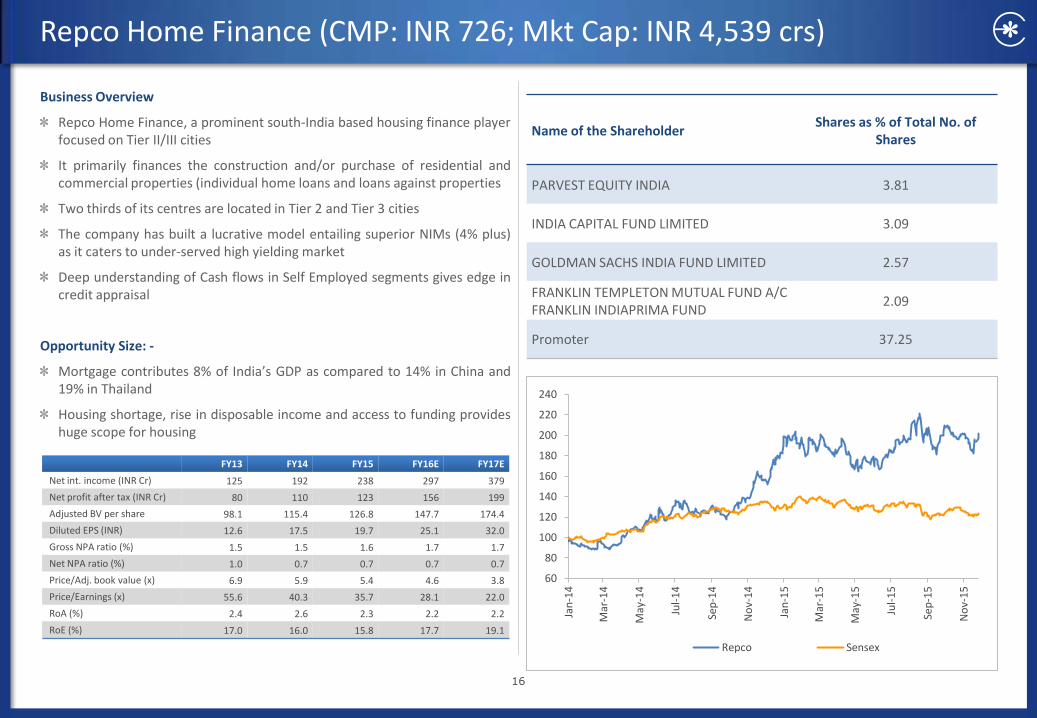
Repco Home Finance, a prominent south-India based housing finance player focused on Tier II/III cities
It primarily finances the construction and/or purchase of residential and commercial properties (individual home loans and loans against properties
Two thirds of its centres are located in Tier 2 and Tier 3 cities
The company has built a lucrative model entailing superior NIMs (4% plus) as it caters to under-served high yielding market
Deep understanding of Cash flows in Self Employed segments gives edge in credit appraisal
Opportunity Size: -
Mortgage contributes 8% of India’s GDP as compared to 14% in China and 19% in Thailand
Housing shortage, rise in disposable income and access to funding provides huge scope for housing
Name of the Shareholder Shares as % of Total No. of
Shares
PARVEST EQUITY INDIA 3.81
INDIA CAPITAL FUND LIMITED 3.09
GOLDMAN SACHS INDIA FUND LIMITED 2.57
FRANKLIN TEMPLETON MUTUAL FUND A/C FRANKLIN INDIAPRIMA FUND
2.09
Promoter 37.25
FY13 FY14 FY15 FY16E FY17E
Net int. income (INR Cr) 125 192 238 297 379
Net profit after tax (INR Cr) 80 110 123 156 199
Adjusted BV per share 98.1 115.4 126.8 147.7 174.4
Diluted EPS (INR) 12.6 17.5 19.7 25.1 32.0
Gross NPA ratio (%) 1.5 1.5 1.6 1.7 1.7
Net NPA ratio (%) 1.0 0.7 0.7 0.7 0.7
Price/Adj. book value (x) 6.9 5.9 5.4 4.6 3.8
Price/Earnings (x) 55.6 40.3 35.7 28.1 22.0
RoA (%) 2.4 2.6 2.3 2.2 2.2
RoE (%) 17.0 16.0 15.8 17.7 19.1
60
80
100
120
140
160
180
200
220
240
Jan
-14
Mar
-14
May
-14
Jul-
14
Sep
-14
No
v-1
4
Jan
-15
Mar
-15
May
-15
Jul-
15
Sep
-15
No
v-1
5
Repco Sensex

17
Repco Home Finance (CMP: INR 726; Mkt Cap: INR 4,539 crs)
0%
10%
20%
30%
40%
50%
60%
FY13 FY14 FY15
Salaried Non Salaried
Loan Book Composition
0%
20%
40%
60%
80%
100%
120%
140%
FY13 FY14 FY15
Average loan size (Rs million)
Investment Hypothesis
Focused play on low cost Housing in India with significant presence in
South.
Self employed category (55% of loan book) gives pricing power with
4%+ NIM’s
Deep understanding of Cash flows in Self Employed segments gives
edge in credit appraisal
Well capitalized balance sheet with capital adequacy ratio of 24.95%
Risks
63.5% of its loan book is coming from Tami Nadu alone. Any
slowdown in real estate sector, especially in Tamil Nadu will have
negative impact
Adverse regulatory change will have negative impact on the growth
and profitability of the company
Peer Comparison
Diluted P/E (x) P/BV(x) ROAE (%)
FY16E FY17E FY16E FY17E FY16E FY17E
Repco 24.0 19.1 4.0 3.4 18.2 19.3
LIC Housing 12.6 10.7 2.1 1.9 18.2 18.6
18
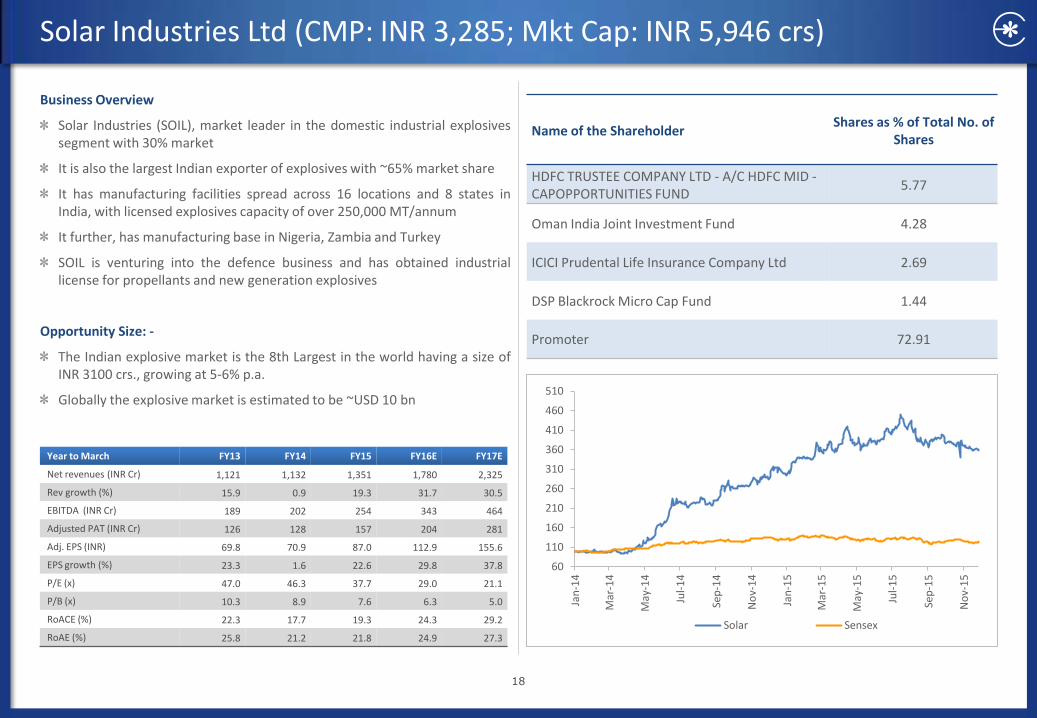
Solar Industries Ltd (CMP: INR 3,285; Mkt Cap: INR 5,946 crs)
Year to March FY13 FY14 FY15 FY16E FY17E
Net revenues (INR Cr) 1,121 1,132 1,351 1,780 2,325
Rev growth (%) 15.9 0.9 19.3 31.7 30.5
EBITDA (INR Cr) 189 202 254 343 464
Adjusted PAT (INR Cr) 126 128 157 204 281
Adj. EPS (INR) 69.8 70.9 87.0 112.9 155.6
EPS growth (%) 23.3 1.6 22.6 29.8 37.8
P/E (x) 47.0 46.3 37.7 29.0 21.1
P/B (x) 10.3 8.9 7.6 6.3 5.0
RoACE (%) 22.3 17.7 19.3 24.3 29.2
RoAE (%) 25.8 21.2 21.8 24.9 27.3
Name of the Shareholder Shares as % of Total No. of
Shares
HDFC TRUSTEE COMPANY LTD - A/C HDFC MID - CAPOPPORTUNITIES FUND
5.77
Oman India Joint Investment Fund 4.28
ICICI Prudental Life Insurance Company Ltd 2.69
DSP Blackrock Micro Cap Fund 1.44
Promoter 72.91
Business Overview
Solar Industries (SOIL), market leader in the domestic industrial explosives segment with 30% market
It is also the largest Indian exporter of explosives with ~65% market share
It has manufacturing facilities spread across 16 locations and 8 states in India, with licensed explosives capacity of over 250,000 MT/annum
It further, has manufacturing base in Nigeria, Zambia and Turkey
SOIL is venturing into the defence business and has obtained industrial license for propellants and new generation explosives
Opportunity Size: -
The Indian explosive market is the 8th Largest in the world having a size of INR 3100 crs., growing at 5-6% p.a.
Globally the explosive market is estimated to be ~USD 10 bn
60
110
160
210
260
310
360
410
460
510
Jan
-14
Mar
-14
May
-14
Jul-
14
Sep
-14
No
v-1
4
Jan
-15
Mar
-15
May
-15
Jul-
15
Sep
-15
No
v-1
5
Solar Sensex

19
Solar Industries Ltd (CMP: INR 3,285; Mkt Cap: INR 5,946 crs)
Investment Hypothesis
Largest player in the industrial explosive segment, expected to
benefit from revival in the infra spending. Also ramp-up in its
subsidiaries in Africa could help improve profitability further
Has entered into defense segment, manufacturing of propellants and
HMX. These products would be 20%+ margins and a RoCE of 40%+.
SOIL has already participated in the tender for supplies, it is awaiting
the initial order. We believe the defence facility has the potential to
generate sales of ~INR7bn at full utilisation level.
Risks
Slow down in mining and infrastructure sectors
Any delay in overseas expansion or in defence venture
USD/INR volatility may impact export revenues as well as margins.
Peer Comparison
Company Name
Diluted P/E (x) Diluted
EV/EBITDA (x) ROE (%)
FY16E FY17E FY16E FY17E FY16E FY17E
Solar industries 35.2 26 22.4 17.1 21.9 24.4
Anhui Jiangnan 20.3 18.0 12.4 11.1 9.6 10.2
Guizhou Juilian 22.7 19.1 16.9 14.7 13.4 14.6
Orica 11.3 10.6 7.4 7.0 13.1 13.2
Bulk Share 27%
Cartrige sharre 29%
Detonators share 14%
Detonating fuse share
3%
Exports 19%
Trading 8%
Segmental Revenues
0%
5%
10%
15%
20%
25%
30%
35%
FY06 FY07 FY08 FY09 FY10 FY11 FY12 FY13 FY14
Market Share Gains

Private and Confidential 20
SRF Ltd (CMP: INR 1,276; Mkt Cap: INR 7,325 crs)
Business Overview
SRF is the market leader in fluorine chemistry, technical textiles, refrigerant gases besides being a preferred supplier of other fluorochemicals products and polyester films, India.
Exports constitute 33% of revenue
Marquee global clients - Bayer, Syngenta, BASF, Pfizer, etc
Opportunity Size: -
India is 3% of the global chemicals market (USD 4.2tn).
Fluorine-based chemicals hold high prospects given that around one-fifth of all drugs sold globally use at least one fluorine substituent .
The specialty chemicals market in India (including knowledge chemicals as active ingredients in agrochemicals and pharmaceuticals) has the potential to grow at a rate of ~16% p. a. to reach USD 42bn by FY2018E .
Year to March FY13 FY14 FY15 FY16E FY17E
Net revenues 3,783 4,018 4,540 4,742 5,325
Rev growth (%) -6% 6% 13% 4% 12%
EBITDA margin 16 13 16 20 21
Adjusted PAT 253 162 303 424 564
Adj. EPS (INR) 40 28 52 72 96
EPS growth (%) -33% -36% 87% 40% 33%
P/E (x) 31.1 45.0 24.0 17.1 12.9
P/B (x) 3.7 3.5 3.1 2.7 2.3
RoACE (%) 11 6 10 13 15
RoAE (%) 12 8 14 17 19
EV/EBITDA (x) 16 19 13.5 10.3 8.7
Name of the Shareholder Shares as % of Total No. of
Shares
Amansa Holdings Pvt Ltd 5.14
Sundaram Mutual Fund A/c Sundaram Select Midcap
2.64
Goldman Sachs India Fund Ltd 2.08
DSP Blackrock Small & Mid Cap Fund 1.23
Promoter 52.38
0
100
200
300
400
500
600
700
Jan
-14
Mar
-14
May
-14
Jul-
14
Sep
-14
No
v-1
4
Jan
-15
Mar
-15
May
-15
Jul-
15
Sep
-15
No
v-1
5
SRF Sensex

Private and Confidential 21
SRF Ltd (CMP: INR 1,276; Mkt Cap: INR 7,325 crs)
Investment Hypothesis
India Value Migration Play- Competitive cost dynamics/skilled
labour/Govt. Policies
Leader and specialist in fluorine chemistry .
Specialty chemicals: Entry barriers, high domain sophistication to
sustain business growth .
Expanding capacity to leverage its strengths
PAT to grow at 47% CAGR over FY14-17E led by business mix change .
Risks
Volatility in fluorspar prices
Substitute product launches in refrigerants cause a concern
Further slowdown in packaging business
Peer Comparison
Segmental Revenues
Segmental Profits
Company Name
Diluted P/E (x) Diluted EPS ROCE (%)
CMP (INR)
FY16E FY17E FY16E FY17E FY16E FY17E
SRF 1391 15.0 12.0 73.0 90.0 13.0 14.0
Aarti Industries 334 12.0 10.0 27.8 34.7 19.0 20.0
PI Industries 680 30.0 22.0 22.6 30.3 36.0 39.0
Vinati Organics 640 25.0 22.0 26.0 29.0 35.0 32.0
Technical textiles 48%
Chemicals Business
24%
Packaging Film Business
28%
Technical textiles 34%
Chemicals Business
54%
Packaging Film Business
12%
22
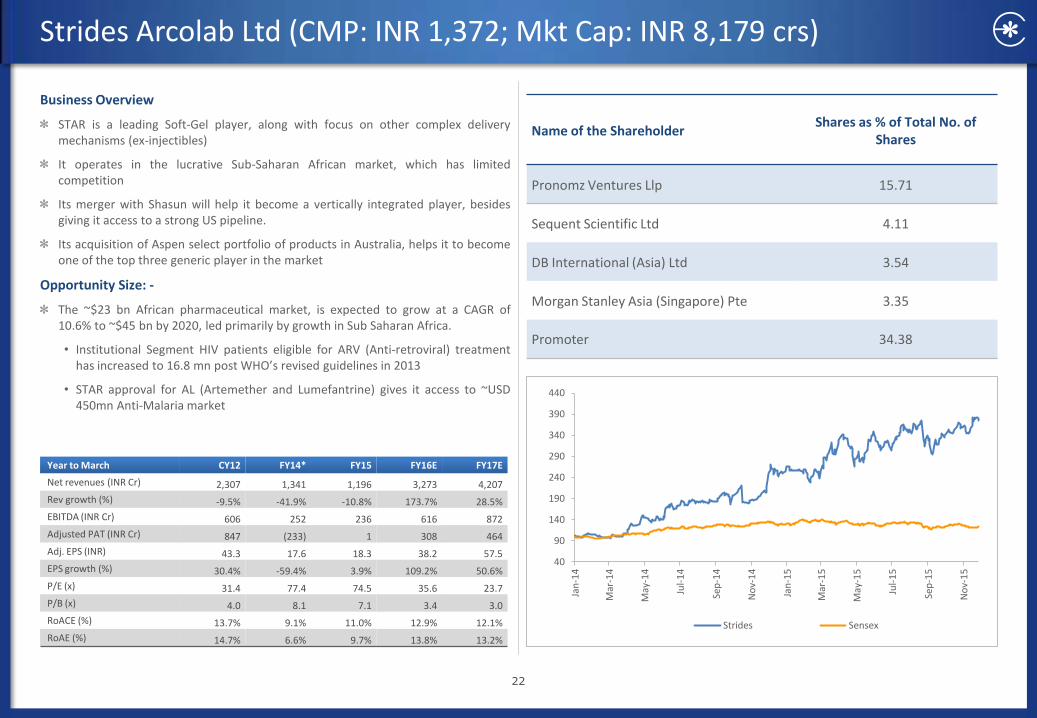
Strides Arcolab Ltd (CMP: INR 1,372; Mkt Cap: INR 8,179 crs)
Business Overview
STAR is a leading Soft-Gel player, along with focus on other complex delivery mechanisms (ex-injectibles)
It operates in the lucrative Sub-Saharan African market, which has limited competition
Its merger with Shasun will help it become a vertically integrated player, besides giving it access to a strong US pipeline.
Its acquisition of Aspen select portfolio of products in Australia, helps it to become one of the top three generic player in the market
Opportunity Size: -
The ~$23 bn African pharmaceutical market, is expected to grow at a CAGR of 10.6% to ~$45 bn by 2020, led primarily by growth in Sub Saharan Africa.
• Institutional Segment HIV patients eligible for ARV (Anti-retroviral) treatment has increased to 16.8 mn post WHO’s revised guidelines in 2013
• STAR approval for AL (Artemether and Lumefantrine) gives it access to ~USD 450mn Anti-Malaria market
Year to March CY12 FY14* FY15 FY16E FY17E
Net revenues (INR Cr) 2,307 1,341 1,196 3,273 4,207
Rev growth (%) -9.5% -41.9% -10.8% 173.7% 28.5%
EBITDA (INR Cr) 606 252 236 616 872
Adjusted PAT (INR Cr) 847 (233) 1 308 464
Adj. EPS (INR) 43.3 17.6 18.3 38.2 57.5
EPS growth (%) 30.4% -59.4% 3.9% 109.2% 50.6%
P/E (x) 31.4 77.4 74.5 35.6 23.7
P/B (x) 4.0 8.1 7.1 3.4 3.0
RoACE (%) 13.7% 9.1% 11.0% 12.9% 12.1%
RoAE (%) 14.7% 6.6% 9.7% 13.8% 13.2%
Name of the Shareholder Shares as % of Total No. of
Shares
Pronomz Ventures Llp 15.71
Sequent Scientific Ltd 4.11
DB International (Asia) Ltd 3.54
Morgan Stanley Asia (Singapore) Pte 3.35
Promoter 34.38
40
90
140
190
240
290
340
390
440
Jan
-14
Mar
-14
May
-14
Jul-
14
Sep
-14
No
v-1
4
Jan
-15
Mar
-15
May
-15
Jul-
15
Sep
-15
No
v-1
5
Strides Sensex

23
Strides Arcolab Ltd (CMP: INR 1,372; Mkt Cap: INR 8,179 crs)
Investment Hypothesis
Shasun acquistion a game changer: To derive significant synergy benefits
● Vertical integration to aid institutional business, yielding higher market share;
● Enhanced product pipeline of non-overlapping molecules in niche and complex segments; and
● Operating synergies will catapult margin. Branded business: Potent growth catalyst on the back of Bafna acquisition and high growth in the African Branded Business Re-entry into the Australian market, expected to be value accretive with higher profitability
Risks
Delay in integration/regulatory clearance for merger with Shasun
Regulatory Risk
Currency risk
Slowdown in funding for institutional business
Peer Comparison
Segmental Revenues
Merged Entity had revenues of INR 24,795 million and reported EBITDA of INR 3,784 million of June 30, 2014
Strides – INR 11,704 million
Shasun – INR 13,091 million
Merged Entity – INR 24,795 million
Institutional Business FDF,
37%
Regulated Markets FDF,
37%
Emerging Markets
Brands, 26%
API, 59%
CRAMs, 25%
Regulated Markets FDF,
16%
API, 31%
Reg Markets FDF, 26%
Institutional Business,
18%
CRAMs, 13%
Emerging Markets FDF,
12%
Deriskedbusiness stream across
verticals
LTM Revenue (June 2014)
Front ending presence in US, Africa, UK and India
38%
39%
24%
Pharma Generics
Institutional Business
Branded Generics
Biogenerics
Company Name
Diluted P/E (x) Diluted
EV/EBITDA (x) ROE (%)
FY16E FY17E FY16E FY17E FY16E FY17E
Strides Arcolab 33.1 22.4 20.6 15.0 17.8 20.0
Ipca Labs 18.9 15.1 12.4 10.0 18.3 19.7
Aurobindo Pharma 19.5 16.8 13.3 11.3 31.6 27.5
Torrent Pharma 21.8 16.2 13.5 10.5 32.6 34.1

24
Sun Pharmaceuticals Ltd (CMP: INR 730; Mkt Cap: INR 1,75,602 crs)
Business Overview
Sun Pharma has a strong track record of turning around distressed assets, Taro acquisition being a prime example
Sun Pharmaceuticals (SUNP) is emerges the numero uno in India with 9.2% market share post Ranbaxy acquisition
Its acquisition of GSK’s opiates business in Australia makes it one of the world’s largest suppliers for analgesics made from raw material opium poppy plants (Controlled Substance)
Opportunity Size: -
Sun-Ranbaxy combined attains leadership position across specialty therapy segments, and 9.2% of the USD 14 bn Indian formulation market
Expands presence in the lucrative EM’s, (USD 250 bn market) growing 9%-11%
Year to March FY13 FY14 FY15 FY16E FY17E
Net revenues (INR Cr) 11,238 16,004 27,286 27,378 32,537
Rev growth (%) 40.3 42.4 70.4 0.3 18.8
EBITDA (INR Cr) 4,974 7,190 8,512 8,518 12,459
Adjusted PAT (INR Cr) 2,983 3,141 4,539 5,127 9,023
Adj. EPS (INR) 17.1 27.3 27.8 24.2 37.5
EPS growth (%) 30.6 59.7 2.0 -13.0 54.8
P/E (x) 52.0 32.5 31.9 36.7 23.7
P/B (x) 12.2 9.9 7.1 6.7 5.5
RoACE (%) 32.8 35.8 27.6 21.1 26.3
RoAE (%) 26.8 34.5 27.4 21.3 25.6
Name of the Shareholder Shares as % of Total No. of
Shares
Viditi Investment Pvt Ltd 8.37
Tejaskiran Pharmachem Industries Pvt Ltd 8.12
Family Investment Pvt Ltd 7.60
LIC of India 2.95
Promoter 54.71
0
50
100
150
200
250
Jan
-14
Mar
-14
May
-14
Jul-
14
Sep
-14
No
v-1
4
Jan
-15
Mar
-15
May
-15
Jul-
15
Sep
-15
No
v-1
5
Sun Pharma Sensex

25
Sun Pharmaceuticals Ltd (CMP: INR 730; Mkt Cap: INR 1,75,602 crs)
Investment Hypothesis
Ranbaxy and GSK’s Opiates business acquisition entails long term value creation
● Ranbaxy’s margin has hit nadir and is the lowest among peers with similar revenues – SUNP’s turnaround capabilities could take it higher
● SUNPs guidance of USD250mm operational synergies appears conservative, but implies BXY’s margins could move to 16-18% in the next three years.
● Besides, upside from RBXY’s key FTFs (Diovan, Nexium, others) could benefit SUNP. There’s more certainty around 53 ANDAs, which are awaiting approval.
In-licensing deal for novel molecule (Tildrakuzumab) – another step in evolution
Risks
Price correction in its Taro portfolio
Delay’s in integration of Ranbaxy and GSK’s Opiates
Peer Comparison
Company Name
Diluted P/E (x) Diluted EV/EBITDA
(x) ROE (%)
FY16E FY17E FY16E FY17E FY16E FY17E
Sun Pharma 26.1 22.5 20.5 17.2 28.1 26.2
Lupin 28.4 22.5 17.7 14.2 27.5 27.4
Cipla 27.8 19.6 17.8 12.8 16.3 19.8
Dr Reddy’s 24.9 18.9 15.4 12.4 20.3 22.7
Sun-Ranbaxy – Highly Complementary Business
Sun Ranbaxy Combined
India (Rx) ****(Chronic) ***(Acute) *****
India (OTC) * **** ****
US Generics ***** *** *****
US Branded (derma) * *** ****
western Europe * ** ***
Eastern Europe – **** ****
Africa – **** ****
Russia/CIS * **** ****
LATAM * *** ***
APAC * *** ***
0
5
10
15
20
25
CY09 CY10 CY11 CY12 CY13 CY14E CY15E CY16E
Ranbaxy's base margins to continue to improve (%)

26
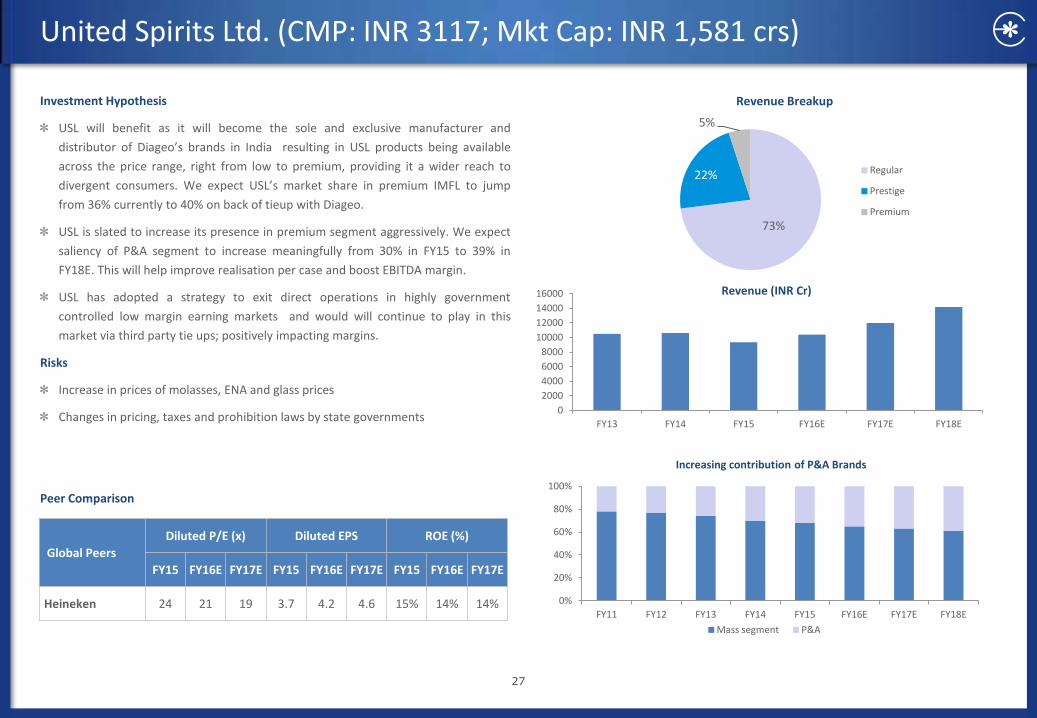
United Spirits Ltd. (CMP: INR 3117; Mkt Cap: INR 1,581 crs)
Business Overview
USL has achieved unparalleled dominance in the IMFL industry, holding 40% market share in terms of volume with 19millionaire brands and has presence across all five segments, viz. whisky, rum, gin, brandy and vodka and has also entered the fast growing wine segment.
The new deal with Diageo has led to creation of strong and enviable products portfolio for USL with USL gaining access to license for manufacturing, distribution/selling of (bulk) products for many key Diageo brands such as VAT 69, Haig Gold Label and Black, Johnnie Walker and related variants, J&B, Ciroc, Baileys, Lagavulin and Talisker as well as Smirnoff & related variants and Captain Morgan rum.
Strong Pan-India manufacturing presence and robust distribution network (75,000 outlets) has resulted in high bargaining power with vendors, suppliers and distributors.
Opportunity Size: -
Although India is the world’s third largest liquor market; majority share is still held by Indian Made Indian Liquor (IMIL) (country liquor) estimated at ~280mn cases in FY14. This portends huge scope for Indian Made Foreign Liquor (IMFL) to grow in India coming from conversion of inexpensive country liquor users to the entry level variants of IMFL. This shift will be led by GDP growth, rise in incomes (particularly in rural areas), increasing aspirations, increase in disposable incomes and health concerns on country liquor consumption.
Year to March FY13 FY14 FY15 FY16E FY17E
Net revenues (INR Cr) 10,411 10,500 9,159 10,375 11,986
Rev growth (%) 14.2 1.1 -12 12.8 15.4
EBITDA (INR Cr) 1,316 511 604 1,211 1,738
Adjusted PAT (INR Cr) -101 -4,489 -1,687 1,075 938
Adj. EPS (INR) 10.7 -80.0 -19.0 36.5 64.5
EPS growth (%) -15.0 0.0 0.0 0.0 76.5
P/E (x) 288.8 -39.0 -163.0 85.1 48.2
P/B (x) 8.1 14.9 68.5 26 16.9
RoACE (%) 10.0 3.5 5.4 20.6 28.4
RoAE (%) 2.7 -30.0 -15.0 44.3 42.5
Name of the Shareholder Shares as % of Total No. of
Shares
Morgan Stanley Asia (Singapore) PTE 2.16
Clsa Global Markets Pte Ltd 1.61
Carmignac Gestion A/C Carmignac Patrimoine
1.56
Kotak Mahindra (International) Ltd 1722968
Promoter 58.87
80
90
100
110
120
130
140
150
160
Jan
-14
Mar
-14
May
-14
Jul-
14
Sep
-14
No
v-1
4
Jan
-15
Mar
-15
May
-15
Jul-
15
Sep
-15
No
v-1
5
United Spirits Sensex
27
United Spirits Ltd. (CMP: INR 3117; Mkt Cap: INR 1,581 crs)
Investment Hypothesis
USL will benefit as it will become the sole and exclusive manufacturer and
distributor of Diageo’s brands in India resulting in USL products being available
across the price range, right from low to premium, providing it a wider reach to
divergent consumers. We expect USL’s market share in premium IMFL to jump
from 36% currently to 40% on back of tieup with Diageo.
USL is slated to increase its presence in premium segment aggressively. We expect
saliency of P&A segment to increase meaningfully from 30% in FY15 to 39% in
FY18E. This will help improve realisation per case and boost EBITDA margin.
USL has adopted a strategy to exit direct operations in highly government
controlled low margin earning markets and would will continue to play in this
market via third party tie ups; positively impacting margins.
Risks
Increase in prices of molasses, ENA and glass prices
Changes in pricing, taxes and prohibition laws by state governments
Peer Comparison
Global Peers
Diluted P/E (x) Diluted EPS ROE (%)
FY15 FY16E FY17E FY15 FY16E FY17E FY15 FY16E FY17E
Heineken 24 21 19 3.7 4.2 4.6 15% 14% 14%
Increasing contribution of P&A Brands
73%
22%
5%
Revenue Breakup
Regular
Prestige
Premium
0%
20%
40%
60%
80%
100%
FY11 FY12 FY13 FY14 FY15 FY16E FY17E FY18E
Mass segment P&A
0
2000
4000
6000
8000
10000
12000
14000
16000
FY13 FY14 FY15 FY16E FY17E FY18E
Revenue (INR Cr)

Edelweiss Focus-12: Performance
Edelweiss Focus-12 have delivered a CAGR return of 33% since inception as against Nifty CAGR return of 11%, translating into an outperformance of 22% (p.a)
On an annualized basis (last 12 months), Focus-12 have delivered a return of 16% per annum as against Nifty return of -7.0%.
Edelweiss Focus-12 NAV: At INR 298 vs Nifty NAV of INR 147
28
80
130
180
230
280
330
380
Feb-1
2
Mar-
12
Apr-
12
May-1
2
Jun-1
2
Jul-
12
Aug-1
2
Sep-1
2
Oct-
12
Nov-1
2
Dec-1
2
Jan-1
3
Feb-1
3
Mar-
13
Apr-
13
May-1
3
Jun-1
3
Jul-
13
Aug-1
3
Sep-1
3
Oct-
13
Nov-1
3
Dec-1
3
Jan-1
4
Feb-1
4
Mar-
14
Apr-
14
May-1
4
Jun-1
4
Jul-
14
Aug-1
4
Sep-1
4
Oct-
14
Nov-1
4
Dec-1
4
Jan-1
5
Feb-1
5
Mar-
15
Apr-
15
May-1
5
Jun-1
5
Jul-
15
Aug-1
5
Sep-1
5
Oct-
15
Nov-1
5
Dec-1
5
Daily Portfolio NAV Daily Benchmark NAV (NIFTY)

Focus-12 Performance
Focus-12 Portfolio Performance
Parameters 1 M 3 M 6 M 9M 12 M ITD (CAGR)
Portfolio Returns -2.3% 0.4% 3.3% 0.8% 16.2% 33.2%
Benchmark Returns -1.6% 2.8% -3.7% -11.8% -7.0% 11.2%
Volatility 14.0% 14.6% 18.6% 19.6% 19.2% 16.7%
Benchmark Volatility 12.2% 14.0% 16.5% 16.6% 16.3% 15.7%
Sharpe Ratio (2.55) (0.44) (0.08) (0.35) 0.71 6.11
Information Ratio (1.25) (1.33) 0.75 1.92 2.46 7.69
Value Composition Sector Composition
29
Pharmaceuticals 11%
BFSI 33%
Infra 7%
Chemical 23%
Auto & Auto Components
2%
Cement 2%
IT 5%
Beverages 17%
Large Cap 38%
Mid Cap 62%
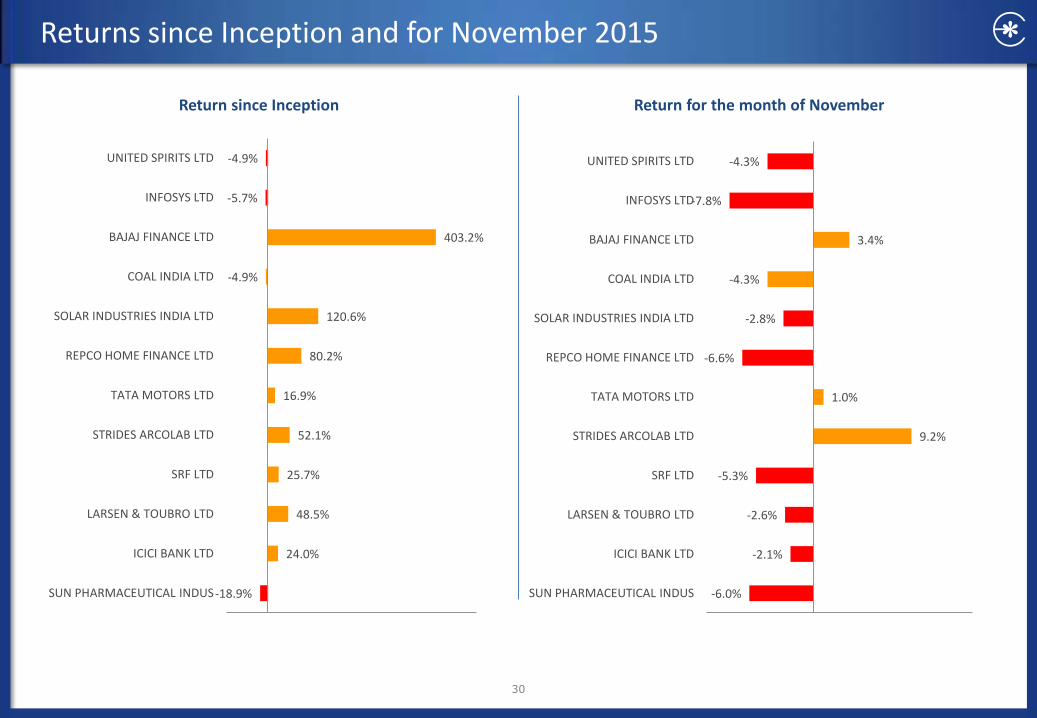
Returns since Inception and for November 2015
30
-6.0%
-2.1%
-2.6%
-5.3%
9.2%
1.0%
-6.6%
-2.8%
-4.3%
3.4%
-7.8%
-4.3%
-10.0% -5.0% 0.0% 5.0% 10.0% 15.0%
SUN PHARMACEUTICAL INDUS
ICICI BANK LTD
LARSEN & TOUBRO LTD
SRF LTD
STRIDES ARCOLAB LTD
TATA MOTORS LTD
REPCO HOME FINANCE LTD
SOLAR INDUSTRIES INDIA LTD
COAL INDIA LTD
BAJAJ FINANCE LTD
INFOSYS LTD
UNITED SPIRITS LTD
Return for the month of November
-18.9%
24.0%
48.5%
25.7%
52.1%
16.9%
80.2%
120.6%
-4.9%
403.2%
-5.7%
-4.9%
-100.0% 0.0% 100.0% 200.0% 300.0% 400.0% 500.0%
SUN PHARMACEUTICAL INDUS
ICICI BANK LTD
LARSEN & TOUBRO LTD
SRF LTD
STRIDES ARCOLAB LTD
TATA MOTORS LTD
REPCO HOME FINANCE LTD
SOLAR INDUSTRIES INDIA LTD
COAL INDIA LTD
BAJAJ FINANCE LTD
INFOSYS LTD
UNITED SPIRITS LTD
Return since Inception
31
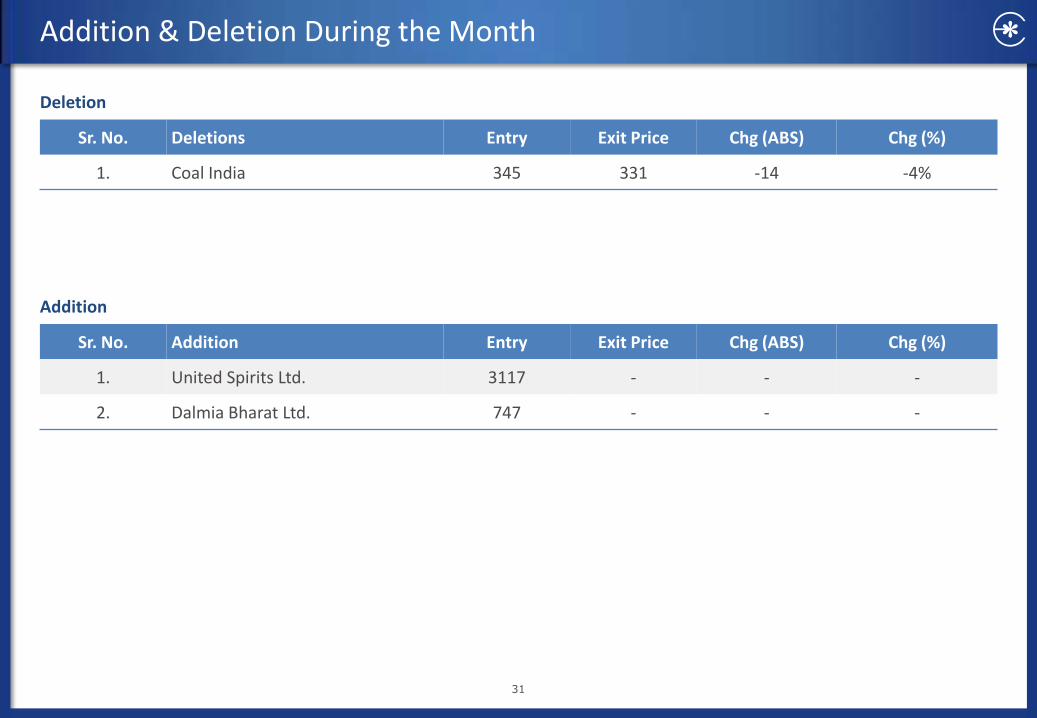
Addition & Deletion During the Month
Sr. No. Deletions Entry Exit Price Chg (ABS) Chg (%)
1. Coal India 345 331 -14 -4%
Deletion
Sr. No. Addition Entry Exit Price Chg (ABS) Chg (%)
1. United Spirits Ltd. 3117 - - -
2. Dalmia Bharat Ltd. 747 - - -
Addition

Edelweiss Focus-12 Deletion History
Exit Date (Beginning Of the Month) Company Name Buy Price Exit Price Return
Jun-12 Tata Steel 471.0 397.9 -15.5%
Sep-12 Glenmark Pharmaceuticals 297.7 426.6 43.3%
Oct-12 Yes Bank 336.2 394.2 17.3%
Oct-12 City Union Bank 37.1 46.1 24.2%
Oct-12 HCL Technologies 437.9 581.2 32.7%
Oct-12 Eros International 204.7 161.6 -21.1%
Oct-12 Bajaj Auto 1610.8 1810.4 12.4%
Oct-12 GSK Consumer 2664.0 3008.5 12.9%
Feb-13 Supreme Industries 282.9 304.1 7.5%
Feb-13 Coromondel international 269.7 227.1 -15.8%
Feb-13 Amara Raja Batteris 221.7 300.6 35.6%
Feb-13 Gateway Distiparks 145.9 134.8 -7.6%
May-13 Astral Poly Technik 120.0 153.9 28.3%
May-13 RAMCO Cement 243.4 242.5 -0.4%
Jul-13 Glenmark Pharmaceuticals 499.8 575.4 15.1%
Jul-13 Lupin 705.6 777.2 10.1%
Jul-13 WABCO India 1605.4 1678.1 4.5%
Jul-13 J&K Bank 161.6 129.8 -19.7%
Aug-13 Bharat Forge 224.2 196.5 -12.4%
Aug-13 Development Credit Bank 48.2 44.3 -8.0%
Sep-13 V-Guard 466.3 507.8 8.9%
Nov-13 KPIT Cummins 130.3 142.3 9.2%
Nov-13 ITC 300.7 328.1 9.1%
Jan-14 Maruti Suzuki 1358.0 1764.0 29.9%
Jan-14 Sobha Developers 301.4 320.2 6.2%
Jan-14 RAMCO Cement 176.2 188.1 6.8%
Apr-14 Lupin 835.0 945.1 13.2%
May-14 Ipca Labs 822.0 760.6 -7.5%
May-14 Wipro 451.0 494.7 9.7%
May-14 Pidilite 255.0 323.9 27.0%
May-14 Infosys 3561.0 2924.5 -17.9%
Aug-14 United Spirits 2499.1 2380.3 -4.8%
Jan-15 Hindalco 156.0 158.0 1.3%
Mar-15 Mindtree 725.0 1411.0 94.6%
May-15 Biocon Ltd 473.0 453.9 -4%
May-15 Zee Entertainment Ltd 228.0 320.9 41%
May-15 Bharat Forge Ltd 472 1254 166%
Aug-15 Bosch Ltd 19736 25387 29%
Sep-15 Motherson Sumi Systems Ltd 122 251 106%
Oct-15 Maruti Suzuki 3726 4365 17%
Dec-15 Coal India 345 328 -5%
32
Private and Confidential
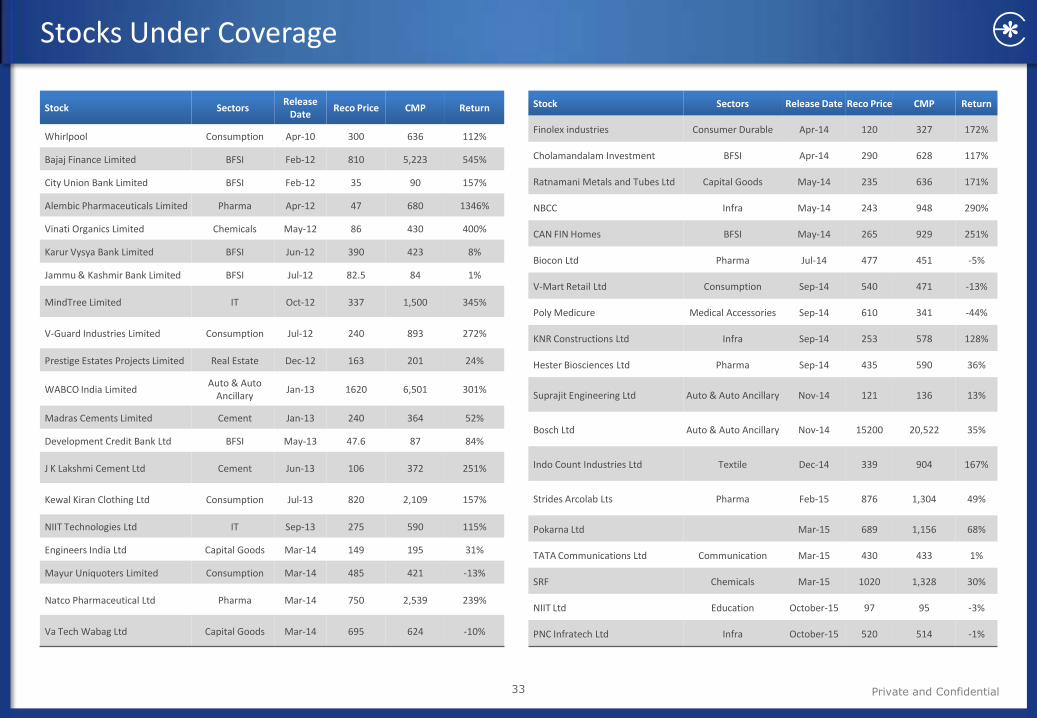
Stocks Under Coverage
Stock Sectors Release
Date Reco Price CMP Return
Whirlpool Consumption Apr-10 300 636 112%
Bajaj Finance Limited BFSI Feb-12 810 5,223 545%
City Union Bank Limited BFSI Feb-12 35 90 157%
Alembic Pharmaceuticals Limited Pharma Apr-12 47 680 1346%
Vinati Organics Limited Chemicals May-12 86 430 400%
Karur Vysya Bank Limited BFSI Jun-12 390 423 8%
Jammu & Kashmir Bank Limited BFSI Jul-12 82.5 84 1%
MindTree Limited IT Oct-12 337 1,500 345%
V-Guard Industries Limited Consumption Jul-12 240 893 272%
Prestige Estates Projects Limited Real Estate Dec-12 163 201 24%
WABCO India Limited Auto & Auto
Ancillary Jan-13 1620 6,501 301%
Madras Cements Limited Cement Jan-13 240 364 52%
Development Credit Bank Ltd BFSI May-13 47.6 87 84%
J K Lakshmi Cement Ltd Cement Jun-13 106 372 251%
Kewal Kiran Clothing Ltd Consumption Jul-13 820 2,109 157%
NIIT Technologies Ltd IT Sep-13 275 590 115%
Engineers India Ltd Capital Goods Mar-14 149 195 31%
Mayur Uniquoters Limited Consumption Mar-14 485 421 -13%
Natco Pharmaceutical Ltd Pharma Mar-14 750 2,539 239%
Va Tech Wabag Ltd Capital Goods Mar-14 695 624 -10%
Stock Sectors Release Date Reco Price CMP Return
Finolex industries Consumer Durable Apr-14 120 327 172%
Cholamandalam Investment BFSI Apr-14 290 628 117%
Ratnamani Metals and Tubes Ltd Capital Goods May-14 235 636 171%
NBCC Infra May-14 243 948 290%
CAN FIN Homes BFSI May-14 265 929 251%
Biocon Ltd Pharma Jul-14 477 451 -5%
V-Mart Retail Ltd Consumption Sep-14 540 471 -13%
Poly Medicure Medical Accessories Sep-14 610 341 -44%
KNR Constructions Ltd Infra Sep-14 253 578 128%
Hester Biosciences Ltd Pharma Sep-14 435 590 36%
Suprajit Engineering Ltd Auto & Auto Ancillary Nov-14 121 136 13%
Bosch Ltd Auto & Auto Ancillary Nov-14 15200 20,522 35%
Indo Count Industries Ltd Textile Dec-14 339 904 167%
Strides Arcolab Lts Pharma Feb-15 876 1,304 49%
Pokarna Ltd Mar-15 689 1,156 68%
TATA Communications Ltd Communication Mar-15 430 433 1%
SRF Chemicals Mar-15 1020 1,328 30%
NIIT Ltd Education October-15 97 95 -3%
PNC Infratech Ltd Infra October-15 520 514 -1%
33

Disclaimer
34
Edelweiss Broking Limited (“EBL” or “Research Entity”) is regulated by the Securities and Exchange Board of India (“SEBI”) and is licensed to carry on the business of broking, depository services and related activities. The business of EBL and its Associates (list available on www.edelweissfin.com) are organized around five broad business groups – Credit including Housing and SME Finance, Commodities, Financial Markets, Asset Management and Life Insurance. Broking services offered by Edelweiss Broking Limited under SEBI Registration No.: INZ000005231; Name of the Compliance Officer: Mr. Dhirendra Rautela, Email ID: [email protected] Corporate Office: Edelweiss House, Off CST Road, Kalina, Mumbai - 400098; Tel. (022) 4009 4400/ 4088 5757/4088 6278 This Report has been prepared by Edelweiss Broking Limited in the capacity of a Research Analyst having SEBI Registration No.INH000000172 and distributed as per SEBI (Research Analysts) Regulations 2014. This report does not constitute an offer or solicitation for the purchase or sale of any financial instrument or as an official confirmation of any transaction. The information contained herein is from publicly available data or other sources believed to be reliable. This report is provided for assistance only and is not intended to be and must not alone be taken as the basis for an investment decision. The user assumes the entire risk of any use made of this information. Each recipient of this report should make such investigation as it deems necessary to arrive at an independent evaluation of an investment in the securities of companies referred to in this document (including the merits and risks involved), and should consult his own advisors to determine the merits and risks of such investment. The investment discussed or views expressed may not be suitable for all investors. This information is strictly confidential and is being furnished to you solely for your information. This information should not be reproduced or redistributed or passed on directly or indirectly in any form to any other person or published, copied, in whole or in part, for any purpose. This report is not directed or intended for distribution to, or use by, any person or entity who is a citizen or resident of or located in any locality, state, country or other jurisdiction, where such distribution, publication, availability or use would be contrary to law, regulation or which would subject EBL and associates / group companies to any registration or licensing requirements within such jurisdiction. The distribution of this report in certain jurisdictions may be restricted by law, and persons in whose possession this report comes, should observe, any such restrictions. The information given in this report is as of the date of this report and there can be no assurance that future results or events will be consistent with this information. This information is subject to change without any prior notice. EBL reserves the right to make modifications and alterations to this statement as may be required from time to time. EBL or any of its associates / group companies shall not be in any way responsible for any loss or damage that may arise to any person from any inadvertent error in the information contained in this report. EBL is committed to providing independent and transparent recommendation to its clients. Neither EBL nor any of its associates, group companies, directors, employees, agents or representatives shall be liable for any damages whether direct, indirect, special or consequential including loss of revenue or lost profits that may arise from or in connection with the use of the information. Our proprietary trading and investment businesses may make investment decisions that are inconsistent with the recommendations expressed herein. Past performance is not necessarily a guide to future performance .The disclosures of interest statements incorporated in this report are provided solely to enhance the transparency and should not be treated as endorsement of the views expressed in the report. The information provided in these reports remains, unless otherwise stated, the copyright of EBL. All layout, design, original artwork, concepts and other Intellectual Properties, remains the property and copyright of EBL and may not be used in any form or for any purpose whatsoever by any party without the express written permission of the copyright holders. EBL shall not be liable for any delay or any other interruption which may occur in presenting the data due to any reason including network (Internet) reasons or snags in the system, break down of the system or any other equipment, server breakdown, maintenance shutdown, breakdown of communication services or inability of the EBL to present the data. In no event shall EBL be liable for any damages, including without limitation direct or indirect, special, incidental, or consequential damages, losses or expenses arising in connection with the data presented by the EBL through this report. We offer our research services to clients as well as our prospects. Though this report is disseminated to all the customers simultaneously, not all customers may receive this report at the same time. We will not treat recipients as customers by virtue of their receiving this report. EBL and its associates, officer, directors, and employees, research analyst (including relatives) worldwide may: (a) from time to time, have long or short positions in, and buy or sell the securities thereof, of company(ies), mentioned herein or (b) be engaged in any other transaction involving such securities and earn brokerage or other compensation or act as a market maker in the financial instruments of the subject company/company(ies) discussed herein or act as advisor or lender/borrower to such company(ies) or have other potential/material conflict of interest with respect to any recommendation and related information and opinions at the time of publication of research report or at the time of public appearance. EBL may have proprietary long/short position in the above mentioned scrip(s) and therefore should be considered as interested. The views provided herein are general in nature and do not consider risk appetite or investment objective of any particular investor; readers are requested to take independent professional advice before investing. This should not be construed as invitation or solicitation to do business with EBL. EBL or its associates may have received compensation from the subject company in the past 12 months. EBL or its associates may have managed or co-managed public offering of securities for the subject company in the past 12 months. EBL or its associates may have received compensation for investment banking or merchant banking or brokerage services from the subject company in the past 12 months. EBL or its associates may have received any compensation for products or services other than investment banking or merchant banking or brokerage services from the subject company in the past 12 months. EBL or its associates have not received any compensation or other benefits from the Subject Company or third party in connection with the research report. Research analyst or his/her relative or EBL’s associates may have financial interest in the subject company. EBL, its associates, research analyst and his/her relative may have other potential/material conflict of interest with respect to any recommendation and related information and opinions at the time of publication of research report or at the time of public appearance. Research analyst has served as an officer, director or employee of subject Company: No EBL has financial interest in the subject companies: No EBL’s Associates may have actual / beneficial ownership of 1% or more securities of the subject company at the end of the month immediately preceding the date of publication of research report. Research analyst or his/her relative has actual/beneficial ownership of 1% or more securities of the subject company at the end of the month immediately preceding the date of publication of research report: No EBL has actual/beneficial ownership of 1% or more securities of the subject company at the end of the month immediately preceding the date of publication of research report: No Subject company may have been client during twelve months preceding the date of distribution of the research report. There were no instances of non-compliance by EBL on any matter related to the capital markets, resulting in significant and material disciplinary action during the last three years. A graph of daily closing prices of the securities is also available at www.nseindia.com Analyst Certification: The analyst for this report certifies that all of the views expressed in this report accurately reflect his or her personal views about the subject company or companies and its or their securities, and no part of his or her compensation was, is or will be, directly or indirectly related to specific recommendations or views expressed in this report. Additional Disclaimer for U.S. Persons. Edelweiss is not a registered broker – dealer under the U.S. Securities Exchange Act of 1934, as amended (the“1934 act”) and under applicable state laws in the United States. In addition Edelweiss is not a registered investment adviser under the U.S. Investment Advisers Act of 1940, as amended (the "Advisers Act" and together with the 1934 Act, the "Acts), and under applicable state laws in the United States. Accordingly, in the absence of specific exemption under the Acts, any brokerage and investment services provided by Edelweiss, including the products and services described herein are not available to or intended for U.S. persons. This report does not constitute an offer or invitation to purchase or subscribe for any securities or solicitation of any investments or investment services and/or shall not be considered as an advertisement tool. "U.S. Persons" are generally defined as a natural person, residing in the United States or any entity organized or incorporated under the laws of the United States. US Citizens living abroad may also be deemed "US Persons" under certain rules. Transactions in securities discussed in this research report should be effected through Edelweiss Financial Services Inc. Additional Disclaimer for U.K. Persons. The contents of this research report have not been approved by an authorised person within the meaning of the Financial Services and Markets Act 2000 ("FSMA"). In the United Kingdom, this research report is being distributed only to and is directed only at (a) persons who have professional experience in matters relating to investments falling within Article 19(5) of the FSMA (Financial Promotion) Order 2005 (the “Order”); (b) persons falling within Article 49(2)(a) to (d) of the Order (including high net worth companies and unincorporated associations); and (c) any other persons to whom it may otherwise lawfully be communicated (all such persons together being referred to as “relevant persons”). This research report must not be acted on or relied on by persons who are not relevant persons. Any investment or investment activity to which this research report relates is available only to relevant persons and will be engaged in only with relevant persons. Any person who is not a relevant person should not act or rely on this research report or any of its contents. This research report must not be distributed, published, reproduced or disclosed (in whole or in part) by recipients to any other person. Additional Disclaimer for Canadian Persons Edelweiss is not a registered adviser or dealer under applicable Canadian securities laws nor has it obtained an exemption from the adviser and/or dealer registration requirements under such law. Accordingly, any brokerage and investment services provided by Edelweiss, including the products and services described herein, are not available to or intended for Canadian persons. This research report and its respective contents do not constitute an offer or invitation to purchase or subscribe for any securities or solicitation of any investments or investment services.