focus on: birmingham parsons green and … · residential research market update forecasts...
TRANSCRIPT

RESIDENTIAL RESEARCH
RESIDENTIAL STATISTICSMARKET UPDATE FORECASTS
FOCUS ON: PARSONS GREEN 2016
BIRMINGHAM AND SURROUNDS RESIDENTIAL MARKET INSIGHT 2018
RESIDENTIAL RESEARCH
2
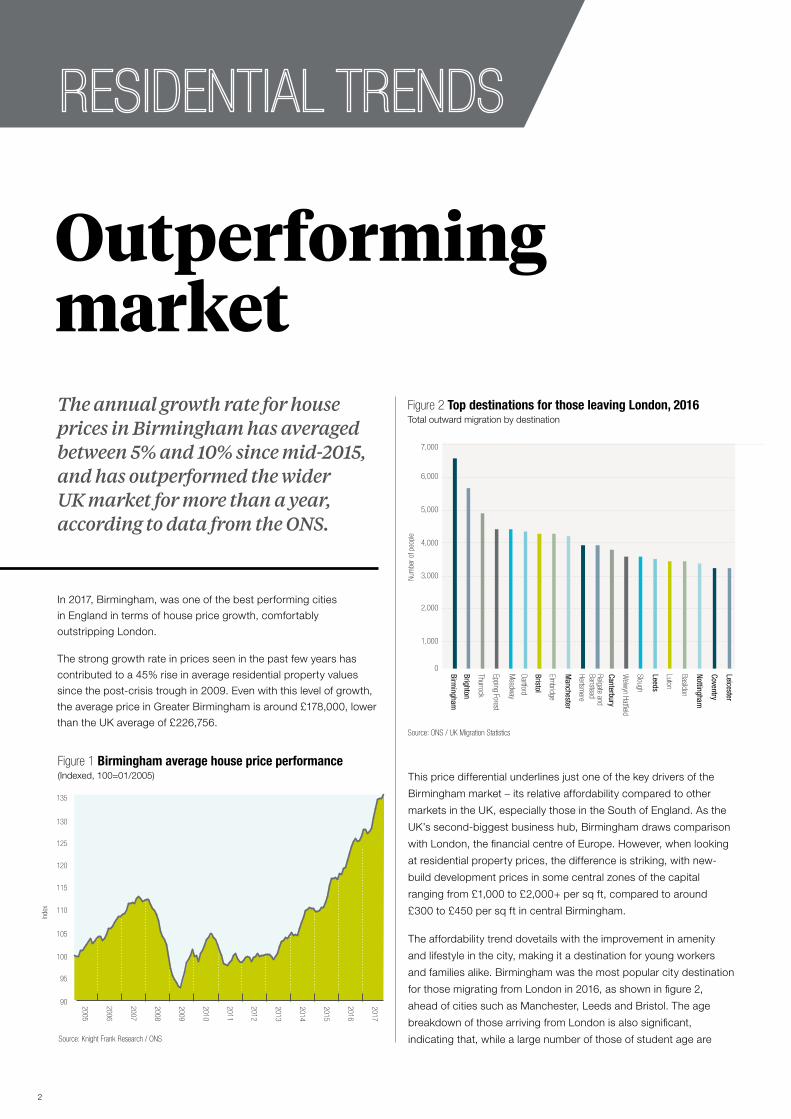
Figure 2 Top destinations for those leaving London, 2016 Total outward migration by destination
Source: ONS / UK Migration Statistics
Num
ber o
f peo
ple
Birmingham
Brighton
Thurrock
Epping Forest
Meadway
Dartford
Bristol
Elmbridge
Manchester
Hertsmere
Reigate and Banstead
Canterbury
Welwyn Hatfield
Slough
Leeds
Luton
Basildon
Nottingham
Coventry
Leicester
0
1,000
2,000
3,000
4,000
5,000
6,000
7,000
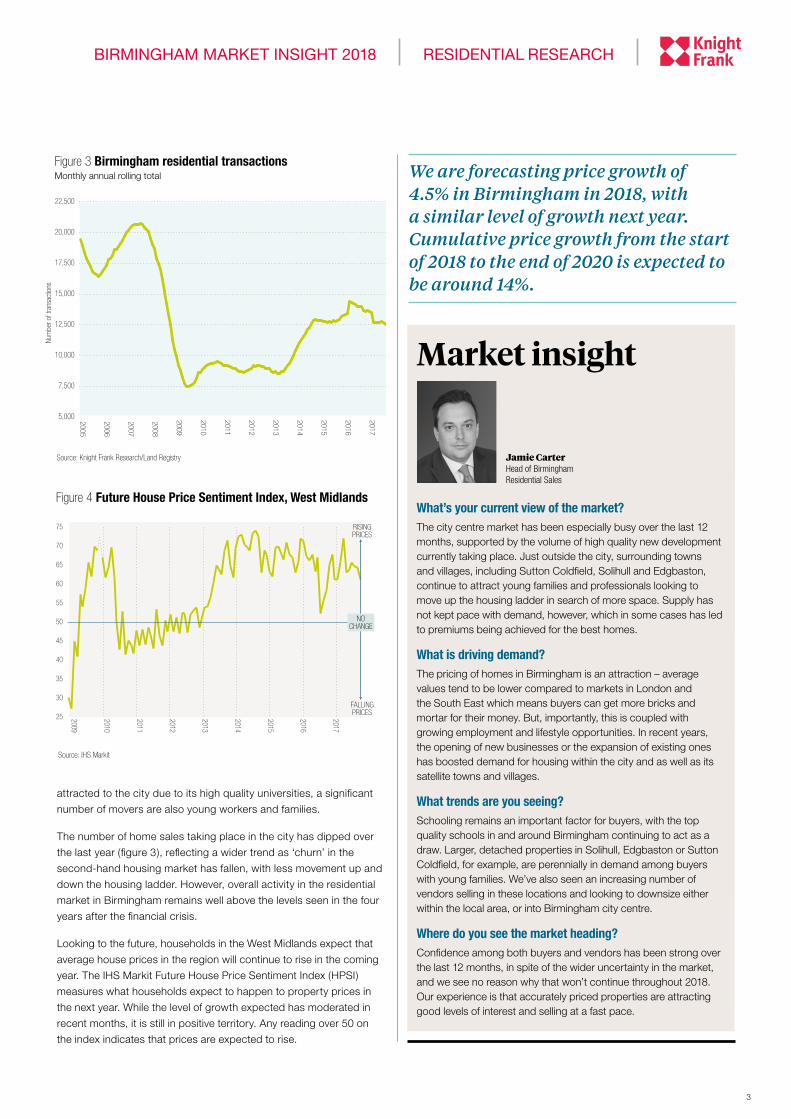
Source: Knight Frank Research / ONS
Figure 1 Birmingham average house price performance (Indexed, 100=01/2005)
The annual growth rate for house prices in Birmingham has averaged between 5% and 10% since mid-2015, and has outperformed the wider UK market for more than a year, according to data from the ONS.
In 2017, Birmingham, was one of the best performing cities
in England in terms of house price growth, comfortably
outstripping London.
The strong growth rate in prices seen in the past few years has
contributed to a 45% rise in average residential property values
since the post-crisis trough in 2009. Even with this level of growth,
the average price in Greater Birmingham is around £178,000, lower
than the UK average of £226,756.
Outperforming market
This price differential underlines just one of the key drivers of the
Birmingham market – its relative affordability compared to other
markets in the UK, especially those in the South of England. As the
UK’s second-biggest business hub, Birmingham draws comparison
with London, the financial centre of Europe. However, when looking
at residential property prices, the difference is striking, with new-
build development prices in some central zones of the capital
ranging from £1,000 to £2,000+ per sq ft, compared to around
£300 to £450 per sq ft in central Birmingham.
The affordability trend dovetails with the improvement in amenity
and lifestyle in the city, making it a destination for young workers
and families alike. Birmingham was the most popular city destination
for those migrating from London in 2016, as shown in figure 2,
ahead of cities such as Manchester, Leeds and Bristol. The age
breakdown of those arriving from London is also significant,
indicating that, while a large number of those of student age are
BIRMINGHAM MARKET INSIGHT 2018In
dex
2005
2006
2007
2008
2009
2010
2011
2012
2013
2014
2015
2016
2017
90
95
100
105
110
115
120
125
130
135
3
Jamie CarterHead of Birmingham Residential Sales
What’s your current view of the market?The city centre market has been especially busy over the last 12 months, supported by the volume of high quality new development currently taking place. Just outside the city, surrounding towns and villages, including Sutton Coldfield, Solihull and Edgbaston, continue to attract young families and professionals looking to move up the housing ladder in search of more space. Supply has not kept pace with demand, however, which in some cases has led to premiums being achieved for the best homes.
What is driving demand?The pricing of homes in Birmingham is an attraction – average values tend to be lower compared to markets in London and the South East which means buyers can get more bricks and mortar for their money. But, importantly, this is coupled with growing employment and lifestyle opportunities. In recent years, the opening of new businesses or the expansion of existing ones has boosted demand for housing within the city and as well as its satellite towns and villages.
What trends are you seeing?Schooling remains an important factor for buyers, with the top quality schools in and around Birmingham continuing to act as a draw. Larger, detached properties in Solihull, Edgbaston or Sutton Coldfield, for example, are perennially in demand among buyers with young families. We’ve also seen an increasing number of vendors selling in these locations and looking to downsize either within the local area, or into Birmingham city centre.
Where do you see the market heading?Confidence among both buyers and vendors has been strong over the last 12 months, in spite of the wider uncertainty in the market, and we see no reason why that won’t continue throughout 2018. Our experience is that accurately priced properties are attracting good levels of interest and selling at a fast pace.
We are forecasting price growth of 4.5% in Birmingham in 2018, with a similar level of growth next year. Cumulative price growth from the start of 2018 to the end of 2020 is expected to be around 14%.
Figure 4 Future House Price Sentiment Index, West Midlands
Source: IHS Markit
Market insight
attracted to the city due to its high quality universities, a significant
number of movers are also young workers and families.
The number of home sales taking place in the city has dipped over
the last year (figure 3), reflecting a wider trend as ‘churn’ in the
second-hand housing market has fallen, with less movement up and
down the housing ladder. However, overall activity in the residential
market in Birmingham remains well above the levels seen in the four
years after the financial crisis.
Looking to the future, households in the West Midlands expect that
average house prices in the region will continue to rise in the coming
year. The IHS Markit Future House Price Sentiment Index (HPSI)
measures what households expect to happen to property prices in
the next year. While the level of growth expected has moderated in
recent months, it is still in positive territory. Any reading over 50 on
the index indicates that prices are expected to rise.
Figure 3 Birmingham residential transactions Monthly annual rolling total
Source: Knight Frank Research/Land Registry
BIRMINGHAM MARKET INSIGHT 2018 RESIDENTIAL RESEARCHN
umbe
r of t
rans
actio
ns
5,000
7,500
10,000
12,500
15,000
17,500
20,000
22,500
2017
2016
2015
2014
2013
2012
2011
2010
2009
2008
2007
2006
200525
30
35
40
45
50
55
60
65
70
75 RISINGPRICES
FALLINGPRICES2017
2016
2015
2014
2013
2012
2011
2010
2009
NOCHANGE

4
In 2017, the EU referendum
result was still very fresh. Little
ground had been covered politically,
so the focus was on economics, with many a
gloomy prognosis shared.
Eighteen months later, however, the balance has
shifted. The machinations of the ‘leave process’ have
taken centre stage, while the economy has largely
failed to provide the drama headline writers hoped for.
In fact, initial estimates suggest economic growth of 1.8%
was seen in 2017, with 1.4% growth forecast in 2018. This is
somewhat below trend, but hardly disastrous. Indeed, recent
news flow has been surprisingly positive: UK unemployment
has fallen to the lowest level since the mid-1970s, while the West
Midlands saw workforce jobs increase by 148,000 over the year
to September 2017, the biggest rise in the UK by some margin. This
chimes with recent data that shows that UK enterprise formation
continues to grow at a healthy clip, but the picture for Birmingham is
even more positive: the number of active businesses is up by 13.5% on
2016 levels, three times the UK growth rate.
“ The West Midlands saw workforce jobs increase by 148,000 over the year to
September 2017, the biggest rise in the UK by some margin.”
Economic Market Outlook
SOLIHULL TOWN CENTRE
BIRMINGHAM MARKET INSIGHT 2018

5
The pace and the scale of economic growth in the region has been significant over the past year. The level of new enterprises created demonstrates how the area is an alternative to London as a business hub.
HSBC is establishing a retail headquarters in Birmingham while Deutsche Bank already has a trading floor and back office jobs in the city. HMRC has announced plans to move a large number of staff to the city centre from 2020.
“ The pace and the scale of economic growth in the region has been significant over the past year.
The city is also receiving billions of pounds of infrastructure investment, with new tram lines, office blocks and public squares planned as the city centre is remodelled. Two High Speed 2 (HS2) railway stations are being built in central Birmingham and nearby Solihull, which will dramatically cut journey times to and from the capital.
News that Birmingham has been selected as a host city partner of the 2022 Commonwealth Games is likely to bring further economic and social benefits.
A growing population, improved transport and a step-change in amenity, career opportunities and lifestyle underpin the demand for homes in and around Birmingham.
The number of people living in Birmingham will rise by 171,000 to 1.3 million by 2039,
according to the latest official population projections. This translates into nearly 100,000 additional households being created over the next two decades or so.
Given the uplift in both job creation, amenity, transport and population, the demand for both city-centre living, and property in the towns and villages surrounding Birmingham, is expected to continue to grow.
BRACEBRIDGE ROAD, SUTTON COLDFIELD
BIRMINGHAM MARKET INSIGHT 2018 RESIDENTIAL RESEARCH
Host citypartner of the 2022Commonwealth Games
1
Two HS2 stationsin central Birmingham and Solihull
1.3 millionforecast population of Birmingham by 2039
148,000 new jobsover the year to September 2017(West Midlands)
RemodelledCity centre
2 3

6
Residential transactions, Birmingham Monthly, unadjusted
Annual price growth, 2017
Annual change in house prices
Age of those moving to Birmingham from London UK Migration data, 2016
Forecast: Birmingham house prices
Knight Frank Tenant Survey % of respondents who said they expect to be renting in three years’ time
Source: DCLG
Source: Nationwide
Source: ONS
Source: Knight Frank Research / ONS
Source: Knight Frank Research / ONS Data
Source: Knight Frank Tenant Survey
250
500
750
1,000
1,250
1,500
1,750
2,000
2017
2016
2015
2014
2013
2012
2011
2010
2009
2008
2007
2006
2005
2022
2021
2020
2019
2018
2017
5.0%
5.0%
4.5%
4.5%
4.5%
7.4%
Annu
al ch
ange
Under1419%
15-1918%
20-2420%
25-2912%
30-3411%
35-4411%
45-596%
60+
2%
-20
-15
-10
-5
0
5
10
15
% c
hang
e
Birmingham annual % change UK annual % change
2017
2016
2015
2014
2013
2012
2011
2010
2009
2008
2007
2006
2005
2.6%
0.2%
1.8%
4.6%
2.3%
2.0%
-0.5%
4.8%
5.2%
4.0%
3.3%
4.8%
68.77%West Midlands
67.68%UK
BIRMINGHAM MARKET INSIGHT 2018
6

7
Average £psf Based on transactions in the 3 years to December 2017
Average pound per square foot values are calculated by matching EPC data to Land Registry sales records. As the map shows, there is a wide variation across Birmingham and its surrounding area, with higher values achieved in satellite towns and villages neighbouring the city, including in Solihull, Sutton Coldfield and Edgbaston.
Seasonality plays a large role in property markets, with activity traditionally peaking in the second half of the year (Q3 and Q4). However, changes to property taxation and political events also influence activity. For example, Q1 2016 was unseasonably busy as buyers looked to complete transactions ahead of the stamp duty increase for those purchasing additional properties.
The majority of sales which took place in Birmingham and its surrounding areas over the 3 years to December 2017 were for properties valued up to £300,000.
Transaction volumes and pricing data
Property sales Achieved prices, 3 years to December 2017
Source: Land Registry / EPC Source: Land Registry
Source: Land Registry
0
1,000
2,000
3,000
4,000
5,000
£0
£50,000
£100,000
£150,000
£200,000
£250,000
201720162015201420132012201120102009Q1 Q2 Q3 Q4 Q1 Q2 Q3 Q4 Q1 Q2 Q3 Q4 Q1 Q2 Q3 Q4 Q1 Q2 Q3 Q4 Q1 Q2 Q3 Q4 Q1 Q2 Q3 Q4 Q1 Q2 Q3 Q4 Q1 Q2 Q3
Tran
sact
ions
Average Sale Price
Transactions Average Sale Price
Contains OS data © Crown Copyright and database right 2017
Birmingham
Edgbaston
Solihull
Sutton Coldfield
Up to £125
£125 - £150
£150 - £200
£200 - £300
£300+
Up to £200,000
£200,000 - £300,000
£300,000 - £500,000
£500,000 - £1,000,000
£1,000,000+
BIRMINGHAM MARKET INSIGHT 2018 RESIDENTIAL RESEARCH
7

Worcester Market Insight Report - 2017
Country View 2018Contains OS data © Crown Copyright and database right 2017
Sale Prices3 years to Aug 2017
Sub £150,000
£150,000 - £225,000
£225,000 - £300,000
£300,000 - £400,000
£400,000+
WORCESTER SALES MARKET INSIGHT - 2017
Prime Market Update
Since the financial crisis, a trend
seen across housing markets in
the UK has been the rise of prime
town and city locations, many
of which have outperformed the
wider prime market. Access to
good transport links, amenities
and good schooling – both state
Source: Knight Frank Research Source: Land Registry
FIGURE 1
Worcester: Fact file
Detached
Semi-detached
Terrace
Flat
Bungalow 4%
14%
26%
35%
22%
2000-present
1973-1999
1945-1972
1900-1939
Pre-1900 17%
16%
27%
32%
8%
FIGURE 4
Property prices in Worcester Achieved prices, 3 years to August 2017
Shelley Stephenson, Worcester Town Sales“ There has been much regeneration in Worcester over the last year which is really helping to underpin demand. The multi-million pound Cathedral Square redevelopment has brought seven new restaurants to the city, as well as shops and a gym, built around a new public square. Further development is also planned, with the opening of Worcester Parkway station in 2018 set to improve links to London and the surrounding area. Excellent schooling remains a key draw for many buyers, as is the value in comparison with similar towns and cities nearby.”
and private – has driven demand in such locations and helped underpin pricing. Worcester has been no exception. Sale prices in the town have risen by just under 5% in the past year, well above the 0.2% growth seen across the prime market over that time. Over the past five years, prices have risen by around 23%.
+4.5% price change in the year to August 2017 +23.1% price change in the five years to
August 2017
FIGURE 2
Property type Worcester, all stock
FIGURE 3
Property age Worcester, all stock
THE FINEST PROPERTIES FROM AROUND THE ENGLISH COUNTRYSIDETHE FINEST PROPERTIES FROM AROUND THE ENGLISH COUNTRYSIDEKnightFrank.com/Country
VIEWCOUNTRY
Prime Country Index Q4 2017
Market updatePrime country prices remained broadly flat in 2017, with a 0.4% rise during the year, after a 0.2% fall in the final quarter.
However, demand has remained steady over this time, with Knight Frank figures showing a 1.2% increase in the number of new prospective buyers registering their interest in buying a home between January and November, and a 4% increase in the number of viewings conducted over the same period. This may only be a marginal rise, but it has come against a backdrop of uncertainty.
Stock levels tightenThis modest rise in demand has also coincided with a lack of new stock being offered for sale – indeed, agents note that this has been one of the most challenging aspects of the market in 2017. Higher rates of stamp duty, a slowdown in economic growth and wider political uncertainty mean that vendors have been prepared to take a ‘wait and see’ approach.
An analysis of listings data shows there were 6.8% fewer homes worth over £1 million launched onto the market in England and Wales, excluding London, so far this year compared with 2016. Above £2 million, the fall was even more pronounced at 16.9%.
East Midlands, West Midlands and Yorkshire were the only regions to see an increase in the number of £1m+ homes put up for sale in 2017 compared with the previous year, in the Midlands this coincided with a pick-up in price growth, especially in urban areas. In the South East, which is usually home to the highest number of £1m+ sales outside of London, there was a 9% fall in new prime listings, as shown in figure 1.
OutlookKnight Frank sales volumes outside of London rose by 4.9% year-on-year between January and November 2017, however any continued decline in stock levels at the top end of the market could weigh on transactions into 2018.
Overall, we are forecasting price growth in prime markets across England and Wales of 1.5% in 2018 and of 2.0% in 2019.
Town and city markets, which have been the strongest performers over the last few years both in terms of price growth and activity, are expected to post some outperformance in the next year or so, but the relative value now offered by more rural markets could mean we start to see a reversal of this trend as the forecast period progresses.
RESIDENTIAL RESEARCH
PRIME COUNTRY HOUSE INDEX Q4 2017
2016 2017
0
2,000
4,000
6,000
8,000
10,000
12,000
14,000
WalesEastMidlands
WestMidlands
Yorkshire andThe Humber
NorthSouth WestEast ofEngland
South East
Num
ber o
f pro
pert
ies
Source: Knight Frank Research / Rightmove
PRIME PRICES RISE 0.4% IN 2017 Price growth in prime markets was subdued in 2017, according to our latest index.
FIGURE 1
New supply falling by region (£1m+)
Key factsPrime property prices in England and Wales fell by 0.2% in the final quarter of 2017
On an annual basis, prices ended the year 0.4% higher
There were 6.8% fewer homes worth over £1 million launched onto the market so far this year compared with 2016
We are forecasting price growth in prime markets across England and Wales of 1.5% in 2018
OLIVER KNIGHT Associate
“ The number of new homes being offered for sale in prime markets outside of London fell in 2017 compared with the previous year, despite indications that demand remains robust with a pick-up in both new prospective buyers and viewings.”
RECENT MARKET-LEADING RESIDENTIAL PUBLICATIONS
UK Housing Market Forecast - Dec 2017
Residential Market Update Jan 2018
Knight Frank The Birmingham Report
1
THE
REPORT
RESIDENTIAL RESEARCH
UK RESIDENTIAL MARKET FORECAST
“ The market is localised and we see slightly stronger growth in the Midlands, East of England and the North West, a continuation of the trend that has emerged this year.”
For the latest news, views and analysis on the world of prime property, visit our blog or @kfintelligence
UK HOUSE PRICE FORECASTUK house price growth has moderated from recent peaks, although markets remain highly localised.
Headlines Dec 2017UK house price growth has been slowing since the summer of 2014, although the annual change remains positive
Price growth across the UK is expected to be 1.0% in 2018, reaching 14.2% cumulatively between 2018 and 2022
In London, prices are forecast to fall by 0.5% in 2018, but cumulative price growth over the next five years is positive at 13.1%
2017-2022 Forecasts, December 2017
2017 2018 2019 2020 2021 2022 2018 - 2022Mainstream residential sales markets
UK 1.5% 1.0% 2.0% 3.0% 3.5% 4.0% 14.2%
London -1.0% -0.5% 2.5% 3.0% 3.5% 4.0% 13.1%
North East 2.0% 2.0% 2.0% 4.0% 3.0% 3.0% 14.8%
North West 2.0% 1.0% 2.0% 4.0% 4.0% 4.5% 16.4%
Yorks & Humber 0.5% 1.0% 2.0% 3.0% 3.0% 3.0% 12.6%
East Midlands 4.5% 2.0% 2.5% 2.5% 3.0% 3.5% 14.2%
West Midlands 4.5% 2.0% 2.0% 3.0% 3.0% 4.0% 14.8%
East 1.0% 2.0% 3.0% 3.0% 4.0% 3.0% 15.9%
South East 3.0% 0.0% 2.0% 3.0% 4.0% 4.5% 14.2%
South West 4.0% 1.0% 2.0% 2.5% 3.5% 4.5% 14.2%
Wales 1.5% 1.5% 1.5% 2.5% 3.0% 4.0% 13.1%
Scotland 1.5% 1.0% 1.0% 2.5% 3.5% 3.5% 12.0%
Prime residential sales markets
Prime central London east 0.0% 0.5% 1.5% 2.5% 3.0% 5.0% 13.1%
Prime central London west 0.0% 0.5% 1.5% 3.5% 3.0% 3.5% 12.6%
Prime outer London -1.0% 0.0% 1.0% 3.0% 3.5% 4.5% 12.5%
Prime England & Wales 0.7% 1.5% 2.0% 2.0% 2.0% 2.0% 9.9%
Residential rental markets
UK 1.2% 2.5% 2.5% 2.5% 3.0% 3.0% 14.0%
London 0.7% 3.0% 2.5% 3.0% 3.0% 3.0% 15.0%
Prime central London -1.5% 0.5% 1.5% 2.5% 3.0% 3.0% 11.0%
Prime outer London -3.5% -1.0% 1.0% 2.0% 2.5% 3.0% 8.0%
The momentum in house price growth is slowing in many parts of the country, and we expect price rises to remain muted overall next year amid increased economic and political uncertainty in the run-up to Brexit and amid more muted forecasts for wage growth. The market is localised and we see slightly stronger growth in the Midlands, East of England and the North West, a continuation of the trend that has emerged this year.
Once the Brexit deal is completed, we forecast rising momentum across the market, with price growth reflecting this in many locations. The variations currently
Source: Knight Frank Research NB. Price forecasts are for existing homes. Property values in the new-build market may perform differently.
observed in the prime housing markets in London and beyond are set to continue, and we explore this more fully in our blog.
The UK may now be entering a period of interest rate rises, but even so, we expect rates to be low compared to long-term norms by the end of the forecast period. While development levels are rising across the country, the shortage of new homes is unlikely to be fully reversed in the coming years, and that will underpin pricing.
On the other hand, factors such as deepening affordability pressures and property taxes, will continue to weigh on pricing.
Methodology Statement: House price forecasts are based upon time series regression analysis of relevant statistically significant macro-economic variables adjusted in-house to encompass externalities such as likely risk factors. The forecast uses the Nationwide House Price Index as a base. Our forecasts assume a Brexit deal, but with a two year transitional period.
Economic and housing market overview A Cabinet re-shuffle in early January resulted in the appointment of the 16th housing minister in 20 years, and the third housing minister of Theresa May’s premiership.
However, amid the revolving door of housing ministers, housing has also become a Cabinet post, with Savid Javid now heading a newly created Ministry for Housing, Communities and Local Government (MHCLG) – something for which we at Knight Frank have been calling for in recent years. This is a welcome move, even if it is largely symbolic, as it underlines the Government’s determination to address housing issues across the country, not least a lack of supply.
There has already been a plethora of housing policy in recent years, as shown in the chart below, but 2018 promises to be another year of legislation, as more plans contained in last year’s Housing
RESIDENTIAL RESEARCH
UK RESIDENTIAL MARKET UPDATE
“ 2018 promises to be another year of housing legislation, especially as housing is now a Cabinet issue.”Follow Gráinne at @ggilmorekf
For the latest news, views and analysis on the world of prime property, visit our blog or follow @KFIntelligence
GRÁINNE GILMORE Head of UK Residential Research
A SEAT AT THE TABLE Savid Javid is now Secretary of State for Housing, Communities and Local Government, meaning housing is now a Cabinet post. A new housing minister (the 16th in 20 years) has also been appointed, with more supply-side policies expected this year. Average house price growth moderated across the country in 2017, while in prime central London, price declines narrowed dramatically.
Key facts Jan 2018Average UK house prices rose by 2.6% in 2017, compared with 4.5% in 2016, according to Nationwide
Prime central London prices ended the year down 0.7%, compared with a 6.3% decline in December 2016
Prime Country home prices in England were up 0.4% in 2017, with some towns outperforming
Prime Scottish property prices were up 0.2% on the year, while Edinburgh values were up 5.4%
White Paper come to fruition. The Spring Statement in March could well be dominated by housing, an issue that the Government has made a top priority, even as it tackles tough Brexit negotiations.
The moderation in house price growth across the country continued towards the end of 2017, with average UK prices rising 2.6% during the year, compared to 4.5% in 2016 and more than 8% in 2014.
However, the underlying picture on pricing has changed, with average falls in pricing across Greater London (-0.5%) versus stronger growth in the West Midlands (5.2%). This is a reversal of the trend seen in recent years, where London has led from the front in terms of price growth.
Affordability constraints remain an issue in some parts of the market, especially in London and the South East, with lacklustre earnings growth also weighing on pricing.
UK housing transactions and policy changes 2007-2018
Source: Knight Frank Research/HMRC
25000
50000
75000
100000
125000
150000
175000
2016 2017 2018201520142013201220112010200920082007
Help to BuyEquity loanlaunched
Help to BuyLondon launched
Stamp duty abolishedfor FTBs up to £300k
Help to BuyMortgage Guarantee
launched
NewBuy Guaranteelaunched
Stamp duty reformed,rates rise to 12%
above £1.5mStamp Duty hol ends
Stamp Dutyrises to 5%
£1m+
FTBs Stamp Dutyhol up to £250,000
FTBs StampDuty hol ends
Funding forLending starts
3% Stamp Dutysurcharge for
additional properties
Housing White Paper
2017GeneralElection
ScottishReferendum
Vote toleave EU
GeneralElection
GeneralElection
Financial Crisis
Stamp Duty raisedto 7% for £2m+
Stamp Duty holidayup to £175,000
Mon
thly
tra
nsac
tions
(E&
W)
Num
ber
GavinBarwell
AlokSharma
DominicRaab
BrandonLewis
GrantShapps
MarkPrisk
John Healey
Kris Hopkins
CarolineFlint
Yvette Cooper
HousingMinisters:
MargaretBeckett
Important Notice
© Knight Frank LLP 2018 – This report is published for general information only and not to be relied upon in any way. Although high standards have been used in the preparation of the information, analysis, views and projections presented in this report, no responsibility or liability whatsoever can be accepted by Knight Frank LLP for any loss or damage resultant from any use of, reliance on or reference to the contents of this document. As a general report, this material does not necessarily represent the view of Knight Frank LLP in relation to particular properties or projects. Reproduction of this report in whole or in part is not allowed without prior written approval of Knight Frank LLP to the form and content within which it appears. Knight Frank LLP is a limited liability partnership registered in England with registered number OC305934. Our registered office is 55 Baker Street, London, W1U 8AN, where you may look at a list of members’ names.
BIRMINGHAM RESIDENTIAL SALES
Jamie CarterHead of Birmingham Residential Sales+44 12 1233 [email protected]
BIRMINGHAM RESIDENTIAL DEVELOPMENT
Mark Evans Head of Regional Residential Development +44 12 1233 6410 [email protected]
RESIDENTIAL RESEARCH
Oliver Knight Associate +44 20 7861 5134 [email protected]
KNIGHT FRANK FINANCE
Darielle Woffindin Consultant +44 13 7246 0883 [email protected]
Knight Frank Research provides strategic advice, consultancy services and forecasting to a wide range of clients worldwide including developers, investors, funding organisations, corporate institutions and the public sector. All our clients recognise the need for expert independent advice customised to their specific needs.
For the latest news, views and analysison the world of prime property, visit
KnightFrank.com/blog
KNIGHT FRANKINTELLIGENCE
Knight Frank Research Reports are available at KnightFrank.com/Research
The Birmingham Report 2017
UK Retirement Housing Market Update Q1 2018
SUPPLY AND DEMAND FUNDING MODELS POLICY FOCUS
RESIDENTIAL RESEARCH
RETIREMENT HOUSING MARKET UPDATE Q1 2018
201812th Edition
TH
E W
EA
LTH
RE
PO
RT
2018
The global perspective on prime property and investment
The Wealth Report - 2018