follow the ore
DESCRIPTION
Follow The OreTRANSCRIPT
FOLLOW THE OREAnnisa SolihahHao LiangXin Su
Mineral Distribution

Weathering
Transp
orta
tion
Deposition and compaction
Metamorphism
Melting
pressure
Crystalization
Consolidation
Igneous rock (extrusive)
Pluton
Met
am
orp
hic
rock
Sed
imen
tary
roc
k
Ma
gm
aIg
neou
s ro
ck (in
trus
ive)
An ore is a type of rock
that contain material
include metal in such
quantities. Iit can be
mined and worked
commercially to extract
that metal. The metal is
usually contained in
chemical combination
with some other element
in addition to various
impuritie.
Rock Cycle
Super-heated magma inside the earth triggering formation of the rocks, and of course,
the mineral inside rocks. There are three basic transition that will distinguish type of
rocks; Transition to sedimentary, Metamorphic, and Igneous
Transition to igneous.
Magma, both from
earth’s mantel and from
melted rock will cooling
down below the surface,
then solidify into an
igneous rock. Magma
which comes out from
the earth, as known as
lava, at some point will
cooling down and turn to
solid rock.
Transition to metamorphic
Rock exposed to high
temperature and pressure
from igneous that heats
up. Metamorpich rock also
can be formed from
crystalization by the heat
of magma.
Transition to sedimentary
Sedimentary rock can
be formed from the
lithification (pressing and
compacting process) of
fragments of rock / grain /
organism.
Svalbard, by Surya Dharma
wikipedia
Ore

250 Ma
200 Ma
Triasic
Jurassic
CretaceousPaleogene
Neogene
Quaternary
MESO
ZO
IC
CEN
OZ
OIC
145.
5 M
a
65.5 Ma
55 Ma
35 M
a
23 M
a
2.5 Ma
Sedimentary rock formed (Quartz and Feldspar)
Prentice Hall, Inc 2003
Coal noticeableCalcium carbonate foundChalk mineral foundNotable in the context of offshore oil drilling
Ice caps in both poles began to growIce Age began, ended 20k years ago.
human existence
“Fut
ure”
Early earth
Tria
sic
Jura
ssic
Cre
tace
ous
Pale
ogen
eQ
uate
rnary

Classification of Rock
Sedimentary
ClasticConglomerate
BrecciaSandstone
SiltstoneMudstoneShale
Limestone
Coal
Gabbro
Basalt
Dolostone
Chert
Diorite
Andesite
Slate
Granodiorite
Dacite
Schist
Quartzite
Granite
Rhyolite
Gneiss
Marble
stone-network.com essentiallyeducation.co.uk
Evaporites
Chemical
Biologic
Intrusive
Extrusive
Foliated
Non-foliated
Igneous
Metamorphic

Convergent BoundaryDivergent Boundary Transform Boundary Volcanic centers active within the last one million years.
http://www.age-of-the-sage.org
North America plate
Eurasian plate
Indian-Australian plate
South America plate
Nazea plate
Pasific plate
Antartic plate
African plate
Cocosplate
Plates of the World
http://www.age-of-the-sage.org

Geology on Circumpolar Arctic
Mainly sedimentary rocks
Mixed volcanic, pyroclastic and sedimentary
Mainly volcanic rocks
Plutons
Intrusive and metamorphic terrains
Tectonic assemblages, schist belts, melanges
Ice
Unclassified

Maps
AluminumChromium
CoalCopper
GoldIron
LLeadLithium
ManganeseNickel
PlatinumREE
SilverTTin
TitaniumUranium
ZincZirconium
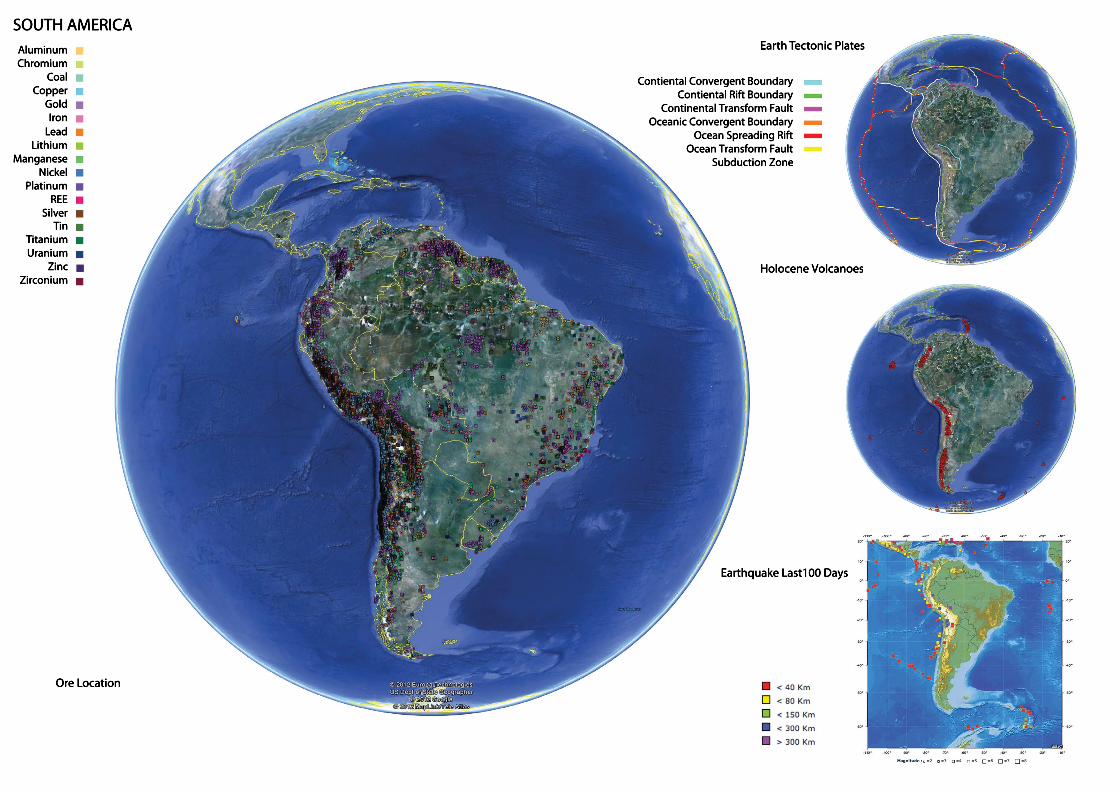
Ore Location
SOUTH AMERICAEarth Tectonic Plates
Earthquake Last100 Days
Holocene Volcanoes
Contiental Convergent BoundaryContiental Rift Boundary
Continental Transform FaultOceanic Convergent Boundary
Ocean Spreading RiftOcean Transform Fault
Subduction ZoneSubduction Zone

Earth Tectonic Plates
Earthquake Last100 Days
Holocene Volcanoes
Contiental Convergent BoundaryContiental Rift Boundary
Continental Transform FaultOceanic Convergent Boundary
Ocean Spreading RiftOcean Transform Fault
Subduction ZoneSubduction Zone
Ore Location
AFRICA
AluminumChromium
CoalCopper
GoldIIron
LeadLithium
ManganeseNickel
PlatinumREE
SilSilverTin
TitaniumUranium
ZincZirconium

Ore Location
Earth Tectonic Plates
Earthquake Last100 Days
Holocene Volcanoes
Contiental Convergent BoundaryContiental Rift Boundary
Continental Transform FaultOceanic Convergent Boundary
Ocean Spreading RiftOcean Transform Fault
Subduction ZoneSubduction Zone
ASIA
AluminumChromium
CoalCopper
GoldIIron
LeadLithium
ManganeseNickel
PlatinumREE
SilSilverTin
TitaniumUranium
ZincZirconium
Ore Location
Earth Tectonic Plates
Earthquake Last100 Days
Holocene Volcanoes
Contiental Convergent BoundaryContiental Rift Boundary
Continental Transform FaultOceanic Convergent Boundary
Ocean Spreading RiftOcean Transform Fault
Subduction ZoneSubduction Zone
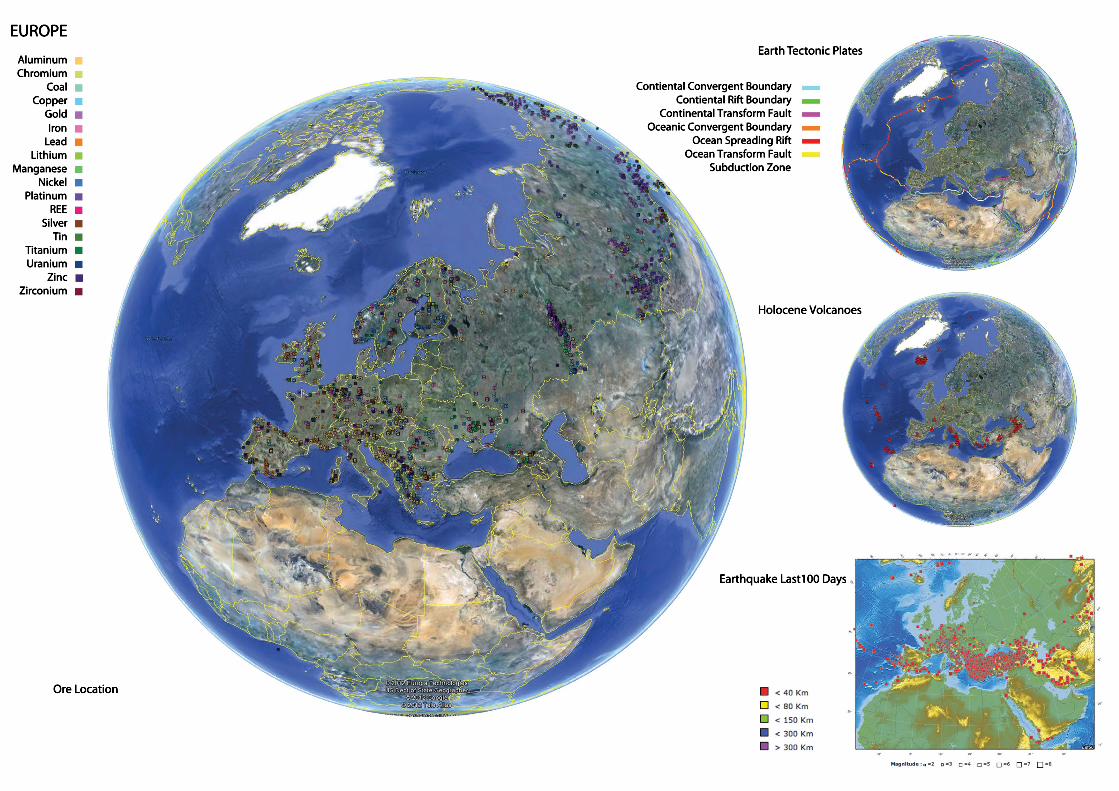
EUROPE
AluminumChromium
CoalCopper
GoldIIron
LeadLithium
ManganeseNickel
PlatinumREE
SilSilverTin
TitaniumUranium
ZincZirconium

Ore Location
Earth Tectonic Plates
Earthquake Last100 Days
Holocene Volcanoes
Contiental Convergent BoundaryContiental Rift Boundary
Continental Transform FaultOceanic Convergent Boundary
Ocean Spreading RiftOcean Transform Fault
Subduction ZoneSubduction Zone
AluminumChromium
CoalCopper
GoldIron
LLeadLithium
ManganeseNickel
PlatinumREE
SilverTTin
TitaniumUranium
ZincZirconium
NORTH AMERICA

Ore Location
Earth Tectonic Plates
Earthquake Last100 Days
Holocene Volcanoes
Contiental Convergent BoundaryContiental Rift Boundary
Continental Transform FaultOceanic Convergent Boundary
Ocean Spreading RiftOcean Transform Fault
Subduction ZoneSubduction Zone
OCEAN
AluminumChromium
CoalCopper
GoldIIron
LeadLithium
ManganeseNickel
PlatinumREE
SilSilverTin
TitaniumUranium
ZincZirconium

World Production

Source: British Geological Survey
-Fossil fuel-Industrial purposes
1941 1950 1960 1970 1980 1990 20008000000000
6000000000
4000000000
2000000000
0
Coal Coal, a fossil fuel, is the largest source of energy for the generation of electricity worldwide, as well as one of the largest worldwide anthropogenic sources of car-bon dioxide releases. Gross carbon dioxide emissions from coal usage are slightly more than those from petroleum and about double the amount from natural gas. Coal is extracted from the ground by mining, either underground by shaft mining through the seams or in open pits.
World Total Production (2009)
6,938,000,000 ton
GERMANY
SOUTH AFRICA
INDONESIA
KAZAKHSTAN
CHINA
USA
POLAND
T1
3
6
9
2
5
8
4
7
10
CHINA
AUSTRALIA
INDONESIA
USA
RUSSIA
GERMANY
INDIA
SOUTH AFRICA
POLAND
KAZAKHSTAN
3,050,000,000
415,252,000
245,000,000
975,153,000
198,000,000
184,828,142
566,157,000
250,581,674
135,172,766
91,493,082
RUSSIA
INDIA
AUSTRALIA
Applications:
Top 10 producer of coal (2009)
World total production of coal (1941-2009)

Source: British Geological Survey
1941 1950 1960 1970 1980 1990 2000
1200000000
1500000000
30000000
600000000
300000000
0
Fe It is the most common element (by mass) forming the planet Earth as a whole, forming much of Earth’s outer and inner core. It is the fourth most common element in the Earth’s crust. Iron’s very common presence in rocky planets like Earth is due to its abundant production as a result of fusion in high-mass stars, where the production of nickel-56 (which decays to iron) is the last nuclear fusion reaction that is exothermic.
World Total Production (2009)
2,248,000,000 ton
CHINAIRAN
UKRAINE
AUSTRALIA
SOUTH AFRICA
INDIA
RUSSIA
BRAZIL
CANADA
USA
T1
3
6
9
2
5
8
4
7
10
CHINA
INDIA
SOUTH AFRICA
AUSTRALIA
RUSSIA
IRAN
BRAZIL
UKRAINE
CANADA
USA
880,171,400
213,370,900
55,313,053
394,069,000
92,000,000
38,200,000
327,000,000
66,452,000
31,699,000
26,000,000
-Transportation,-Packaging-Household-Electronic shell-Electrical transmission
Applications:
Top 10 producer of iron (2009)
World total production of iron (1941-2009)

Source: British Geological Survey
1941 1950 1960 1970 1980 1990 200040000000
30000000
20000000
10000000
0
Al Aluminium is the third most abundant element (after oxygen and silicon), and the most abundant metal, in the Earth’s crust. It makes up about 8% by weight of the Earth’s solid surface. Aluminium metal is too reactive chemically to occur natively. Instead, it is found combined in over 270 different minerals. The chief ore of aluminium is bauxite.
World Total Production (2009)
36,900,000 ton
CHINA
NORWAY
INDIA
RUSSIA
BRAZIL
AUSTRALIA
USA
CANADA
UAEBAGRAIN
T1
3
6
9
2
5
8
4
7
10
CHINA
AUSTRALIA
INDIA
RUSSIA
USA
NORWAY
CANADA
BRAZIL
UAE
BAHRAIN
12,846,000
1,943,000
1,302,100
3,815,000
1,727,200
1,090,000
3,030,269
1,535,900
1,009,800
850,000
- Transport manufacturing industry- Packaing- Water treatment- Construction- Cooking utensils- Electrical transmission lines_Electronics, CDs and transis-
Applications:
Top 10 producer of aluminium (2009)
World total production of aluminium (1941-2009)

Source: British Geological Survey
1941 1950 1960 1970 1980 1990 2000
20000000
25000000
15000000
10000000
5000000
0
Ag Silver is a soft, white, lustrous transition metal, it has the highest electrical conductivity of any element and the highest thermal conductivity of any metal. The metal occurs naturally in its pure, free form (native silver), as an alloy with gold and other metals, and in minerals such as argentite and chlorargyrite. Most silver is produced as a byproduct of copper, gold, lead, and zinc refining.
World Total Production (2009)
22,236,000 ton
PERU
POLAND
CHILE
MEXICO
USA
RUSSIA
BOLIVIA
CHINA
CANADA
KAZAKHSTAN
T1
3
6
9
2
5
8
4
7
10
PERU
RUSSIA
USA
MEXICO
BOLIVIA
POLAND
CHINA
CHILE
CANADA
KAZAKHSTAN
3,854,019
1,400,000
1,238,800
3,553,841
1,325,730
1,150,000
2,900,000
1,301,018
630,897
618,100
- Precious metal- Electrical contacts and conduc-tors- Mirrors- Catalysis of chemical reactions- Photographic film
Applications:
Top 10 producer of silver (2009)
World total production of silver (1941-2009)

Source: British Geological Survey
Cr Chromium is the 21st most abundant element in Earth’s crust with an average concentration of 100 ppm.[6] Chromium compounds are found in the environment, due to erosion of chromium-containing rocks and can be distributed by volcanic eruptions. Although rare, deposits of native chromium exist.
World Total Production (2009)
18,700,000 ton
SOUTH AFRICA
ALBANIA
RUSSIAFINLAND
BRAZIL
TURKEY
INDIA
KAZAKHSTAN
CHINA
T1
3
6
9
2
5
8
4
7
10
SOUTH AFRICA
TURKEY
RUSSIA
INDIA
OMAN
CHINA
KAZAKHSTAN
BRAZIL
ALBANIA
FINLAND
6,864,938
1,770,029
416,194
3,372,000
730,000
280,000
3,333,197
700,000
274,140
247,000
1941 1950 1960 1970 1980 1990 2000
20000000
25000000
15000000
10000000
50000000
OMAN
- Form stainless steel- Chrome planting- Dye and pigment- Wood preservative- Tanning- Refractory material- Catalysts
Applications:
Top 10 producer of chromium (2009)
World total production of chromium (1941-2009)
Source: British Geological Survey
1941 1950 1960 1970 1980 1990 2000
12000000
15000000
9000000
6000000
3000000
0
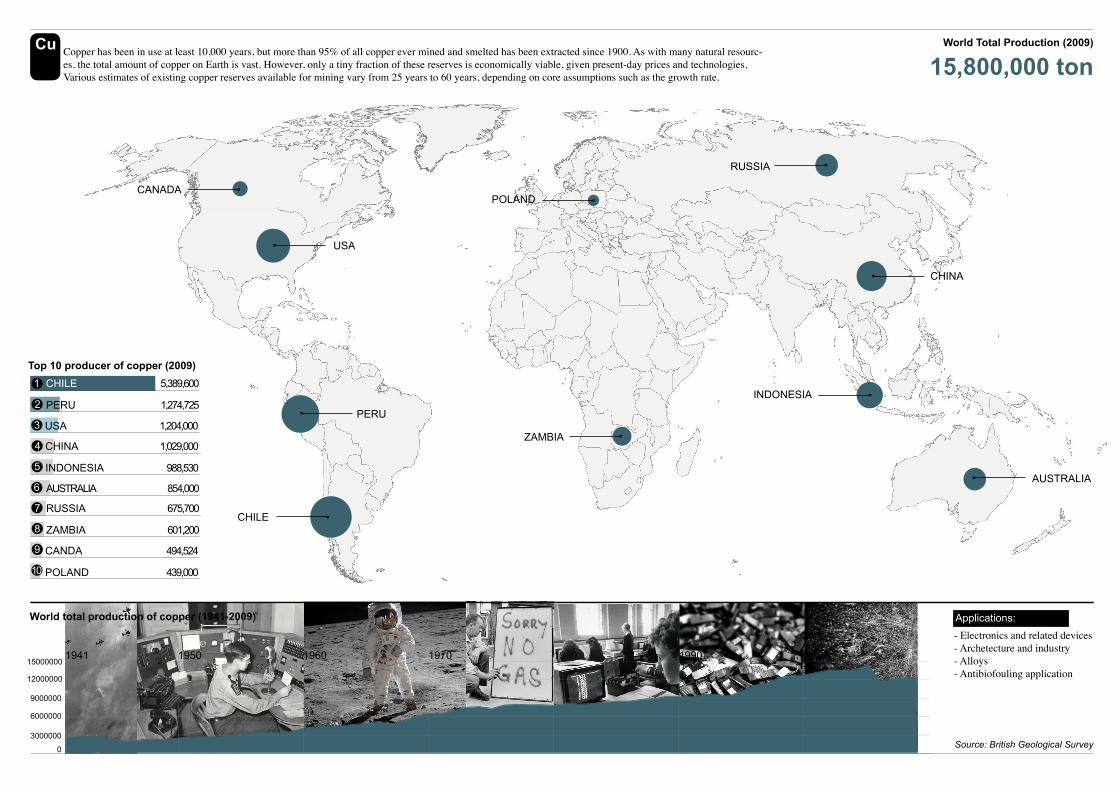
Cu Copper has been in use at least 10,000 years, but more than 95% of all copper ever mined and smelted has been extracted since 1900. As with many natural resourc-es, the total amount of copper on Earth is vast. However, only a tiny fraction of these reserves is economically viable, given present-day prices and technologies. Various estimates of existing copper reserves available for mining vary from 25 years to 60 years, depending on core assumptions such as the growth rate.
World Total Production (2009)
15,800,000 ton
CHILE
ZAMBIA
RUSSIA
PERU
AUSTRALIA
CHINA
INDONESIA
USA
CANADAPOLAND
T1
3
6
9
2
5
8
4
7
10
CHILE
CHINA
RUSSIA
PERU
INDONESIA
ZAMBIA
USA
AUSTRALIA
CANDA
POLAND
5,389,600
1,029,000
675,700
1,274,725
988,530
601,200
1,204,000
854,000
494,524
439,000
- Electronics and related devices- Archetecture and industry- Alloys- Antibiofouling application
Applications:
Top 10 producer of copper (2009)
World total production of copper (1941-2009)

Source: British Geological Survey
Zn Zinc makes up about 75 ppm (0.0075%) of the Earth’s crust, making it the 24th most abundant element. The element is normally found in association with other base metals such as copper and lead in ores. Zinc is a chalcophile, meaning the element has a low affinity for oxides and prefers to bond with sulfides. Chalcophiles formed as the crust solidified under the reducing conditions of the early Earth’s atmosphere.
World Total Production (2009)
11,400,000 ton
CHINA
BOLIVIA
MEXICO
NAMIBIA
INDIA
USA
PERU
AUSTRALIA
KAZAKHSTAN
T1
3
6
9
2
5
8
4
7
10
CHINA
USA
MEXICO
PERU
CANADA
BOLIVIA
AUSTRALIA
INDIA
KAZAKHSTAN
NAMBIA
3,091,600
735,700
489,766
1,509,129
698,901
430,879
1,290,000
677,069
418,600
244,400
1941 1950 1960 1970 1980 1990 200012000000
9000000
6000000
3000000
0
CANADA
- Galvanizing- Brass and bronze- Alloys- Chemicals- Semi-manufactures- Miscellaneous
Applications:
Top 10 producer of zinc (2009)
World total production of zinc (1941-2009)

Source: British Geological Survey
1941 1950 1960 1970 1980 1990 200040000000
30000000
20000000
10000000
0
Pb Lead is a soft, malleable poor metal. It is also counted as one of the heavy metals. Metallic lead does occur in nature, but it is rare. Lead is usually found in ore with zinc, silver and (most abundantly) copper, and is extracted together with these metals. The main lead mineral is galena (PbS), which contains 86.6 % lead by weight. Other common varieties are cerussite (PbCO3) and anglesite (PbSO4).
World Total Production (2009)
3,900,000 ton
CHINA
RUSSIA
INDIA
CANADA
AUSTRALIA
BOLIVIA
PERU
MEXICO
USA
T1
3
6
9
2
5
8
4
7
10
CHINA
PERU
INDIA
AUSTRALIA
MEXICO
RUSSIA
USA
BOLIVIA
SWEDEN
CANADA
1,610,000
302,142
84,025
506,000
143,838
78,000
405,800
84,538
69,293
68,763
- Building construction- Batteries- Alloys- Bullets and shots- Weights
Applications:
Top 10 producer of lead (2009)
World total production of lead (1941-2009)

Source: British Geological Survey
1941 1950 1960 1970 1980 1990 2000
24000000
30000000
18000000
12000000
600000
0
Au Gold is a dense, soft, shiny, malleable and ductile metal. Pure gold has a bright yellow color and luster traditionally considered attractive, which it maintains without oxidizing in air or water. It is one of the least reactive solid chemical elements. The metal therefore occurs often in free elemental (native) form, as nuggets or grains in rocks, in veins and in alluvial deposits. Less commonly, it occurs in minerals as gold compounds, usually with tellurium.
World Total Production (2009)
2,460,000 ton
CHINA
CANADA
INDONESIA
USA
PERU
RUSSIA
SOUTH AFRICAAUSTRALIA
GHANA
UZBEKISTAN
T1
3
6
9
2
5
8
4
7
10
CHINA
RUSSIA
INDONESIA
USA
SOUTH AFRICA
CANADA
AUSTRALIA
PERU
GHANA
UZBEKISTAN
320,000
205,236
127,716
223,323
197,628
97,367
222,000
182,390
97,197
73,000
- Jewellery- Investment - Industrial uses- Dentistry and medicine- Catalyst and nanotechnology
Applications:
Top 10 producer of gold (2009)
World total production of gold (1941-2009)

Source: British Geological Survey
Ni nickel is reactive with oxygen that native nickel is rare on Earth’s surface, being mostly confined to the interiors of larger nickel–iron meteorites that were protected from oxidation during their time in space. On Earth, such native nickel is always found in combination with iron, in keeping with those elements’ origin as major end products of the nucleosynthesis process in supernovas. An iron–nickel mixture is thought to compose Earth’s inner core.
World Total Production (2009)
1,412,000 ton
RUSSIA
BRAZIL
NEW CALEDONIA
SOUTH AFRICA
INDONESIA
COLOMBIA
PHILLIPINES
CANADA
AUSTRALIA
CUBA
T1
3
6
9
2
5
8
4
7
10
RUSSIA
PHILLIPINES
COLOMBIA
INDONESIA
CANADA
CUBA
AUSTRALIA
NEW CALEDONIA
BRAZIL
SOUTH AFRICA
261,900
137,350
72,000
202,800
136,594
67,000
166,000
92,570
65,000
34,610
1941 1950 1960 1970 1980 1990 20002000000
1500000
1000000
50000
0
-Electroplanting applications-Alloys-Household-Construction-Chemical and food-processing industries- Batteries, jewellery and electri-cal components
Applications:
Top 10 producer of nickel (2009)
World total production of nickel (1941-2009)

Source: British Geological Survey
1941 1950 1960 1970 1980 1990 2000
400000
500000
600000
300000
200000
1000000
Pt Even though it has six naturally occurring isotopes, platinum is one of the rarest elements in the Earth’s crust and has an average abundance of approximately 5 μg/kg. It is the least reactive metal. It occurs in some nickel and copper ores along with some native deposits, mostly in South Africa, which accounts for 80% of the world production.
World Total Production (2009)
429,000 ton
SOUTH AFRICA
AUSTRALIA
COLOMBIA
USA
ZIBABWE
CANADA
RUSSIA
T1
3
6
2
5
4
7
SOUTH AFRICA
ZIBABWE
AUSTRALIA
USA
CANADA
RUSSIA
COLOMBIA
271,393
13,393
726
116,485
13,340
112,759
929
- Jewellery- Elecronics industry- Chemical industrial- Investment
Applications:
Top 10 producer of platinum (2009)
World total production of platinum (1941-2009)

Source: British Geological Survey
Sn Tin is the 49th most abundant element in the Earth’s crust, representing 2 ppm compared with 75 ppm for zinc, 50 ppm for copper, and 14 ppm for lead.Tin does not occur as the native element but must be extracted from various ores.
World Total Production (2009)
279,000 ton
CHINA
VIETNAM
CONGO
MALAYSIA
INDONESIABRAZIL
BOLIAVIA
AUSTRALIA
PERU
RWANDA
120000 150000
T1
3
6
9
2
5
8
4
7
10
CHINA
BOLIVIA
CONGO
INDONESIA
AUSTRALIA
VIETNAM
PERU
BRAZIL
RWANDA
MALAYSIA
128,000
19,581
9,400
46,078
13,269
5,400
37,530
10,000
3,154
2,412
1941 1950 1960 1970 1980 1990 2000
20000000
15000000
10000000
5000000
0
25000000
- Solder- Specialized alloys- Tin plating
Applications:
Top 10 producer of tin (2009)
World total production of tin (1941-2009)

Source: British Geological Survey
REE Despite their name, rare earth elements are relatively plentiful in the Earth’s crust. However, because of their geochemical properties, rare earth elements are typi-cally dispersed and not often found in concentrated and economically exploitable forms. The few economically exploitable deposits are known as rare earth miner-als. It was the very scarcity of these minerals that led to the term “rare earth”.
World Total Production (2009)
123,190 ton
CHINA
MALAYSIA
RUSSIA
BRAZIL
T1
3
2
5
4
CHINA
MALAYSIA
RUSSIA
INDIA
BRAZIL
120,000
20
2,500
20
650
1941 1950 1960 1970 1980 1990 2000150000
120000
90000
60000
30000
0
INDIA
- Consumer electronics- Environmental technologies- Military applications
Applications:
Top 10 producer of rare earth element (2009)
World total production of rare earth element (1941-2009)
Source: British Geological Survey
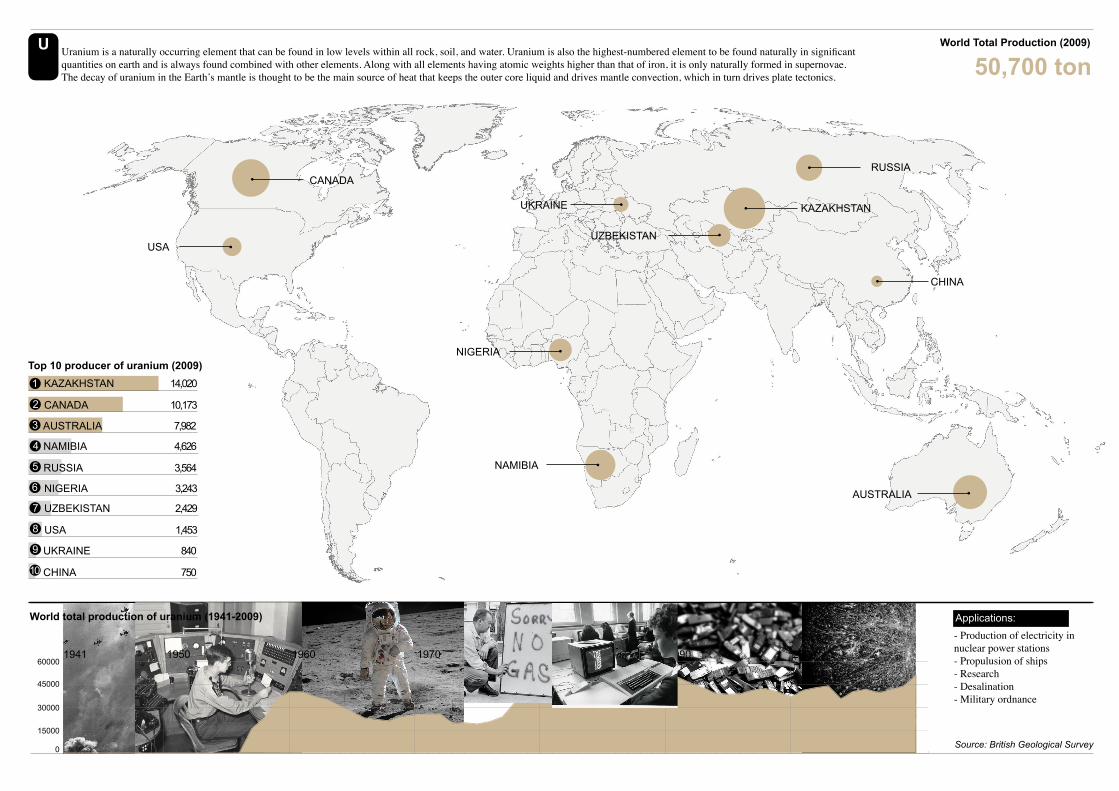
U Uranium is a naturally occurring element that can be found in low levels within all rock, soil, and water. Uranium is also the highest-numbered element to be found naturally in significant quantities on earth and is always found combined with other elements. Along with all elements having atomic weights higher than that of iron, it is only naturally formed in supernovae. The decay of uranium in the Earth’s mantle is thought to be the main source of heat that keeps the outer core liquid and drives mantle convection, which in turn drives plate tectonics.
World Total Production (2009)
50,700 ton
KAZAKHSTAN
USA
NIGERIA
CHINA
UZBEKISTAN
NAMIBIA
CANADA
AUSTRALIA
UKRAINE
T1
3
6
9
2
5
8
4
7
10
KAZAKHSTAN
NAMIBIA
UZBEKISTAN
CANADA
RUSSIA
USA
AUSTRALIA
NIGERIA
UKRAINE
CHINA
14,020
4,626
2,429
10,173
3,564
1,453
7,982
3,243
840
750
1941 1950 1960 1970 1980 1990 200060000
45000
30000
15000
0
RUSSIA
- Production of electricity in nuclear power stations- Propulusion of ships- Research- Desalination- Military ordnance
Applications:
Top 10 producer of uranium (2009)
World total production of uranium (1941-2009)
Source: British Geological Survey
Pb
Sn
Al Ni
Fe
Zn
Coal
U
Au
REE
Ag
Cr
Cu
Pt
10,000,000,000
8,000,000,000
6,000,000,000
4,000,000,000
2,000,000,000
0
120,000,000
100,000,000
80,000,000
60,000,000
40,000,000
20,000,0000
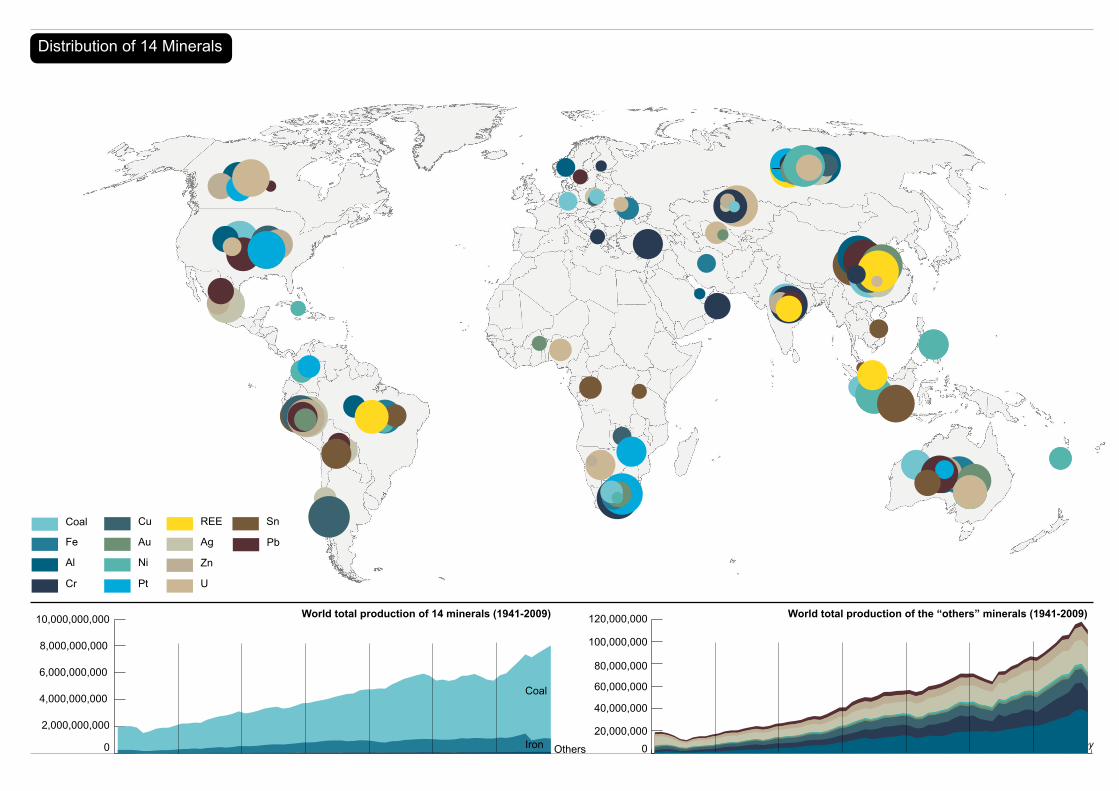
Distribution of 14 Minerals
World total production of 14 minerals (1941-2009) World total production of the “others” minerals (1941-2009)
Coal
Iron Others

Pb
Sn
Al Ni
Fe
Zn
Coal
U
Au
REE
Ag
Cr
Cu
Pt
1990 19981991
The Gulf War
September 11, 2001 at-
tacks
Iraq War
The Euro-pean Union was formally established
The forma-tion of World Trade Organ-
ization
Dissolution of the Soviet
Union
Indian Ocean Earthquake
global finan-cial crisis
19991992 2000 2002 2004 2006 2008
2001 2003 2005 2007 200919931994
19951996
1997
Growth Rate of Minerals (1990-2009)