follow us - grupo integrado de ingeniería · 10 nonlinear dynamics j 59 510 1.118 15.792 3.098...
TRANSCRIPT


Display journal title
Just copy the code below and paste within your html page:
F o l l o w u s :
SJR is developed by:
How to cite this website?
Home
Journal Rankings
Journal Search
Country Rankings
Country Search
Compare
Map Generator
Help
About Us
<a href="http://www.scimagojr
J o u r n a l S e a r c h
M a r i t i m e P o l i c y a n d M a n a g e m e n t
Country: United Kingdom
Subject Area: Social Sciences | Engineering | Environmental Science
Subject Category:
Publisher: . Publication type: Journals. ISSN: 03088839, 14645254
Coverage: 1977-1978, 1980-2014
H Index: 31
Scope:
Thirty years ago maritime management decisions were taken on the basis of experience and hunch. Today, the experience is augmented [...]Show full scope
Charts Data
SJR indicator vs. Cites per Doc (2y)
The SJR indicator measures the scientific influence of the average article in a journal, it expresses how central to the global scientific discussion an average article of the journal is. Cites per Doc. (2y) measures the scientific impact of an average article published in the journal, it is computed using the same formula that journal impact factor ™ (ThomsonReuters).
Citation vs. Self-Citation
in Journal Title Search
Exact phrase
CategoryQuartile (Q1 means highest values and Q4 lowest values)
1999 2000 2001 2002 2003 2004 2005 2006 2007 2008 2009 2010 2011 2012 2013
Management, Monitoring, Policy and Law
Geography, Planning and Development
Ocean Engineering
Transportation
Search query
Página 1 de 3Maritime Policy and Management
04/08/2014http://www.scimagojr.com/journalsearch.php?q=26252&tip=sid&clean=0

F o l l o w u s :
SJR is developed by:
How to cite this website?
Home
Journal Rankings
Journal Search
Country Rankings
Country Search
Compare
Map Generator
Help
About Us
J o u r n a l R a n k i n g s
Subject Category: Ocean Engineering.Year: 2013.
Download data in MS Excel format (30 Kb)
1 - 50 of 139 << First | < Previous | Next > | Last >>
Subject Area: All Subject Category: Ocean Engineering Country: All Year: 2013 Order By: SJR Display journals with at least: 0 Citable Docs. (3 years) Refresh
Title Type SJRH
index
Total Docs. (2013)
Total Docs.
(3years)
Total Refs.
Total Cites
(3years)
Citable Docs.
(3years)
Cites / Doc.
(2years)
Ref. / Doc.
Country
1International Journal of Impact Engineering
j 66 125 324 3.653 953 315 2,74 29,22
2 Computational Mechanics j 60 186 317 7.638 769 299 2,37 41,06
3 Coastal Engineering j 62 113 302 3.875 773 281 2,53 34,29
4Probabilistic Engineering Mechanics
j 44 55 174 1.605 442 169 2,55 29,18
5International Journal of Engine Research
j 22 46 119 1.470 248 116 2,24 31,96
6Journal of Atmospheric and Oceanic Technology
j 81 206 433 6.677 914 423 1,95 32,41
7 Marine Structures j 33 45 91 1.212 218 89 2,13 26,93
8 Applied Ocean Research j 34 82 152 2.308 286 152 1,87 28,15
9 Ocean Engineering j 46 332 558 9.205 1.214 541 1,95 27,73
10 Nonlinear Dynamics j 59 510 1.118 15.792 3.098 1.081 2,80 30,96
11Limnology and Oceanography: Methods
j 35 52 187 2.013 419 186 1,70 38,71
12 Naval Research Logistics j 41 48 164 1.311 166 154 0,74 27,31
13 Coastal Engineering Journal j 21 16 62 540 108 60 1,91 33,75
14Maritime Policy and Management
j 31 62 121 1.927 235 115 1,87 31,08
15International Journal of Structural Stability and Dynamics
j 14 88 186 2.165 220 180 1,34 24,60
16Structure and Infrastructure Engineering
j 17 148 211 5.379 322 202 1,49 36,34
17Geological Society Special Publication
k 68 250 718 19.928 1.126 703 1,36 79,71
18Ships and Offshore Structures
j 9 78 96 1.409 87 90 1,13 18,06
19
Proceedings of the Institution of Civil Engineers: MaritimeEngineering
j 12 20 62 445 50 48 1,19 22,25
20IEEE Journal of Oceanic Engineering
j 63 108 212 1.800 461 204 2,27 16,67
21Journal of Waterway, Port, Coastal and Ocean Engineering
j 36 53 112 1.476 144 105 1,46 27,85
22 Journal of Ship Research j 28 18 65 480 76 65 1,24 26,67
23 Oceanologia j 26 47 117 2.110 128 117 1,02 44,89
24Mechanics Based Design of Structures and Machines
j 20 27 91 635 82 88 0,93 23,52
Ranking Parameters
2,290
2,176
1,798
1,713
1,618
1,615
1,518
1,497
1,382
1,277
1,132
1,131
1,129
1,009
0,982
0,926
0,856
0,740
0,703
0,687
0,671
0,662
0,552
0,540
Página 1 de 2Journal Rankings on Ocean Engineering
04/08/2014http://www.scimagojr.com/journalrank.php?area=0&category=2212&country=all&ye...

F o l l o w u s :
SJR is developed by:
How to cite this website?
Home
Journal Rankings
Journal Search
Country Rankings
Country Search
Compare
Map Generator
Help
About Us
J o u r n a l R a n k i n g s
Subject Category: Transportation.Year: 2013.
Download data in MS Excel format (26 Kb)
1 - 50 of 119 << First | < Previous | Next > | Last >>
Subject Area: All Subject Category: Transportation Country: All Year: 2013 Order By: SJR Display journals with at least: 0 Citable Docs. (3 years) Refresh
Title Type SJRH
index
Total Docs. (2013)
Total Docs.
(3years)
Total Refs.
Total Cites
(3years)
Citable Docs.
(3years)
Cites / Doc.
(2years)
Ref. / Doc.
Country
1Transportation Research, Series B: Methodological
j 70 135 301 4.613 1.356 294 4,36 34,17
2 Transportation Science j 64 39 103 1.369 334 103 2,93 35,10
3Transportation Research, Part A: Policy and Practice
j 65 134 276 6.238 930 264 3,07 46,55
4Transportation Research, Part E: Logistics and Transportation Review
j 52 114 263 3.534 927 255 3,12 31,00
5Transportmetrica A: Transport Science
j 13 46 62 1.682 123 59 1,86 36,57
6 Tourism Management j 80 127 438 8.474 1.665 406 3,45 66,72
7 Journal of Travel Research j 59 59 151 3.974 444 149 2,64 67,36
8Transportation Research Part C: Emerging Technologies
j 55 227 285 7.294 1.054 256 3,98 32,13
9Journal of Transport Geography
j 43 162 400 7.439 1.114 378 2,54 45,92
10 Transport Reviews j 34 39 112 2.373 276 107 2,19 60,85
11 Transport Policy j 40 138 273 5.439 605 260 2,14 39,41
12 Transportation j 42 84 177 3.188 346 165 1,89 37,95
13International Journal of Sustainable Transportation
j 8 17 65 572 93 62 1,35 33,65
14International Journal of Physical Distribution and Logistics Management
j 34 40 130 2.480 383 127 2,66 62,00
15Transportation Research, Part D: Transport and Environment
j 44 111 248 1.316 510 244 1,96 11,86
16Research in Transportation Economics
j 13 106 155 3.498 203 138 1,32 33,00
17 Economics of Transportation j 3 14 7 403 14 6 2,33 28,79
18
IWCTS 2012 - 5th ACM SIGSPATIAL International Workshop on ComputationalTransportation Science
p 1 0 10 0 2 8 0,25 0,00
19International Journal of Tourism Research
j 15 93 148 5.512 270 144 1,37 59,27
20International Journal of Logistics Management
j 8 21 60 1.199 117 59 1,32 57,10
21Transportation Research Part F: Traffic Psychology andBehaviour
j 43 101 166 4.229 354 165 1,80 41,87
22Maritime Policy and
j 31 62 121 1.927 235 115 1,87 31,08
Ranking Parameters
3,306
3,139
2,433
2,155
2,150
1,961
1,958
1,943
1,715
1,678
1,666
1,645
1,556
1,305
1,255
1,130
1,120
1,093
1,093
1,088
1,016
1,009
Página 1 de 2Journal Rankings on Transportation
04/08/2014http://www.scimagojr.com/journalrank.php?area=0&category=3313&country=all&ye...

Scimago Lab, Copyright 2007-2014. Data Source: Scopus®
1 - 50 of 119 << First | < Previous | Next > | Last >>
Management
23Journal of Transportation Engineering
j 42 139 407 3.388 490 398 1,04 24,37
24European Journal of Transport and InfrastructureResearch
j 10 18 72 764 99 69 1,22 42,44
25Maritime Economics and Logistics
j 27 22 68 842 102 66 1,46 38,27
26Journal of Air Transport Management
j 34 84 251 2.855 290 234 1,12 33,99
27 Public Transport j 8 18 37 479 38 33 1,17 26,61
28IET Intelligent Transport Systems
j 15 55 128 1.431 245 124 1,67 26,02
29International Journal of Shipping and Transport Logistics
j 7 37 70 1.507 86 70 1,21 40,73
30Journal of Transportation Safety and Security
j 5 21 64 567 51 63 0,56 27,00
31Sustainable Cities and Society
j 7 42 65 1.413 125 63 1,98 33,64
32Journal of Transport Economics and Policy
j 33 29 69 800 62 69 0,84 27,59
332010 IEEE Vehicular Networking Conference, VNC 2010
p 6 0 49 0 63 48 0,00 0,00
34International Journal of Crashworthiness
j 21 61 166 1.635 198 165 1,13 26,80
35Research in Transportation Business and Management
j 3 54 65 2.398 41 57 0,72 44,41
36International Journal of Transport Economics
j 14 18 44 814 33 43 0,66 45,22
37Transportation Planning and Technology
j 21 42 143 1.279 100 139 0,57 30,45
38European Transport -Trasporti Europei
j 4 22 62 897 47 58 0,69 40,77
39European Transport Research Review
j 5 45 67 1.294 44 60 0,65 28,76
40Zhongguo GongluXuebao/China Journal of Highway and Transport
j 16 148 380 2.673 211 380 0,56 18,06
41World Review of Intermodal Transportation Research
j 5 13 23 536 13 23 0,17 41,23
42 Transportation Letters j 7 21 59 775 34 59 0,51 36,90
43 IATSS Research j 4 18 40 481 38 40 0,81 26,72
44 Transportation Journal j 23 26 75 1.005 34 59 0,30 38,65
45Journal of Public Transportation
j 2 29 58 770 28 58 0,48 26,55
46
Jiaotong Yunshu Xitong Gongcheng Yu Xinxi/ Journal of Transportation SystemsEngineering and Information Technology
j 12 159 574 1.670 218 574 0,34 10,50
47 Mobilization j 15 0 67 0 53 66 0,40 0,00
48Journal of Transport and Land Use
j 3 20 21 741 13 20 0,65 37,05
49Journal of Transportation Security
j 5 27 62 775 39 58 0,59 28,70
50IEEE Vehicular Networking Conference, VNC
p 4 42 77 621 80 74 1,08 14,79
0,970
0,912
0,896
0,857
0,768
0,760
0,712
0,680
0,677
0,624
0,613
0,593
0,560
0,541
0,502
0,500
0,480
0,472
0,460
0,426
0,425
0,402
0,354
0,329
0,327
0,326
0,288
0,285
Página 2 de 2Journal Rankings on Transportation
04/08/2014http://www.scimagojr.com/journalrank.php?area=0&category=3313&country=all&ye...

2013 JCR Social Science Edition
Journal Summary List Journal Title Changes
Journals from: subject categories TRANSPORTATION
Sorted by: Impact Factor Journals 1 - 20 (of 29) [ 1 | 2 ] Page 1 of 2
Ranking is based on your journal and sort selections.
Mark Rank
Abbreviated Journal Title
(linked to journal information)
ISSN
JCR Data Eigenfactor® Metrics
Total Cites
ImpactFactor
5-YearImpactFactor
ImmediacyIndex Articles
CitedHalf-life
Eigenfactor®
Score
ArticleInfluence®
Score
1 TRANSPORT RES B-METH 0191-2615 5300 3.894 4.439 0.571 126 9.2 0.01137 1.695
2 ACCIDENT ANAL PREV 0001-4575 9082 2.571 3.096 0.371 509 7.0 0.01729 0.840
3 TRANSPORT RES A-POL 0965-8564 3711 2.525 2.855 0.326 129 8.3 0.00801 1.119
4 TRANSPORT SCI 0041-1655 3038 2.294 2.913 0.541 37 >10.0 0.00494 1.706
5 J TRANSP GEOGR 0966-6923 2060 2.214 2.768 0.432 148 4.4 0.00567 0.795
6 TRANSPORT RES E-LOG 1366-5545 2255 2.193 2.943 0.283 99 5.6 0.00718 1.055
7 TRANSPORTMETRICA 1812-8602 241 2.068 2.022 0 3.7 0.00122 0.813
8 TRANSPORT POLICY 0967-070X 1555 1.718 2.084 0.179 134 6.4 0.00419 0.750
9 TRANSPORT RES F-TRAF 1369-8478 1482 1.635 2.349 0.280 100 7.0 0.00329 0.781
10 TRANSPORT RES D-TR E 1361-9209 1666 1.626 2.040 0.206 107 6.6 0.00439 0.746
11 TRANSPORTATION 0049-4488 1629 1.617 2.061 0.696 56 8.3 0.00392 0.952
12 TRANSPORT REV 0144-1647 1016 1.551 2.310 0.892 37 6.7 0.00285 0.927
13 INT J SUSTAIN TRANSP 1556-8318 159 1.447 1.505 0.333 21 3.6 0.00079 0.510
13 MARIT POLICY MANAG 0308-8839 884 1.447 0.116 43 9.0 0.00132
15 INT J SHIP TRANS LOG 1756-6517 129 1.340 1.337 0.143 35 2.9 0.00042 0.272
16 J SAFETY RES 0022-4375 2030 1.303 1.940 0.175 63 8.3 0.00401 0.761
17 TRAFFIC INJ PREV 1538-9588 1106 1.286 1.556 0.296 125 5.1 0.00395 0.560
18 MOBILITIES-UK 1745-0101 323 1.169 1.348 0.200 35 5.0 0.00145 0.641
19 MARIT ECON LOGIST 1479-2931 414 1.045 0.100 20 6.9 0.00103
20 EUR J TRANSP INFRAST 1567-7133 210 1.023 1.132 0.056 18 5.1 0.00073 0.410
Journals 1 - 20 (of 29) [ 1 | 2 ] Page 1 of 2
Página 1 de 2JCR-Web 4.5 Journal Summary List
04/08/2014http://admin-apps.webofknowledge.com/JCR/JCR?RQ=LIST_SUMMARY_JOURN...

1
Alba Martínez López
De: MPM <[email protected]>Enviado el: xoves, 13 de novembro de 2014 3:30Para: 'Alba Martínez López'Asunto: RE: Maritime Policy & Management - Decision on Manuscript ID
TMPM-2012-0103.R3Datos adjuntos: Acceptance letter - Dr Martínez-López.pdf
Dear Prof.Dr. Alba Martínez López Please find attached copy of letter as requested ‐ we have sent in electronic format, please confirm that this will be acceptable, else I can arrange a printed copy to be sent to: The Integrated Group for Engineering Research University A Coruña Edificio de Talleres (Campus de Esteiro) C/ Mendizábal s/n 15403 Ferrol Spain Kind regards Sally Dr Sally Martin Administrative Editor Maritime Policy & Management Email: [email protected] ‐‐‐‐‐Original Message‐‐‐‐‐ From: Alba Martínez López [mailto:[email protected]] Sent: 04 November 2014 01:09 To: [email protected] Subject: RV: Maritime Policy & Management ‐ Decision on Manuscript ID TMPM‐2012‐0103.R3 Dear Dr Martin, When do you estimate that this paper will be published? We suppose that in 2015....in that case, Would it be possible you send to us by post a formal acceptance letter of the paper signed by the editor in chief? I attach an example from another journal. The acceptation mail is not valid for our university system, it demands an acceptance letter like the attached one for the recognition of the paper before its publication.This recognition is important for the financiation of our research group in 2015. Sorry for the inconveniences but that letter is essential for us. Thank you for your comprehension. Sincerely, Prof.Dr. Alba Martínez López (PhD. Naval Engineer and Naval Architect) The Integrated Group for Engineering Research University of A Coruña Edificio de Talleres (Campus de Esteiro) C/ Mendizábal s/n 15403 Ferrol (Spain) Telf. +34981337400 ext. 3848/3866 http://www.gii.udc.es ‐‐‐‐‐Mensaje original‐‐‐‐‐ De: onbehalfof+heather.mclaughlin+canterbury.ac.uk@manuscriptcentral.com [mailto:onbehalfof+heather.mclaughlin+canterbury.ac.uk@manuscriptcentral.com] En nombre de [email protected]

2
Enviado el: sábado, 25 de outubro de 2014 10:33 Para: [email protected] Asunto: Maritime Policy & Management ‐ Decision on Manuscript ID TMPM‐2012‐0103.R3 25‐Oct‐2014 Dear Dr Martínez‐López: Ref: A Multi‐criteria Decision Method for the analysis of the Motorways of the Sea: the application to the case of France and Spain on the Atlantic Coast Our referees and editors have now considered your paper and have recommended publication in Maritime Policy & Management. We are therefore pleased to accept your paper in its current form. Once your paper is allocated to a forthcoming issue, your manuscript files will be forwarded to the publisher for copy editing and typesetting. You will then receive proofs for checking, and instructions for transfer of copyright. The publisher requests that proofs are checked and returned within 48 hours of receipt. Thank you for your contribution to Maritime Policy & Management and we look forward to receiving further submissions from you. Sincerely, Dr McLaughlin Editor, Maritime Policy & Management [email protected] There are now over 1050 Taylor & Francis titles available on our free table of contents alerting service! To register for this free service visit: www.tandfonline.com/alerting.
MARITIME POLICY & MANAGEMENT The flagship journal of international shipping and port research
Editors-in-Chief
Heather McLaughlin Canterbury Christ Church University
Kevin Li Chung-Ang University Email: [email protected]
13 November 2014
Dear Prof. Alba Martínez López,
Re: Acceptance of manuscript for Maritime Policy & Management
Routledge, Taylor & Francis are pleased to accept your paper entitled, ‘A Multi-criteria Decision Method for
the analysis of the Motorways of the Sea: the application to the case of France and Spain on the Atlantic
Coast’ for publication in the Journal Maritime Policy & Management. Your manuscript is scheduled to be
published in 2015.
Should you have further inquiries regarding the publication of this manuscript, please feel free to contact Dr
Sally Martin, the Administrative Editor at [email protected].
Yours sincerely,
Kevin Li
Editor-in-Chief
Maritime Policy & Management

1
Alba Martínez López
De: onbehalfof+heather.mclaughlin+canterbury.ac.uk@manuscriptcentral.com en nombre de [email protected]
Enviado el: sábado, 25 de outubro de 2014 10:33Para: [email protected]: Maritime Policy & Management - Decision on Manuscript ID TMPM-2012-0103.R3
25‐Oct‐2014 Dear Dr Martínez‐López: Ref: A Multi‐criteria Decision Method for the analysis of the Motorways of the Sea: the application to the case of France and Spain on the Atlantic Coast Our referees and editors have now considered your paper and have recommended publication in Maritime Policy & Management. We are therefore pleased to accept your paper in its current form. Once your paper is allocated to a forthcoming issue, your manuscript files will be forwarded to the publisher for copy editing and typesetting. You will then receive proofs for checking, and instructions for transfer of copyright. The publisher requests that proofs are checked and returned within 48 hours of receipt. Thank you for your contribution to Maritime Policy & Management and we look forward to receiving further submissions from you. Sincerely, Dr McLaughlin Editor, Maritime Policy & Management [email protected] There are now over 1050 Taylor & Francis titles available on our free table of contents alerting service! To register for this free service visit: www.tandfonline.com/alerting.

Maritime Policy & Management
My Manuscripts Author Resources
0 Unsubmitted and Manuscripts in Draft
0 Resubmitted Manuscripts in Draft
0 Revised Manuscripts in Draft
0 Submitted Manuscripts
4 Manuscripts with Decisions
0 Manuscripts I Have Co-Authored
0 Withdrawn Manuscripts
0 Invited Manuscripts
Click here to send a manuscript to AJE for English-language editing. NOTE: This will not submit your manuscript to the journal - this link opens a new window for English-language editing services.
There is also a range of language polishing services listed on the Taylor & Francis Author Services WEBSITE .
This section lists the subjects of the five most recent e-mails that have been sent to you regarding your submission(s).
Maritime Policy & Management - Decision on Manuscript ID TMPM-2012-0103.R3 (25-Oct-2014)
Delete
Maritime Policy & Management - Manuscript ID TMPM-2012-0103.R3 (01-Oct-2014)
Delete
Maritime Policy & Management - Decision on Manuscript ID TMPM-2012-0103.R2 (30-Sep-2014)
Delete
Maritime Policy & Management (14-Aug-2014)
Delete
Maritime Policy & Management - Manuscript ID TMPM-2012-0103.R2 (17-May-2014)
Delete
Manuscripts with Decisions
Manuscript ID Manuscript Title Date Submitted
Date Decisioned Status Actions
TMPM-2012-0103.R3
A Multi-criteria Decision Method for the analysis of the Motorways of the Sea: the application to the case of France and Spain on the Atlantic Coast [View Submission]
01-Oct-2014 25-Oct-2014
ADM: Martin, Sally
Accept (25-Oct-2014)Awaiting Production Checklist
view decision letter
TMPM-2012-0103.R2
A Multi-criteria Decision Method for the analysis of the Motorways of the Sea: the application to the case of France and Spain on the Atlantic Coast [View Submission]
17-May-2014 30-Sep-2014
ADM: Martin, Sally
Minor Revision (30-Sep-2014)a revision has been submitted
view decision letter
a revision has been submitted (TMPM-2012-0103.R3)
TMPM-2012-0103.R1 20-Dec-2013 05-May-2014
• To submit a new manuscript, click on the "Submit a Manuscript" link below.• Clicking on the various manuscript status links under "My Manuscripts" will display a list of all the
manuscripts in that status at the bottom of the screen.• To continue a submission already in progress, click the "Continue Submission" link in the "Unsubmitted
Manuscripts" list.
Página 1 de 3ScholarOne Manuscripts#refX#refX
25/10/2014http://mc.manuscriptcentral.com/tmpm

A Multi-criteria Decision Method for the analysis of the Sea Motorways: the application to the case of France and Spain on the Atlantic Coast [View Submission]
ADM: Martin, Sally
Conditional Accept (05-May-2014)a revision has been submitted
view decision letter
a revision has been submitted (TMPM-2012-0103.R2)
TMPM-2012-0103
A Multi-criteria Decision Method for the analysis of the Sea Motorways: the application to the case of France and Spain on the Atlantic Coast [View Submission]
30-Jul-2012 26-Nov-2013
ADM: Pang, AliceADM: Martin, Sally
Minor Revision (26-Nov-2013)a revision has been submitted
view decision letter
a revision has been submitted (TMPM-2012-0103.R1)
© Thomson Reuters | © ScholarOne, Inc., 2014. All Rights Reserved.ScholarOne Manuscripts and ScholarOne are registered trademarks of ScholarOne, Inc.ScholarOne Manuscripts Patents #7,257,767 and #7,263,655.
@ScholarOneNews | System Requirements | Privacy Statement | Terms of Use
Buzzwok
Amazing Five Frozen Hotels Made Of Snow And Ice, Would You Spend A Night...
Buzzwok
Senior Women With Tattoos Show That Aging With Tattoos Looks Pretty Good!...
Buzzwok
The Most Terrifying Yet Bizarre Ancient Grave Yard With COFFINS Nailed...
Buzzwok
Top 10 Destination For Modern Travelers. If You Visit These Places, Consider...
Buzzwok
What To Do When 2 Giant Kangaroos Fight In The Neighborhood? Grab A Beer...
Buzzwok
Would You Apply For The Toughest Job In The World? As Terrifying As It...
Buzzwok
20 Pics That Will Make You Look Harder A Second Time! | BuzzWok.com |...
Buzzwok
When Students Take Off Their Cloths To Support A Charity Cause, Wonderful...
Buzzwok
You Definitely Do Not Want To See These Kind Of Pictures In A Wedding!...
Buzzwok
16 Gay Celebrities And Their Stories Behind The Announcement Of Coming...
Buzzwok
Amazing Discovery About The Origins of Sex. And Not, It’s Not Missionary...
Buzzwok
10 Of The Best Nature Photo Entries To The 2014 National Geographic Photo... Buzzwok
A British Parrot Return Home After Missing For Four Years, Speaking A New...
You might enjoy reading: ×
Página 2 de 3ScholarOne Manuscripts#refX#refX
25/10/2014http://mc.manuscriptcentral.com/tmpm

For Peer Review O
nly
A Multi-criteria Decision Method for the analysis of the
Motorways of the Sea: the application to the case of France
and Spain on the Atlantic Coast
Journal: Maritime Policy & Management
Manuscript ID: TMPM-2012-0103.R3
Manuscript Type: Original Article
Keywords: Freight Markets, Liner shipping, Logistics, Ports, Regulation, Risk, Policy,
Sustainability
URL: http://mc.manuscriptcentral.com/tmpm
Maritime Policy & Management

For Peer Review O
nly
Author's Response to Decision Letter for (TMPM-2012-0103.R2)
A Multi-criteria Decision Method for the analysis of the Motorways of the Sea: the application
to the case of France and Spain on the Atlantic Coast
COMMENTS IN BRIEF Dear editor, congratulations for the journal and thanks to give us the opportunity to participate in it. First of all, we would like to thank all the reviewers for their comments and suggestions; we are plenty aware of the time dedicated to the revision and we would like to thank their attention. In what follows we provide a brief description of the main changes that have been made and how every reviewer’s suggestions have been addressed. Comments to the Author • Pdf page 2: Line 34. Instead of “Despite the political support of the European Union for the identification of the most interesting Motorways of the Sea” use “Despite the European Union political support to identify the most interesting Motorways of the Sea”. Done • Pdf page 2: Line 37. Instead of “for the identification” use “to identify”. Done • Pdf page 2: In the abstract, the word “interesting” does not provide scientific content. Have Authors thought about other words like feasible, adequate? Give it a thought. Thank you for this appropriated observation. We have substituted interesting by feasible in the second line and by relevant in the third line from the end of the abstract. • Pdf page 4: Lines 11 to 13: “Despite this political support, the last decades have witnessed relevant public investments in land-based transport infrastructures but this financial support was not equally applied to seaway infrastructures whereby, a distorted transport marketplace was generated in favour of land transport [6]”. This paragraph needs to be revised. At an EU level this paragraph is questionable and can raise a lot of discussion because it is not correct. EU funding for public investments in infrastructure has favoured low carbon modes, subject to specific public calls texts and evaluation criteria, and whose number of financed projects depends upon a number of parameters, and two immediate ones are the number of proposals submitted and their quality; this depends from the private sector participation and from the involvement of national public authorities. At a national level it may be accepted, but even here are rules to follow. And yes, a couple of years ago road transport received most of the funding, but rail missed it. The focus of land infrastructure funding falls now on rail because of its numerous bottlenecks, and because rail is part of the low carbon modes. Therefore, this can not be strictly criticised as it appears in the paper even though I can understand what you are trying to say. In the light of this, the distorted transport marketplace, does exist because of two factors: 1) Road and rail have taken advantage of public funding because they are more visible 2) The maritime industry has not been able to take advantage of existing funding, given its inherent business structure, a situation that is now slowly changing. This paragraph was based on the conclusions of the Dr. Baird and Dr. Gesé and Bair which were published by Maritime Policy and Management: Baird A. 2007. The economics of Motorways of the sea. Maritime Policy and Management. 34:4 pp 287-310 Gesé X. and Baird A. 2013. Motorways of the sea policy in Europe. Maritime Policy and Management. 40:1 pp10-26 Consequently, we agree with the reviewer: the current paragraph can arise a wide discussion about the reasons of the distortion of the transport marketplace in EU. Although this is very interesting for our work, obviously it is not the main aim of this paper. Thus, we have decided to simplify the paragraph: ‘Despite this political support, the last decades have witnessed a distorted transport marketplace which has resulted in a favorable situation for the land transport’
Page 1 of 33
URL: http://mc.manuscriptcentral.com/tmpm
Maritime Policy & Management
123456789101112131415161718192021222324252627282930313233343536373839404142434445464748495051525354555657585960

For Peer Review O
nly
• Pdf page 4: Lines 22: an “a” is missing before “frequency”. Done • Pdf page 4: Lines 25: add “alone” after “transport”. Done • Pdf page 4: Lines 29 to 35: the paragraph starting with “This aspect was…..” does not link to the previous one, needs clarification, and lacks scientific support. As it is the first group of studies that Authors refer to is out of context, and whatever studies are considered they should be identified in the paper. In order to improve the continuity of the text, we have changed the expression of the paragraph: ‘The selection of the ports, and therefore the maritime routes chosen in the intermodal transport, was mainly tackled from….’ The scientific references are provided in the next paragraph. Regarding the first group of studies, these are related mainly to tramp traffic, however the Motorways of the sea projects, presented by the shipping companies to take advantage of the public funds in the framework of the Bilateral Agreement between Spain and France for the development of the Motorways of the Sea, are very significant to this regard. We have introduced a sentence in the body text that tries to clarify this comment. • Pdf page 6 Line 52. Write abbreviation “(RI)” after “Relevance Indexes” this facilitates the reading of the paper equations. Done • Pdf page 7 Line 11. Write abbreviation “(DIR)” after “Differential Indexes of Relevance” this facilitates the reading of the paper equations. Done • Pdf page 7 Lines 23, 29. Please consider revising the abbreviation “IPT” since it does no match with its meaning “Port Index”. Check the overall paper We have substituted IPT by PI (Port Index) along the text. We have also introduced after “Port Index´´ the abbreviation (PI) as it was indicated in the previous comments of the reviewer. • Pdf pages 11 and 13. Abbreviations should be avoided in the head of sections. Done
Page 2 of 33
URL: http://mc.manuscriptcentral.com/tmpm
Maritime Policy & Management
123456789101112131415161718192021222324252627282930313233343536373839404142434445464748495051525354555657585960

For Peer Review O
nlyA Multi-criteria Decision Method for the analysis of the Motorways of
the Sea: the application to the case of France and Spain on the Atlantic
Coast
Abstract
Despite European Union political support to identify the political support of the European Union for
the identification of the most interesting feasible Motorways of the Sea, the final decision can only be
made by Private Shipping Companies, which are operators of a unique stretch of the intermodal chain.
This paper provides a multi-criteria decision method for the identification ofto identify the most suitable
Motorways of the SeaSea Motorways taking into account the competitiveness of whole intermodal
routes versus the alternative of road transport from the loader´s perspective. The analysis is carried out
assuming a `many to many´ transport model. Firstly indexes of time and cost were defined and
evaluated for every available route in the model in accordance with a multi-criteria decision matrix.
Secondly, through a Monte Carlo simulation a sensitivity analysis was carried out in order to evaluate
the influence on the results of the forecast assumed to construct the matrix. The results obtained are
not only quantitative, but also qualitative. The development of intermodal routes via Motorways of the
Sea is especially relevant interesting for the peripheral European Union countries. Due to the relevance
of the freight flow between France and Spain and the congestion of their connections through the
Pyrenees, the method proposed was applied to the analysis of this particular case
Keywords: Motorways of the Sea, Selection of Maritime Routes, Monte Carlo
Simulation, Sensitivity Analysis, Multi-criteria decision method
Page 3 of 33
URL: http://mc.manuscriptcentral.com/tmpm
Maritime Policy & Management
123456789101112131415161718192021222324252627282930313233343536373839404142434445464748495051525354555657585960
For Peer Review O
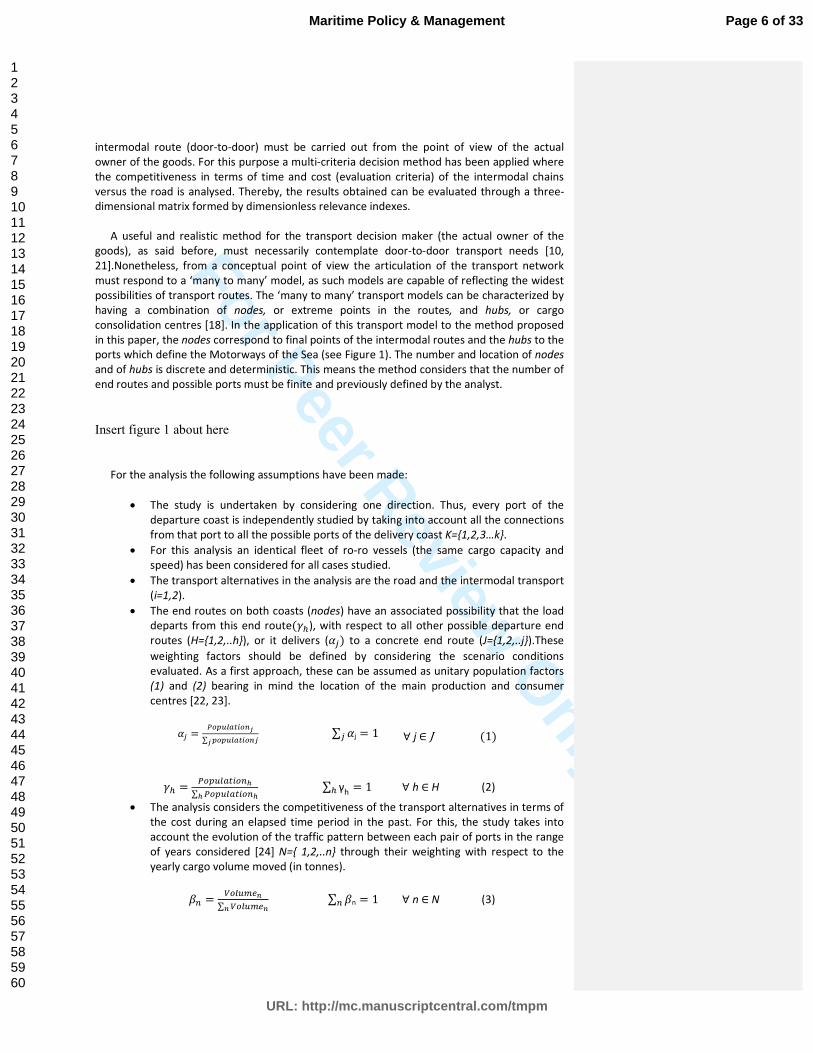
nlyIntroduction
The level of congestion reached by some of the main land transport corridors within the
European Union (EU) suggests the need to divert traffic from roads to alternative modes of
transport with the aim of reducing the costs derived from the high traffic concentration borne
by the former. This reduction would affect both social costs (related mainly to accident levels
and environmental degradation) and private costs (longer travelling time).
To achieve this goal, the development of Short Sea Shipping (SSS) has been contemplated in
European Transport Policy as a fundamental stretch of the intermodal chains. Although the
definitions given for SSS are numerous, according to the communication from the European
Commission of 29 June 1999 [1] the term refers to “the movement of cargo and passengers by
sea between ports situated in geographical Europe or between those ports situated in non-
European countries having a coastline on the enclosed seas bordering Europe”.
The main advantages associated with SSS compared to road transport are: its lower
number of accidents, its low infrastructure costs, its capacity to reach ultra-peripheral regions
and its lower impact on the environment (authors such as Vanherle et al. [2] have made
important clarifications regarding this subject). However, notwithstanding all these
advantages, road transport continues to be predominant for channelling the flow of intra-
communitarian freight. The main reasons why transport decision-makers are reluctant to
adopt intermodal transport are related to the perception of SSS as an out-dated, slower, rigid
and complex alternative from an administrative point of view, in addition to being less reliable.
Potential users thus, tend to consider SSS to be a less satisfactory option than road transport
when offering a door-to-door service [3, 4].
In an attempt to invert this perception, the White Paper on Transport (2001) introduced
the concept of the Sea Motorway as a tool to develop SSS. Motorways of the Sea are not only
maritime corridors but also a network of ports and intermodal services which are able to offer
a door-to-door transport through their correct integration in the intermodal chains for a
particular zone of the EU [5]. In 2003, the European Commission revised the Trans- the
European Network of Transport (TEN-T) including as an objective for 2010 the implementation
of Motorways of the Sea in 4 corridors (TEN-T Project 21): i) the Baltic Sea Motorway; ii) the
Western Europe Sea Motorway ; iii) the South-East Europe Sea Motorway; and iv) the South-
West Europe Sea Motorway, connecting Spain, Portugal, France, Italy and Malta, and linking
up with the South-East Europe Sea Motorway, including links to the Black Sea. Despite this
political support, the last decades have witnessed relevant public investments in land-based
transport infrastructures but this financial support was not equally applied to seaway
infrastructures whereby, a distorted transport marketplace was generated in which has
resulted in a favourable situation for the of land transport [6]. Consequently, the responsibility
for the establishment of the successful Motorways of the Sea and their correct integration
within the intermodal chains was left by the most member states to the private initiative [7].
One exception however, is the case of the Motorways of the Sea between Spain and France in
the Atlantic. On this occasion both countries agreed to boost the most suitable and viable
Motorways of the Sea projects [8], which met the requirements demanded, subsidizing up to
30% of the operative cost during the first three operation years.
Aside from the choice of ports of call, the setting-up of Motorways of the Sea requires the
establishment of a frequency of service for these connections, which will make it possible to
offer a door-to-door service in similar conditions of cost and quality to those offered by road
transport alone [9]. In other words, the success of the Motorways of the Sea depends on their
capacity to integrate their services in an intermodal chain of transport without additional costs
due to bureaucracy or inefficient port services [5, 10]. The same principle is applicable to SSS
services, since Motorways of the Sea are specific short sea shipping services. All this makes
the selection of the port critical for the success of the Sea Motorway [5]. The selection of the
ports, and therefore the maritime routes chosen in the intermodal transportis aspect was
Page 4 of 33
URL: http://mc.manuscriptcentral.com/tmpm
Maritime Policy & Management
123456789101112131415161718192021222324252627282930313233343536373839404142434445464748495051525354555657585960

For Peer Review O
nlymainly tackled from two different approaches: from the point of view of the shipping
companies and from the modal choice perspective. In the first group the works devoted to
port selection within the SSS framework are very scarce and tend to be limited to the water
borne context (the Motorways of the sea projects, which were presented by the shipping
companies to take advantage of the public funds in the framework of the Bilateral Agreement
between France and Spain for the development of the Motorways of the Sea, are very
significant to this regard [8]), whereas in the second approach, the analyses are focused on
establishing the minimum thresholds of distances between ports or between end routes to
ensure the competitiveness of the intermodal transport versus other alternatives.
Nevertheless, these ranges of distances try to offer general recommendations from the
study of particular cases approached as ‘one origin to one destination’ models. Hence, in
accordance with the conclusions of previous researches the Motorways of the Sea through
Atlantic ports prove to be interesting for maritime inter-port distances ranging between 834
and 1400 km (see projects from the IV Framework programme of the European Commission
[11], or those financed by the Spanish Ministry of Development [12]). Likewise, the EU [1] has
also recommended respecting the minimum threshold of 1385 km of land distance to establish
an intermodal chain of transport (these references were established for the European case)
which is very close to the recommendation of Jiang et al. [13] who proposed 1400 km. The
WEST MOS project, in 2008 [14] also concluded a minimum land distance of 1000 km for the
use of intermodal transport in Spain. Other projects even proposed thresholds for the relative
weight of the road haulage into the intermodal chain to keep the interest in this transport
mode. Thereby in 2005, the INTEGRATION project [15] suggested land stretches should be as
much as 60% of the intermodal route distance, while Ametller [16] affirmed that for the case
of intermodal transport from Spain and a total distance of 1600 km the maximum road
haulage should be 50%. For other contexts, see for example Brooks and Trifts [17].
This paper propose to adopt the perspective of the transport service as a whole
considering that the decision maker of the transport mode is the loader, in this case, the actual
owner of the goods. As a consequence, the transport need demanded by the decision maker
will be a door-to-door service, this forces to evaluate the transport modes according to their
capacity to offer this transport service. On the other hand, the intermodal transport through
Motorways of the Sea must be analysed as a ‘many to many’ transport model. This is a
transport network with many possible origins and destinations, nodes, which share a common
trunk haul: the Sea Motorway [18], which is identified by a pair of ports (hubs). According to
previous considerations, the aim of this paper is to provide a method able to identify the ports
that form the most suitable maritime route to support an intermodal chain that is competitive
with respect to road transport. To support the comprehension of the proposed method, a case
study: the implementation of a Sea Motorway that connects the Atlantic Coastline of Spain
and France, has been used as an application example in this paper.
The method was split into two parts. The first one aims to rank quantitatively the maritime
routes, for this a multi-criteria decision matrix has been initially defined. In a second step a
Monte Carlo simulation was applied to the matrix with the intention of meeting the risk
assumed with the decisions made through the evaluation of the matrix, and to identify the
most influent variables on the success of the intermodal transport.
The first step: the method for the quantification of the results
The multi-criteria decision method has been applied in combination with the analysis of
scenarios by other authors for the selection of ports [19, 20]. However, most of these studies
were focused on the tramp traffic and approached from the point of view of the shipping
company using data obtained from the stated preference methods. The present paper aims to
evaluate different possibilities of maritime routes (Motorways of the Sea) but integrated into
the intermodal chains. This involves that, the competitiveness evaluation of the whole
Formatted: Font: (Default) Calibri, 11 pt, NotItalic
Formatted: Font: (Default) Calibri, 11 pt, NotItalic
Formatted: Font: (Default) Calibri, 11 pt, NotItalic
Page 5 of 33
URL: http://mc.manuscriptcentral.com/tmpm
Maritime Policy & Management
123456789101112131415161718192021222324252627282930313233343536373839404142434445464748495051525354555657585960
For Peer Review O
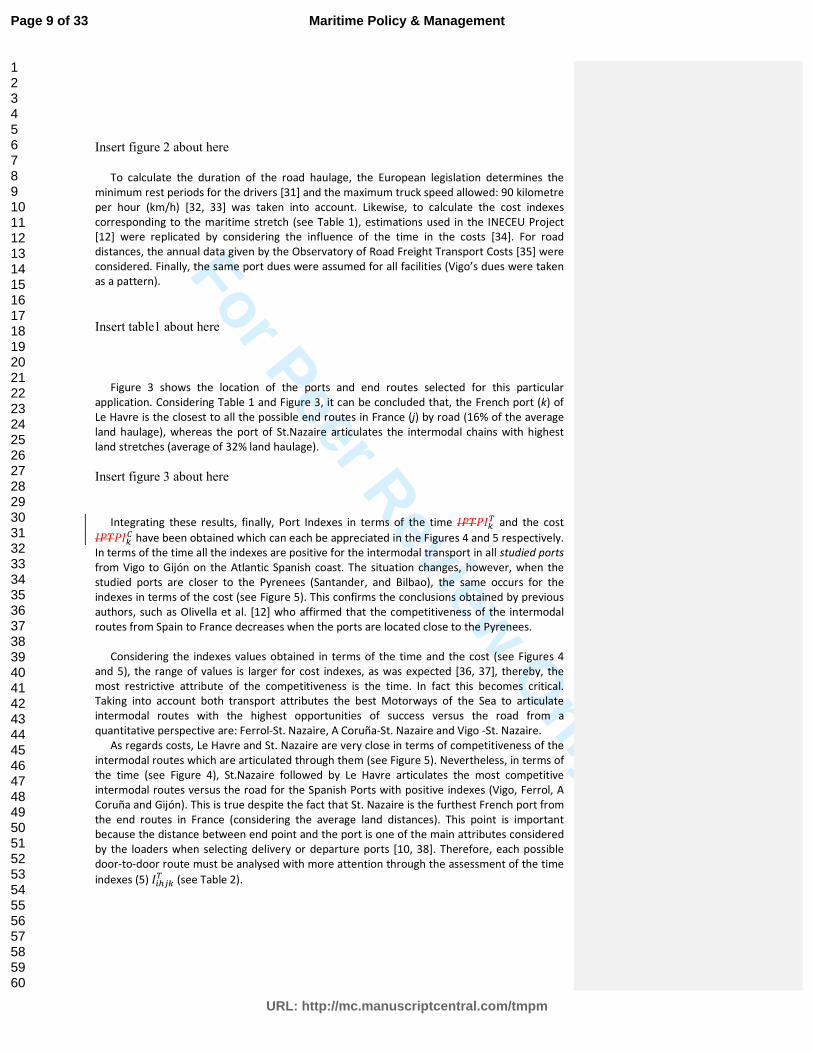
nlyintermodal route (door-to-door) must be carried out from the point of view of the actual
owner of the goods. For this purpose a multi-criteria decision method has been applied where
the competitiveness in terms of time and cost (evaluation criteria) of the intermodal chains
versus the road is analysed. Thereby, the results obtained can be evaluated through a three-
dimensional matrix formed by dimensionless relevance indexes.
A useful and realistic method for the transport decision maker (the actual owner of the
goods), as said before, must necessarily contemplate door-to-door transport needs [10,
21].Nonetheless, from a conceptual point of view the articulation of the transport network
must respond to a ‘many to many’ model, as such models are capable of reflecting the widest
possibilities of transport routes. The ‘many to many’ transport models can be characterized by
having a combination of nodes, or extreme points in the routes, and hubs, or cargo
consolidation centres [18]. In the application of this transport model to the method proposed
in this paper, the nodes correspond to final points of the intermodal routes and the hubs to the
ports which define the Motorways of the Sea (see Figure 1). The number and location of nodes
and of hubs is discrete and deterministic. This means the method considers that the number of
end routes and possible ports must be finite and previously defined by the analyst.
Insert figure 1 about here
For the analysis the following assumptions have been made:
• The study is undertaken by considering one direction. Thus, every port of the
departure coast is independently studied by taking into account all the connections
from that port to all the possible ports of the delivery coast K={1,2,3…k}.
• For this analysis an identical fleet of ro-ro vessels (the same cargo capacity and
speed) has been considered for all cases studied.
• The transport alternatives in the analysis are the road and the intermodal transport
(i=1,2).
• The end routes on both coasts (nodes) have an associated possibility that the load
departs from this end route(��), with respect to all other possible departure end
routes (H={1,2,..h}), or it delivers (��) to a concrete end route (J={1,2,..j}).These
weighting factors should be defined by considering the scenario conditions
evaluated. As a first approach, these can be assumed as unitary population factors
(1) and (2) bearing in mind the location of the main production and consumer
centres [22, 23].
�� =��� ����
∑ �� ����� ∑ �j� = 1 ∀ j ∈J (1)
�� =��� ����
∑ ��� ����� ∑ γ
h� = 1 ∀ h ∈ H (2)
• The analysis considers the competitiveness of the transport alternatives in terms of
the cost during an elapsed time period in the past. For this, the study takes into
account the evolution of the traffic pattern between each pair of ports in the range
of years considered [24] N={ 1,2,..n} through their weighting with respect to the
yearly cargo volume moved (in tonnes).
�� =������
∑ ������� ∑ �n� = 1 ∀ n ∈ N (3)
Page 6 of 33
URL: http://mc.manuscriptcentral.com/tmpm
Maritime Policy & Management
123456789101112131415161718192021222324252627282930313233343536373839404142434445464748495051525354555657585960

For Peer Review O
nlyOwing to the fact that volume of trade and the evolution of transport costs are inversely
related, the flows of freight could benefit from a reduction of the latter. Such a reduction
could be in monetary terms or in terms of time [25]. Likewise, the time and cost variables have
been remarked as decisive factors in the selection of the transport mode by numerous
previous studies [26-28].Consequently, the competitiveness of the transport modes was
evaluated according to the time and the costs expended on each route. Assuming the previous
points, indexes to assess each of these criteria, as in (4) and (5) are proposed, where (4) is the
cost index and (5) is the time index. Both indexes are normalized according to the two
transport alternatives which have been taken into consideration (i)
������ = 1 −
"�#��$�∑ "�#��$�%#&'
∑ ������ (
�)* = 1 (4)
�����+ = 1 −
+���#��$∑ +���#��$%#&'
∑ �����+(
�)* = 1 (5)
Thus, the closer the index value is to 1, the less time/cost will be needed with respect to its
alternative. Therefore the interest of the loader in that transport mode versus the alternative
one will be higher when evaluating only each pair of nodes h and j (like a ‘one to one’ model,
this is, all transportation load departures from the same point h and it deliveries to the same
port j) through two ports (the studied port and the port k).
Once the indexes have been calculated, the assessment of each Sea Motorway alternative
is aggregated. This aggregation is done using Relevance Indexes (RI), defined according to (6)
and (7). In this case, they are interpreted as the probability (or relevance) of the decision-
maker choosing a particular transport option (mode and route), taking into account the
transport attributes (in terms of time and cost) to the all extreme routes defined (‘many to
many’ model approach).
,���� = ∑ ∑ (�� × .������
× ��/)�� ∀ h ∈ H; ∀ j ∈ J (6)
,���+ = ∑ ∑ (�� × .�����
+ × ��/)�� ∀ h ∈ H; ∀ j ∈ J (7)
It is worthwhile to know the advantages that the intermodal alternative offers compared to
road transport. For this purpose, the Differential Indexes of Relevance (DIR) in terms of time
and cost have been defined according to (8) and (9).These indexes facilitate the comparison of
the competitiveness associated with the intermodal chains articulated through different
Motorways of the Sea.
0�,�+=,�(�
+ - ,�*�+ (8)
0�,�� =.,�(��
1 - ,�*��1 / × β� (9)
Indeed, the Differential Indexes of Relevance can be assumed as the final Port Indexes (PI),
because they are able to reflect the appeal of each Sea Motorway versus the road alternative
for transport users. The higher the index value, the higher the appeal of the intermodal option
is. Thereby, in terms of time, the Port Index matches the respective Differential Index of
Relevance (�232��+ = 0�,�
+). However, this coincidence does not occur in terms of cost. In
this case the Differential Index of Relevance (0�,�� ) is related to a particular year (n), whereas
the Port Index must take into account the total period of time considered, as shown in (10):
Formatted: Font: (Default) Calibri, 11 pt,
Italic
Formatted: Font: (Default) Calibri, 11 pt,Italic
Formatted: Font: (Default) Calibri, 11 pt,
Page 7 of 33
URL: http://mc.manuscriptcentral.com/tmpm
Maritime Policy & Management
123456789101112131415161718192021222324252627282930313233343536373839404142434445464748495051525354555657585960

For Peer Review O
nly
�232�� = ∑ .0�,��
/� ∀ n ∈ N (10)
The assessment model for the case of France-Spain
For this particular case, it is important to bear in mind that the amendment of the TEN-T led
to the signing of a bilateral agreement between Spain and France in 2006 to promote the
development of Motorways of the Sea by linking up their respective Atlantic coastlines (‘The
declaration of intentions about the Motorways of the Sea’,[8]). As a result, an
intergovernmental commission was created with the aim of drawing up a proposal for the
selection of Sea Motorway projects. The requirements are: i) a service frequency of at least 4
departures per week each way during the first two years of operation; ii) a frequency of at
least 7 departures per week each way once these 2 years have elapsed; iii) annual traffic of at
least 350,000 semi-trailers should have been reached at the end of 5 years; and iv) it should
have risen to 850,000 after 10 years. The selected projects would receive additional resources.
Taking into account the date of this agreement and the convenience of the medium term
study a time range of 4 years from 2006 to 2009 (N=1,2…,4) has been assumed for the
analysis:. In this manner, the real advantage obtained by the use of intermodal transport
during these years versus the road alternative can be demonstrated.
Afterwards it is necessary to identify the end points of the routes on both coasts. For this
purpose the most consumption and production centres of load, which could be transported
through SSS in the Atlantic were assumed as the most probable end routes. In the case of
France, these are coinciding with the most populated cities; these should be considered as
possible end points. In 2008 the most populated cities in France were (in thousands of
habitants according to INSEE, 2009, French Government [29]): Paris 11,694, Lyon 6,121, Lille
4,022 and Rennes 3,139. Excepting Lyon, the rest of the cities could be reached from the
Atlantic coast specifically through the ports of St.Nazaire, Le Havre and Calais. For the case of
Spain the situation is different. The most important ports on the Atlantic coast are also the
most important production centres of their hinterlands [30], therefore the land distance on
the Spanish coast can be rejected with respect to the whole intermodal chain. Consequently,
the end routes in Spain can be assumed as the ports and the ‘many to many’ transport model
previously presented (see Figure 1) must be adapted to this situation through a ‘one to many’
model [18] (see Figure 2). Hence, in this particular case:
• The studied ports were those Spanish ports on the Atlantic coast which are
considered as Category A ports (they have international relevance and an annual
volume of traffic of over 1.5 million tons of freight or 200,000 passengers). These
are: Vigo, Ferrol, A Coruña, Gijón, Santander and Bilbao. On the other coast the
French ports (k) considered were: St.Nazaie, Le Havre and Calais; K={1,2,3}.
• For the analysis of the time invested in the maritime stretch a fleet of ro-ro vessels
with cargo capacity of 157 trucks each (1960 lane meters) and with a service speed
of 30 knots (kn) has been assumed. Additionally, a constant loading speed at all
ports of 34 trucks per hour (trucks/h) (information provided by Spanish Stowage
Society) has been estimated for all ports studied.
• The transport alternatives in the analysis were the road and the intermodal
transport (i=1,2).
• The end routes on the Spanish coast were coincident with the ports, therefore for
each Spanish studied port it is always h=1, while the French nodes were: Rennes,
Paris and Lille; J={1,2,3}.
Page 8 of 33
URL: http://mc.manuscriptcentral.com/tmpm
Maritime Policy & Management
123456789101112131415161718192021222324252627282930313233343536373839404142434445464748495051525354555657585960
For Peer Review O
nlyInsert figure 2 about here
To calculate the duration of the road haulage, the European legislation determines the
minimum rest periods for the drivers [31] and the maximum truck speed allowed: 90 kilometre
per hour (km/h) [32, 33] was taken into account. Likewise, to calculate the cost indexes
corresponding to the maritime stretch (see Table 1), estimations used in the INECEU Project
[12] were replicated by considering the influence of the time in the costs [34]. For road
distances, the annual data given by the Observatory of Road Freight Transport Costs [35] were
considered. Finally, the same port dues were assumed for all facilities (Vigo’s dues were taken
as a pattern).
Insert table1 about here
Figure 3 shows the location of the ports and end routes selected for this particular
application. Considering Table 1 and Figure 3, it can be concluded that, the French port (k) of
Le Havre is the closest to all the possible end routes in France (j) by road (16% of the average
land haulage), whereas the port of St.Nazaire articulates the intermodal chains with highest
land stretches (average of 32% land haulage).
Insert figure 3 about here
Integrating these results, finally, Port Indexes in terms of the time �232��+ and the cost
�232�� have been obtained which can each be appreciated in the Figures 4 and 5 respectively.
In terms of the time all the indexes are positive for the intermodal transport in all studied ports
from Vigo to Gijón on the Atlantic Spanish coast. The situation changes, however, when the
studied ports are closer to the Pyrenees (Santander, and Bilbao), the same occurs for the
indexes in terms of the cost (see Figure 5). This confirms the conclusions obtained by previous
authors, such as Olivella et al. [12] who affirmed that the competitiveness of the intermodal
routes from Spain to France decreases when the ports are located close to the Pyrenees.
Considering the indexes values obtained in terms of the time and the cost (see Figures 4
and 5), the range of values is larger for cost indexes, as was expected [36, 37], thereby, the
most restrictive attribute of the competitiveness is the time. In fact this becomes critical.
Taking into account both transport attributes the best Motorways of the Sea to articulate
intermodal routes with the highest opportunities of success versus the road from a
quantitative perspective are: Ferrol-St. Nazaire, A Coruña-St. Nazaire and Vigo -St. Nazaire.
As regards costs, Le Havre and St. Nazaire are very close in terms of competitiveness of the
intermodal routes which are articulated through them (see Figure 5). Nevertheless, in terms of
the time (see Figure 4), St.Nazaire followed by Le Havre articulates the most competitive
intermodal routes versus the road for the Spanish Ports with positive indexes (Vigo, Ferrol, A
Coruña and Gijón). This is true despite the fact that St. Nazaire is the furthest French port from
the end routes in France (considering the average land distances). This point is important
because the distance between end point and the port is one of the main attributes considered
by the loaders when selecting delivery or departure ports [10, 38]. Therefore, each possible
door-to-door route must be analysed with more attention through the assessment of the time
indexes (5) �����+ (see Table 2).
Page 9 of 33
URL: http://mc.manuscriptcentral.com/tmpm
Maritime Policy & Management
123456789101112131415161718192021222324252627282930313233343536373839404142434445464748495051525354555657585960

For Peer Review O
nlyInsert figure 4 about here
Insert figure 5 about here
Table 2 shows the time indexes (5) for every routes (for all cases h=1), the non-competitive
indexes (�����+ < 0,5)have been highlighted. As said before, these indexes evaluate the
interest of the loader in a transport mode versus the alternative one by assuming a ‘one to
one’ transport model. Through the assessment of this Table, numerous cases where the most
competitive intermodal routes in terms of the time are not those with the least distance for
land haulage can be found. For example, on the Vigo-Lille route the closest port to Lille is
Calais, so through this port the land haulage is 7.5% of the chain and the time index is
IT
2133=0.60 whereas the intermodal chain of Vigo-St.Nazaire-Lille with a land haulage of 42%
achieves IT
2131=0.61.
Moreover, numerous cases have been detected where the recommended range of
maritime distances for the transport through SSS is not accomplished, but they are however
shown as competitive routes in terms of the time and viceversa. For instance, as Vigo-Le
Havre-Rennes, this route has a land haulage distance of 18% (less than the 30 % is
recommended by Ametller X. [16]) and the land distance between Vigo-Rennes is 1453 km
thus, reaching all the minimum distances recommended by previous authors: Jiang et al. [13];
EU recommendation [1]. Furthermore, the maritime distance of Vigo-Le Havre (Table 1) also
meets the minimum distance recommended: 833 km by SPC-Spain [39] and INECEU project
[12]. Notwithstanding all these aspects the intermodal route is still not competitive with
respect to the road in terms of time (IT
2122=0.49).
Insert table2 about here
Thus, according to the analysis undertaken, the application of the recommended distances
and minimum thresholds is not enough to ensure the competitiveness in terms of the time (a
critical parameter) for intermodal chains versus the road. Moreover, the proximity of a port to
the consumer or production centre has not been shown as the most suitable attribute for port
selection regarding the intermodal transport. As a result, the selection of an intermodal route
should be considered for every concrete scenario and for the door-to-door needs [40].
The second step: the sensitivity analysis and the risk assessment
Owing to the fact that the inputs used for the construction of the multi-criteria matrix in
the first step of the method are related to a temporal range (∀n ∈ N), their values are the
result of forecasts or estimates. This necessarily implies to accept a risk level on the variables
used (uncertainty variables or inputs) and therefore on results obtained. Consequently, the
decisions made through the quantitative evaluation of the Port Indexes (see expressions 8 and
10 and their values in Figures 4 and 5) can involve some mistakes. Thus, to assess the goodness
of a particular Sea Motorway selection, a risk analysis of the Port Index values was carried out
by taking into account the variation in the variables contemplated. For that, once the multi-
critreria decision matrix has been performed, the most uncertainty variables were firstly
identified; the variation of these led to different scenarios which should be analyzed.
Notwithstanding this, there are different methods for the simulation of the scenarios. In this
case, the Monte Carlo method (already used in this field by other authors [41-43]) was chosen
because it allows the evaluation of all selected variable variations at the same time to calculate
Page 10 of 33
URL: http://mc.manuscriptcentral.com/tmpm
Maritime Policy & Management
123456789101112131415161718192021222324252627282930313233343536373839404142434445464748495051525354555657585960
For Peer Review O
nlythe Port Indexes according to an initially determined probability distribution for all variables.
This signifies a notable advantage with regard to most of the methods for simulating scenarios
(Herz, Unidimensional, etc.) which uniquely contemplate static scenarios (through an
optimistic or pessimistic approach.
The probability distributions for the value of the Port Indexes and their sensitivity analysis
were thereby obtained from Monte Carlo simulations. On the one hand, this allows
ascertaining the risk associated with the selection of the ports. For that purpose the Port
Indexes were evaluated to check whether these indexes were good estimators for the
corresponding distributions obtained and, consequently, whether the decisions made on the
basis of the values of these indexes would be reliable. On the other hand, the sensitivity
analysis obtained from the simulation allows determining the influence of the different inputs
(controllable and non-controllable variables) assumed for the construction of the decision
matrixes.
In the particular case of Spain and France in the Atlantic coast, all the scenarios evaluated
were generated in a past period of time (2006-2009) this involves that the variables values
were already known (they are not the result of forecasts). However, these were provided by
different information sources through diverse formats (formulations and data), therefore a
reasonable level of risk was also recognized in this case. For this reason triangular probability
distributions being assumed for all variables [44,45] with a variation range of 20% between the
most and least probable values. The amount of tests carried out in each simulation was
1,600,000, with a 100% certainty for all results obtained.
Insert figure 6 about here
For each simulation, the statistical data related to the real probability distribution of the
Indexes (and the theoretical distribution that best fits) and the influences of each variable on
the Port Indexes were obtained. This last point will also allow the risk to be quantified in
association with the lack of control over any variables, and to explain the results achieved in
the risk analysis.
The measurement of the goodness of the Port Indexes as estimators was carried out by
considering three features:
• Bias: measured as the difference between the mean and the base case (value of the
index obtained through the expressions provided).
• Consistency level: considered as the proximity from the base case to the most
probable value in the distribution.
• Efficiency level: the lowest standard deviation means the highest efficiency level for
the indexes [44, 46]. This was measured through the Coefficient of Variability.
The analysis of the Port Indexes in terms of the time 89:;: for the case of
France-Spain
For the calculation of the Port Indexes in terms of time, the following inputs were assumed
as variables: population factors (αj), the loading/unloading speed in port, the truck speed and
the vessel speed. The values of these inputs were taken as uncertainty variables and so could
change in other scenarios. This fact implies a risk for the value of the Port Indexes and, hence,
Page 11 of 33
URL: http://mc.manuscriptcentral.com/tmpm
Maritime Policy & Management
123456789101112131415161718192021222324252627282930313233343536373839404142434445464748495051525354555657585960

For Peer Review O
nlyfor the selected route. Accordingly, these inputs were considered as variables in the
simulations for this Index.
Insert figure 7 about here
Figure 7 shows the probability distributions shapes obtained from the simulations
undertaken for each port. As can be seen in this figure, all the probability distributions shapes
of the Port Indexes are very similar for the intermodal routes articulated through the maritime
routes from the same Spanish port to every French ports (in Figure 7 in horizontal sense, e.g.
Vigo-St.Nazaire, Vigo-Le Havre, Vigo-Calais). Nevertheless, the opposite is not met. In other
words, in terms of the time the choice of the Spanish port from a French one involves more
risk for the intermodal transport than the choice of the French port from a Spanish one. This is
mainly due to the coastal geography of the countries (Spain is a peninsula see Figure 3) and to
the fact that ‘one to many’ transport model is assumed for the case of France-Spain (see Figure
2). The latter implies that the election of the Spanish port from the French side, not only
determines the Sea Motorway, but also the extreme point of the whole route (for the
intermodal chain and also for the unimodal transport). However, independently on the French
port selected, from one Spanish port the end routes were always the same for the unimodal
and intermodal transport.
The distributions shapes obtained (continuous for the routes articulated from Vigo to Gijón
on the Spanish coast) can be explained by taking into account the results obtained from the
sensitivity analysis (see Table 3). According to the two parameters that influence greatly on the
variance of the�232��+: the truck speed (negative influence) and the vessel speed (positive
influence). The relative importance between them determines the shape of the distributions
obtained.
Insert table3 about here
Indeed the influence of the truck speed on the �232��+ is greatly governed in the European
Union by the Regulation 561/2006 [31] which determines the driver’s maximum continuous
driving hours per day along with rest periods. This leads to stepped functions for the time
invested in the road transport which likewise influences on the probability functions shapes
obtained for the Port Index. Consequently, depending on road route geography slight changes
in truck speed could mean a difference of one day’s travel.
Even though the influence of the truck speed is a very important factor in all cases, its
effect is moderate for the case of Vigo and Gijón due to the higher influence of the vessel
speed in these ports. As a consequence, the positive and negative contributions balance
themselves out for the case of Vigo, whereas in the case of Gijón the positive contributions are
even higher than the negative ones (the real distribution is actually very close to a continuous
beta distribution).
Here it is important to pay attention to the fact that the intermodal routes articulated
through the Le Havre port have the shortest road haulages distances. For this reason their
competitiveness versus the road is highly influenced by the truck speed. The opposite occurs
for the intermodal routes through St.Nazaire (those with the largest road haulage distance),
their competitiveness is the least dependent on the truck speed as these routes also take
advantage (positive influence) of an increase of the speed on the road haulage. Finally, as
expected, while the relative importance of the vessel speed increases with maritime distance,
the relative weight of the loading/unloading speed is inversely proportional to the maritime
route [47].
Page 12 of 33
URL: http://mc.manuscriptcentral.com/tmpm
Maritime Policy & Management
123456789101112131415161718192021222324252627282930313233343536373839404142434445464748495051525354555657585960

For Peer Review O
nlyIt is interesting to note that routes with Indexes which are less dependent on the truck
speed (non-controllable variable) are those with the highest improvement range. In this case
they are the routes articulated through Gijón and Vigo to any French port (see Table 3).
Table 4 shows the values obtained from the simulations carried out using the Monte Carlo
method. Differences between the index values and the means reflect that the bias taken in the
selection of the port is low for all cases. However, the level of dispersion of the data is high,
with elevated standard deviations and coefficients of variability. Nonetheless, the preferential
order of the considered optimal routes remains the same due to the consistency of the index
in all the cases and the distance in absolute values of the Indexes among ports.
Insert table4 about here
Looking at the coefficients of variability at Table 4, the lowest dispersion has been achieved in
the intermodal routes through Gijón-St.Nazaire (0.118), Ferrol-St.Nazaire (0.188), A Coruña-
St.Nazaire (0.215) and Vigo-St.Nazaire (0.278). Therefore, taking into account the risk analysis,
the Indexes in these routes are good estimators (their port indexes are centred, efficient and
consistent). As such, for these routes the decisions made through the quantitative analysis of
values of Port Indexes in terms of the time does not involve risk.
From the risk assumed and the dependence on non-controllable variables obtained from
sensitivity analysis of the Port Indexes in terms of time, the most suitable routes would be
Gijón-St.Nazaire and Vigo-St. Nazaire. Moreover, these routes obtained very close absolute
values for the Port Indexes in the decision matrix �232��+ = 0.11 (see Figure 4).
The analysis of the Port Indexes in terms of the cost 89:;= for the case of
France-Spain
For the risk analysis of this index, the assumptions taken into account were: population size
at the French route endpoints (��), the weighting factor regarding the recorded annual volume
of traffic between France and Spain(��), the land transport cost per km and the freight per
transport unit (considering the fuel cost and the capital cost for the shipping company
independently).
The probability distributions shape is shown in Figure 8. According to this, it can be
concluded that in all cases the theoretical probability distribution (beta) fits the real
distribution. This already forwards a reduction of the risk associated to the decisions made
through this index (�232�� ) in comparison to the previous index (�232��
+). In this case, all the
distributions are continuous (there are no important steps).This is mainly owing to the fact
that the total influence of all the variables for all the routes is positive (see Table 5).
Insert figure 8 about here
Insert table 5 about here
Table 5 shows the results from the sensitivity analysis. Once again, the most influential
variable on the index value is related to the truck: the cost per km. For each Spanish port, the
positive influence of the road cost increases when the influence of the road stretch in the
intermodal transport decreases. Namely, the intermodal routes with large maritime stretches
Page 13 of 33
URL: http://mc.manuscriptcentral.com/tmpm
Maritime Policy & Management
123456789101112131415161718192021222324252627282930313233343536373839404142434445464748495051525354555657585960
For Peer Review O
nlytake advantage of the effects of economies of scale. Therefore an increase of the cost per
kilometre by road still favours more this advantage in costs. So the influence of this variable is
higher for the maritime routes to Calais versus those to St.Nazaire when the Port Indexes are
positive, this is true from Vigo, A Coruña and Ferrol. As the cost per kilometre by road is not
controllable the preferable maritime routes are those which articulate intermodal routes
which are less influenced by it. This is so for the maritime routes from Vigo, A Coruña and
Ferrol (see Table 5). Furthermore, as expected, the influence of the loading/unloading costs
increases with decreasing maritime distance, but total freight costs exert little influence on the
index value for all the routes.
On the other hand, it is worth noting that the influence of the population factor on the Port
Index is not only dependent on the average distance from the city to the port, or on the
absolute value of the population factor for one city versus the others, but rather on a
combination of all these factors. Hence once again, the attribute of the distance between port
and end route is under discussion now in terms of the cost.
Insert table 6 about here
The statistical results obtained for all the routes (see Table 6) show, as expected (see Figure
8), a high coincidence between the respective value of the Port Indexes in terms of cost and
the means of their simulated distributions. Furthermore, the indexes are efficient and
consistent. These are, consequently, good estimators of the probability distributions obtained
and, the risk associated with the selection of all the routes considering the absolute value of
this index is, therefore, low. Thereby, the analysis of risk for the Port Index in terms of the cost
in the study case is not selective.
Conclusions
The method presented involved two evaluations of the intermodal transport articulated
through different Motorways of the Sea based on the ‘many to many’ transport model: a
quantitative and qualitative analysis. The method may be used to make an initial assessment
of the alternative potential routes in order to develop a Sea Motorway that articulates
competitive intermodal chains versus unimodal transport. In the first step of the method a
multi-criteria decision matrix is built through different indexes. From this first step applied to
the study case presented in the paper, the case of France-Spain, it can be concluded that the
advantage of the intermodal services versus unimodal transport is especially noticeable when
considering the cost of the service. As expected, the time criterion is the most restrictive point
with respect to the competitive advantage of intermodal transport. Taking both perspectives
into account, the intermodal alternative is preferable to its unimodal counterpart for all the
maritime routes from the Spanish ports: Vigo, A Coruña and Ferrol to the French ports (see
Table 7). The port of Gijón represents an inflexion point where the Indexes start to take
negative values towards the Pyrenees until Bilbao. The maritime routes with the highest
potential for success from a quantitative point of view are A Coruña-St.Nazaire, Ferrol-
St.Nazaire and Vigo-Saint Nazaire (see Table 7).
In the first step it is important to note that the competitiveness of the intermodal route in
terms of the time does not increase when the road haulage is lower. Hence, this feature for
the selection of the ports in the intermodal chain is under discussion. Additionally, in this step
there are many occasions where the traditional distance ranges recommended for the
intermodal chain are met but the chains are not competitive versus the road transport.
Page 14 of 33
URL: http://mc.manuscriptcentral.com/tmpm
Maritime Policy & Management
123456789101112131415161718192021222324252627282930313233343536373839404142434445464748495051525354555657585960
For Peer Review O
nlyConsequently, the generalization of distance ranges is not recommended to ensure the
establishment of competitive intermodal chains versus the road.
Insert table 7 about here
As the value of the indexes depends on the assumptions considered to calculate them, in
the second step it has been convenient to analyse the risk assumed when selecting a particular
alternative through the evaluation of the indexes. The Monte Carlo simulation was the chosen
tool for this purpose. The results obtained from the simulations allow for stating that, while
the Port Indexes in terms of the cost are good estimators of the probability distributions
obtained for all cases, the Port Indexes in terms of the time just proved to be good estimators
for the routes: Gijón-St.Nazaire, Ferrol-St.Nazaire, A Coruña-St.Nazaire and Vigo-St.Nazaire.
According to this method, the risk assumed by accepting the results of Port Indexes associated
with intermodal versus unimodal transport on these routes is low (see Table 7).
The Monte Carlo simulation also led to the drawing of conclusions from the sensitivity
analysis. For both indexes, the most influential variable is a non-controllable one: the truck
speed (limited by regulations) and the road cost (limited by the cost of gasoil in the trade),
respectively. Thereby, routes with the least sensitive indexes to these variables have a larger
improvement range through their own capacities (they are more sensitive to controllable
variables). The influence of the truck speed (negative) on the Port Indexes in terms of time is
less for the intermodal routes with longest land stretches (see Table 7). The opposite occurs,
however, regarding the influence of the road cost on the positive Port Indexes in terms of cost.
Considering the time advantage as being preferential and the independence of the route
with respect to the non-controllable variables, the selected routes should be Vigo-St. Nazaire
and Gijón-St.Nazaire (see Table 7). Finally, it should be noted that the influence of the truck
speed on the competitiveness of the intermodal transport, in the European Union, is not
continuous but occurs in steps. Therefore for many routes, slight modifications in truck speed
lead to high differences in the competitiveness of intermodal transport. This point is highly
dependent on the geographical location of the routes as well as on the European Regulation
for road transport. Thereby, the results achieved in this paper confirm that the European
Regulations about maximum permitted speed and the driver’s maximum continuous driving
hours on road can be used as efficient policy instruments to discourage the European road
freight transport [48]
On the other hand, it was concluded that the loading/unloading speed is highly relevant in
the intermodal routes with the shortest maritime routes as previous authors had noted.
Finally, from the results achieved the total freight costs were not so relevant with regard to
competitiveness in terms of cost as expected. This paper has accordingly also tried to order
and quantify the main factors that determine the competitiveness of intermodal versus
unimodal transport in order to act on them.
References
1. THE EUROPEAN PARLIAMENT, The economic and social committee and the committee of the
regions, 1999. The Development of Short Sea Shipping in Europe: A Dynamic Alternative in a
Sustainable Transport Chain. Second Two-yearly Progress Report. COM(1999) 317 final
2. Vanherle, K. and Delhaye, E.,2010, Road versus short sea shipping: comparing emissions and
external costs, Proceedings of the 2010 Conference of the International Association of Maritime
Economics (IAME). Lisbon, Portugal, July.
3. Medda, F., Pels, E. and Trujillo, L., 2010. Incentive mechanism for the development of SSS.
Proceedings of the 2010 Conference of the International Association of Maritime Economics
(IAME). Lisbon, Portugal, July.
Page 15 of 33
URL: http://mc.manuscriptcentral.com/tmpm
Maritime Policy & Management
123456789101112131415161718192021222324252627282930313233343536373839404142434445464748495051525354555657585960
For Peer Review O
nly4. Triunfante Martins, P., Moura, A., Andrade-Campos, A. and Lobo, V. 2010, Genetic algorithms
approach for containers fleet management dependent on cargo and their deadlines.
Proceedings of the 2010 Conference of the International Association of Maritime Economics
(IAME). Lisbon, Portugal, July.
5. Paixão Casaca, Ana C., 2008. Motorway of the sea port requirements: the viewpoint of port
authorities, International Journal of Logistics Research and Applications, 11(4):279-294
6. Baird A. 2007. The economics of Motorways of the sea. Maritime Policy and Management. 34:4
pp 287-310
7. Gesé X. and Baird A. 2013. Motorways of the sea policy in Europe. Maritime Policy and
Management. 40:1 pp10-26
8. GOVERMENT OF SPAIN, Ministry on foreign relations, 2006, Aplicación provisional del
Intercambio de cartas, de 9 de junio y 3 de julio de 2006, relativo a la creación de una Comisión
intergubernamental hispano-francesa para proponer una selección de proyectos de autopistas
del mar entre España y Francia [Creation of a French Spanish intergovernmental commission for
the selection of projects about Motorways of the Sea between Spain and France]. Report
Boletín Oficial del Estado (BOE). Nº 265 (2006)
9. González Laxe, F. and Novo Corti, I.,2007, Las autopistas del mar en el contexto europeo [The
Motorways of the Sea in the European context], Boletín Económico ICE 2902: 33-47.
10. Paixao Casaca, A., Carvalho, S. and Oliveira, M. 2010, Port choice in the European short sea
shipping market: the point of view of point of port authorities. Proceedings of the 2010
Conference of the International Association of Maritime Economics (IAME). Lisbon, Portugal,
July.
11. EMMA study, 1996-1999.European Marine Motorways, the potential for transferring freight
from road to high speed sea transport system. IV Framework Programme of the European
Commission. Retrieved from: http://www.ub.edu/geoport/contents.html
12. Olivella Puig, J., Martínez de Osés and J., Castells Sanabra, M. 2004. Intermodalidad entre
España y Europa, el proyecto INECEU. [Intermodality between Spain and Europe, the INECEU
project]. Research group TRANSMAR, Department of Science and Nautical Engineering.
Polytechnic University of Cataluña in Spain. Retrieved from: http://upcommons.upc.edu/e-
prints/handle/2117/524
13. Jiang, F. Johnson P, and Calzada, C., 1999. Freight demand characteristics and mode choice: and
analysis of the results of the modeling with disaggregated relevant preference data. Journal of
Transportation and statics, 2:149-158.
14. WEST MOS. Western Europe Sea Transport and Motorway of the Sea, 2005-2008. Trans
European Transport Networks budget. Retrieved from: http://westmos.eu/es/results.aspx
15. INTEGRATION. Integration of Sea Land technologies for an efficient door to door intermodal
transport. 2002-2005. V Framework Programme of the European Commission. Retrieved from:
http://www.transport-research.info/web/projects/project_details.cfm?id=7033
16. Ametller X.,2007. Optimización del transporte de mercancías mediante tráfico marítimo de
corta distancia [Optimization of the load transport through the short sea shipping] . Master’s
thesis, Department of Transport Engineering of the Polytechnic University of Cataluña, Spain.
Retrieved from:
http://upcommons.upc.edu/pfc/bitstream/2099.1/4942/1/Mem%C3%B2ria.pdf
17. Brooks M. and Trifts V., 2008. Short sea shipping in North America: understanding the
requirements of Atlantic Canadian shippers, Maritime Policy and Management 35(2): 145-158.
18. Daganzo C. 2005. Logistic systems Analysis. Berlin Springer
19. Chou C., Chu C. and Liang G.,2003. A transportation demand split model for international ports
in Taiwan area. Journal of the Eastern Asia Society for Transportation studies, 5:625-637.
20. Ugboma, C., Ugboma O. and Ogwude,I.,2006. An Analytic hierarchy process (AHP) approach to
port choice decisions-empirical evidences from Nigerian ports, Maritime Economics and
Logistics, 8 (2): 251-266.
21. Romana F.,Pels E. and Trujillo L.,2010. Incentive mechanisms for the development of short sea
shipping. Proceedings of the 2010 Conference of the International Association of Maritime
Economics (IAME). Lisbon, Portugal, July.
22. Callejón M., 2003. En busca de las economías externas [Searching of external economies].
Ekonomiaz 53, 2ºcuatrimestre: 75-89.
Page 16 of 33
URL: http://mc.manuscriptcentral.com/tmpm
Maritime Policy & Management
123456789101112131415161718192021222324252627282930313233343536373839404142434445464748495051525354555657585960

For Peer Review O
nly23. Van Oort F.and Stam E., 2005. Agglomeration economies and entrepreneurship: Testing for
spatial externalities in the Dutch ICT industry. Max Planck Institute for Research into economics
systems discussion Papers on entrepreneurship, growth and Public Policy, Nº 0905. Retrieved
from https://papers.econ.mpg.de/egp/discussionpapers/2005-09.pdf
24. Tasto M., 2010. Changing traffic patterns in European Shortsea container traffic. Proceedings of
the 2010 Conference of the International Association of Maritime Economics (IAME). Lisbon,
Portugal, July.
25. Limao, N. and Venables, A.,2001. Infrastructure, geographical disadvantage, transport costs and
trade, The World Bank Economic Review 15(3): 451-479.
26. Garcia-Menendez, L., Martinez-Zarzoso, I. and Pinero de Miguel, D. 2004, Determinants of
mode choice between road and shipping for freight transport: evidence for four Spanish
exporting sectors, Journal of Transport Economics and Policy 38(3): 447-466.
27. Bergantino, A. and Bolis, S., 2008. An analysis of maritime ro-ro freight transport service
attributes through adaptive stated preference: an application to a sample of freight forwarders.
European Transport, 25-26: 33-51.
28. Culligane K and Toy N., 2000. Identifying influential attributes in freight route/mode choice
decisions: a content analysis. Transport Research. Part E, vol.36: 41-53.
29. GOVERNMENT OF FRANCE, National Institute of statistics and economic studies, The population
Census. Retrieved from http://www.recensement-1999.insee.fr/
30. García-Alonso L. and Sánchez-Soriano J., 2010, Analysis of the Evolution of the Inland Traffic
Distribution and Provincial Hinterland Share of the Spanish Port System, Transport Reviews
30(3): 275-297.
31. THE EUROPEAN PARLIAMENT AND THE COUNCIL OF THE EUROPEAN UNION, Regulation (EC)
No 561/2006 of the European Parliament and of the Council of 15 March 2006 on the
harmonisation of certain social legislation relating to road transport and amending Council
Regulations (EEC) No 3821/85 and (EC) No 2135/98 and repealing Council Regulation (EEC) No
3820/85 (Text with EEA relevance)
32. THE COUNCIL OF THE EUROPEAN COMMUNITIES COUNCIL DIRECTIVE 92/24/EEC of 31 March
1992 relating to speed limitation devices or similar speed limitation on-board systems of certain
categories of motor vehicles
33. THE COUNCIL OF THE EUROPEAN COMMUNITIES Council Directive 92/6/EEC of 10 February
1992 on the installation and use of speed limitation devices for certain categories of motor
vehicles in the Community
34. Polo, G., 2000. Sobre la estructura de costes del transporte marítimo en España. [About the
cost structure of maritime transport in Spain].Estudios e Investigaciones marinas. Vol.1, (1):27-
45
35. GOVERNMENT OF SPAIN, Ministry of Public Works,2010, Observatorio de costes del transporte
de mercancías por carretera Octubre 2010 [Observatory of road freight transport costs,
October, 2010]. Madrid. Retrieved from
http://www.fomento.gob.es/MFOM/LANG_CASTELLANO/DIRECCIONES_GENERALES/TRANSPO
RTE_POR_CARRETERA/SERVICIOS_TRANSPORTISTA/OBSERVATORIO_COSTES/observatorios.ht
m
36. Feo, M., Espino, R.and García L. 2009. TRA2006-09939/TMAR: Desarrollo del transporte
marítimo de corta distancia: soluciones para la creación de Autopistas del mar [Development of
the short sea shipping transport: solutions for the creation of Motorways of the Sea]. Spanish
Ministry of Education and Science (CICYT 2006-2009) Retrieved from
http://www.alde.es/encuentros/anteriores/xeea/trabajos/f/pdf/012.pdf
37. Castells I Sanabra M. 2009. Short Sea shipping efficiency analysis considering high-speed craft
as an alternative to road transport in SW Europe. Doctoral dissertation, Department of Nautical
Science and Engineering of the Polytechnic University of Cataluña, Spain).Retrieved from
http://www.tesisenred.net/bitstream/handle/10803/7011/TACS3de3.pdf?sequence=3
38. D´Este G.M, and Merick S., 1992. Carrier selection in a Ro-Ro ferry trade. Part 1 and 2. Decisions
factors and attitudes. Maritime Policy and Management, vol 19, nº2: 115-126.
39. SPANISH SHORTSEA PROMOTION CENTER-SPC SPAIN http://www.shortsea.es/english
40. Magala M. and ,Sammons A.,2008. A new approach to the port choice modelling. Maritime
Economics and Logistics 10(1/2): 10-34.
Page 17 of 33
URL: http://mc.manuscriptcentral.com/tmpm
Maritime Policy & Management
123456789101112131415161718192021222324252627282930313233343536373839404142434445464748495051525354555657585960

For Peer Review O
nly41. Lu K., and Meng Q.,2010. Reliability analysis of liner shipping network capacity. Proceedings of
the 2010 Conference of the International Association of Maritime Economics (IAME). Lisbon,
Portugal, July.
42. Clark, S. and Watling D., 2005. Modelling network travel time reliability under stochastic
demand. Tranportation Research Part B, 39:119-140.
43. Sumalee, A. and Kurauchi F.,2006. Network capacity reliability analysis considering traffic
regulation after a major disaster. Networks and Spatial Economics. Vol.6,(3-4): 205-219.
44. Sapag, N.,2001. Evaluación de proyectos de Inversión en la empresa [Assessment of investment
projects in bussiness]. (Buenos Aires, Argentina: Prentice Hall)
45. Suddhendu, B., 1991. Topics in statistical Methodology.(New York, United States of America:
John Wiley &Sons).
46. Ayyub, B., 2003. Risk Analysis in Engineering and economics. (Ontario, Canada: Chapman & Hall,
CRC Press).
47. Siu J. and Van de Voorde, E.,2010.Scenario analysis for supply chain integration in container
shipping. Proceedings of the 2010 Conference of the International Association of Maritime
Economics (IAME). Lisbon, Portugal, July.
48. Baindur D. and Viegas J., 2011. Challenges to implementing motorways of the sea concept-
lessons from the past. Maritime Policy and Management 38(7): 673-690.
Page 18 of 33
URL: http://mc.manuscriptcentral.com/tmpm
Maritime Policy & Management
123456789101112131415161718192021222324252627282930313233343536373839404142434445464748495051525354555657585960

For Peer Review O
nly
Figure 1. Model ‘Many to many’ applied for the study of the transport alternatives. 223x135mm (96 x 96 DPI)
Page 19 of 33
URL: http://mc.manuscriptcentral.com/tmpm
Maritime Policy & Management
123456789101112131415161718192021222324252627282930313233343536373839404142434445464748495051525354555657585960

For Peer Review O
nly
Figure 2. Model ‘One to many’ applied for the study of the transport alternatives in the case: Spain-France. 152x95mm (96 x 96 DPI)
Page 20 of 33
URL: http://mc.manuscriptcentral.com/tmpm
Maritime Policy & Management
123456789101112131415161718192021222324252627282930313233343536373839404142434445464748495051525354555657585960
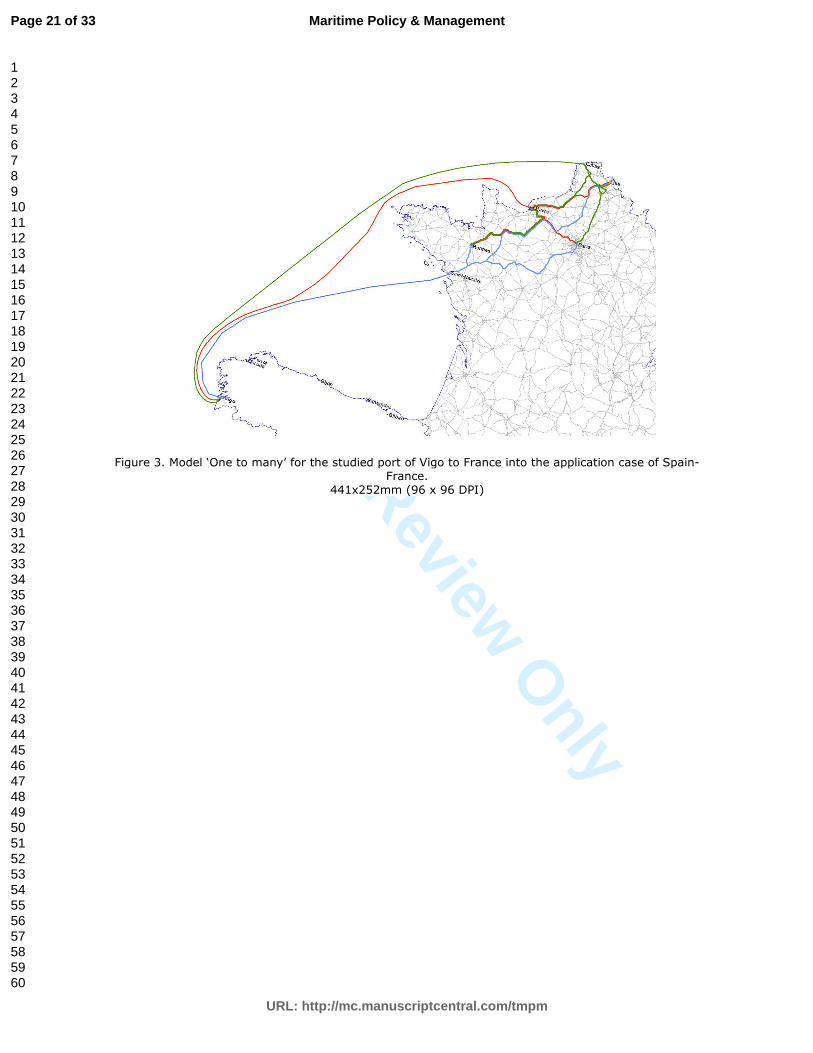
For Peer Review O
nly
Figure 3. Model ‘One to many’ for the studied port of Vigo to France into the application case of Spain-France.
441x252mm (96 x 96 DPI)
Page 21 of 33
URL: http://mc.manuscriptcentral.com/tmpm
Maritime Policy & Management
123456789101112131415161718192021222324252627282930313233343536373839404142434445464748495051525354555657585960

For Peer Review O
nly
Figure 4. Port Indexes in terms of the time PI<k></T> for the case of France-Spain. 206x167mm (96 x 96 DPI)
Page 22 of 33
URL: http://mc.manuscriptcentral.com/tmpm
Maritime Policy & Management
123456789101112131415161718192021222324252627282930313233343536373839404142434445464748495051525354555657585960
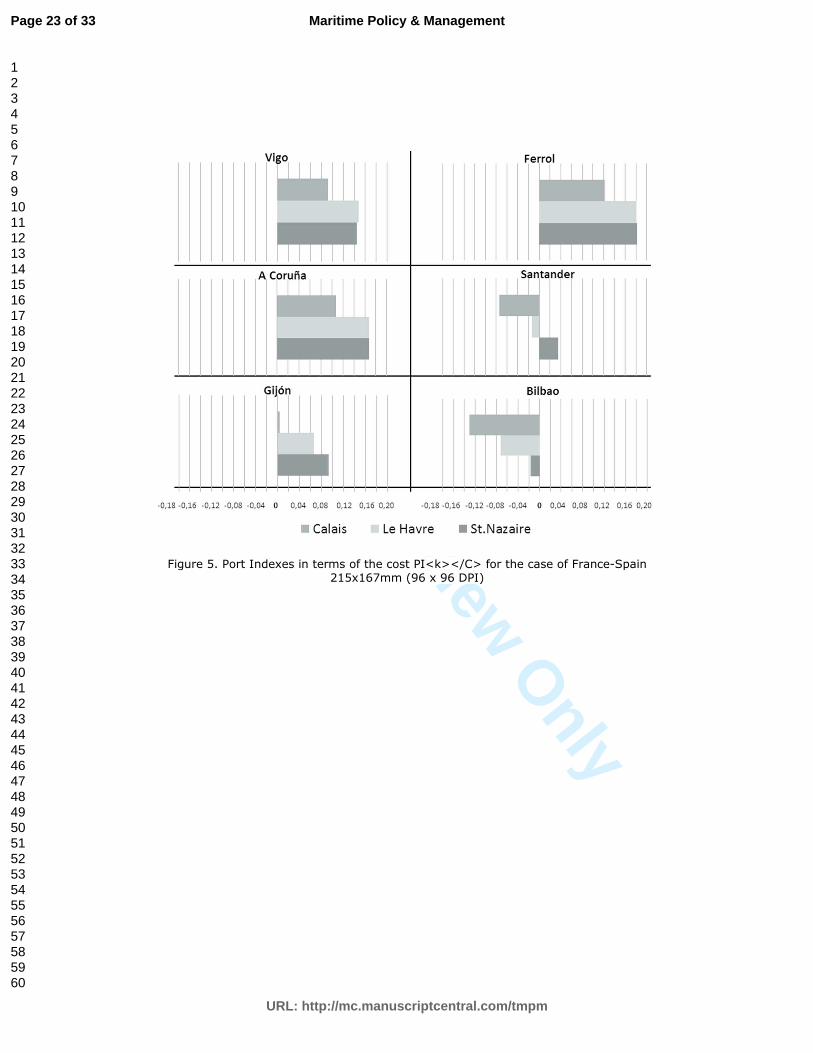
For Peer Review O
nly
Figure 5. Port Indexes in terms of the cost PI<k></C> for the case of France-Spain 215x167mm (96 x 96 DPI)
Page 23 of 33
URL: http://mc.manuscriptcentral.com/tmpm
Maritime Policy & Management
123456789101112131415161718192021222324252627282930313233343536373839404142434445464748495051525354555657585960
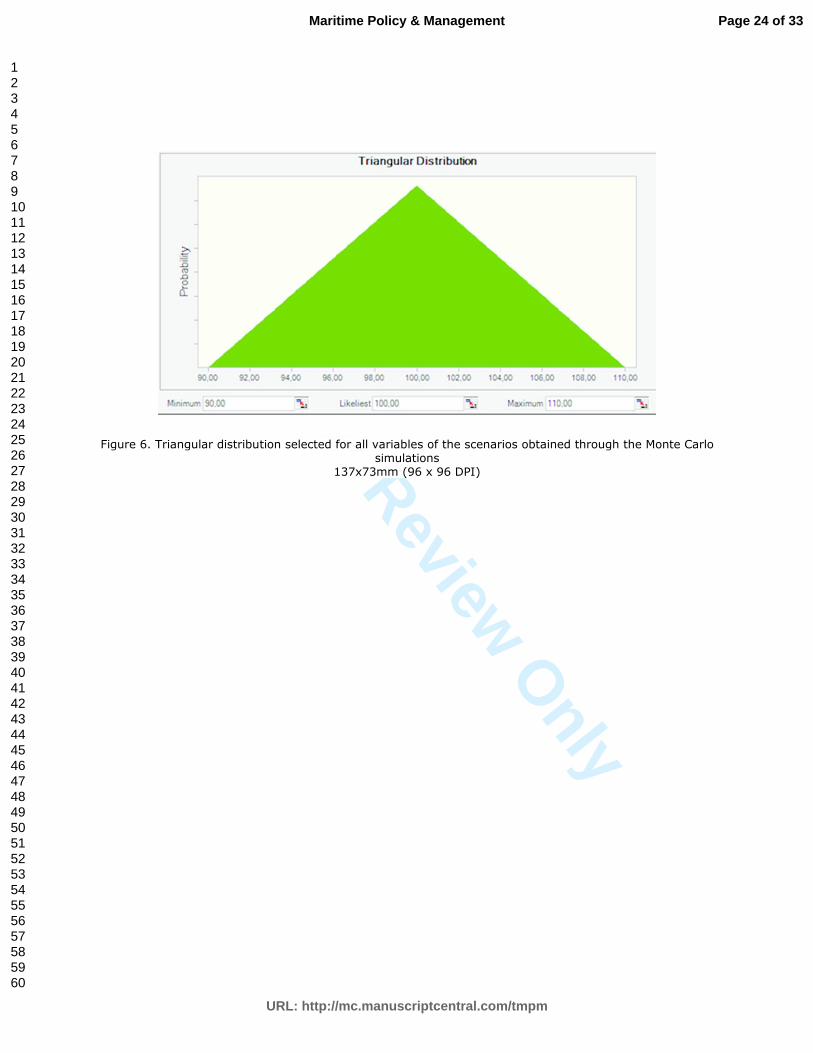
For Peer Review O
nly
Figure 6. Triangular distribution selected for all variables of the scenarios obtained through the Monte Carlo simulations
137x73mm (96 x 96 DPI)
Page 24 of 33
URL: http://mc.manuscriptcentral.com/tmpm
Maritime Policy & Management
123456789101112131415161718192021222324252627282930313233343536373839404142434445464748495051525354555657585960
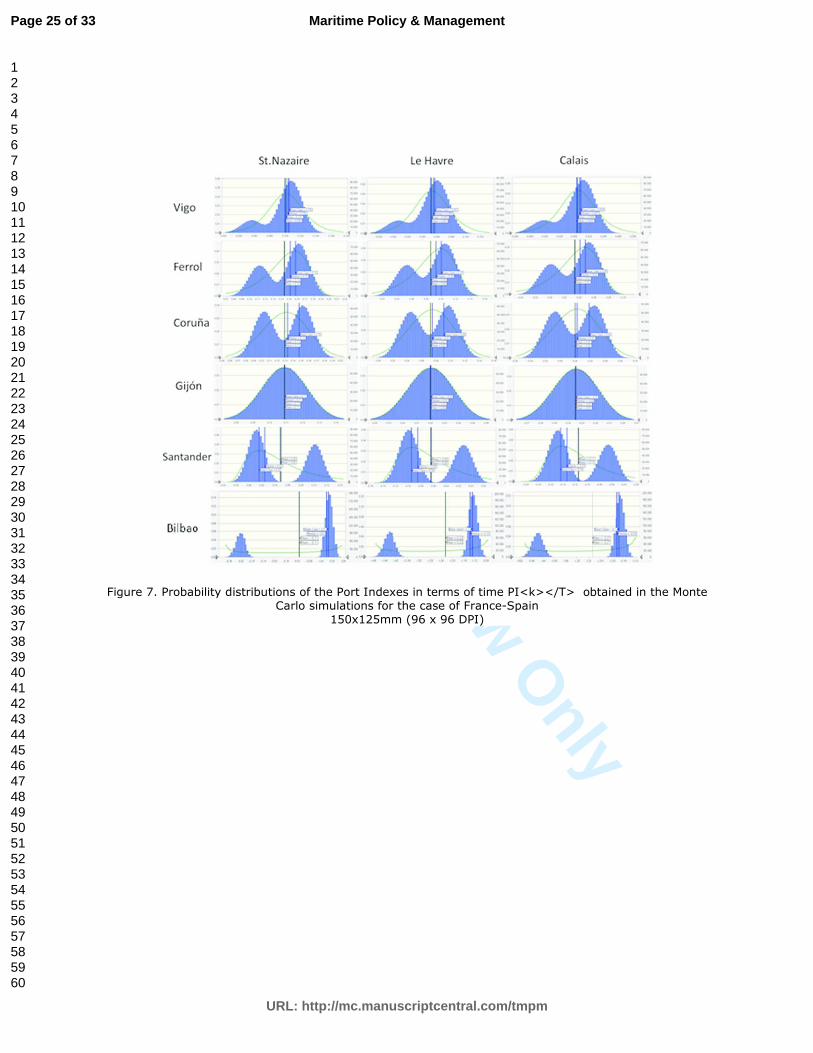
For Peer Review O
nly
Figure 7. Probability distributions of the Port Indexes in terms of time PI<k></T> obtained in the Monte Carlo simulations for the case of France-Spain
150x125mm (96 x 96 DPI)
Page 25 of 33
URL: http://mc.manuscriptcentral.com/tmpm
Maritime Policy & Management
123456789101112131415161718192021222324252627282930313233343536373839404142434445464748495051525354555657585960

For Peer Review O
nly
Figure 8. Probability distributions of the Port Indexes in terms of cost PI<k></C> obtained in the Monte Carlo simulations for the case of France-Spain
151x122mm (96 x 96 DPI)
Page 26 of 33
URL: http://mc.manuscriptcentral.com/tmpm
Maritime Policy & Management
123456789101112131415161718192021222324252627282930313233343536373839404142434445464748495051525354555657585960
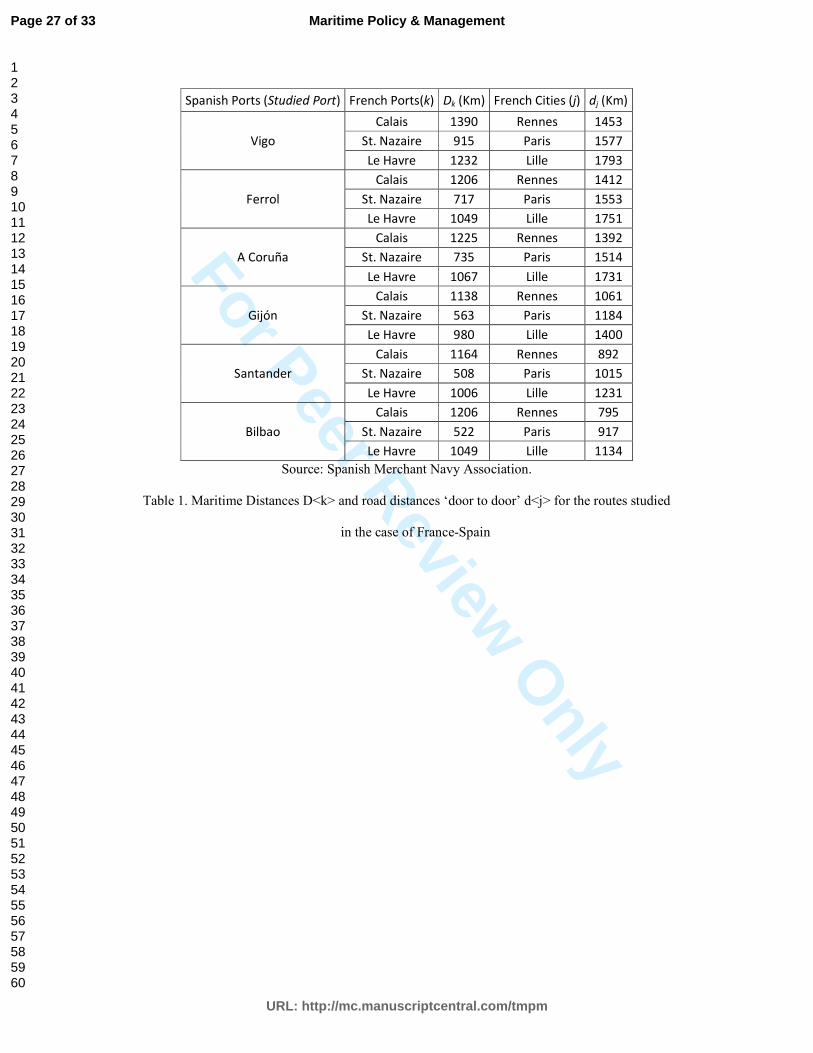
For Peer Review O
nly
Spanish Ports (Studied Port) French Ports(k) Dk (Km) French Cities (j) dj (Km)
Vigo
Calais 1390 Rennes 1453
St. Nazaire 915 Paris 1577
Le Havre 1232 Lille 1793
Ferrol
Calais 1206 Rennes 1412
St. Nazaire 717 Paris 1553
Le Havre 1049 Lille 1751
A Coruña
Calais 1225 Rennes 1392
St. Nazaire 735 Paris 1514
Le Havre 1067 Lille 1731
Gijón
Calais 1138 Rennes 1061
St. Nazaire 563 Paris 1184
Le Havre 980 Lille 1400
Santander
Calais 1164 Rennes 892
St. Nazaire 508 Paris 1015
Le Havre 1006 Lille 1231
Bilbao
Calais 1206 Rennes 795
St. Nazaire 522 Paris 917
Le Havre 1049 Lille 1134
Source: Spanish Merchant Navy Association.
Table 1. Maritime Distances D<k> and road distances ‘door to door’ d<j> for the routes studied
in the case of France-Spain
Page 27 of 33
URL: http://mc.manuscriptcentral.com/tmpm
Maritime Policy & Management
123456789101112131415161718192021222324252627282930313233343536373839404142434445464748495051525354555657585960

For Peer Review O
nly
Table 2. Time indexes I <ihjk></T> for the routes studied in the case France-Spain
St. Nazaire Le Havre Calais
Truck SSS Truck SSS Truck SSS
Studied Ports French cities (j) IT11j1 I
T21j1 I
T11j2 I
T21j2 I
T11j3 I
T21j3
Vigo
Rennes 0.45 0.55 0.51 0.49 0.55 0.45
Paris 0.47 0.53 0.49 0.51 0.52 0.48
Lille 0.39 0.61 0.39 0.61 0.40 0.60
Ferrol
Rennes 0.42 0.58 0.49 0.51 0.53 0.47
Paris 0.44 0.56 0.47 0.53 0.50 0.50
Lille 0.36 0.64 0.37 0.63 0.38 0.62
A Coruña
Rennes 0.42 0.58 0.49 0.51 0.54 0.46
Paris 0.45 0.55 0.47 0.53 0.50 0.50
Lille 0.37 0.63 0.38 0.62 0.38 0.62
Gijón
Rennes 0.42 0.58 0.51 0.49 0.55 0.45
Paris 0.45 0.55 0.49 0.51 0.52 0.48
Lille 0.46 0.54 0.48 0.52 0.48 0.52
Santander
Rennes 0.67 0.33 0.76 0.24 0.79 0.21
Paris 0.45 0.55 0.51 0.49 0.54 0.46
Lille 0.46 0.54 0.50 0.50 0.50 0.50
Bilbao
Rennes 0.70 0.30 0.78 0.22 0.81 0.19
Paris 0.47 0.53 0.52 0.48 0.55 0.45
Lille 0.48 0.52 0.51 0.49 0.52 0.48
Page 28 of 33
URL: http://mc.manuscriptcentral.com/tmpm
Maritime Policy & Management
123456789101112131415161718192021222324252627282930313233343536373839404142434445464748495051525354555657585960
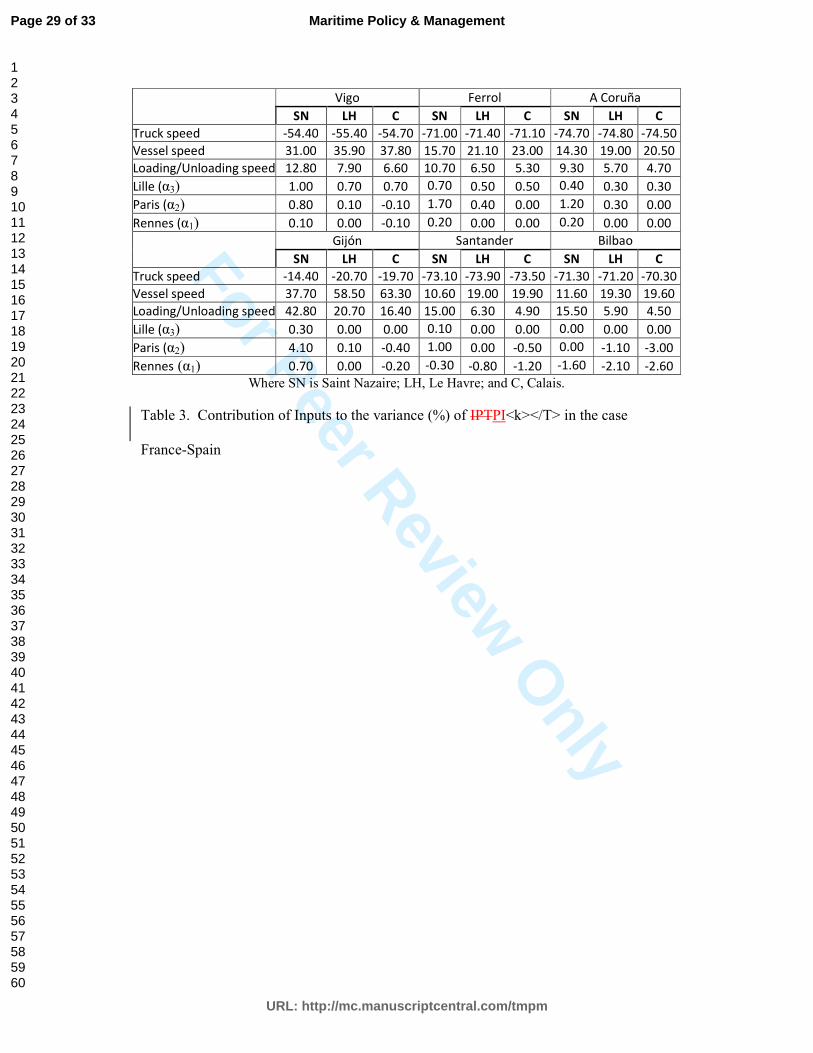
For Peer Review O
nly
Vigo Ferrol A Coruña
SN LH C SN LH C SN LH C
Truck speed -54.40 -55.40 -54.70 -71.00 -71.40 -71.10 -74.70 -74.80 -74.50
Vessel speed 31.00 35.90 37.80 15.70 21.10 23.00 14.30 19.00 20.50
Loading/Unloading speed 12.80 7.90 6.60 10.70 6.50 5.30 9.30 5.70 4.70
Lille (α3) 1.00 0.70 0.70 0.70 0.50 0.50 0.40 0.30 0.30
Paris (α2) 0.80 0.10 -0.10 1.70 0.40 0.00 1.20 0.30 0.00
Rennes (α1) 0.10 0.00 -0.10 0.20 0.00 0.00 0.20 0.00 0.00
Gijón Santander Bilbao
SN LH C SN LH C SN LH C
Truck speed -14.40 -20.70 -19.70 -73.10 -73.90 -73.50 -71.30 -71.20 -70.30
Vessel speed 37.70 58.50 63.30 10.60 19.00 19.90 11.60 19.30 19.60
Loading/Unloading speed 42.80 20.70 16.40 15.00 6.30 4.90 15.50 5.90 4.50
Lille (α3) 0.30 0.00 0.00 0.10 0.00 0.00 0.00 0.00 0.00
Paris (α2) 4.10 0.10 -0.40 1.00 0.00 -0.50 0.00 -1.10 -3.00
Rennes (α1) 0.70 0.00 -0.20 -0.30 -0.80 -1.20 -1.60 -2.10 -2.60
Where SN is Saint Nazaire; LH, Le Havre; and C, Calais.
Table 3. Contribution of Inputs to the variance (%) of IPTPI<k></T> in the case
France-Spain
Page 29 of 33
URL: http://mc.manuscriptcentral.com/tmpm
Maritime Policy & Management
123456789101112131415161718192021222324252627282930313233343536373839404142434445464748495051525354555657585960

For Peer Review O
nly
Vigo Ferrol A Coruña
SN LH C SN LH C SN LH C
Base Case: value ������� 0.105 0.057 0.009 0.160 0.100 0.050 0.150 0.090 0.040
Mean 0.099 0.051 0.003 0.140 0.090 0.030 0.130 0.070 0.020
Median 0.103 0.055 0.007 0.150 0.090 0.040 0.130 0.070 0.020
Standard Desviation 0.028 0.030 0.030 0.030 0.030 0.030 0.030 0.030 0.030
Coeff.of Variability 0.278 0.580 9.55 0.188 0.339 0.862 0.215 0.416 1.500
/Mean-Base Case/ 0.006 0.006 0.006 0.020 0.010 0.020 0.020 0.020 0.020
Gijón Santander Bilbao
SN LH C SN LH C SN LH C
Base Case: value ������� 0.110 0.020 -0.030 0.020 -0.090 -0.140 -0.010 -0.130 -0.180
Mean 0.110 0.020 -0.030 0.050 -0.060 -0.110 -0.110 -0.220 -0.270
Median 0.110 0.020 -0.030 0.020 -0.080 -0.130 -0.020 -0.130 -0.180
Standard Desviation 0.010 0.020 0.020 0.050 0.050 0.040 0.150 0.140 0.140
Coeff.of Variability 0.118 0.777 -0.440 0.953 -0.708 -0.375 -1.300 -0.630 -0.509
/Mean-Base Case/ 0 0 0 0.030 0.030 0.030 0.100 0.090 0.090
Where SN is Saint Nazaire; LH, Le Havre; and C, Calais.
Table 4. Statistical results from the Monte Carlo simulations (in terms of time) in the
case of France-Spain
Page 30 of 33
URL: http://mc.manuscriptcentral.com/tmpm
Maritime Policy & Management
123456789101112131415161718192021222324252627282930313233343536373839404142434445464748495051525354555657585960
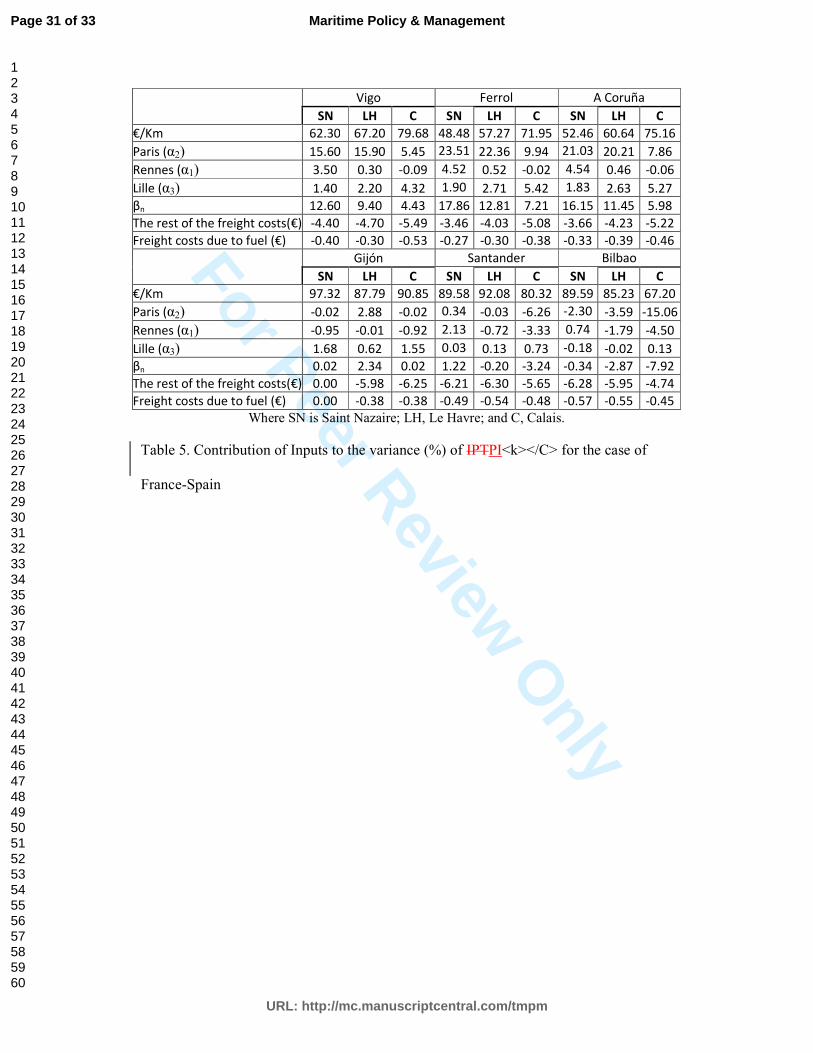
For Peer Review O
nly
Vigo Ferrol A Coruña
SN LH C SN LH C SN LH C
€/Km 62.30 67.20 79.68 48.48 57.27 71.95 52.46 60.64 75.16
Paris (α2) 15.60 15.90 5.45 23.51 22.36 9.94 21.03 20.21 7.86
Rennes (α1) 3.50 0.30 -0.09 4.52 0.52 -0.02 4.54 0.46 -0.06
Lille (α3) 1.40 2.20 4.32 1.90 2.71 5.42 1.83 2.63 5.27
βn 12.60 9.40 4.43 17.86 12.81 7.21 16.15 11.45 5.98
The rest of the freight costs(€) -4.40 -4.70 -5.49 -3.46 -4.03 -5.08 -3.66 -4.23 -5.22
Freight costs due to fuel (€) -0.40 -0.30 -0.53 -0.27 -0.30 -0.38 -0.33 -0.39 -0.46
Gijón Santander Bilbao
SN LH C SN LH C SN LH C
€/Km 97.32 87.79 90.85 89.58 92.08 80.32 89.59 85.23 67.20
Paris (α2) -0.02 2.88 -0.02 0.34 -0.03 -6.26 -2.30 -3.59 -15.06
Rennes (α1) -0.95 -0.01 -0.92 2.13 -0.72 -3.33 0.74 -1.79 -4.50
Lille (α3) 1.68 0.62 1.55 0.03 0.13 0.73 -0.18 -0.02 0.13
βn 0.02 2.34 0.02 1.22 -0.20 -3.24 -0.34 -2.87 -7.92
The rest of the freight costs(€) 0.00 -5.98 -6.25 -6.21 -6.30 -5.65 -6.28 -5.95 -4.74
Freight costs due to fuel (€) 0.00 -0.38 -0.38 -0.49 -0.54 -0.48 -0.57 -0.55 -0.45
Where SN is Saint Nazaire; LH, Le Havre; and C, Calais.
Table 5. Contribution of Inputs to the variance (%) of IPTPI<k></C> for the case of
France-Spain
Page 31 of 33
URL: http://mc.manuscriptcentral.com/tmpm
Maritime Policy & Management
123456789101112131415161718192021222324252627282930313233343536373839404142434445464748495051525354555657585960

For Peer Review O
nly
Vigo Ferrol A Coruña
SN LH C SN LH C SN LH C
Base Case: value ������� 0.144 0.147 0.092 0.180 0.180 0.122 0.170 0.170 0.108
Mean 0.144 0.147 0.092 0.180 0.180 0.121 0.170 0.170 0.108
Median 0.144 0.147 0.092 0.180 0.180 0.121 0.170 0.170 0.107
Standard Desviation 0.008 0.010 0.009 0.010 0.010 0.009 0.010 0.010 0.009
Coeff.of Variability 0.058 0.067 0.098 0.049 0.057 0.076 0.050 0.060 0.083
/Mean-Base Case/ 0 0 0 0 0 0 0 0 0
Gijón Santander Bilbao
SN LH C SN LH C SN LH C
Base Case: value ������� 0.090 0.070 0.004 0.040 -0.010 -0.075 -0.020 -0.070 -0.131
Mean 0.090 0.070 0.004 0.030 -0.010 -0.075 -0.020 -0.070 -0.131
Median 0.090 0.070 0.004 0.030 -0.010 -0.075 -0.020 -0.070 -0.131
Standard Desviation 0.010 0.010 0.011 0.010 0.010 0.009 0.010 0.010 0.009
Coeff.of Variability 0.094 0.166 2.970 0.182 -0.597 -0.117 -0.358 -0.119 -0.072
/Mean-Base Case/ 0 0 0 0.010 0 0 0 0 0
Where SN is Saint Nazaire; LH, Le Havre; and C, Calais.
Table 6. Statistical results from the Monte Carlo simulations (in terms of cost) for the
case of France-Spain
Page 32 of 33
URL: http://mc.manuscriptcentral.com/tmpm
Maritime Policy & Management
123456789101112131415161718192021222324252627282930313233343536373839404142434445464748495051525354555657585960
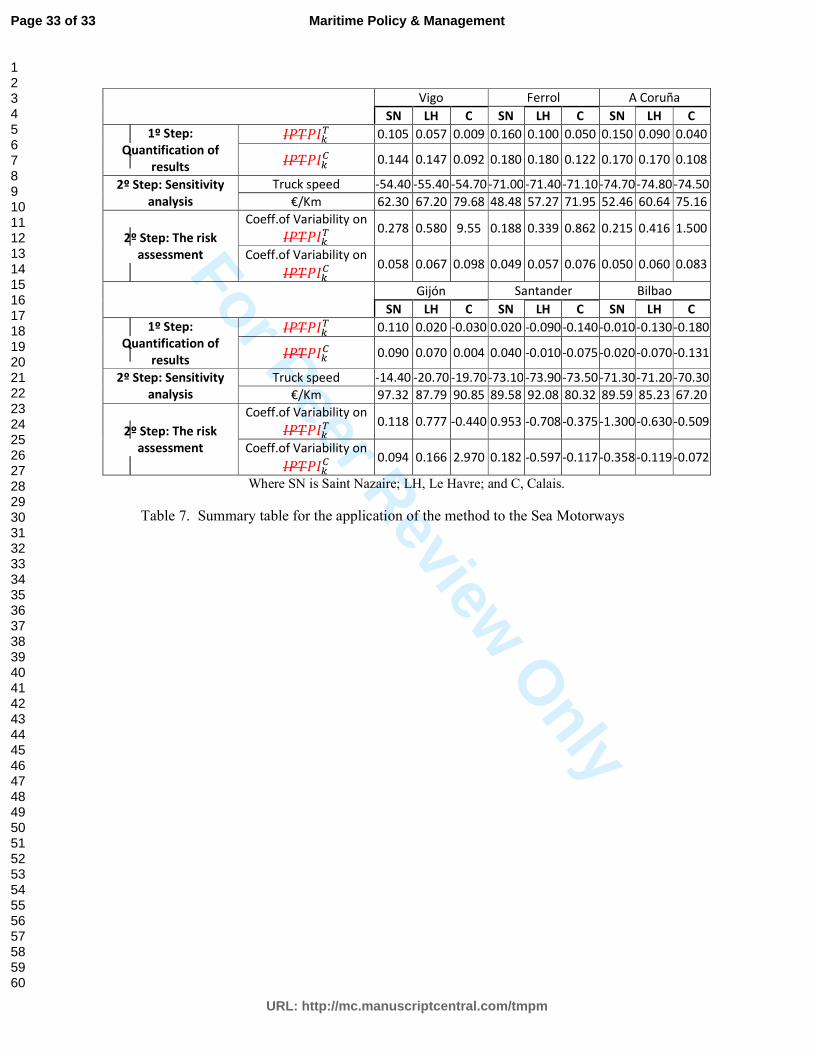
For Peer Review O
nly
Vigo Ferrol A Coruña
SN LH C SN LH C SN LH C
1º Step:
Quantification of
results
������
� 0.105 0.057 0.009 0.160 0.100 0.050 0.150 0.090 0.040
������
� 0.144 0.147 0.092 0.180 0.180 0.122 0.170 0.170 0.108
2º Step: Sensitivity
analysis
Truck speed -54.40 -55.40 -54.70 -71.00 -71.40 -71.10 -74.70-74.80 -74.50
€/Km 62.30 67.20 79.68 48.48 57.27 71.95 52.46 60.64 75.16
2º Step: The risk
assessment
Coeff.of Variability on
������
� 0.278 0.580 9.55 0.188 0.339 0.862 0.215 0.416 1.500
Coeff.of Variability on
������
� 0.058 0.067 0.098 0.049 0.057 0.076 0.050 0.060 0.083
Gijón Santander Bilbao
SN LH C SN LH C SN LH C
1º Step:
Quantification of
results
������
� 0.110 0.020 -0.030 0.020 -0.090 -0.140 -0.010-0.130 -0.180
������
� 0.090 0.070 0.004 0.040 -0.010 -0.075 -0.020-0.070 -0.131
2º Step: Sensitivity
analysis
Truck speed -14.40 -20.70 -19.70 -73.10 -73.90 -73.50 -71.30-71.20 -70.30
€/Km 97.32 87.79 90.85 89.58 92.08 80.32 89.59 85.23 67.20
2º Step: The risk
assessment
Coeff.of Variability on
������
� 0.118 0.777 -0.440 0.953 -0.708 -0.375 -1.300-0.630 -0.509
Coeff.of Variability on
������
� 0.094 0.166 2.970 0.182 -0.597 -0.117 -0.358-0.119 -0.072
Where SN is Saint Nazaire; LH, Le Havre; and C, Calais.
Table 7. Summary table for the application of the method to the Sea Motorways
Page 33 of 33
URL: http://mc.manuscriptcentral.com/tmpm
Maritime Policy & Management
123456789101112131415161718192021222324252627282930313233343536373839404142434445464748495051525354555657585960