fomc 19821005 gb sup 19821001
TRANSCRIPT
Prefatory Note
The attached document represents the most complete and accurate version available based on original copies culled from the files of the FOMC Secretariat at the Board of Governors of the Federal Reserve System. This electronic document was created through a comprehensive digitization process which included identifying the best-preserved paper copies, scanning those copies,1 and then making the scanned versions text-searchable.2 Though a stringent quality assurance process was employed, some imperfections may remain.
Please note that this document may contain occasional gaps in the text. These gaps are the result of a redaction process that removed information obtained on a confidential basis. All redacted passages are exempt from disclosure under applicable provisions of the Freedom of Information Act.
1 In some cases, original copies needed to be photocopied before being scanned into electronic format. All scanned images were deskewed (to remove the effects of printer- and scanner-introduced tilting) and lightly cleaned (to remove dark spots caused by staple holes, hole punches, and other blemishes caused after initial printing). 2 A two-step process was used. An advanced optimal character recognition computer program (OCR) first created electronic text from the document image. Where the OCR results were inconclusive, staff checked and corrected the text as necessary. Please note that the numbers and text in charts and tables were not reliably recognized by the OCR process and were not checked or corrected by staff.

CONFIDENTIAL (FR)
CLASS II - FOMC October 1, 1982
SUPPLEMENTCURRENT ECONOMIC AND FINANCIAL CONDITIONS
Prepared for theFederal Open Market Committee
By the StaffBoard of Governors
of the Federal Reserve System

TABLE OF CONTENTS
Page
THE DOMESTIC NONFINANCIAL ECONOMY
Unemployment claims . . . . . . . .New house sales . . . . . . . . . .Construction expenditures . . . . .
TABLES:
Private housing activity . . .
New construction put in place
THE DOMESTIC FINANCIAL ECONOMY
TABLES:
Monetary aggregates . . . . . . . . .. . . 5Commercial bank credit and short- and intermediate-
term business credit . . . . . . . . ... . . . .. 6
Selected financial market quotations . . . . .. . . 7
Appendix: Compensating balance arrangements anddemand deposit behavior . .. . . . A-1
2. . . . . 1. . . . 1. . . . 2
. 3S .

SUPPLEMENTAL NOTES
THE DOMESTIC NONFINANCIAL ECONOMY
Unemployment claims
Recent data on insured unemployment suggest that labor market con-
ditions continued to deteriorate through mid-September. Initial claims
for unemployment insurance rose to 709,000 in the week ended September 18;
this followed a somewhat reduced volume during the week of the Labor Day
holiday. The average for new claims during the first three weeks of
September was about 665,000--somewhat higher than the peak flow of new
claimants during mid-May 1980. The level of insured unemployment under
all regular programs averaged 4.4 million in the first two weeks of
September--up more than 240,000 from the mid-August reference week for
the BLS labor market surveys. The reference week for September was the
week ended the 18th.
New house sales
New house sales have remained quite weak since midyear. The number
of units sold rose 2 percent in August to a seasonally adjusted annual
rate of 359,000 units; however, taken together new house sales in July
and August averaged 3 percent below the pace in the second quarter which
had been the recent cyclical low. The average sales price of new houses
in August was $92,300--6 percent above a year earlier. The preliminary
average sales price of new houses in July--which originally showed a year-
over-year increase of 10 percent--was revised down to $87,700, now also
6 percent higher than a year earlier. The median sales price of new
houses was $73,200 in August.

Unsold inventories do not seem to be a serious problem nationwide.
The stock of unsold new houses declined in August for the seventh consec-
utive month to a seasonally adjusted 247,000 total--the lowest since mid-
1971. The slightly higher sales rate in August pushed inventories measured
in terms of sales down to 7.9 months' supply. The median length of time
that unsold new units have been on the market fell to 3.9 months in August;
this period is considerably shorter than the average of 6 months at year-
end 1981.
Construction expenditures
The total value of construction put-in-place rose 2 percent in
August to a seasonally adjusted annual rate of $232.3 billion. Expendi-
tures in August were 2 percent below the level of a year earlier In
real terms, total construction expenditures also rose 2 percent in
August, but remained slightly (2 percent) below August 1981.
Outlays for private residential and nonresidential construction
each rose about 1 percent in August. The value of state and local
construction expenditures increased by 4 percent, but remained somewhat
smaller than a year earlier.

PRIVATE HOUSING ACTIVITY
(Seasonally adjusted annual rates, millions of units)
1981 1982__Annual Q4 Q 1 Q2 June July Aug . 1
All unitsPermits .99 .76 .82 .92 .93 1. .89Starts 1.08 .87 .92 .95 .91 1.20 1.00
Single-family unitsPermits .56 .42 .45 .49 .52 .50 .49Starts .71 .54 .59 .61 .62 .63 .61
SalesNew homes .44 .40 .39 .37 .37 .35 .36Existing homes 2.35 1.92 1.93 1.93 1.98 1.89 1.79
Multifamily unitsPermits .42 .34 .37 .43 .41 .56 .39Starts .38 .33 .33 .35 .29 .57 .40
Mobile home shipments .24 .21 .24 .25 .26 .26 n.a.
1. Preliminary estimates.n.a.--Not available.
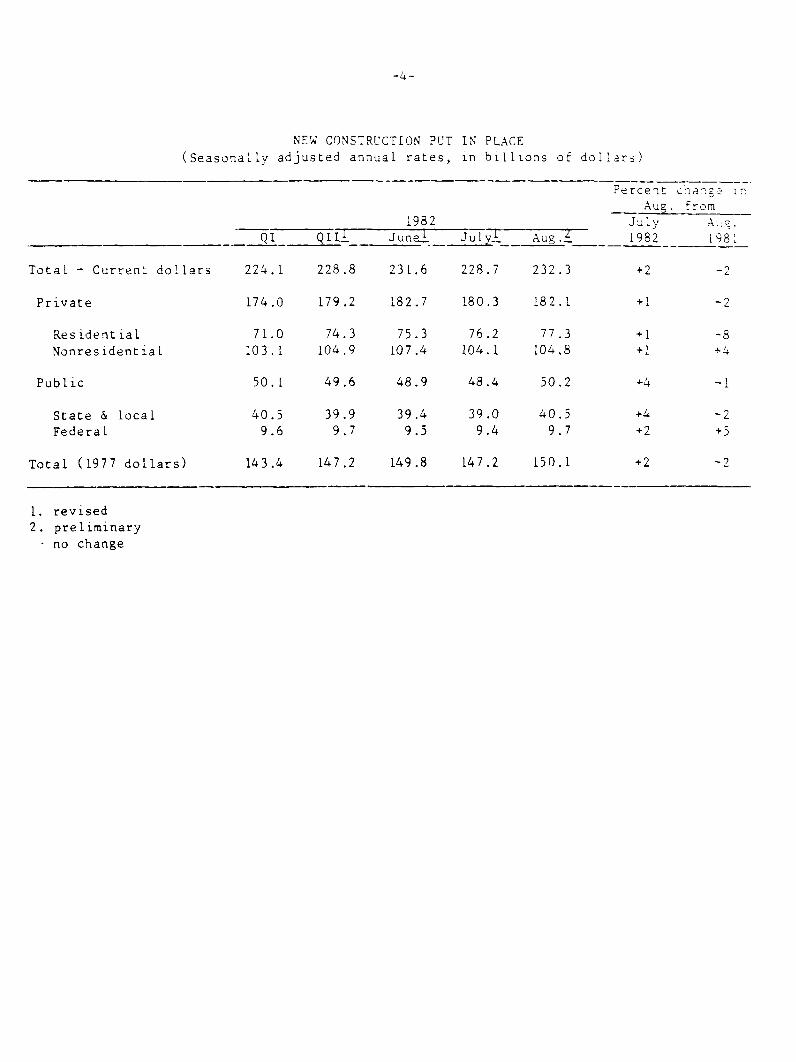
NEW CONSTRUCTION PUT IN PLACE
(Seasonally adjusted annual rates, in billions of dollars)
Percent change in
Aug. from1982 July Aug. .
QI QII1 Junel JulyI Aug. 1982 1981
Total - Current dollars 224.1 228.8 231.6 228.7 232.3 +2 -2
Private 174.0 179.2 182.7 180.3 182.1 +1 -2
Residential 71.0 74.3 75.3 76.2 77.3 +1 -8Nonresidential 103.1 104.9 107.4 104.1 104.8 +1 -4
Public 50.1 49.6 48.9 48.4 50.2 +4 -1
State & local 40.5 39.9 39.4 39.0 40.5 +4 -2
Federal 9.6 9.7 9.5 9.4 9.7 +2 +5
Total (1977 dollars) 143.4 147.2 149.8 147.2 150.1 +2 -2
1. revised2. preliminary
Sno change

MONETARY AGGREGATES
(Based on seasonally adjusted data unless otherwise noted)1
1982 QIV. '81to
Q1 Q2 Q3P July Aug. Sept.P Sept.'82P
--Percentage change at annual rates-
Money stock measures1. M12. (M1) 2
3. M24. M3
3.3 3.5 -0.33.6 4.4 -4.Q9.5 9.7 9.710.7 12.0 12.6
10.4 14.013.9 17.414.2 5.218.4 3.5
Selected components5. Currency 7.9 9.3 6.9 3.7 6.5 10.2
6. Demand deposits -0.5 -5.8 -1.4
7. Other checkable deposits
8. M2 minus M1 (9+10+11+14)
9. Overnight RPs and Eurodollars, NSA3
10. General purpose and broker/dealermoney market mutual fund shares,NSA
11. Commercial banks12. savings deposits13. small time deposits14. Thrift institutions1q. savings deposits
small time deposits
xt. M3 minus M2 (18+21+22)
18. Large time deposits19. at commercial banks, net
4
20. at thrift institutions21. Institutions-only money market
mutual fund shares, NSA22. Term RPs, NSA
MEMORANDA:23. Managed liabilities at commercial
banks4 (24+25)24. Large time deposits, gross5
25. Nondeposit funds5
26. Net due to related foreigninstitutions, NSA 5
27. Other5 ,6
28. U.S. government deposits at commercialbanks
7
49.5 19.6 11.9 -1.4
9.5 11.5 11.7 12.9
63.6
33.89.48.79.71.6
10.2-1.5
38.4 39.9 30.3
15.4 2.6 10.8
-8.4 19.0 8.4 35.9 -16.1 22.
20.917.2
2.023.8
6.00.68.1
31.012.3-9.721.6
6.1-8.011.4
19.214.4
-22.529.111.0
-17.721.7
60.912.3-8.420.34.8
-5.88.6
12.78.54.6
10.0-3.2-3.2-3.2
31.113.10.2
18.84.10.45.5
11.1 16.9 23.3 26.9 38.4 -5.0 14.5
8.9 19.1 19.2 27.4 12.9 -3.5 14.96.1 19.9 20.9 32.6 11.7 -8.2 14.4
21.6 15.5 11.5 4.0 18.1 17.8 17.2
-2.5 15.2 104.0 106.8 209.3 22.3 46.2-29.9 6.2 -25.7 -69.2 122.4 -85.2 -16.2
-Average monthly change in billions of dollays--
0.62.7
-2.1
-2.10.0
6.3 n.a. 6.15.8 5.5 10.60.5 n.a. -4.5
5.2 n.a.6.8 -0.9
-1.6 n.a.
0.4 -4.8 -4.8 -4.1 -5.60.1 n.a. 0.4 2.4 n.a.
1.9 -2.5 0.2 -1.5
n.a.4.2n.a.
-2.1n.a.
0.8 1.4 -0.1
1. Quarterly growth rates are computed on a quarterly average basis. Dollar amounts shown under memoranda forquarterly changes are calculated on an end-month-of-quarter basis.2. Ml seasonally adjusted using alternative model-based procedure applied to weekly data.3. Overnight and continuing contract RPs issued to the nonbank public by comercial banks, net of amounts heldby money market mutual funds, plus overnight Eurodollar deposits issued by Caribbean branches of U.S. memberbanks to U.S. nonbank customers. Excludes retail RPs, which are in the small time deposit components.SNet of large-denomination time deposits held by money market mutual funds and thrift institutions.
Adjusted for shifts of assets and liabilities to International Banking Facilities (IBFs) which affectedas from December 1981 to June 1982.
-. Consists of borrowings from other than commercial banks in the form of federal funds purchased, securitiessold under agreements to repurchase and other liabilities for borrowed money (including borrowings from theFederal Reserve and unaffiliated foreign banks), loans sold to affiliates, loan RPs and other minor items.Data are partially estimated.7. Consists of Treasury demand deposits at commercial banks and Treasury note balances.n.a. - Not available.p - preliminary.
6.57.09.8
10.6
2.6 6.8 -1.8

COMMERCIAL BANK CREDIT AND SHCRT- AND INTERMEDIATE BUSINESS CREDIT(Percentage changes at annual rates, based on seasonally adjusted data)1
1981 1982 <I ::to
Q4 Ql Q2 June July Aug. Aug. '82
--Commercial Bank Credit--
1. Total loans and investmentsat banks
2 , 3 6.4 10.1 7.9 5.1 6.4 6.4 9.5
2. Investments 4.8 5.7 4.7 1.7 2.4 8.5 5.8
3. Treasury securities -7.8 11.5 4.9 -5.2 7.3 13.4 .5
4. Other securities 11.2 2.8 4.8 5.1 0.0 6.1 4.5
5. Total loans 2 ,3 6.9 11.5 9.0 6.4 7.6 5.8 19.8
6. Business loans 2 ,3 9.2 16.8 14.8 14.2 9.9 3.3 15.4
7. Security loans 58.6 -18.3 -26.8 -64.1 92.3 22.9 4.3
8. Real estate loans 7.3 7.8 6.6 7.3 0.8 4.4 7.4
9. Consumer loans 4.1 2.8 3.0 2.6 5.7 2.5 4.1
--Short- and Intermediate-Term Business Credit--
10. Total short- and intermediate-term business credit (sum of
lines 14, 15 and 16) 13.8 15.2 13.1 10.6 14.2 n.a. n.a.
11. Business loans net of bankersacceptances 3 9.3 16.5 15.7 17.7 11.3 2.1 15.8
12. Commercial paper issued by non-financial firms5 21.3 30.0 16.8 2.0 38.2 -1.9 27.4
13. Sum of line 11 & 12 10.8 18.2 15.9 15.6 14.9 1.8 17.3
14. Line 13 plus loans at foreignbranches6 14.0 18.4 15.7 13.6 15.2 5.3 18.2
15. Finance company loans to business 7 7.6 1.0 1.5 10.5 17.8 n.a. n.a.
16. Total bankers acceptances outstanding7 20.9 11.7 10.2 -6.6 0.0 n.a. n.a.
1. Average of Wednesdays for domestically chartered banks and average of current and preceding ends of months for
foreign-related institutions.2. Loans include outstanding amounts of loans reported as sold outright to a bank's own foreign branches, uncon-solidated nonbank affiliates of the bank, the bank's holding company (if not a bank), and unconsolidated nonbanksubsidiaries of the holding company.3. Adjusted for shifts of assets and liabilities to International Banking Facilities (IBFs) which affected flowsfrom December 1981 to June 1982.4. Growth of bank credit from the FOMC's December-January base through August 1982, not adjusted for shifts ofassets from domestic offices to IBFs, was at an annual rate of 7.6 percent. Adjusted for such shifts afterJanuary, growth over this period was 8.4 percent.5. Average of Wednesdays.6. Loans at foreign branches are loans made to U.S. firms by foreign branches of domestically chartered banks.7. Based on average of current and preceding ends of month.n.a.--not available.
-7-
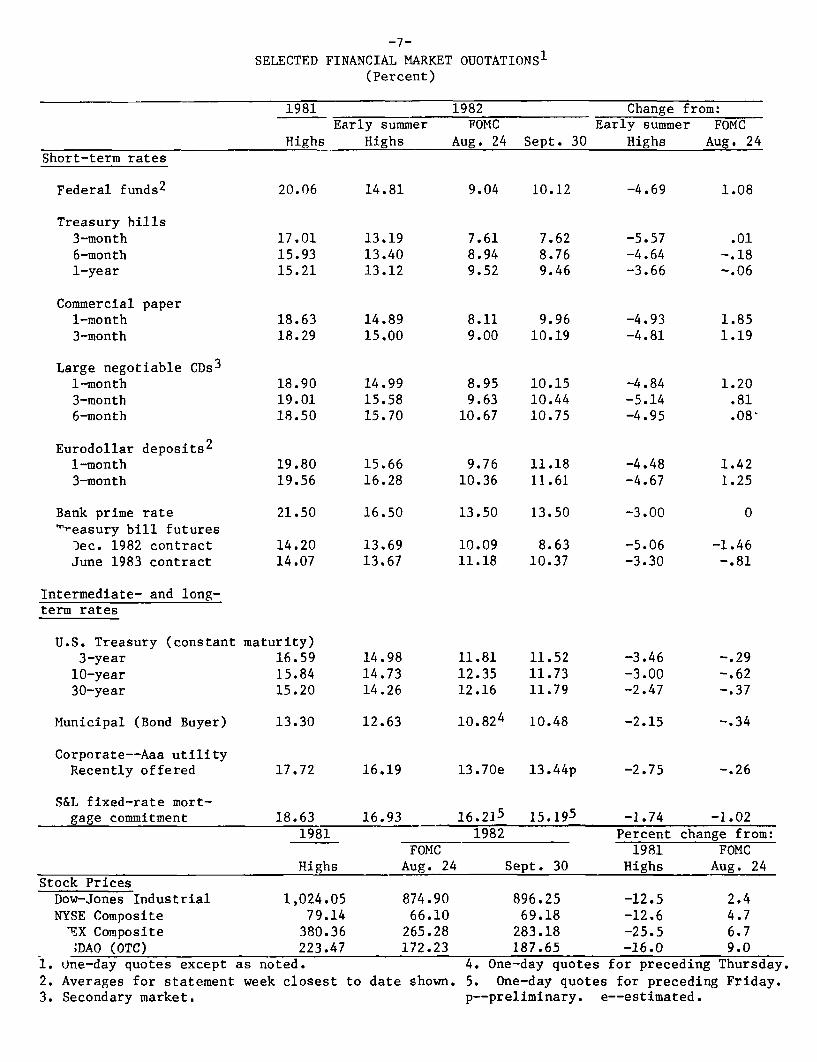
SELECTED FINANCIAL MARKET QUOTATIONS1
(Percent)
1981 1982 Change from:Early summer FOMC Early summer FOMC
Highs Highs Aug. 24 Sept. 30 Highs Aug. 24Short-term rates
Federal funds2
Treasury bills3-month6-month1-year
Commercial paper1-month3-month
Large negotiable CDs 3
1-month3-month6-month
Eurodollar deposits 2
1-month3-month
Bank prime rateTreasury bill futures
)ec. 1982 contractJune 1983 contract
Intermediate- and long-term rates
20.06
17.0115.9315.21
18.6318.29
18.9019.0118.50
19.8019.56
21.50
14.2014.07
14.81
13.1913.4013.12
14.8915.00
14.9915.5815.70
15.6616.28
16.50
13.6913.67
9.04 10.12
7.618.949.52
7.628.769.46
8.11 9.969.00 10.19
8.959.63
10.67
10.1510.4410.75
9.76 11.1810.36 11.61
13.50 13.50
10.0911.18
8.6310.37
U.S. Treasury (constant maturity)3-year 16.59
10-year 15.8430-year 15.20
Municipal (Bond Buyer)
Corporate--Aaa utilityRecently offered
13.30
17.72
14.9814.7314.26
12.63
16.19
11.8112.3512.16
11.5211.7311.79
10.824 10.48
13.70e 13.44p
S&L fixed-rate mort-gage commitment 18.63 16.93 16.235 15.195 -1.74 -1.02
1981 1982 Percent change from:FOMC 1981 FOMC
Highs Aug. 24 Sept. 30 Highs Aug. 24Stock PricesDow-Jones Industrial 1,024.05NYSE Composite 79.14
'EX Composite 380.36;DAO (OTC) 223.47
1. One-day quotes except as noted.
874.9066.10
265.28172.23
896.2569.18
283.18187.65
4. One-day quotes
-12.5 2.4-12.6 4.7-25.5 6.7-16.0 9.0
for preceding Thursday.
-4.69
-5.57-4.64-3.66
-4.93-4.81
-4.84-5.14-4.95
-4.48-4.67
-3.00
-5.06-3.30
1.08
.01-.18-.06
1.851.19
1.20.81.08-
1.421.25
-1.46-. 81
-3.46-3.00-2.47
-2.15
-2.75
-.29-.62-.37
-.34
-.26
2. Averages for statement week closest to date shown. 5. One-day quotes for preceding Friday.3. Secondary market, p--preliminary. e--estimated.

APPENDIX*
COMPENSATING BALANCE ARRANGEMENTS AND DEMAND DEPOSIT BEHAVIOR
The expansion of demand deposits in August and September--whichhad been preceded by six months of contraction--may have been in parta reaction to the sharp fall in short-term interest rates since June.
An inverse relation between demand deposits and interest rates is con-sistent with conventional economic modeling of the transactions demandfor money. Moreover, for businesses, which account for well over halfof all demand deposits in the money stock, compensating balance arrange-ments may reinforce the interest rate response of demand deposits. To
update information on compensating balance practices, the staff at theBoard and three District Banks earlier this month contacted nine largecommercial banks.
Most of the banks contacted indicated that the vast bulk of their
business demand deposits were linked to formal compensating balance
agreements. Based on the responses of all the banks, compensating bal-
ances appear, on average, to be approximately equally split between
those associated with operational services (including cash management
services) and those connected with credit services (loan commitments
and takedowns). These deposits of businesses are used actively for
transaction purposes, and average daily (close of business) collected
balances typically are used as the basis for determining compensation.
A corporate customer can pay for credit services either through
fees or balances. 1 When balances are used, the required level of
average balances is fixed for the term of the agreement and does not
change in response to fluctuations in short-term interest rates. How-
ever, since balances can be averaged over periods such as a quarter or
even a year, customers do have some scope to vary credit-related bal-
ances in response to interest rate movements and rate expectations.
The balance requirements for loan commitments or takedowns reportedly
have come down from a standard 10 percent a few years ago to around
three to five percent.2
* Prepared by Fred Furlong, Economist, Banking Section, and Richard
Porter, Chief, Econometrics and Computer Applications, Division of
Research and Statistics.1. There has been a pronounced trend toward the use of fees rather than
balances to pay for credit services in recent years, particularly in
the case of large firms. This may reflect in part the fact that funds
linked to compensating balance arrangements generally are used actively
for transaction purposes, and a business would have less need to hold
transaction balances with a bank from which it receives only credit
services compared to a bank that supplies operational services.
2. Fees on lines of credit reportedly are centered around 3/8 percent
of the dollar value of the line, with higher credit quality customers
in many cases paying 1/4 percent and lower rated customers paying 1/2
percent.
A-l
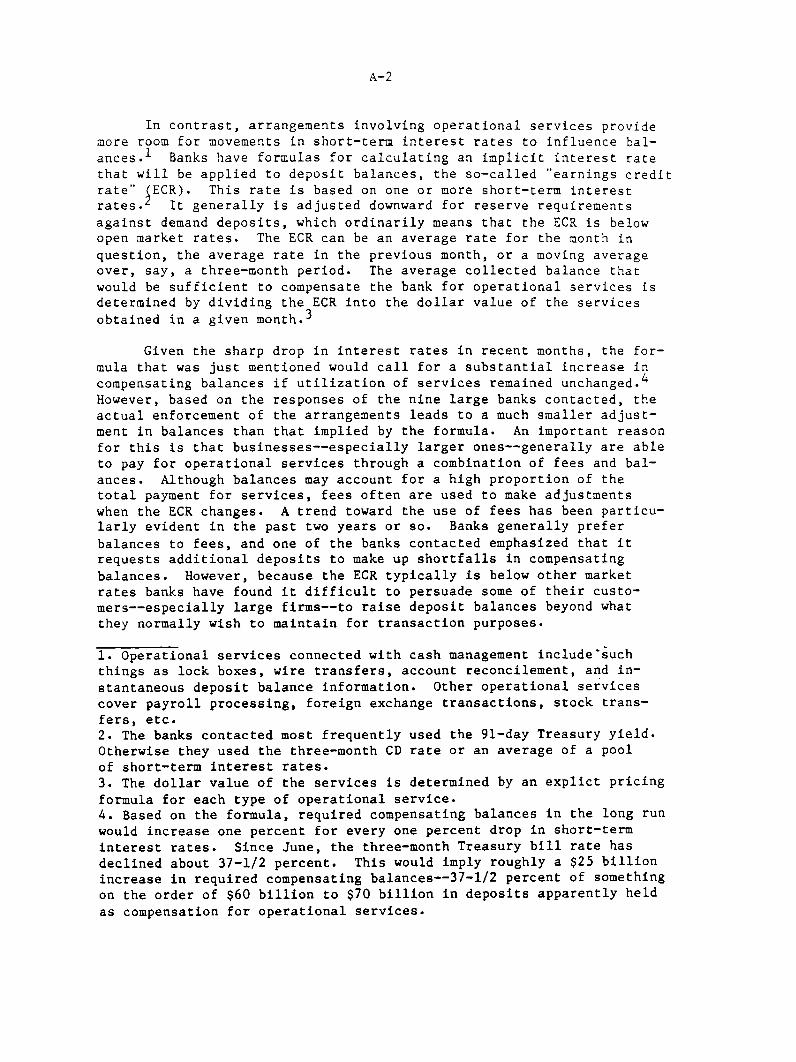
A-2
In contrast, arrangements involving operational services providemore room for movements in short-term interest rates to influence bal-ances. 1 Banks have formulas for calculating an implicit interest ratethat will be applied to deposit balances, the so-called "earnings creditrate" ECR). This rate is based on one or more short-term interestrates. It generally is adjusted downward for reserve requirementsagainst demand deposits, which ordinarily means that the ECR is belowopen market rates. The ECR can be an average rate for the month inquestion, the average rate in the previous month, or a moving averageover, say, a three-month period. The average collected balance thatwould be sufficient to compensate the bank for operational services isdetermined by dividing the ECR into the dollar value of the servicesobtained in a given month. 3
Given the sharp drop in interest rates in recent months, the for-mula that was just mentioned would call for a substantial increase incompensating balances if utilization of services remained unchanged. 4
However, based on the responses of the nine large banks contacted, theactual enforcement of the arrangements leads to a much smaller adjust-ment in balances than that implied by the formula. An important reasonfor this is that businesses--especially larger ones--generally are ableto pay for operational services through a combination of fees and bal-ances. Although balances may account for a high proportion of thetotal payment for services, fees often are used to make adjustmentswhen the ECR changes. A trend toward the use of fees has been particu-larly evident in the past two years or so. Banks generally prefer
balances to fees, and one of the banks contacted emphasized that itrequests additional deposits to make up shortfalls in compensating
balances. However, because the ECR typically is below other marketrates banks have found it difficult to persuade some of their custo-mers--especially large firms--to raise deposit balances beyond whatthey normally wish to maintain for transaction purposes.
1. Operational services connected with cash management include suchthings as lock boxes, wire transfers, account reconcilement, and in-
stantaneous deposit balance information. Other operational servicescover payroll processing, foreign exchange transactions, stock trans-
fers, etc.2. The banks contacted most frequently used the 91-day Treasury yield.Otherwise they used the three-month CD rate or an average of a poolof short-term interest rates.3. The dollar value of the services is determined by an explict pricing
formula for each type of operational service.4. Based on the formula, required compensating balances in the long run
would increase one percent for every one percent drop in short-term
interest rates. Since June, the three-month Treasury bill rate has
declined about 37-1/2 percent. This would imply roughly a $25 billionincrease in required compensating balances--37-1/2 percent of something
on the order of $60 billion to $70 billion in deposits apparently held
as compensation for operational services.

A-3
Aside from the use of fees to cover shortfalls, there are otherreasons for there to be a loose relation between changes in the ECR andmovements in corporate demand deposits. Accounts are evaluated on acase-by-case basis. Banks consider the overall profitability of anaccount before deciding whether more balances (or a higher fee) arerequired. Previous surpluses in deposit balances or even the return onthe customer's loans are taken into account. A shortfall in demanddeposit balances may be permitted to persist for a number of months ifthe seasonal pattern in the cash flow of the corporate customer is suchthat the firm would be able to make up the deficit more easily in thefuture. In addition, some businesses have balances beyond those used tomeet formal compensating balance requirements.1 These deposits absorbsome of the change in "required" compensating balances. Overall, thebanks contacted indicated that when balances are adjusted to interestrate changes lags can range from a few months to a year or more.
As noted earlier, the ECR tends to be lower than market rates.However, because of the method used to calculate the ECR at many banks,this implicit rate of return can lag other market rates. As such, if
short-term interest rates fall sharply enough to offset the adjustmentfor reserve requirements, the ECR for a given month can exceed rates
available on market instruments. Corporate depositors would have an
incentive to increase their demand deposit holdings to take advantageof the higher yield.2 This would allow a business to reduce its fee
payments for services, make up for previous shortfalls in compensatingbalances, or build up surplus balances that can be applied to services
obtained in the future. Any such buildup in demand deposits would be
temporary, since the increase would be reversed when the ECR came back
into line as market rates stopped falling.
In summary, there appears to be ample scope for compensating bal-
ance arrangements, particularly those involving operational services,
to have affected the behavior of demand deposits as interest rates have
fallen sharply. The ECR at a number of banks has lagged the drop in
market rates, and, thus, the implicit return on compensating balances may
have exceeded market rates in recent months. This would have created an
incentive for some businesses to temporarily increase their demand depos-
it holdings. In the longer run, the flexibility afforded depositors byusing fees instead of balances and the fact that the ECR ordinarily isbelow open market rates will affect the extent to which businesses
1. Some of these free balances are active transaction deposits ofsmaller businesses, and some are funds that are maintained by busi-nesses that want certain services that are not priced explicitly by
banks, such as access to the bank's chairman or financial analysts.2. The intra-monthly pattern of interest rates also can affect therelative attractiveness of the ECR, even in the cases where the ECR isnot lagged. Since the ECR represents a daily average, if rates fallsharply early in the month, a business may be able to profit by hold-
ing larger balances in the latter part of the month when the ECR exceedsprevailing market rates.

A-4
increase their demand balances beyond what they normally wish to hold
for transaction purposes. Finally, given the variation in methods used
to enforce compensating balance arrangements, some portion of the
adjustment in balances that does occur could be spread over a long and
indefinite period.