fomc 19920331 blue book 19920327
TRANSCRIPT

Prefatory Note
The attached document represents the most complete and accurate version available based on original copies culled from the files of the FOMC Secretariat at the Board of Governors of the Federal Reserve System. This electronic document was created through a comprehensive digitization process which included identifying the best-preserved paper copies, scanning those copies,1 and then making the scanned versions text-searchable.2 Though a stringent quality assurance process was employed, some imperfections may remain.
Please note that this document may contain occasional gaps in the text. These gaps are the result of a redaction process that removed information obtained on a confidential basis. All redacted passages are exempt from disclosure under applicable provisions of the Freedom of Information Act.
1 In some cases, original copies needed to be photocopied before being scanned into electronic format. All scanned images were deskewed (to remove the effects of printer- and scanner-introduced tilting) and lightly cleaned (to remove dark spots caused by staple holes, hole punches, and other blemishes caused after initial printing). 2 A two-step process was used. An advanced optimal character recognition computer program (OCR) first created electronic text from the document image. Where the OCR results were inconclusive, staff checked and corrected the text as necessary. Please note that the numbers and text in charts and tables were not reliably recognized by the OCR process and were not checked or corrected by staff.

Strictly Confidential (FR) Class I FOMC
MONETARY POLICY ALTERNATIVES
Prepared for the Federal Open Market Committee
By the staff Board of Governors of the Federal Reserve System

Strictly Confidential (FR)Class I - FOMC March 27, 1992
MONETARY POLICY ALTERNATIVES
Recent Developments
(1) The Federal Reserve's stance in the reserves market re-
mained unchanged over the intermeeting period.1 In the three com-
plete maintenance periods since the February FOMC meeting, the federal
funds rate averaged 4 percent, and funds have continued to trade mostly
at or a little below that level in the current maintenance period. The
allowance for adjustment plus seasonal borrowing was raised $25 million
to $100 million immediately after the FOMC meeting to reflect an ex-
pected rise in seasonal credit and has since remained unchanged. Bor-
rowing averaged only $67 million in the three complete maintenance
periods and is running at $73 million in the current period; adjustment
credit has remained unusually low and seasonal borrowing--subject to a
less attractive rate under the new market-based rate program implemented
this year--has increased relatively little.
(2) Despite the stable federal funds rate, most market inter-
est rates rose from 20 to 60 basis points over the intermeeting period,
as spending picked up and expectations took hold that a solid economic
2expansion was underway. Perhaps reflecting the changed cyclical
outlook, the most pronounced increases occurred at intermediate maturi-
ties, with the three-year Treasury note rate moving around 60 basis
points higher versus a 20 basis point rise in the thirty-year bond
yield. Currently the yield on thirty-year bonds is about one-half per-
centage point above its low in early January, though it remains about
1. On February 18, the Board announced a reduction in the reserverequirement on transaction deposits from 12 to 10 percent, to takeeffect April 2. This action was designed to free up funds for lendingand to strengthen the financial condition of banks, thereby improvingtheir access to capital markets and putting them in a better positionto extend credit.
2. Discussions of interest rates, exchange rates, and stock pricesare based on data available through noon, March 27.

one-half percentage point below its peak in June and July of 1991. The
interest rate on conventional fixed-rate mortgages is now 80 basis
points above its trough in early January, having increased by 35 basis
points to about 9 percent over the intermeeting period. Yields on
corporate bonds rated A and above rose in tandem with Treasuries, pre-
serving their narrow spreads, but bond rates for many lesser-rated
borrowers, whose prospects apparently were seen to be especially
improved by the stronger economic outlook, were unchanged or even fell
somewhat. Spreads on bank debentures also narrowed, and indexes of bank
stocks rose 2 to 3 percent, with only a very small boost from the
announcement of the reserve requirement cut. while most broad stock
price indexes were down between 2 and 4 percent.
(3) Since the last Committee meeting, the dollar has appre-
ciated about 3-1/2 percent on a weighted-average basis, primarily in re-
sponse to the indications of a more buoyant economy in the United
States. In addition, economic activity in several foreign countries
showed signs of falling short of expectations. Economic weakness in
Japan reinforced expectations of a discount rate cut and, along with
further political and financial scandals, contributed to a 5-1/2 percent
drop in the yen against the dollar. Japanese short-term interest rates
declined 25 basis points, while long-term rates were down about 15 basis
points. German short-term rates, on the other hand, rose 20 basis
points and long-term rates 15 basis points on balance as money growth
remained robust and inflation concerns intensified, despite faltering
economic activity.
On two occasions, the Desk
sold small amounts of dollars against yen in cooperation with Japanese

monetary authorities. Of the total amount of $150 million, $125 million
was for Treasury account and $25 million for System account.
(4) The broad monetary aggregates accelerated sharply in
February, but M2 is estimated to have flattened and M3 to have con-
tracted somewhat in March. From December to March, M2 and M3 grew at
4-1/4 percent and 2 percent rates, respectively, compared with the 3 and
1-1/2 percent rates expected at the last FOMC meeting. The pickup in
growth from the fourth quarter to the first likely owed in part to the
strengthening of income and spending. In addition, declines in market
interest rates in late 1991 also provided some impetus to money growth,
although that impetus probably was partly offset by increases in oppor-
tunity costs associated with the recent backup in market rates. Also
contributing to faster money growth, especially in February, were ac-
celerated individual tax refunds resulting from increased electronic
filings and a surge in refinancings of securitized mortgage loans.
The deceleration of M2 in March likely reflects diminished effects of
these special factors and the widening opportunity costs. Runoffs of
money funds, occasioned by the rise in short-term market interest rates,
also weakened the broad aggregates in March. Although M2 picked up in
the first quarter and ran above the path expected at the last meeting,
its growth is still appreciably below the pace predicted on the basis of
historical relationships with income and short-term interest rates.
Velocity is estimated to have been about flat in the first quarter,
compared with a 2 percent decline predicted by the standard staff model.
3. Prepayments on mortgages that have been securitized typicallyare held in demand deposits for 15 to 45 days prior to disbursement toholders of mortgage-backed securities, in accordance with the provi-sions of GNMA and FNMA contracts. Data on GNMA prepayments are notyet available for February, but estimates based on the experience ofFNMA securities suggest that overall prepayment activity may haveboosted M2 growth a percentage point or less last month. The effectof accelerated refunds likely was of roughly similar magnitude.
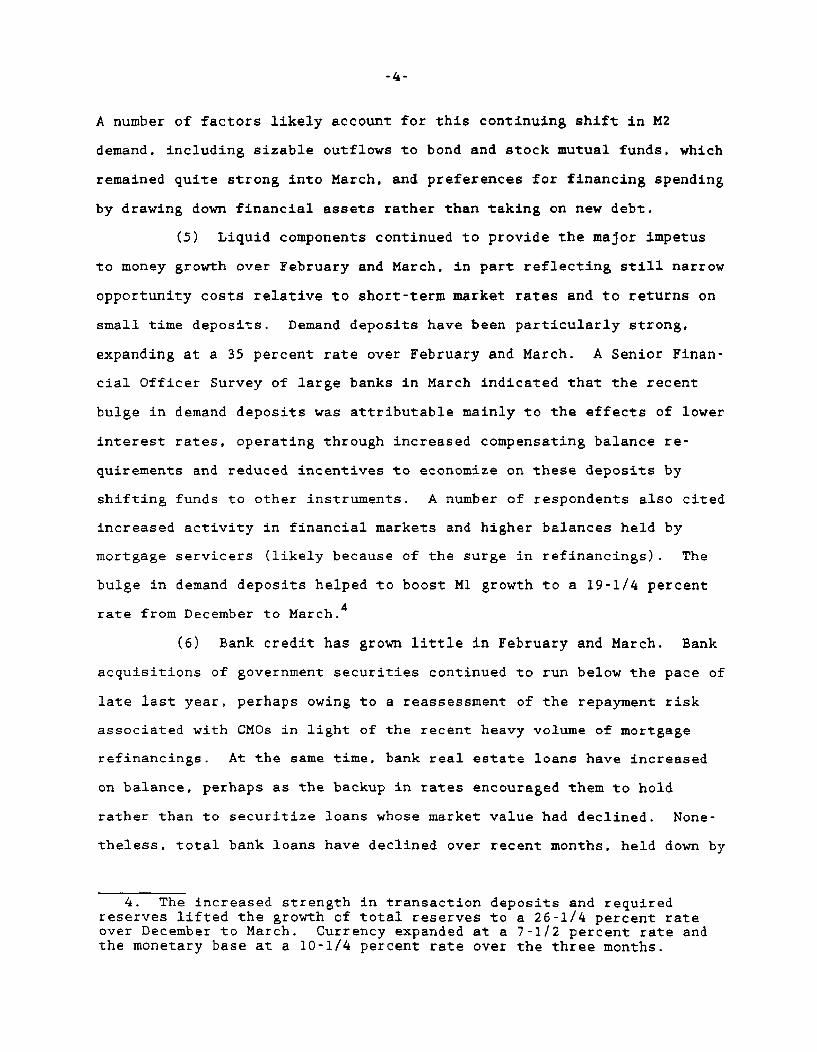
A number of factors likely account for this continuing shift in M2
demand, including sizable outflows to bond and stock mutual funds, which
remained quite strong into March, and preferences for financing spending
by drawing down financial assets rather than taking on new debt.
(5) Liquid components continued to provide the major impetus
to money growth over February and March, in part reflecting still narrow
opportunity costs relative to short-term market rates and to returns on
small time deposits. Demand deposits have been particularly strong,
expanding at a 35 percent rate over February and March. A Senior Finan-
cial Officer Survey of large banks in March indicated that the recent
bulge in demand deposits was attributable mainly to the effects of lower
interest rates, operating through increased compensating balance re-
quirements and reduced incentives to economize on these deposits by
shifting funds to other instruments. A number of respondents also cited
increased activity in financial markets and higher balances held by
mortgage servicers (likely because of the surge in refinancings). The
bulge in demand deposits helped to boost M1 growth to a 19-1/4 percent
rate from December to March.4
(6) Bank credit has grown little in February and March. Bank
acquisitions of government securities continued to run below the pace of
late last year, perhaps owing to a reassessment of the repayment risk
associated with CMOs in light of the recent heavy volume of mortgage
refinancings. At the same time, bank real estate loans have increased
on balance, perhaps as the backup in rates encouraged them to hold
rather than to securitize loans whose market value had declined. None-
theless, total bank loans have declined over recent months, held down by
4. The increased strength in transaction deposits and requiredreserves lifted the growth of total reserves to a 26-1/4 percent rateover December to March. Currency expanded at a 7-1/2 percent rate andthe monetary base at a 10-1/4 percent rate over the three months.

falling business and consumer loans. The dropoff in business loans does
not seem to result from any further tightening of lending terms; indeed,
the February Survey of Terms of Bank Lending indicated that the spread
of business lending rates over market rates has narrowed and the January
Bank Lending Practices Survey suggested little change in credit stan-
dards for such loans. The latter survey also showed a bit more willing-
ness to provide consumer credit; the drop in consumer loans partly re-
flected continuing securitization of such credit.
(7) Along with bank lending, total credit growth appears to
have remained quite weak, despite the pickup in spending. Growth in the
debt of domestic nonfinancial sectors is estimated to have increased at
an average rate of only 3 percent over January and February, restrained
by an anemic 2 percent average rate of growth for the debt of nonfederal
borrowers. Business funding needs have been quite modest as inventories
have declined and corporations have found it attractive to issue high
volumes of equity to reduce reliance on debt. Gross issuance of cor-
porate bonds, which remained strong in February and March, included
sizable refinancing of callable debt. Households seem to be taking on
larger volumes of mortgage debt to finance home purchases. In addition,
households may be increasing primary mortgage indebtedness in the pro-
cess of refinancing existing mortgages, although reports suggest they
are using the extra cash to repay home equity and consumer credit.
Nonetheless, consumer credit probably increased slightly over the first
two months of the year, after dropping through much of 1991.

MONEY, CREDIT, AND RESERVE AGGREGATES(Seasonally adjusted annual rates of growth)
Dec. QIV'91to to
Jan. Feb. Mar.p Mar. p Mar.P
Money and credit aggregates
M1 16.2 27.0 13.8 19.3 17.3
M2 3.2 9.4 .3 4.3 4.1
M3 1.4 7.0 -2.8 1.9 1.8
Domestic nonfinancialdebt 2.4 3.3
Bank credit 3.2 .5 1.8 3.5 3.0
Reserve measures
Nonborrowed reserves 1 12.8 48.9 18.4 27.2 26.5
Total reserves 13.7 45.3 18.6 26.3 25.8
Monetary base 9.1 16.4 5.0 10.3 9.7
Memo: (Millions of dollars)
Adjustment plus seasonalborrowing 233 75 82 -
Excess reserves 1003 1065 762 -
p - Preliminary estimate.1. Includes "other extended credit" from the Federal Reserve.
NOTE: Monthly reserve measures, including excess reserves and borrow-ing, are calculated by prorating averages for two-week reservemaintenance periods that overlap months. Reserve data incor-porate adjustments for discontinuities associated with changesin reserve requirements.

Policy Alternatives
(8) Three policy alternatives are presented below for con-
sideration by the Committee. Under alternative B, federal funds would
continue to trade around 4 percent in association with an initial bor-
rowing allowance of $100 million. Over the intermeeting period, the
borrowing allowance likely would need to be increased to accommodate a
rise in demands for seasonal credit, but probably by less than in pre-
vious years owing to the less attractive rate on such credit under the
new program. Under alternative A, the federal funds rate would decline
to the 3-1/2 percent area in conjunction with a reduction in the initial
borrowing allowance to $75 million.5 In contrast, the funds rate
would return to 4-1/2 percent and the initial borrowing allowance would
increase to $125 million under alternative C. Under any of the alterna-
tives, the staff anticipates little difficulty in bank reserve manage-
ment from the cut in reserve requirements effective in early April, and
as a result there is unlikely to be much additional funds market vola-
tility. Part of the initial reduction in required reserve balances,
estimated at $8-1/2 billion, will be offset by the seasonal upsurge in
required reserves on transaction deposits; but even after this bulge
abates, the total of required reserves plus required clearing balances
should be above the level needed for clearing purposes.
5. The difference in the borrowing assumptions between alterna-tives B and alternatives A and C has been narrowed from $50 to $25million. This modification has been made to take into account theadvent of the market-based rate for seasonal credit, which likelyrenders such credit unresponsive to changes in federal funds rates,and also the damped response of adjustment credit to variations in thespread between the federal funds rate and discount rate observed overthe last year.
6. To date, only a few banks have increased their required clear-ing balances or communicated their intention to do so to offset thedrop in required reserve balances.

(9) Markets appear to anticipate no change in policy over the
intermeeting period, and thus interest rates should remain close to
current levels under alternative B. Nevertheless, there could be a
downward bias to rate movements over coming months. Information on the
economy consistent with the greenbook forecast may be somewhat more
mixed than recent releases, and with aggregate price measures damped and
money growth slower, expectations of future inflation and the likelihood
of monetary tightening later in the year could be revised down. Any
tendency toward rate declines might be reinforced if the market became
convinced that a fiscal stimulus package had been definitively ruled
out. Under these circumstances, the dollar could reverse some of its
recent gains.
(10) The steepening yield curve for maturities out to two
years and the pattern of futures market quotations suggest some firming
of expectations that policy will tighten beginning later in the year.
In this context, the unexpected easing of money market conditions of
alternative A might cause a market reassessment of the intentions of the
Federal Reserve, leading to a significant downward revision in the
expected course of short-term interest rates for the next year or so.
Short-term rates would fall by about the 1/2 percentage point drop in
the funds rate, and some intermediate-term rates might drop quite sub-
stantially as well. Effects on expected rates at longer horizons are
more difficult to judge. In the absence of a worsening in the economic
outlook, the easing might be interpreted as expansionary--and poten-
tially inflationary--and short-term rates would be expected to rebound
ultimately to even higher levels than market participants now antici-
pate; in this event, bond yields might drop relatively little, if at
all. If the policy ease came to be seen as needed to counter threats to

the expansion, however, arising perhaps from recent upward movements in
long-term interest rates and exchange rates, the action could be viewed
as promising lower short-term rates for a considerable period, and bond
rates would move down appreciably. In either case, the dollar would
fall.
(11) The tightening of policy under alternative C would lead
to about a 50 basis point rise in money market rates, which likely would
be passed through fully to the prime rate. Long-term rates also would
rise and the dollar would firm, especially if the Federal Reserve's
action were taken as confirming views that a robust expansion was well
established with inflationary potential. On the other hand, to the
extent that market participants saw the early move as improving pros-
pects for disinflation or that the action would be reversed quickly
because it risked undermining an acceptable economic recovery, effects
on bond yields would be limited.
(12) Absent an easing of reserve conditions, expansion in M2
and M3 is expected to be slower over the second quarter than over the
first. Projections for money growth over the March-to-June period under
all three alternatives are given in the table below and on the table and
charts on the following pages. Under the unchanged reserve conditions
of alternative B, M2 growth is projected to moderate to a 3-1/2 percent
rate from March to June. leaving this aggregate below the midpoint of
its annual range. Although more rapid income growth would tend to boost
demands for M2 at the relatively stable interest rates of this alterna-
tive, the lagged effects of the rise in market interest rates over the
past few months will be restraining money growth relative to income. In
addition, a number of the special factors boosting money growth in the

-10-
Alt. A Alt. B Alt. C
Growth from March to June
M2 4-1/2 3-1/2 2-1/2M3 2 1-1/2 1M1 13 11 9
Implied growth from 1991:Q4 to June
M2 4-1/4 4 3-1/2M3 2 1-3/4 1-1/2M1 15-3/4 15 14
first quarter will no longer be at work, and in some cases their effects
will be reversing. One such factor is the shifting of tax refunds
into February from later months. Another involves mortgage refinancing;
such activity already may have leveled out with depressing effects on
growth of demand deposits, and refinancing could well decline
subsequently in response to the rise in mortgage rates, causing
currently swollen demand deposit accounts of mortgage servicers to be
drawn down. The slowdown in M2 over the March-to-June period would be
concentrated in the M1 component, which still is expected to expand at a
11 percent rate.8 Given that opportunity costs on its more liquid
7. Projections of money growth are especially uncertain at thistime of year owing to the massive payment flows associated with theApril 15 tax date. Changes in nonwithheld tax payments this year areprojected to be well within the experience of recent years. Thus, weare assuming that these flows are captured by existing seasonalfactors.
8. The cut in the reserve requirement on transaction deposits isexpected to have little net effect on M1. Banks may bid slightly moreaggressively for NOW accounts, but compensating balance requirements,which are usually calculated to incorporate the cost of reserve re-quirements, will be lower.
The continued strength in transaction components results inprojected growth over March to June in required and total reserves atrates of 13-1/2 and 14-3/4 percent, respectively, after adjusting forthe effects of the change in reserve requirements. The monetary basewould expand at a 7-1/2 percent rate.

Alternative Levels and Growth Rates for Key Monetary Aggregates
M2 M3 M1
Alt. A Alt. B Alt. C Alt. A Alt. B Alt. C Alt. A Alt. B Alt. C
Levels in billions1992 January 3448.5 3448.5 3448.5 4177.1 4177.1 4177.1 910.3 910.3 910.3
February 3475.6 3475.6 3475.6 4201.5 4201.5 4201.5 930.8 930.8 930.8March 3476.5 3476.5 3476.5 4191.7 4191.7 4191.7 941.5 941.5 941.5
April 3488.1 3486.6 3485.1 4196.2 4195.2 4194.2 950.9 950.1 949.3May 3501.2 3496.8 3492.4 4203.9 4201.1 4198.3 961.2 958.8 956.4June 3515.8 3507.0 3498.2 4213.4 4208.1 4202.8 972.4 967.6 962.8
Monthly Growth Rates1992 January 3.2 3.2 3.2 1.4 1.4 1.4 16.2 16.2 16.2
February 9.4 9.4 9.4 7.0 7.0 7.0 27.0 27.0 27.0March 0.3 0.3 0.3 -2.8 -2.8 -2.8 13.8 13.8 13.8
April 4.0 3.5 3.0 1.3 1.0 0.7 12.0 11.0 10.0May 4.5 3.5 2.5 2.2 1.7 1.2 13.0 11.0 9.0June 5.0 3.5 2.0 2.7 2.0 1.3 14.0 11.0 8.0
I
Quarterly Ave. Growth Rates1991 Q1 3.7 3.7 3.7 3.4 3.4 3.4 5.2 5.2 5.2
Q2 4.4 4.4 4.4 1.8 1.8 1.8 7.4 7.4 7.4Q3 0.6 0.6 0.6 -1.3 -1.3 -1.3 7.5 7.5 7.5Q4 2.3 2.3 2.3 1.0 1.0 1.0 11.1 11.1 11.1
1992 Q1 4.4 4.4 4.4 2.3 2.3 2.3 16.8 16.8 16.8Q2 4.0 3.5 2.9 1.4 1.1 0.8 14.7 13.5 12.4
Sep 91 to Dec 91 3.3 3.3 3.3 1.9 1.9 1.9 12.0 12.0 12.0Dec 91 to Mar 92 4.3 4.3 4.3 1.9 1.9 1.9 19.3 19.3 19.3Mar 92 to Jun 92 4.5 3.5 2.5 2.1 1.6 1.1 13.1 11.1 9.1
Q4 90 to Q4 91 2.8 2.8 2.8 1.2 1.2 1.2 8.0 8.0 8.0Q4 91 to Q2 92 3.9 3.9 3.7 1.8 1.7 1.5 16.0 15.4 14.8Q4 91 to Mar 92 4.1 4.1 4.1 1.8 1.8 1.8 17.3 17.3 17.3Q4 91 to June 92 4.3 3.9 3.4 1.9 1.7 1.5 15.8 14.9 14.0
2.5 to 6.5 1.0 to 5.01992 Target Ranges:

Chart 1
ACTUAL AND TARGETED M2
Billions of dollars
6.5%Actual Level
* Short-Run Alternatives
3700
-j 3650
- 3600
-4 3550
-1 3500
-1 3450
-4 3400
I I I I I I I I I I I I IO N D J F M A M J J A S O N D
1991 1992
3350

Chart 2
ACTUAL AND TARGETED M3
Billions of dollars
Actual Level* Short-Run Alternatives
O N D
1991
J F M A M J J A S O N D
1992
4425
4375
4325
4275
4225
4175
4125
4075
,*l'
l

Chart 3
M1
Billions of dollars
Actual Level 15% 99010% 990------ Growth From Fourth Quarter
A s'i •
I s
- / -970B
SC
- ' - 950
/ S 5%
, , .. °- 930
S0%
- --........ ..............................................-------- 890
O N D J F M A M J J A S O N D
1991 1992
I /-- 1-- -- I-- -- I-1-- -- \-- -- \-\-- ----- - --- 970I I - -
1991 910I
,-I I -
-r *
- - - - - - - -- - - - - - - - - - - - - - - - - - - - - - 890

Chart 4
DEBTBillions of dollars
- - Actual Level- -- Estimated Level
* Projected Level
-- 11900
,.w -1 117004.5%
- 11500
-- 11300
-1 11100
a
I I I I I I I I IO N D J F M A M J J A S O N D
10900
-4 12300
8.5%
12100
1991 1992

-12-
components remain favorable, inflows to nontransaction M2 are expected
to continue to be concentrated in savings deposits (including MMDAs),
while sizable outflows from retail time deposits persist.
(13) As a consequence of rising opportunity costs and waning
effects of special factors, M2 velocity is projected to increase sig-
nificantly in the second quarter--at about a 2 percent annual rate under
alternative B. The modest deceleration of M2 embodied in this alterna-
tive is expected to be consistent with the greenbook forecast of a con-
tinued pickup in the economy. With credit flows concentrated in longer-
term markets, depositories will remain fairly unaggressive bidders for
deposits, and households will continue to direct savings to capital
market instruments. In these circumstances, the staff is forecasting a
1-1/2 percent increase in M2 velocity over the four quarters of 1992
under the greenbook forecast, the same change in velocity as was fore-
cast in February. For the year, M2 now would be expected to increase
around 4 percent, a little faster than projected in February in line
with stronger projected nominal GDP.
(14) Growth in M3 under alternative B would moderate slightly
to a 1-1/2 percent pace over the March-to-June period. In addition to
weaker M2 growth, M3 money funds should be about unchanged over the
second quarter under conditions of stable money market rates. On the
other hand, deposit inflows at banks might firm as their asset growth
strengthens a bit. With improving capital positions and better access
to funding markets, banks might become a little more willing to hold the
loans that they originate, rather than sell them. Demands for commer-
cial and industrial loans are likely to strengthen a little, as inven-
tory liquidation abates. Nonetheless, businesses are expected to con-
tinue to concentrate much of their financing in bond and equity markets
-13-
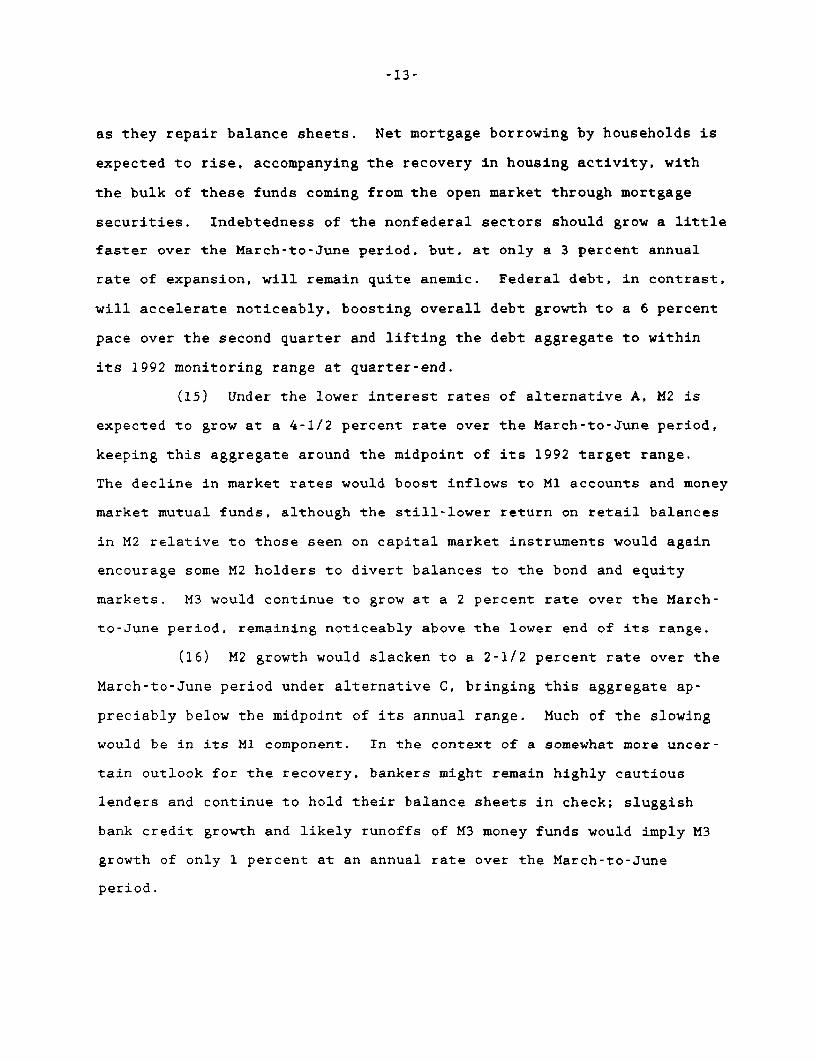
as they repair balance sheets. Net mortgage borrowing by households is
expected to rise, accompanying the recovery in housing activity, with
the bulk of these funds coming from the open market through mortgage
securities. Indebtedness of the nonfederal sectors should grow a little
faster over the March-to-June period, but, at only a 3 percent annual
rate of expansion, will remain quite anemic. Federal debt, in contrast,
will accelerate noticeably, boosting overall debt growth to a 6 percent
pace over the second quarter and lifting the debt aggregate to within
its 1992 monitoring range at quarter-end.
(15) Under the lower interest rates of alternative A, M2 is
expected to grow at a 4-1/2 percent rate over the March-to-June period,
keeping this aggregate around the midpoint of its 1992 target range.
The decline in market rates would boost inflows to M1 accounts and money
market mutual funds, although the still-lower return on retail balances
in M2 relative to those seen on capital market instruments would again
encourage some M2 holders to divert balances to the bond and equity
markets. M3 would continue to grow at a 2 percent rate over the March-
to-June period, remaining noticeably above the lower end of its range.
(16) M2 growth would slacken to a 2-1/2 percent rate over the
March-to-June period under alternative C, bringing this aggregate ap-
preciably below the midpoint of its annual range. Much of the slowing
would be in its M1 component. In the context of a somewhat more uncer-
tain outlook for the recovery, bankers might remain highly cautious
lenders and continue to hold their balance sheets in check; sluggish
bank credit growth and likely runoffs of M3 money funds would imply M3
growth of only 1 percent at an annual rate over the March-to-June
period.

-14-
Directive Language
(17) Draft language for the operational paragraph, including
the usual options and updating, is presented below:
OPERATIONAL PARAGRAPH
In the implementation of policy for the immediate
future, the Committee seeks to DECREASE SOMEWHAT/maintain/
INCREASE SOMEWHAT the existing degree of pressure on reserve
positions. In the context of the Committee's long-run
objectives for price stability and sustainable economic
growth, and giving careful consideration to economic,
financial, and monetary developments, slightly (SOMEWHAT)
greater reserve restraint (WOULD) might or slightly
(SOMEWHAT) lesser reserve restraint would (MIGHT) be
acceptable in the intermeeting period. The contemplated
reserve conditions are expected to be consistent with growth
of M2 and M3 over the period from [DEL: December through] March
THROUGH JUNE at annual rates of about ___ AND ____ [DEL: 3 and 1-1/2]
percent, respectively.

March 27, 1992
SELECTED INTEREST RATES(percent)
Short-Term Long-TermCDs money corporate conventional home
federal Treasury bills secondary comm. market bank U.S. government constant A-utility muncipal secondary primaryfunds secondary market market paper mutual prime maturity yields recently Bond market market
3-month 6-month 1 i-year 3-month 1-month fund loan 3-year 10-year 30-year ao ered Buyer fied-rate fixed-rate ARM1_1 2 3 4 5 6 7 8 9 10 11 12 13 14 15 1 16
91 -High- Low
92 -High- Low
MonthlyMar 91Apr 91May 91Jun 91Jul 91Aug 91Sep 91Oct 91Nov 91Dec 91
Jan 92Feb 92
WeeklyDec 11 91Dec 18 91Dec 25 91
Jan 1 92Jan 8 92Jan 15 92Jan 22 92Jan 29 92
Feb 5 92Feb 12 92Feb 19 92Feb 26 92
Mar 4 92Mar 11 92Mar 18 92Mar 25 92
DailyMar 24 92Mar 25 92Mar 26 92
7.464.22
4203.87
6.125.915.785.905.825.665.455.214.814.43
4.034.06
4.544.494.22
4.194.194.013.874.01
4.173.934.203.96
4.083.954.043.94
6.463.84
4.053.76
5.905.655.465.575.585.335214.994.564.07
3.803.84
4214.133.84
3.863.803.813.773.82
3.843.763.813.93
3.994.024.054.05
6.493.93
4223.82
5.925.715.615.755.705.395.255.044.614.10
3.873.93
4.214.173.93
3.883.833.863.863.90
3.913.823.924.04
4.074.144224.21
6.434.01
4.513.89
6.005.855.765.965.915.455.265.044.644.17
3.954.08
4274.214.01
3.953.893.953.944.00
4.013.944.10421
4.224.374.514.45
7.754.25
4.323.94
6.456.065.916.075.985.655.475.334.944.47
4.054.07
4.574.45425
4.324.024.034.074.07
4.063.944.074.18
4.164.244.30427
3.86 4.05 4.19 4.42 4283.95 4.01 4.16 4.38 4.224.07 4.01 4.15 4.36 4.18
8.49 7.374.88 4.53
5.02 4.514.00 3.72
6.48 6.126.08 5.895.91 5.606.06 5.495.98 5.465.72 5.385.57 5.245.29 5.034.95 4.824.98 4.61
4.11 4.184.11 3.84
5.00 4.634.90 4.594.88 4.53
5.02 4.514.19 4.404.07 4.194.09 4.144.08 3.99
4.09 3.924.00 3.854.13 3.784.18 3.78
4.23 3.75427 3.724.32 3.724.29 3.73
4.29425423 -
9.937.07
6.506.50
9.009.008.508.508.508.508.208.007.587.21
6.506.50
7.507.507.07
6.506.506.506.506.50
6.506.506.506.50
6.506.506.506.50
6.506.506.50
7.475.24
6.325.11
7.357.237.127.397.386.806.506.235.905.39
5.405.72
5.525.445.24
5.145.115.325.435.61
5.675.535.765.89
5.896.056.326.30
6266.22623
8.356.96
7.656.79
8.118.048.078288277.907.657.537.427.09
7.037.34
7227206.96
6.796.806.937.09722
7.307237.437.42
7.377.477.657.58
8.527.58
8.047.44
8.298218278.478.458.147.957.937.927.70
7.587.85
7.807.777.58
7.477.447.507.617.71
7.787.787.937.92
7.887.928.047.99
9.968.49
8.998.46
9.589.469.459.539.559259.059.028.958.68
8.578.79
8.768.578.49
8.468.498.588.678.72
8.718.858.878.72
8.868.998.98
-
7.406.76
6.876.53
7.327247.137.307.187.056.976.896.896.87
6.676.83
6.906.846.76
6.686.536.666.706.76
6.796.856.856.82
6.826.866.876.87
9.978.38
9.228.36
9.819.759.739.939.799.449.189.048.868.56
8.658.92
8.678.478.38
8.398.368.678.838.98
8.749.049.028.89
9.109.19922
9.758.35
9.03823
9.509.499.479.629.579249.018.868.718.50
8.438.78
8.538.498.35
8248238.458.568.68
8.678.738.828.83
8.858.889.03
-
7.786.02
6225.78
7.477.387.227.247237.086.876.716.426.19
5.895.88
6236216.02
5.945.795.895.905.93
5.875.785.925.93
5.996.046.22
7.53 7.947.53 7.947.57 7.99
NOTE: Weekly data for columns 1 through 11 are statement week averages. Data n column 7 are taken from Donoghu's Money Fund Report Columns 12 13 and 14 are 1-day quotes ar Friday, Thursday o Frid, repectivelyfollowing the end of the statement week. Column 13 a the Bond Buyer revenue Index. Column 14 is the FNMA purchase yeld, plus lon servicig fee, on 30-day mndaory delverycommtmens. Column 15 theaveragecontract rate on new commitments for fixed-rate mortgages (FRMs) with 80 percent loan-to-value ratos at major Institutional lenders. Column 16 is the average niial contract teon nw commbntents for 1-earw ajustele-rate mortgages (ARMs) at major institutional lenders offering both FRMs and ARMs with the same number of discount points.

Strictly Confidential (FR)
Money and Credit Aggregate Measures Class II FOMC
Seasonally adjusted MAR. 30, 1992
Money stock measures and liquid assets Bank credit Domestic nonfinancial debt1
nontransactions total loans U.S.Period Mt M2 components M3 L and government' other' total'
in M2 in M3 only lnvestments1 2" 3 4 5 6 7 8 9 10
ANN. GROHTH RATES I%) :ANNUALLY (Q4 TO Q41
198919901991
QUARTERLY AVERAGE1991-2nd QTR.1991-3rd QTR.1991-4th QTR.1992-1st QTR. pe
MONTHLY1991-MAR.
APR.MAYJUNEJULYAUG.SEP.OCT.NOV.DEC.
1992-JAN.FEB.MAR. pe
LEVELS I(BILLIONS) :MONTHLY
1991-OCT.NOV.DEC.
1992-JAN.FEB.
HEEKLY1992-FEB.
MAR. 29 p
16 p
1. Debt data are on a monthly average basis,discontinuities.p-preliminarype-preliminary estimate
4.84.02.8
4.40.72.34
6.22.74.02.2-1.50.70.72.14.82.9
3.29.40
3417.43431.13439.3
3448.53475.6
3462.63473.43478.03477.5
3478.73482.53478.2
0.64.28.0
7.47.5
11.116k
8.80.611.79.03.89.17.6
12.214.39.2
16.227.014
880.9891.4898.2
910.3930.8
921.1927.1931.4934.2
935.0939.6943.4
-0.9-7.2-5.5
-9.7-9.8-4.9-7
-17.9-7.7
-14.1-14.1-9.5-4.5-9.50.5
-8.3-5.7
-7.0-4.4
-18
741.5736.4732.9
728.6725.9
729.8723.6738.1714.7
725.6718.1718.6
6.23.91.1
3.4-1.6-0.70
5.43.31.5
-0.1-3.3-2.1-1.7-1.41.50.7
-1.43.2
-5
2536.52539.72541.1
2538.12544.8
2541.42546.32546.62543.4
2543.72542.92534.8
4.81.80.5
-1.90.70.2
-1.1-6.3-4.76.81.2
-1.5-2.60.93.1-0.4
-1.0
4977.84990.84989.2
4984.9
7.55.53.4
2.91.85.7
5.51.60.83.80.50.94.86.87.16.1
3.20.5
2805.12821.62836.0
2843.52844.6
7.310.311.2
6.813.912.2
6.6-1.911.816.012.315.312.313.1
.,10.87.7
5.9
2723.82748.32766.0
2779.7
8.46.12.4
3.41.91.7
3.23.73.92.51.41.21.51.72.41.5
1.2
8422.58439.68450.3
8459.1
8.27.04.5
4.24.74.3
4.02.45.85.64.04.54.14.54.53.0
2.4
11146.311187.911216.2
11238.7
3.61.71.2
1.8-1.31.02k
1.60.70.6
-0.8-3.0-0.2-1.21.82.51.4
1.47.0
-3
4159.04167.54172.2
4177.14201.5
4192.34197.14216.14192.2
4204.34200.64196.7
S _ _ __ _ __ _ _ _ _ _ I __ __ _ J _ _ _ _I_ _ _ _ I _ __ _ __ ._ __ _ I
derived by averaging end-of-month levels of adjacent months, and have been adjusted to remove
Strictly Confidential (FR).
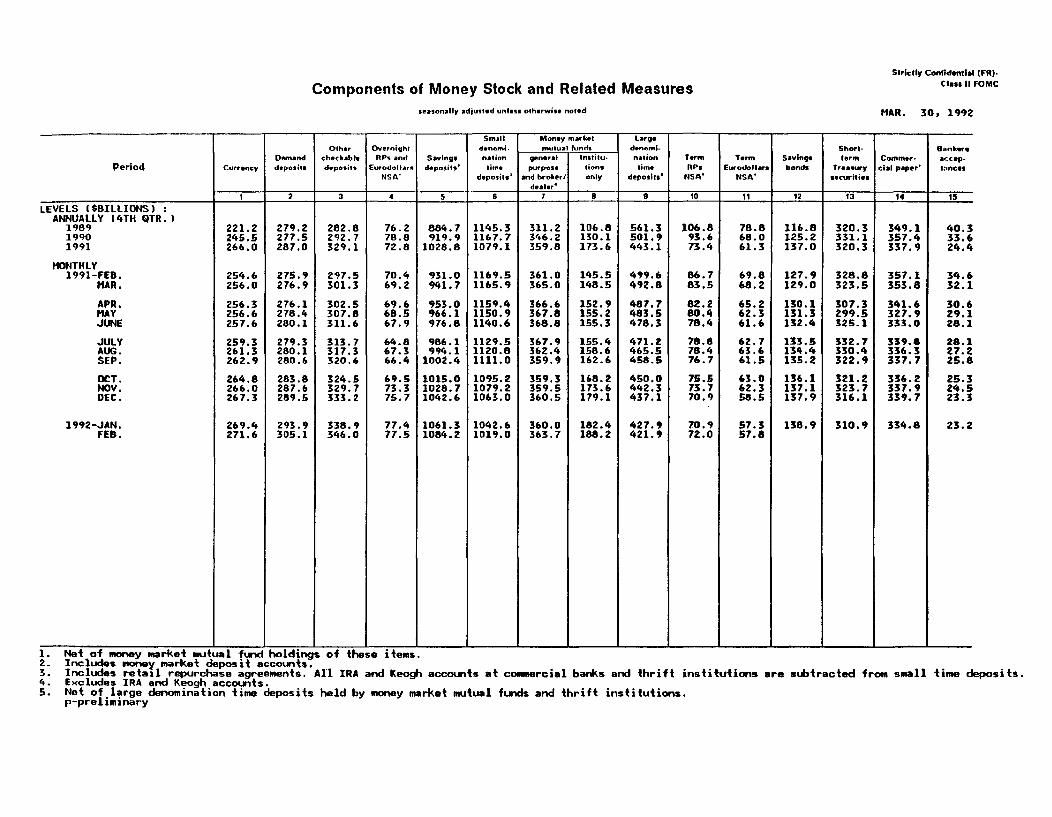
Components of Money Stock and Related Measures Class II FOMC
seasonally adjusted unless otherwise noted MAR. 30, 1992
Small Money market LargeOther Overnight denomi- mutual funds denomi- Short- Bankers
Demand checkable RPs and Savings nation general Institu- nation Term Term Savings term Commer accep-Period Currency deposits deposits Eurodollars deposits' time purpose tions time RPs Eurodollars bonds Treasury cial paper' tances
NSA' deposis' and broker/ only deposits' NSA' NSA' securiliesdealer'
_ ___ 1 2 3 4 5 6 7 8 9 10 11 12 13 14 IS
LEVELS ($BILLIONS) :ANNUALLY 14TH QTR.)
1989 221.2 279.2 282.8 76.2 884.7 1145.3 311.2 106.8 561.3 106.8 78.8 116.8 320.3 349.1 40.31990 245.5 277.5 292.7 78.8 919.9 1167.7 346.2 130.1 501.9 93.6 68.0 125.2 331.1 357.4 33.61991 266.0 287.0 329.1 72.8 1028.8 1079.1 359.8 173.6 443.1 73.4 61.3 137.0 320.3 337.9 24.4
MONTHLY1991-FEB. 254.6 275.9 297.5 70.4 931.0 1169.5 361.0 145.5 499.6 86.7 69.8 127.9 328.8 357.1 34.6
MAR. 256.0 276.9 301.3 69.2 941.7 1165.9 365.0 148.5 492.8 83.5 68.2 129.0 323.5 353.8 32.1
APR. 256.3 276.1 302.5 69.6 953.0 1159.4 366.6 152.9 487.7 82.2 65.2 130.1 307.3 341.6 30.6MAY 256.6 278.4 307.8 68.5 966.1 1150.9 367.8 155.2 483.5 80.4 62.3 131.3 299.5 327.9 29.1JUNE 257.6 280.1 311.6 67.9 976.8 1140.6 368.8 155.3 478.3 78.4 61.6 132.4 325.1 333.0 28.1
JULY 259.3 279.3 313.7 64.8 986.1 1129.5 367.9 155.4 471.2 78.8 62.7 133.5 332.7 339.8 28.1AUG. 261.3 280.1 317.3 67.3 994.1 1120.8 362.4 158.6 465.5 78.4 63.6 134.4 330.4 336.3 27.2SEP. 262.9 280.6 320.6 66.4 1002.4 1111.0 359.9 162.6 458.5 76.7 61.5 135.2 322.9 337.7 25.8
OCT. 264.8 283.8 324.5 69.5 1015.0 1095.2 359.3 168.2 450.0 75.5 63.0 136.1 321.2 336.2 25.3NOV. 266.0 287.6 329.7 73.3 1028.7 1079.2 359.5 173.6 442.3 73.7 62.3 137.1 323.7 337.9 24.5DEC. 267.3 289.5 333.2 75.7 1042.6 1063.0 360.5 179.1 437.1 70.9 58.5 137.9 316.1 339.7 23.3
1992-JAN. 269.4 293.9 338.9 77.4 1061.3 1042.6 360.0 182.4 427.9 70.9 57.3 138.9 310.9 334.8 23.2FEB. 271.6 305.1 346.0 77.5 1084.2 1019.0 363.7 188.2 421.9 72.0 57.8
nstitutions are subtracted from small time deposits.
Net of money market mutual fund holdings of these items.Includes money market deposit accounts.Includes retail repurchase agreements. All IRA and Keogh accounts at commercial banks and thrift iiExcludes IRA and Keogh accounts.Net of large denomination time deposits held by money market mutual funds and thrift institutions.p-preliminary

NET CHANGES IN SYSTEM HOLDINGS OF SECURITES 1Millions of dollars, not seasonally adjusted
STRICTLY CONFIDENTIAL (FR)CLASS II-FOMC
Period
198919901991
1990 -01-02-03-04
1991 -01-02-03-04
1991 Mach
AprilMayJuneJulyAugustSeptemberOctoberNovemberDecember
1992 JanuaryFebruary
WeeklyDecember 25
January 18152229
February 5121926
March 4111825
Memo: LEVEL (bil $) 6March 25
1.468 12,730 -11,26317,448 4.400 13,04820,038 1.000 19,038
-3,799 1,400 -5.19910,892 - 10.892
5,115 - 5,1155.241 3,000 2.241
2,160 1.000 1,1604,356 - 4,3567,664 - 7,6645858 - 5858
313908
3,41137
1,3595.776
5292,1982.823
837
-1,628123
-221-498-909
-
123
39
313908
3,41137
1,3595,776
5292,1982.823
837
-3,228123
-221-898
-1.709-400
123
39
135.7
Treasur
327425
3,043
94650
6.583
2,950550650
2.433
2.950550
650
2.133300
258 284 500 1.315-100 - - 375
1.280 375 - 11,282
- - - 200
- - - 150- -- ISO
-100 - - 25
400 - - 4,150- - - 1,450- - - 1,815
880 375 - 3,867
50 - - 3,700- - - 1,250
-- - 200
625- - - 340
-- - 850
880 375 - 3.567- - --- 300
- 1,027
34.0 62.5 15.2 24.6 136.3
Net changeoutright
-10.39013,24025,199
-5,00010,964
5,0452,230
5.3103,1729,4197.299
4,0132.0671.068
371,9296.1161.3742.1854,0221,092
-3,3131,150
-45
-255-933
-1,725-400
395755
-0625839
-1.68311,128-1,614
-4.061500
-2,12416.805
-16.864902152
14.106
-14.7931,370-1,153
77571
-2.1342.2166,942-8,871
16,035
-12,874-2,010
8,2506,050
-16.195-1.0595.150
-5,495-1,0962211
11.087-9,9951,8921.1653,800
-6,138
1. Change from end-of-period to end-of-period. 4. Reflects net change in redemptions (-) of Tre2 Outright transactions in market and with foreign accounts. 5. Includes change in RPs (+), matched sale-pu3. Outright transactions in market and with foreign accounts, and short-term notes acquired 6. The levels of agency issues were as follows:in exchange for maturing bills. Excludes maturity shifts and rollovers of maturing Issues.
asury and agency securities.rchase transactions (-), and matched purchase sale transactions (+).
March 25
within1 yewr 1-5 5-10 over 10 total
2.3 2.8 0.8 0.2 6.1
March 27,1992
277.9 -6.1'