fomc 19970520 g bpt 219970515
TRANSCRIPT

Prefatory Note
The attached document represents the most complete and accurate version available based on original copies culled from the files of the FOMC Secretariat at the Board of Governors of the Federal Reserve System. This electronic document was created through a comprehensive digitization process which included identifying the best-preserved paper copies, scanning those copies,1 and then making the scanned versions text-searchable.2 Though a stringent quality assurance process was employed, some imperfections may remain.
Please note that this document may contain occasional gaps in the text. These gaps are the result of a redaction process that removed information obtained on a confidential basis. All redacted passages are exempt from disclosure under applicable provisions of the Freedom of Information Act.
1 In some cases, original copies needed to be photocopied before being scanned into electronic format. All scanned images were deskewed (to remove the effects of printer- and scanner-introduced tilting) and lightly cleaned (to remove dark spots caused by staple holes, hole punches, and other blemishes caused after initial printing). 2 A two-step process was used. An advanced optimal character recognition computer program (OCR) first created electronic text from the document image. Where the OCR results were inconclusive, staff checked and corrected the text as necessary. Please note that the numbers and text in charts and tables were not reliably recognized by the OCR process and were not checked or corrected by staff.

Confidential (FR) Class III FOMC
Part 2May 15, 1997
CURRENT ECONOMICAND FINANCIAL CONDITIONS
Recent Developments
Prepared for the Federal Open Market CommitteeBy the staff of the Board of Governors of the Federal Reserve System

Confidential (FR) Class III FOMC
May 15, 1997
RECENT DEVELOPMENTS
Prepared for the Federal Open Market Committeeby the staff of the Board of Governors of the Federal Reserve System

DOMESTIC NONFINANCIALDEVELOPMENTS

DOMESTIC NONFINANCIAL DEVELOPMENTS
Economic activity was extraordinarily robust in the first
quarter, but April data on employment, industrial production, and
retail sales point to a marked slackening of growth in the current
quarter. Increased pressures on resources have produced a hint of
deterioration in the trends of hourly labor compensation, but this
has yet to be clearly mirrored in price inflation.
Real GDP
According to BEA's advance estimate, real GDP rose 5.6 percent
at an annual rate in the first quarter. Private domestic final
purchases soared, reflecting large gains in both consumer spending
and business fixed investment, and inventory investment also rose
sharply. The only sector that showed significant weakness was net
exports, which reversed most of the big increase in the fourth
quarter.
REAL GDP AND SELECTED COMPONENTS
1997:Q1BEA Expected
1996:Q4 adv. revisionPercent change,
annual rate
Real GDP
Final sales
Private domestic final purchasesConsumptionBusiness fixed investmentResidential investment
Federal governmentState and local government
3.8 5.6 6.0
4.9 3.9 3.8
3.3 7.1 6.73.4 6.4 5.85.5 11.9 12.2
-1.8 5.5 6.4
-5.3 -3.5 -3.51.9 1.2 1.9
Level, billions ofchained (1992) dollars
Nonfarm inventory investment 19.3 46.5 52.6Net exports -98.4 -130.3 -128.5
Since the publication of the advance GDP estimate, we have
received the usual monthly flow of data as well as the Census
Bureau's annual revisions to the retail and wholesale trade data and
partial historical revisions to the NIPAs from the BEA. Taken
together, the incoming information suggests that first-quarter GDP
II-1

II-2
CHANGES IN EMPLOYMENT(Thousands of employees; based on seasonally adjusted data)
1996 1997 1997
1995 1996 Q3 Q4 Q1 Feb. Mar. Apr.
------------ Average monthly changes---------Nonfarm payroll employmentI 185 216 171 224 237 314 139 142
Private 176 201 147 223 229 281 166 110Manufacturing -12 -8 -19 10 15 3 17 -14
Durable 5 4 -7 12 18 12 18 -3Transportation equipment -3 1 -4 4 7 0 8 -10
Nondurable -17 -12 -12 -2 -3 -9 -1 -11Construction 9 25 16 24 31 104 -25 -44Trade 54 63 59 88 39 46 72 33Finance, insurance, real estate 4 14 14 14 14 15 18 23Services 110 100 76 86 103 86 72 93
Help supply services 8 12 12 -3 16 -40 19 -5Total government 9 15 24 2 9 33 -27 32
Private nonfarm production workers1 152 168 120 184 201 354 169 34Manufacturing production workers -10 -8 -14 8 12 6 9 -13
Total employment2 32 232 219 202 440 -150 745 209Nonagricultural 51 225 195 220 453 26 651 98
Memo:Aggregate hours of private production
workers (percent change) 1 .1 .3 .1 .3 .3 2.6 .0 -. 8Average workweek (hours)1 34.5 34.4 34.4 34.6 34.7 34.9 34.9 34.6Manufacturing (hours) 41.6 41.5 41.7 41.8 41.9 41.9 42.1 42.2
Note. Average change from final month of preceding period to final month ofperiod indicated.
1. survey of establishments.2. Survey of households.
Average Weekly Hours
Hours35.1
35
34.9
34.8
34.7
34.6
Aggregate Hours of Production orNonsupervisory Workers
Index, 1982=100
1985 1989 1993 1985 1989 1993 19971997

II-3
growth may be raised fractionally: On balance, we expect final
sales to be little changed, as a downward revision to consumer
spending is offset by upward revisions to other components, but the
reported pace of inventory investment in the manufacturing and trade
sectors has been even greater than BEA had assumed. Unless
otherwise noted, the discussion of first-quarter activity in the
remainder of this section of the Greenbook incorporates our expected
revisions to the GDP data.
Labor Market Developments
Growth in labor demand appears to have moderated slightly over
the March-April period from its rapid pace of the winter. Payroll
increases slowed, and in April, the average workweek dropped back
from the high level in the previous two months. Labor markets
remain tight, however: The unemployment rate moved down to
4.9 percent in April (5.0 percent on concurrent seasonals), and the
labor force participation rate edged down only slightly from its
historical high in March. In addition, initial claims for
unemployment insurance, which had been boosted at least in part in
late April and early May by flooding in the Midwest and strike-
related layoffs, returned to about their first-quarter average
during the week ended May 10.
Private nonfarm employment grew about 140,000 per month, on
average, in March and April following increases averaging 240,000
per month over the previous five months. The slowing of employment
growth was concentrated in the goods-producing sector. Construction
posted job declines averaging 35,000 per month in the past two
months. These decreases likely were exaggerated by the weather:
The outsized gains during the mild weather of February apparently
"borrowed" from later months and building conditions were subpar
during the survey weeks in March and April. Manufacturing
employment, which had grown about 15,000 per month, on average, in
the first quarter, dropped 14,000 in April; 3,500 of the decline
reflects striking GM workers in Oklahoma.
The average workweek of production or nonsupervisory workers
dropped 0.3 hour in April, to 34.6 hours--about equal to its average
over the past six months. Aggregate hours of production or
nonsupervisory workers were unchanged in March and fell 0.8 percent
in April, compared with average monthly growth rates of 0.4 percent
from October to February.

II-4
SELECTED UNEMPLOYMENT AND LABOR FORCE PARTICIPATION RATES(Percent; based on seasonally adjusted data)
1996 1997 1997
1995 1996 Q3 Q4 Q1 Feb. Mar. Apr.
Civilian unemployment rate(16 years and older) 5.6 5.4 5.3 5.3 5.3 5.3 5.2 4.9Teenagers 17.3 16.7 16.6 16.6 17.0 17.5 16.4 15.4Men 4.8 4.6 4.5 4.4 4.5 4.4 4.4 4.2Women 4.9 4.8 4.7 4.8 4.7 4.7 4.7 4.4
Full-time workers 5.5 5.3 5.2 5.2 5.2 5.1 5.1 4.8
Labor force participation rate 66.6 66.8 66.8 66.9 67.2 67.0 67.3 67.2
Labor Force Participation RateTotal, Age 16+ (Adjusted for CPS redesign in 1994)
Total, Age 16+Percent
Quarterly averages
April
Last Six Months67.4
April 67
- 66.61996 1997
1980 1985 1990 1995 I I I I I1980 1985 1990 1995
Men Age 20+Percent
Women Age 20+Percent
Quarterly averages
April
I9 I I I I I 199 1 99
1987 1989 1991 1993 1995 1997I I I I I I I I I I I 1 561987 1989 1991 1993 1995 1997

II-5
The strength of economic activity in the past year has boosted
labor force participation. The participation rate was little
changed in April after reaching a record high in March; since the
beginning of the year, it has fluctuated between 67.0 percent and
67.3 percent. Taking a slightly longer perspective, the
participation rate has rebounded from its unexplained drop in 1995
and now stands above its level in late 1994. Participation rates of
adult men and teenagers, which decrease noticeably in the early
1990s, have been little changed, on net, since late 1994. In
addition, the participation of adult women, which had grown only
slowly at the beginning of the current expansion, has been moving up
more rapidly in the past year or so.
Some analysts have speculated that welfare reform has been a
key driver of the upturn in the labor force participation rate. In
fact, there has been rapid labor force growth recently among women
who maintain families--the group most likely to be affected by
welfare reform. However, this group accounts for only about
4 percent of the population, and its labor force increase has added
at most 0.2 percentage point to the aggregate participation rate
over the past year. Moreover, even within this group, only about
60 percent have children under 18 years--a key eligibility criterion
for many welfare programs. Also, the rise in participation has not
been limited to groups likely to be affected by welfare reform.
This suggests that job availability has probably been a more
important factor.
The staff estimates that output per hour of all persons in the
nonfarm business sector grew at a 2-1/2 percent annual rate in the
first quarter. Smoothing through the quarterly fluctuations,
productivity has risen about 1 percent per year since the first
quarter of 1995, after having stagnated over the previous two years.
In the nonfinancial corporate sector, productivity grew 1.7 percent
at an annual rate in the fourth quarter and 2.1 percent over 1996 as
a whole.2
1. BLS's preliminary estimate of productivity growth in the firstquarter--which was based on the advance GDP release--was2.0 percent.
2. Data on productivity growth in the nonfinancial corporatesector for the first quarter will not be available until the nextProductivity and Cost release on June 18.

II-6
GROWTH IN SELECTED COMPONENTS OF INDUSTRIAL PRODUCTION(Percent change from preceding comparable period)
1996 1997 1997Proportion
1996 19961 Q4 Q1 Feb. Mar. Apr.
-Annual rate- --Monthly rate---
Total index 100.0 3.9 4.5 4.7 .5 .6 .0Previous 3.9 4.5 5.6 .6 .9
Manufacturing 86.5 4.1 4.3 5.7 .7 .5 -.2Durables 47.1 5.7 2.8 8.5 1.1 .8 -.3Motor veh. and parts 4.9 -1.6 -15.2 15.4 -1.6 .1 -6.8Aircraft and parts 2.3 34.5 33.0 17.9 .9 2.3 .4
Nondurables 39.4 2.3 6.0 2.4 .2 .2 -.1
Manufacturing excludingmotor vehicles & parts 81.6 4.5 5.6 5.1 .8 .5 .2
Mining 5.6 3.4 .5 5.8 2.1 .9 -.5Utilities 7.9 1.4 9.5 -6.5 -2.6 .9 2.0
IP by market group,excluding motor vehicles & parts
Consumer goods 26.1 2.6 7.2 -1.2 -.1 .7 .0Durables 4.1 3.0 .0 4.5 2.2 2.2 -1.2Nondurables 22.0 2.5 8.6 -2.1 -.5 .5 .2
Business equipment 12.7 9.1 9.3 11.6 1.3 .8 .8Information processing 5.8 10.8 7.5 13.4 2.2 1.2 1.1Industrial 4.5 -.2 1.1 2.5 .0 .0 .8Transit 1.2 53.1 48.4 33.5 2.2 2.6 .4Other 1.3 3.6 12.3 14.6 .9 .0 -.2
Construction supplies 5.7 5.7 -.4 .5 2.2 .5 .0
Materials 38.5 4.3 4.6 5.6 .8 .6 .3Durables 21.5 6.3 4.9 7.8 1.2 .9 .3
Semiconductors 4.0 16.0 17.8 34.5 3.5 3.6 2.4Metals 3.7 3.2 4.5 -1.6 .9 -.5 -.2
Nondurables 9.0 2.8 6.3 6.3 .8 .2 -.1
1. From the final quarter of the previous period to the final quarter of theperiod indicated.
CAPACITY UTILIZATION(Percent of capacity; seasonally adjusted)
1988-89 1959-96 1996 1997 1997
High Avg. Q4 Q1 Feb. Mar. Apr.
Manufacturing 85.7 81.7 82.3 82.6 82.7 82.8 82.4
Primary processing 88.9 82.8 86.6 86.7 86.9 87.0 86.8Advanced processing 84.2 81.2 80.4 80.8 80.8 81.0 80.4

II-7
Industrial Production
Industrial production was unchanged in April after posting
sizable gains in the fourth and first quarters. Output in the
manufacturing sector is estimated to have slipped 0.2 percent,
dragged down by a sharp drop in the production of motor vehicles and
related parts and materials. All told, the slump in vehicle
production probably depressed overall manufacturing output about
0.7 percent in April, taking into account both the direct effects of
lower assemblies and spillovers to upstream industries like steel,
metal stampings, and rubber. With the decline in motor vehicle
output, factory utilization fell to 82.4 percent last month; about
3/4 percentage point above the 1959-1996 average. Utilization in
advanced processing was a bit below its average, while the rate for
primary processing was 4 percentage points above its long-term
average.
Two factors contributed to the sharp drop in motor vehicle
assemblies from 12.5 million units (annual rate) in March to
11.1 million units in April. First, the automakers had stepped up
production over the winter to replenish stocks that were drawn down
by the strikes in late 1996. And, with inventories of most models
having been restored to comfortable levels by March, the companies
planned to return output to more normal levels in April. Second,
local strikes against Chrysler and GM cut April's assemblies almost
a million units. The bulk of the strike-related production loss was
associated with the recently settled dispute at a Chrysler plant
that makes engines for popular models of light trucks. Because the
assembly plants idled by the strike had already been operating at
full capacity, Chrysler has little room to recoup the lost
production over the near term. Current schedules for the industry
as a whole, which show planned output of about 12-1/4 million units
at an annual rate in May and June, are little changed from pre-
strike plans. A brief strike against a GM parts plant was settled
on May 14, but threats of additional work stoppages later this
spring present a downside risk to production.
By major market group (excluding motor vehicles and parts), the
output of consumer goods remained flat in April, as declines in
consumer durables were largely offset by small gains in consumer
nondurables. The output of business equipment posted another solid
gain, led by a good performance of information processing equipment.
Production of aircraft and parts grew moderately after a big gain in

II-8
Manufacturing Capacity Utilization
Percent
Average capacity utilization(1959-1996)
1985 1987 1989 1991 1993 1995
90.7
87.7
84.7
81.7
78.7
75.7
- 72.71997
NEW ORDERS FOR DURABLE GOODS(Percent change from preceding period, seasonally adjusted)
1996 1997 1997
Share,1996:H2 Q4 Q1 Jan. Feb. Mar.
Total durable goods 100.0 .6 1.8 3.8 1.0 -2.6
Adjusted durable goodst 68.0 .1 4.6 4.5 4.1 -2.1
Computers 5.0 .2 -1.2 -4.8 -2.4 -.7Nondefense capital goods
excluding aircraft and computers 17.0 -.7 6.9 5.8 10.2 -2.3All other categories 46.0 .3 4.4 5.2 2.6 -2.1
Memo:Real adjusted orders2 .3 4.5 4.4 3.9 -2.4
1. Orders excluding defense capital goods, nondefense aircraft, and motor vehicleparts.
2. Nominal adjusted durable goods orders were split into two components, computersand all other. These components were deflated and then aggregated in a chain-weighted fashion.

II-9
the first quarter. Output of construction supplies did not change
in April and remains around the very high level reached last
November. Another substantial advance in semiconductor output
boosted growth in durable materials.
PRODUCTION OF DOMESTIC AUTOS AND TRUCKS(Millions of units at an annual rate; FRB seasonal basis)
1997 1996 1997Feb. Mar. Apr. Q4Q 1 02
Sched.
U.S. production 12.4 12.5 11.1 11.8 12.4 11.9Autos 6.1 6.2 5.7 5.8 6.1 5.9Trucks 6.3 6.3 5.5 6.0 6.3 6.0
Days' supplyAutos 57.3 55.2 61.3 61.2 55.2 ---Light trucks 68.7 69.4 77.3 67.5 69.4
Note. Components may not sum to totals because of rounding.
The advance indicators of industrial activity, though remaining
upbeat, are consistent with some slowdown from the robust first-
quarter pace. The diffusion indexes of orders in the National
Association of Purchasing Managers (NAPM) and the Dun & Bradstreet
surveys decreased in April but continue to suggest future increases
in production. In addition, the staff's adjusted durable goods
orders series, derived from the M3 survey, declined substantially in
March but remained at a relatively high level.
Motor Vehicles
Light motor vehicle sales slowed in April to 14.5 million units
(annual rate) from 15.4 million units in March, after adjusting for
GM's and Toyota's extension of the March reporting period into
April. A drop in retail sales of autos and light trucks appears to
account for most of the April decline because fleet sales (based on
confidential data) fell only a bit, after jumping in March.
On average, the pace of vehicle sales over the first four
months of the year was about the same as that over 1996 as a whole.
The weakening of the yen over the past several quarters has enhanced
the competitiveness of Japanese nameplates, and the popularity of
several new models has also boosted sales. As a result, the share
of new automobile sales going to the three largest Japanese
manufacturers has increased from 27 percent in 1996 to 29 percent so
far this year.

II-10
SALES OF AUTOMOBILES AND LIGHT TRUCKS(Millions of units at an annual rate; FRB seasonals)
1996 1997 1997
1995 1996 Q3 Q4 Q1 Feb. Mar. Apr.
Total 14.7 15.1 15.0 14.8 15.4 15.1 15.7 14.2Adjustedl 14.7 15.0 15.1 14.7 15.3 15.2 15.4 14.5
Autos 8.6 8.5 8.6 8.0 8.6 8.4 8.6 7.8Light trucks 6.1 6.6 6.4 6.8 6.8 6.7 7.1 6.3
North American 2 12.8 13.4 13.3 13.1 13.5 13.3 13.7 12.4Autos 7.1 7.2 7.3 6.7 7.2 7.0 7.2 6.6
Big Three 5.4 5.3 5.3 4.8 5.1 5.1 5.2 4.8Transplants 1.7 1.9 2.1 1.9 2.1 1.9 2.1 1.8
Light trucks 5.7 6.1 6.0 6.3 6.2 6.2 6.5 5.8
Foreign produced 1.9 1.7 1.7 1.7 1.9 1.9 2.0 1.8Autos 1.5 1.3 1.3 1.3 1.4 1.3 1.4 1.2Light trucks .4 .4 .4 .5 .6 .5 .6 .6
Note. Components may not sum to totals because of rounding. Data on salesof trucks and imported autos for the most recent month are preliminary.
1. Excludes the estimated effect of automakers' changes in reporting periods.2. Excludes some vehicles produced in Canada that the industry classifies as
imports
Total Industry Fleet and Retail Sales(Millions of units; annual rate)
1995Note. FRB staff estimate
14 5
13.5
4
11.5
11
-- 1019971996
Buying Attitudes for New Vehicles
I I """""L "" 1001993 1994 1995 1996 1997

II-11
Several factors point to continued strength in consumer demand
in the near term. The Conference Board survey in March and April
reported that consumer plans to buy new automobiles in the next six
months were among the highest in the past several years, while the
Michigan Survey index of car buying conditions for April remained in
the favorable range witnessed over the past year. In addition, the
automakers are offering generous sales incentives this quarter. In
the wake of its recently settled strike, Chrysler's supplies of
light trucks are a bit tight but not lean enough to place an
appreciable drag on sales in the near term.
Personal Income and Consumption
Growth in consumer spending appears to be moderating after the
blockbuster first quarter. Nonetheless, the underlying trend in
consumption remains consistent with the positive fundamentals in the
sector, namely robust income growth, receding concerns about
unemployment, and the huge gains in household net worth over the
past two years.
Much of the statistical information for April is for spending
on goods. As noted, motor vehicle sales sagged noticeably last
month. In addition, according to Census' advance April report,
nominal retail sales in the control category, which excludes sales
at automotive dealers and building material and supply stores, fell
0.2 percent last month. In addition, the data for the preceding two
months were revised down to show a 0.6 percent increase in February
and no gain in March. The drop-off in spending in April was most
pronounced at general merchandise stores, which had experienced a
boom in sales in the first quarter. Based on the retail sales
report and available information on prices, the staff estimates that
real PCE for goods excluding motor vehicles in April was 0.2 percent
(not at an annual rate) above the average level in the first
quarter.
Spending on services rose 3.6 percent last quarter, despite
warm winter weather that held down outlays for energy services;
unseasonably cool temperatures in April prompted a rebound in energy
spending last month. Expenditures on personal business services
remained quite strong for the first quarter as a whole, reflecting,
in part, the sharp increases in spending on brokerage services
associated with the run-up in trading volumes on major U.S.
exchanges around the turn of the year.

II-12
RETAIL SALES(Percent change; seasonally
1996
Q3 Q4
adjusted)
1997
Q1
1997
Feb. Mar. Apr.
Total salesPrevious estimate 1
Building materialsand supplies
Automotive dealers
Retail control2
Previous estimatel
Durable goodsFurniture and appliancesOther durable goods
NondurablesApparelFoodGeneral MerchandiseGasoline stationsDrug storesOther nondurables
.3 1.3 2.8 1.33.5 1.5
1.1 -.3 4.2 3.0 1.0 -.0-8 1.4 4.1 2.9 -.3 -.9
.1 1.4 2.12.7
-. 7.6
-1.6
.2-. 61.0
.5-2.5
2.2.6
1.5 2.2 2.2 -. 8-. 4 2,4 3.1 -1.13.0 2.1 1.6 -.6
1.4-.9
.91.22.62.22.1
2.12.6
.63.71.93.42.4
.3
.3.0.4
-. 62.0
.7
.2-1.0
.6-. 1-. 5
.7
.5
-. 2
.1-. 3
.4
-. 3-. 6-. 5-. 9-. 1-. 1
.5
1. The "previous estimates" refer to March's regular retail salesrelease.
2. Total retail sales less building material and supply stores andautomotive dealers, except auto and home supply stores.
Consumer Surveys
Consumer Sentiment
1987 1990 1993 1996
Index- 125
Apr.
.(f) 105
85
Inde
65
S45
Current Labor Market Conditions*Index
* The index is defined as the proportion of respondentsreporting that jobs are plentiful minus the proportion reportingthat jobs are hard to get, plus 100.

II-13
REAL PERSONAL CONSUMPTION EXPENDITURES(Percent change from the preceding period;
derived from billions of chained (1992) dollars)
1996 1997 1997
1995 1996 Q3 Q4 Ql Jan. Feb. Mar.
- -Q4/Q4- - - - Annual rate - - - -Monthly rate- -PCE 1.9 2.7 .5 3.4 6.4 1.1 .2 .4
Durables 1.3 5.4 -2.6 5.0 19.9 3.6 .2 .7Motor vehicles -3.8 -.5 -10.0 -1.0 15.1 5.7 -4.1 1.6Computers 52.3 57.7 40.8 36.3 76.7 5.8 5.3 3.5Other durable goods .4 2.2 -4.1 3.6 12.9 1.8 2.0 -.5
Nondurables 1.1 1.8 .4 1.8 6.3 1.2 .3 .5Gas and oil 1.9 1.0 -3.2 5.3 -.4 -.3 1.4 .3Clothing and shoes .7 5.1 3.2 -1.0 14.1 2.0 1.0 .8Other nondurables 1.1 1.1 .1 2.1 5.1 1.2 .0 .4
Services 2.4 2.6 1.3 3.8 3.6 .4 .1 .2Energy 5.4 1.8 -11.4 3.7 -9.5 2.0 -4.4 -.2Non-energy 2.3 2.6 1.9 3.8 4.2 .3 .3 .2
Housing 1.8 1.6 1.3 1.9 2.1 .2 .2 .2Household operation 3.8 3.7 .1 9.5 4.4 .3 .4 .3Transportation 3.1 4.4 4.2 6.1 7.6 .1 .3 .5Medical 2.5 2.2 2.1 3.9 3.9 .3 .6 .5Personal business 2.5 1.8 -3.0 5.6 6.0 .9 .0 -.4Other 1.7 4.3 6.4 2.3 5.1 .3 .4 .3
Note. Derived from BEA's advance estimates.
PERSONAL INCOME(Average monthly percent change)
1996 1997 1997
1995 1996 Q4 Q1 Jan. Feb. Mar.
- Q4/Q4 - Annual rate - - Monthly rate - -Total personal income 5.6 5.7 5.4 7.3 .3 .8 .6
Wages and salaries 5.3 6.2 6.3 8.5 .0 1.3 .7Private 5.8 6.8 7.3 9.0 -.3 1.5 .8
Other labor income 5.5 3.0 4.0 2.9 .2 .2 .2
Less: Personal tax andnontax payments 7.9 9.9 6.9 -.1 -1.8 1.2 .6
Equals: Disposablepersonal income 5.3 5.1 5.2 8.4 .7 .8 .6
Memo:Real disposable income1 3.1 2.7 2.6 6.4 .6 .5 .5Saving rate (percent) 4.6 4.9 5.1 5.1 4.9 5.2 5.3
Note. Derived from BEA's advance estimates.1. Derived from billions of chained (1992) dollars.

II-14
According to the advance NIPA estimates, real disposable income
rose 6.4 percent at an annual rate in the first quarter, and the3
saving rate held steady at 5.1 percent. The apparent flatness
of the saving rate is misleading, however. The rate was likely
overstated by about 0.3 percentage point in the first quarter
because BEA does not seasonally adjust the annual changes to
government expenditures and the reindexation of tax brackets that
take place in January. Also, incoming data point to revisions
to the advance estimates of disposable income as well as
consumption. In particular, data from the Treasury indicate that
BEA's advance estimate of seasonally adjusted tax payments in the
first quarter was too low. 5 Taking into account the likely
revisions to spending and income, we expect the saving rate to be
lowered slightly in the next GDP release.
Readings on consumer sentiment remained buoyant in April. The
Michigan SRC index rose to its highest level since the 1960s.
Although many consumers mentioned concerns about rising interest
rates, their views of buying conditions for homes, vehicles, and
large durables changed little, partly because of an increase in the
number of respondents who advocated buying now in advance of rate
increases. The Conference Board confidence index slipped a bit in
April, as views of current labor market conditions retreated from
the extremely favorable level registered in March.
Housing Markets
Housing activity has been buffeted by unseasonable weather
since late last year. However, cutting through the ups and downs,
activity in the single-family sector has remained essentially flat
over the past couple of quarters. Single-family starts in the first
quarter were about equal to the average pace for 1996 as a whole,
and permits have continued to fluctuate within a fairly narrow
3. These figures reflect BEA's recent revisions to its estimatesof saving, which incorporate new estimates of capital depreciationand related income series. Although saving rates were raised0.3 percentage point, on average, over 1981-93, the revisions to thedata for recent years were minimal.
4. These annual adjustments include cost-of-living and otherchanges in federal transfer programs and increases in federal payscales. By introducing the changes all at once, BEA overstatesthe level of disposable income in the first half of the year butunderstates the level of disposable income in the second half.
5. See the Federal section for more discussion of the taxsurprise. Even though final tax payments are concentrated in April.BEA's normal procedure is to spread these payments over the year.The advance estimate for the first quarter is, of necessity, basedon a projection of these payments.

II-15
Private Housing Activity(Millions of units; seasonally adjusted annual rate)
1996 1997
1996 Q3 Q4 r QiP Jan. r Feb.r Mar.P
All unitsStarts 1.48 1.49 1.42 1.44 1.38 1.52 1.43Permits 1.43 1.43 1.40 1.43 1.40 1.44 1.45
Single-family unitsStarts 1.16 1.18 1.09 1.15 1.13 1.22 1.12Permits 1.07 1.06 1.02 1.05 1.05 1.08 1.03New home sales 0.76 0.79 0.76 0.82 0.83 0.83 0.81Existing home sales 4.09 4.09 4.00 4.08 3.91 4.23 4.11
Multifamily unitsStarts 0.32 0.31 0.33 0.29 0.25 0.30 0.31Permits 0.36 0.36 0.38 0.38 0.35 0.37 0.42
Mobile homesShipments 0.36 0.37 0.35 n.a. 0.34 0.36 n.a.
Note, p Preliminary. r Revised, n.a. Not available.
Private Housing Starts(Seasonally adjusted annual rate)
Millions of units
1977 1979 1981 1983 1985 1987 1989 1991 1993 1995 1997

II-16
Indicators of Housing Demand(Seasonally adjusted; FRB seasonals)
Builders' Rating of New Home SalesDiffusion index
1989 1990 1991 1992 1993 1994 1995 1996 1997Note. The index is calculated from National Association of Homebuilders data as the proportion of respondents rating current sales as good
minus the proportion rating them as poor.
MBA Index of Mortgage Loan Applications for Home Purchase
F4 week moving averageS --------Weekly
index
May 9I¢i
1990 1991 1992 1993 1994 1995 1996
Consumer Homebuying Attitudes
1997
Diffusion index
1997
Z-V
1989
1989 1990 1991 1992 1993 1994 1995 1996Note. The homebuying attitudes index is calculated from Survey Research Center data as the proportion of respondents
rating current conditions as good minus the proportion rating conditions as bad.
I I I I
60
40
20
+0
20
40
60
80
250
200
150
100
50
100
75
50
25
0

II-17
range. (April figures for starts and permits will be published this
Friday.)
Despite dropping off a bit in March, new home sales jumped to
an eighteen-year high in the first quarter. However, the Census
Bureau is in the process of implementing a new data collection
procedure that has made these notoriously unreliable data even more
difficult to interpret than usual. Existing home sales tailed off
in March after February's sharp gain. For the first quarter as a
whole, existing home sales returned to just below the 1996 average.
More recent indicators of single-family housing demand show a
mixed picture. Builders' assessments of new home sales have
remained in a narrow range since late 1996. After smoothing through
the gyrations in weekly readings, applications for new mortgages
have firmed of late after a dip earlier in the year. However, home
buying attitudes as measured by the Michigan survey were less
positive in March and April than earlier in the year.
Multifamily housing starts dropped sharply in the first quarter
of 1997, about offsetting the fourth-quarter surge. Averaging
through the fourth and first quarters, multifamily starts were in
line with their average for the first three quarters of 1996.
Business Fixed Investment
Real business fixed investment expanded at a 12 percent annual
rate in the first quarter: Growth in outlays for producers' durable
equipment rebounded from a weak fourth-quarter showing, and real
investment in nonresidential structures posted a third consecutive
quarter of substantial growth.
The strength in real PDE last quarter was widespread. In the
high-tech sectors, the continuing wave of upgrades to Windows NT and
strong demand for high-end servers for computer networks reportedly
have provided considerable impetus to spending on computing and
office equipment, and demand for communications equipment remained
strong. In addition, expenditures on other equipment recouped the
previous quarter's decline.
Recent data on orders suggest that equipment investment will
continue to advance at a healthy clip. Orders for communications
equipment were up more than 12 percent in the first quarter.
Anecdotal reports reinforce the view that the outlook is for brisk
growth in this sector: Competition is heating up among service
providers in local phone markets in anticipation of deregulation,
demand for wireless and personal communication systems is continuing

II-18
BUSINESS CAPITAL SPENDING INDICATORS(Percent change from preceding comparable period;
based on seasonally adjusted data, in current dollars)
1996 1997 1997
Q2 Q3 Q4 Ql Jan. Feb. Mar.
Producers' durable equipment
Shipments of nondefense capital goods 2.9 1.8 1.5 1.0 -3.3 2.4 3.5Excluding aircraft and parts 1.5 1.5 1.0 .5 -3.4 2.9 2.2
Office and computing -.8 4.4 -.4 2.6 -1.4 -1.2 3.4Communications equipment 4.7 4.5 4.2 -1.0 -8.1 9.7 4.5All other categories 1.7 -.3 .6 .1 -2.9 2.9 1.2
Shipments of complete aircraft I 12.2 14.7 21.1 -10.2 -38.6 15.7 32.2
Sales of heavy trucks 1.3 -.8 -5.6 6.0 6.8 -.4 3.5
Orders of nondefense capital goods -6.5 4.9 .5 1.9 4.4 2.4 -4.0Excluding aircraft and parts -1.7 2.6 -.5 4.9 3.1 7.2 -1.9
office and computing 1.6 5.0 .2 -1.2 -4.8 -2.4 -.7Communications equipment -8.5 6.6 3.8 12.2 45.4 22.4 -5.6All other categories -1.2 .8 -1.8 5.5 -1.1 7.1 -1.3
Nonresidential structures
Construction put in place, buildings -.6 3.7 8.4 2.4 3.0 2.1 -2.3Office 8.3 9.2 8.4 4.4 2.4 8.7 -4.8Other commercial -1.0 1.4 7.7 3.0 3.3 -1.1 -.9Institutional 1.2 8.2 9.4 4.7 .7 2.4 1.5Industrial -8.0 -1.0 10.0 -5.8 3.3 -.8 -6.9Lodging and miscellaneous .0 4.5 6.6 8.5 5.2 4.3 -.2
Rotary drilling rigs in use 2 9.9 -4.0 -1.6 16.2 6.0 8.3 8.8
Memo:Business fixed investment 3 3.8 17.5 5.5 11.9 n.a. n.a. n.a.
Producers' durable equipment3 6.7 20.9 -.9 12.9 n.a. n.a. n.a.Office and computing 29.6 42.3 28.9 25.7 n.a. n.a. n.a.Communications equipment 14.9 28.2 -.7 18.9 n.a. n.a. n.a.Other equipment 4 5.3 1.9 -3.7 7.4 n.a. n.a. n.a.
Nonresidential structures3 -3.7 8.4 25.8 9.5 n.a. n.a. n.a.
1. From the Current Industrial Report "Civil Aircraft and Aircraft Engines."Monthly data are seasonally adjusted using FRB seasonal factors constrained toBEA quarterly seasonal factors. Quarterly data are seasonally adjusted usingBEA seasonal factors.
2. Percent change of number of rigs in use, seasonally adjusted.3. 1997 Q1 is BEA's advance estimate. Based on 1992 chain-weighted data;
percent change, annual rate.4. Producers' durable equipment excluding office and computing,
communications, motor vehicles, and aircraft and parts.n.a. Not available.

II-19
Orders and Shipments of Nondefense Capital GoodsOffice and Computing Equipment
Billions of dollars
Shipments Mar.------- Orders :O.
-
I I
1994
Communications Equipment
- Shipments
1995 1996II 6
1997
Billions of dollars
....... Orders ' , Mar.
I
* I
i' _ \r y'f ^^' ',j . ,_. , *
# ' c ^ t I
/i 'i ;
8
7
6
5
4
1994 1995 1996
Other Equipment (Excluding Aircraft, Computing, and Communications Equipment)
ShipmentsF ------- Orders
1 0j1997
Billions of dollars21
Mar.
It
II I
1994 1995 1996 J 179971994 1995 1996 1E

II-20
Nonresidential Construction and Contracts(Six-month moving average)
Total Building Index, Dec. 1982 = 100, ratio scale
1980 1982 1984 1986 1988 1990 1992 1994 1996
Other Commercial
1984 1986 1988 1990 1992 1994 1996 1984 1986 1988 1990 1992 1994 1996
Industrial Institutional
1984 1986 1988 1990 1992 1994 1996 1984 1986 1988 1990 1992 1994 1996
Note. For contracts, total includes private only; individual sectors include public and private.
Office

II-21
to boom, and traffic on the Internet is persistently bumping up
against capacity constraints on phone and data lines. Orders for
other capital goods, which had been on a plateau for most of 1995
and 1996, broke out of their recent range with a healthy 5.5 percent
gain in the first quarter, suggesting further improvement in
shipments of these items in the months ahead.
Business spending on motor vehicles was up considerably over
the first four months of 1997. Fleet sales of light vehicles
recovered from strike-depressed levels of late last year. Demand
for medium and heavy trucks also appears to have firmed: Sales
averaged 420,000 units at an annual rate from January to April,
after a dip in late 1996, and the recent upturn in order backlogs
bodes well for sales over the rest of the year.
Although Boeing continues to ramp up production, domestic
spending on aircraft fell slightly in the first quarter, when a
large share of deliveries were destined for foreign markets.
Real expenditures on structures rose sharply in the first
quarter after the fourth quarter's outsized 26 percent annual rate
gain. Among categories of buildings, office, other commercial,
institutional, and lodging all registered double-digit increases;
the only building category to decline was industrial, which slipped
in the wake of a fourth-quarter surge.
Contracts for private nonresidential buildings fell in the
first quarter. However, this series often takes misleading turns,
and the preponderance of indicators of future construction activity
is upbeat. Commercial vacancy rates have continued to decline, and
the FDIC real estate survey of senior examiners and asset managers
conducted in the first quarter reported improved prices for real
estate, fewer rent concessions, and a higher volume of sales.
Business Inventories
BEA's advance GDP estimate showed real nonfarm inventory
investment of $47 billion (SAAR), more than twice the fourth-quarter
pace, and the newly available data for manufacturing and trade
establishments point to an upward revision--perhaps to around
$53 billion. (Compared with BEA's assumptions in the advance
GDP release, the incoming data for manufacturers and wholesalers
6. Aside from inventories held by manufacturing and tradeestablishments, which are estimated largely from the monthly Censussurveys, BEA estimated that inventories held elsewhere in theeconomy expanded $13 billion in the first quarter, a rapid pace byhistorical standards.

II-22
CHANGES IN MANUFACTURING AND TRADE INVENTORIES(Billions of dollars at annual rates;based on seasonally adjusted data)
1996 1997 1997
Q3 Q4 Q1 Jan. Feb. Mar.
Book value basis
Total 32.7 13.8 44.8 47.8 48.5 38.3Excluding wholesale and
retail motor vehicles 18.6 20.0 37.1 45.9 43.2 22.1Manufacturing 11.3 4.9 19.2 25.2 22.7 9.9
Excluding aircraft 8.6 .5 9.3 5.8 14.3 7.9Wholesale -7.8 4.1 16.3 25.0 2.3 21.6
Excluding motor vehicles -4.9 6.0 11.8 16.4 7.8 11.2Retail 29.2 4.9 9.3 -2.4 23.5 6.8
Auto dealers 17.0 -4.3 3.2 -6.9 10.7 5.8Excluding auto dealers 12.2 9.1 6.1 4.4 12.8 1.1
SELECTED INVENTORY-SALES RATIOS(Months' supply, based on Census book-value data, seasonally adjusted)
Cyclical Range overreference points preceding 12 months
March1990-91 1994-95High Low High Low 1997
Manufacturing and trade 1.58 1.40 1.42 1.36 1.37Less wholesale and retail
motor vehicles 1.55 1.37 1.40 1.33 1.34
Manufacturing 1.75 1.39 1.45 1.37 1.38Primary metals 2.08 1.45 1.62 1.53 1.55Nonelectrical machinery 2.48 1.88 1.92 1.77 1.76Electrical machinery 2.08 1.52 1.54 1.43 1.38Transportation equipment 2.94 1.59 1.87 1.65 1.78Motor vehicles .97 .53 .67 .55 .59Aircraft 5.85 4.42 5.65 4.89 5.03
Nondefense capital goods 3.09 2.33 2.49 2.38 2.39Textile 1.71 1.44 1.59 1.49 1.50Petroleum .94 .88 .85 .76 .85Tobacco 2.83 1.99 2.18 1.93 1.98Home goods & apparel 1.96 1.70 1.76 1.66 1.69
Merchant wholesalers 1.36 1.28 1.29 1.22 1.24Less motor vehicles 1.31 1.25 1.27 1.20 1.21Durable goods 1.83 1.54 1.57 1.50 1.54Nondurable goods .96 .98 .99 .92 .92
Retail trade 1.61 1.46 1.53 1.48 1.49Less automotive dealers 1.48 1.42 1.45 1.42 1.42Automotive dealers 2.21 1.61 1.79 1.68 1.70General merchandise 2.43 2.20 2.29 2.12 2.11Apparel 2.56 2.50 2.56 2.42 2.49G.A.F. 2.44 2.23 2.30 2.16 2.16

II-23
Manufacturing
Inventory-Sales Ratios, by Major Sector(Book value)
Ratio
Excluding aircraft and parts
1980 1982 1984 1986 1988 1990 1992 1994 1996
Wholesale Excluding Motor Vehicles
1980 1982 1984 1986 1988 1990 1992 1994 1996
Retail
' "2.5 - ' *,, '
* I ' '
1 *5
Ratio
Ratio
GAF group (left scale)
Total excluding autos (right scale)
1984 1986 1988 1990 1992
2.2
1.95
1.7
1.45
1.2
1.5
1.4
1.3
1.2
1.1
1
1.7
1.6
1.5
1.4
1.31980 1982 1994 1996

II-24
were stronger, while the data for retail trade were weaker.)
Nonetheless, for most manufacturing industries and trade groupings,
the inventory-sales ratios in March were among the lowest in the
current expansion.
In manufacturing, inventories rose at a $10 billion annual rate
in book value terms in March and were up at a $19 billion rate for
the first quarter as a whole. Stocks of nondefense aircraft and
parts posted another sizable increase in the first quarter.
Excluding aircraft, stocks of nondefense capital goods edged up.
Changes were small in other categories.
In the trade sector, nonvehicle wholesale inventories continued
expanding at a moderate pace in March and over the first quarter as
a whole. Although inventory-sales ratios for most types of
wholesale distributors edged up in March, they remained near the low
end of the ranges observed in recent years. In the retail sector,
stores in the GAF grouping (general merchandise, apparel, and
furniture and appliance) reported a $7-1/2 billion drop in
inventories in March, following little net accumulation during the
first two months of the year. Inventory-sales ratios for most types
of retail establishments in March were near their lowest levels in
recent years.
Federal Sector
The incoming news on the fiscal 1997 budget has been very
favorable. For the first half of fiscal 1997, the unified federal
deficit, adjusted for payment timing shifts and excluding deposit
insurance and spectrum auction proceeds, was $15 billion
(11 percent) lower than for the same period in fiscal 1996.
Receipts were more than 7-1/2 percent higher than last year, while
adjusted outlays were up only 4 percent. Spending growth was
subdued across most categories. Outlays for income security
programs were up less than 3 percent over last year, reflecting, in
part, the strong economy. Spending on Medicare grew slightly less
than 9 percent, on the low side of its recent trend. And, although
outlays for Medicaid rose about 8 percent, the increase was
exaggerated by an unusually low level of spending in the first part
of fiscal 1996.
Individual nonwithheld tax payments surged in April. These
payments, which reflect both final payments on 1996 tax liabilities
7. Real federal purchases in the NIPAs were down 3-1/2 percent atan annual rate in the first quarter of 1997, roughly in line withthe trend over the past four years.

II-25
and estimated tax payments for the first quarter of calendar year
1997, were $30 billion higher than forecast in the last Greenbook
and also substantially higher than OMB and CBO forecasts.
This 1997 "tax surprise" comes on the heels of a similar but
smaller (roughly half the magnitude) surprise last year. The
surprise in the spring of 1996 appears to have arisen because total
taxable income in 1995 was somewhat higher than expected (according
to preliminary estimates), and the distribution of taxable income
was more skewed toward taxpayers in the upper-income brackets. 9
Although no data are available on the source of this year's
surprise, the factors that accounted for last year's tax surge may
have played a role again in 1997.
We do not know whether the past two years of data point to a
permanent structural shift toward higher average tax rates or
whether temporary factors (perhaps related to the capital gains
generated by a soaring stock market) account for the high level of
tax payments. Despite the uncertainty, CBO notified the Congress
that "a downward adjustment in the deficit of $45 billion in 1997
and similar amounts for 1998 through 2002 would be reasonable for
planning the budget resolution." 1 0
The CBO reading of the revenue surprise paved the way for the
Administration and the Congress to reach agreement on the broad
outlines of a plan to balance the budget by fiscal 2002. Under
that plan, taxes would be cut $85 billion, on net, over the five
years, reflecting up to $135 billion of gross tax cuts (including a
child tax credit, reductions in capital gains and estate taxes, and
new tax incentives for education) offset by up to $50 billion of ta
increases. New spending initiatives include $16 billion for child
8. The March Greenbook forecast for tax payments on 1996liabilities assumed that last year's tax surprise would persist.Thus, the tax surprise this year comes on top of a forecasted levelof revenues that, as a share of income, was already high byrecent standards.
9. Part of the increase in reported income of upper-incomebracket taxpayers in 1995 may have reflected the exercising of stocoptions and other forms of deferred compensation; however, the scanavailable information suggests that this factor could account foronly a small part of the tax surprise.
10. Quoted from a letter to the Honorable Pete V. Domenici,Chairman of the Senate Committee on the Budget, from June E.O'Neill, Director of CBO, dated May 2, 1997. The $45 billion figurrefers to the difference between CBO's current expectations ofrevenues in fiscal 1997 and CBO's estimates from early March. Itincludes $25 billion for higher-than-expected nonwithheld taxes inApril and an upward revision of $20 billion to its estimates ofwithheld taxes over fiscal 1997 as a whole.

II-26
FEDERAL GOVERNMENT OUTLAYS AND RECEIPTS(Unified basis; billions of dollars except as noted)
Fiscal year to date totals
MarchDollar Percent
1996 1997 1996 1997 change change
Outlays 136.2 129.4 773.3 806.4 33.1 4.3Deposit insurance (DI) -.8 -1.4 -5.4 -10.1 -4.7 ...Spectrum auction (SA) -.2 .0 -.2 -3.6 -3.4 ...Other 137.1 130.8 778.9 820.1 41.2 ...
Receipts 89.1 108.1 645.6 695.1 49.5 7.7
Deficit (+) 47.1 21.3 127.7 111.3 -16.4 -12.9
Adjusted for payment timing shifts1
and excluding DI and spectrum auction
Outlays 137.1 138.1 786.0 820.1 34.1 4.3National defense 22.3 22.0 130.8 133.2 2.3 1.8Net interest 20.2 20.4 120.3 122.5 2.1 1.8Social security 29.1 30.2 171.1 178.9 7.8 4.6Medicare 14.1 15.2 85.2 92.8 7.5 8.8Medicaid 7.8 8.1 44.0 47.4 3.4 7.8Other health 2.5 2.4 13.1 14.0 .9 7.2Income security 26.0 25.8 121.4 124.7 3.3 2.8Other 15.1 14.0 100.1 106.7 6.6 6.6
Receipts 89.1 108.1 645.6 695.1 49.5 7.7Individual 22.5 36.4 293.6 320.4 26.8 9.1Withheld 41.8 50.0 281.4 302.3 20.9 7.4Nonwithheld 5.8 6.4 51.2 58.1 6.9 13.5Refunds (-) 25.1 20.0 39.0 40.1 1.1 2.7
Social insurance taxes 41.8 44.2 231.0 251.5 20.5 8.9Corporate 15.5 18.7 64.2 67.9 3.7 5.8Other 9.3 8.7 56.8 55.3 -1.6 -2.7
Deficit(+) 48.0 30.0 140.4 125.0 -15.3 -10.9
Note. Components may not sum to totals because of rounding.1. A shift in payment timing occurs when the first of the month falls on a
weekend or holiday. The monthly and fiscal year to date outlays for defense,Medicare, income security, and "other" have been adjusted to account for thisshift.
II-27
health insurance and $15 billion to repeal parts of last year's
welfare law; notably, the deal would make legal immigrants already
in this country eligible for Medicaid and SSI benefits but not food
stamps. The plan specifies $115 billion in Medicare cuts, $15
billion in Medicaid cuts, additional spectrum auctions, and
reductions in discretionary spending, which are still unspecified.
State and Local Governments
Real expenditures on consumption and gross investment by state
and local governments continued to grow slowly in the first quarter.
Spending on consumption of goods and services increased moderately,
while outlays for construction held steady at their high fourth-
quarter level. Despite gyrations in employment growth over the past
two months, average job gains thus far this year are about in line11
with the 1996 pace.
Fiscal 1997 will end on June 30 for all but four states, and
most are finding themselves with sizable surpluses primarily because
tax collections have been higher than anticipated. Stronger-than-
expected economic growth has contributed to the higher revenues:
The Center for the Study of the States reports that revenue growth
is running well ahead of the roughly 4 percent gains projected
during the budget planning process. In addition, many states
apparently experienced a surge in final payments in April.
Developments on the spending side have also contributed to the
strong fiscal picture at the state and local level. One key factor
is the sharp decline in the number of families on welfare, which has
fallen from a high of about 5 million per month, on average, in the
mid-1990s to 4-1/4 million, on average, between October 1996 and
January 1997 (the first four months of the federal fiscal year).
The beneficial effects of declining caseloads on state and local
budgets are especially great in the current circumstance: Federal
welfare assistance is now provided in block grants that are based on
caseloads over fiscal 1992-95, and thus the grants are unaffected by
movements in the welfare rolls. In contrast, had Aid to Families
with Dependent Children remained in place, federal grants would have
fallen in lockstep with the shrinkage in the welfare rolls.
The states collect little information about the activities of
former welfare recipients or the reasons they leave the rolls.
11. Seasonal adjustment problems related to the use of temporaryelection workers during the 1996 primary season boosted employmentgrowth for noneducation workers at local governments in April afterholding it down in March.

II-28
State and Local ConstructionState and Local Sector
Billions of chained (1992) dollars
1985 1986 1987 1988 1989 1990 1991 1992 1993 1994 1995 1996 1997* 1997:Q1 is a staff estimate.
Average Monthly Change in State and Local EmploymentThousands
-- 40
H.11985 1986 1987 1988 1989 1990 1991
SAverage of first four months.
i
NI
.. I'
~ I
~s~s~~s~
f~--. u
5~
1992 1993 1994 1995 1996 1997
AFDC/TANF Caseloads
(Fiscal year)
fjIt 1
Percent change-1 20
1989 1991 1993 1995 1997'
15
10
5+0
5
10
15
* The first 4 months of fiscal 1997, compared tothe same period in fiscal 1996.
Medicaid RecipientsPercent change
(Fiscal year)
~i;
i
~1 I~I r~
'' ~Si
"
s. ..
,H ,~t- - - -
u1989 1991 1993 1995 1997'
* Figure for 1997 is estimated by the Health CareFinancing Administration.
- - ----- - ----- ------ - ----- - ----- ----- ------ - ----- ----
~s
~
iii~i~t~
MImma;<,
~5~" ""~ riii.s~ r~2~
iii i~St~ 5''':
ii'5''' Z~:f~i. .-~ F '.'i f; ;i
5~ e -~- I"" -"" I"'f~ iii
:f~~ ~t~z .......
~ '''' "'~
~~1 r ~I I I~s~
.ssi~
SI~

II-29
However, a recently released study by the Council of Economic
Advisers suggests that more than 40 percent of the decrease in
caseloads through fiscal 1996 can be explained by the strong
economy, and almost a third is related to state welfare reform
efforts, which were undertaken under federal waivers.
Pressures from Medicaid have also lessened recently. Although
the program has continued to see a rise in the number of recipients,
recent increases have been much smaller than those in the early
1990s. The slow growth in recipients, in conjunction with the
moderation in medical price inflation and the revamping of many
state Medicaid programs, has helped keep spending in check.
Labor Costs and Prices
Labor markets have tightened in recent quarters, and labor
costs have accelerated gradually. Held down by flat benefit costs,
hourly compensation, as measured by the Employment Cost Index,
increased only 2.5 percent at an annual rate between December and
March, compared with a rise of 2.8 percent over the preceding three
months. However, quarterly changes in the ECI are quite volatile.
Thus, we customarily focus on the twelve-month changes; these show
that hourly compensation of private industry workers increased
3.0 percent in the year ended in March, up from a 2.7 percent rise
in the twelve months ended in March 1996. Hourly wages and salaries
increased 3.4 percent during the year ended in March, while benefits
rose 2 percent.
Several factors have damped increases in benefits costs12
recently. Employers' health insurance costs, as measured in the
ECI, have remained nearly unchanged over the past two years,
although there have been some reports that they are picking up
recently. Moderating medical care costs have helped hold down
increases in workers compensation. In addition, employers have
benefited from reductions in state unemployment insurance premiums,
which reflect the lagged effects of declining layoff rates on firms'
experience ratings. In contrast, supplemental pay, which includes
nonproduction bonuses, has picked up a bit; it rose 2 percent over
the year ended in March after having fallen 1/2 percent over the
preceding year.
12. As noted, seasonally adjusted benefit costs were flat in thefirst quarter. However, the weakness may have been exaggeratedbecause the seasonal factors are estimated over a period thattypically saw big first-quarter increases in employers' costs forhealth insurance, state unemployment insurance, and other benefits.

II-30
EMPLOYMENT COST INDEX OF HOURLY COMPENSATIONFOR PRIVATE INDUSTRY WORKERS
1996 1997
Mar. June Sept. Dec. Mar.
----- Quarterly percent change-------(Compound annual rate)
Total hourly compensation 1
Wages and salariesBenefit costs
By industryConstructionManufacturingTransportation andpublic utilities
Wholesale tradeRetail tradeFIREServices
By occupationWhite-collarBlue-collarService occupations
Memo:State and local governments
Total hourly compensationExcluding sales workersWages and salaries
Excluding sales workersBenefit costs
By industryConstructionManufacturingTransportation and
public utilitiesWholesale tradeRetail tradeFIREServices
By occupationWhite-collarBlue-collarService occupations
Memo:State and local governments
3.53.63.0
1.93.52.9
3.8-0.3
5.93.4
3.12.92.9
2.5
2.8 2.8 2.52.9 3.2 3.52.1 2.9 0.0
1.6 3.5 2.23.4 2.8 0.62.5 4.1 1.2
3.45.2-2.2
3.1
2.83.83.8
3.1
----- Twelve-month percent change----
2.72.63.23.11.6
3.12.93.43.32.0
2.6 2.72.5 2.83.1 3.0
3.5 3.63.0 2.53.6 3.72.5 2.7
2.4 2.33.0 2.63.0 2.7
3.02.51.9
2.8
1. Seasonally adjusted by the BLS.
6.93.58.52.7
3.41.23.5
2.1
3.02.83.43.12.0

II-31
The twelve-month change in average hourly earnings of
production or nonsupervisory workers fluctuated between 3.7 percent
and 4.1 percent over the past couple of months. Even so, it
remained well above the pace of the preceding year and thus
continued to show a greater acceleration than hourly wages and
salaries of production or nonsupervisory workers in the ECI. Shifts
in the occupational composition of the workforce, which are not
captured in the ECI, may explain part of the relatively greater
acceleration in average hourly earnings. In addition, some of the
discrepancy between the two wage series has arisen because hourly
earnings have been boosted by the rise in overtime hours over the
past several quarters, whereas the ECI is designed to measure only
straight-time earnings. (Stock options and deferred compensation
are not included in either the ECI or average hourly earnings.)
Hourly compensation in the nonfarm business sector--reported in
the Productivity and Cost release--rose 4.7 percent in the first
quarter. Smoothing through the considerable quarterly volatility,
hourly compensation increased 3.9 percent on a year-over-year basis,
essentially the same pace as during the previous year. However,
this measure of hourly compensation has accelerated markedly since
the second half of 1993, when the four-quarter rate of increase
bottomed out at 1.8 percent--mirroring the pattern of average hourly
earnings. In comparison, the acceleration in the ECI started later
and has been much smaller than in nonfarm hourly compensation.
The consumer price index rose only 0.1 percent in April,
bringing the increase over the past twelve months to just
2.5 percent. This measure of the inflation trend reached
3.3 percent late last year but has backed off virtually month by
month as food and energy prices reversed their earlier run-ups.
The drop in crude oil prices has been quite apparent in retail
prices in the past two months. The CPI for energy fell 1.5 percent
in April after a 1.7 percent decline in March; prices of motor fuel,
home heating oil, and natural gas decreased sharply in both months.
Consumer food prices have declined slightly over the past two
months, though they remain 2.8 percent higher than a year earlier.
At earlier stages of processing, the PPI for crude foodstuffs and
feedstuffs rose in March and April following seven consecutive
months of declines; the recent upturn reflected increases in
livestock and soybean prices.

II-32
Components of ECI Benefits Costs(Private industry workers; twelve-month change)
Insurance Costs Supplemental PayPercent Percent
25 .30
,r \
'0 102020
, 5 I Nonproduction1y°' X \\ 15 bonuses ,
I^ 10
r
1982 1984 1986 1988 1990 1992 1994 1996 1982 1984 19S6 1988 1990 1992 1994 1996
er m en ti ne State nem ent nePercent Percent
1982 1984 1986 1988 1990 1992 1994 1996 1982 1984 1986 1988 1990 1992 1994 19961oe4 np 2010
5 0
8 20
5, ,. 5
5 10
1982 194 1986 1988 1990 1992 1994 1996 1982 1984 1986 1988 1990 1992 1994 1996
Note. Unpublished ECI benefits detail. -SNote. Unpublished ECI benefits detail.

II-33
Earnings of Production or Nonsupervisory Workers(Twelve-month change)
Percent
ECI wages and salaries
-J
Average hourly earnings
LJ 1.819971990 1991 1992 1993 1994 1995 1996
LABOR COSTS(Percent change from preceding period at compound annual rate;
based on seasonally adjusted data)
1996 1997 1996:01S--- to
19951 19961 Q2 Q3 Q4 Q1 1997:Ql
Compensation per hourNonfarm business 3.7 3.6 3.9 3.3 3.6 4.7 3.9Manufacturing 4.2 3.4 5.8 4.6 2.7 4.5 4.4
Nonfinancialcorporations 2 3.5 3.5 3.9 4.1 3.2 ND ND
Unit labor costsNonfarm business 3.7 2.6 3.3 3.3 2.5 2.7 2.9Manufacturing .5 -.7 3.6 -1.2 -1.5 1.4 .5
Nonfinancialcorporations2 1.9 1.3 2.3 .1 1.5 ND ND
1. Changes are fromshown.
fourth quarter of preceding year to fourth quarter of year
2. The nonfinancial corporate sector includes all corporations doing businessin the United States with the exception of banks, stock and commodity brokers,finance and insurance companies; the sector accounts for about two-thirds ofbusiness employment.

II-34
CPI AND PPI INFLATION RATES(Percent change)
From twelvemonths earlier 1996 1997 1996
Apr. Apr.1996 1997 Q4 Q1 Mar. Apr.
-Annual rate- -Monthly rate-
All items (100.0)1
Food (15.9)Energy (7.0)CPI less food and energy (77.0)
Commodities (23.4)
New vehicles (5.0)Used cars (1.3)Apparel (4.8)House furnishings (3.3)Other Commodities (9.0)
2.8 4.7.0 10.2
2.7 2.7
1.1
1.2-2.00.8-0.72.1
1.4
0.9-1.82.10.12.2
0.3 .07.3 -1.72.2 0.2
1.0
-0.51.62.2
-0.71.7
0.1
0.11.2
-0.4-0.3
0.2
Services (53.7) 3.1 2.7
Shelter (28.2)Medical care (6.1)Auto finance chargesOther Services (18.8)
(0.6)
Finished goods (100.0)2
Finished consumer foods (23.6)Finished energy (14.7)Finished goods less food
and energy (61.6)
Consumer goods (38.0)Capital equipment (23.6)
Intermediate materials (100.0)3
Intermediate materialsless food and energy (81.2)
Crude materials (100.0)4
Crude food materials (38.9)Crude energy (41.1)Crude materials less
food and energy (20.0)
3.33.9
-10.13.1
3.1 2.73.0 2.93.0 -3.03.8 3.9
1.9 2.46.5 -1.3
1.6 0.6
1.8 1.01.4 0.1
0.6 -0.1
-1.0
10.4 -4.8
17.521.3
-13.1
-2.3-9.9-1.0
-28.176.4
1.0
4.917.6
0.4
0.6.0
3.12.6-1.8
2.1
-0.7
-4.21.9
0.2
0.30.5
-0.1
0.9-3.4
0.4
0.30.3
-0.6
-0.4-2.6
-0.1
.0-0.4
1.1 -0.6 -0.3
.0 .0
5.5 -6.9 -0.9
-15.529.011.6
2.1-19.2
0.6
3.3-5.2-2.3
1. Relative importance weight2. Relative importance weight3. Relative importance weight4. Relative importance weight
for CPI, December 1996.for PPI, December 1996.for intermediate materials, December 1996.for crude materials, December 1996.
-0.2-1.5
0.3
0.3
.0-1.61.1-0.2
0.5

II-35
The index for consumer prices excluding food and energy rose
1/4 percent per month in March and April. On a twelve-month basis,
core inflation was 2.7 percent in April, the same as a year earlier
and up from the 2.5 percent figures of the prior couple of months.
The increase last month included sizable rises in tobacco and
apparel prices that likely will prove to be outliers.
The BLS recently introduced an experimental CPI using geometric
means. This alternative index--which differs from the headline
index by its method of weighting observations at the most detailed
level--reduces the within-strata substitution bias that plagues the
official CPI. The BLS intends to introduce geometric weighting in
some of the detailed strata in the official index in January13
1999. Based on comparisons of the relative performance of the
official and alternative indexes over the past several years, the
BLS estimates that applying the geometric mean formula within all
strata would lower the growth rate of the CPI about 1/4 percentage
point per year; thus, this figure can be taken as an upper-bound
estimate of the impact of the planned change to the CPI.
Other broad measures of prices present a mixed bag of small
accelerations and decelerations, and measures of inflation
expectations are lower than, or unchanged from, a year ago. The PPI
for intermediate materials less food and energy held steady over the
past two months and has been essentially flat over the past year.
The PPI for core crude materials dropped sharply last month;
smoothing through the considerable volatility, it has fallen
1 percent from its year-earlier level. On balance, the Journal of
Commerce index of industrial commodity prices and the KR-CRB index
of spot prices have been largely unchanged this year. However,
metals prices have continued to tick up in recent weeks and have now
mostly recovered from their steep decline in 1996.
13. The BLS is examining which categories it will switch over to
geometric means and plans to make an announcement of the results bythe end of the year. In addition, at the beginning of 1998, the BLSwill introduce new expenditure weights, which may reduce CPIinflation roughly 0.1 percentage point per year.

II-36
BROAD MEASURES OF INFLATION(Four-quarter percent change)
1994 1995 1996 1997Q1 Q1 Q1 Q1
Product prices
GDP chain price index 2.3 2.4 2.2 2.2
GDP deflator 2.2 2.5 2.1 1.8
Nonfarm business chain price index1 2.1 2.4 1.6 2.2
Expenditure prices
Gross domestic purchases chain price index 2.1 2.5 2.2 2.2Less food and energy 2.3 2.5 2.2 1.9
PCE chain price index 2.2 2.5 2.0 2.5Less food and energy 2.5 2.6 2.0 2.1
PCE deflator 2.2 2.6 2.0 2.1Less food and energy 2.5 2.6 1.9 1.8
CPI 2.5 2.9 2.8 2.9Less food and energy 2.9 3.0 2.9 2.5
Median CPI 3.0 2.7 3.3 2.7
1. Excluding housing
SURVEYS OF (CPI) INFLATION EXPECTATIONS(Percent)
University of Michigan Conference ProfessionalActual (1-year) (1-year) Board forecasters
inflationi Mean 2 Median 3 (1-year) (10-year)4
1995:Q1 2.8 4.1 3.1 4.2 3.3Q2 3.1 4.1 3.1 4.2 3.4Q3 2.6 3.9 2.9 4.0 3.2Q4 2.7 3.6 2.8 3.9 3.0
1996:Q1 2.7 3.9 2.9 4.1 3.0Q2 2.8 4.5 3.0 4.3 3.0Q3 2.9 4.2 3.0 4.3 3.0Q4 3.2 4.0 3.0 4.2 3.0
1997:Jan. 3.0 4.1 3.0 4.3Feb. 3.0 3.8 3.0 4.3Mar. 2.8 3.5 2.8 4.1 3.0
Apr. 2.5 3.7 3.0 4.2
1. CPI; percent change from the same period in the preceding year.2. Average increase for responses to the question: By about what percent do you
expect prices (CPI) to go up, on the average, during the next 12 months?3. Median increase for responses to the question above.4. Compiled by the Federal Reserve Bank of Philadelphia.

II-37
Commodity Price Measures
Total
y 'IV " W\,/ I I C
1 , f\r\ l May 13
Metals'
./tJ
Metals
Mar. Apr. May1997
KR-CRB Spot IndustrialsRatio scale, index, 1967=100
Mar. Apr. May1997
200
KR-CRB FuturesRatio scale, index, 1967=100
290 KR-CRB Futures
May 13 270
1985 1986 1987 1988 1989 1990 1991 1992 1993 1994 1995 1996 1997
Mar. Apr. May1997
Note. Weekly data, Tuesdays. Vertical lines on small panels indicate week of last Greenbook. The Journal of Commerce index is based almostentirely on industrial commodities, with a small weight given to energy commodities, and the KR-CRB spot price index consists entirely of industrialcommodities, excluding energy. The KR-CRB futures index gives about a 60 percent weight to food commodities and splits the remaining weight roughlyequally among energy commodities, industrial commodities, and precious metals. Copyright for Joumal of Commerce data is held by CIBCR, 1994.

II-38
SPOT PRICES OF SELECTED COMMODITIES
--------------- Percent change---------------
Memo:Current Dec. 31 Mar. 182 Yearprice to to earlier($) 1995 1996 Mar. 182 May 13 to date
MetalsCopper (lb.) 1.180 -3.5 -18.3 9.3 .9 -12.6Steel scrap (ton) 138.500 -6.6 -13.7 17.2 1.5 -2.8Aluminum, London (lb.) .741 -12.9 -9.8 6.5 1.5 .8
Precious metalsGold (oz.) 348.900 1.7 -5.1 -6.2 .8 -10.7Silver (oz.) 4.860 7.2 -8.8 7.9 -5.6 -9.6
Forest productsLumber (m. bdft.) 386.000 -14.4 66.0 -9.4 2.7 5.2Plywood (m. sqft.) 310.000 -6.1 1.6 6.3 -7.5 -3.7
PetroleumCrude oil (barrel) 19.450 16.8 25.9 -19.4 2.0 .2Gasoline (gal.) .634 7.7 24.3 -6.7 .7 -7.2Fuel oil (gal.) .565 22.6 16.1 -19.9 .2 -5.2
LivestockSteers (cwt.) 69.000 -5.7 .0 3.0 1.5 14.0Hogs (cwt.) 61.000 27.5 34.1 -12.7 27.1 2.5Broilers (lb.) .567 10.7 12.4 -13.2 4.5 -10.6
U.S. farm cropsCorn (bu.) 2.770 57.4 -29.5 12.7 -3.7 -44.0Wheat (bu.) 4.533 24.0 -16.6 -.1 -.2 -37.4Soybeans (bu.) 8.655 29.0 -7.1 18.1 6.5 7.7Cotton (lb.) .693 -8.1 -10.9 -. 1 -2.0 -16.4
Other foodstuffsCoffee (lb.) 2.825 -39.1 43.2 50.7 37.8 106.2
Memo:JOC Industrials 106.300 -1.7 -3.7 1.1 -2.0 -4.0JOC Metals 100.500 -1.8 -7.7 7.3 .2 -3.0KR-CRB Futures 251.300 3.3 -2.6 2.6 2.8 -3.4KR-CRB Spot 338.410 -3.5 1.0 1.5 -.4 -.4
1. Changes, if not specified, are from the last week of the preceding year tothe last week of the period indicated.
2. Week of the March Greenbook.

DOMESTIC FINANCIALDEVELOPMENTS
__

III-T-1
Selected Financial Market Quotations'(Percent except as noted)
1996 1997 Change to May 14, from:
Instrument Feb. July FOMC,* Feb. July FOMC,*
low high Mar. 25 May 14 low high Mar. 25
Short-term rates
Federal funds2 5.15 5.39 5.29 5.49 .34 .10 .20
Treasury bills'3-month 4.76 5.21 5.25 5.05 .29 -.16 -.206-month 4.67 5.40 5.35 5.30 .63 -.10 -.051-year 4.55 5.64 5.53 5.53 .98 -.11 .00
Commercial paper1-month 5.27 5.50 5.61 5.61 .34 .11 .003-month 5.12 5.59 5.66 5.69 .57 .10 .03
Large negotiable CDs'I-month 5.21 5.44 5.56 5.59 .38 .15 .033-month 5.12 5.59 5.63 5.70 .58 .11 .076-month 4.99 5.83 5.77 5.87 .88 .04 .10
Eurodollar deposits'1-month 5.13 5.38 5.50 5.56 .43 .18 .063-month 5.13 5.56 5.56 5.69 .56 .13 .13
Bank prime rate 8.25 8.25 8.25 8.50 .25 .25 .25
Intermediate- and Long-term Rates
U.S. Treasury (constant maturity)3-year 4.98 6.62 6.45 6.41 1.43 -.21 -.0410-year 5.58 7.06 6.72 6.68 1.10 -.38 -.0430-year 6.02 7.19 6.94 6.90 .88 -.29 -.04
U.S. Treasury indexed bond n.a. n.a. 3.47 3.57 n.a. n.a. .10
Municipal revenue (Bond Buyer)5 5.67 6.24 6.06 5.98 .31 -.26 -.08
Corporate-A utility, recently offered 7.18 8.23 8.11 7.98 .80 -.25 -.13
High-yield corporate6 9.57 10.36 9.66 9.60 .03 -.76 -.06
Home mortgages7
FHLMC 30-yr fixed rate 6.94 8.42 7.94 7.91 .97 -.51 -.03FHLMC 1-yr adjustable rate 5.19 6.01 5.71 5.82 .63 -. 19 .11
Record high 1996 1997 Percentage change to May 14, from:
July FOMC,* Record July FOMC,*
Stock exchange index Level Date low Mar. 25 May 14 high low Mar. 25
Dow-Jones Industrial 7292.75 5/12/97 5346.55 6905.25 7286.16 -.09 36.28 5.52
S&P 500 Composite 837.66 5/12/97 626.65 790.89 836.04 -.19 33.41 5.71
NASDAQ (OTC) 1388.06 1/22/97 1042.37 1242.64 1335.55 -3.78 28.13 7.48
Russell 2000 370.65 1/22/97 307.78 349.48 364.48 -.68 19.61 4.29
Wilshire 7885.88 5/12/97 6099.34 7501.44 7874.56 -.14 29.11 4.971. One-day quotes except as noted.2. Average for two-week reserve maintenance period closest to date shown. Last observation is the average to date for maintenance period
ending May 21,1997.3. Secondary market.4. Bid rates for Eurodollar deposits at 11 a.m. London time.5. Most recent observation based on one-day Thursday quote and futures market index changes.6. Merrill Lynch Master II high-yield bond index composite.7. Quotes for week ending Friday previous to date shown.* Figures cited are as of the close on March 24, 1997.

DOMESTIC FINANCIAL DEVELOPMENTS
The FOMC's action at the March meeting to raise the intended
federal funds rate from 5-1/4 percent to 5-1/2 percent was widely
anticipated, and yields on Treasury coupon issues shifted up only
1 to 5 basis points that day. Yields rose further through mid-April
on data releases suggesting that economic activity was much stronger
than expected. However, those increases were more than rolled back
after the employment cost index and other reports suggested subdued
inflation pressure and slowing growth, and after the release of
favorable news on the federal budget deficit. In addition, Chairman
Greenspan's speech of May 8 was interpreted as reducing the
likelihood of further tightening. On net, yields on Treasury notes
and bonds are down slightly since the March FOMC meeting. Market
odds on a 25-basis-point tightening at the May meeting, as read from
federal funds futures contracts, are less than 50-50 (chart).
Yields on private money market instruments have risen somewhat
since late March. Three-month Treasury bill rates, however, are
down 20 basis points because of a sharp cutback in supply, which
resulted from the Treasury's continued reliance on coupon securities
in the face of surprisingly large tax receipts.
Major stock price indexes gyrated throughout the intermeeting
period (chart) but were up 4 percent to 7-1/2 percent, on balance,
boosted by unexpectedly strong corporate earnings in the first
quarter. The Dow and the S&P 500 hit new highs on May 12, bringing
their total increase since year-end to about 13 percent. The NASDAQ
composite, while up strongly in recent weeks, has not fully retraced
the decline from its peak in January. Price-earnings multiples
remain elevated, suggesting that market participants expect
substantial growth in earnings from the already high levels.
Borrowing by the nonfinancial business sector so far this
quarter appears to have held at its strong first-quarter pace.
Business lending at banks has remained robust, and merger deals have
continued to generate considerable issuance in the markets. In the
household sector, commercial bank data suggest a continuation of the
moderate first-quarter growth of home mortgage debt but possibly a
further deceleration in consumer credit. State and local government
debt remains on a slow growth path, while borrowing by the federal
government has plummeted because of the elevated tax receipts. With
III-1

III-2
Selected Stock Market Indexes and Short-Term Futures Rates
Selected Stock Indexes Index, Dec. 29, 1995=1
NASDAQ
- .-r .
S&P 500
Jan Feb Mar Apr May Jun Jul Aug Sep Oct Nov Dec Jan Feb Mar Apr May1996 1997
Federal Funds Futures
05/14/97........ 03/25/97
Eurodollar Futures Percent
05/14/97.......... 03/25/97
6/97 9/97 12/97 3/98 6/98Contract Months
Percent- 6.5
6.0
May June July AugContract Months
~*'
~'''''

III-3
bank credit growing robustly and households building up liquid
assets to pay taxes, growth in the broad monetary aggregates
remained strong in April.
Business finance
After a solid first quarter, gross issuance of nonfinancial
corporate bonds slowed just a bit in April (table) and then jumped
in the first half of May. Investment-grade offerings were strong
throughout the intermeeting period, supported by large merger-
related issues. In contrast, speculative-grade issuance turned down
in April, amid weak inflows to junk bond mutual funds; investors
apparently became more cautious regarding the prospects for low-
rated companies--mirroring the slide in the stock market. This
caution seems to have abated in recent weeks, as speculative-grade
issuance and inflows to junk bond funds have both recovered. Yield
spreads of speculative-grade bonds over Treasuries have widened a
shade, on net, since the March FOMC meeting but remain very narrow
by historical standards.
Borrowing by nonfinancial firms from banks remained robust in
April, with domestic banks providing most of the loans. Respondents
to the May Senior Loan Officer Opinion Survey indicated very little
change over the past three months in credit standards for C&I loans
but did note some easing of terms, especially spreads of loan rates
over market rates for large and medium-sized companies. About one-
fifth of respondents, on net, expected charge-offs of business loans
to increase in the remainder of 1997 from the extraordinarily low
rates of the past few quarters. Standards for commercial real
estate loans were reportedly unchanged, on net, but the vast
majority of respondent banks said that their competitors had eased
standards. Significant fractions of banks reported easing spreads
on such loans over the past year, but other terms were little
changed.
Nonfinancial commercial paper outstanding fell sharply in April
after rising moderately in the first quarter (chart). The most
likely explanation for the decline is that strong profits reduced
the need to issue paper to make first-quarter tax payments.
Commercial paper issuance is poised to pick up in coming weeks as
several companies tap the market to finance large merger deals.
Equity issuance by nonfinancial firms was sluggish in March and
April in large part because of the extremely slow pace of initial
public offerings (IPOs). The IPO market has been tepid this year,

III-4
GROSS ISSUANCE OF SECURITIES BY U.S. CORPORATIONS(Billions of dollars; monthly rates, not seasonally adjusted)
Type of security 1995 1996
1996
Q4
1997
Q1 Feb. Mar. Apr.
All U.S. corporationsStocks1
Bonds
Nonfinancial corporationsStocks1
Initial public offeringsSeasoned offerings
Bonds
47.76.1
41.6
58.410.248.2
6.72.93.8
59.512.147.4
6.42.83.6
56.79.9
46.8
4.91.13.9
52.5 59.28.4 7.9
44.1 51.3
10.8 12.5 13.6 13.2 14.0 13.1 12.6
By rating, bonds sold inInvestment gradeSpeculative gradePublicRule 144A
Financial corporationsStocksiBonds
U.S. 2
6.53.02.01.1
1.730.8
6.34.82.32.5
7.64.91.43.5
3.5 5.8 4.935.8 33.8 33.6
Note. Components may not sum to totals because of rounding. Thesedata include speculative-grade bonds issued privately under Rule 144A.All other private placements are excluded. Total reflects gross proceedsrather than par value of original discount bonds.
1. Excludes equity issues associated with equity-for-equity swaps that haveoccurred in restructurings.
2. Bonds categorized according to Moody's bond ratings, or to Standard & Poor'sif unrated by Moody's. Excludes mortgage-backed and asset-backed bonds.
Nonfinancial CorporationsNet Commercial Paper Issuance
(Change in outstandings over period shown)Billions of dollars, monthly rate
Announced Share Repurchase ProgramsBillions of dollars
Annual
1994 1995 1996 1997 1985 1987 1989 1991 1993 1995 1997"
*Data through April, at an annual rate.
39.85.6
34.2
2.41.01.4
2.630.2
3.938.2
3.221.5

III-5
with a sizable share of IPOs being offered at prices below their
filing ranges and first-day returns on IPO shares dropping to their
lowest level since 1994. Overall, the equity issuance that has
occurred has been overwhelmed by retirements through mergers and
share repurchases. Announcements of new repurchase programs have
continued to rise this year, reflecting the accumulation of cash at
large companies (chart).
Recent reports on corporate profits have been extremely
favorable. After-tax earnings in the first quarter for S&P 500
firms were about 14 percent above earnings posted four quarters
earlier (chart). This robust growth, which was widespread across
industries, surpassed expectations of securities analysts by a large
margin. Equity price indexes fell sharply from the March FOMC
meeting through mid-April, partly in response to higher interest
rates and the anticipation of future FOMC tightenings. Prices
recovered on the favorable earnings news and surged in early May
amid declining bond yields and lessening fears of further Fed rate
hikes. These broad market swings were accompanied by substantial
intraday price volatility, as market participants reacted strongly
to economic news or statements by Fed officials seen as providing
hints about the near-term course of monetary policy. Despite the
favorable earnings, price-to-earnings ratios for both the S&P 500
and NASDAQ indexes are high by historical standards (chart).
The merger wave among nonfinancial companies that began in 1994
has shown no signs of abating. The pace of megamergers during the
first four months of this year, expressed in dollars at an annual
rate, was fairly close to the record volume in 1996 (chart), and the
backlog of announced, but uncompleted, deals remained huge. Unlike
the wave of hostile takeovers of the 1980s, the current one
continues to be dominated by friendly intra-industry mergers that
look for potential economies of scale or are driven by regulatory
and technological changes. Also in contrast to the 1980s, stock
swaps have dominated cash-financed purchases. Structuring deals as
stock swaps rather than cash purchases allows shareholders of the
acquired firm to avoid an immediate tax liability on any capital

III-6
Stock Market and Corporate Profits
Corporate ProfitsPercent change from 4 quarters earlier
-- - 30Quarterly
; ,. -Q1I tI
S NIPA after-tax book profits*
I I I
S Operating earningsSfor S&P 500**
I 1 i1991 1993 1995 1997
* 1996:Q4 value adjusted to exclude effect of chargeto recapitalize SAIF.** Goldman Sachs estimate.
30
1020
20 10
Price-Earnings RatioRatio
1983 1990 1997Note. S&P 500 ratio based on consensus estimate
of earnings over the coming 12 months. Nasdaq ratiobased on earnings over the previous 12 months.
Volume of Megamergers(Completed transactions where target firm is valued at $1 billion or more)
Billions of 1995 dollars'
Value of stock swaps
Value of equity retired
1981 1982 1983 1984 1985 1986 1987 1988 1989 1990 1991 1992 1993 1994 1995 1996 1997*** Deflated to 1995 dollars using GDP deflator."*Data through April, at an annual rate.

III-7
gains and often enables the combined firm to use a more advantageous
method of financial accounting.1
Corporate credit quality has remained generally good.
According to Moody's, the value of nonfinancial company debt
upgraded in the first quarter about equaled that downgraded, and
among companies under review for a rating change at the end of the
first quarter, anticipated upgrades slightly exceeded anticipated
downgrades. In addition, the default rate on speculative-grade debt
during the first four months of the year dropped below the already
very low rate in 1996. The only negative news was the increase in
business failures in the first quarter, which owed largely to start-
up difficulties for firms with new licenses in wireless
telecommunications.
Household finance
Growth in total consumer credit outstanding picked up a bit in
the first quarter to a 6-1/2 percent annual rate (table). Growth of
revolving and "other" credit moved slightly higher, while the level
of automobile credit was about unchanged. Consumer credit
decelerated, however, as the quarter proceeded. That trend,
together with the sluggish pace of bank consumer loans in April, is
consistent with the view that credit availability has tightened a
little and--more important--that consumer spending has moderated.
In the May Senior Loan Officer Survey, about half the banks, on net,
reported tightening standards on new credit card accounts over the
past three months, with a smaller fraction reining in other consumer
loans. The most common tightening action on loan terms was to lower
credit limits. In addition, a fifth of the respondents, on net,
reported a decline in demand for consumer loans.
Household borrowing in mortgage markets increased slightly in
the first quarter, and data from large commercial banks suggest that
growth in home equity and other residential real estate loans
remained solid this spring. Mortgage applications for home purchases
surged in the week following the System's tightening. In similar
episodes in the past, borrowers have rushed to lock in mortgage
rates in anticipation of further increases in interest rates, but
the active encouragement of lenders and the faster turnaround now
1. When cash is used in an acquisition, the combined firm'ssubsequent income statements must include charges to write off"goodwill" (the excess of the purchase price over the value of thenet assets of the acquired firm). By contrast, if the deal is astock swap and meets other technical requirements, goodwill is notrecognized and subsequent charges against income are avoided.

III-8
Consumer Credit
1996 1997
1995 1996 Q3 Q4 Q1 P Jan Feb Mar p
Credit outstanding, end of period
Growth rates(percent, SAAR)
14.2(14.2)
10.622.0
9.2
8.1
( 8.3)
6.913.0
3.4
7.8 5.3(8.1) (5.6)
6.4 10.3
(10.3)
0.212.7
4.5
3.121.6
3.0
Levels(billions of dollars, SA)
Total
Auto
RevolvingOther
Interest rates 1
(annual percentage rate)
Commercial banks
New cars (48 mo.)2
Personal (24 mo.)2
Credit cards3
Auto finance companies 4
New cars
Used cars
1103.3 1193.2 1177.6 1193.2 1212.2 1203.5 1210.2 1212.2
350.8413.9338.6
9.613.916.0
11.214.5
375.2467.9350.2
9.013.515.6
9.8
13.5
373.4454.0
350.2
9.113.4
15.7
10.3
13.9
375.2
467.9
350.2
9.013.615.6
9.813.6
375.3
482.8354.1
8.913.5
15.9
7.6
13.1
376.1476.3351.0
n.a.n.a.
n.a.
7.212.9
376.4481.3352.5
375.3482.8
354.1
n.a.n.a.n.a.
8.113.2
Total
(Previous)
Auto
RevolvingOther
6.7(6.7)
0.712.7
5.1
1. Annual data are averages of quarterly data for commercial banks and of monthly data for finance companies.2. Average of most common rate charged for specified type and maturity during the first week of the middle month of each quarter.3. Stated APR averaged across all credit card accounts at all reporting banks during the period.4. Average rate for all loans of each type, regardless of maturity, made during the period.p Preliminary. n.a. Not available.

III-9
MBA Mortgage Purchase Application Index(Seasonally adjusted by Board staff)
Weekly........ MBA Purchase Application Index- 4-week moving average
1990 1991 1992 1993 1994 1995
March 16, 1990 = 100
_. May 9
III
1996 1997
Adjustable Rate Mortgage Rate Less 1-Year Treasury Rate(Not seasonally adjusted)
Basis points
Weekly
1990 1991 1992 1993 1994 1995 1996 1997
Auto Loan Delinquency Rates(Seasonally adjusted, 30 days or more past due)
Percent
225
150
75
0
-75
4
3
2
1970 1972 1974 1976 1978 1980 1982 1984 1986 1988 1990 1992 1994 1996
Source. Federal Reserve, American Bankers Association.
. .. . . .~~ ~ ~ ~ ~ - - - - - - - -. . . . .... . . . . . . . . . . . . . . . . . . . . . . . . . . . . I I I I ,& F . ..1 . . . . . . . . . . .I . .. . . . . . . . .I . . . . . . . . . . 1 - . . . . . . . ..l I . . . . . I . . . . I l. . .

III-10
available on applications have amplified this effect. The volume of
applications has dropped back somewhat since then but remains
relatively high (chart).
Like other long-term interest rates, the average commitment
rate on thirty-year, fixed-rate mortgages rose through mid-April but
subsequently has drifted down to a level slightly below that at the
March FOMC meeting. Rates on adjustable-rate mortgages (ARMs) are
up, on balance, over the intermeeting period, but relative to their
indexes, ARMs are still being heavily discounted by lenders. The
average initial contract rate on mortgages tied to the Treasury
one-year constant maturity yield is now below that index (chart).
The few recent indicators of household credit quality suggest
some further deterioration. The average delinquency rate on auto
loans at the three captive auto finance companies rose to a new high
of 3.59 percent in the first quarter (chart). Moody's reported that
losses on securitized credit card loans rose sharply in March from
the year-earlier period to an annual rate of 6.72 percent, the
highest in the seven-year history of this series (not shown). About
one-third of banks reporting on the Senior Loan Officer Survey
expected charge-off rates on consumer loans to increase over the
remainder of this year because of an increased willingness of
households to declare bankruptcy, worsening household financial
conditions, and previous aggressive solicitation of borrowers by the
banks themselves.
Federal government finance
The seasonal inflow of federal tax receipts has surpassed all
expectations and should produce a budget surplus of $85 billion in
the second quarter (table). The staff anticipates that this
surplus, together with $12 billion to be raised from coupon issues,
will be used to pay down $97 billion in bills, on net, this quarter.
Weekly bill auction sizes have been cut substantially since the last
FOMC meeting, and considerably more than is typical for the second
quarter, with the weekly competitive supply falling about
$6 billion.
For most of this decade the average maturity of the Treasury's
debt fell, reaching a low point in 1996 of a little over five years.
However, the recent cut in bill auction sizes has reinforced the
increase in the average maturity of the debt that began last year.
Auctions of ten-year notes were added last July and October, an
auction for the thirty-year bond was added in November, and four

III-11
(BillionsTREASURY FINANCING
of dollars; total for period)
1996 1997
Item Q4 Q1 Q2 Apr.e Mayp June p
Total surplus/deficit (-) -59.3 -52.0 85.3 88.4 -45.8 42.8
Means of financing deficitNet cash borrowing and
repayments (-) 48.7 48.0 -86.0 -40.3 -23.8 -21.9Nonmarketable 7.4 3.4 -0.4 -0.3 -0.1 0.0Marketable 41.3 44.6 -85.5 -39.9 -23.7 -21.9
Bills 16.2 8.1 -97.2 -44.2 -26.6 -26.4Coupons 25.1 36.5 11.6 4.2 2.9 4.5
Decrease in cash balance 11.4 -0.7 -6.9 -55.9 71.8 -22.8
Other 1 -0.8 4.6 7.6 7.8 -2.2 2.0
Memo:Cash balance, end of period 32.8 33.5 40.4 89.4 17.6 40.4
Note. Data reported on a payment basis. Details may not sum to totalsbecause of rounding.
1. Accrued items, checks issued less checks paid, and othere Estimate.p Projection.
transactions.
NET CASH BORROWING OF GOVERNMENT-SPONSORED ENTERPRISES(Billions of dollars)
1996 1997
Agency Q4 Q1 Jan. Feb. Mar.
FHLBs 8.5 3.1 -6.3 -1.6 11.0FHLMC 10.0 -3.4 6.2 -1.6 -7.9FNMA 12.1 4.9 2.0 -1.3 4.1Farm Credit Banks -0.1 0.8 7.6 -7.5 0.8SLMA -0.2 -1.7 4.0 -0.1 -5.6
Note. Excludes mortgage pass-through securities issuedby FNMA and FHLMC.

III-12
auctions were set for the indexed-linked ten-year note. The
Treasury's actions reflected concern that issuance at the long end
had become bunched since 1993, leading to cash management
difficulties. Given the budget projections then available, more
auctions of long-term debt with slightly smaller auction sizes were
not expected to affect the average maturity of the debt in a
significant way. However, because auction sizes at the long end can
only be cut back so much without undermining the liquidity of
specific issues, the debt managers have been forced by this year's
unexpectedly small deficit to pare both bills and intermediate-
maturity notes.
In April, the Treasury held its second auction of indexed-
linked ten-year notes, reopening the existing issue. This auction
was less successful than the first, held in January. The ratio of
bids to the amount offered was about half that observed at the prior
auction, although, at 2-1/4, it was similar to the ratios observed
at conventional ten-year note auctions. The market for these
securities is still immature. Trading volumes remain very low, and
a market for stripped securities has yet to emerge, but the Chicago
Board of Trade plans to begin trading in futures and options
contracts based on inflation-indexed securities in July.
In other news, the Treasury announced at the end of April some
changes to its savings bond program to make these instruments more
attractive to savers. Interest rates on Series EE bonds issued
after May 1, 1997, will be set at 90 percent of the constant
maturity yields on five-year Treasury notes, a noticeable increase
from the rates set under the old procedures. The new bonds will
accrue interest monthly instead of semiannually, making it easier to
cash them in without losing interest. However, to encourage longer-
term holdings, there will be a three-month interest penalty for
redemption within five years of issuance.
After a robust performance in late 1996, bond issuance by
federal agencies slowed substantially in the first quarter of this
year as interest rates rose (table). Nonetheless, the trend toward
global issues continued apace, as Fannie Mae and Freddie Mac issued
bonds totaling $1.9 billion that were offered simultaneously in the
United States, Europe, and Asia and in some cases were denominated
in foreign currencies.
Perhaps looking ahead to eventual privatization, some agencies
have sought to diversify their activities and in the process have

III-13
run into opposition. Fannie Mae, Freddie Mac, and the Federal HomeLoan Bank System have all raised congressional eyebrows by,respectively, flirting with the life insurance market, investing inPhilip Morris' debt, and moving toward direct lending to
individuals. House Banking Committee Chairman Leach has called fora review of the investment and expansion plans of these government-
sponsored enterprises, citing the possible use of their special
status to gain an unfair competitive advantage.
The Student Loan Marketing Association is well on its way to
privatization. Some directors think that Sallie Mae ought to
originate student loans as well as buy them in the secondary market
and repackage them. Once a proxy fight over this strategy is
resolved, Sallie Mae could become a holding company with one of its
subsidiaries containing all of the government-related financial
assets. This subsidiary would wind down gradually over the next ten
years.
State and local government finance
Gross issuance of long-term municipal debt rose about
20 percent in April from the subdued first-quarter pace (table),
owing to stronger new capital issuance reportedly in anticipation of
higher long-term interest rates. However, refunding issuance fell
in April in response to the rise in long-term interest rates that
had already occurred. Net issuance remained positive, reflecting
the reduced pace of retirements of pre-refunded bonds.
The credit quality of municipal debt improved further in the
first quarter, with Standard and Poor's upgrading nearly twice as
much debt as it downgraded (chart). The net upgrades reflected more
solid fiscal positions that have accompanied the expanding economy
and better financial management by state and local governments. As
in 1996, the improvement in credit quality would have been greater
if not for the net downgrades at municipal utilities, which continue
to be under pressure from deregulation.
The record $2.9 billion offering of taxable pension bonds,
announced by New Jersey in March and reported in the last Greenbook,
has been delayed. At issue is the use of bond proceeds to cover
some unfunded pension liabilities, which would enable the state to
reduce current contributions to the pension plan. Governor Whitman
wants to use this tool to free up some revenues for other programs
while maintaining a balanced budget. The opposition is portraying
it as a financial gimmick, and at least one rating agency is

III-14
GROSS OFFERINGS OF MUNICIPAL SECURITIES(Billions of dollars; monthly rates, not seasonally adjusted)
1996 1997
1994 1995 1996 Q4 Q1 Feb. Mar. Apr.
Total tax-exempt 16.2 15.4 17.9 18.7 13.7 14.5 15.0 15.5Long-term 12.8 12.1 14.3 16.2 12.1 12.1 13.8 14.7
Refundingst 4.0 3.6 4.9 5.2 4.3 3.6 4.9 3.1New capital 8.8 8.5 9.4 11.0 7.8 8.4 8.9 11.6
Short-term 3.3 3.3 3.6 2.5 1.6 2.4 1.3 0.8
Total taxable 0.7 0.7 0.8 1.5 0.7 0.8 0.8 0.3
Note. Includes issues for public and private purposes.1. Includes all refunding bonds, not just advance refundings.
Rating Changes for Long-Term Municipal DebtBillions of dollars
I Upgrades
* Downgrades
n r- H nH
1990 1991 1992 1993 1994 1995 1996
*Annual rate.Source. Standard & Poor's
- 1001997

III-15
questioning the need to use any such savings for budget purposes in
an expanding economy.
Financial intermediaries and money
Net inflows to stock and bond mutual funds slowed substantially
in March and April from the robust pace earlier in the year, as
investors pulled back in response to heightened volatility (table).
Less affected were conservatively managed growth and income funds,
which invest in large, well-known companies. International funds,
which had the highest total returns in the first quarter among all
equity fund categories, also posted solid net sales in March and
April. Weekly data from the Investment Company Institute (ICI) for
early May show some pickup in net sales of equity funds from the
April pace, consistent with press reports suggesting an upswing of
investor interest. After posting an outflow in March, net sales of
bond funds (excluding reinvested dividends) were zero in April.
However, weekly data indicate that flows have turned positive
lately, with the increase mainly at junk-bond funds.
Liquidity ratios of stock funds are very low, and the
substantial decline over the past several years can be explained in
part by the large and reasonably stable inflows to such funds
(chart). In this environment, portfolio managers have less concern
about redemptions, and they seek to extract more yield in a rising
market by holding fewer liquid assets. So far this year, fund
managers have not experienced any serious difficulty because of the
low level of liquid assets. The ICI's daily monitoring of large
fund complexes, which is done when there are substantial stock
market declines, indicated that during the downturn at the end of
March none of the funds had been forced to draw on credit lines to
meet redemptions.
Credit provided by commercial banks expanded at a brisk
11 percent annual rate in April, above its first-quarter pace and
driven by strong growth in securities holdings (table). The main
increase in securities occurred in U.S. government obligations held
in investment accounts at domestic banks and likely reflected the
tax-related buildup in deposits of households. Still, there were
noticeable increases in other securities and in securities holdings
at foreign banks, for which household deposits are not a significant
source of funds.
Loan growth fell back in April from its first-quarter rate,
with business and real estate loans remaining strong but consumer

III-16
Net Sales of Selected Mutual Funds Excluding Reinvested Distributions(Billions of dollars; quarterly and annual data at monthly rate)
1996 1997 Memo:
March1995 1996 Q4 Q1 Feb Mar Apre assets
Stock funds 10.7 18.6 14.2 19.2 18.2 10.5 13.5 1809.7
Domestic 1 9.7 14.7 11.4 14.8 13.7 7.7 9.3 1504.9
Aggressive growth 3.1 4.7 3.2 1.8 0.6 -0.2 1.6 265.1
Growth 3.1 3.9 2.7 3.7 3.1 1.4 1.3 489.0
Growth and income 2 3.7 6.2 5.6 9.2 9.4 6.9 6.4 746.1
International3 1.0 3.9 2.7 4.5 4.4 2.8 4.2 304.8
Bond funds -0.4 1.1 1.1 1.2 2.3 -2.0 0.0 890.4
High-yield 0.7 1.0 1.3 0.8 2.1 -1.3 0.5 81.1
Balanced 4 1.4 2.6 0.6 1.7 1.7 1.5 0.4 256.7
Other -4.7 -2.5 -0.8 -1.3 -1.5 -2.2 -0.9 552.6
1. Includes precious metals funds, not shown elsewhere.2. Calculated as the sum of "Growth and income" and "Income equity" in the ICI data.3. Calculated as the sum of "International" and "Global equity" in the ICI data.4. Calculated as the sum of "Income-Mixed", "Balanced", and "Flexible Portfolio" in the ICI data; these funds invest in both stocks and
bonds.e Aggregate Stock and Bond are ICI estimates, components are staff estimates.Source. Investment Company Institute.
Net Sales and Liquidity at Domestic Stock FundsPercent Percent
14 - - 4Monthly
SLiquidity ratio (left scale) 3
12 - ,
.. , Net sales divided by total assets (right scale) 2
1t.
Note. Liquidity ratio is cash and short-term securities as a percent of total assets.
Source. Investment Company Institute. • : -2Source. Investment Company Institute.

III-17
Commercial Bank Credit(Percent change; seasonally adjusted annual rate)
1996 1997 Level,
Type of credit 1996 AprQ4 Q1 Feb Mar Apr 1997
(billions of $)
1. Bank credit: Reported 4.1 6.7 10.2 12.3 6.7 11.2 3,903.9
2. Adjusted 1 4.6 6.9 7.0 9.0 10.2 11.3 3,805.5
3. Securities: Reported -1.7 2.2 13.6 18.9 -7.5 22.8 1,033.1
4. Adjusted1 -0.2 2.4 0.7 6.1 5.0 24.9 934.7
5. U.S. government -0.8 0.7 0.1 -5.1 6.7 24.6 721.7
6. Other 2 -4.0 6.1 48.3 74.8 -38.6 18.4 311.3
7. Loans3 6.3 8.3 9.0 9.9 11.9 7.0 2,870.8
8. Business 8.9 13.6 9.9 14.8 8.4 9.9 809.2
9. Real estate 4.0 4.6 7.6 6.3 14.1 9.3 1,162.6
10. Home equity 6.8 18.9 10.9 12.6 16.6 19.2 89.1
11. Other 3.7 3.5 7.3 5.8 13.9 8.4 1,073.5
12. Consumer: Reported 6.3 6.3 1.2 -0.5 -2.8 -5.7 519.3
13. Adjusted4 11.5 10.2 5.6 3.8 3.3 1.9 700.6
14. Other 5 8.5 12.0 23.8 26.1 33.1 11.8 379.7
Note. Adjusted for breaks caused by reclassifications. Monthly levels are pro rata averages of weekly (Wednesday) levels. Quar-terly levels (not shown) are simple averages of monthly levels. Annual levels (not shown) are levels for the fourth quarter. Growth ratesshown are percentage changes in consecutive levels, annualized but not compounded.
1. Adjusted to remove effects of mark-to-market accounting rules (FIN 39 and FASB 115).2. Includes securities of corporations, state and local governments, and foreign governments and any trading account assets that
are not U.S. government securities.3. Excludes interbank loans.4. Includes an estimate of outstanding loans securitized by commercial banks.5. Includes security loans, loans to farmers, state and local governments, and all others not elsewhere classified. Also includes
lease financing receivables.

III-18
MONETARY AGGREGATES(Based on seasonally adjusted data)
Aggregate or component
1996
1996 Q4
1997 1996:Q4 Levelto (bil. $)
Feb. Mar. Apr. Apr. 97 Apr. 97(p) (P) (P)
Percentage change (annual rate) 1
-4-6 -7.3 -0.7 1.0 -6.04.6 5.0 5.9 5.1 5.16.7 7-9 7.7 9.0 6.8
Selected components
4. Currency
5. Demand deposits
6. Other checkable deposits
7. M2 minus M13
8. Savings deposits9. Small time depositsLO. Retail money market funds
5.7 7.7 7.5 10.6 5.7 3.9 6.8 403.7
2.7 -5.5 2.0 7.5 -4.2 -22.6 -3.4 3i'1.2
-23.1 -29.4 -16.1 -22.9 -25.6 -17.4 -17.7 257.8
8.8 10.1
11.7 12.1 10.71.3 3.8 1.1
17.1 17.2 16.3
8.5 6.7 9-4 13.6 9.6 2838.9
7.5 12.8 17.5 12.3 1323.31.5 -1.4 1.7 0.9 946.4
13.9 19.9 24.5 18.7 569.2
11. M3 minus M24
Large time deposits, net 5
Institution-only money marketmutual funds
RPsEurodollars
15.0 18.5 14.1 22.8 12.8 16.3 15-2 1148.7
16.1 20.1 12.6 15.9 21.2 28.9 17.6 518.9
19.8 19.8 15.6 36.9 25.1 -0.8 15.1 311.64.1 1.9 8.4 23.8 -9.6 9.7 7.3 200.3
18.8 39.9 28.2 14.4 -17.3 18.6 19.4 117.9
Memo
Sweep-adjusted MI6
Monetary baseHousehold M27
5-4 1270.44.6 458.36.9 3505.9
Average monthly change (billions of dollars) 8
Memo
Selected managed liabilitiesat commercial banks:
18. Large time deposits, gross19. Net due to related foreign
institutions
20. U.S. government depositsat commercial banks
8.5 15.3 12.7 14.8 1
-2.0 -4.7 -6.9 -4.2
0-0 0.0 0.5 -4.5 10.2
.0.3 16.4 - . . 605.7
-8.3 2.2 . . 212.6
1.6 . . . 27.0
1. For the years shown, fourth quarter-to-fourth quarter percent change. For the quarters shown, based onquarterly averages.2. Sum of seasonally adjusted Ml, retail money market funds, savings deposits, and small time deposits.3. Sum of retail money funds, savings deposits, and small time deposits, each seasonally adjusted separately.4. Sum of large time deposits, institutional money funds, RP liabilities of depository institutions, and
Eurodollars held by U.S. addressees, each seasonally adjusted separately.5. Net of holdings of depository institutions, money market mutual funds, U.S. government, and foreign banks
and official institutions.6. Sweep figures used to adjust these series are the estimated national total of transaction account
balances initially swept into MMDAs owing to the introduction of new sweep programs, on the basis of monthlyaverages of daily data.7. M2 less demand deposits8. For the years shown, "average monthly change' is the fourth quarter-to-fourth quarter dollar change,
divided by 12. For the quarters shown, it is the quarter-to-quarter dollar change, divided by 3.
p--Preliminary.
Aggregate
1. Ml2. M2
2
3. M3
-11.46.68.8
1065.03903.95052.6
--

III-19
and other loans weakening considerably. Consumer loans ran off in
April and were quite weak even after adjusting for securitization2
and special factors. Some of the weakness may have owed to
continued substitution of home equity credit for consumer loans and
some to a firming of credit standards and terms by lenders.
The monetary aggregates expanded briskly in April (table). M2
grew at a 6-1/2 percent annual rate, slightly faster than in the
first quarter. Strong growth in its household liquid components
suggests that individuals built up deposits to make tax payments.
Weekly data for the latter half of April and early May show a drop-
off in these accounts, confirming the tax story. The strength in M2
showed through to M3, which grew at an 8-3/4 percent annual rate in
April. M3 was also boosted by the need to fund strong credit
growth. Banks generally, but foreign banks in particular, continued
their heavy issuance of large time deposits, in part to replace
other sources of funds. Assets at wholesale money market mutual
funds ran off slightly last month because the lag in their yields
caused institutional depositors to move cash directly into money
market instruments in the wake of the policy tightening in late
March.
2. Consumer loan growth in March was damped about 7-1/2
percentage points by a shift of receivables from a bank to a nonbanksubsidiary of a bank holding company. In April, growth wasdepressed about 1-1/4 percentage points by the move from RAP to GAAP
accounting on the call report, which enabled banks to remove more
assets from their books.

APPENDIX
THE MAY SENIOR LOAN OFFICER OPINION SURVEY ONBANK LENDING PRACTICES
The May 1997 Senior Loan Officer Opinion Survey on Bank LendingPractices (which generally covered changes over the preceding threemonths) posed questions about bank lending standards and terms, loandemand by businesses and households, and expectations about charge-off rates for consumer and C&I loans. The responses suggest thatdomestic banks have become even more accommodative lenders tobusinesses but have tightened credit to households. They alsoindicate that foreign banks have taken some steps to restrict creditsupply.
Citing stiff competition as their reason, large fractions ofbanks reported having eased terms on C&I and commercial real estateloans, though few banks reported having reduced standards for theseloans. The responses were mixed but suggest, on net, that borrowerdemand for both types of business credit strengthened slightly.
Once again, both standards and terms for consumer loans weretightened over the preceding three months, and banks reported lessdemand for these loans. Standards on home mortgages were aboutunchanged, and demand weakened a little.
Lending to Businesses
Like the January survey results, the May results suggest thatstandards for commercial and industrial loans did not change muchover the preceding three months but that terms eased further.Almost no domestic respondents reported having changed standards onC&I loans to large and small businesses, but a few more than10 percent eased standards for middle-market customers (chart). Bycontrast, 10 percent of foreign banks, on net, tightened standardsfor C&I loans. Regarding terms for large and middle-marketborrowers, one-third of domestic respondents reported havingnarrowed the spreads of loan rates over market rates, about one-fourth reduced costs of credit lines and eased loan covenants, andabout one-tenth increased credit lines or eased collateralizationrequirements. Terms for small borrowers were eased by only a smallshare of banks. By contrast, small net fractions of foreignrespondents reported having tightened various terms on C&I loans,(whereas for the past several surveys foreign banks reported havingeased terms on these loans). Those banks that eased standards orterms on C&I loans said they had done so because of more aggressivecompetition from other banks and from nonbank sources of credit.The banks that tightened cited a lower tolerance for risk and adeterioration in their current or expected future capital position.
On net, domestic respondents reported no change in demand forC&I loans from large customers, but about 10 percent reportedincreased demand from middle-market and small borrowers. However,about 15 percent of foreign respondents, which typically lend tolarge firms, indicated weaker demand for C&I loans. Domestic banksattributed stronger demand to increased financing needs for plantand equipment investment, inventories, and, for larger borrowers,mergers and acquisitions. Weaker demand was attributed to customersswitching to other sources of credit and increases in customers'internal funds.
III-A-1

III-A-2
On net, about 5 percent of domestic respondents said that overthe preceding three months they had eased their standards forcommercial real estate loans (construction and land developmentloans and loans secured by nonfarm, nonresidential real estate); buta similar fraction of foreign respondents said they had tightenedtheir standards for these loans. The May survey was the fourthconsecutive survey to find little evidence of changes in thestandards for these loans following the modest tightening ofstandards reported in late 1995 and early 1996. Even so, 90 percentof the domestic banks and 70 percent of the foreign banks said thattheir competitors had eased their standards for these loans over thepreceding twelve months. With respect to terms on commercial realestate loans, about one-half domestic banks and one-fourth offoreign banks reported having eased spreads over the precedingtwelve months, but only small net fractions reported having changedother terms, including maximum loan size, maximum loan maturity,loan-to-value ratios, debt-service coverage ratios, and requirementsfor take-out financing. As with C&I loans, those banks that easedterms most commonly said they had done so because of increasedcompetition from banks and nonbanks; many also cited the increasedliquidity of these loans resulting from a more-developed secondarymarket for them and the improved condition of the commercial realestate industry. On net, about 10 percent of domestic respondentsand nearly 50 percent of foreign respondents reported havingexperienced increased demand for commercial real estate loans.
Lending to Households
As has been true since the beginning of 1996, significantfractions of banks reported having tightened standards on consumerloans. Nearly one-half the banks said they had tightened standardsfor new credit card accounts over the preceding three months, andone-fourth reported having tightened standards on other consumerloans. Nevertheless, banks' willingness to make consumerinstallment loans was virtually unchanged from three months ago(chart). The net fraction of banks more willing to make these loanshas hovered near zero for the past six surveys. Forty percent ofthe respondents lowered credit limits on credit card lines, andabout 15 percent raised spreads of loan rates over market rates.Terms on other consumer loans were about unchanged. On net,20 percent of the respondents reported a decline in demand forconsumer loans.
Banks reported little change in their standards for approvingmortgage applications of individuals to purchase homes. Ten percentmore banks reported weaker demand for residential mortgages thanreported stronger demand.
Expectations for Charge-off Rates
Additional questions on the survey asked loan officers how theyexpected charge-off rates for consumer and C&I loans to change overthe remainder of 1997. About one-third of respondents, on net,expected charge-off rates for consumer loans to go up, aneventuality most attributed to a greater willingness on the part ofhouseholds to declare bankruptcy; somewhat fewer blamed worseninghousehold financial conditions and aggressive solicitations by theirbank for these loans. One-fifth of the banks, on net, expectedcharge-off rates for C&I loans to go up. Banks pointed to easedstandards for these loans, a deterioration in business financialconditions, and a deterioration in the economy generally as thereasons for their outlook. Several banks also noted that recentdeclines in the gross charge-off rate on C&I loans would translateinto fewer future recoveries, raising the net charge-off rate.
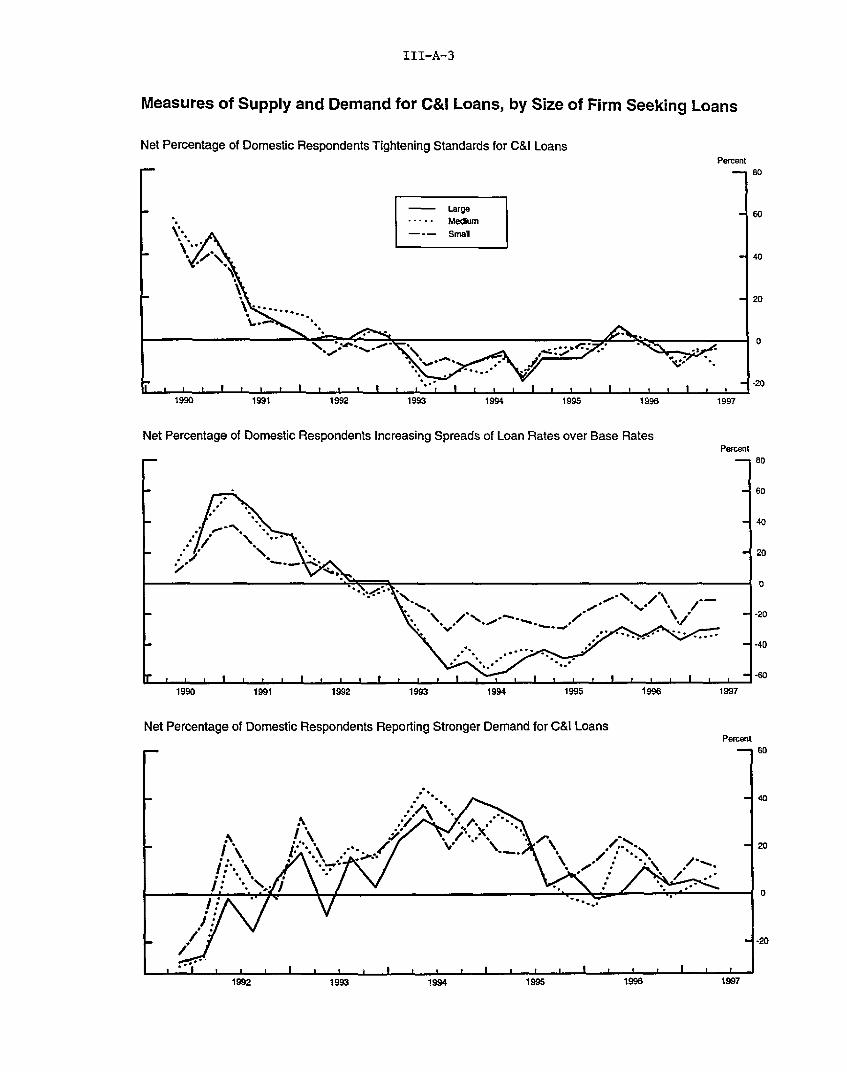
III-A-3
Measures of Supply and Demand for C&I Loans, by Size of Firm Seeking Loans
Net Percentage of Domestic Respondents Tightening Standards for C&I LoansPercent
80
- Large
260.- * Medium*\ A - - -
Small
S 40
-20
__. - -201990 1991 1992 1993 1994 1995 1996 1997
Net Percentage of Domestic Respondents Increasing Spreads of Loan Rates over Base RatesPercent
80
60
40
i20
0
- -40~----^ .---------.... .-- A " \/'- -°
-
I
0
t
1990 1991 1992 1993 1994 1 1991996 1997
Net Percentage of Domestic Respondents Reporting Stronger Demand for C&l LoansPercent
60
40
\ *A\ \ 20
S-

III-A-4
Measures of Supply and Demand for Loans to HouseholdsNet Percentage of Domestic Respondents Indicating More Willingness to Make Consumer Installment Loans
Percent
Net Percentage of Domestic Respondents Reporting Stronger Demand for Loans to HouseholdsPercent
Net Percentage of Domestic Respondents Tightening Standards for Mortgages to IndividualsPercent
NJY
1993 1994 1995 19971990 1991 1992
PAJA -^

INTERNATIONAL DEVELOPMENTS

INTERNATIONAL DEVELOPMENTS
U.S. International Trade in Goods and Services
For January-February combined, the U.S. deficit in trade in goods
and services was substantially larger than in the fourth quarter of last
year and about the same as in the third quarter. Relative to the fourth
quarter, exports increased only slightly and imports rose sharply. Data
for March will be released on May 21.
NET TRADE IN GOODS & SERVICES(Billions of dollars, seasonally adjusted)
Annual rates Monthly rates1996 1996 1997 1996 1997
03 04 Qle/ Dec Jan FebReal NIPA 1/Net exports of G&S -113.6 -137.4 -98.4 -130.3
Nominal BOPNet exports of G&S -114.3 -136.8 -106.1 -136.5 -10.5 -12.3 -10.4
Goods, net -187.8 -207.2 -181.9 -213.1 -16.9 -18.6 -16.9Services, net 73.5 70.4 75.9 76.6 6.4 6.3 6.5
1. In billions of chained (1992) dollars.e. BOP data are two months at an annual rate.Source. U.S. Dept. of Commerce, Bureaus of Economic Analysis and Census.
Exports of goods and services were only 1/2 percent higher in
January-February relative to the fourth quarter. A sharp rise in
exports of automotive products to Canada (from strike-reduced levels
in the fourth quarter), and solid increases in exports of computers,
semiconductors, and chemicals were nearly offset by declines in
other categories of trade (mostly agricultural products, aircraft,
and fuels). The decline in agricultural exports primarily reflected
a reversal of a surge in shipments of grains and oilseeds in the
fourth quarter, and the decrease in aircraft exports was due to a
temporary drop in January deliveries. Most of the decline in the
value of fuel exports, however, was in price.
Imports of goods and services were about 3-1/2 percent higher
in January-February relative to the fourth quarter. About three-
fourths of the increase was in imports of automotive products
(largely a rebound from strike-reduced levels in the fourth quarter)
and in imports of computers and semiconductors. The CAW and UAW
strikes against GM in the fall had a greater effect on automotive
imports than on automotive exports: The value of imported computers
IV-1

IV-2
U.S. International Trade in Goods and Services(Seasonally adjusted annual rate)
Net ExportsBillions of dollars, SAAR
1989 1990 1991 1992 1993 1994 1995 1996 1997
Selected NIPA ExportsRatio scale, billions of chained (1992) dollars
NIPA Exports and ImportsRatio scale, billions of chained (1992) dollars
1989 1990 1991 1992 1993 1994 1995 1996 1997
Selected NIPA ImportsRatio scale, billions of chained (1992) dollars
/Consumergoods /
-/
1989 1990 1991 1992 1993 1994 1995 1996 1997
5-9-97
920
720
520
320
1989 1990 1991 1992 1993 1994 1995 1996 1997

IV-3
U.S. EXPORTS AND IMPORTS OF GOODS AND SERVICES(Billions of dollars. SAAR, BOP basis)
Levels1996 1997 1997
Q4 Qle/ Jan Feb
Amount Change i/1996 1997 _ 199704 Ole/ Jan Feb
862.1 864.7 847.7 881.6
632.561.73.7
567.0
36.743.336.9150.1
65.233.410.621.2
135.573.326.0
632.557.83.6
571.2
33.846.038.8145.9
70.839.210.1
21.6
136.774.025.2
616.357.72.7
555.8
29.445.738.4
143.0
68.338.69.4
20.3
133.372.025.7
648.757.84.4
586.5
38.246.439.1
148.7
73.439.710.822.9
140.175.924.7
39.0
31.61.6
-1.531.5
10.00.43.29.2
-1.6-2.92.7-1.4
6.74.3
-0.6
2.5 -6.8 33.8
0.0-4.0-0.14.1
-2.92.71.9-4.2
5.65.8-0.50.4
1.10.7-0.8
-6.8-1.6-0.8-4.4
-10.04.21.9
-3.9
4.85.6-2.41.6
-2.3-0.2-2.0
Exports of G&S
Goods exportsAgriculturalGoldOther goods
Aircraft & ptsComputersSemiconductorsOther cap gds
Automotiveto Canadato Mexicoto ROW
Ind suppliesConsumer goodsAll other
Services exports
Imports of G&S
Goods importsPetroleumGoldOther goods
Aircraft & ptsComputersSemiconductorsOther cap gds
Automotivefrom Canadafrom Mexicofrom ROW
Ind suppliesConsumer goodsFoodsAll other
Services imports
Memo:Oil qty (mb/d)Oil price ($/bbl)
968.2 1001.2 995.7 1006.6
814.474.73.4
736.2
13.961.632.6
121.9
128.642.323.263.1
130.6180.2
36.730.2
845.678.03.7
763.9
13.867.135.0
121.4
145.754.923.966.9
132.7181.837.029.4
839.779.82.7
757.2
13.766.434.5
121.0
144.056.423.064.5
132.7180.636.727.6
851.576.24.7
770.6
13.867.935.6
121,7
147.553.324.769.4
132.6183.037.331.2
153.8 155.6 156.1 155.1
9.18 9.62 9.51 9.7222.31 22.21 22.96 21.45
8.3 32.9 15.4 10.8
6.42.9-2.76.2
0.80.0-0.8
4.4
-7.1-9.0-0.01.9
-0.37.10.81.3
1.9
31.13.20.2
27.7
-0.25.62.4-0.6
17.212.6
0.73.9
2.11.50.4-0.8
-0.86 0.452.73 -0.11
14.11.4
-0.212.9
-1.83.50.9-2.8
16.713.22.61.0
2.3-3.0-1.5-1.5
11.8-3.6
2.013.4
0.11.51.10.8
3.5-3.1
1.74.8
-0.12.40.73.6
1.2 -1.0
0.06 0.210.27 -1.51
1. Change from previous quarter or month, e. Average of two months.Source. U.S. Dept. of Commerce. Bureaus of Economic Analysis and Census.
229.7 232.2 231.4 232.9
32.40.01.7
30.7
8.80.70.75.7
5.11.11.42.6
6.83.9-1.0

IV-4
(including accessories and parts) in January-February was 9 percent
higher than in the fourth quarter, and the trade deficit in
computers widened about $12 billion. The value of imported
semiconductors turned up following four quarters of declines.
Oil Imports and Prices
The quantity of oil imported during January-February increased
slightly from the level recorded in the fourth quarter of 1996, as a
lower-than-normal seasonal inventory drawdown offset a decline in
oil consumption. Preliminary Department of Energy statistics
indicate that oil imports picked up in March and April due to a
build-up in oil inventories.
Prices of imported oil declined substantially in the first
quarter, partly reversing the very large increase recorded in the
fourth quarter of 1996. Prices had risen significantly in the
fourth quarter and at yearend stood 37 percent above the December
1995 level. Spot WTI dropped $1.27 per barrel in April, averaging
$19.72 per barrel, its lowest level since February 1996. Prices
traded near the April average in early May, but jumped last weekend
due to increased tensions in the Middle East. Spot prices are now
trading near $21 per barrel.
Prices of Non-oil Imports and Exports
Prices of U.S. non-oil imports declined somewhat in the first
quarter. Declines in prices of computers, semiconductors, other
capital goods, and consumer goods were partly offset by moderate
increases in prices of industrial supplies and foods. Prices of
non-oil imports have declined for six consecutive quarters.
Prices of exports rose slightly in the first quarter. Prices
of agricultural products increased somewhat after posting large
declines in the third and fourth quarters of 1996, mostly because of
higher grain and oilseed prices, reflecting renewed concerns of
lower crop production in 1997. Prices of nonagricultural exports
were little changed in the first quarter (as in the fourth quarter)
with increases spread among major trade categories with the
exception of computers and semiconductors. These two quarters of
small price changes followed five quarters of modest price declines
for nonagricultural products (related primarily to industrial
supplies).

IV-5
Oil Prices 5-14-97
Dollars per barrel
Spot West Texas intermediate
Import unit value
1987 1988 1989 1990 1991 1992 1993 1994 1995 1996 1997
PRICES OF U.S. IMPORTS AND EXPORTS(Percentage change from previous period)
Annual rates199___6 1997
03 04 011997
Jan Feb
Merchandise importsOilNon-oil
Foods, feeds, bev.Ind supp ex oilComputersSemiconductorsCap. goods ex comp & semiAutomotive productsConsumer goods
Merchandise exportsAgriculturalNonagricultural
Ind supp ex agComputersSemiconductorsCap. goods ex comp & semiAutomotive productsConsumer goods
Chain-weight__Imports of gds & serv.Non-oil merchandise
----------- BLS-2.41.9
-2.8
-10.5-5.3
-10.9-15.4-0.40.7-0.8
-3.5-18.0-0.9
-3.2-11.9-15.5
2.10.30.7
5.364.3-0.4
1.81.0
-8.5-15.0
0.10.1-0.5
-4.2-31.90.4
0.8-10.6-3.61.21.30.9
prices-4.5-24.9-1.9
4.76.0
-13.6-24.1-5.10.0-0.8
0.42.50.1
0.7-10.1-6.12.01.30.5
(1995=100)------------0.30.6
-0.4
-0.11.0-1.7-5.4-0.8-0.1-0.1
-0.8-7.50.0
1.90.3-1.2-0.1-0.50.00.2
0.1 0.2 0.00.1 2.2 1.40.0 0.0 -0.1
0.0-0.2-1.30.40.20.0
0.2-1.0-0.10.00.00.2
---Prices in the NIPA accounts (1992=100)--
-2.0-3.0
3.6 -3.7-1.5 -2.2
Exports of gds & serv.Nonag merchandise
Mar
-1.4-10.9-0.3
2.8-1.3-1.13.1-0.50.0-0.6
0.1-1.3-0.6-0.10.2-0.4
I- Swn - L - -
-1.8 -2.2-2.3 -0.9
0.1-0.8

IV-6
U.S. International Financial Transactions
Very large gross capital inflows and outflows continued during
the first quarter of 1997. Foreign official assets in the United
States increased by $28 billion, despite the absence of substantial
G-10 exchange market intervention and the appreciation of the dollar
against most currencies during much of the period (line 1 of the
Summary of U.S. International Transactions table). Apart from the
OPEC countries, which benefitted from high oil prices, the largest
increases in holdings were shown by Spain and China. Preliminary
data from the FRBNY suggest that net changes in official assets in
the United States were modest in April.
Foreign private net purchases of U.S. securities continued at
a very rapid pace in March, bringing the first quarter total to $86
billion (line 4). Purchases of U.S. Treasury securities (line 4a)
were particularly strong. As is frequently the case, the largest
purchases were reported for the United Kingdom, a major center for
trading U.S. Treasury securities. Foreign private net purchases of
U.S. corporate and government agency bonds (line 4b) fell off in
March, but the total for the quarter remained strong. Foreigners
showed renewed interest in U.S. stocks in the first quarter,
particularly in February (line 4c).
U.S. net purchases of foreign stocks were also substantial in
March and in the first quarter as a whole (line 5b); net purchases
were concentrated in Europe and Japan. In contrast, U.S. net
purchases of foreign bonds were modest for the quarter as a whole
(line 5a).
Banks and securities dealers reported large net capital
outflows in March and the first quarter as a whole (line 3).
Monthly average data on net claims of banking offices in the United
States on their IBFs and own foreign offices also showed net
outflows during this period (line 1 of the International Banking
Data table), concentrated at foreign-chartered banks.

IV-7
SUMMARY OF U.S. INTERNATIONAL TRANSACTIONS(Billions of dollars, not seasonally adjusted except as noted)
1996 19971995 1996
Q2 Q3 Q4 Q1 Feb Mar
Officilapait al
1. Change in foreign official reserveassets inU.S. (increase. +)
a. G-10 countries
b. OPEC countries
c. All other countries
2. Change in U.S. official reserveassets (decrease. +)
Fri±ate capital
Banks
3. Change in net foreign positionsof banking offices in the U.S.
1
Securities2
4. Foreign net purchases ofU.S. securities (+)
a. Treasury securities3
b. Corporate and other bonds4
c. Corporate stocks
5. U.S. net purchases (-) offoreign securities
a. Bonds
b. Stocks
Other flows (quarterly data, s.a.)
6. U.S. direct investment (-) abroad
7. Foreign direct investment in U.S.
8. Other (inflow. +)5
US_.-_urrent account balance Cs.a.
Sta-Lstical disctre pacc-yLs .aJ.
110.0 121.6 13.4 23.2 32.9
33.1
4.3
72.6
-9.7
35.5
13.4
72.7
6.7
1.4
5.3
16.5
7.5
28.0 8.9
2.2
3.6
27.2
-. 3
-30.9 -58.0 -12.6 -5.4 -14.0 -29.2 -4.0 -13.7
190.8 290.9 61.7 78.9 100.5 86.2 32.1
99.9
82.6
8.2
-98.7
156.2
120.9
13.8
-107.4
31.8
23.6
6.3
-20.2
43.6
33.4
2.0
-22.4
67.7
31.1
1.7
-30.4
47.1
28.4
10.7
-16.2
15.6
11.1
5.4
-5.8
25.3
17.8
5.2
2.3
-6.0
-48.4 -48.8 -2.8 -14.2 -19.9 -4.3 -1.5 -2.1
-50.3 -58.6 -17.4 -8.2 -10.5 -11.8 -4.4 -3,8
-95.5 -88.3 -26.2 -9.1 -29.8
60.2
-9.5
-148.2
84.0
-31.3
-165.1
17.4
16.9
-40.6
21.1
-24.1
-47.9
16.8
-7.7
-41.4
n.a n.a n.a
n.a n.a n.a
n.a n.a n.a
n.a n.a n.a
31.5 -53.1 -9.3 -21.8 -26.6 n.a n.a n.a
Note. The sum of official capital, private capital, the current account balance, and the statisticaldiscrepancy is zero. Details may not sum to totals because of rounding.
1. Changes in dollar-denominated positions of all depository institutions and bank holding companiesplus certain transactions between broker-dealers and unaffiliated foreigners (particularly borrowingand lending under repurchase agreements). Includes changes in custody liabilities other than U.S.Treasury bills.
2. Includes commissions on securities transactions and therefore does not match exactly the data on U.S.international transactions published by the Department of Commerce.3. Includes Treasury bills.4. Includes U.S. goverment agency bonds.5. Transactions by nonbanking concerns and other banking and official transactions not shown elsewhere
plus amounts resulting from adjustments made by the Department of Commerce and revisions in lines 1through 5 since publication of the quarterly data in the Survey of Current Business.n.a. Not available. ' Less than S50 million.

IV-8
INTERNATIONAL BANKING DATA 1(Billions of dollars)
1994 1995 1996 1997
Dec. Dec. Jun. Sep. Dec. Jan. Feb. Mar.
1. Net claims of U.S. -224.0 -260.0 -247.3 -247.4 -231.2 -230.3 -230.3 -220.6banking offices(excluding IBFs) onown foreign officesand IBFs
a. U.S.-charteredbanks
b. Foreign-charteredbanks
2. Credit extended to U.S.nonbank residents
a. By foreign branchesof U.S. banks
b. By Caribbeanoffices of foreign-chartered banks
3. Eurodollar holdings ofU.S. nonbank residents
a. At allU.S.-chartered banks andforeign- charteredbanks in Canada andthe United Kingdom
b. At the Caribbeanoffices of foreign-chartered banks
-70.1 -86.1 -77.1 -73.6 -66.4 -70.4 -79.5 -72.5
-153.9 -173.9 -170.2 -173.8 -164.8 -159.9 -150.8 -148.1
23.1 26.5 29.0 29.2 31.9 30.8 32.1 32.9
78.4 86.3 85.4 83.3 79.4 n.a. n.a. n.a.
85.6 91.2 101.0 101.4 113.0 119.8 121.2 120.0
86.0 92.3 103.7 109.4 112.1 n.a n.a. n.a.
MEMO: Data as recorded in the U.S.international transactions accounts
4. Credit extended to U.S.nonbank residents
5. Eurodeposits of U.S.nonbank residents
176.6 211.3
248.2 281.2
223.8 242.2 n.a.
297.3 313.3 n.a.
n.a n.a- n.a.
n.a n.a. n.a.
1. Data on lines 1 through 3 are from Federal Reserve sources and sometimes differ intiming from the banking data incorporated in the U.S. international transactionsaccounts.
Lines la, lb, and 2a are averages of daily data reported on the FR 2950 and FR2951.Lines 2b and 3b are end-of-period data reported quarterly on the FFIEC 002s.Line 3a is an average of daily data (FR 2050) supplemented by the FR 2502 and end-of-
quarter data supplied by the Bank of Canada and the Bank of England. There is a break inthe series in April 1994.
Lines 4 and 5 are end-of-period data estimated by BEA on the basis of data provided bythe BIS, the Bank of England, and the FR 2502 and FFIEC 002s. They include some foreign-currency denominated deposits and loans. Source: SCB

IV-9
Foreign Exchange and Foreign Financial Markets
The foreign-exchange value of the dollar rose significantly in
April only to give back those gains in early May. On balance, the
weighted-average value of the dollar has declined 1 percent since
the March 25 FOMC meeting. The dollar's see-saw behavior has
occurred amid alternating views on the next U.S. monetary policy
action and alternating interpretations of official views on the
appropriate level for the dollar.
The release in early April of a stronger-than-expected labor
market report for the United States and remarks from Treasury
Secretary Rubin, who indicated in Tokyo that he does not believe in
using currencies for trade policy, started the dollar on its April
rise. After some mid-month declines, particularly against the mark,
amid comments from Bundesbank President Tietmeyer indicating that
the Bundesbank is not interested in a further weakening of the mark,
the dollar rebounded later in the month as the market came to the
conclusion that the April 27 G-7 meeting would not result in any
further qualification of the strong dollar policy espoused by
Secretary Rubin. While the formal statement on exchange rates and
financial markets from the.G-7 finance ministers and central bank
governors "emphasized the importance of avoiding exchange rates that
could lead to the reemergence of large external imbalances," market
participants evidently interpreted that statement and the
accompanying language,1 at least initially, as offering no
objections to the dollar's rise. Immediately following the release
of the statement, the dollar resumed its move higher, although
subsequent remarks from Mr. Tietmeyer indicating concern about
1 The April 27 statement contained the following paragraph on exchange
rates and financial markets: "We discussed developments in exchange and
financial markets since our last meeting in Berlin where we noted that major
misalignments in exchange markets had been corrected. We agreed that
exchange rates should reflect economic fundamentals and that excess
volatility and significant deviations from fundamentals are undesirable.
In this context, we emphasized the importance of avoiding exchange rates
that could lead to the reemergence of large external imbalances. We agreed
to monitor developments and to cooperate as appropriate in exchange
markets."

IV-10
Weighted Average Exchange Value of the Dollar
Index, March 1973 = 100
February March April May
Interest Rates in Major Industrial Countries
Three-month rates Ten-year bond yieldsMar. 24 May 15 Change Mar. 24 May 15 Change
Germany 3.18 3.10 -0.08 5.93 5.71 -0.22Japan 0.56 0.56 0.00 2.40 2.59 0.19United Kingdom 6.25 6.38 0.13 7.60 7.00 -0.60Canada 3.33 3.40 0.07 6.59 6.57 -0.02France 3.27 3.28 0.01 5.81 5.56 -0.25Italy 7.44 6.81 -0.63 7.70 7.12 -0.58Belgium 3.46 3.17 -0.29 6.06 5.80 -0.26Netherlands 3.14 3.14 0.00 5.81 5.61 -0.20Switzerland 1.88 1.69 -0.19 3.59 3.34 -0.25Sweden 4.23 4.15 -0.08 7.13 6.66 -0.47
Weighted-averageforeign 3.59 3.51 -0.08 5.80 5.57 -0.23
United States 5.63 5.72P 0.09 6.72 6.72P 0.00
Note. Change is in percentage points. P Preliminary.

IV-11
currency overshoots seemed to restrain the dollar's upward momentum
by month-end.
Market readings of official intentions reversed quickly in
early May amid reports of discussions about the possibility of
concerted intervention by the United States, Germany, and Japan to
restrain the dollar's rise. Consistent with sentiment that official
concern over dollar strength was increasing, Bundesbank Council
member Welteke indicated that a further rise of the dollar would not
be welcome. Subsequent remarks by Japanese (Ministry of Finance)
officials suggesting that they would like to see some yen
appreciation and that the strength of the G-7 statement on exchange
rates had been misunderstood seemed to exert additional downward
pressure on the dollar, particularly against the yen. Reduced
expectations for further tightening of U.S. monetary policy,
triggered by Chairman Greenspan's May 8 speech at New York
University in the wake of somewhat softer data on U.S. activity,
also weighed on the dollar.
The widely expected tightening by the FOMC announced after its
March meeting generated little immediate movement in the foreign
exchange value of the dollar, even though the action seemed to
prompt a rise in U.S. long-term interest rates relative to those
abroad in the days immediately following the meeting. U.S. rates
have subsequently eased, reflecting in part reduced prospects for
further monetary policy tightening in the United States, with the
ten-year Treasury yield little changed on balance during the
intermeeting period. Over the same period, the bellwether bond
yield in Japan has risen nearly 20 basis points, perhaps reflecting
more optimism among investors about Japanese economic activity,
although data supporting this view has not yet materialized and the
roughly unchanged three-month rate fails to support the view that
expectations for Japanese monetary policy have changed
substantially. The German bond yield has declined more than 20
basis points during the intermeeting period, for reasons that are
not entirely clear, and the three-month rate in Germany has moved
down almost 10 basis points. Resulting changes on net in
corresponding long-term interest rate differentials are roughly

IV-12
consistent with the dollar's movements against individual
currencies. The dollar has risen 3/8 percent against the mark
during the intermeeting period but has declined 5-1/2 percent
against the yen.
Election results or pre-election nervousness appear to be
affecting financial markets in several countries. While sterling
has risen 1-1/2 percent on balance against the dollar during the
intermeeting period, long-term interest rates have declined sharply
in United Kingdom, moving down 60 basis points, largely in reaction
to the announcement by the new Labour government that it is taking
steps to make the Bank of England more independent. This decline
occurred even as U.K. authorities moved to tighten monetary policy,
prompting an increase in the base lending rate of 25 basis points to
6-1/4 percent on May 6. This move had been widely expected to occur
soon after the election.
The dollar has firmed less than 1/2 percent against the
Canadian dollar, as Canadian authorities have evidently chosen to
accept the stimulative effects of a weaker currency rather than
respond to the March action by the FOMC with increases in short-term
Canadian policy rates ahead of Canadian elections in June.
French financial markets have also been affected by the
announcement of national elections to be held on May 25 and June 1.
The franc had weakened shortly after mid-April as the market began
to suspect that President Chirac might call an election, and short-
and long-term interest rate differentials against the mark rose
significantly. Subsequent polls giving the ruling center-right
coalition a substantial lead have led to a recovery of the franc and
an unwinding of the movement in the long-term interest rate
differential. The short-term spread has not completely reversed its
earlier rise, however, ending the intermeeting up 9 basis points on
balance.
The Desk
did not intervene for the U.S. monetary authorities during the
period.

IV-13
Developments in Foreign Industrial Countries
Recent indicators suggest that economic activity picked up in
the first quarter, although the pace varied considerably across the
major industrial countries. First-quarter growth appears to have
continued at a robust pace in Canada, the United Kingdom, and Japan,
while activity expanded at a modest pace in continental Europe.
More forward-looking indicators suggest that activity will pick up
further in Germany and France in the second quarter, continue at a
modest rate in Italy, and slow temporarily in Japan.
Inflationary pressures generally remain subdued in the foreign
industrial countries. CPI inflation is under 2 percent in Germany,
France, Italy, and Canada. In Japan, an increase in the VAT rate
was responsible for an increase in CPI inflation to a little over
one percent. In the United Kingdom, CPI inflation eased somewhat
further in April, largely reflecting a decline in food and energy
prices and recent sterling appreciation.
On May 1M, the Labour Party in the United Kingdom won the
general election by a wide margin. One of the new government's
first moves was to increase the Bank of England's independence by
giving it the operational responsibility to set interest rates. A
general election has been called in France, with the first round of
voting on May 25 and the second round on June 1. Recent polls point
to a much-reduced majority for the Center-Right Coalition, but the
outcome is likely to be close. In Canada, the Liberal Party is
expected to be re-elected by a wide margin in the June 2 election.
Individual country notes. In Japan, economic activity
continued to expand strongly on average in the first quarter.
Production and consumption spending were front-loaded in advance of
the April 1 increase of the VAT from 3 to 5 percent, but spending
likely fell off in the second quarter. Strong gains in industrial
production, machinery orders, and new car registrations in January
were partially reversed in February and March, and new car
registrations fell nearly 29 percent further in April.
Although some of the surge in durable goods spending was
related to the change in the VAT rate, it was also related to last
year's strong housing cycle that seems to have come to an end.
Housing starts fell during the first quarter to a level 11-1/2
percent below the fourth-quarter average.

IV-14
JAPANESE ECONOMIC INDICATORS(Percent change from previous period except where noted, SA)
1996 1997
Q3 Q4 Q1 Jan Feb Mar Apr
Industrial Production 1.6 3.1 2.1 5.6 -3.7 -1.5 n.a.
Housing Starts 2.6 4.3 -11.5 -2.8 -3.2 -2.6 n.a.
Machinery Orders 2.8 7.4 -4.9 16.1 -5.9 -3.8 n.a.
New Car Registrations 5.8 10.6 2.3 2.6 -1.6 -2.3 -28.7
Unemployment Rate (%) 3.3 3.3 3.3 3.3 3.4 3.2 n.a.
Job Offers Ratio1 0.72 0.75 0.74 0.76 0.73 0.73 n.a.
Business Sentiment2 -7 -3 2 . ... ... ...
CPI (Tokyo area)3 0.0 0.1 0.0 0.0 0.0 0.0 1.2
Wholesale Prices3 0.7 0.6 1.4 1.0 1.6 1.6 3.2
1. Level of indicator.2. Percent of manufacturing firms having a favorable view of business
conditions minus those with an unfavorable outlook (Tankan survey).3. Percent change from previous year.
The unemployment rate fell to 3.2 percent in March while the
job offers/applicants ratio remained at 0.73. The Tokyo CPI and
wholesale prices rose in April, largely as a result of the VAT
increase. Wholesale prices have also been boosted in recent months
by rising import prices.
The Bank of Japan's March survey (Tankan) revealed a striking
contrast in sentiment between manufacturing firms and non-
manufacturing firms. The yen's depreciation since the time of the
previous Tankan has raised expected sales and profits of many
manufacturing firms. The survey showed a modest increase in the
diffusion index of business sentiment at major manufacturers to 2
from -3 last November. This is the first positive value of the
index since November 1991. Meanwhile, firms' sentiment has
deteriorated in other sectors, particularly in construction,
retailing, and other services, largely owing to concerns about the
impact of the fiscal contraction.
The current account surplus narrowed in the first quarter. A
strong expansion in exports was offset by a surge in imports as
consumers and firms made purchases before the April 1 increase in
the VAT.
Economic activity in Germany appears to have picked up in the
first quarter from its tepid pace in the fourth quarter of last

IV-15
year, although growth likely remained well below potential rates,
probably in the 1 to 2 percent (AR) range. Industrial production
for February and March indicate that the construction sector
recovered from its weather-related slump in January, and total
output increased 0.5 percent in the first quarter from its fourth-
quarter level. Real manufacturing orders increased strongly in the
first quarter, led by a surge in export orders. The IFO business
climate survey, an indicator of current and expected conditions in
industry, continued to improve in the first quarter, with the index
crossing into the positive range for the first time since mid-1995.
The labor market situation appears to have stabilized following the
jump in unemployment at the beginning of the year, but total
unemployment remains near the 4.3 million (SA) level. Consumer
price inflation in Germany remains subdued, with inflation
registering 1.4 percent over the year to April.
GERMAN ECONOMIC INDICATORS(Percent change from previous period except where noted, SA)
1996 1997
Q3 Q4 Q1 Jan Feb Mar Apr
Industrial Production 1.1 -0.0 0.5 -1.8 2.0 0.5 n.a.
Orders 1.0 -0.4 1.4 2.7 -0.2 1.1 n.a.
Unemployment Rate (%) 10.4 10.8 11.3 11.3 11.3 11.2 11.2
Western Germany 9.2 9.5 9.8 9.8 9.8 9.8 9.8
Eastern Germany 15.4 15.9 17.3 17.3 17.5 17.2 17.1
Capacity Utilization 82.6 83.0 84.1 . ... ...Business Climatel 2 -11.3 -3.3 1.3 -1.0 3.0 2.0 n.a.
Consumer Prices3 1.4 1.4 1.7 1.8 1.7 1.5 1.4
1. Western Germany.2. Percent of firms (in manufacturing, construction, wholesale, and
retail) citing an improvement in business conditions (current andexpected over the next six months) less those citing a deterioration inconditions.
3. Percent change from previous year.
A number of recent outside forecasts, including the spring
joint forecast from the German economic institutes, the German
Council of Economic Experts, and the IMF's recent World Economic
Outlook, project a narrowing in the general government deficit this
year to about 3-1/4 percent from 3.9 percent in 1996. On May 15,

IV-16
tax experts estimated a shortfall in tax revenue of DM18 billion
(0.5 percentage point of GDP) this year, DM10 billion (0.3
percentage point) more than the Finance Ministry had accounted for
in its deficit estimate of 2.9 percent of GDP. Thus, supplemental
measures will be necessary if Germany is to meet the Maastricht
deficit target of 3 percent of GDP. Although no formal announcement
has been made of supplementary budget measures to bridge the
shortfall, there has been talk of additional cuts in social
expenditures, an increase in the mineral oil tax, and revaluation of
the Bundesbank's gold reserves to market prices in order to increase
the profits paid over to the government.
In France, first-quarter growth of economic activity is
estimated to have remained modest. While industrial production rose
sharply in February on strength in manufacturing output, the
January-February average is little changed from the fourth-quarter
average. In recent months, business confidence has risen sharply,
mostly on strength in foreign demand. In the first quarter,
consumption of manufactured products rose about 2-1/4 percent, at an
annual rate, after a sharp fourth-quarter decline (associated with
the end of the government's earlier car-buying incentive program).
After edging up in February, the unemployment rate was unchanged in
March, and consumer price inflation through April remains subdued.
FRENCH ECONOMIC INDICATORS(Percent change from previous period except where noted, SA)
1996 1997
Q3 Q4 Q1 Jan Feb Mar Apr
Consumption of 2.7 -3.5 0.6 2.6 -1.3 -0.1 n.a.Manufactured Products
Industrial Production 2.2 -1.3 n.a. -1.1 1.6 n.a. n.a.
Capacity Utilization 82.3 81.4 81.1 ... ... ... ...
Unemployment Rate (%) 12.5 12.7 12.8 12.7 12.8 12.8 n.a.
Business Confidence -26.7 -19.7 2.3 1.0 6.0 0.0 -3.0
Consumer Prices2 1.8 1.7 1.5 1.8 1.6 1.1 1.0
1. Percent balance of respondents citing an improvement in the outlookversus those citing a worsening.
2. Percent change from previous year.

IV-17
In the United Kingdom, the economy has continued to expand
rapidly, although sterling's recent strength has begun to cloud the
outlook for exports. Real GDP growth picked up to almost 4 percent
(SAAR) in the first quarter, while the unemployment rate has
continued to drop, reaching 5.9 percent in April. About half of the
decline in the unemployment rate since last October has been
attributed to changes in the unemployment benefit system. Consumer
demand remains strong, and business confidence rebounded in March
and remained high in April. However, export orders have fallen
since last fall in response to the strength of sterling. In
addition, industrial production was unchanged in March, with a small
decline in manufacturing, although the purchasing managers survey
indicated that manufacturing output rose in April in response to
continued strength in domestic demand.
UNITED KINGDOM ECONOMIC INDICATORS(Percent change from previous period except where noted, SA)
1996 1997
Q3 Q04 1 Jan Feb Mar Apr
Real GDP (AR) 2.6 3.4 3.9 ... ... ...
Non-oil GDP (AR) 2.6 3.0 4.1 ... ....
Industrial Production 0.4 0.6 0.1 0.1 -0.8 0.0 n.a.
Retail Sales 0.9 1.1 0.9 0.8 0.4 0.4 n.a.
Unemployment Rate (%) 7.5 6.9 6.3 6.5 6.2 6.1 5.9Business Sentiment 21.3 18.0 18.3 14.0 16.0 25.0 23.0
Consumer Prices1 2.9 3.2 2.9 3.1 2.9 2.7 2.5
Producer Input Price 2 -2.7 -4.6 -7.0 -6.3 -6.8 -8.0 -10.5
Average Earnings2 4.0 4.2 4.6 4.8 4.5 4.5 n.a.
1. Retail prices excluding mortgage interest payments. Percent changefrom previous year.
2. Percent change from previous year.
The twelve-month rate of increase in retail prices excluding
mortgage interest payments dropped to 2.5 percent in April, meeting
the government's inflation target. Prices of goods were up only 1.7
percent, reflecting a sharp drop in seasonal food prices, lower
energy costs, and the impact of the strength of sterling. In
contrast, services prices rose 3.3 percent. The underlying rate of
increase in average earnings backed off from the high January rate

IV-18
in February and March. Nonetheless, the most recent rate of 4.5
percent is up from 3.75 percent a year ago, reflecting the tighter
labor market.
As expected, the Labour Party won the May 1 general election
by a wide margin. One of the new Government's first moves was to
raise official interest rates by 25 basis points, a change which had
been widely anticipated. More surprising was a decision to make the
Bank of England more independent by giving it the operational
responsibility to set interest rates. Decisions will be made by
majority vote of a nine-member Monetary Policy Committee, which will
include the Governor of the Bank of England along with two Deputy
Governors and several appointed members from outside the Bank.
These changes bring the authority of the Bank more in line with that
of other G-7 central banks. The reforms stop short of full
compliance with the Maastricht treaty, however, because the Treasury
will retain control of the inflation target as well as the ability
to instruct the Bank on interest rates for a "limited period" in
"extreme economic circumstances." The Government has also pledged
to introduce an early budget which will include a welfare-to-work
program to tackle unemployment, financed by a levy on excess profits
of privatized utilities industries.
In Italy, real economic activity declined 0.9 percent (SAAR)
in the fourth quarter, mostly accounted for by about one percent
declines in both business fixed investment and government spending,
a very large drop in net exports, and two fewer working days in the
fourth quarter than in the third quarter. Household consumption,
which showed some signs of improvement due to the feed through of
tax incentives on auto purchases, rose a modest one percent.
First-quarter monthly indicators point to a modest pick-up in
activity. Industrial production rose in the first quarter, more
than offsetting the decline in the fourth quarter of last year.
Business sentiment rose significantly in the first quarter.
Consumer confidence rose in January but has since declined slightly,
and remains below its 1996 average. The quarterly unemployment rate
edged up.

IV-19
ITALIAN REAL GDP(percent change from previous period, SAAR)
1995 1996 1996
Q4/Q4 Q4/Q4 Q1 Q2 Q3 Q4
GDP 2.5 0.1 0.8 -1.5 2.2 -0.9
Private Consumption 1.6 0.9 0.6 1.0 0.9 1.0
Investment 8.4 -1.9 -3.9 -1.0 -1.4 -1.2
Government Consumption -0.5 0.4 0.3 1.1 1.3 -1.1
Exports 5.5 3.4 -2.9 7.6 14.1 -4.0
Imports 5.6 -1.4 -8.1 -16.0 11.8 9.2
Total Domestic Demand 2.4 -1.0 -0.3 -6.9 1.2 2.1
Net Exports (contribution) 0.1 1.1 1.1 5.3 1.0 -2.8
Inflationary pressures are likely to remain subdued in light
of continued moderation in wholesale and producer price increases,
reflecting both the appreciation of the lira over the past two years
and the productivity gains due to contained labor costs since 1993.
(Percent changeITALIAN ECONOMIC INDICATORSfrom previous period except where noted, SA)
1996 1997
Q3 4Q Q1 Jan Feb Mar Apr
Industrial Production -0.3 -1.0 1.2 0.3 2.9 0.7 n.a.
Cap. Utilization (%) 75.6 75.1 76.2 ... ... ... ...
Unemployment Rate (%) 12.1 12.0 12.2 ... ... ...
Consumer Confidence 114.1 104.7 109.2 109.9 109.0 108.6 108.1
Bus. Sentiment 2 (%) -1.0 1.3 20.0 21.0 22.0 17.0 n.a.
Consumer Prices3 3.5 2.7 2.4 2.6 2.4 2.2 1.7
Wholesale Prices3 2.0 1.8 0.6 1.0 0.6 0.3 n.a.
1. Level of index, NSA.2. Percent of manufacturing firms having a favorable view
conditions minus those with an unfavorable outlook.3. Percent change from previous year.
of business
On March 27, the government announced a supplemental budget
worth approximately $9 billion (about 3/4 percent of GDP) in
response to the greater-than-projected deficit in the first-quarter.
Key measures of the package include advanced taxation of anticipated
severance fund outlays by private firms in 1997 and 1998, a

IV-20
temporary freeze in severance pay for public sector employees, and
the elimination of advanced payments and cash outlays on public work
projects.
Indicators for the first quarter point to continued strong
growth in Canada. Industrial production, retail sales,
manufacturing shipments, and new orders registered sizeable
increases for the average of January and February over their fourth-
quarter levels. Housing starts in the first quarter registered the
largest quarterly increase in 6 years, but retreated somewhat in
April. The Index of Business Attitudes reached a record high in the
first quarter. Employment was little changed in January and
February, but employment growth resumed in March and April. After
declining to 9.3 percent in March, the unemployment rate rose in
April as labor force participation increased. Consumer price
inflation has eased in recent months and currently is slightly below
the midpoint of the Bank of Canada's target range of 1-3 percent.
CANADIAN ECONOMIC INDICATORS(Percent change from previous period except where noted, SA)
1996 1997
Q3 Q4 Q1 Jan Feb Mar Apr
Industrial Production 2.1 0.6 n.a. 1.1 0.4 n.a. n.a.
Manufacturing Survey:Shipments 3.2 -0.2 n.a. 2.0 0.6 n.a. n.a.
New Orders 2.7 0.3 n.a. 4.6 -2.0 n.a. n.a.
Retail Sales 1.2 2.7 n.a. 1.0 1.1 n.a. n.a.
Housing Starts 3.9 0.4 19.9 8.3 11.0 -2.2 -7.8
Employment 0.1 0.4 0.3 0.0 -0.1 0.4 0.2
Unemployment Rate (%) 9.8 9.9 9.6 9.7 9.7 9.3 9.6
Consumer Prices1 1.4 2.0 2.1 2.2 2.2 2.0 1.7
Consumer Attitudes2 101.7 104.8 106.9 ... . ..Business Confidence3 148.3 153.1 160.1 ... .
1. Percent change from year earlier.2. Level of index, 1991 = 100.3. Level of index, 1977 = 100.

IV-21
EXTERNAL BALANCES(Billions of U.S. dollars, seasonally adjusted)
1996 1996 1997
Q3 Q4 Q1 Dec Jan Feb Mar
Japan: trade 61.4 14.3 16.5 12.9 4.4 5.5 3.8 3.6
current account 66.9 18.9 17.4 15.5 5.1 6.8 4.8 3.9
Germany: trade1 65.4 18.1 19.0 n.a. 5.0 3.5 5.5 n.a.
current account -14.3 -8.4 -1.6 n.a. -0.3 -6.1 -0.9 n.a.
France: trade 18.2 5.2 5.1 n.a. 1.6 2.2 2.0 n.a.
current account 21.9 5.4 5.4 n.a. 1.9 3.9 3.4 n.a.
U.K.: trade -19.4 -4.6 -4.3 n.a. -1.4 -0.9 -1.2 n.a.
current account -0.3 -0.5 1.3 n.a. ... ... ... ...
Italy: trade 41.6 9.6 11.0 n.a. 2.3 n.a. n.a. n.a.
current accountl 41.1 14.7 9.4 n.a. 1.4 n.a. n.a. n.a.
Canada: trade 25.8 7.1 5.3 n.a. 2.1 1.5 1.6 n.a.
current account -1.2 0.2 -1.3 n.a. ... ... ...
1. Not seasonally adjusted.... Data not available on a monthly basis.

IV-22
MAY 15, 1997
Consumer Price Inflation in Selected Industrial Countries(12-month change)
JapanPercent
-~ 9
1 Sv -V- I^
1994 1995 19961992 1993
France
II I ~ 1 ffi 11
Percent-I 12
l1 1 1 l I1992 1993 1994 1995 1996
ItalyPercent
GermanyPercent
1992 1993 1994
United Kingdom
1995 1996
Percent
1 1 I III I I I n ia lL
1992 1993 1994 1995 1996
CanadaPercent
1992 1993 1994 1995 19961992 1993 1994 1995 19961992 1993 1994 1995 1996
I 1 r 1 I . . 1 , .I 1 I . . 1

IV-23
MAY 15, 1997
Industrial Production in Selected Industrial Countries(12-month change)
Japan-- 120
91=100
1992 1993 1994 1995 1996
France
t l, I r 1tIt I I ,, I1992 1993 1994 1995 1996
Italy
1 9 19 9
.. .1 . 1. 1.11111.. , I. .I1992 1993 1994 1995 1996
Germany-- 120
I II _1 _1 I LA~I I E I .1 . I ,1992 1993 1994 1995 1996
United Kingdom
A.x
-, 120
- 90
1992 1993 1994 1995 1996
Canada130
-120
110
100
2 19 9 1 15 19 6 901992 1993 1994 1995 1996

IV-24
Economic Situation in Other Countries
Growth has slowed in Mexico, Argentina, Brazil, and China,
while in Korea and Taiwan it has picked up. Indications are that
Russia is on the verge of a turnaround, as GDP appears to have
leveled off in the first quarter, but concerns about the reliability
of the data remain. Inflation performance has been good in most
cases, surprisingly so in Brazil. Also notable are recent declines
in inflation in Mexico, China and Russia, and a fall in the price
level in Argentina.
Mexico's trade surplus rose in the first quarter despite a
recovery in consumption and the real appreciation of the peso.
China's trade surplus also improved, as did Argentina's. Brazil
continued to record trade deficits in the first quarter. Strong
domestic demand contributed to narrowing of the trade surplus in
Taiwan and a widening of Korea's trade deficit. In Thailand, the
baht has come under renewed downward pressures.
Individual country notes. In Mexico, monthly data show that
the economy continued to grow in the first quarter but at less than
the rapid rate shown in the fourth quarter of 1996. Industrial
production rose 6.2 percent in the first quarter from a year
earlier. That is slower than the 12.8 percent growth rate in the
fourth quarter, reflecting in part the higher base period. The
unemployment rate moved a bit lower in February, to 4.2 percent, and
remained at that level in March. The unemployment rate has declined
from its post-crisis high of 7.6 percent in August 1995 but remains
above its pre-crisis level of about 3-1/2 percent. Other
indications point to some weakness in the first quarter. Retail
sales fell 3.4 percent in the January-February period from the same
period a year earlier. Earnings reported by Mexican corporations
fell short of expectations in most sectors as reported sales
declined by 1.2 percent from the first quarter a year ago.
Consumer price inflation has continued to moderate in recent
months, registering a monthly rate of only 1.1 percent in April.
Increases in public sector prices and minimum wages in December now
appear to have been reflected in consumer prices, and inflation has
returned to the post-crisis lows of last October. The stability of
the peso so far this year and the usually low seasonal price

IV-25
pressures during the summer make it likely that the inflation rate
will remain near its current rate in coming months.
MEXICAN ECONOMIC INDICATORS(Percent change from year earlier except where noted)
1995 1996 1996 1997 1997
Q4 Q1 Feb Mar
Real GDP -6.2 5.1 7.6 n.a.... ...Industrial Production -7.5 10.4 12.8 6.2 8.2 n.a.Unemployment Rate (%) 6.3 5.5 4.7 4.3 4.2 4.2Consumer Prices 1 52.1 27.7 6.1 5.6 1.7 1.2Trade Balance 2 7.0 6.3 0.7 1.4 0.3 0.6Imports2 72.5 89.6 25.5 23.5 7.7 8.2Exports 2 79.5 95.9 26.2 24.9 8.0 8.7Current Account 2 -1.6 -1.8 -1.4 n.a. .1. Percentage change from previous period.2. Billions of U.S. dollars, NSA
Recent trade data have been stronger than expected despite the
continued real appreciation of the peso and the recovery of domestic
demand. After declining in the fourth quarter, the trade surplus
rebounded in the first quarter to nearly the level of the third
quarter, even as oil exports declined nearly 13 percent from the
previous quarter (due in part to a decline in oil prices). The
trade surplus for March showed a particularly large rise, with the
gains coming largely from increased automotive and agricultural
exports.
In Argentina, the growth in economic activity continues but at
a slower pace than the very high rates seen at the end of 1996 and
the beginning of 1997. Industrial production in the first quarter
was 8 percent above a year earlier, down from nearly 12 percent in
the fourth quarter of 1996. Somewhat unexpectedly, consumer prices
fell in March and April, offsetting the increase in prices that
occurred in the first two months of this year. Accordingly,
consumer price inflation over the past twelve months was
0.8 percent. The first quarter fiscal deficit of the central
government was $1 billion, equal to the target for this quarter
agreed upon with the IMF.
Strong Brazilian demand and a record harvest continue to boost
Argentine exports; in the first quarter of 1997, they were up 19
percent over a year ago. However, imports in the first quarter were

IV-26
ARGENTINE ECONOMIC INDICATORS(Percent change from year earlier except where noted)
1995 1996 1996 1997 1997
Q4 Q1 Mar Apr
Real GDP -4.6 4.4 9.2 n.a. ...Industrial Production (SA) -6.2 3.4 11.7 8.0 4.1 n.a.Unemployment Rate (%)2 17.4 17.2 17.3 ... ...Consumer Prices 1 1.5 0.2 0.3 0.3 -0.5 -0.3Trade Balance 3 3.0 3.8 0.7 -0.2 0.0 n.a.Current Account 3 -1.6 n.a. n.a. n.a. ...1. Percentage change from previous period.2. Unemployment figures available only in May andOctoberannual figure is the average of the two surveys.3. Billions of U.S. dollars.
of each year. The
up 42 percent over the same period as a result of a stronger dollar
and, hence, a stronger peso. Consequently, the trade balance in the
first quarter shifted to a small deficit from a small surplus a year
earlier. International reserves (excluding gold) were $17 billion
at the end of April, roughly 25 percent higher than a year ago.
Taking advantage of relatively favorable borrowing conditions,
the Argentine government has been placing large amounts of debt in
international capital markets recently. The government anticipates
raising about $9 billion in international capital markets for 1997
financing needs, of which about two thirds has already been
achieved. In April, in a move that was widely expected, Standard
and Poor's upgraded its sovereign debt rating for Argentina to BB
from BB-. However, other rating agencies have not followed suit.
In Brazil, industrial production (s.a.) fell by 2.1 percent in
March, after very little change in January and February. Retail
sales have been volatile in recent months, making it difficult to
determine whether there is any clear trend. Economic activity in
recent months has been boosted to some extent by a good agricultural
harvest. Inflation has remained remarkably low; consumer prices
rose only 8.2 percent in the year through April 1997, making it one
of the lowest twelve-month increases since the 1950s.
Brazil continued to record trade deficits in March and April,
bringing the deficit for the year through April to $4 billion,
compared with near balance over the same period in 1996. Import
growth has been very strong; imports over the January-April period
were 30 percent higher than a year earlier. Some of the
deterioration in the trade balance can be attributed to the stronger

IV-27
BRAZILIAN ECONOMIC INDICATORS(Percent change from year earlier except where noted)
1995 1996 1996 1997 1997
Q4 Q1 Mar AprReal GDP 4.2 2.9 5.4 n.a. ...Industrial Production (SA) 1 3.6 2.3 0.0 -2.3 -2.1 n.a.Open Unemployment Rate (%) 4.6 5.4 4.5 6.0 6.0 n.a.Consumer Prices 2 22.0 9.4 1.0 2.0 0.7 0.6TradeBalance 3 -3.2 -5.5 -3.9 -3.1 -1.0 -0.9Current Account 3 -17.8 -24.3 -10.7 -6.8 -2.4 -2.51. Annual data are from national income accounts.2. INPC, Percentage change from previous period. Annual data are Dec/Dec.3. Billions of U.S. dollars, NSA
dollar, and, hence, the stronger currency. (Under the government's
stabilization program, the central bank limits the extent to which
it will allow the real to depreciate against the dollar.) In April,
the government tightened credit restrictions on imports and in early
May increased a tax on other forms of credit that were aimed at
reducing the demand for automobiles and other durable goods, the two
major sources of upward pressures on imports.
The current account deficit in the first quarter exceeded the
capital account surplus by $1 billion, resulting in a drawdown in
the central bank's international reserves. The desire to maintain
interest rates high enough to attract capital from abroad (and thus
avoid further drawdowns in reserves) also prompted the central bank
in late April to leave its two key lending rates to financial
institutions unchanged in May. This represents a departure from the
practice of gradually reducing interest rates since early 1995,
after the central bank no longer confronted strong downward
pressures on the real. International reserves stood at $59 billion
at the end of March, down slightly since the end of 1996, but up
considerably from $32 billion in early 1995.
On May 6, the government sold its controlling stake in CVRD
(Companha Vale do Rio Doce), a mining conglomerate, for $3 billion.
The sale was the largest of a government-owned firm to date in Latin
America. The sale of CVRD has symbolized the Cardoso government's
determination to enact needed fiscal and other economic reforms that
are crucial to the long-run success of its stabilization program.
Privatization and other proposed reforms have been extremely
controversial.

IV-28
In Venezuela, recent labor market developments have increased
uncertainty about the short-term economic outlook. In mid-March,
the government signed an agreement on a severance payment reform
with unions and private sector representatives that replaces the
present severance payment system with one that is far less generous
by international standards. Because the agreement, which is
expected to be approved by Congress, will reduce the cost of firing
workers in the future, the reform is expected to increase labor
productivity and growth in the long run. However, existing
employees will receive very large payoffs from the government over
the next few years, which Finance Minister Matos estimates will cost
the government 10 percent of GDP. The huge fiscal cost of the
reform has thus raised concerns that the government will resort to
more inflationary finance of fiscal deficits in the future.
(Although the government ran a sizeable fiscal surplus in 1996, it
was due to a windfall generated by the rise in oil prices that
year.)
VENEZUELAN ECONOMIC INDICATORS(Percent change from year earlier except where noted)
1995 1996 1996 1997 1997
Q4 Q1 Mar Apr
Real GDP 2.2 -1.6 ......... ...
Unemployment Rate (%) 10.8 11.8 12.4 ...... .
ConsumerPrices 1 56.7 103.3 10.6 6.6 1.6 2.4
Trade Balance 2 -6.0 -5.1 -1.2 n.a. n.a. n.a.Current Account 2 2.6 n.a. ... ...... ...1. Percentage change from previous period.2. Billions of U.S. dollars, NSA, non-oil trade balance.
Other recent developments in the labor market have also fueled
inflationary pressures. The minimum wage was increased by 44 percent
on May 1 and public employees salaries were increased by 75 percent
on average in February. Thus, although consumer prices posted their
lowest monthly increases in five years in March and April,
inflationary expectations are running high.
Real GDP declined year-over-year by 1.6 percent in 1996. The
recession led to a narrowing of the non-oil trade deficit from $6
billion in 1995 to about $5 billion in 1996. International reserves
(excluding gold) at the end of April were $12 billion, compared with
$6.4 billion a year ago. At the end of April, the IMF approved a

IV-29
Venezuelan request to extend its stand-by agreement, which is due to
expire in July, for another eighteen months.
China's soft landing continued in the first quarter, as growth
slowed slightly but remained high, and inflation moderated. GDP
rose 9.4 percent in the first quarter of 1997, the lowest quarterly
growth rate reported since 1992. Industrial production, in
particular, moderated. Twelve-month consumer price inflation of 4.0
percent in March was at its lowest level since 1991. In the first
four months of 1997, China recorded a trade surplus of $10.3
billion, compared with a deficit of $0.6 billion in the year earlier
period; the value of exports rose 27 percent and the value of
imports fell 2 percent from the year-earlier period. The surging
exports and falling imports appear to reflect in part a base-period
effect, since the beginning of 1996 had the reverse pattern of
falling exports and surging imports. International reserves reached
$114 billion in March, up $7 billion since the end of 1996.
CHINESE ECONOMIC INDICATORS(Percent change from year earlier except where noted)
1995 1996 1996 1997 1997
Q4 Q1 Mar Apr
Real GDP 1 10.5 9.7 9.7 9.4 ... ...
Industrial Production 17.8 15.6 15.6 13.0 16.1
Consumer Prices 10.1 7.0 7.0 4.0 4.0 ...
TradeBalance 2 16.7 12.2 4.0 6.8 3.0 3.51. Cumulative from the beginning of the year2. Billions of U.S. dollars, NSA
In Taiwan, inflation has plummeted in recent months, with
consumer prices rising only 0.5 percent in the twelve months ending
in April. Industrial production grew strongly in the first quarter,
following strong growth at the end of 1996. Taiwan ran a trade
surplus of $1.6 billion in the first four months of 1997, down from
the surplus of $3.4 billion in the year-earlier period. Exports
rose 3 percent, while imports rose 9 percent. Foreign exchange
reserves were $89 billion at the end of March, virtually unchanged
since the beginning of the year.

IV-30
TAIWAN ECONOMIC INDICATORS(Percent change from year earlier except where noted)
1995 1996 1996 1997 1996
Q4 Q1 Mar Apr
Real GDP 6.1 5.7 6.6 ......Industrial Production 4.2 1.6 4.8 5.4 10.0 ...Consumer Prices 4.6 2.5 2.5 1.1 1.1 0.5Trade Balance1 8.3 14.3 4.0 1.8 0.6 -0.2Current Account 1 5.0 10.5 2.8 ...... ..1. Billions of U.S. dollars, NSA
An epidemic of foot-and-mouth disease hit Taiwan's pig stocks
in March, leading Taiwan to ban the export of pork. The decline in
pork exports contributed to the April trade deficit, as exports fell
3 percent compared with April 1996; the deficit was only Taiwan's
fifth monthly trade deficit since 1983, and the first since 1995.
In Korea, more financial scandals have appeared in the wake of
the collapse of Hanbo Steel Company in January. Sammi Steel, the
country's third-largest steelmaker, defaulted on loan payments on
March 19. This was followed a month later by the near-bankruptcy of
the Jinro Business Group; the group's creditors have agreed to
provide an emergency loan package to allow it to restructure its
operations. The ongoing investigation into the collapse of Hanbo
Steel has led to the imprisonment of many top government officials
and bankers on charges of graft and embezzlement. The son of
President Kim Young-sam was among those who testified concerning
their alleged involvement in the financial scandal.
KOREAN ECONOMIC INDICATORS(Percent change from year earlier except where noted)
1995 1996 1996 1997 1997
Q4 Q1 Mar Apr
Real GDP 9.0 6.8 6.6 n.a. n.a. n.a.
Industrial Production 11.7 8.4 9.8 7.0 9.1 n.a.
Consumer Prices 4.5 5.0 4.8 4.7 4.5 4.3
TradeBalancel -4.7 -15.3 -3.9 -5.4 -1.4 n.a.
Current Account 1 -8.9 -23.7 -6.2 -7.9 -2.3 n.a.1. Billions of U.S. dollars, NSA
The current account deficit jumped to nearly $8 billion in the
first quarter, compared with a deficit of $4.6 billion a year
earlier. However, the monthly figures indicate a downward trend
($2.3 billion in March versus $3.1 billion in January); customs-

IV-31
cleared trade numbers for April indicate a continuation of the
trend. Industrial production in March grew at a robust rate of just
over 9 percent (year-over-year), with some signs of pickup in key
industries such as semiconductors. Inflation remained at moderate
levels in April.
In Thailand, the baht has come under renewed strong downward
pressures, prompting strong intervention support. On May 14 the
Bank of Thailand issued the following statement: "Today the Bank of
Thailand and the Monetary Authority of Singapore jointly intervened
in the foreign exchange market to stabilize the value of the Thai
baht. This concerted operation is aimed at stemming excessive
speculative activities which may lead to disorderly conditions in
the Thai and regional financial markets. Other appropriate measures
will be taken as necessary." Also on May 14, the overnight
interbank interest rate rose sharply from 11.5 percent to 18
percent. On May 15, the central bank was reported to have raised
short-term interest rates to 25 percent.
Since 1984, the baht has been tied to a basket of currencies
with a heavy weight on the dollar, but a number of adverse
developments over the past year have shaken investor confidence and
put downward pressures on the currency. Thailand has been running
large current account deficits (8 percent of GDP in 1995 and 1996),
and the banking sector has experienced a rise in non-performing
loans as a result of plunging real estate prices. The stock market
index fell by 25 percent in 1996, and has plunged by a further 30
percent since the beginning of this year. The rise in interest
rates in February during an earlier attack against the currency
weakened the banking sector further. In early April, Moody's
downgraded Thailand's long-term foreign debt from A2 to A3, citing
Thailand's high current account deficit and the fragility of the
banking sector. Despite Thailand's economic problems, the overall
economy managed to grow by almost 7 percent in 1996, and the most
recent consensus forecast called for 6 percent growth in 1997.
In Russia, President Yeltsin has made a strong return from his
eight-month illness, and the economy seems to be on the verge of a
turnaround. Year-on-year GDP growth rates were very slightly
positive for January and February, although there is some concern
that the figures are an artifact of a change in methodology.

IV-32
Inflation continues to decline; for the first four months of 1997,
it came in at 6.3 percent, higher than would be consistent with the
targeted annual rate of 12 percent but still lower than last year's
inflation for the same period. The ruble-dollar exchange rate has
continued to remain well within the corridor set by the Central
Bank; on May 6, the ruble traded at 5,755 to the dollar.
RUSSIAN ECONOMIC INDICATORS(Percent change from year earlier except where noted)
1995 1996 1996 1997 1997
Q4 Q1 Mar Apr
Real GDP -4 -6 -6 0.2 -0.3 n.a.Industrial Production -3 -5 -5 n.a. 0.4 n.a.
Consumer Prices 1 7 1.7 2 2 1.4 1.0
Ruble Depreciation1 2 1.5 1 1 0.9 0.3
Trade Balance 2 18.3 n.a. n.a. n.a. n.a. n.a.
Current Account 2 5.7 n.a. n.a. n.a. n.a. n.a.1. Monthly rate.2. Billions of U.S. dollars.
Yeltsin's return to full-time work may give a needed jolt to
economic reform, which had been stalled. In March he reshuffled his
cabinet, bringing in well-known reformers, including the dynamic
former governor of Nizhny, Novgorod Boris Nemtsov, and the effective
but unpopular Anatoly Chubais. Nemtsov has begun to tackle the
necessary but difficult task of restructuring Russia's government
monopolies.
The fiscal situation is still problematic. Tax revenues for
the first quarter of 1997 were less than 60 percent of projections.
Wage, pension, and tax arrears continue to accumulate. While some
proposals to help firms settle their tax arrears have been made, a
long-term resolution of the fiscal problems will not occur without
both comprehensive tax reform and restructuring or closure of loss-
making firms. In late April, a sequestration plan for bringing
expenditures in line with reduced revenue and a tax reform package
were submitted to the Duma.
The fiscal reform measures removed important obstacles to the
continuation of Russia's three-year, $10 billion IMF Extended Fund
Facility, which had been held up since late 1996. The IMF reached
an agreement with Russia on a plan for 1997 in late April, and the
IMF Executive Board is expected to vote on the plan on May 16. The

IV-33
IMF and Russia have agreed to move from monthly to quarterly
reviews.