fomc 20050322 g bpt 220050316
TRANSCRIPT

Content last modified 03/31/2011.
Prefatory Note The attached document represents the most complete and accurate version available based on original files from the FOMC Secretariat at the Board of Governors of the Federal Reserve System. Please note that some material may have been redacted from this document if that material was received on a confidential basis. Redacted material is indicated by occasional gaps in the text or by gray boxes around non-text content. All redacted passages are exempt from disclosure under applicable provisions of the Freedom of Information Act.

Confidential (FR) Class III FOMC
Part 2 March 16, 2005
CURRENT ECONOMICAND FINANCIAL CONDITIONS
Recent Developments
Prepared for the Federal Open Market Committeeby the staff of the Board of Governors of the Federal Reserve System

Confidential (FR) Class III FOMC
March 16, 2005
Recent Developments
Prepared for the Federal Open Market Committeeby the staff of the Board of Governors of the Federal Reserve System

Domestic NonfinancialDevelopments

Domestic Nonfinancial Developments
Overview The economy appears to be expanding at a solid pace this quarter. Consumer spending is on track for another brisk gain, and residential construction expenditures continue to trend higher. In addition, apart from motor vehicle expenditures, spending on equipment and software appears to have entered 2005 with considerable thrust. Industrial production increased moderately in January and February. More broadly, firms across the economy continued to add employees at a steady pace early this year. Both overall and core consumer prices moved up in January after no change in December. Labor Market Developments The labor market continued to improve in February. Private nonfarm payroll employment rose 229,000 last month for the fifth consecutive monthly increase of more than 100,000 jobs—the longest such stretch since 1999.1 Job gains last month were widespread across industries. Manufacturing employment moved up 20,000 after five straight months of decline. Construction employment bounced back after having been held down by inclement weather in January, and retail trade registered a large increase as well. Employment also rose briskly in February in the services sector with gains in most services categories. The workweek was revised down to 33.7 hours in December and is reported to have remained at that level through February. Still, aggregate hours increased 0.2 percent in February to a level 0.4 percent above the fourth-quarter average. In the household survey, the unemployment rate moved back up to its December level of 5.4 percent, and the labor force participation rate held steady at 65.8 percent. The employment-population ratio, which combines these two measures, fell back to 62.3 percent in February, a level below its fourth-quarter average but above the lows reached in the middle of 2003.2 Smoothing through the recent fluctuations in the data, both the unemployment rate and the employment-population ratio suggest that while slack remains in the labor market, it is diminishing.
1 The January employment report included the annual benchmark revision to the payroll survey, which
raised the level of total nonfarm payroll employment by 161,000 in December. The revised data have been incorporated in the BLS measures of hours worked in the nonfarm business sector, which are used in estimating productivity.
2 In contrast to the increase in nonfarm payroll employment, household employment was about unchanged on net in January and February. Over the past twelve months, payroll employment has risen 2.4 million, and household employment has risen 1.8 million.

II-2
1997 1998 1999 2000 2001 2002 2003 2004-400
-300
-200
-100
0
100
200
300
400
500
-400
-300
-200
-100
0
100
200
300
400
500Thousands
Feb.
3-month moving average
Changes in Private Payroll Employment
1997 1998 1999 2000 2001 2002 2003 200494
96
98
100
102
104
106
94
96
98
100
102
104
1062002 = 100
Feb.
Aggregate Hours of Production orNonsupervisory Workers
Changes in Employment(Thousands of employees; seasonally adjusted)
2004 2005
Measure and sector 2004 Q2 Q3 Q4 Dec. Jan. Feb.
Average monthly change Monthly change
Nonfarm payroll employment (establishment survey) 183 231 134 190 155 132 262 Private 171 235 98 182 161 110 229 Previous 169 235 98 175 140 134 ... Manufacturing 3 18 3 -6 -3 -20 20 Construction 23 19 14 29 26 0 30 Wholesale trade 7 8 6 4 4 -4 3 Retail trade 13 13 -8 13 -4 6 30 Transportation and utilities 9 10 8 5 -1 26 6 Information -2 5 -8 0 -6 -7 -2 Financial activities 12 15 11 15 21 21 12 Professional and business services 45 77 33 53 63 24 81 Temporary help services 15 25 18 14 -5 5 30 Nonbusiness services1 59 67 37 67 58 62 44 Total government 12 -4 35 8 -6 22 33 Total employment (household survey) 146 250 123 210 -137 85 -97 Memo:Aggregate hours of private production workers (percent change)2 2.4 2.6 2.4 2.4 .1 .2 .2 Average workweek (hours)3 33.7 33.7 33.7 33.7 33.7 33.7 33.7 Manufacturing (hours) 40.8 40.8 40.8 40.6 40.5 40.7 40.5
1. Nonbusiness services comprises education and health, leisure and hospitality, and "other." 2. Establishment survey. Annual data are percent changes from Q4 to Q4. Quarterly data are percent changes from precedingquarter at an annual rate. Monthly data are percent changes from preceding month. 3. Establishment survey. ... Not applicable.

II-3
1994 1995 1996 1997 1998 1999 2000 2001 2002 2003 2004 200565.6
65.8
66.0
66.2
66.4
66.6
66.8
67.0
67.2
67.4Percent
3.5
4.0
4.5
5.0
5.5
6.0
6.5
7.0Percent
Unemployment rate (right scale)
Participation rate (left scale)
Feb.
Labor Force Participation Rateand Unemployment Rate
1994 1996 1998 2000 2002 200461.0
61.5
62.0
62.5
63.0
63.5
64.0
64.5
65.0
61.0
61.5
62.0
62.5
63.0
63.5
64.0
64.5
65.0Percent
Feb.
Employment-Population Ratio
1994 1996 1998 2000 2002 20042.0
2.5
3.0
3.5
4.0
2.0
2.5
3.0
3.5
4.0Percent
Feb.
Persons Working Part-Timefor Economic Reasons (Percent of household employment)
Selected Unemployment and Labor Force Participation Rates(Percent; seasonally adjusted)
2004 2005
Rate and group 2004 H1 Q4 Dec. Jan. Feb.
Civilian unemployment rate16 years and older 5.5 5.6 5.4 5.4 5.2 5.4 Teenagers 17.0 16.9 17.1 17.6 16.3 17.5 20-24 years old 9.4 9.6 9.3 8.9 9.5 10.1 Men, 25 years and older 4.4 4.5 4.3 4.4 4.0 4.1 Women, 25 years and older 4.4 4.5 4.2 4.2 4.1 4.2
Labor force participation rateTotal 66.0 66.0 66.0 66.0 65.8 65.8 Teenagers 43.8 43.7 44.1 44.1 43.3 43.2 20-24 years old 75.0 74.9 75.3 75.0 74.7 74.2 Men, 25 years and older 75.3 75.3 75.3 75.2 75.1 75.2 Women, 25 years and older 59.3 59.2 59.2 59.3 59.2 59.2

II-4
Labor Market Indicators
1990 1992 1994 1996 1998 2000 2002 20041.5
2.0
2.5
3.0
3.5
4.0
4.5Millions
250
300
350
400
450
500
550Thousands
4-week moving average
Initial claims(right scale)
Insured unemployment(left scale)
Mar. 5
Feb. 26
Unemployment Insurance
1990 1992 1994 1996 1998 2000 2002 200440
60
80
100
120
140Index
20
40
60
80
100
120Index
Feb.
Conference Board(left scale)
Michigan SRC(right scale)
Note. The proportion of households expecting labormarket conditions to improve, minus the proportion expecting conditions to worsen, plus 100.
Expected Labor Market Conditions
1990 1992 1994 1996 1998 2000 2002 200450
70
90
110
130
150
50
70
90
110
130
150Index
Feb.
Note. The proportion of households believing jobsare plentiful, minus the proportion believing jobs arehard to get, plus 100. Source. Conference Board.
Job Availability
2001 2002 2003 20041.8
2.0
2.2
2.4
2.6
2.8
3.0
3.2
3.4
3.6Percent of private employment
30
40
50
60
70
80
90
100
1101999 = 100
Jan.
Job openings (left scale)
Help wanted index(right scale)
Source. For job openings, Job Openings andLabor Turnover Survey; for help wanted index,Conference Board.
Job Openings and Help Wanted Index
2001 2002 2003 2004 20055
10
15
20
25
30Percent
3.0
3.2
3.4
3.6
3.8
4.0
4.2Percent of private employment
Jan.
Q2
Hiring Plans* (left scale)
Hires(right scale)
*Percent planning an increase in employment minuspercent planning a reduction. Source. For hires, Job Openings and Labor TurnoverSurvey; for hiring plans, Manpower Employment OutlookSurvey.
Hiring and Hiring Plans
1990 1992 1994 1996 1998 2000 2002 20045
10
15
20
25
30
35
40
5
10
15
20
25
30
35
40Percent
Source. National Federation of Independent Businesses.
Feb.
3-month moving average
Note. Percent of firms surveyed with at least one"hard to fill" job opening.
Positions Hard to Fill

II-5
Most other labor market indicators appear to support that impression. The percentage of individuals working part time for economic reasons dropped sharply in February and now stands 0.2 percentage point below its average level in 2004. Similarly, both the percentage of firms with hard-to-fill positions (from a survey by the National Federation of Independent Businesses (NFIB)) and the percentage of households believing jobs are plentiful rather than hard to get (from a survey by the Conference Board) have improved recently. In addition, the help-wanted index ticked up to a recent high in January, and job openings as measured in the Job Openings and Labor Turnover Survey (JOLTS) have moved up, on balance, over the past year. Most measures of hiring and job separation point to continued solid employment growth in coming months. The JOLTS hiring rate moved up toward the end of last year, and both the Manpower and the NFIB measures of hiring plans have remained at relatively high levels. In addition, initial claims for unemployment insurance have averaged 313,000 over the past four weeks, well below the levels prevailing toward the end of last year. In contrast, household expectations for the labor market as measured by both the Conference Board and the Michigan surveys were somewhat less optimistic in February. The Bureau of Labor Statistics reported that output per hour for all persons in the nonfarm business sector increased at an annual rate of 2.1 percent in the fourth quarter; the staff’s current estimate is 2.8 percent. Over the four quarters of 2004, we estimate that productivity rose a little under 3 percent, a deceleration from the outsized gain of 5½ percent in 2003 but close to the average rate of increase since 1995.
Labor Output per Hour(Percent change from preceding period at an annual rate;
seasonally adjusted)
2004 2003:Q4to
Sector 2001 2002 2003 Q2 Q3 Q4 2004:Q4
Nonfarm business All persons 3.3 3.5 5.5 3.9 1.3 2.1 2.8 All employees1 3.4 3.7 6.0 3.4 2.2 1.8 2.6Nonfinancial corporations2 1.9 4.1 5.4 3.3 4.9 n.a. n.a.
Note. Annual changes are from fourth quarter of preceding year to fourth quarter of year shown. 1. Assumes that the growth rate of hours of non-employees equals the growth rate of hours ofemployees. 2. All corporations doing business in the United States except banks, stock and commodity brokers,and finance and insurance companies. The sector accounts for about two-thirds of business employment. n.a. Not available.

II-6
Selected Components of Industrial Production (Percent change from preceding comparable period)
Proportion 2004 2004 20052004 20041
Component (percent) Q3 Q4 Dec. Jan. Feb.
Total 100.0 4.3 2.7 4.4 .8 .1 .3Previous 100.0 4.1 2.7 4.0 .7 .0 ...
Manufacturing 81.9 5.1 4.0 4.6 .5 .5 .5 Ex. motor veh. and parts 74.7 5.3 4.5 3.5 .5 .7 .1 Ex. high-tech industries 70.2 4.4 3.8 2.8 .4 .5 .0
Mining 8.3 -2.0 -2.0 -3.3 1.1 .0 .2Utilities 9.8 2.4 -4.7 9.4 2.4 -2.8 -1.1
Selected industriesHigh technology 4.5 18.9 15.6 15.3 2.1 3.2 1.5 Computers 1.0 6.8 -1.0 13.7 1.0 .8 .7 Communications equipment 1.2 9.6 22.3 13.2 1.0 4.5 2.3 Semiconductors2 2.3 30.4 20.0 17.1 3.2 3.5 1.5
Motor vehicles and parts 7.2 2.9 -1.1 16.2 1.1 -1.5 5.1
Market groups excludingenergy and selected industriesConsumer goods 22.0 3.6 1.4 3.2 .1 .4 .6 Durables 4.3 1.3 -2.9 -1.0 .0 -.2 .5 Nondurables 17.7 4.2 2.5 4.2 .1 .5 .6
Business equipment 7.7 9.2 11.7 1.7 1.2 .5 -.1Defense and space equipment 1.9 6.1 9.1 5.0 .6 .3 .5
Construction supplies 4.3 4.0 3.6 .6 .4 .3 -.3Business supplies 8.1 3.2 1.6 1.0 .6 .9 -.7
Materials 25.2 3.9 4.3 3.1 .1 .5 -.2 Durables 13.9 4.7 5.5 4.5 -.1 .8 -.1 Nondurables 11.3 2.9 2.9 1.4 .3 .3 -.5
1. From fourth quarter of preceding year to fourth quarter of year shown. 2. Includes related electronic components. ... Not applicable.
Annual rate Monthly rate
Capacity Utilization (Percent of capacity)
1972- 1990- 2004 20052004 1982 1991
Sector average low low Q2 Q3 Q4 Jan. Feb.
Total industry 81.0 70.8 78.6 77.9 78.2 78.8 79.2 79.4
Manufacturing 79.8 68.5 77.2 76.5 77.0 77.6 78.2 78.5 High-tech industries 78.3 74.1 74.3 69.7 69.9 69.9 71.8 72.0 Excluding high-tech industries 79.9 68.2 77.3 77.2 77.8 78.5 79.0 79.3
Mining 87.1 78.6 83.5 86.6 86.3 85.7 86.9 87.2Utilities 86.8 77.7 84.2 85.1 83.7 85.2 84.1 83.1

II-7
Industrial Production After increasing 0.1 percent in January, total industrial production (IP) moved up 0.3 percent in February. A surge in the production of motor vehicles and parts contributed importantly to the increase in total IP last month. Mining output also edged up, but utilities output dropped for a second consecutive month as a result of unseasonably warm weather. Manufacturing IP excluding motor vehicles edged up just 0.1 percent in February. But that modest increase came on the heels of four solid monthly gains, and the diffusion index of three-month percent changes for IP remained elevated, an indication that there has been fairly widespread improvement in the factory sector in recent months. The manufacturing operating rate moved up for the fifth consecutive month, rising to 78.5 percent, but was still 1.3 percentage points below its 1972-2004 average. Motor vehicle assemblies rose 700,000 in February to an annual rate of 12.6 million units. In March, however, assemblies are scheduled to fall back to an annual rate of 12.2 million units, a decline that would shave about 0.1 percentage point from the change in IP this month. Elsewhere in transportation, the output of commercial aircraft expanded for the second consecutive month in February. Boeing recently announced an increase in planned assemblies in 2006, a move that suggests that the level of production in this category should increase at a brisk pace throughout the year. Overall production of high-tech goods rose 1½ percent in February. Although the output of communications equipment jumped more than 2¼ percent for a second consecutive month, production increases for computers continued at the relatively sluggish pace of recent months. Semiconductor output rose at a moderate clip in February after having accelerated noticeably in the previous three months. The stepped-up gains for semiconductors coincide with reports from industry contacts that the excess inventories that had accumulated last year at semiconductor manufacturers and the electronics firms that use their chips have been largely eliminated. Although orders for semiconductor equipment have dropped lately, rising capacity utilization rates for semiconductor manufacturers could signal a recovery in equipment sales later in the year. Consistent with this interpretation, Intel’s midquarter update to its earnings forecast for the first quarter points to a more rapid pace of real semiconductor output in coming months. Intel, along with IBM and other manufacturers, also has bullish plans to press ahead with the release of next-generation chips, especially for high-end servers.

II-8
Indicators of High-Tech Manufacturing Activity
1999 2000 2001 2002 2003 2004
100
200
400
600
800
100012001997 = 100, ratio scale
Computers
Communications equipment
Semiconductors
Feb.
Industrial Production in the High-Tech Sector
1999 2000 2001 2002 2003 2004 200540
50
60
70
80
90
100
110
40
50
60
70
80
90
100
110Percent
Feb.
Semiconductors
Electronic components
Capacity Utilization for Semiconductorsand Electronic Components
1999 2000 2001 2002 2003 2004 2005
0.5
1.0
1.5
2.0
2.5
3.03.5
Billions of dollars, ratio scale
Orders
Shipments
Jan.
Source. Semiconductor Equipment and MaterialsInternational.
Semiconductor Manufacturing Equipment Orders and Shipments
1999 2000 2001 2002 2003 2004 20055.0
5.5
6.0
6.5
7.0
7.5
8.0
8.5
9.09.5
Note. Q1 is the range of Intel’s guidance as of Mar. 10, 2005.FRB seasonals. Source. Intel and Semiconductor Industry Association.
Worldwide MPU shipments
Intel revenue
Billions of dollars, ratio scale
Q4
Q1
Microprocessor Unit (MPU) Shipmentsand Intel Revenue
1999 2000 2001 2002 2003 2004 20050.30
0.36
0.42
0.48
0.54
0.60
0.66
0.720.78
9
10
11
12
13
14
15
16
17
Q1
PCs (right scale)
Servers (left scale)
Millions of units, ratio scale Millions of units, ratio scale
Note. FRB seasonals. Values for Q1 are Gartner forecasts.Source. Gartner.
Q1
U.S. Personal Computer and Server Sales
45
50
55
60
65
70
75
45
50
55
60
65
70
75Index
2001 2002 2003 2004 Note. The diffusion index equals the percentage of respon-dents planning to increase future spending plus one-half thepercentage of respondents planning to leave future spendingunchanged. Source. CIO Magazine.
Data networking equipment
Computer hardware
Feb.
CIO Magazine Future SpendingDiffusion Indexes

II-9
Indicators of Manufacturing Activity
1999 2000 2001 2002 2003 2004 200510
11
12
13
14
15
10
11
12
13
14
15Millions of units
Annual rate
+ Mar.
Note. March value is based on Ward’s latest productionschedules.
Motor Vehicle Assemblies
84
88
92
96
100
104
108
112
116
120
124
84
88
92
96
100
104
108
112
116
120
1241997=100
July Jan. July Jan. July Jan. July Jan. July
+ Mar.
2001 2002 2003 2004Note. March value for electricity generation is based on
weekly data.
Electricity generation
Natural gas transmission
Utilities Production
1999 2000 2001 2002 2003 2004 200525
30
35
40
45
50
55
60
65
70
75
25
30
35
40
45
50
55
60
65
70
75Index
Feb.
3-month change
Note. The diffusion index equals the percentage ofseries that increased over 3 months plus one-half the percentage that were unchanged.
Industrial Production Diffusion Index
1998 2000 2002 2004 2006405060708090
100110120130140150160
405060708090100110120130140150160
1997 = 100
3-month moving average
Note. 1998 price-weighted index. Actual completions equaldeliveries plus the change in the stock of finished aircraft.Data through February are actual completions; the remainderare Boeing scheduled assembly rates.
Boeing Commercial Aircraft Completions
1999 2000 2001 2002 2003 2004 2005
30
35
40
45
50
55
60
65
70
75
80Diffusion index
FRB Philadelphia survey
ISM
Note. The diffusion index equals the percentage of respondents reporting greater levels of new orders plus one-half the percentage of respondents reporting that new orders were unchanged.
Feb.
New Orders: ISM and FRB Philadelphia Surveys
2002 2003 2004-4
-3
-2
-1
0
1
2
3
4
-4
-3
-2
-1
0
1
2
3
4Percent
Jan.
3-month moving average
Change in Real AdjustedDurable Goods Orders

II-10
Reinforcing this optimism, Gartner’s preliminary estimates point to a pickup in sales for both PCs and servers in the first quarter. Nevertheless, many industry analysts remain cautious about the high-tech outlook. For semiconductors, our contact at the Semiconductor Industries Association (SIA) expects nominal sales to increase at a rate in the high single-digits in 2005, roughly half the long-run historical average. For computers and communications equipment, CIO Magazine’s diffusion indexes for future spending on computer hardware and on networking equipment have trended down in recent months, although these indexes remain elevated. Echoing this view, Gartner’s IT Watch for February predicts cautious business spending in 2005 on computers and communications equipment. The output of business equipment excluding high-tech, transportation, and energy production ticked down in February after having posted large gains in the previous two months. The production of both construction and business supplies, as well as materials, also declined in February. In contrast, the production of consumer goods increased as production of both durables and nondurables moved up. Most of the forward-looking indicators of production, as well as reports from the staff’s industry contacts, suggest that activity in the industrial sector will continue to expand at a moderate pace in the coming months. For example, the three-month moving average of the staff’s series on real adjusted durable goods orders advanced 1.8 percent in January. And although the diffusion index of new orders as measured by the Institute for Supply Management has trended down from the high levels in late 2003, it nevertheless remained elevated last month; in addition, the index of new export orders moved up. Finally, the various regional diffusion indexes are still at levels that suggest further gains in production. Motor Vehicles Sales of light vehicles dropped sharply in the first two months of the year to an average annual rate of 16.3 million units, down nearly one million units from the average pace in the second half of last year. The decline was concentrated in the retail sector, most notably in the sales of light trucks. The automakers attributed some of the weakness in January and February to a payback from the unusually high sales rate in December. In addition, part of the decline likely reflected the continued paring back of incentives. Average incentives per vehicle have been falling since October, and the level of incentives in early March was the lowest in about two years. Confidential reports from

II-11
Sales of Light Vehicles(Millions of units at an annual rate; FRB seasonals)
2004 2004 2005
Category 2004 Q2 Q3 Q4 Dec. Jan. Feb.
Total 16.9 16.5 17.1 17.2 18.3 16.2 16.3
Autos 7.5 7.5 7.3 7.7 8.3 7.4 7.4 Light trucks 9.4 9.1 9.7 9.5 10.1 8.8 8.9
North American1 13.5 13.1 13.8 13.6 14.6 13.0 12.9 Autos 5.4 5.3 5.3 5.4 5.9 5.4 5.3 Light trucks 8.1 7.9 8.5 8.2 8.7 7.6 7.6
Foreign-produced 3.4 3.4 3.3 3.6 3.7 3.2 3.4 Autos 2.1 2.2 2.0 2.3 2.3 2.0 2.1 Light trucks 1.2 1.2 1.2 1.3 1.4 1.2 1.2
Memo:Medium and heavy trucks .43 .40 .44 .48 .52 .53 .49
Note. Components may not sum to totals because of rounding. Data on sales of trucks and imported autos for the mostrecent month are preliminary and subject to revision. 1. Excludes some vehicles produced in Canada that are classified as imports by the industry.
2002 2003 2004 20051000
1400
1800
2200
2600
3000
3400
Mar. 6
Ratio scale, current dollars per vehicle
Quarterly averages
Average Value of Incentives on Light Vehicles
Note. Weighted average of customer cash rebate andinterest rate reduction. Data are seasonally adjusted. Source. J.D. Power and Associates.
2000 2001 2002 2003 2004 2005
125
130
135
140
145
150
155
160
165Index
Feb.
Michigan Survey Index of Car-Buying Attitudes
2002 2003 200415.0
15.5
16.0
16.5
17.0
17.5
18.0
18.5
19.0
Feb.
Millions of units, annual rate
Quarterly averages
Sales of Light Vehicles
Note. FRB seasonals.
1998 1999 2000 2001 2002 2003 2004 2005
30
40
50
60
70
80
90
100Days
Autos
Light trucks
Feb.
Days’ Supply of Autos and Light Trucks

II-12
the automakers early this month suggest that they expect light vehicle sales to edge up slightly in March. Consistent with the decline in incentives, consumers’ perceptions of buying conditions have become more negative. The Michigan SRC index of car-buying attitudes fell for a second month in February, and an increased fraction of respondents cited high prices as the reason for their worsened perceptions. Those views appear to be well grounded: The CPI for new vehicles has accelerated sharply, with an average monthly increase of nearly 0.5 percent per month over the four months ending in January. Despite the slowdown in sales, motor vehicle production picked up in January and February, and inventories rose sharply over this period. The increase in stocks was particularly large for light trucks, for which days’ supply on dealer lots approached ninety days; days’ supply for autos also moved up but only to about sixty days. Automakers’ initial production schedules for the second quarter call for a sizable drop in total assemblies, to an annual rate of 11.8 million units. This drop, however, is concentrated in autos, while scheduled truck assemblies are a bit above the rate in the first quarter. This production schedule presents something of a puzzle because it implies that inventories of light trucks will remain high through the spring unless sales pick up noticeably. One possible explanation is that with an increasing variety of light truck models, automakers are willing to tolerate higher levels of overall stocks.
Production of Domestic Autos and Trucks(Millions of units at an annual rate except as noted; FRB seasonals)
2004 2005 2005
Item 2004 Q4 Q11 Q21 Jan. Feb. Mar.1
U.S. production 12.0 12.0 12.2 11.8 11.9 12.6 12.2 Autos 4.3 4.1 4.5 3.9 4.4 4.6 4.4 Trucks 7.8 7.9 7.7 7.9 7.5 8.0 7.7
Days’ supply2 73 73 n.a. n.a. 76 78 n.a. Autos 59 58 n.a. n.a. 59 61 n.a. Trucks 83 82 n.a. n.a. 89 89 n.a.
Inventories3 3.21 3.21 n.a. n.a. 3.23 3.27 n.a. Autos 1.02 1.02 n.a. n.a. 1.03 1.04 n.a. Trucks 2.19 2.19 n.a. n.a. 2.20 2.23 n.a.
Note. Components may not sum to totals because of rounding. 1. Production rates for March and the first and second quarters reflect the latest schedules from Ward’s Communications. 2. Quarterly and semiannual values are calculated with end-of-period stocks and average reported sales; excludes mediumand heavy trucks. 3. End-of-period stocks; excludes medium and heavy trucks. n.a. Not available.

II-13
Consumer Spending Consumer spending increased at an annual rate of nearly 4¼ percent last quarter, and supported by strong income gains and rising wealth, it is on track for another solid advance in the current quarter. Although household purchases of motor vehicles appear to be stepping down this quarter, other outlays have continued to rise at a brisk pace. In the retail control category of goods—which excludes sales by auto dealers and building material and supply stores—nominal spending increased 1.1 percent in January and 0.6 percent in February. The gains in recent months have been widespread, but have been especially strong at electronics and appliance stores and at clothing stores. Factoring in our projection of consumer prices, we estimate that real spending in the PCE control category increased 0.9 percent in January and 0.3 percent in February.3 Meanwhile, real outlays for consumer services rose 0.2 percent in January (the latest available data), and the increases were broadly based. The fundamental factors underlying consumer spending are quite favorable. Disposable personal income is now reported to have increased more rapidly in the second half of last year than we estimated at the time of the January Greenbook. The increase reflects an upward revision to wages and salaries based on unemployment insurance tax records for the third quarter. In recent months, a number of special factors have buffeted personal income. The Microsoft dividend payout provided a large, temporary boost to income in December, and annual cost-of-living increases in federal government salaries and transfer payments generated a small, permanent increase in income in January (offset partly by annual increases in contributions to social insurance programs). Leaving aside these special factors, real disposable personal income increased at an average annual rate of about 6½ percent in December and January, a rate noticeably higher than the 2¾ percent that prevailed over the first three quarters of 2004. Regarding wealth, increases in equity prices and house values pushed up the wealth-income ratio in the fourth quarter to its highest level since early 2001. The saving rate was 3.6 percent in December (0.4 percent excluding the effect of the Microsoft dividend on income) and 1.0 percent in January, still low by historical standards.
3 The difference in January growth rates between real PCE control and nominal retail control cannot be
explained by changes in prices (which were roughly flat in January for this category of goods). It reflects instead an unusual divergence between nominal PCE control and retail control that is due to two factors: First, the BEA inserted a stepdown in the level of PCE control between December and January to account for the fact that 2004 was a leap year and 2005 is not; and second, there was an unusually large decline in “other motor vehicles,” a category of spending that is included in the control category and available to the BEA but not to Board staff.

II-14
Retail and Food Services Sales(Percent change from preceding period; seasonally adjusted current dollars)
2004 2005
Category H1 Q3 Q4 Dec. Jan. Feb.
Total sales 4.2 1.4 2.4 1.3 .3 .5 Previous estimate 4.2 1.4 2.4 1.1 -.3 ...
Retail control1 4.2 1.4 2.5 .3 1.1 .6 Previous estimate 4.2 1.4 2.4 .2 .7 ...
GAF2 2.9 1.0 1.6 .5 1.0 .8 Gasoline stations 14.3 2.2 6.2 -2.3 1.8 .9 Food services 4.0 1.5 2.5 1.4 .8 1.2 Other retailers3 3.2 1.5 2.0 .2 1.1 .3
1. Total retail trade and food services less sales at building material and supply stores and automobileand other motor vehicle dealers. 2. Furniture and home furnishing stores; electronics and home appliance stores; clothing andaccessories stores; sporting goods, hobby, book, and music stores; and general merchandise stores. 3. Health and personal care stores, food and beverage stores, electronic shopping and mail-orderhouses, and miscellaneous other retailers. ... Not applicable.
2620
2678
2736
2794
2852
2910
2968
2620
2678
2736
2794
2852
2910
2968Billions of chained (2000) dollars
2003 2004
Feb.Quarterly average
Note. December, January, and Q4 are staff estimates;February is a staff forecast.
Real PCE Goods Excl. Motor Vehicles
4190
4230
4270
4310
4350
4390
4430
4190
4230
4270
4310
4350
4390
4430Billions of chained (2000) dollars
2003 2004
Jan. Quarterly average
Real PCE Services
-3
-1
1
3
5
7
9
-3
-1
1
3
5
7
9Percent, annual rate
* 2004:Q4 and January values exclude the effect on income of the one-time Microsoft dividend payment in December.
H1 H2 H1 Q3 Q4 Jan.
2003 2004
Real wage and salary disbursementsOther components of real DPI*
Change in Real Wages and Salaries and Other Real DPI

II-15
Household Indicators
1994 1995 1996 1997 1998 1999 2000 2001 2002 2003 2004 20053000
5000
7000
9000
11000
13000
15000Index
4.0
4.5
5.0
5.5
6.0
6.5
7.0Ratio
Q4
Feb.
Wilshire 5000 (left scale)
Ratio of household net worth to DPI*(right scale)
* 2004:Q4 value excludes the effect on income of the one-time Microsoft dividend payment in December.
Household Net Worth and Wilshire 5000
1994 1995 1996 1997 1998 1999 2000 2001 2002 2003 2004 2005-1
0
1
2
3
4
5
6
7
-1
0
1
2
3
4
5
6
7Percent
Jan.
* December 2004 value excludes the effect on income of the one-time Microsoft dividend payment in that month.
Personal Saving Rate*
1994 1995 1996 1997 1998 1999 2000 2001 2002 2003 2004 200540
60
80
100
120
140
1601985 = 100
60
70
80
90
100
110
1201966 = 100
Feb.
Michigan SRC(right scale)
Conference Board (left scale)
Consumer Confidence

II-16
Private Housing Activity(Millions of units; seasonally adjusted annual rate except where noted)
2004 2005
Sector 2004 Q2 Q3 Q4 Dec. Jan. Feb.
All unitsStarts 1.96 1.92 1.97 1.98 2.06 2.18 2.20 Permits 2.02 2.02 2.01 2.03 2.03 2.13 2.07
Single-family unitsStarts 1.61 1.60 1.63 1.62 1.71 1.77 1.78 Permits 1.57 1.57 1.57 1.56 1.57 1.64 1.62 Adjusted permits1 1.58 1.60 1.60 1.59 1.61 1.67 1.65 Permit backlog2 .150 .136 .141 .150 .150 .140 .134New home sales 1.20 1.21 1.16 1.23 1.22 1.11 n.a.Existing home sales 5.96 6.07 5.97 6.05 5.97 5.94 n.a.
Multifamily unitsStarts .35 .32 .34 .35 .34 .41 .42 Permits .45 .45 .44 .47 .47 .49 .45 Permit backlog2 .075 .058 .067 .075 .075 .074 .068
Mobile homesShipments .131 .127 .128 .139 .136 .151 n.a.
Condos and Co-opsExisting home sales .82 .83 .83 .83 .84 .86 n.a.
1. Adjusted permits equal permit issuance plus total starts outside of permit-issuing areas. 2. Number outstanding at end of period. Seasonally adjusted by Board staff. Excludes permits that have
been canceled, abandoned, expired, or revoked. Not at an annual rate. n.a. Not available.
1988 1989 1990 1991 1992 1993 1994 1995 1996 1997 1998 1999 2000 2001 2002 2003 2004 2005.0
.2
.4
.6
.8
1.0
1.2
1.4
1.6
1.8
2.0
2.2
2.4
.0
.2
.4
.6
.8
1.0
1.2
1.4
1.6
1.8
2.0
2.2
2.4
Millions of units
Private Housing Starts(Seasonally adjusted annual rate)
Feb.
Feb.
Feb.Total
Single-family
Multifamily

II-17
According to surveys by both the Michigan SRC and the Conference Board, consumer sentiment edged down in February, as the expectations components of both surveys weakened. However, both indexes remain at levels consistent with the continued solid gains in consumer spending that are suggested by the fundamentals. Housing Markets Starts of single-family homes rose slightly in February to an annual rate of almost 1.8 million units. During the first two months of this year, single-family starts averaged 1.77 million units, 9¼ percent higher than the average pace in the fourth quarter of last year. The level of permits for single-family homes (adjusted for activity in areas where permits are not required) was considerably lower than starts in both January and February, and the permit backlog declined in both months, an indication that starts likely will show a decline in March. In the multifamily sector, starts rose 1.7 percent in February to an annual rate of 420,000 units. The average level of multifamily starts in January and February was 17½ percent higher than the fourth-quarter reading. However, the permit backlog for multifamily starts declined during the past two months, suggesting that starts moderated in March. Home sales fell in January, but other indicators do not suggest a downshift in housing demand. Sales of new homes were at an annual rate of 1.11 million units in January, nearly 10 percent less than the fourth-quarter level. Sales of single-family existing homes edged down slightly in January, and their 5.94 million unit pace was just 1¾ percent less than the fourth-quarter average, the highest quarterly level on record. Builders’ ratings of new home sales during the first three months of this year were at the high end of the elevated range that has prevailed during the past year and a half. The thirty-year fixed-rate mortgage rate stood at 5.85 percent on March 10, up only 11 basis points from the average during the fourth quarter of last year; the one-year adjustable mortgage rate has increased about the same amount. The most recent reading on the four-week moving average of the Mortgage Bankers Association index of mortgage applications for home purchase was in the middle of the range it has occupied during the past year and a half. Home prices have continued to rise rapidly. The repeat-transactions price index for existing homes, which measures the change in the value of properties when they are sold or refinanced, rose 11¼ percent over the year ending in the fourth quarter, a pace below the year-over-year reading in the previous quarter but well above the average pace during the past two years. A version of the index that includes only home purchase transactions was up 10 percent in the fourth quarter from the level of a year earlier. The constant-

II-18
Indicators of Single-Family Housing
1998 1999 2000 2001 2002 2003 2004 20053500
4000
4500
5000
5500
6000
6500
3500
4000
4500
5000
5500
6000
6500Thousands of units
Jan.
Source. National Association of Realtors.
Existing Home Sales
1998 1999 2000 2001 2002 2003 2004 2005700
900
1100
1300
1500
700
900
1100
1300
1500Thousands of units
Jan.
Source. Census Bureau.
New Home Sales
1998 1999 2000 2001 2002 2003 2004 20053
4
5
6
7
8
9
3
4
5
6
7
8
9Percent
Fixed rate
One-year ARM
Mar.
Mar.
Note. The March readings are based on datathrough Mar. 9. Source. Freddie Mac.
Mortgage Rates
1998 1999 2000 2001 2002 2003 2004 2005 2006-20
0
20
40
60
80
100Diffusion index
200
250
300
350
400
450
500
550Index
Mar. 11
Note. MBA index is a 4-week moving average. Builders’ratings data are seasonally adjusted by Board staff. Source. Mortgage Bankers Association and NationalAssociation of Home Builders.
(left scale)
Mar.
MBA purchase index (right scale)Builders’ ratings of current new home sales
Homebuying Indicators
1998 1999 2000 2001 2002 2003 2004 20050
2
4
6
8
10
12
14
0
2
4
6
8
10
12
14Percent change from year earlier
Q4Q4
Repeat transactionsRepeat transactions (purchases only)
Source. Office of Federal Housing EnterpriseOversight.
Prices of Existing Homes
1998 1999 2000 2001 2002 2003 2004 20050
2
4
6
8
10
0
2
4
6
8
10Percent change from year earlier
Q4
Constant quality
Source. Census Bureau.
Prices of New Homes

II-19
quality price index for new homes—which controls for changes in the geographic composition of sales, home size, and a few other readily measurable attributes—was up 6.7 percent in the fourth quarter from a year earlier, a pace similar to the average during the past couple of years. Equipment and Software Real business spending on equipment and software (E&S) advanced at an annual rate of 18 percent in the fourth quarter, according to our current estimate.4 The overall pace of E&S spending appears likely to step down in the current quarter, reflecting a decline in outlays for motor vehicles. However, real E&S spending excluding motor vehicles is on track to increase this quarter at a rate that is comparable to the average rate over the previous year. In addition, investment fundamentals are still accommodative: Business output continues to expand at a brisk pace, firms hold large cushions of liquid assets, and the cost of capital remains attractive—despite the expiration of the partial-expensing provision—because of low interest rates. Moreover, anecdotal reports from the Beige Book, recent business surveys, and our industry contacts support a favorable outlook for nontransportation capital spending in the near term. In the high-tech sector, nominal shipments of computing equipment accelerated in January, and shipments of communications gear more than bounced back from their December drop. High-tech orders look fairly strong as well: Bookings of computers decreased in January but reversed only part of their previous months’ advance, and orders for communications equipment jumped (although the signaling content in this volatile series for future deliveries is quite weak). The few available revenue projections from software vendors for the current quarter point to a smaller rise in business spending on software than in the fourth quarter. Outside of high-tech, shipments posted a sizable and broad-based increase in January, although the gains were most pronounced in the machinery sector. In addition, the backlog of orders continued to increase, pointing to further gains in shipments in coming months. After surging in the second half of last year, business demand for transportation equipment appears to have fallen back in the current quarter. Although fleet sales of light vehicles were up in January and February, the much larger retail component of light vehicle sales fell sharply over the same period, and we suspect that a portion of this
4 The BEA’s preliminary estimate of the fourth-quarter increase in real business spending on
equipment and software did not incorporate revised data on orders and shipments or on international trade for December.

II-20
1999 2000 2001 2002 2003 2004 20055
6
7
8
9
10
11
12
5
6
7
8
9
10
11
12Billions of dollars, ratio scale
Jan.
ShipmentsOrders
Computers and Peripherals
1999 2000 2001 2002 2003 2004 20053
6
9
12
15
1821
3
6
9
12
15
1821
Billions of dollars, ratio scale
Jan.
ShipmentsOrders
Communications Equipment
1999 2000 2001 2002 2003 2004 2005200
290
380
470
560
650
740
890
200
290
380
470
560
650
740
890Thousands of units, ratio scale
Feb.
Feb.
Note. Annual rate, FRB seasonals. Source. For class 4-8 trucks, Ward’s Communications; for class 5-8 trucks, ACT Research.
Sales of class 4-8 trucksNet new orders of class 5-8 trucks
Medium and Heavy Trucks
1999 2000 2001 2002 2003 2004 200536
39
42
45
48
52
36
39
42
45
48
52Billions of dollars, ratio scale
Jan.ShipmentsOrders
Other Equipment
Orders and Shipments of Nondefense Capital Goods(Percent change; seasonally adjusted current dollars)
2004 2005
Indicators Q3 Q4 Nov. Dec. Jan.
Annual rate Monthly rate
Shipments 14.1 9.7 -2.4 4.1 2.7 Excluding aircraft 15.0 9.6 -1.7 3.1 3.7 Computers and peripherals 10.9 40.3 -2.9 2.1 6.5 Communications equipment 11.8 -17.1 1.1 -3.9 6.5 All other categories 16.2 8.6 -1.8 4.3 2.7
Orders 25.5 4.7 7.7 -.6 -.2 Excluding aircraft 14.1 6.3 1.2 3.4 2.9 Computers and peripherals 5.6 34.6 5.8 9.9 -3.3 Communications equipment -10.9 -23.0 -8.1 2.0 21.6 All other categories 19.7 5.9 1.5 2.3 2.0
Memo: Shipments of complete aircraft1 26.2 27.1 20.6 30.7 25.4
1. From Census Bureau, Current Industrial Reports; billions of dollars, annual rate.

II-21
decline will show up as reduced purchases by businesses.5 Elsewhere, medium and heavy truck sales continued their strong upward trajectory, and the level of new truck orders suggests that demand will remain robust in coming months. Nominal shipments of aircraft fell back a bit in January. Smoothing through the monthly fluctuations in the data, however, domestic demand for aircraft appears to be firming a little after two years of weakness in the wake of the September 11 attacks. We had previously expected expenditures on equipment and software to decline this quarter as a consequence of the termination of the partial-expensing tax provision. Although a deceleration does seem to be under way, the expiration of partial expensing does not appear to be the dominant influence. Indeed, much of the apparent deceleration is in spending on light vehicles, which probably was not greatly affected by the tax incentive. In addition, shipments of long-lived assets in the non-high-tech, nontransportation category—whose user cost was reduced the most by the tax incentive—moved up in January from their December level. All told, if partial expensing boosted E&S spending in the second half of last year and depressed it in the current quarter, the size of the effect was much smaller than we had anticipated. Nonresidential Construction Real construction of nonresidential structures has been about flat in recent months at a depressed level. Outlays in the power and communications sector and in the manufacturing sector have been increasing since the middle of last year. However, real spending on commercial structures, which had moved up in the first half of 2004, has trended lower since then, even though the vacancy rate for retail buildings has edged down in recent quarters and remains at the low end of the range observed during the past few years. Office construction has also slipped further of late, in part because of continued high vacancy rates. The number of rigs drilling for natural gas edged up in January and February, pointing to another increase in the drilling and mining component of outlays for nonresidential structures. Business Inventories We currently estimate that a pickup in real inventory investment contributed about ¾ percentage point to the increase in real GDP in the fourth quarter, and a similar-sized contribution seems possible this quarter. For the manufacturing and trade sector excluding motor vehicles, which accounts for 85 percent of total inventory stocks, the
5 On average over the past year, 70 percent of total light vehicle sales to businesses were classified as retail sales, and 30 percent were classified as fleet sales.

II-22
Nonresidential Construction and Indicators
Real Construction(Seasonally adjusted, annual rate; nominal CPIP deflated by
BEA prices through Q3 and by staff projection thereafter)
1997 1998 1999 2000 2001 2002 2003 2004 2005170
190
210
230
250
270
290
170
190
210
230
250
270
290Billions of chained (2000) dollars
Jan.
Total Structures
1997 1998 1999 2000 2001 2002 2003 2004 200520
30
40
50
60
70
20
30
40
50
60
70Billions of chained (2000) dollars
Office
Jan.
Commercial
Jan.
Office and Commercial
1997 1998 1999 2000 2001 2002 2003 2004 20050
10
20
30
40
50
60
0
10
20
30
40
50
60Billions of chained (2000) dollars
Jan.
Manufacturing
Jan.
Power & communication
Manufacturing and Power &Communication
1997 1998 1999 2000 2001 2002 2003 2004 200555
60
65
70
75
55
60
65
70
75Billions of chained (2000) dollars
Jan.
Note. Includes religious, educational, lodging, amusementand recreation, transportation, and health-care facilities.
Other
1997 1998 1999 2000 2001 2002 2003 2004 20050
3
6
9
12
15
18
0
3
6
9
12
15
18Percent
Q4Office
Q4Retail
Q4
Industrial
Indicators
Source. National Council of Real Estate InvestmentFiduciaries.
Vacancy Rates
1997 1998 1999 2000 2001 2002 2003 2004 20050
200
400
600
800
1000
1200
0
200
400
600
800
1000
1200Number
Natural gas
Petroleum
Mar.
Mar.
Note. Mar. values are averages through Mar. 11.Source. DOE/Baker Hughes.
Drilling Rigs in Operation

II-23
1992 1993 1994 1995 1996 1997 1998 1999 2000 2001 2002 2003 2004 20051.0
1.2
1.4
1.6
1.8
1.0
1.2
1.4
1.6
1.8Ratio
Jan.
Wholesale trade ex. motor vehicles and parts
Manufacturing
Retail trade ex. motor vehicles and parts
Book-Value Inventories Relative to Shipments and Sales
1992 1993 1994 1995 1996 1997 1998 1999 2000 2001 2002 2003 2004 200546
48
50
52
54
56
58
60
62
64
46
48
50
52
54
56
58
60
62
64Days’ supply
Feb.
Total
Total ex. motor vehicles and parts
Inventory-Consumption Ratios, Flow-of-Goods System
Changes in Manufacturing and Trade Inventories (Billions of dollars; seasonally adjusted book value; annual rate)
2004 2005
Sector Q2 Q3 Q4 Nov. Dec. Jan.
Manufacturing and trade 120.4 84.1 88.4 162.1 36.8 136.6 Ex. wholesale and retail motor vehicles and parts 94.1 75.9 107.6 139.5 68.2 139.9
Manufacturing 38.9 32.3 35.9 53.9 5.7 73.4 Ex. aircraft 39.0 33.9 33.2 45.7 6.6 73.1
Wholesale trade 33.7 39.1 35.7 47.9 16.2 42.0 Motor vehicles and parts 1.3 3.3 -2.0 3.1 -4.0 7.3 Ex. motor vehicles and parts 32.4 35.7 37.7 44.8 20.2 34.7
Retail trade 47.7 12.8 16.8 60.3 14.9 21.2 Motor vehicles and parts 25.0 4.9 -17.1 19.5 -27.4 -10.7 Ex. motor vehicles and parts 22.7 7.9 33.9 40.8 42.3 31.8

II-24
Federal Government Outlays and Receipts(Unified basis; billions of dollars except as noted)
12 months endingJanuary-February in February
Percent Percent
Function or source 2004 2005 change 2004 2005 change
Outlays 375.5 408.5 8.8 2206.7 2359.9 6.9 Financial transactions1 -.3 -.1 ... -2.0 -1.5 ... Payment timing2 -12.1 -12.4 ... -11.7 -.1 ... Adjusted outlays 387.9 421.0 8.5 2220.3 2361.5 6.4
Receipts 277.2 303.1 9.3 1795.3 1952.1 8.7 Payment timing .0 .0 ... .0 .0 ... Adjusted receipts 277.2 303.1 9.3 1795.3 1952.1 8.7
Surplus or deficit (-) -98.3 -105.4 ... -411.4 -407.8 ...
Selected componentsof adjusted outlaysand receiptsAdjusted outlays 387.9 421.0 8.5 2220.3 2361.5 6.4 Net interest 25.1 28.1 11.9 151.8 166.1 9.4 Non-interest 362.8 392.9 8.3 2068.5 2195.4 6.1 National defense 73.5 77.3 5.2 430.6 468.1 8.7 Social Security 81.8 86.5 5.8 482.6 506.4 4.9 Medicare 40.5 45.0 10.9 252.8 280.0 10.8 Medicaid 27.5 27.6 .3 166.7 178.1 6.8 Income security 76.2 80.4 5.5 340.4 338.2 -.7 Agriculture 2.5 6.1 139.2 22.6 23.9 5.7 Other 60.8 70.1 15.3 372.8 400.6 7.5
Adjusted receipts 277.2 303.1 9.3 1795.3 1952.1 8.7 Individual income and payroll taxes 243.0 265.5 9.3 1458.5 1551.1 6.3 Withheld + FICA 240.4 260.7 8.5 1366.6 1437.9 5.2 Nonwithheld + SECA 49.0 52.4 7.0 287.2 292.5 1.9 Less: Refunds 46.3 47.6 2.8 195.2 189.1 -3.1 Corporate 5.2 8.4 61.4 147.2 213.7 45.2 Gross 9.1 12.5 38.6 201.7 248.9 23.4 Less: Refunds 3.8 4.1 7.6 54.5 35.2 -35.5 Other 29.0 29.2 .8 189.6 187.3 -1.2
Adjusted surplus or deficit (-) -110.7 -117.9 ... -425.0 -409.3 ...
Note. Components may not sum to totals because of rounding. 1. Financial transactions consist of deposit insurance, spectrum auctions, and sales of major assets. 2. A shift in payment timing occurs when the first of the month falls on a weekend or holiday, orwhen the first three days of a month are nonworking days. Outlays for defense, Social Security,Medicare, income security, and "other" have been adjusted to account for these shifts. ... Not applicable.

II-25
book value of inventories increased at an annual rate of $140 billion in January after an average $108 billion accumulation in the fourth quarter. In January, manufacturers accumulated inventories at twice the rate of the fourth quarter, while wholesalers and retailers excluding auto dealers about matched the fourth-quarter pace of inventory investment. Despite rapid sales growth, the recent pace of inventory investment has kept inventory-sales ratios in all three major sectors about flat since the middle of last year, rather than on the downward path that we think characterizes the longer-run trend. Nevertheless, business surveys and reports from our industry contacts provide little evidence that these accumulations are unwanted. In the February ISM Report on Business, the number of respondents stating that their customers’ inventories are too low increased from December to February, whereas the number of respondents stating that they are too high decreased. That said, data from the staff’s flow-of-goods inventory system indicate that inventories remain elevated relative to consumption for a few products, including motor vehicles, food, and paper. Federal Government Sector The federal budget situation over the past two months is similar to that recorded during the same period last year, as both receipts and outlays have posted large increases. According to the Monthly Treasury Statement, the federal government recorded a cumulative $105 billion deficit in January and February, an amount only a bit higher than the $98 billion deficit posted during the comparable months of 2004. Receipts in January and February rose about 9¼ percent from year-earlier levels. Increases in income and payroll taxes, boosted in part by recent income gains, were sizable. Individual refunds were up only a little in January and February. However, the refundable portions of the earned income and child tax credits, which are counted as outlays rather than as individual refunds, each posted large increases. According to separate IRS data, the total of all these refunds through early March was about 6 percent above year-earlier levels. The average size of refund checks issued thus far is about $200 higher than it was last year, although the number of tax returns certified for a refund is about 2 percent lower than it was last year. However, the tax refund season is far from over; the total amount of refunds to date is less than half of the expected total for the entire season.

II-26

II-27
Outlays in January and February, adjusted for financial transactions and payment timing shifts, rose 8½ percent from year-earlier levels. Outlays increased in all major categories. Spending for national defense in January and February rose about 5¼ percent, an increase consistent with developments in Iraq and Afghanistan. Medicare spending posted a double-digit rate of increase, while Medicaid expenditures, which had received a temporary increment between mid-2003 and mid-2004 under the Jobs and Growth Tax Relief Reconciliation Act of 2003, were little changed. Spending in the “other” category picked up noticeably, largely because of variation in the timing of payments for programs such as the financing of foreign military sales. President Bush has submitted to the Congress his budget for fiscal 2006. The Administration expects that, if the Congress enacts the supplemental appropriation for spending in Iraq that was requested in late February and the President’s other policy proposals, the unified deficit will reach $427 billion in fiscal 2005, up from $412 billion last fiscal year and higher than the CBO’s most recent estimate of $394 billion. Under these assumptions, the Administration projects that the deficit would be cut in half over the next five years, to a level of $207 billion in 2010. However, the President’s budget submission excluded any significant funding for activities in Iraq and Afghanistan beyond that already in train and omitted any budgetary effect of the President’s proposal to add personal accounts to Social Security. The President’s policy proposals that were included in the budget would have little effect on the deficit over the next five years, as small revenue losses would be offset by small spending cuts. However, the proposals would increase the deficit significantly after 2010 because the Administration is proposing to extend the tax cuts that are due to expire then. State and Local Governments Recent indicators signal that state and local government finances are improving this year and that the sector’s spending is strengthening. Employment rose 31,000 in February, with gains primarily at educational establishments. The sector’s employment has now risen for eight consecutive months. Similarly, construction spending, which has been increasing since September, rose another 1.4 percent in nominal terms in January. Outlays for highways and streets have been on an unusually steep upward trajectory; spending on educational facilities has also trended higher. Together, these two categories account for about 60 percent of state and local construction. News on state finances during the current fiscal year continues to be encouraging; most states have reported strong revenue growth month after month. However, many officials
II-28
Measures of Inflation(Percent)
12-month change 3-month change 1-month change
Annual rate Monthly rate
Jan. Jan. Oct. Jan. Dec. Jan.Measures 2004 2005 2004 2005 2005 2005
CPITotal 1.9 3.0 3.2 1.3 .0 .1 Food 3.5 2.9 2.2 1.5 .0 .1 Energy 7.8 10.6 14.4 -6.0 -1.3 -1.1 Ex. food and energy 1.1 2.3 2.3 2.0 .2 .2 Core commodities -2.3 .9 1.4 1.7 .0 .3 Core services 2.5 2.8 2.5 2.4 .2 .2 Chained CPI (n.s.a.) 1 1.7 2.6 ... ... ... ... Ex. food and energy 1 .8 1.9 ... ... ... ...
PCE pricesTotal 1.8 2.2 2.3 1.4 .0 .2 Food 3.0 2.6 2.4 1.2 .1 .0 Energy 7.8 11.6 16.5 -7.0 -1.4 -1.2 Ex. food and energy 1.2 1.6 1.4 2.1 .0 .3 Core commodities -2.0 .4 .3 1.3 -.2 .4 Core services 2.6 2.1 1.9 2.4 .1 .2 Core market-based 1.1 1.7 1.2 2.1 .0 .3 Core non-market-based 1.5 1.0 2.3 2.0 -.1 .4
PPITotal finished goods 3.3 4.2 7.2 2.7 -.3 .3 Food 4.3 4.1 6.5 1.0 .1 -.2 Energy 11.2 9.8 24.6 -3.0 -2.5 -1.0 Ex. food and energy 1.0 2.7 3.2 4.8 .2 .8 Core consumer goods 1.1 2.6 2.8 5.1 .1 .9 Capital equipment .9 2.8 3.7 4.3 .2 .6 Intermediate materials 3.9 8.7 9.2 5.0 -.1 .4 Ex. food and energy 2.4 8.5 8.7 6.8 .5 .8 Crude materials 16.1 10.8 -4.8 13.1 -3.0 -2.0 Ex. food and energy 25.4 13.0 26.7 -6.6 -1.3 -2.5
1. Higher-frequency figures are not applicable for data that are not seasonally adjusted. ... Not applicable.

II-29
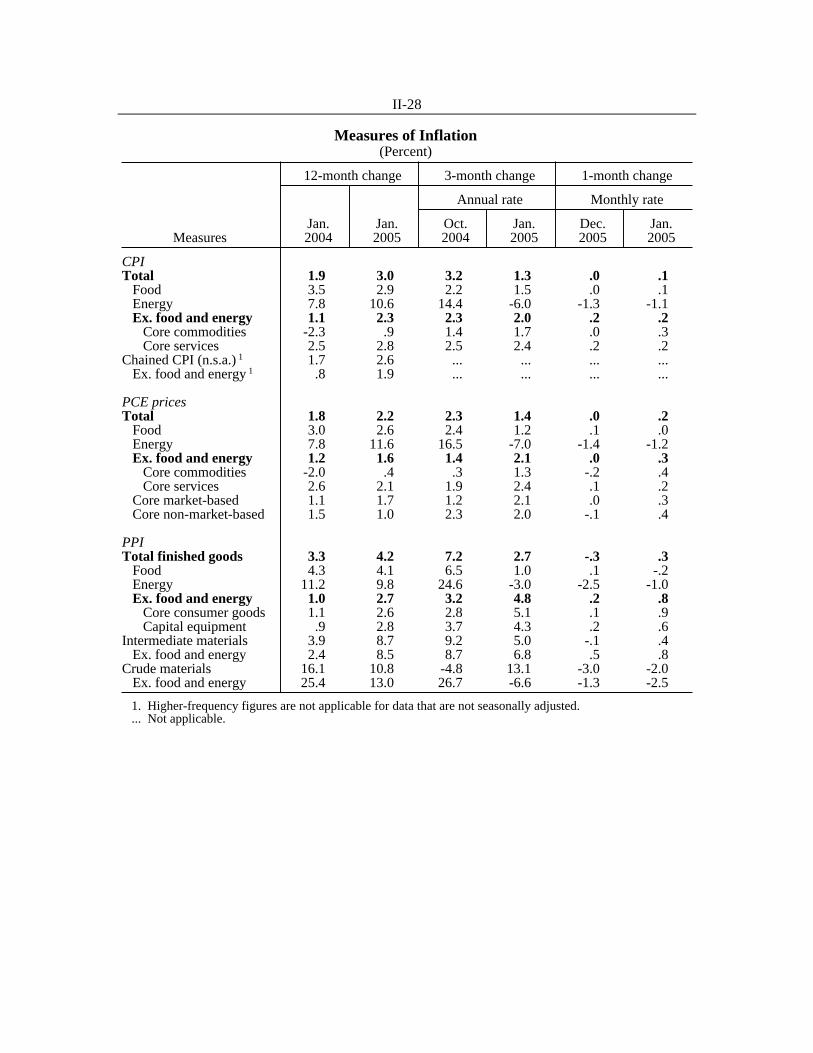
remain concerned about fiscal 2006, which starts July 1 in all but four states. According to a new survey from the National Conference of State Legislatures, nearly half the states reported that they are projecting budget gaps in their general fund account for 2006 if no corrective budget actions are taken. The prospective shortfalls range from a low of 0.2 percent of expenditures in West Virginia to a high of 15 percent in Alaska. California, Illinois, New Jersey, and New York are among the states anticipating large budget gaps. Prices and Labor Costs After having held steady in December, prices of consumer goods and services moved up in January. Core consumer prices rose a touch faster than overall prices, and the increase in the core was fairly widespread among commodities and services. A decline in consumer energy prices held down the January increase in the overall price indexes. However, gasoline and other energy prices turned back up in February and early March. The price index for personal consumption expenditures (PCE) rose 0.2 percent in January. During the twelve months that ended in January, PCE prices rose 2.2 percent, boosted by a climb of almost 12 percent in energy prices. PCE prices excluding food and energy moved up 0.3 percent in January after increases averaging 0.1 percent per month in the fourth quarter. On a twelve-month basis, the change in core PCE prices has been around 1½ percent since last spring. PCE energy prices fell 1.2 percent in January, a decrease that reflected the passthrough of the decline in crude oil prices late last year. However, crude prices have turned back up this year, and survey data suggest that seasonally adjusted gasoline prices increased about 2½ percent in February and will rise even more sharply in March. Higher crude prices have also induced some substitution toward natural gas by industrial users of heavy fuel oil, and this substitution has pushed up prices of natural gas a little despite ample inventories for this time of year. PCE prices for food were flat in January, as they were held down by substantial declines in prices for fruits and vegetables. These prices continued to reverse their earlier, hurricane-related run-ups, but wholesale prices of fruits and vegetables suggest that this adjustment has now largely run its course. Within the core PCE price index, goods prices rose 0.4 percent in January. Prices of new motor vehicles climbed appreciably, as sales incentives fell further. Price increases were

II-30
Consumer Price Inflation(12-month change except as noted)
1999 2000 2001 2002 2003 2004 20050
1
2
3
0
1
2
3 Percent
Jan.
chainedCPIPCE
CPI
CPI and PCE ex. Food and Energy
1999 2000 2001 2002 2003 2004 20050
1
2
3
0
1
2
3 Percent
Jan.
Core PCE
Market-based components
PCE excluding Food and Energy
1999 2000 2001 2002 2003 2004 2005-1
0
1
2
3
4
5
-1
0
1
2
3
4
5 Percent
3-month change, annual rate
Jan.
PCE excluding Food and Energy
1999 2000 2001 2002 2003 2004 2005-3
-2
-1
0
1
2
3
4
-3
-2
-1
0
1
2
3
4 Percent
Jan.
Jan.
Services ex. energy
Commodities ex. food and energy
PCE Services and Commodities
1999 2000 2001 2002 2003 2004 2005-20
-10
0
10
20
30
-20
-10
0
10
20
30 Percent
Jan.
PCE Energy
2003 2004 200540
70
100
130
160
190
220
40
70
100
130
160
190
220Cents per gallon
Retail price*
WTI spot price
Mar. 7
Mar. 7
* Average of all grades reported by the Department ofEnergy, seasonally adjusted.
Gasoline Price Decomposition

II-31
fairly widespread among other goods as well. Prices of core consumer services moved up 0.2 percent in January, about in line with the average increase seen over the previous few months. The January uptick in core PCE inflation was apparent in both the market-based and the non-market-based components of the index. On a twelve-month change basis, inflation in core PCE services has trended down consistently for the past three years. However, inflation in core PCE goods prices has moved sharply higher since late 2003 apparently as a result of higher import prices, the indirect effects of higher energy prices, and higher prices for core intermediate materials. The twelve-month change in the core CPI was 2.3 percent over the year ending in January, a pickup of 1.2 percentage points from a year earlier. The greater acceleration in the CPI compared with the PCE price index can be traced in large part to its different treatment of medical services. The PCE medical services index includes some components (for example, Medicare and Medicaid reimbursements) that are not covered in the CPI.6 In addition, PCE medical services prices are mostly derived from producer price indexes rather than from the CPIs. Because of these differences in scope and data sources, the CPI for medical services accelerated 0.7 percentage point in the twelve months ending in January, while the PCE for medical services decelerated 1.6 percentage points.
According to the final release of the Michigan Survey for February, the median expectation for inflation over the next year was 2.9 percent, the same reading as in January and a little below its fourth-quarter average. The median expectation for inflation over the next five to ten years was 2.8 percent, roughly the average reported over the past several years. Regarding producer prices, the PPI for capital equipment jumped 0.6 percent in January. The January increase brought the twelve-month change in prices for capital equipment to 2.8 percent, almost 2 percentage points greater than the change in the preceding year. The PPI for core intermediate materials climbed 0.8 percent in January after several months of somewhat smaller increases. The January advance leaves these prices 8½ percent higher than they were a year earlier; rising prices for energy and imported materials and rising rates of capacity utilization can explain much of that run-up, although the acceleration is larger than our models that incorporate these factors would predict.
6 Because of this difference in scope, medical care has a much larger weight in the PCE index than in the CPI.

II-32
Broad Measures of Inflation(Percent change, Q4 to Q4)
Measure 2001 2002 2003 2004
Product pricesGDP price index 2.4 1.6 1.7 2.4 Less food and energy 2.3 1.7 1.4 2.2
Nonfarm business chain price index 1.9 1.0 .8 2.2
Expenditure pricesGross domestic purchases price index 1.6 1.8 1.8 2.9 Less food and energy 2.1 1.6 1.4 2.1
PCE price index 1.7 1.8 1.7 2.5 Less food and energy 2.2 1.5 1.2 1.6
PCE price index, market-based components 1.3 1.7 1.6 2.7 Less food and energy 1.8 1.4 1.0 1.6
CPI 1.8 2.2 1.9 3.4 Less food and energy 2.7 2.1 1.2 2.1
Chained CPI 1.5 1.8 1.7 2.9 Less food and energy 2.1 1.7 .8 1.8
Median CPI 3.9 3.0 2.0 2.3 Trimmed mean CPI 2.6 2.1 1.6 2.2
Actual CPI inflation 1
Professional forecasters (10-year) 4
Surveys of Inflation Expectations(Percent)
University of Michigan
1 year 2 5 to 10 years 3
Period Mean Median Mean Median
2003:Q2 2.1 2.6 2.2 3.1 2.7 2.5 Q3 2.2 2.8 2.3 3.1 2.7 2.5 Q4 1.9 3.0 2.6 3.1 2.8 2.5
2004:Q1 1.8 3.1 2.7 3.4 2.9 2.5 Q2 2.9 4.0 3.3 3.3 2.8 2.5 Q3 2.7 3.3 2.9 3.1 2.8 2.5 Q4 3.3 3.4 3.0 3.1 2.8 2.5
2005:Q1 n.a. n.a. n.a. n.a. n.a. 2.5
2004:July 3.0 3.5 3.0 3.1 2.8 ... Aug. 2.7 3.1 2.8 3.1 2.7 ... Sept. 2.5 3.2 2.8 3.1 2.8 2.5 Oct. 3.2 3.6 3.1 3.2 2.8 ... Nov. 3.5 3.3 2.8 3.1 2.7 ... Dec. 3.3 3.4 3.0 3.1 2.8 2.5 2005:Jan. 3.0 3.5 2.9 3.2 2.7 ... Feb. n.a. 3.3 2.9 3.1 2.8 ...
1. Percent change from the same period in the preceding year. 2. Responses to the question: By about what percent do you expect prices to go up, onaverage, during the next 12 months? 3. Responses to the question: By about what percent per year do you expect prices to go up,on average, during the next 5 to 10 years? 4. Quarterly CPI projections compiled by the Federal Reserve Bank of Philadelphia. ... Not applicable. n.a. Not available.

II-33
Commodity Price Measures
1986 1988 1990 1992 1994 1996 1998 2000 2002 2004 200660
70
80
90
100
110
120
130
140
60
70
80
90
100
110
120
130
1401996 = 100
Metals
Total
Mar. 15
Journal of Commerce
1986 1988 1990 1992 1994 1996 1998 2000 2002 2004 2006150
200
250
300
350
400
150
200
250
300
350
4001967 = 100
Spot industrials
Futures
Mar. 15
Note. The Journal of Commerce index is based almost entirely on industrial commodities, with a small weight given toenergy commodities. The Commodity Research Bureau (CRB) spot industrials index consists entirely of industrialcommodities, excluding energy. The CRB futures index gives about a 60 percent weight to food commodities and splitsthe remaining weight roughly equally among energy commodities, industrial commodities, and precious metals. Copyrightfor Journal of Commerce data is held by CIBCR, 1994.
Commodity Research Bureau
2
Spot Prices of Selected Commodities(Percent change)
12/28/04 1/25/05 52-weekto to change to
Index 2004 1 1/25/05 2 3/15/05 3/15/05
JOC industrials 8.7 .0 4.4 1.6 JOC metals 19.4 -2.6 4.8 8.2 CRB spot industrials 5.0 -.8 4.5 6.2 CRB spot foodstuffs 2.7 -2.3 3.3 -9.9 CRB futures 11.1 .8 11.9 14.6
1. From the last week of the preceding year to the last week of the year indicated. 2. January 25, 2005, is the Tuesday preceding publication of the January Greenbook.

II-34
1990 1991 1992 1993 1994 1995 1996 1997 1998 1999 2000 2001 2002 2003 2004 20051.0
1.5
2.0
2.5
3.0
3.5
4.0
4.5
1.0
1.5
2.0
2.5
3.0
3.5
4.0
4.5Percent
Average hourly earnings
ECI wages and salaries
Feb.
Labor Costs for Production or Nonsupervisory Workers(12-month change)
1990 1992 1994 1996 1998 2000 2002 20041.52
1.54
1.56
1.58
1.60
1.62
1.64
1.66
1.52
1.54
1.56
1.58
1.60
1.62
1.64
1.66
Average, 1968-present
Q4
Note. Markup defined as ratio of output price to unitlabor costs.
Markup, Nonfarm Businesses
1990 1992 1994 1996 1998 2000 2002 20041.45
1.47
1.49
1.51
1.53
1.55
1.57
1.59
1.45
1.47
1.49
1.51
1.53
1.55
1.57
1.59
Average, 1968-present
Q3
Note. Markup defined as ratio of output price to unitlabor costs.
Markup, Nonfinancial Corporations
e
Nonfarm Hourly Compensation and Unit Labor Costs(Percent change from preceding period at compound annual rate; based on seasonally adjusted data)
2004
Category 2003 2004 Q1 Q2 Q3 Q4
Compensation per hour 5.3 4.2 2.1 5.9 5.4 3.4
Unit labor costs -.2 1.1 -1.6 1.9 4.0 .6
Note. Annual changes are from fourth quarter of preceding year to fourth quarter of year shown. e Staff estimates.

II-35
Prices for core crude materials fell 2½ percent in January after a 1¼ percent decline in December. However, prices for industrial metals (aside from steel scrap) have been increasing in recent weeks, and the Journal of Commerce metals index is up 4¾ percent since the January Greenbook. Among the other commodity indexes that exclude energy, the CRB spot industrials index has risen 4½ percent since the last Greenbook, and the CRB spot foodstuffs index has risen 3¼ percent. The JOC industrial index and the CRB futures index, both of which contain a substantial energy component, have moved up 4½ percent and 12 percent respectively. Average hourly earnings were flat in February after a 0.3 percent gain in January. They rose 2½ percent during the twelve months ending in February, about 1 percentage point faster than in the preceding year. The BEA estimates that compensation per hour in the nonfarm business sector moved up 4.2 percent last year, compared with an increase of 5.3 percent in the preceding year. 7 The markup of prices over unit labor costs remained somewhat higher than the long-term norm for both the nonfarm business sector (through the fourth quarter) and the nonfinancial corporate sector (through the third quarter, the latest quarter for which data are available).
7 The most recent Productivity and Costs release, which incorporated the updated estimates of wages
and salaries in the third quarter, now shows that compensation per hour in the nonfarm business sector increased about 2 percentage points faster in the third quarter than had previously been reported.

Domestic FinancialDevelopments

III-T-1Selected Financial Market Quotations(One-day quotes in percent except as noted)
Change to Mar. 15 from2004 2005 selected dates (percentage points)
Instrument 2004 2004 2005 June 28 Dec. 31 Feb. 1 Mar. 15 June 28 Dec. 31 Feb. 1
Short-termFOMC intended federal funds rate 1.00 2.25 2.25 2.50 1.50 .25 .25
Treasury bills1
3-month 1.36 2.18 2.47 2.75 1.39 .57 .28 6-month 1.74 2.52 2.70 3.01 1.27 .49 .31
Commercial paper (A1/P1 rates)2
1-month 1.28 2.29 2.51 2.72 1.44 .43 .21 3-month 1.45 2.28 2.69 2.89 1.44 .61 .20
Large negotiable CDs1
3-month 1.53 2.50 2.71 2.98 1.45 .48 .27 6-month 1.82 2.72 2.94 3.23 1.41 .51 .29
Eurodollar deposits3
1-month 1.29 2.32 2.53 2.77 1.48 .45 .24 3-month 1.51 2.49 2.68 2.96 1.45 .47 .28
Bank prime rate 4.00 5.25 5.25 5.50 1.50 .25 .25
Intermediate- and long-termU.S. Treasury4
2-year 2.88 3.08 3.28 3.77 .89 .69 .49 5-year 3.97 3.63 3.70 4.21 .24 .58 .51 10-year 4.90 4.34 4.24 4.64 -.26 .30 .40
U.S. Treasury indexed notes 5-year 1.56 1.02 1.18 1.33 -.23 .31 .15 10-year 2.23 1.67 1.66 1.81 -.42 .14 .15
Municipal revenue (Bond Buyer)5 5.37 5.04 4.90 5.02 -.35 -.02 .12
Private instruments 10-year swap 5.21 4.65 4.53 4.91 -.30 .26 .38 10-year FNMA6 5.30 4.61 4.48 4.82 -.48 .21 .34 10-year AA7 5.59 4.98 4.87 5.26 -.33 .28 .39 10-year BBB7 6.18 5.38 5.28 5.61 -.57 .23 .33 5-year high yield7 8.30 7.34 7.46 7.48 -.82 .14 .02
Home mortgages (FHLMC survey rate)8
30-year fixed 6.21 5.77 5.63 5.85 -.36 .08 .22 1-year adjustable 4.19 4.10 4.23 4.24 .05 .14 .01
Change to Mar. 15 Record high 2004 2005 from selected dates (percent)
Stock exchange index Record 2004 2005 Level Date Dec. 31 Feb. 1 Mar. 15 high Dec. 31 Feb. 1
Dow Jones Industrial 11,723 1-14-00 10,783 10,552 10,745 -8.34 -.35 1.83S&P 500 Composite 1,527 3-24-00 1,212 1,189 1,198 -21.59 -1.17 .70Nasdaq 5,049 3-10-00 2,175 2,069 2,035 -59.69 -6.46 -1.63Russell 2000 655 12-28-04 652 628 627 -4.24 -3.80 -.21Wilshire 5000 14,752 3-24-00 11,971 11,722 11,817 -19.89 -1.29 .81
1. Secondary market. 2. Financial commercial paper. 3. Bid rates for Eurodollar deposits collected around 9:30 a.m. eastern time. 4. Derived from a smoothed Treasury yield curve estimated using off-the-run securities. 5. Most recent Thursday quote. 6. Constant maturity yields estimated from Fannie Mae domestic noncallable coupon securities. 7. Derived from smoothed corporate yield curves estimated using Merrill Lynch bond data. 8. Home mortgage data for Mar. 15, 2005, is from Mar. 10, 2005. _______________________________________________________________________
NOTES:
June 28, 2004, is the day before the most recent policy tightening began. February 1, 2005, is the day before the most recent FOMC announcement.
_______________________________________________________________________

III-C-1
Policy Expectations and Treasury Yields
Feb. 1 Feb. 4 Feb. 9 Feb. 14 Feb. 17 Feb. 23 Feb. 28 Mar. 3 Mar. 8 Mar. 112.6
2.8
3.0
3.2
3.4
3.6
3.8
4.0
4.2
Note. 5-minute intervals.
FebruaryFOMC
Februaryminutes
Chairman’stestimony PPI
Januaryemployment report
Februaryemployment report
CorePCE
Futures Contract RatesPercent
December 2005 Eurodollar
April 2005 federal funds
Mar. July Nov. Mar. July Nov. Mar.2005 2006 2007
2.5
3.0
3.5
4.0
4.5PercentImplied Federal Funds Futures Rate
Note. Estimates from federal funds and Eurodollar futures,with an allowance for term premia and other adjustments.
February 1, 2005
March 15, 2005
Jan. Apr. July Oct. Jan.2004 2005
1
2
3
4
5
6
7PercentTreasury Yields
10-year
2-year
Mar.15
Daily
Note. Estimates from smoothed Treasury yield curve basedon off-the-run securities.
FOMC
Jan. Apr. July Oct. Jan.2004 2005
1.5
2.0
2.5
3.0
3.5
4.0PercentInflation Compensation
Note. Estimates based on smoothed nominal and inflation-indexed Treasury yield curves.
5 to 10years ahead
5-year
DailyFOMC
Mar.15
Jan. Apr. July Oct. Jan.2004 2005
50
100
150
200
250
300
350
400Basis pointsPolicy Uncertainty
Note. Width of a 90 percent confidence interval for thefederal funds rate computed from the term structures for boththe expected federal funds rate and implied volatility.
DailyFOMC
12 months ahead
6 months ahead
Mar.15

Domestic Financial Developments
Overview During the intermeeting period, investors focused on Federal Reserve statements that suggested continued tightening of monetary policy and on incoming data that pointed to sustained economic growth and the possible emergence of inflationary pressure. Market participants shifted up the anticipated path for the federal funds rate, and nominal Treasury yields rose sharply across the yield curve, accompanied by significant increases in inflation compensation. Despite the higher interest rates and oil prices, stock prices edged up and spreads on corporate bonds narrowed, especially for speculative-grade firms. In recent months, the pace of total net business borrowing has quickened, and household borrowing has remained brisk. Policy Expectations and Interest Rates The decision at the February FOMC meeting to increase the federal funds rate target 25 basis points and to retain the “measured pace” language matched market expectations. However, investors marked up their policy expectations in the wake of several events, including higher-than-expected readings on inflation, increases in oil prices, and the Chairman’s monetary policy testimony, which was interpreted as indicating no imminent pause in monetary tightening. The release of the minutes of the February FOMC meeting the week after the monetary policy testimony prompted little market reaction. The market has now fully priced in 75 basis points of cumulative tightening over the next three FOMC meetings. Uncertainty about the future path of policy was about unchanged over the intermeeting period. The yield on the two-year Treasury note rose by about 50 basis points over the intermeeting period, while the ten-year yield increased 40 basis points. Market expectations for faster inflation likely contributed to the rise in yields, especially at shorter maturities. Five-year TIPS-based inflation compensation increased about 35 basis points amid the higher-than-expected inflation data and rising oil prices; although inflation compensation over the subsequent five years only edged up, the front-loaded rise still implies a 25 basis point increase over a ten-year period. Upward pressures on the ten-year yield also may have been amplified by the Chairman’s remark in his semiannual testimony that the then-prevailing low level of long-term interest rates was a “conundrum.” Corporate Yields, Risk Spreads, and Stock Prices Broad equity price indexes rose on net by less than 1 percent over the intermeeting period after touching four-year highs in early March, as generally positive earnings news and a

III-2
Corporate Yields, Risk Spreads, and Stock Prices
65
70
75
80
85
90
95
100
105
110
115
120Ratio scale, Feb. 2, 2005=100
Jan. Mar. May July Sept. Nov. Jan. Mar.2004 2005
Stock Price Indexes
Daily
S&P 500
Dow Jones Energy Index
FOMC
Mar. 15
2
4
6
8
10
12Percent
1985 1989 1993 1997 2001 2005
12-Month Forward Trend Earnings-Price Ratiofor S&P 500 and Long-Run Treasury Yield
Monthly
12-month forwardtrend E/P ratio
Long-run real Treasury yield*
+
+
Mar. 15
* Yield on synthetic Treasury perpetuity minus Philadelphia Fed 10-year expected inflation. + Denotes the latest observation using daily interest rates and stock prices and latest earnings data from I/B/E/S.
10
20
30
40
50
60
Percent
2002 2003 2004 2005
Implied Volatility on Nasdaq 100 (VXN) andS&P 500 (VIX)
Weekly Friday*
S&P 500
NasdaqFOMC
Mar. 15
* Latest observation is for most recent business day.
6
8
10
12
14
3
5
7
9Percent Percent
2002 2003 2004 2005
Yields for BBB and High-Yield Corporate Bonds
Daily
5-year high yield(left scale)
10-year BBB(right scale)
FOMC
Mar. 15
Note. Yields from smoothed yield curves based on Merrill Lynch bond data.
100
300
500
700
900
1100
50
150
250
350
450Basis points Basis points
1995 1997 1999 2001 2003 2005
Corporate Bond Spreads to Similar-Maturity Treasuries
Daily
5-year high yield(left scale)
10-year BBB(right scale) Mar.
15 0
30
60
90
120
150
Basis points
1999 2001 2003 2005
Commercial Paper Quality Spread(30-Day A2/P2 less A1/P1)
Weekly Friday*
Mar. 15
* Latest observation is for most recent business day.

III-3
continued flow of merger announcements offset the effects of higher long-term interest rates and oil prices. Energy-related and basic materials stocks posted especially large gains in response to the recent run-up in the prices of oil and other commodities, while the remainder of the market edged down. The gap between the trend-adjusted forward earnings-price ratio and the real perpetuity Treasury yield was little changed and remained near its long-term average and well below its recent high in early 2003.1 Both implied and realized volatilities on the Nasdaq 100 and S&P 500 have stayed near historical lows. Yields on investment-grade bonds moved up a bit less than comparable-maturity Treasury yields over the intermeeting period and spreads fell a touch. Spreads on high-yield bonds narrowed considerably more—roughly 50 basis points. The implied risk premium for high-yield spreads based on the staff’s model of expected defaults and recoveries is now quite narrow and near levels last seen in 1997. The quality spread on commercial paper has remained low. Corporate Earnings and Credit Quality With fourth-quarter reports in hand from virtually all of the S&P 500 firms, earnings per share are estimated to have risen roughly 19 percent relative to a year earlier, a pace that continues the solid growth recorded over the past few years. Revisions to forecasts of year-ahead earnings were slightly positive on net in February and early March, a reflection of upward revisions for energy firms. Net revisions excluding these firms were slightly negative and similar to their levels in recent months. Credit quality for nonfinancial firms remains strong. Aggregate cash positions are still very large, although they appear to have ticked down in the fourth quarter because of Microsoft’s special dividend and Cingular’s cash-financed acquisition of AT&T Wireless. The value of bond upgrades exceeded bond downgrades in January and February. Meanwhile, the six-month trailing bond default rate, which edged up in recent months, remains at a modest level, and the C&I loan delinquency rate continued to trend downward in the fourth quarter. Firm-level estimates by KMV as of January indicate that the aggregate expected year-ahead default rate has remained low.
1 The unadjusted forward earnings-price ratio, which we have presented previously in the Greenbook as a rough estimate of the expected real return on the S&P 500, has a cyclical bias. In particular, when twelve-month-ahead (forward) earnings are above trend, as in recent months, the ratio is biased upward, and vice versa when earnings are below trend. The trend-adjusted forward earnings-price ratio uses the estimated trend component of forward earnings per share in place of actual forward earnings per share to eliminate this cyclical bias.

III-4
Corporate Earnings and Credit Quality
-30
-20
-10
0
10
20
30
Percent
S&P 500 EPSNIPA, economicprofits before tax
1989 1992 1995 1998 2001 2004
Corporate Earnings Growth
Quarterly*
Q4
Q3
* Change from four quarters earlier. Source. I/B/E/S for S&P 500 EPS.
-4
-3
-2
-1
0
1
2
Percent
S&P 500S&P 500 excluding energy
2002 2003 2004 2005
S&P 500 Revisions Index
Monthly
Mid- Feb.
Note. Index is a weighted average of the percent change in the consensusforecasts of current-year and following-year EPS for constant sample.
0.03
0.06
0.09
0.12
0.5
1.0
1.5
2.0
2.5
Ratio Ratio
1989 1992 1995 1998 2001 2004
Cash and Equivalents
Nonfinancial corporations
Over fixed investment(right scale)
Over assets(left scale)
Q4
Note. Computstat data, annual through 1999 and quarterly thereafter; fixedinvestment is at an annual rate. e Staff estimate.
e
1993 1995 1997 1999 2001 2003 200550
40
30
20
10
0
10
20
30Upgrades
Downgrades
Bond Ratings Changes ofNonfinancial Companies Percent of outstandings
Note. Data are at an annual rate.
H1H2
Q1*
* Data through February. Source. Moody’s Investors Service.
0
1
2
3
4
5
6
7Percent of outstandings
1990 1993 1996 1999 2002 2005
Bond Defaults andC&I Loan Delinquency Rates
C&I loan delinquency rate (Call Report)
Bond default rate* Feb.
Q4
* 6-month moving average, from Moody’s Investors Service.
0.0
0.5
1.0
1.5
2.0Percent of liabilities
1993 1996 1999 2002 2005
Expected Year-Ahead Defaults
Monthly
Jan.
Note. Firm-level estimates of default weighted by firm liabilities as apercent of total liabilities, excluding defaulted firms. Source. KMV Corporation.

III-5
Business FinanceGross Issuance of Securities by U.S. Corporations(Billions of dollars; monthly rates, not seasonally adjusted)
2004 2005Type of security 2001 2002 2003 H1 H2 Jan. Feb.
Nonfinancial corporationsStocks1 6.5 5.2 3.7 5.7 4.9 2.0 7.7 Initial public offerings 2.1 0.7 0.4 0.8 2.3 0.9 4.8 Seasoned offerings 4.4 4.4 3.2 4.9 2.6 1.1 2.9
Bonds2 39.8 24.8 31.6 22.8 22.7 15.5 17.6 Investment grade 27.5 15.7 16.0 8.2 8.5 4.6 5.5 Speculative grade 8.9 4.8 11.3 10.5 8.5 7.3 9.0 Other (sold abroad/unrated) 3.4 4.2 4.3 4.1 5.7 3.6 3.2
MemoNet issuance of commercial paper3 -8.0 -6.3 -3.8 2.8 -0.1 19.2 3.8Change in C&I loans at commercial banks3,4 -5.8 -5.2 -7.9 -0.7 7.2 18.1 3.8
Financial corporationsStocks1 4.2 4.0 6.9 8.3 5.1 4.2 3.7Bonds2 80.2 87.0 111.1 131.1 147.6 164.2 93.7
Note. Components may not sum to totals because of rounding. 1. Excludes private placements and equity-for-equity swaps that occur in restructurings. 2. Data include regular and 144a private placements. Bond totals reflect gross proceeds rather than par value of original discount bonds. Bonds are categorized according to Moody’s bond ratings, or to Standard & Poor’s if unrated by Moody’s. 3. End-of-period basis, seasonally adjusted. 4. Adjusted for FIN 46 effects.
2001 2002 2003 2004 2005
-20
-10
0
10
20
30
40
50
Commercial paper*C&I loans*Bonds
Total
Selected Components of Net Debt Financing
Billions of dollars
Monthly rate, nonfinancial firms
H1 H2 Jan. Feb.
* Seasonally adjusted, period-end basis.
2001 2002 2003 2004
-50
-40
-30
-20
-10
0
10
20
30
40
50
Public issuancePrivate issuanceRepurchasesCash mergers
Total
Components of Net Equity Issuance
Billions of dollars
Monthly rate, nonfinancial firms
H1Q3 Q4 e
e Staff estimate.

III-6
1996 1998 2000 2002 2004 0
2
4
6
8
10
12
14
16
18Percent
Q4
Growth of Commercial Mortgage Debt
Quarterly, s.a.a.r.
Billions of dollars
Quarterly
1996 1998 2000 2002 20040
5
10
15
20
25
30
35
Gross Issuance of CMBS
* Through March 11. ** Staff estimate for Q1. Source. Commercial Mortgage Alert.
**
*
2000 2001 2002 2003 2004 2005 3
4
5
6
7
8
9
10Percent
Jan.
10-Year Commercial Mortgage Rates
Source. Barron’s/Levy.
Monthly
2000 2001 2002 2003 2004 2005 0
50
100
150
200
250
300Basis points
AAA
BBB
Mar. 9
Investment-Grade CMBSSpreads over 10-Year Treasury
Source. Morgan Stanley.
Weekly
1996 1998 2000 2002 2004
0
1
2
3
4Percent
Q4
Q3
Feb.
At lifeinsurancecompanies
CMBS
At commercial banks
Delinquency Rates on CommercialMortgages and CMBS
Source. Call Report, ACLI, Morgan Stanley.
2
3
4
5
6
7
1986 1989 1992 1995 1998 2001 20042
3
4
5
6
7Index, 1990:Q1=4 Percent
Ratio of net operating income to price* (left scale)
Long-run real Treasury yield** (right scale)
Q4
Q4
Commercial Real Estate Valuation
Quarterly
* Staff calculation from NCREIF data. ** Yield on synthetic Treasury perpetuity minus Philadelphia Fed 10-year expected inflation.
Commercial Real Estate

III-7
Business Finance Gross issuance of bonds by nonfinancial corporations in February and early March maintained the relatively slow pace seen in January and was held down by limited offerings from investment-grade firms. In contrast, speculative-grade issuance remained brisk, similar to the pace last year, and the share of issuance by the weaker firms in this group—those rated B minus and below—has picked up this year. Nevertheless, in contrast to 1997 and the first half of 1998, speculative-grade issuers are reportedly still largely using the proceeds to refinance their existing debt—and thereby improve their balance sheets—rather than to fund expansion. With regard to shorter-term borrowing, commercial paper and C&I loans expanded further in February, albeit at a more moderate pace than in January. Overall, net debt financing from these sources in the current quarter is on a somewhat stronger track than it was in the second half of 2004, but it remains moderate. Equity issuance by nonfinancial firms through mid-March stayed at the moderate pace recorded last year. IPOs have accounted for the bulk of issuance this year, as seasoned offerings have continued to be muted by firms’ low leverage and ample cash. Completions of share repurchases, which were fueled by strong profits and substantial liquid assets, rose from an already elevated rate to a record pace in the fourth quarter. Cash-financed mergers jumped as well, in part because of the merger of Cingular and AT&T Wireless. For the first quarter, announcements of share repurchases and merger activity have been strong but have not matched the torrid pace of the fourth quarter. Commercial Real Estate Commercial mortgage debt rose at a 12½ percent annual rate in the fourth quarter, and a full CMBS calendar suggests solid growth in the current quarter. Investment-grade CMBS spreads over the ten-year Treasury yield are still narrow. Delinquency rates on loans backing CMBS have fallen almost 1 percentage point on net since their peak in late 2003, and those on commercial mortgages on the books of banks and life insurance companies remain quite low. The ratio of net operating income to property prices—an indicator of the rate of return on commercial real estate—declined further in the fourth quarter. The spread of this ratio over the real perpetuity Treasury yield, a rough measure of the risk premium on commercial real estate assets, widened somewhat in the fourth quarter but remained in the lower part of the range observed over the past decade.

III-8
1996 1998 2000 2002 2004 0
2
4
6
8
10
12
14
16
18Percent
Q1e
Mortgage Debt Growth
Quarterly, s.a.a.r.
e Staff estimate.1996 1998 2000 2002 2004
4
5
6
7
8
9Percent
Mar. 9
30-year Fixed-Rate Mortgage Rate
Weekly
Source: Freddie Mac.
1996 1998 2000 2002 2004 2
4
6
8
10
12
14
16Percent change from year earlier
Jan.
Consumer Credit Growth
1996 1998 2000 2002 200417.0
17.5
18.0
18.5
19.0Percent
Financial Obligations Ratio
Q4
+
+ Q4 value excluding Microsoft dividend.
Quarterly, n.s.a.
1996 1998 2000 2002 20041
2
3
4
5
Percent
Auto loans at captive finance companies
Residential mortgages at commercial banks
Credit card loans at commercial banks
Jan.
Q4
Q4
Delinquency Rates
Source. Call Reports, Federal Reserve.1996 1998 2000 2002 2004
300
350
400
450
500
550
600
650Filings per 100,000 persons
8-week moving average, s.a.a.r.
Mar. 12
Household Bankruptcies
Source. Visa Bankruptcy Notification Service.
Household Liabilities

III-9
1990 1992 1994 1996 1998 2000 2002 20044
5
6
7Net Worth Relative to Disposable Income Ratio
Quarterly, period-end, s.a.
Household Assets
Q4
1990 1992 1994 1996 1998 2000 2002 2004 50
150
250
350Asset Prices 1993:Q1 = 100
Quarterly, n.s.a.
Stock prices (Wilshire 5000)
House prices*
Q4
Q4
* Source. Office of Federal Housing Enterprise Oversight (OFHEO).
Net Flows into Long-Term Mutual Funds(Billions of dollars, monthly rate)
Fund type 2003 2004 2004 Assets Q2 Q3 Q4 Jan. Feb.e Jan.
Total long-term funds 18.0 18.5 3.8 11.7 21.8 18.9 28.5 6,109 Equity funds 12.7 15.1 11.3 6.9 14.0 8.7 20.9 4,290 Domestic 10.7 9.5 7.6 3.8 6.7 0.7 9.2 3,601 International 2.0 5.7 3.7 3.1 7.3 8.1 11.7 688 Hybrid funds 2.7 3.6 3.1 2.8 3.3 5.3 3.6 517 Bond funds 2.6 -0.3 -10.5 2.0 4.5 4.8 4.0 1,302 High-yield 2.2 -0.8 -2.7 0.5 0.6 -2.1 0.1 155 Other taxable 1.0 1.6 -4.0 2.0 4.0 6.0 2.8 816 Municipals -0.6 -1.1 -3.9 -0.5 -0.2 0.9 1.1 331
Note. Excludes reinvested dividends.
e Staff estimates based on confidential ICI weekly data.
Source. Investment Company Institute.

III-10
Treasury Financing(Billions of dollars)
Item2004 2005
Q1 Q2 Q3 Q4 Jan. Feb.
Total surplus, deficit (–) -170.8 -25.7 -85.7 -118.6 8.6 -113.9Means of financing deficit
Net borrowing 135.9 40.7 83.4 102.8 20.2 79.5Nonmarketable -10.1 6.2 -5.2 3.1 5.4 -0.7Marketable 146.0 34.5 88.6 99.7 14.8 80.2
Bills 56.1 -34.9 14.3 43.6 -16.4 43.9Coupons 89.9 69.4 74.3 56.0 31.2 36.2
Decrease in cash balance 11.9 -23.3 8.3 11.7 -36.6 41.7Other1 23.0 8.3 -6.0 4.2 7.9 -7.2
Memo:Cash balance, end of period 21.3 44.6 36.3 24.7 61.3 19.6
Note. Components may not sum to totals because of rounding.1. Direct loan financing, accrued items, checks issued less checks paid, and other transactions.
Agency Market Developments
Oct. Nov. Dec. Jan. Feb. Mar.2004 2005
15
20
25
30
35
40
45Basis points
Ten-year Agency Spreads over Treasury
Daily
Fannie Mae
Freddie Mac
Mar. 15
Oct. Nov. Dec. Jan. Feb. Mar.2004 2005
85
90
95
100
105
110
115Oct. 1, 2004 = 100
Agency Stock Prices
Daily
Fannie Mae
Freddie Mac
Mar. 15

III-11
Household Finance Household mortgage debt continued to expand at a double-digit annual rate in the fourth quarter. Although interest rates on thirty-year fixed-rate mortgages have risen in recent weeks, they remain low and should contribute to strong mortgage debt growth in the current quarter. Consumer credit posted another moderate gain in the fourth quarter and picked up a bit in January. The household financial obligations ratio declined in the fourth quarter because an increase in required debt payments was more than offset by a spike in disposable personal income stemming from Microsoft’s special dividend payment. Without the Microsoft dividend, the financial obligations ratio would have edged up to its highest value in more than a year. Even so, measures of household credit quality have remained strong. At commercial banks, delinquency rates on credit card loans were about unchanged, and rates on residential mortgages declined in the fourth quarter. In addition, delinquency rates on auto loans at captive finance companies remained low in January, and bankruptcy filings thus far in the year have continued to run below their year-ago levels. However, filings may surge in coming months if the bankruptcy bill now working its way through the Congress becomes law.2 The ratio of household net worth to disposable personal income increased in the fourth quarter; the lift came from solid gains in both equity and house prices. Although stock prices were little changed on net in January and February, equity mutual fund inflows in these months maintained the strong pace seen in the fourth quarter. Treasury and Agency Finance Treasury borrowing has continued to expand at a steady pace in recent months. Indirect bidding at recent Treasury auctions—a rough proxy for demand from foreign official institutions—has remained generally strong. Treasury securities held in custody at the Federal Reserve Bank of New York (FRBNY) on behalf of foreign official institutions resumed their robust growth with an increase of about $22 billion over the intermeeting period. Fannie Mae’s stock price declined in response to both the revelation of more accounting irregularities at the company and Chairman Greenspan’s remarks about the desirability of
2 This bill, which has been passed by the Senate but not yet by the House, would make it more difficult
for households to discharge their debts through chapter 7 filings. The tougher standards would take effect 180 days after the President signs the bill and so could spur a rush to file in the intervening months.

III-12
State and Local Government FinanceGross Offerings of Municipal Securities
(Billions of dollars; monthly rate, not seasonally adjusted)
2004 2005
Type of security 2001 2002 2003 H1 H2 Jan. Feb.
Total 29.0 36.3 37.8 36.1 33.4 24.3 32.1 Long-term 1 24.3 30.3 32.0 31.9 27.8 22.7 30.5 Refundings 2 7.6 10.1 10.0 11.5 10.0 9.2 13.1 New capital 16.7 20.2 22.1 20.5 17.9 13.5 17.4 Short-term 4.7 6.0 5.8 4.2 5.5 1.6 1.6
Memo: Long-term taxable 1.4 1.7 3.5 2.5 1.6 1.1 1.6
1. Includes issues for public and private purposes. 2. All issues that include any refunding bonds.
1991 1993 1995 1997 1999 2001 2003 20052000
1500
1000
500
0
500
1000
1500
2000
Upgrades
Downgrades
Bond Rating Changes
Number of rating actions
Annual rate Q1*
* Data through March 9 at an annual rate. Source. S&P’s Credit Week Municipal and Ratings Direct.
0
1
2
3
4
5
6
7General Obligation Percent
1996 1999 2002 2005
Municipal Bond Yields
Weekly
20-year
1-year
Mar. 10
Mar. 15
Source. Bloomberg and Bond Buyer.
0.7
0.8
0.9
1.0
General Obligation over Treasury Ratio
1996 1999 2002 2005
Municipal Bond Yield Ratio
Weekly
20-year
Mar. 10
Source. Bond Buyer.

III-13
the size of the housing GSEs’ investment portfolios. However, credit spreads for the GSEs remain very low amid reduced issuance as well as continued strong demand from foreign official institutions, as judged by FRBNY custody holdings. State and Local Government Finance Gross issuance of long-term municipal bonds was rapid in February. Advance refundings were boosted by municipalities taking advantage of a temporary dip in long-term rates, while new capital issuance continued to be supported by projects related to higher education. In contrast, short-term issuance was muted, likely because of the stronger budget situation in many states. Credit quality continued to improve, as upgrades of municipal bonds far outpaced downgrades. Municipal bond yields increased, and the ratio of long-term municipal bond yields to comparable-maturity Treasury yields was about unchanged in recent weeks. Money and Bank Credit M2 growth averaged about 2½ percent at an annual rate over the first two months of the year, about half of the fourth-quarter pace. The weaker growth was concentrated in liquid deposits, likely the result of the higher opportunity costs associated with holding such deposits. In contrast, small time deposits, whose rates typically align more closely with market rates, expanded rapidly in January and February. The ongoing runoff in money market funds also contributed to the slow M2 growth; investors evidently found bond and equity funds an attractive alternative to money market funds. Bank credit growth has picked up sharply this year to an average annual rate of 17 percent in January and February. A jump in holdings of securities, particularly agency-related mortgage-backed securities, accounted for a bit more than half of the expansion. Loan growth was also brisk, with business and real estate loans posting solid increases.

III-14
Monetary Aggregates(Based on seasonally adjusted data)
2004 2005 Level(billions of
dollars), Aggregate or component 2003 2004 Q3 Q4 Jan. Feb. Feb.
(p) (p)Aggregate
5.5 5.3 3.5 5.7 2.6 2.6 6,4654.8 5.9 4.3 3.5 5.0 2.2 9,511
3. Currency 5.9 5.5 7.5 5.0 4.8 3.4 70214.1 10.2 6.1 8.5 1.2 2.2 4,213
5. Small time deposits -9.3 -.3 1.7 5.5 13.8 16.2 8366. Retail money market funds -11.4 -11.8 -11.4 -9.5 -3.7 -11.1 707
Components of M33.5 7.2 5.9 -1.0 10.1 1.2 3,0464.3 20.9 17.9 10.0 66.2 18.3 1,141
9. Institutional money -5.6 -5.7 -6.3 -12.2 -13.1 -20.1 1,040 market funds10. RPs 14.1 1.2 -.4 -17.8 -66.8 40.3 49811. Eurodollars 27.7 26.9 23.0 28.4 21.2 -39.2 367
Memo12. Monetary base 5.9 5.5 7.3 4.5 4.2 5.6 765
Selected managed liabilitiesat commercial banks13. Large time deposits, gross -1.1 14.8 17.3 9.9 53.3 7.9 1,26314. Net due to related foreign institutions 3.1 -10.4 -9.8 -3.7 50.6 -1.4 8915. U.S. government deposits at commercial banks -.3 .2 -2.8 1.9 1.9 1.1 18
1. For the years shown, Q4-to-Q4 percent change. For the quarters shown, based on quarterly averages. 2. Sum of currency, liquid deposits (demand, other checkable, savings), small time deposits, retail money market funds, and nonbank traveler's checks. 3. Sum of M2, net large time deposits, institutional money market funds, RP liabilities of depository institutions, and Eurodollars held by U.S. addressees. 4. Nonbank traveler's checks not listed. 5. Sum of demand deposits, other checkable deposits, and savings deposits. 6. Sum of large time deposits, institutional money market funds, RP liabilities of depositoryinstitutions, and Eurodollars held by U.S. addressees. 7. Net of holdings of depository institutions, money market funds, U.S. government, and foreign banks and official institutions. 8. For the years shown, "average monthly change" is the Q4-to-Q4 dollar change divided by 12. For the quarters shown, it is the quarter-to-quarter dollar change divided by 3. p Preliminary.
Percent change (annual rate)1
1. M22
2. M33
Components of M24
4. Liquid deposits5
7. M3 minus M26
8. Large time deposits, net7
Average monthly change (billions of dollars)8

III-15
Commercial Bank Credit(Percent change, annual rate, except as noted; seasonally adjusted)
Level,Type of credit 2003 H1 Q3 Q4 Jan. Feb. Feb. 2005
2004 2004 2004 2005 2005 ($ billions)
Total 1. Adjusted1 5.9 11.8 5.2 6.3 13.9 20.2 6,705 2. Reported 5.6 10.4 5.8 6.2 11.0 18.6 6,850
Securities 3. Adjusted1 8.6 16.9 -8.1 1.0 30.5 36.7 1,834 4. Reported 7.2 11.6 -4.8 1.3 18.8 29.7 1,979 5. Treasury and agency 8.9 17.9 -4.4 -11.2 30.9 34.7 1,211 6. Other2 4.8 2.0 -5.6 22.1 .6 21.9 768
Loans3
7. Total 4.9 9.9 10.3 8.2 7.9 14.1 4,871 8. Business -9.4 -3.9 7.0 6.2 23.3 11.6 921 9. Real estate 11.1 15.8 8.3 12.8 11.7 12.0 2,587 10. Home equity 30.8 39.9 37.2 37.3 20.5 5.0 407 11. Other 8.8 12.4 3.7 8.6 10.0 13.4 2,180 12. Consumer 5.4 7.9 19.9 -1.8 9.8 .0 679 13. Adjusted4 5.8 4.0 12.3 2.3 11.3 -15.9 1,044 14. Other5 6.7 9.9 12.4 4.6 -29.0 40.1 683
Note. Data are adjusted to remove estimated effects of consolidation related to FIN 46 and for breaks caused byreclassifications. Monthly levels are pro rata averages of weekly (Wednesday) levels. Quarterly levels (not shown)are simple averages of monthly levels. Annual levels (not shown) are levels for the fourth quarter. Growth rates arepercentage changes in consecutive levels, annualized but not compounded. 1. Adjusted to remove effects of mark-to-market accounting rules (FIN 39 and FAS 115). 2. Includes private mortgage-backed securities, securities of corporations, state and local governments, foreigngovernments, and any trading account assets that are not Treasury or agency securities, including revaluation gainson derivative contracts. 3. Excludes interbank loans. 4. Includes an estimate of outstanding loans securitized by commercial banks. 5. Includes security loans and loans to farmers, state and local governments, and all others not elsewhere classified.Also includes lease financing receivables.

International Developments

International Developments
U.S. International Transactions Trade in Goods and Services The U.S. international trade deficit widened to $58.3 billion in January from $55.7 billion in December (revised).
Net Trade in Goods and Services(Billions of dollars, seasonally adjusted)
Annual rate Monthly rate2004 2004 2004 2005
Q2 Q3 Q4 Nov. Dec. Jan.Real NIPA1
Net exports of G&S -584.3 -580.3 -583.2 -623.4 ... ... ...
Nominal BOPNet exports of G&S -617.1 -605.3 -623.5 -684.2 -59.4 -55.7 -58.3
Goods, net -665.5 -655.5 -668.1 -734.2 -63.5 -59.9 -62.3Services, net 48.4 50.2 44.6 50.0 4.1 4.1 4.0
1. Billions of chained (2000) dollars.Source. U.S. Department of Commerce, Bureaus of Economic Analysis and Census.n.a. Not available. ... Not applicable.
In January, the value of exports of goods and services increased 0.4 percent. Exports of automotive products were strong, due to sizable growth in exports to non-NAFTA countries. However, most other categories of goods exports showed modest declines. Among capital goods, telecommunications equipment was the only category that exhibited an increase, with computers, semiconductors, aircraft, and other capital goods all declining. Exports of industrial supplies fell slightly, while consumer goods retreated a bit from an extremely robust December. In December, the value of exports of goods and services jumped 3.2 percent after falling almost 1 percent in November. The export figures for November were revised up more than $1.5 billion, largely on account of a correction to data provided by Statistics Canada, which are used to measure U.S. exports to Canada. In the fourth quarter, exports of goods and services climbed 8¼ percent at an annual rate. The increase was widespread, with the exception of exports of automotive products, which fell in the quarter. The value of imported goods and services increased 1.9 percent in January. A large decline in the value of imported oil was more than offset by a sharp increase in imports of non-oil goods. Services imports also increased smartly. The rise in non-oil goods

IV-2
U.S. International Trade in Goods and Services
-750
-700
-650
-600
-550
-500
-450
-400
-350
-300
-250
-200
-150
-100
-50Nominal
BOP basis
RealNIPA basis
(2000$)
1997 1999 2001 2003 2005
Net Exports Bil$, s.a.a.r.
20
40
60
80
100
120
140
160
180
200
220
Machinery 2/
Industrialsupplies 1/
Consumer goods
Aircraft
1997 1999 2001 2003 20051. Excludes agriculture and gold.2. Excludes computers and semiconductors.
Selected Exports Bil$, s.a.a.r.
-4
-3
-2
-1
0
1
2
3Percentage points, s.a.a.r.
1997 1999 2001 2003 2005
Contribution of Net Exports to Real GDP Growth
-80
-60
-40
-20
0
20Net trade in computersand semiconductors
Net automotive tradewith Canada and Mexico
1997 1999 2001 2003 2005
Bil$, s.a.a.r.
120
140
160
180
200
220
240
260
280
300
320
340
360
380
400
50
70
90
110
130
150
170
190
210
230
250
270
290
Consumer goods
Machinery 2/
Industrialsupplies 1/
Automotive 3/ (overseas)
1. Excludes oil and gold.2. Excludes computers and semiconductors.3. Excludes Canada and Mexico.
1997 1999 2001 2003 2005
Selected Imports Bil$, s.a.a.r.

IV-3
U.S. Exports and Imports of Goods and Services(Billions of dollars, s.a.a.r., BOP basis)
Levels Change1
2004 2004 2005 2004 2004 2005Q3 Q4 Dec. Jan. Q3 Q4 Dec. Jan.
Exports of G&S 1160.4 1183.5 1205.1 1209.9 22.0 23.2 37.2 4.8
Goods exports 820.0 834.2 853.6 855.0 21.2 14.2 36.3 1.5Gold 5.0 4.9 5.0 5.8 1.5 -0.0 0.4 0.8Other goods 815.1 829.3 848.6 849.2 19.7 14.2 35.8 0.7
Aircraft & parts 51.9 51.9 51.9 50.7 4.2 0.0 1.7 -1.3Computers & accessories 43.2 43.6 45.7 45.1 1.3 0.4 3.3 -0.6Semiconductors 46.4 46.0 44.7 43.8 -2.8 -0.4 -1.9 -0.9Other capital goods 193.3 194.5 202.4 202.7 2.5 1.2 15.8 0.3
Automotive 92.2 91.9 93.7 97.0 6.8 -0.3 3.4 3.3to Canada 52.1 50.7 54.0 53.8 5.2 -1.4 5.7 -0.2to Mexico 14.6 16.3 13.6 14.1 -1.4 1.7 -4.0 0.5to ROW 25.5 25.0 26.1 29.1 3.1 -0.6 1.7 3.0
Agricultural 61.1 62.8 62.7 61.9 -2.2 1.6 0.3 -0.8Ind supplies (ex. ag, gold) 190.5 200.1 204.9 204.5 6.6 9.6 8.4 -0.4Consumer goods 102.8 108.1 112.8 110.6 0.4 5.3 7.3 -2.2All other goods 33.7 30.4 29.7 33.0 2.8 -3.3 5.9 3.2
Services exports 340.3 349.3 351.5 354.9 0.8 9.0 1.0 3.4
Imports of G&S 1783.8 1867.7 1874.0 1909.2 40.2 83.9 -6.8 35.2
Goods imports 1488.1 1568.4 1571.9 1602.4 33.8 80.3 -7.2 30.5Petroleum 179.0 217.3 209.6 198.4 15.3 38.2 -25.2 -11.2Gold 4.0 4.8 5.5 3.5 0.7 0.8 1.4 -2.0Other goods 1305.1 1346.3 1356.8 1400.5 17.7 41.2 16.6 43.7
Aircraft & parts 24.2 28.0 28.1 26.8 -0.2 3.7 4.7 -1.4Computers & accessories 91.6 91.9 93.5 91.0 3.6 0.3 2.8 -2.5Semiconductors 27.6 25.5 24.0 25.7 0.2 -2.1 -1.3 1.7Other capital goods 208.6 213.8 217.2 225.4 6.7 5.3 0.4 8.2
Automotive 231.5 230.4 230.4 236.9 2.9 -1.1 2.3 6.5from Canada 69.3 70.5 70.9 69.8 1.4 1.1 3.9 -1.1from Mexico 42.1 44.1 39.3 35.9 -2.7 2.0 -4.2 -3.4from ROW 120.1 115.9 120.2 131.2 4.1 -4.2 2.7 11.0
Ind supplies (ex. oil, gold) 240.8 246.6 250.8 255.3 16.6 5.8 10.2 4.5Consumer goods 366.2 390.4 391.6 415.3 -9.9 24.2 -2.5 23.7Foods, feeds, bev. 60.9 65.0 66.8 66.6 -1.6 4.1 1.6 -0.2All other goods 53.7 54.7 54.4 57.5 -0.4 1.1 -1.5 3.1
Services imports 295.7 299.3 302.1 306.8 6.4 3.6 0.3 4.6
Memo:Oil quantity (mb/d) 13.02 14.55 15.12 14.59 0.08 1.53 -0.44 -0.54Oil import price ($/bbl) 37.57 40.90 37.85 37.24 3.04 3.33 -3.37 -0.61
1. Change from previous quarter or month.Source. U.S. Department of Commerce, Bureaus of Economic Analysis and Census.

IV-4
----------------------- BLS prices ---------------------
--------------------- NIPA prices ---------------------
Prices of U.S. Imports and Exports(Percentage change from previous period)
Annual rate Monthly rate2004 2005 2004 2005
Q3 Q4 Q1 Nov. Dec. Jan.
Merchandise imports 7.4 7.9 7.3 -0.3 -1.4 0.9Oil 43.2 57.1 35.1 -6.0 -11.5 4.6Non-oil 3.0 1.5 3.2 0.9 0.4 0.2
Core goods* 4.3 2.4 4.2 1.1 0.4 0.4Cap. goods ex comp & semi 0.0 1.6 2.6 0.3 0.5 0.8Automotive products 1.4 1.7 2.5 0.1 0.2 -0.1Consumer goods -0.5 -0.4 1.2 0.2 0.3 0.4Foods, feeds, beverages 7.8 3.3 10.0 0.2 0.8 -0.2Industrial supplies ex oil 18.7 8.3 11.4 3.8 0.9 0.1
Computers -8.6 -9.0 -7.3 -0.3 -0.1 -1.4Semiconductors -7.0 -4.4 -4.5 0.1 -0.1 0.1
Merchandise exports 6.0 -0.1 3.8 0.3 0.2 0.7
Core goods* 6.6 0.6 5.1 0.4 0.3 0.8Cap. goods ex comp & semi 0.8 1.3 3.4 0.3 0.2 0.7Automotive products 1.3 0.9 1.2 0.1 0.1 0.3Consumer goods 1.1 2.3 0.1 0.1 0.2 0.6Agricultural products 17.5 -31.0 -11.4 0.3 -1.0 0.3Industrial supples ex ag 14.4 14.5 17.4 0.8 0.5 1.5
Computers 0.3 -7.6 -9.2 -0.9 -0.7 -1.0Semiconductors 2.1 -3.9 -1.5 0.0 0.3 -0.1
Chain price indexImports of goods & services 5.1 7.9 n.a. ... ... ...
Non-oil merchandise 1.3 3.2 n.a. ... ... ...Core goods* 2.3 4.2 n.a. ... ... ...
Exports of goods & services 1.6 3.8 n.a. ... ... ...Total merchandise 1.2 3.9 n.a. ... ... ...
Core goods* 1.8 5.0 n.a. ... ... ...*/ Excludes computers and semiconductors.n.a. Not available. ... Not applicable.
5
1015
20
25
3035
40
45
5055
Spot West Texas Intermediate
Import unit value
1994 1995 1996 1997 1998 1999 2000 2001 2002 2003 2004 2005
Oil PricesDollars per barrel

IV-5
imports was widespread across categories, with notable increases in consumer goods and automotive products. Within capital goods, declines in the imports of computers, telecommunication equipment, and aircraft were more than offset by large gains in semiconductors and other capital goods. The value of imported goods and services was little changed in December, as a large decline in the value of imported oil offset an increase in non-oil imports. In the fourth quarter, nominal imports of goods and services increased just over 20 percent at an annual rate, with the increase roughly split in half between oil and non-oil imports. Within non-oil imports, most broad categories recorded gains, with the exception of automotive products which fell. Prices of Internationally Traded Goods Non-oil imports. In January, the prices of U.S. imports of non-oil goods and of core goods rose 0.2 and 0.4 percent, respectively. Higher prices for capital goods (excluding computers and semiconductors) and consumer goods were the main contributors to the price increase. For capital goods, the January price increase of 0.8 percent was the largest one-month change recorded since May 1995. The price index for imported industrial supplies increased only 0.1 percent in January, held down by an 8.3 percent decline in natural gas prices. Other categories of industrial supplies had notable price increases; for example, prices of building materials and chemicals each rose by just over 2 percent. Prices for imported automotive products and foods, feeds and beverages fell 0.1 and 0.2 percent, respectively, in January. Prices of imported computers fell 1.4 percent, whereas prices for semiconductors edged up. Oil. The BLS price of imported oil rose 4.6 percent in January. The spot price of West Texas Intermediate crude rose 8.1 percent in January, averaging about $46.80 per barrel. Although the average spot price in February was only about $1 per barrel higher, the spot price began to rise late in the month and closed on March 15 at $55.05 per barrel. The increase in oil prices is a reaction in part to oil demand that is stronger than was previously anticipated and remarks by OPEC that imply the cartel is targeting a higher level of oil prices. In addition, concerns about future supplies from Iraq, Iran, Nigeria, Venezuela, and Russia also continue to support oil prices. On March 16, OPEC announced a 500,000 barrel per day increase in its production target, but this had little

IV-6
immediate impact on prices. Subsequently, oil prices surged to new record highs in intraday trading after the release of lower-than-expected U.S. oil inventory data. Exports. In January, the prices of U.S. exports of total goods and of core goods increased 0.7 and 0.8 percent, respectively. Much of January’s rise was due to a 1.5 percent increase in prices of industrial supplies, reflecting higher prices for chemicals and petroleum products. In addition, export prices of capital goods (excluding computers and semiconductors) and consumer goods rose 0.7 and 0.6 percent, respectively. Prices for agricultural products and automotive products both increased 0.3 percent. For both computers and semiconductors, export prices fell in January. U.S. International Financial Transactions Foreign private demand for U.S. securities (line 4 of the Summary of U.S. International Transactions table) continued strong in both December and January. In each month there were substantial net acquisitions of agency (line 4b) and corporate (line 4c) debt securities, continuing recent trends. January saw the highest level of foreign net purchases of equities (line 4d) recorded in several years. Foreign acquisitions of U.S. Treasuries (line 4a) were flat in December but picked up sharply in January. For the fourth quarter as a whole, net private inflows were above the yearly average; for 2004, net purchases were the highest yet recorded and well above the 2003 level. During 2004 foreign investors acquired Treasuries, corporate debt, and equities at about the same pace as the preceding year and returned to acquiring agency debt after selling these securities during 2003. Net foreign official inflows (line 1) continued at about their yearly average in December at $30 billion, but fell to $19 billion in January.
. Net inflows during the fourth quarter remained high and in line with recent quarters; for the year, net official inflows were almost 50 percent larger than the previous year's record of $250 billion, owing in part to substantial first-quarter inflows. Partial data from the Federal Reserve Bank of New York indicate a large increase in reserve assets during February and early March, with the largest inflows from China and Russia. U.S. investors acquired foreign equities (line 5b) at an unusually high rate in December before returning to more normal levels in January, while recorded net purchases of

IV-7
foreign debt securities (line 5a) in December were offset by net sales in January. Although net U.S. acquisitions of foreign securities (line 5) were well above average during the fourth quarter, for the year they were only slightly above those recorded in 2003 and resulted almost entirely from increased holdings of foreign equities. During both 2002 and 2003 net inflows from foreign official institutions (primarily into securities) combined with foreign private purchases of U.S. securities exceeded U.S. acquisitions of foreign securities by slightly over $500 billion. For 2004, this same calculation results in a net inflow of over $700 billion. The volatile banking sector (line 3) recorded a modest inflow in December and a substantial outflow of $68 billion in January. For the year, the banking sector recorded a modest net outflow. Full balance of payments data for the fourth quarter, including direct investment, will be released March 16 and included in the Greenbook Supplement. U.S. direct investment abroad is expected to show a large increase during the fourth quarter resulting from the re-incorporation in the United States of News Corporation Ltd. (Australia), the Rupert Murdoch controlled media conglomerate valued at nearly $60 billion. The re-incorporation itself does not represent a net financial inflow. The positive entry that will appear in the direct investment account will be offset elsewhere, most likely by stock swaps reducing the value of U.S. portfolio assets abroad and increasing the value of foreign portfolio holdings of U.S. securities.

IV-8
2005Q1 Q2 Q3 Q4 Dec. Jan.
Official financial flows 250.1 363.3 137.0 71.5 71.9 82.8 29.5 18.6 1. Change in foreign official assets in the U.S. (increase, +) 248.6 360.5 136.4 70.4 71.5 82.1 28.8 14.8 a. G-10 countries 114.7 162.7 96.8 46.2 20.1 -.4 -3.7 .4 b. OPEC countries 6.1 12.1 3.3 -2.1 3.2 7.7 .6 3.2 c. All other countries 127.9 185.7 36.4 26.3 48.1 74.8 31.9 11.2 2. Change in U.S. official reserve assets (decrease, +) 1.5 2.8 .6 1.1 .4 .7 .7 3.8
Private financial flows 295.6 ... 1.6 93.4 81.3 ... … … Banks 3. Change in net foreign positions of banking offices in the U.S.1 64.7 -5.8 -39.9 35.6 -17.7 16.1 7.0 -68.1Securities2
4. Foreign net purchases of U.S. securities (+) 369.0 486.3 94.8 149.6 94.3 147.6 57.7 54.6 a. Treasury securities 114.0 120.0 42.9 63.2 1.2 12.6 .4 13.1 b. Agency bonds -10.1 83.7 1.9 33.3 5.8 42.8 15.6 9.9 c. Corporate and municipal bonds 224.7 244.8 44.2 49.5 81.7 69.4 35.0 14.5 d. Corporate stocks3 40.4 37.8 5.7 3.6 5.6 22.8 6.7 17.2 5. U.S. net acquisitions (-) of foreign securities -90.5 -112.3 -7.1 -33.3 -20.5 -51.4 -23.5 -2.1 a. Bonds 21.9 2.1 11.9 8.3 -3.2 -14.9 -7.0 5.5 b. Stock purchases -95.0 -101.1 -19.0 -28.9 -16.7 -36.5 -16.5 -7.6 c. Stock swaps3 -17.4 -13.3 .0 -12.7 -.6 .0 .0 .0Other flows (quarterly data, s.a.) 6. U.S. direct investment (-) abroad -173.8 ... -47.6 -55.3 -43.5 ... … … 7. Foreign direct investment in U.S. 39.9 ... 10.2 32.6 53.1 ... … … 8. Foreign holdings of U.S. currency 16.6 ... -1.8 8.8 2.6 ... … … 9. Other (inflow, + )4 69.7 ... -7.0 -44.6 12.9 ... … … U.S. current account balance (s.a.) -530.7 ... -147.2 -164.4 -164.7 ... … … Capital account balance (s.a.)5 -3.1 ... -0.4 -0.3 -0.4 ... … … Statistical discrepancy (s.a.) -12.0 ... 8.9 -0.2 11.8 ... … … NOTE. Data in lines 1 through 5 differ in timing and coverage from the balance of payments data published by the Departmentof Commerce. Details may not sum to totals because of rounding. 1. Changes in dollar-denominated positions of all depository institutions and bank holding companies plus certain transactions between broker-dealers and unaffiliated foreigners (particularly borrowing and lending under repurchase agreements). Includes changes in custody liabilities other than U.S. Treasury bills. 2. Includes commissions on securities transactions and therefore does not match exactly the data on U.S. international transactions published by the Department of Commerce. 3. Includes (4d) or represents (5c) stocks acquired through mergers. 4. Transactions by nonbanking concerns and other banking and official transactions not shown elsewhere plus amounts resulting from adjustments made by the Department of Commerce and revisions in lines 1 through 5 since publication of the quarterly data in the Survey of Current Business 5. Consists of transactions in nonproduced nonfinancial assets and capital transfers.n.a. Not available. ... Not applicable.
2003 2004
Summary of U.S. International Transactions(Billions of dollars, not seasonally adjusted except as noted)
2004

IV-9
Foreign Financial Markets The trade-weighted exchange value of the dollar against the major foreign currencies declined 2.4 percent on net over the intermeeting period. The dollar appreciated for several days following the Chairman’s speech on February 4, which many analysts interpreted as reflecting a reduced level of concern about the large and rising U.S. current account deficit. However, that move was quickly reversed. The dollar’s subsequent decline appeared to be linked in part to news stories and official statements, sometimes contradictory, about the intent of several Asian monetary authorities, including Japan and Korea, to alter the currency composition of their foreign reserves. Late in the period, renewed investor concerns about the financing burden associated with the U.S. current account deficit again appeared to weigh on the dollar. On a bilateral basis, the dollar depreciated against all other major currencies over the period, with the exception of the Japanese yen. The dollar depreciated 3 percent, on net, against the euro, despite lackluster economic data in the euro area and a downward revision of the European Central Bank’s economic growth forecast for 2005. A news report late in the period that the ECB’s Governing Council viewed its current policy rate as “well below” its own estimate of a neutral monetary policy stance boosted the euro’s exchange value. The dollar also declined 2.3 percent versus sterling and 3.5 percent
96
97
98
99
100
101
102
Daily
Major currencies
Broad
Other importanttrading partners
Dec Jan Feb Mar
FOMCFeb.
Exchange Value of the DollarFebruary 2, 2005 = 100

IV-10
against the Swiss franc. In contrast, the dollar was little changed on net against the yen amid continued concerns about the pace of Japanese economic activity. Sharp increases in the prices of crude oil, industrial metals, and some agricultural commodities over the period were thought to have also contributed to the depreciation of the dollar against the Canadian and Australian currencies. Short-term interest rates were little changed on balance over the period in the euro area, Canada, and Japan. Three-month rates rose 11 basis points in the United Kingdom, in part as the minutes of the February meeting of the Bank of England’s Monetary Policy Committee showed some willingness to consider a rate increase. Three-month Australian interest rates rose 36 basis points. The Reserve Bank of Australia increased its main policy rate 25 basis points on March 2, to 5.50 percent, and the Reserve Bank of New Zealand also raised its policy rate 25 basis points, to 6.75 percent, on March 10. Both central banks cited concerns over inflationary pressures as a factor in their decisions. Ten-year sovereign yields rose substantially in all industrial countries over the period, led by the United States, reflecting in part an uptick in expected future inflation shown in the price of inflation-indexed bonds. Benchmark nominal yields rose about 20 basis points in the United Kingdom, the euro area, and Japan. Headline equity indexes rose about 1
Financial Indicators in Major Industrial Countries
Three-month rate Ten-year yield EquitiesPercentage Percentage
Mar. 16 point Mar. 16 point percentCountry (Percent) change (Percent) change change
Canada 2.60 .05 4.39 .14 4.74
Japan .05 -.02 1.47 .19 4.02
Euro area 2.14 -.01 3.72 .18 1.08
United Kingdom 4.89 .11 4.81 .22 .46
Switzerland .70 .01 2.37 .20 3.71
Australia 5.84 .36 5.68 .36 2.14
United States 2.98 .27 4.54 .39 .70
Memo:Weighted-averageforeign 1.97 .02 3.54 .20 n.a.
NOTE. Change is from February 1/2 to March 16 (10 a.m. EDT). n.a. Not available.

IV-11
percent in the euro area and the United Kingdom and about 4 percent in Japan and Canada.
Financial Indicators in Latin America, Asia, and Russia
Currency/ Short-term Dollar-denominated Equity US dollar interest rates1 bond spread2 prices
Percentage PercentagePercent Mar.15/16 point Mar.15/16 point Percent
Economy Mar. 16 change (Percent) change (Percent) change change
Mexico 11.25 .70 9.30 .20 1.71 .08 -1.17
Brazil 2.76 5.48 18.91 .54 4.29 .08 13.40
Argentina 2.92 -.10 n.a. n.a. 50.46 -1.50 .92
Chile 593.30 2.24 3.17 .50 .56 .03 4.46
China 8.28 .00 n.a. n.a. .57 .05 .25
Korea 1003.55 -2.36 3.55 .05 ... ... 7.78
Taiwan 31.02 -2.11 1.39 -.03 ... ... .89
Singapore 1.62 -1.06 1.88 .13 ... ... 2.44
Hong Kong 7.80 .00 1.99 1.12 ... ... 2.04
Malaysia 3.80 -.01 2.80 .00 .46 .02 -2.29
Thailand 38.40 -.21 2.44 .12 .41 .04 -.52
Indonesia 9328.00 1.61 7.45 .02 .97 -.61 8.11
Philippines 53.80 -2.11 3.94 -1.06 4.00 -.25 5.50
Russia 27.47 -1.80 n.a. n.a. 1.94 -.10 6.14
NOTE. Change is from February 1/2 to March 15/16.1. One month interbank interest rate, except Chile: 30-day deposit rate; Korea: 1-week call rate.
No reliable short-term interest rates exist for China or Russia.2. Spread over similar maturity U.S. Treasury security yield. Mexico, Brazil, Argentina, Korea,
the Philippines and Russia: EMBI+ yield. Chile and China: Global bond yield. Malaysia: Eurobondyield. Thailand and Indonesia: Yankee bond yield. Taiwan, Singapore, and Hong Kong do not haveoutstanding sovereign bonds denominated in dollars.
n.a. Not available. ... Not applicable. The dollar was little changed on a trade-weighted basis against the currencies of our other important trading partners, on balance over the period. The dollar rose less than 1 percent against the Mexican peso but, in contrast, appreciated 5.5 percent against the Brazilian real, as Brazil’s central bank sold financial derivatives designed to weaken its currency. The dollar depreciated about 2 percent against the Korean won and the Taiwan dollar despite (unconfirmed) reports of intervention activity by the respective central banks to dampen their currencies’ strength. Equity prices generally rose throughout Latin America and Asia, reflecting the perception that economic conditions are improving in a

IV-12
number of emerging market countries. Brazil’s main equity index rose 13 percent, touching a record high, amid reports of large capital inflows from foreign private investors. Korean equity prices rose 8 percent, with shares of “old economy” firms outperforming those of the technology sector. Latin American dollar-denominated bond spreads ended the period little changed, on net, after declining to multi-year lows in early March. The spreads rose in the last days of the intermeeting period, reportedly amid concerns that higher U.S. Treasury yields would make carry trades into emerging market bonds less attractive to international investors. Argentina’s offer to exchange much of its defaulted sovereign debt for new issues was accepted by investors holding 76 percent of the eligible bonds, which was widely seen as a success for the Argentine government. The new bonds, to be formally issued on April 1, were trading on the when-issued market at a spread of about 550 basis points over Treasuries, compared with spreads in the 4000 to 6000 basis point range for the old debt.

IV-13
Developments in Foreign Industrial Countries Data on fourth-quarter GDP in the major foreign economies confirm that a widespread decline in net exports led to a general slowdown in the pace of economic activity in the second half of 2004. Japanese output rose slightly after two quarters of contraction but growth was lackluster as imports surged and consumption remained weak. The euro-area economy continued to lose steam as real GDP fell in Germany and Italy. In Canada, a decrease in exports for the second consecutive quarter contributed to a slowing of output growth. The U.K economy, in contrast, expanded at a robust rate, as strong domestic demand more than offset the negative contribution of net exports. Leading indicators for the current quarter are generally positive, pointing to a broad pickup in growth. Industrial production rose briskly in Japan and continued to increase in the major euro-area economies. Retail sales posted strong gains in Japan and the United Kingdom, and firmed in the euro area. Consumer price inflation remained subdued. In the euro area, the rate of change of the harmonized inflation index edged slightly above the ECB’s ceiling in February, following a substantial drop in January. In the United Kingdom and Canada, consumer prices continued rising at moderate rates. Mild deflation persisted in Japan. In Japan, revised data show that real GDP rose 0.5 percent during the fourth quarter, following two consecutive quarters of negative growth. Fourth-quarter growth was depressed by a 1 percent decline in personal consumption. Business fixed investment was roughly flat, while government investment fell almost 2 percent. Exports accelerated from their anemic third-quarter pace, rising 5 percent, but were outpaced by a jump in imports. As a result, net exports subtracted 0.4 percentage point from growth. An increase in inventories added nearly 1 percentage point to growth. Nominal GDP rose 0.1 percent from the previous quarter. The GDP deflator was down 0.4 percent from its year-ago level, the smallest decline since 1998, as the PCE deflator fell only a little from a year ago and the government consumption deflator rose nearly 1 percent. A stream of positive data releases recently points to further strengthening in the first quarter. Retail sales and household expenditures posted near-record monthly gains in January. Industrial production rose 2.5 percent in January, and inventories of high-tech goods eased back from recent highs. The manufacturing PMI moved up in February.

IV-14
Japanese Real GDP (Percent change from previous period, except as noted, s.a.a.r.)
2004 Component 20031 20041
Q1 Q2 Q3 Q4
GDP 2.1 1.0 6.0 -1.0 -1.1 .5 Total domestic demand 1.3 .9 5.1 -1.9 -.5 1.0 Consumption .9 .3 3.0 .3 -.9 -1.0 Private investment 8.6 1.6 -7.0 13.4 .3 .8 Public investment -12.5 -11.8 39.5 -52.4 -7.4 -1.8 Government consumption 1.0 3.1 4.7 3.2 1.4 3.3 Inventories2 -.3 .4 2.1 -1.3 .0 .9 Exports 10.6 10.4 20.2 14.8 2.6 4.9 Imports 2.9 10.4 13.9 8.3 9.3 10.1 Net exports2 .9 .3 1.0 1.0 -.6 -.4
1. Q4/Q4. 2. Percentage point contribution to GDP growth, s.a.a.r.
Real exports rose 3 percent in January from their fourth-quarter average, but real imports also rose strongly. Housing starts also registered a strong start to the first quarter. In addition, measures of business confidence turned up in January and February, following several consecutive months of declines. However, core machinery orders, a leading indicator of business investment, gave back some of their fourth-quarter gains in January. In February, the Diet passed a FY2004 supplementary budget allocating an extra ¥1.2 trillion (0.2 percent of GDP) for public works projects related to damage caused by last October’s earthquake. Labor market conditions continued to improve, but deflation persisted. In January, the unemployment rate held steady at 4.5 percent and employment surged. The job-offers-to-applicants ratio, a leading indicator of employment, returned to the thirteen-year high hit in November. Nominal wages continued to fall through December, dragged down by sharp cuts in winter bonuses in the services sector. Core consumer goods prices in the Tokyo area (which exclude fresh food but include energy) rose 0.1 percent in February from the previous month, and were down 0.5 percent from a year earlier. Wholesale price inflation eased markedly in the early months of this year.

IV-15
Japanese Economic Indicators (Percent change from previous period except as noted, s.a.)
2004 2005 Indicator
Q2 Q3 Q4 Nov. Dec. Jan. Feb.
Industrial production1 2.7 -.7 -.7 1.7 -.8 2.5 n.a. All-industries index 1.8 -.2 -.1 .2 -.3 n.a. n.a. Housing starts -2.6 5.0 -3.9 -2.9 2.9 9.9 n.a. Machinery orders2 10.3 -8.4 6.0 19.9 -8.8 -2.2 n.a. Machinery shipments3 4.3 -1.6 1.2 1.7 3.3 1.8 n.a. New car registrations -9.5 10.6 -.7 4.8 -1.9 1.9 -2.8 Unemployment rate4 4.6 4.8 4.6 4.6 4.5 4.5 n.a. Job offers ratio5 .80 .85 .90 .91 .90 .91 n.a. Business sentiment6 .0 2.0 1.0 . . . . . . . . . . . . CPI (core, Tokyo area)7 -.1 -.1 -.3 -.3 -.4 -.5 -.5 Wholesale prices7 1.0 1.7 1.9 2.0 1.8 1.3 1.3
1. Mining and manufacturing. 2. Private sector, excluding ships and electric power. 3. Excluding ships and railway vehicles. 4. Percent. 5. Level of indicator. 6. Tankan survey, diffusion index. 7. Percent change from year earlier, n.s.a. n.a. Not available. . . . Not applicable.
Euro-area real GDP continued to decelerate in the fourth quarter, rising just 0.6 percent. Net exports made a negative contribution for the second consecutive quarter as imports grew faster than exports. Final domestic demand rose 1.7 percent, supported by solid growth in consumption and especially in investment. The change in inventories subtracted 0.4 percentage point from growth. At the country level, the pace of economic activity continued to diverge: GDP rose robustly in France and Spain, while it fell in Germany, Italy and the Netherlands. Incoming data suggest a limited pickup in growth in the first quarter. Euro-area retail sales rose 0.3 percent in January from the previous month. In January, industrial production surged in Germany and continued to rise in France. Euro-area manufacturing and services PMIs moved up a bit in January and February, on average, from the fourth-quarter level. In contrast, the European Commission’s index of business sentiment fell in February to its lowest level since March 2004. The fall was widespread across all sectors of the economy, except for consumer confidence that was flat. In Germany, the IFO index rose in January but edged down in February.

IV-16
Euro-Area Real GDP (Percent change from previous period, except as noted, s.a.a.r.)
2004 Component 20031 20041
Q1 Q2 Q3 Q4
GDP .8 1.6 3.0 1.9 1.0 .6 Total domestic demand 1.5 1.9 1.3 1.2 3.8 1.3 Consumption .6 1.3 3.1 .2 .3 1.8 Investment .2 1.6 -.4 1.9 2.6 2.4 Government consumption 1.4 1.2 .9 1.6 1.5 .7 Inventories2 .8 .5 -.5 .4 2.6 -.4 Exports .2 6.0 5.7 11.4 5.2 1.9 Imports 2.0 7.1 1.5 10.1 13.1 3.9 Net exports2 -.6 -.3 1.6 .7 -2.6 -.7
Memo: GDP of selected countries France 1.3 2.2 3.0 2.8 -.1 3.1 Germany .0 .6 2.0 1.4 .1 -.9 Italy .1 1.0 2.2 1.4 1.7 -1.2
1. Q4/Q4. 2. Percentage point contribution to GDP growth, s.a.a.r.
Labor market conditions remained weak in the euro area, with the unemployment rate unchanged at 8.8 percent in January. In Germany, the unemployment rate increased to 11.7 percent in February, a substantial jump from the 10.8 percent rate recorded in December. However, according to the German Federal Statistical Office, the recent surge in measured unemployment is mostly attributable to the implementation of the Hartz IV laws, as welfare recipients able to work now are counted as unemployed. The twelve-month rate of consumer price inflation in the euro area dropped to 1.9 percent in January but edged up to 2.1 percent, above the ECB’s ceiling, in February. Prices of both manufactured goods and services contributed to the moderation of the headline inflation rate since last year. Within manufactured goods, most of the moderation is explained by a favorable base effect as the sharp hike in tobacco prices in January 2004 was not repeated in January of this year. Similarly, in services, the effect of last year’s German health care reform fell out of the calculation of inflation. Energy prices edged down in January and February, on average, with respect to the fourth-quarter level.

IV-17
Euro-Area Economic Indicators (Percent change from previous period except as noted, s.a.)
2004 2005 Indicator
Q2 Q3 Q4 Nov. Dec. Jan. Feb.
Industrial production1 1.0 .3 -.4 -.4 .5 n.a. n.a. Retail sales volume2 -.1 -.2 .1 .0 .0 .3 n.a. Unemployment rate3 8.8 8.8 8.8 8.7 8.8 8.8 n.a. Consumer confidence4 -14.3 -13.7 -13.0 -13.0 -13.0 -13.0 -13.0 Industrial confidence4 -5.0 -3.7 -3.3 -3.0 -4.0 -5.0 -7.0 Manufacturing orders, Germany 2.1 -.1 1.6 -2.6 7.6 -3.4 n.a. CPI5 2.3 2.2 2.3 2.2 2.4 1.9 2.1 Producer prices5 2.0 3.1 3.8 3.7 3.5 3.9 n.a. M35 5.3 6.0 6.4 6.0 6.4 6.6 n.a.
1. Excludes construction. 2. Excludes motor vehicles. 3. Percent. Euro-area standardized to ILO definition. Includes Eurostat estimates in some cases. 4. Diffusion index based on European Commission surveys in individual countries. 5. Eurostat harmonized definition. Percent change from year earlier, n.s.a. n.a. Not available.
Real GDP in the United Kingdom rose 2.9 percent in the fourth quarter. Private consumption grew a sluggish 1.5 percent, its smallest rise in almost two years, and net exports made a negative contribution of 0.5 percentage point. However, fixed investment grew by 5.6 percent.
U.K. Real GDP (Percent change from previous period, except as noted, s.a.a.r.)
2004 Component 20031 20041
Q1 Q2 Q3 Q4
GDP 2.7 2.9 2.4 4.2 2.1 2.9 Total domestic demand 2.3 3.3 3.8 3.4 3.0 3.2 Consumption 2.2 2.8 4.3 3.0 2.3 1.5 Investment 1.4 6.0 7.4 7.4 3.7 5.6 Government consumption 5.6 3.5 2.9 2.8 4.7 3.4 Inventories2 -.3 -.1 -1.0 .0 .0 .5 Exports 5.9 3.6 -6.3 8.7 4.8 8.0 Imports 4.2 5.6 1.0 5.6 7.7 8.3 Net exports2 .3 -.8 -2.1 .5 -1.1 -.5
1. Q4/Q4. 2. Percentage point contribution to GDP growth, s.a.a.r.

IV-18
House prices remained almost flat over the fourth quarter. However, since the beginning of this year, they have begun to rise again. According to the Halifax index, house prices have increased around 6 percent at an annual rate over the three-month period ending in February. Household net mortgage borrowing rose in both December and January but is still about 20 percent below its 2003 peak. Business confidence has recovered solidly from its slump in the fourth quarter. Consumer confidence, however, has remained unchanged at a level of zero, which separates positive from negative sentiment. The PMI for both services and construction fell slightly in February while the PMI for manufacturing remained unchanged. All three surveys continue to indicate expansion.
U.K. Economic Indicators (Percent change from previous period except as noted, s.a.)
2004 2005 Indicator
Q2 Q3 Q4 Nov. Dec. Jan. Feb. Industrial production 1.3 -1.2 -.1 .5 .3 -.1 n.a. Retail sales volume1 1.9 1.0 .3 .6 -1.1 .9 n.a. Unemployment rate2 Claims-based 2.8 2.7 2.7 2.7 2.7 2.6 2.6 Labor force survey3 4.8 4.7 4.7 4.7 4.7 n.a. n.a. Business confidence4 16.3 12.3 4.3 5.0 -6.0 10.0 19.0 Consumer confidence5 -4.0 -3.3 -.7 .0 .0 .0 .0 Consumer prices6 1.4 1.2 1.4 1.5 1.6 1.6 n.a. Producer input prices7 3.9 5.6 6.8 6.8 4.4 9.7 10.7 Average earnings7 4.2 3.8 4.4 4.6 4.4 4.2 n.a.
1. Excludes motor vehicles. 2. Percent. 3. Three-month average centered on month shown. 4. Percentage of firms expecting output to increase in the next four months less percentage expecting output to decrease. 5. Average of the percentage balance from consumers’ expectations of their financial situation, general economic situation, unemployment, and savings over the next 12 months. 6. Consumer prices index (CPI), percent change from year earlier. 7. Percent change from year earlier. n.a. Not available. . . . Not applicable.
The labor market continued to be tight; the official-claims-based measure of the unemployment rate remained near its lowest point since 1975, and the labor-force-survey measure stayed near its all-time low.

IV-19
The twelve-month rate of consumer price inflation stayed at 1.6 percent in January, well below the Bank of England’s 2 percent target. In its February Inflation Report, the Bank of England forecast inflation, using market expectations for interest rates, to edge just above the target at a two-year horizon. In Canada, real GDP growth slowed to 1.7 percent in the fourth quarter, as exports fell sharply for the second consecutive quarter. Exports decreased in virtually all goods categories as the appreciation of the Canadian dollar over the past two years seems to be exerting strong downward pressure on external demand. Imports continued to grow strongly, and net exports subtracted 4.7 percentage points from growth. In contrast, final domestic demand continued to accelerate. Business investment growth reached its fastest pace of the year, while consumption also registered a healthy advance. Inventory accumulation was large for the second consecutive quarter.
Canadian Real GDP (Percent change from previous period, except as noted, s.a.a.r.)
2004 Component 20031 20041
Q1 Q2 Q3 Q4
GDP 1.7 3.0 2.8 4.5 2.9 1.7 Total domestic demand 3.9 4.9 2.5 1.5 9.9 5.9 Consumption 2.8 3.9 6.2 1.9 3.6 4.1 Investment 7.0 5.8 6.4 4.3 5.2 7.4 Government consumption 3.5 2.1 2.9 1.9 1.5 2.2 Inventories2 .1 .9 -2.9 -.9 5.9 1.5 Exports -.8 3.6 4.9 17.9 -3.4 -3.5 Imports 5.0 9.1 4.3 9.6 14.2 8.4 Net exports2 -2.1 -2.0 .3 3.3 -6.7 -4.7
1. Q4/Q4 2. Percentage point contribution to GDP growth, s.a.a.r.
Domestic demand appears to have remained healthy in the early part of 2005. Housing starts remained strong in January and February. The composite index of leading indicators rose again in January, the second consecutive monthly advance since growth in the index stalled in November. The sub-index for retail trade continued to advance in January, although more slowly than in the previous few months. The manufacturing sector, which is heavily export-oriented, was hard-hit during the third and fourth quarters of 2004. However, indicators suggest a pickup at the turn of the year.

IV-20
In January, both new orders and shipments surged, as nearly every sub-sector posted solid gains.
Canadian Economic Indicators (Percent change from previous period except as noted, s.a.)
2004 2005 Indicator
Q2 Q3 Q4 Nov. Dec. Jan. Feb.
GDP by industry 1.0 .9 .5 .3 .2 n.a. n.a. Industrial production 1.4 1.3 .4 .4 .5 n.a. n.a. New manufacturing orders 5.1 1.5 -1.0 -.6 .2 7.1 n.a. Retail sales .6 1.7 .6 -.4 -1.5 n.a. n.a. Employment .6 .3 .4 .0 .1 -.0 .2 Unemployment rate1 7.2 7.1 7.1 7.2 7.0 7.0 7.0 Consumer prices2 2.2 2.0 2.3 2.4 2.1 2.0 n.a. Core consumer prices2,3 1.7 1.7 1.6 1.5 1.7 1.6 n.a. Consumer attitudes (1991 = 100) 115.5 123.0 123.7 . . . . . . . . . . . .Business confidence (1991 = 100) 145.6 151.4 139.8 . . . . . . . . . . . .
1. Percent. 2. Percent change from year earlier, n.s.a. 3. Excluding the 8 most volatile components (fruits, vegetables, gasoline, fuel oil, natural gas, mortgage interest, inter-city transportation and tobacco). n.a. Not available. . . . Not applicable.
On February 23, the government released a new budget plan that includes roughly C$42 billion (about 3 percent of GDP) in new spending initiatives over the next five years and projects a surplus of C$4 billion for 2005-2006. Further new initiatives are expected to be consistent with budgets that are balanced or in surplus, with the goal of reducing the federal debt-to-GDP ratio, over the next ten years, to 25 percent from the current level of 41 percent. The labor market was little changed through the first two months of 2005, with the unemployment rate steady at 7 percent. In addition, both total and manufacturing employment were flat, on average, in January and February. In January, the twelve-month rate of consumer price inflation moderated to 2 percent, although gasoline prices moved up. The twelve-month rate of core inflation, excluding the eight most volatile components, also declined slightly in January to 1.6 percent.

IV-21
External Balances (Billions of U.S. dollars, s.a.a.r.)
2004 2005 Country and balance
Q2 Q3 Q4 Nov. Dec. Jan.
Japan Trade 116.5 102.7 105.5 113.2 109.3 99.2 Current account 170.2 169.8 173.4 167.0 198.8 175.4
Euro area Trade 115.0 59.2 54.9 53.5 67.4 n.a. Current account 73.5 18.1 30.3 26.5 43.4 n.a. Germany Trade 201.8 184.3 192.7 187.8 199.3 202.8 Current account 107.4 100.5 83.7 96.6 78.3 170.3 France Trade -4.0 -17.2 -26.0 -17.1 -40.9 -14.7 Current account -4.2 -9.4 -15.8 -14.7 -18.0 n.a. Italy Trade 1.5 -.7 -8.1 -3.8 -7.2 n.a. Current account -20.0 -3.2 -18.1 -20.2 -20.4 n.a.
United Kingdom Trade -101.9 -108.6 -114.5 -114.5 -114.3 -116.7 Current account -42.0 -63.8 n.a. . . . . . . . . .
Canada Trade 56.3 51.0 50.8 55.0 51.3 39.2 Current account 32.4 25.6 20.7 . . . . . . . . .
n.a. Not available. . . . Not applicable.

IV-22
Consumer Price Inflation in Selected Industrial Countries(12-month change)
1998 1999 2000 2001 2002 2003 2004 2005-2
-1
0
1
2
3
4
5
JapanPercent
1998 1999 2000 2001 2002 2003 2004 2005-2
-1
0
1
2
3
4
5
FrancePercent
1998 1999 2000 2001 2002 2003 2004 2005-2
-1
0
1
2
3
4
5
ItalyPercent
1998 1999 2000 2001 2002 2003 2004 2005-2
-1
0
1
2
3
4
5
GermanyPercent
1998 1999 2000 2001 2002 2003 2004 2005-2
-1
0
1
2
3
4
5
United KingdomPercent
1998 1999 2000 2001 2002 2003 2004 2005-2
-1
0
1
2
3
4
5
CanadaPercent

IV-23
Industrial Production in Selected Industrial Countries
1998 1999 2000 2001 2002 2003 2004 200590
100
110
120Japan 1998=100
1998 1999 2000 2001 2002 2003 2004 200590
100
110
120France
1998 1999 2000 2001 2002 2003 2004 200590
100
110
120Italy
1998 1999 2000 2001 2002 2003 2004 200590
100
110
120Germany 1998=100
1998 1999 2000 2001 2002 2003 2004 200590
100
110
120United Kingdom
1998 1999 2000 2001 2002 2003 2004 200590
100
110
120Canada

IV-24
Economic Situation in Other Countries Recent data suggest that economic performance in emerging Asia has been mixed. While Chinese industrial production fell and Korean growth remained subdued, Hong Kong, Taiwan, and the ASEAN countries registered some gains. In Latin America, Mexico and Argentina experienced solid performances, while Brazilian indicators pointed to a slowdown in activity. Consumer prices in developing countries have remained stable, suggesting that higher oil prices have only had a modest impact on inflation. Chinese industrial production fell significantly in January, after a strong fourth quarter. Average imports for January and February were down sharply from fourth-quarter levels. Given the shifting of the Chinese New Year holiday between January and February in different years, seasonal adjustment of data for the first few months of the year is difficult. The contractions in production and imports may reflect residual seasonal factors, or they could reflect weakness in the Chinese economy associated with slowing investment growth. The contraction of imports led to a big increase in the trade surplus for January. Twelve-month consumer price inflation slowed in January, as food prices continued to decline, but rose to about 4 percent in February.
Chinese Economic Indicators (Percent change from previous period, s.a., except as noted)
2004 2005 Indicator 2003 2004
Q3 Q4 Dec. Jan. Feb.
Real GDP1 10.0 9.5 10.1 11.2 … … … Industrial production 18.6 14.5 2.9 3.6 .9 -2.5 n.a. Consumer prices1 3.2 2.4 5.3 3.2 2.4 1.9 3.9 Trade balance2 25.5 31.9 44.1 67.2 86.4 148.6 82.1
1. Annual rate. Quarterly data estimated by staff from reported four-quarter growth rates. Annual data are Q4/Q4. 2. Billions of U.S. dollars, annual rate. Imports are c.i.f. n.a. Not available. . . . Not applicable.
Recent indicators in Hong Kong have been generally positive, with real GDP growing at an annual rate of 6.8 percent in the fourth quarter. The unemployment rate fell again in January, business confidence is up, and retail sales and tourism have remained strong. Trade volume, usually a very good indicator of growth for the entrepot economy, is off slightly from the high reached late last year. Consumer prices were down a bit in January

IV-25
from their year-ago levels. Markets reacted little to the resignation of Chief Executive Tung earlier this month.
Hong Kong Economic Indicators (Percent change from previous period, s.a., except as noted)
2004 2005 Indicator 2003 2004
Q3 Q4 Nov. Dec. Jan.
Real GDP1 4.6 7.0 4.2 6.8 … … … Unemployment rate2 7.9 6.9 6.8 6.5 6.7 6.5 6.4 Consumer prices3 -1.9 .2 .8 .2 .2 .2 -.3 Trade balance4 -8.5 -12.0 -13.4 -7.5 -6.9 -8.2 -2.6
1. Annual rate. Annual data are Q4/Q4. 2. Percent. Monthly data are averages of the current and previous two months. 3. Percent change from year-earlier period, except annual data, which are Dec./Dec. 4. Billions of U.S. dollars, annual rate. Imports are c.i.f. . . . Not applicable.
Taiwanese real GDP grew just over 2 percent in the fourth quarter. Weak exports held down overall growth, but domestic demand was strong. Indicators of first-quarter growth have been mixed. Industrial production was up in January. The trade surplus is positive for the year to date, largely due to a decline in imports of electronic components. Twelve-month consumer price inflation is a little less than 2 percent, about where it was during most of last year.
Taiwan Economic Indicators (Percent change from previous period, s.a., except as noted)
2004 2005 Indicator 2003 2004
Q3 Q4 Dec. Jan. Feb.
Real GDP1 5.8 3.2 4.5 2.1 … … … Unemployment rate2 5.0 4.5 4.4 4.2 4.2 4.2 n.a. Industrial production 7.1 9.8 -.3 -.7 -.7 1.4 n.a. Consumer prices3 -.1 1.6 2.9 1.8 1.6 .5 1.9 Trade balance4 16.9 6.1 15.6 -7.0 -16.2 -3.3 16.7 Current account5 29.3 19.0 21.4 8.7 … … …
1. Annual rate. Annual data are Q4/Q4. 2. Percent. 3. Percent change from year-earlier period, except annual data, which are Dec./Dec. 4. Billions of U.S. dollars, annual rate. Imports are c.i.f. 5. Billions of U.S. dollars, n.s.a., annual rate. n.a. Not available. . . . Not applicable.

IV-26
Economic growth in Korea remains subdued, led primarily by the export sector. Production was up significantly in January, with particular strength in high-tech products such as semiconductors and communication equipment, and exports were up further on average in January and February relative to the fourth quarter. However, retail sales continued to trend down through January. One bright spot is the fact that both business and consumer sentiment has improved. Also, credit card delinquency ratios have continued to decline, suggesting that the restraint on spending from high consumer debt may be abating. Twelve-month consumer price inflation, both headline and core, was around 3¼ percent in February, within the government’s target range of 2.5-3.5 percent for core inflation.
Korean Economic Indicators (Percent change from previous period, s.a., except as noted)
2004 2005 Indicator 2003 2004
Q3 Q4 Dec. Jan. Feb.
Real GDP1 4.1 n.a. 2.6 n.a. … … … Industrial production 4.9 10.2 -.3 2.0 -.8 3.1 n.a. Unemployment rate2 3.4 3.5 3.6 3.5 3.5 3.6 n.a. Consumer prices3 3.4 3.0 4.3 3.4 3.0 3.1 3.3 Trade balance4 22.0 38.2 41.4 35.5 40.1 58.0 n.a. Current account5 11.9 27.6 28.4 29.4 23.9 46.4 n.a.
1. Annual rate. Annual data are Q4/Q4. 2. Percent. 3. Percent change from year-earlier period, except annual data, which are Dec./Dec. 4. Billions of U.S. dollars, annual rate. Imports are c.i.f. 5. Billions of U.S. dollars, n.s.a., annual rate. n.a. Not available. . . . Not applicable.
Incoming data from the ASEAN countries indicate that economic activity expanded at a solid pace in the fourth quarter. The exception is the Philippines, where fourth-quarter growth was lowered by the adverse effects of natural disasters on the agricultural sector. The Singapore electronics PMI rose in January and February, after falling in the previous three months, suggesting expansion in economic activity going forward. Recent trade data for the ASEAN economies have been mixed. Indonesia, Malaysia, and Singapore continued to run trade surpluses, although the surplus for Singapore decreased in January. In the Philippines and Thailand, the trade balance turned negative. Consumer price inflation remained elevated in Indonesia and the Philippines and moderate elsewhere in the region. Nonetheless, governments in Indonesia, Malaysia, and Thailand have recently allowed more increases in the domestic prices of subsidized fuel.

IV-27
The Thai central bank continued tightening monetary policy by raising interest rates 25 basis points to 2.25 percent early this month, the fourth rate increase since August 2004.
ASEAN Economic Indicators: Growth (Percent change from previous period, s.a., except as noted)
2004 2005 Indicator 2003 2004
Q3 Q4 Nov. Dec. Jan.
Real GDP1 Indonesia 5.0 6.5 6.5 9.8 … … … Malaysia 6.6 5.6 2.3 3.9 … … … Philippines 4.8 5.4 5.7 2.4 … … … Singapore 5.5 6.5 .7 7.9 … … … Thailand 7.7 5.3 6.0 7.2 … … …
Industrial production2 Indonesia3 3.9 4.7 5.2 1.9 -10.4 -.8 n.a. Malaysia 9.3 11.3 -.3 1.3 2.6 -.1 -2.2 Philippines .0 .7 1.4 -.6 .6 -.6 n.a. Singapore 3.0 13.9 1.0 5.3 -1.7 11.4 -7.6 Thailand 14.0 6.4 .4 1.8 -.2 2.0 n.a.
1. Annual rate. Annual data are Q4/Q4. 2. Annual data are annual averages. 3. Staff estimate. n.a. Not available. . . . Not applicable.
ASEAN Economic Indicators: Trade Balance (Billions of U.S. dollars, s.a.a.r.)
2004 2005 Indicator 2003 2004
Q3 Q4 Nov. Dec. Jan.
Indonesia 28.5 25.0 26.9 30.3 32.2 21.0 26.9 Malaysia 21.4 21.2 23.8 18.3 17.3 13.3 26.1 Philippines -1.3 -.7 -.1 -.5 1.9 -1.7 n.a. Singapore 16.2 16.1 16.5 18.3 8.1 32.1 10.1 Thailand 3.8 1.7 1.5 3.6 -1.8 3.8 -11.4
n.a. Not available.

IV-28
ASEAN Economic Indicators: CPI Inflation (Percent change from year earlier, except as noted)
2004 2005 Indicator 20031 20041
Q3 Q4 Dec. Jan. Feb.
Indonesia 5.2 6.4 6.7 6.3 6.4 7.3 7.2 Malaysia 1.2 2.1 1.5 2.1 2.1 2.4 2.4 Philippines 3.1 7.9 6.4 7.5 7.9 n.a. n.a. Singapore .8 1.5 1.7 1.7 1.5 1.0 n.a. Thailand 1.8 2.9 3.3 3.1 2.9 n.a. n.a.
1. Dec./Dec. n.a. Not available.
In Mexico, recent data releases point to a solid pickup in economic activity. Real GDP rose 5.5 percent (s.a.a.r.) in the fourth quarter, above market expectations. Domestic demand was the main source of growth during the quarter, as suggested by the strong performance in retail sales, services, and construction activities, aided by increasing bank credit despite relatively high real interest rates. Solid manufacturing exports—mainly maquiladora exports to the United States—also contributed to the strong fourth-quarter performance. High oil revenues have continued to allow government spending to provide further stimulus to the economy. In late February the Bank of Mexico tightened monetary policy for the eleventh time in the past year in an ongoing effort to tame inflation and signal its commitment to its inflation target. Twelve-month inflation stood at 4.3 percent in February, down from 5.2 percent at the end of 2004 but still above the target range of 2-4 percent. This reduction in inflation suggests that the Bank of Mexico's aggressive tightening stance is beginning to bear fruit, aided by declines of food and energy prices.

IV-29
Mexican Economic Indicators (Percent change from previous period, s.a., except as noted)
2004 2005 Indicator 2003 2004
Q3 Q4 Dec. Jan. Feb.
Real GDP1 2.1 4.9 3.8 5.5 … … … Overall economic activity 1.4 4.0 1.1 1.3 .7 n.a. n.a. Industrial production -.2 3.5 .6 .8 .8 .6 n.a. Unemployment rate2 3.2 3.7 3.8 3.7 3.8 3.8 n.a. Consumer prices3 4.0 5.2 4.8 5.3 5.2 4.6 4.3 Trade balance4 -5.8 -8.5 -9.1 -12.9 -17.2 -19.0 n.a. Imports4 170.5 197.2 200.0 208.3 210.2 213.6 n.a. Exports4 164.8 188.6 190.9 195.4 193.0 194.6 n.a. Current account5 -8.5 -8.6 -7.3 -18.2 … … …
1. Annual rate. Annual data are Q4/Q4. 2. Percent; counts as unemployed those working one hour a week or less. 3. Percent change from year-earlier period, except annual data, which are Dec./Dec. 4. Billions of U.S. dollars, annual rate. 5. Billions of U.S. dollars, n.s.a., annual rate. n.a. Not available. . . . Not applicable.
In Brazil, data releases since the last Greenbook have pointed to a slowdown. Fourth-quarter real GDP rose 1.7 percent (a.r.), down from 4.4 percent in the third quarter and from 6½ percent in the first half of 2004. The fourth-quarter result was driven by a 15 percent fall in investment that analysts believe was temporary and private consumption continued to show strength, growing 5½ percent. Industrial production declined ½ percent in January, while average vehicle production over January-February was roughly flat, after having risen over 20 percent in 2004. Despite the appreciation of the real against the dollar during the past months, Brazil continued to record a sizeable trade surplus. Monthly CPI inflation declined from 0.8 percent in December to 0.6 percent in February, bringing the twelve-month increase down to 7.4 percent. Twelve-month-ahead expected inflation from the central bank’s survey has fallen from 6.3 percent last October to about 5½ percent. Nevertheless, in mid-February, the central bank raised its policy rate for the sixth consecutive month, to 18.75 percent. The central bank has expressed concerns about the inflation outlook, in part because of sizeable increases in government-administered fuels prices in late 2004. The central bank has been aiming to reduce inflation to about 5 percent by the end of 2005.

IV-30
Brazilian Economic Indicators (Percent change from previous period, s.a., except as noted)
2004 2005 Indicator 2003 2004
Q3 Q4 Dec. Jan. Feb.
Real GDP1 .8 4.8 4.4 1.7 … … … Industrial production .1 8.3. 2.4 .6 1.2 -.5 n.a. Unemployment rate2 12.4 11.5 11.2 11.3 11.5 10.1 n.a. Consumer prices3 9.3 7.6 6.9 7.2 7.6 7.4 7.4 Trade balance4 24.8 33.7 35.7 34.0 38.9 37.8 41.8 Current account5 4.0 11.8 21.3 7.9 14.5 9.8 n.a.
1. Annual rate. Annual data are Q4/Q4. 2. Percent; break in October 2001 as a result of change in methodology. 3. Percent change from year-earlier period, except annual data, which are Dec./Dec. Price index is IPC-A. 4. Billions of U.S. dollars, annual rate. 5. Billions of U.S. dollars, n.s.a., annual rate. n.a. Not available. . . . Not applicable.
In Argentina, the economic recovery continued in the third quarter, with real GDP and industrial production growing at annual rates of 12 and 11 percent, respectively. Growth appears to have slowed somewhat in the fourth quarter, as industrial production increased at an annual rate of 8.5 percent. The unemployment rate has steadily fallen over the past few years, reaching about 12 percent in the fourth quarter, half of what it was at the peak of the 2001-02 financial crisis. The trade surplus has narrowed in recent months. Twelve-month consumer price inflation rose to just over 8 percent in February, slightly above the central bank’s unofficial target range of 5 to 8 percent inflation for end-2005. The government launched its long-awaited debt restructuring in mid-January. The debt swap offer closed on February 25, and preliminary results indicate that private investors holding $62 billion out of a total $82 billion in defaulted bonds accepted the government’s offer, for a global participation rate of 76 percent. After the transaction is settled, Argentina’s total public debt is expected to fall by $67 billion to $125 billion (equivalent to about 72 percent of GDP), 37 percent of which will be denominated in Argentine pesos (up from just 3 percent in 2001). It remains to be seen how the Argentine government with ultimately deal with the investors holding almost $20 billion in defaulted bonds who did not accept the government’s offer.

IV-31
Argentine Economic Indicators (Percent change from previous period, s.a., except as noted)
2004 2005 Indicator 2003 2004
Q3 Q4 Dec. Jan. Feb.
Real GDP1 12.1 n.a. 12.0 n.a … … … Industrial production 16.1 10.7 2.6 2.1 1.5 .4 n.a. Unemployment rate2 17.3 13.6 13.2 12.1 … … … Consumer prices3 3.7 6.1 5.3 5.8 6.1 7.2 8.2 Trade balance4 15.7 12.1 11.7 10.4 10.6 12.2 n.a. Current account5 7.4 n.a. 2.1 n.a. … … …
1. Annual rate. Annual data are Q4/Q4. 2. Percent; n.s.a. 3. Percent change from year-earlier period, except annual data, which are Dec./Dec. 4. Billions of U.S. dollars, annual rate. 5. Billions of U.S. dollars, n.s.a., annual rate. n.a. Not available. . . . Not applicable.
In Venezuela, on March 3 the government devalued the bolivar 10.7 percent. Venezuela's currency had been pegged to the dollar since early 2003 in an attempt to rein in inflation; however, inflation has remained very high, ending 2004 at nearly 20 percent. The devaluation had been expected since early December, when it was factored into the 2005 budget that was approved by the Venezuelan congress. At that time, however, Finance Minister Tobias Nobrega was removed after he announced that the devaluation would take place on January 1. Venezuela has been maintaining capital controls, which have deterred speculative pressures on international reserves.

IV-32
Venezuelan Economic Indicators (Percent change from previous period, s.a., except as noted)
2004 2005 Indicator 2003 2004
Q3 Q4 Dec. Jan. Feb.
Real GDP1 6.6 11.2 -6.0 8.2 … … … Unemployment rate2 18.0 15.1 14.5 14.1 13.2 13.5 n.a. Consumer prices3 27.1 19.2 21.5 19.5 19.2 18.5 16.8 Non-oil trade balance4 -5.5 -10.5 -11.9 -12.2 … … … Trade balance4 16.5 22.1 17.9 25.2 … … … Current account5 11.4 14.6 14.6 15.6 … … …
1. Annual rate. Annual data are Q4/Q4. 2. Percent. 3. Percent change from year-earlier period, except annual data, which are Dec./Dec. 4. Billions of U.S. dollars, annual rate. 5. Billions of U.S. dollars, n.s.a., annual rate. n.a. Not available. . . . Not applicable.