fomc 20080916 material
TRANSCRIPT

Appendix 1: Materials used by Mr. Dudley
September 16, 2008 86 of 108Authorized for Public Release
Class II FOMC – Restricted FR
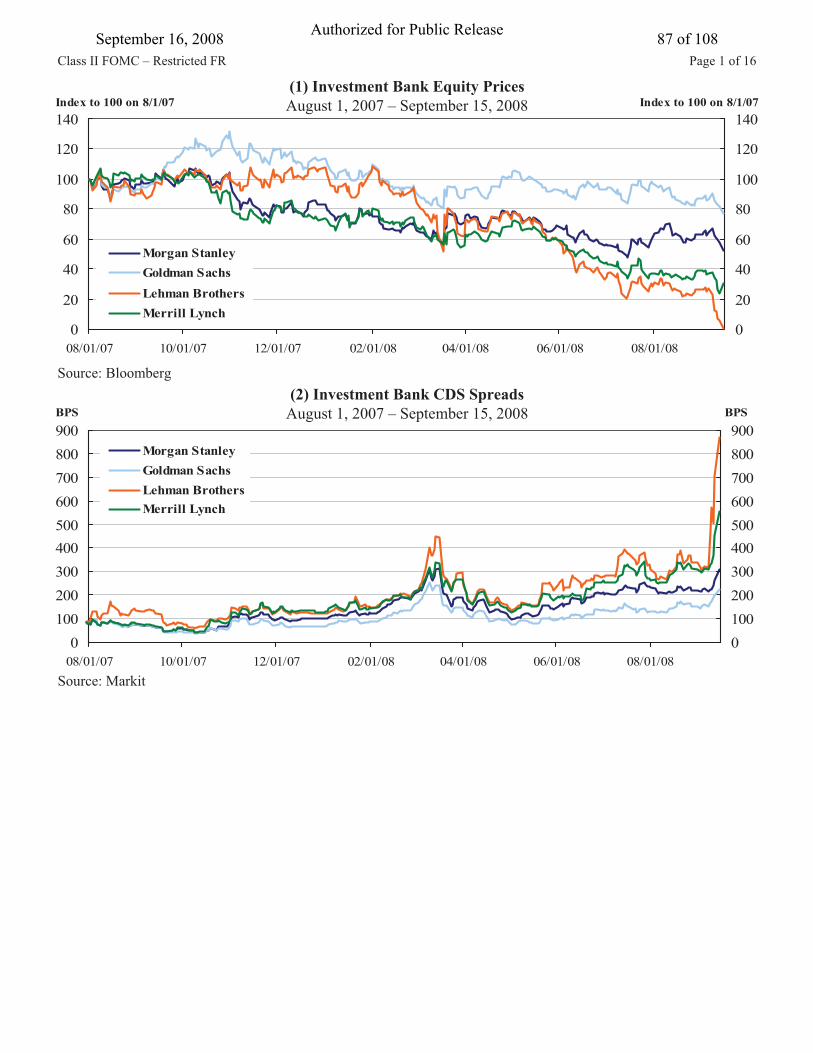
Source: Bloomberg
(1) Investment Bank Equity PricesAugust 1, 2007 – September 15, 2008
0
20
40
60
80
100
120
140
08/01/07 10/01/07 12/01/07 02/01/08 04/01/08 06/01/08 08/01/08
Index to 100 on 8/1/07
0
20
40
60
80
100
120
140Index to 100 on 8/1/07
Morgan StanleyGoldman SachsLehman BrothersMerrill Lynch
(2) Investment Bank CDS SpreadsAugust 1, 2007 – September 15, 2008
Source: Markit
0100200300400500600700800900
08/01/07 10/01/07 12/01/07 02/01/08 04/01/08 06/01/08 08/01/08
BPS
0100200300400500600700800900
BPS
Morgan StanleyGoldman SachsLehman BrothersMerrill Lynch
Page 1 of 16September 16, 2008 87 of 108Authorized for Public Release

Class II FOMC – Restricted FR
Source: Bloomberg
(3) Large Commercial Bank Equity PricesAugust 1, 2007 – September 15, 2008
20
40
60
80
100
120
08/01/07 10/01/07 12/01/07 02/01/08 04/01/08 06/01/08 08/01/08
Index to 100 on 8/1/07
20
40
60
80
100
120Index to 100 on 8/1/07
JPMorgan Chase
CitibankBank of America
(4) Large Commercial Bank CDS SpreadsAugust 1, 2007 – September 15, 2008
Source: Markit
0
50
100
150
200
250
08/01/07 10/01/07 12/01/07 02/01/08 04/01/08 06/01/08 08/01/08
BPS
0
50
100
150
200
250BPS
JPMorgan ChaseCitigroupBank of America
Page 2 of 16September 16, 2008 88 of 108Authorized for Public Release

(5) Regional Bank Equity PricesAugust 1, 2007 – September 15, 2008
Source: Bloomberg
Class II FOMC – Restricted FR
Source: Markit
(6) Regional Bank CDS SpreadsAugust 1, 2007 – September 15, 2008
0
20
40
60
80
100
120
08/01/07 10/01/07 12/01/07 02/01/08 04/01/08 06/01/08 08/01/08
Index to 100 on 8/1/07
0
20
40
60
80
100
120Index to 100 on 8/1/07
Washington Mutual
Wachovia
Wells Fargo
0500
1000150020002500300035004000450050005500
08/01/07 10/01/07 12/01/07 02/01/08 04/01/08 06/01/08 08/01/08
BPS
05001000150020002500300035004000450050005500BPS
Washington Mutual
Wachovia
Wells Fargo
Page 3 of 16September 16, 2008 89 of 108Authorized for Public Release

Class II FOMC – Restricted FR(7) Agency Debt Spreads
March 1, 2008 – September 15, 2008
Source: Bloomberg
40
60
80
100
120
03/01/08 04/01/08 05/01/08 06/01/08 07/01/08 08/01/08 09/01/08
BPS
40
60
80
100
120BPS
Fannie Mae 5-YearFreddie Mac 5-YearFannie Mae 10-YearFreddie Mac 10-Year
-25
025
50
75
100125
150
175
01/01/07 03/01/07 05/01/07 07/01/07 09/01/07 11/01/07 01/01/08 03/01/08 05/01/08 07/01/08 09/01/08
BPS
-25
025
50
75
100125
150
175BPS
Spread to Treasury YieldSpread to Agency DebtSpread to Interest Rate Swap
(8) Mortgage Option Adjusted Spreads January 1, 2007 – September 12, 2008
Source: Lehman Brothers
Page 4 of 16September 16, 2008 90 of 108Authorized for Public Release

Class II FOMC – Restricted FR(9) Fannie Mae and Freddie Mac Equity Prices
August 1, 2007 – September 15, 2008
Source: Bloomberg
0
10
20
30
40
50
60
70
08/01/07 10/01/07 12/01/07 02/01/08 04/01/08 06/01/08 08/01/08
Dollars
0
10
20
30
40
50
60
70Dollars
Fannie Mae
Freddie Mac
(10) Fannie Mae and Freddie Mac CDS Spreads August 1, 2007 – September 12, 2008
Source: Markit
0
50
100
150
200
250
300
350
400
08/01/07 10/01/07 12/01/07 02/01/08 04/01/08 06/01/08 08/01/08
BPS
0
50
100
150
200
250
300
350
400BPS
Fannie Mae SeniorFreddie Mac SeniorFannie Mae SubordinatedFreddie Mac Subordinated
Page 5 of 16September 16, 2008 91 of 108Authorized for Public Release
Class II FOMC – Restricted FR
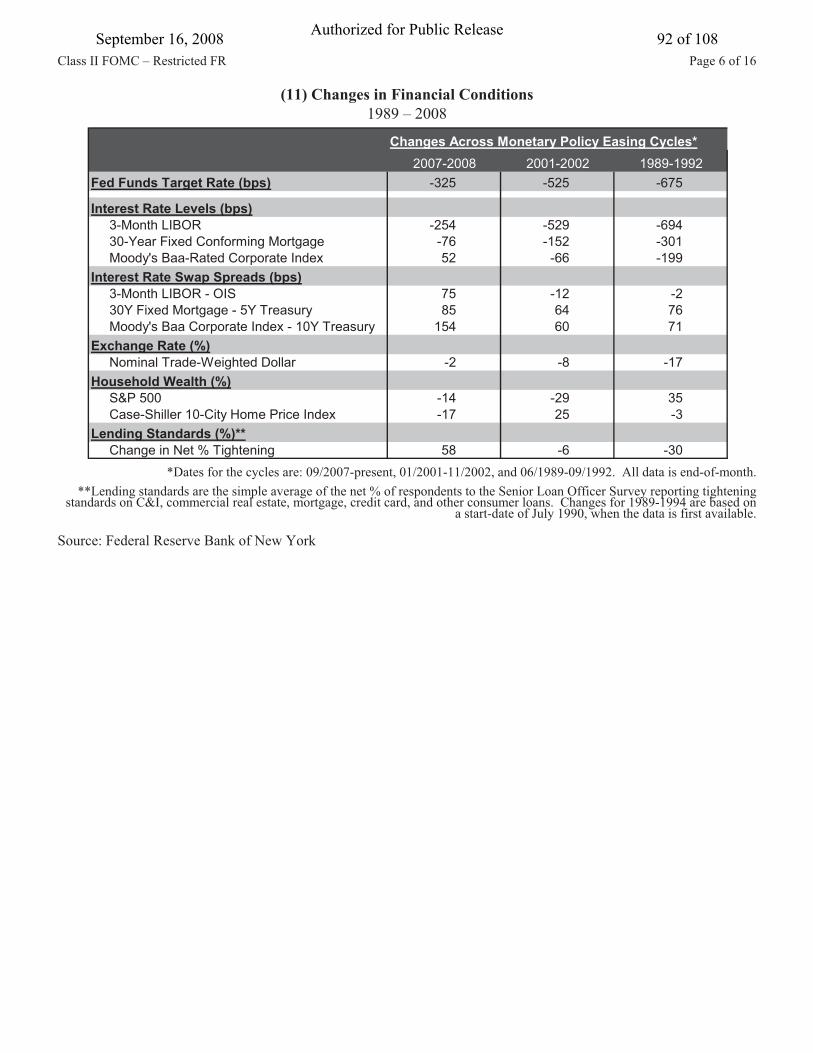
(11) Changes in Financial Conditions1989 – 2008
Source: Federal Reserve Bank of New York
*Dates for the cycles are: 09/2007-present, 01/2001-11/2002, and 06/1989-09/1992. All data is end-of-month.**Lending standards are the simple average of the net % of respondents to the Senior Loan Officer Survey reporting tightening
standards on C&I, commercial real estate, mortgage, credit card, and other consumer loans. Changes for 1989-1994 are based on a start-date of July 1990, when the data is first available.
Page 6 of 16
Changes Across Monetary Policy Easing Cycles*
Fed Funds Target Rate (bps) -325 -525 -675
Interest Rate Levels (bps) 3-Month LIBOR -254 -529 -694 30-Year Fixed Conforming Mortgage -76 -152 -301 Moody's Baa-Rated Corporate Index 52 -66 -199Interest Rate Swap Spreads (bps) 3-Month LIBOR - OIS 75 -12 -2 30Y Fixed Mortgage - 5Y Treasury 85 64 76 Moody's Baa Corporate Index - 10Y Treasury 154 60 71Exchange Rate (%) Nominal Trade-Weighted Dollar -2 -8 -17Household Wealth (%) S&P 500 -14 -29 35 Case-Shiller 10-City Home Price Index -17 25 -3Lending Standards (%)** Change in Net % Tightening 58 -6 -30
2007-2008 2001-2002 1989-1992
September 16, 2008 92 of 108Authorized for Public Release
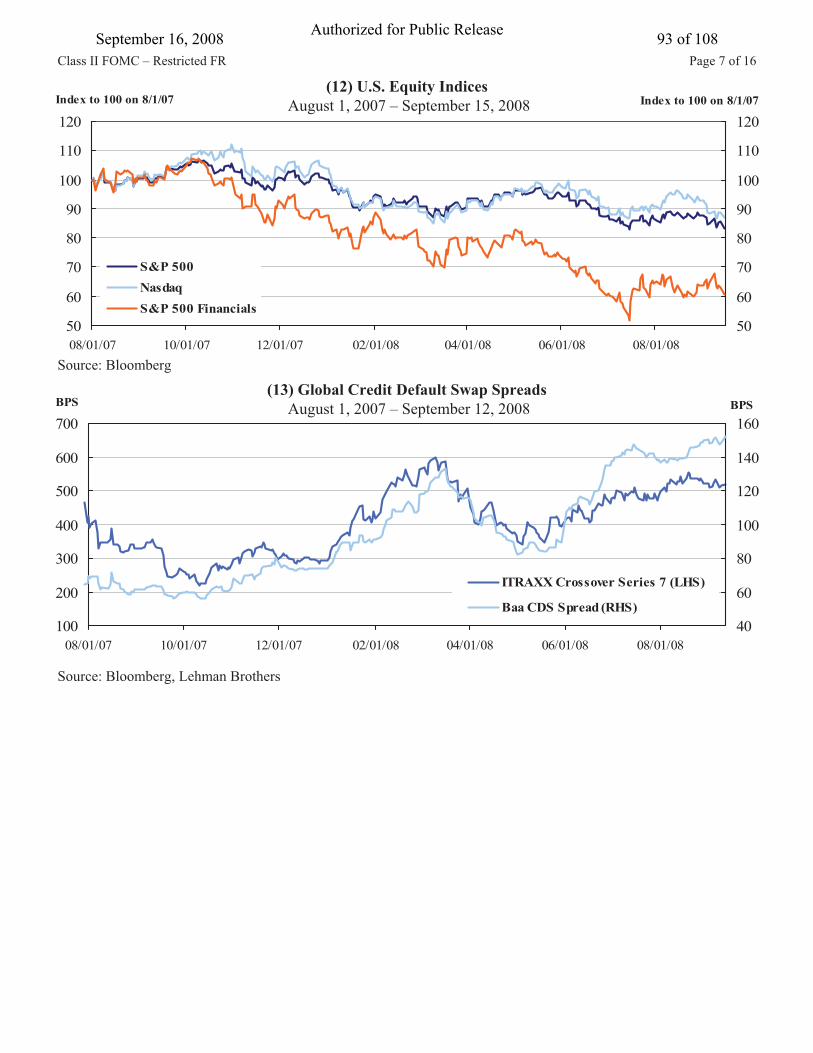
(12) U.S. Equity Indices August 1, 2007 – September 15, 2008
Class II FOMC – Restricted FR
50
60
70
80
90
100
110
120
08/01/07 10/01/07 12/01/07 02/01/08 04/01/08 06/01/08 08/01/08
Index to 100 on 8/1/07
50
60
70
80
90
100
110
120 Index to 100 on 8/1/07
S&P 500NasdaqS&P 500 Financials
Source: Bloomberg
Source: Bloomberg, Lehman Brothers
(13) Global Credit Default Swap Spreads August 1, 2007 – September 12, 2008
100
200
300
400
500
600
700
08/01/07 10/01/07 12/01/07 02/01/08 04/01/08 06/01/08 08/01/08
BPS
40
60
80
100
120
140
160BPS
ITRAXX Crossover Series 7 (LHS)
Baa CDS Spread (RHS)
Page 7 of 16September 16, 2008 93 of 108Authorized for Public Release

(14) One-Month Libor–OIS SpreadsJuly 1, 2007 – September 15, 2008
Source: Bloomberg
Source: Bloomberg
(15) Three-Month Libor – OIS Spreads July 1, 2007 – September 15, 2008
Class II FOMC – Restricted FR
0
20
40
60
80
100
120
07/01/07 09/01/07 11/01/07 01/01/08 03/01/08 05/01/08 07/01/08 09/01/08
BPS
0
20
40
60
80
100
120BPS
U.S.U.K.Euro Area
0
20
40
60
80
100
120
07/01/07 09/01/07 11/01/07 01/01/08 03/01/08 05/01/08 07/01/08 09/01/08
BPS
0
20
40
60
80
100
120BPS
U.S.U.K.Euro Area
Page 8 of 16September 16, 2008 94 of 108Authorized for Public Release

(16) TAF Auction Results December 20, 2007 – September 11, 2008
Source: Federal Reserve Board
Class II FOMC – Restricted FR
0
15
30
45
60
75
90
105
12/2
0/07
12/2
7/07
01/1
7/08
01/3
1/08
02/1
4/08
02/2
8/08
03/1
3/08
03/2
7/08
04/1
0/08
04/2
4/08
05/0
8/08
05/2
2/08
06/0
5/08
06/1
9/08
07/0
3/08
07/1
7/08
07/3
1/08
08/1
4/08
08/1
4/08
08/2
8/08
09/1
1/08
09/1
1/08
BPS
1.0
1.5
2.0
2.5
3.0
3.5
4.0
4.5Bid-to-Cover Ratio
Bid-to Cover Ratio (RHS)TAF Stop-Out Spread to Minimum Bid Rate (LHS) 84-Day Term
(17) Federal Reserve Term Securities Lending Facility Options Program ResultsAugust 27, 2008 – September 10, 2008
Source: Federal Reserve Bank of New York
Page 9 of 16
AuctionDate
AuctionSettlement Term Collateral Amount
Minimum Fee Rate
Stop-outRate Propositions Bid/Cover
8/27/2008 9/25/2008 7 Days Schedule 2 $50 b 0.01% 0.02% $51.0 b 2.04
9/10/2008 9/25/2008 7 Days Schedule 2 $50 b 0.01% 0.03% $54.5 b 2.18
September 16, 2008 95 of 108Authorized for Public Release

Class II FOMC – Restricted FR
Source: Bloomberg
85
90
95
100
105
110
115
01/01/08 02/01/08 03/01/08 04/01/08 05/01/08 06/01/08 07/01/08 08/01/08 09/01/08
Index to 100 on 1/1/08
85
90
95
100
105
110
115Index to 100 on 1/1/08
(19) Dollar Appreciates Against Euro and Great British Pound January 1, 2008 – September 15, 2008
Dol
lar
Dep
reci
atio
n
Dol
lar
App
reci
atio
n
Euro vs. DollarYen vs. Dollar
Great British Pound vs. Dollar
80
100
120
140
160
01/01/08 02/01/08 03/01/08 04/01/08 05/01/08 06/01/08 07/01/08 08/01/08 09/01/08
Index to 100 on 1/1/08
80
100
120
140
160Index to 100 on 1/1/08
GSCI SpotGSCI EnergyGSCI AgricultureGSCI Industrial Metals
(18) Commodity Prices January 1, 2008 – September 15, 2008
Source: Bloomberg
Source: Bloomberg
(20) Dollar Strengthens Against Euro Despite Worsening Interest Rate Differentials January 1, 2007 – September 15, 2008
1.10
1.20
1.30
1.40
1.50
1.60
1.70
01/01/07 03/01/07 05/01/07 07/01/07 09/01/07 11/01/07 01/01/08 03/01/08 05/01/08 07/01/08 09/01/08
Dollars per Euro
-150
-100
-50
0
50
100
150BPS
Euro/USD (LHS)Dec-09 3-Month Euribor-Eurodollar Futures Spread (RHS)
Page 10 of 16September 16, 2008 96 of 108Authorized for Public Release
Class II FOMC – Restricted FR
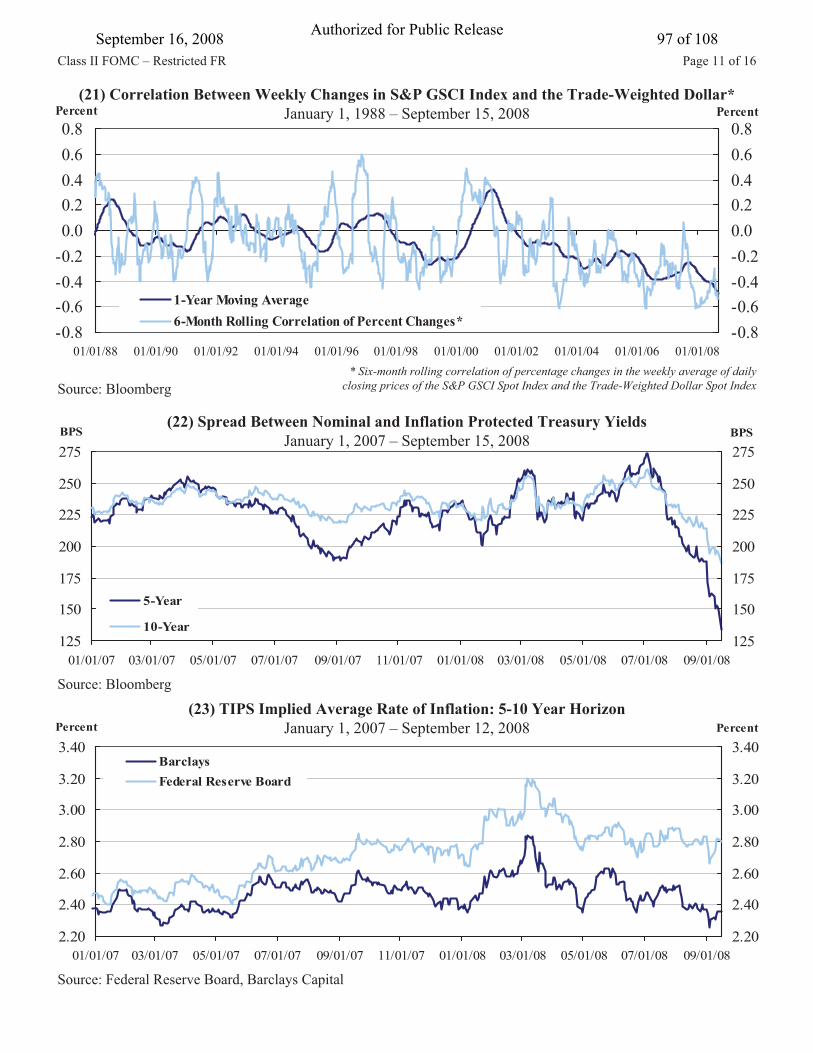
(23) TIPS Implied Average Rate of Inflation: 5-10 Year HorizonJanuary 1, 2007 – September 12, 2008
Source: Federal Reserve Board, Barclays Capital
2.20
2.40
2.60
2.80
3.00
3.20
3.40
01/01/07 03/01/07 05/01/07 07/01/07 09/01/07 11/01/07 01/01/08 03/01/08 05/01/08 07/01/08 09/01/08
Percent
2.20
2.40
2.60
2.80
3.00
3.20
3.40 Percent
BarclaysFederal Reserve Board
(22) Spread Between Nominal and Inflation Protected Treasury YieldsJanuary 1, 2007 – September 15, 2008
125
150
175
200
225
250
275
01/01/07 03/01/07 05/01/07 07/01/07 09/01/07 11/01/07 01/01/08 03/01/08 05/01/08 07/01/08 09/01/08
BPS
125
150
175
200
225
250
275 BPS
5-Year
10-Year
Source: Bloomberg
(21) Correlation Between Weekly Changes in S&P GSCI Index and the Trade-Weighted Dollar*January 1, 1988 – September 15, 2008
-0.8-0.6-0.4-0.20.00.20.40.60.8
01/01/88 01/01/90 01/01/92 01/01/94 01/01/96 01/01/98 01/01/00 01/01/02 01/01/04 01/01/06 01/01/08
Percent
-0.8-0.6-0.4-0.20.00.20.40.60.8
Percent
1-Year Moving Average6-Month Rolling Correlation of Percent Changes*
Source: Bloomberg* Six-month rolling correlation of percentage changes in the weekly average of daily
closing prices of the S&P GSCI Spot Index and the Trade-Weighted Dollar Spot Index
Page 11 of 16September 16, 2008 97 of 108Authorized for Public Release
Class II FOMC – Restricted FR
Source: Bloomberg
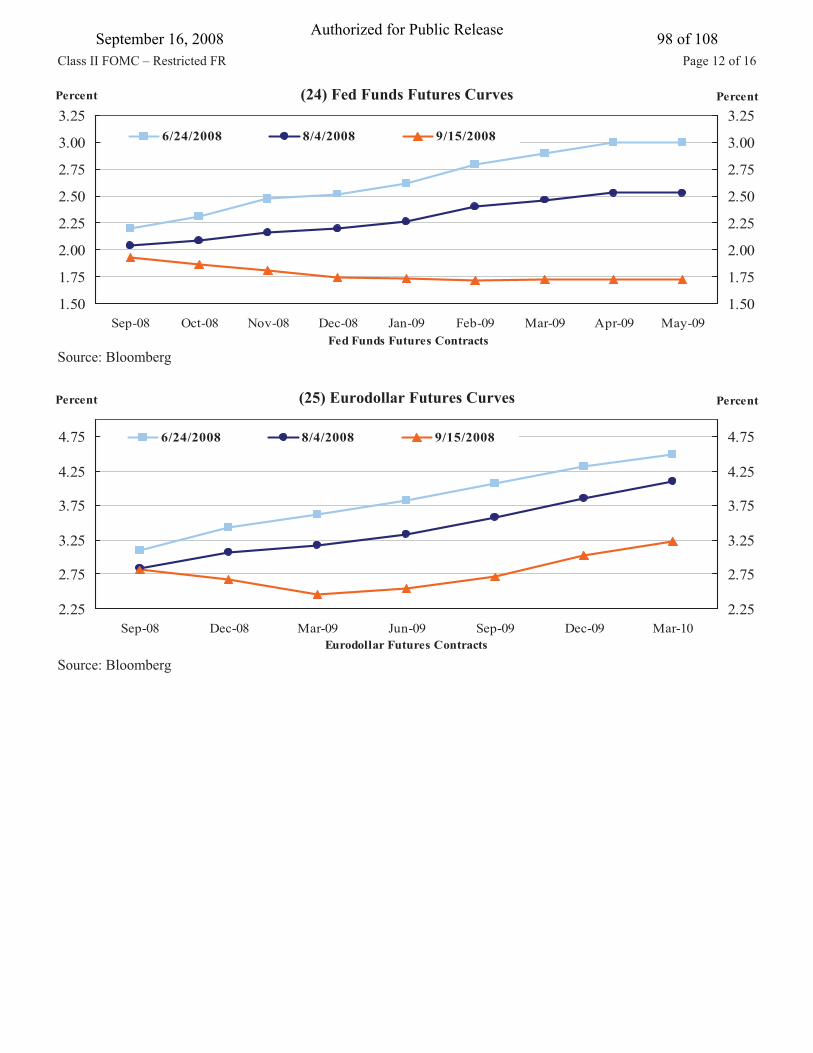
(24) Fed Funds Futures Curves
Source: Bloomberg
(25) Eurodollar Futures Curves
1.50
1.75
2.00
2.25
2.50
2.75
3.00
3.25
Sep-08 Oct-08 Nov-08 Dec-08 Jan-09 Feb-09 Mar-09 Apr-09 May-09Fed Funds Futures Contracts
Percent
1.50
1.75
2.00
2.25
2.50
2.75
3.00
3.25 Percent
6/24/2008 8/4/2008 9/15/2008
2.25
2.75
3.25
3.75
4.25
4.75
Sep-08 Dec-08 Mar-09 Jun-09 Sep-09 Dec-09 Mar-10Eurodollar Futures Contracts
Percent
2.25
2.75
3.25
3.75
4.25
4.75
Percent
6/24/2008 8/4/2008 9/15/2008
Page 12 of 16September 16, 2008 98 of 108Authorized for Public Release

Class II FOMC – Restricted FR
(26) Probabilities for Policy Rate Outcomes: September FOMC Meeting May 1, 2008 – September 11, 2008
Source: Federal Reserve Bank of Cleveland
Source: Federal Reserve Bank of Cleveland
0102030405060708090
100
05/01/08 05/16/08 05/31/08 06/15/08 06/30/08 07/15/08 07/30/08 08/14/08 08/29/08
Percent
0102030405060708090100
Percent
(27) Probabilities for Policy Rate Outcomes: October FOMC Meeting August 1, 2008 – September 11, 2008
0102030405060708090
100
08/01/08 08/06/08 08/11/08 08/16/08 08/21/08 08/26/08 08/31/08 09/05/08 09/10/08
Percent
0102030405060708090100
Percent
Page 13 of 16
2.75 Percent Target
2.50 Percent Target
2.25 Percent Target
2.00 Percent Target
1.75 Percent Target
2.75 Percent Target
2.50 Percent Target
2.25 Percent Target
2.00 Percent Target1.75 Percent Target
September 16, 2008 99 of 108Authorized for Public Release

Class II FOMC – Restricted FR
(28) Distribution of Expected Policy Target Rate Among Primary Dealers Prior to September 16 FOMC Meeting
Source: Dealer Policy Survey
Q3 2008 Q4 2008 Q1 2009 Q2 2009 Q3 2009 Q4 2009Source: Dealer Policy Survey
(29) Distribution of Expected Policy Target Rate Among Primary Dealers Prior to August 5 FOMC Meeting
1.0
1.5
2.0
2.5
3.0
3.5
4.0
4.5Percent
Survey Response: S ize Indicates Frequency
September AverageForecast
Market Rates as of 9/8
Q3 2008 Q4 2008 Q1 2009 Q2 2009 Q3 2009 Q4 2009
1.0
1.5
2.0
2.5
3.0
3.5
4.0
4.5Percent
Survey Response: S ize Indicates Frequency
August Average Forecast
Market Rates as of 7/28
Page 14 of 16September 16, 2008 100 of 108Authorized for Public Release

Class II FOMC – Restricted FR
-113579
111315
9/5/2007 10/24/2007 12/12/2007 1/30/2008 3/19/2008 5/7/2008 6/25/2008 8/13/2008
$ Billions
-113579111315
$ Billions
Ginnie MaeFreddie MacFannie Mae
(30) Weekly Changes in Aggregate FIMA Holdings of Agency MBS September 5, 2007 – September 10, 2008
Source: Federal Reserve Bank of New York
APPENDIX: Reference Exhibits
(31) Global Equity IndicesAugust 1, 2007 – September 15, 2008
Source: Bloomberg
50
60
70
80
90
100
110
120
130
08/01/07 10/01/07 12/01/07 02/01/08 04/01/08 06/01/08 08/01/08
Index to 100 on 8/1/07
50
60
70
80
90
100
110
120
130 Index to 100 on 8/1/07
DJ Euro StoxxJapan TopixMSCI Emerging Markets
Page 15 of 16September 16, 2008 101 of 108Authorized for Public Release

Class II FOMC – Restricted FR
(32) Forward Three-Month Libor-OIS Spreads July 1, 2007 – September 12, 2008
0
10
20
30
40
50
60
07/01/07 09/01/07 11/01/07 01/01/08 03/01/08 05/01/08 07/01/08 09/01/08
BPS
0
10
20
30
40
50
60 BPS
1-2 Year Horizon2-3 Year Horizon
Source: Reuters
Source: Bloomberg, Chicago Mercantile Exchange
(33) U.S. Dollar Net Long Positioning by Non-Commercial Accounts Increases* January 1, 2007 – September 1, 2008
-40
-30
-20
-10
0
10
20
01/01/07 03/01/07 05/01/07 07/01/07 09/01/07 11/01/07 01/01/08 03/01/08 05/01/08 07/01/08 09/01/08
Percent
-40
-30
-20
-10
0
10
20Percent
*Calculated as ($ amount of non-commercial long - short positioning) / ($ amount of total open interest). USD compared against the following currencies: EUR, JPY, GBP, CHF, CAD, MXN, AUD
Page 16 of 16September 16, 2008 102 of 108Authorized for Public Release

Appendix 2: Materials used by Mr. Madigan
September 16, 2008 103 of 108Authorized for Public Release

Class I FOMC – Restricted Controlled (FR)
Material for FOMC Briefing on Monetary Policy Alternatives and Trial Run Survey Results Brian Madigan September 16, 2008
September 16, 2008 104 of 108Authorized for Public Release

Exhibit 1
Class I FOMC – Restricted Controlled (FR) Table 1: Alternative Language for the September 2008 FOMC Announcement September 15, 2008
August FOMC Alternative A Alternative B Alternative C
Policy Decision
1. The Federal Open Market Committee decided today to keep its target for the federal funds rate at 2 percent.
The Federal Open Market Committee decided today to lower its target for the federal funds rate 25 basis points to 1¾ percent.
The Federal Open Market Committee decided today to keep its target for the federal funds rate at 2 percent.
The Federal Open Market Committee decided today to raise its target for the federal funds rate 25 basis points to 2¼ percent.
2. Economic activity expanded in the second quarter, partly reflecting growth in consumer spending and exports. However, labor markets have softened further and financial markets remain under considerable stress. Tight credit conditions, the ongoing housing contraction, and elevated energy prices are likely to weigh on economic growth over the next few quarters. Over time, the substantial easing of monetary policy, combined with ongoing measures to foster market liquidity, should help to promote moderate economic growth.
Strains in financial markets have increased significantly and labor markets have weakened further. Overall economic growth appears to have slowed considerably, and tight credit conditions and the ongoing housing contraction are among the factors likely to weigh on growth over the next few quarters. Today’s policy action, combined with those taken earlier, including the ongoing measures to foster market liquidity, should help to promote moderate economic growth over time.
Economic growth appears to have slowed recently, partly reflecting a softening of household spending. In addition, strains in financial markets have intensified and labor markets have weakened further. Tight credit conditions, the ongoing housing contraction, and some slowing in export growth are likely to weigh on economic growth over the next few quarters. Over time, the substantial easing of monetary policy, combined with ongoing measures to foster market liquidity, should help to promote moderate economic growth.
Economic growth appears to have slowed recently, partly reflecting a softening of household spending. In addition, strains in financial markets have intensified and labor markets have weakened further. Tight credit conditions, the ongoing housing contraction, and some slowing in export growth are likely to weigh on economic growth over the next few quarters. Nonetheless, the accommodative stance of monetary policy, combined with ongoing measures to foster market liquidity, should help to promote moderate economic growth.
Rationale
3. Inflation has been high, spurred by the earlier increases in the prices of energy and some other commodities, and some indicators of inflation expectations have been elevated. The Committee expects inflation to moderate later this year and next year, but the inflation outlook remains highly uncertain.
Inflation has been high, but the Committee expects that the recent decline in energy and other commodity prices and increased slack in resource utilization will foster a moderation of inflation later this year and next year. Nevertheless, the inflation outlook remains highly uncertain.
Inflation has been high, spurred by the earlier increases in the prices of energy and some other commodities. The Committee expects inflation to moderate later this year and next year, but the inflation outlook remains highly uncertain.
Inflation has remained high, and some indicators of inflation expectations have been elevated. Although the Committee expects inflation to moderate later this year and next year, the possibility that inflation may fail to decline as anticipated is of significant concern.
Assessment of Risk
4. Although downside risks to growth remain, the upside risks to inflation are also of significant concern to the Committee. The Committee will continue to monitor economic and financial developments and will act as needed to promote sustainable economic growth and price stability.
The downside risks to growth have intensified, but the upside risks to inflation remain a concern to the Committee. The Committee will continue to monitor economic and financial developments and will act as needed to promote sustainable economic growth and price stability.
The downside risks to growth and the upside risks to inflation are both of significant concern to the Committee. The Committee will continue to monitor economic and financial developments and will act as needed to promote sustainable economic growth and price stability.
The Committee took this action to provide additional assurance that inflation will abate as desired. The Committee will continue to monitor economic and financial developments and will act as needed to promote sustainable economic growth and price stability.
September 16, 2008 105 of 108Authorized for Public Release

1. I prefer that the trial run encompass both Alternative 1 and Alternative 2.
2. I prefer that the trial run encompass only Alternative 1 (projections of long-run values, say 5to 6 years ahead, absent further shocks).
3. I prefer that the trial run encompass only Alternative 2 (steady-state values).
4. I agree that a trial run should be conducted but have no preference regarding the twoalternatives.
5. I propose that the following alternative approach to longer-term projections be considered(please explain)
6. Other (please explain).
Survey Options
0
1
2
3
4
5
6
7
8
#1 #2 #3 #4 #5 #6
Survey Responses
Number of participants
Option
Exhibit 2Trial Run of Longer-Term Projections
September 16, 2008 106 of 108Authorized for Public Release

Appendix 3: Materials used by Chairman Bernanke
September 16, 2008 107 of 108Authorized for Public Release

For immediate release September 16, 2008 The Federal Open Market Committee decided today to keep its target for the federal
funds rate at 2 percent.
Strains in financial markets have increased significantly and labor markets have
weakened further. Economic growth appears to have slowed recently, partly reflecting a
softening of household spending. Tight credit conditions, the ongoing housing contraction, and
some slowing in export growth are likely to weigh on economic growth over the next few
quarters. Over time, the substantial easing of monetary policy, combined with ongoing measures
to foster market liquidity, should help to promote moderate economic growth.
Inflation has been high, spurred by the earlier increases in the prices of energy and some
other commodities. The Committee expects inflation to moderate later this year and next year,
but the inflation outlook remains highly uncertain.
The downside risks to growth and the upside risks to inflation are both of significant
concern to the Committee. The Committee will monitor economic and financial market
developments closely and will act as needed to promote sustainable economic growth and price
stability.
Voting for the FOMC monetary policy action were:
-0-
September 16, 2008 108 of 108Authorized for Public Release