fomc 20081029 sep compilation
TRANSCRIPT

2008 2009 2010 2011Central Tendencies
Real GDP Growth 0.0 to 0.3 -0.2 to 1.1 2.3 to 3.2 2.8 to 3.6June projections 1.0 to 1.6 2.0 to 2.8 2.5 to 3.0 n/a
Unemployment Rate 6.3 to 6.5 7.1 to 7.6 6.5 to 7.3 5.5 to 6.6June projections 5.5 to 5.7 5.3 to 5.8 5.0 to 5.6 n/a
PCE Inflation 2.8 to 3.1 1.3 to 2.0 1.4 to 1.8 1.4 to 1.7June projections 3.8 to 4.2 2.0 to 2.3 1.8 to 2.0 n/a
Core PCE Inflation 2.3 to 2.5 1.5 to 2.0 1.3 to 1.8 1.3 to 1.7June projections 2.2 to 2.4 2.0 to 2.2 1.8 to 2.0 n/a
RangesReal GDP Growth -0.3 to 0.5 -1.0 to 1.8 1.5 to 4.5 2.0 to 5.0
June projections 0.9 to 1.8 1.9 to 3.0 2.0 to 3.5 n/a
Unemployment Rate 6.3 to 6.6 6.6 to 8.0 5.5 to 8.0 4.9 to 7.3June projections 5.5 to 5.8 5.2 to 6.1 5.0 to 5.8 n/a
PCE Inflation 2.7 to 3.6 1.0 to 2.2 1.1 to 1.9 0.8 to 1.8June projections 3.4 to 4.6 1.7 to 3.0 1.6 to 2.1 n/a
Core PCE Inflation 2.1 to 2.5 1.3 to 2.1 1.1 to 1.9 0.8 to 1.8June projections 2.0 to 2.5 1.8 to 2.3 1.5 to 2.0 n/a
Table 1: Economic Projections of Federal Reserve Governors and ReserveBank Presidents 1
1. Projections of real GDP growth, PCE inflation and core PCE inflation are fourth-quarter-to-fourth-quarter growth rates, i.e. percentage changes from the fourth quarter of the prior year to the fourth quarter of the indicated year. PCE inflation and core PCE inflation are the percentage rates of change in the price index for personal consumption expenditures and the price index for personal consumption expenditures excluding food and energy, respectively. Each participant's projections are based on his or her assessment of appropriate monetary policy. The range for each variable in a given year includes all participants' projections, from lowest to highest, for that variable in the given year; the central tendencies exclude the three highest and three lowest projections for each variable in each year.
SEP: Compilation and Summary of Individual Economic Projections October 28–29, 2008
Authorized for Public Release – 1 of 32
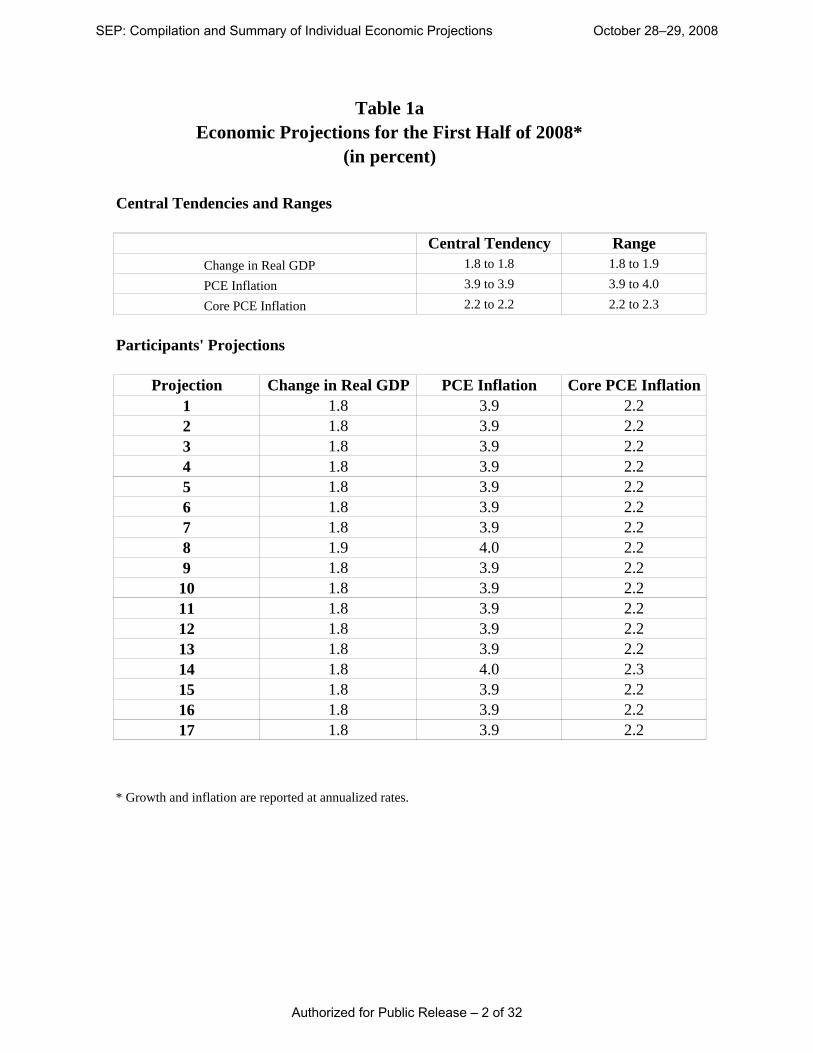
Central Tendencies and Ranges
Central Tendency Range1.8 to 1.8 1.8 to 1.9
3.9 to 3.9 3.9 to 4.0
2.2 to 2.2 2.2 to 2.3
Participants' Projections
Projection Change in Real GDP PCE Inflation Core PCE Inflation1 1.8 3.9 2.22 1.8 3.9 2.23 1.8 3.9 2.24 1.8 3.9 2.25 1.8 3.9 2.26 1.8 3.9 2.27 1.8 3.9 2.28 1.9 4.0 2.29 1.8 3.9 2.210 1.8 3.9 2.211 1.8 3.9 2.212 1.8 3.9 2.213 1.8 3.9 2.214 1.8 4.0 2.315 1.8 3.9 2.216 1.8 3.9 2.217 1.8 3.9 2.2
* Growth and inflation are reported at annualized rates.
Table 1aEconomic Projections for the First Half of 2008*
Change in Real GDP
PCE Inflation
Core PCE Inflation
(in percent)
SEP: Compilation and Summary of Individual Economic Projections October 28–29, 2008
Authorized for Public Release – 2 of 32

Central Tendencies and Ranges
Central Tendency Range-1.8 to -1.2 -2.4 to -0.8
1.6 to 2.3 1.4 to 3.3
2.4 to 2.8 2.0 to 2.8
Participants' Projections
Projection Change in Real GDP PCE Inflation Core PCE Inflation1 -1.6 2.1 2.62 -1.2 1.5 2.63 -1.8 1.5 2.44 -1.2 2.3 2.85 -1.2 1.7 2.66 -1.2 1.7 2.67 -0.8 1.7 2.88 -1.5 1.6 2.69 -1.8 3.1 2.810 -1.8 3.3 2.811 -2.4 1.7 2.812 -1.2 2.1 2.813 -1.6 2.5 2.414 -1.4 1.4 2.515 -1.6 1.9 2.616 -1.8 2.3 2.217 -1.0 2.1 2.0
* Projections for the second half of 2008 implied by participants' October projections for the first half of 2008 and for 2008 as a whole. Growth and inflation are reported at annualized rates.
Table 1bEconomic Projections for the Second Half of 2008*
Change in Real GDP
PCE Inflation
Core PCE Inflation
(in percent)
SEP: Compilation and Summary of Individual Economic Projections October 28–29, 2008
Authorized for Public Release – 3 of 32

Projection Year Change in Real GDP Unemployment Rate PCE Inflation Core PCE Inflation
1 2008 0.1 6.4 3.0 2.42 2008 0.3 6.5 2.7 2.43 2008 0.0 6.4 2.7 2.34 2008 0.3 6.3 3.1 2.55 2008 0.3 6.3 2.8 2.46 2008 0.3 6.3 2.8 2.47 2008 0.5 6.4 2.8 2.58 2008 0.2 6.4 2.8 2.49 2008 0.0 6.5 3.5 2.510 2008 0.0 6.4 3.6 2.511 2008 -0.3 6.4 2.8 2.512 2008 0.3 6.5 3.0 2.513 2008 0.1 6.6 3.2 2.314 2008 0.2 6.3 2.7 2.415 2008 0.1 6.4 2.9 2.416 2008 0.0 6.5 3.1 2.217 2008 0.4 6.3 3.0 2.1
1 2009 0.6 7.4 1.2 1.52 2009 0.3 7.4 1.4 1.73 2009 0.5 7.1 1.3 1.44 2009 1.1 7.2 1.8 2.05 2009 -0.1 7.2 1.2 1.36 2009 1.8 6.6 1.8 1.97 2009 1.8 7.0 2.2 2.08 2009 -1.0 7.8 1.3 1.69 2009 1.5 7.0 2.0 2.010 2009 1.0 7.5 2.1 2.011 2009 -0.2 7.2 1.8 1.812 2009 0.5 7.3 1.8 2.013 2009 1.0 8.0 1.5 1.714 2009 0.1 7.4 1.6 1.515 2009 -1.0 7.6 2.1 2.116 2009 0.0 7.7 1.0 1.717 2009 -0.8 7.5 1.8 1.6
Table 2: October Economic Projections(in percent)
SEP: Compilation and Summary of Individual Economic Projections October 28–29, 2008
Authorized for Public Release – 4 of 32

Projection Year Change in Real GDP Unemployment Rate PCE Inflation Core PCE Inflation
1 2010 2.4 6.9 1.6 1.32 2010 3.1 7.1 1.3 1.33 2010 3.0 6.9 1.3 1.34 2010 3.0 6.5 1.8 1.85 2010 2.3 6.5 1.4 1.36 2010 4.5 5.8 1.9 1.87 2010 2.7 5.5 1.7 1.78 2010 4.0 7.3 1.1 1.19 2010 2.5 6.5 1.5 1.510 2010 2.5 7.0 1.7 1.611 2010 3.5 6.8 1.5 1.512 2010 3.2 6.9 1.8 1.813 2010 3.0 7.5 1.7 1.514 2010 2.4 7.3 1.5 1.315 2010 1.5 7.8 1.9 1.916 2010 1.8 8.0 1.6 1.517 2010 1.5 6.6 1.5 1.5
1 2011 3.6 6.4 1.7 1.52 2011 4.8 6.1 1.2 1.23 2011 5.0 6.0 1.3 1.24 2011 2.8 5.9 1.8 1.85 2011 3.0 4.9 1.5 1.56 2011 3.5 5.1 1.6 1.67 2011 2.7 5.0 1.7 1.78 2011 3.8 6.6 0.8 0.89 2011 2.8 5.5 1.5 1.510 2011 3.5 6.0 1.5 1.411 2011 3.0 6.5 1.5 1.512 2011 3.2 6.6 1.6 1.613 2011 3.5 6.3 1.8 1.814 2011 3.6 6.7 1.4 1.315 2011 2.5 7.0 1.8 1.816 2011 3.5 7.3 1.6 1.517 2011 2.0 6.2 1.4 1.3
Table 2 (continued): Economic Projections
SEP: Compilation and Summary of Individual Economic Projections October 28–29, 2008
Authorized for Public Release – 5 of 32

1
+_0
1
2
3
4
5
6
Percent
Figure 1. Central tendencies and ranges of economic projections, 2008–11
201120102009200820072006200520042003
Change in real GDP
Range of projections
Actual
Central tendency of projections
5
6
7
8
Percent
201120102009200820072006200520042003
Unemployment rate
1
2
3
4
Percent
201120102009200820072006200520042003
PCE inflation
1
2
3
4
Percent
201120102009200820072006200520042003
Core PCE inflation
NOTE: Definitions of variables are in the notes to table 1. The data for the actual values of the variables are annual.
SEP: Compilation and Summary of Individual Economic Projections October 28–29, 2008
Authorized for Public Release – 6 of 32

Uncertainty and Risks - GDP Growth
0
5
10
15
20Number of participants
Lower(C)
Broadly similar(B)
Higher(A)
2(a): Please indicate your judgment of the uncertainty attached to your projections relative tolevels of uncertainty over the past 20 years.
0
5
10
15
20Number of participants
Weighted to downside(C)
Broadly balanced(B)
Weighted to upside(A)
2(b): Please indicate your judgment of the risk weighting around your projections.
Individual Responses
Respondent 1 2 3 4 5 6 7 8 9 10 11 12 13 14 15 16 17
2(a) A A A A A A A A A A A A A A A A A2(b) C C C C C C B C C C B C C C C C B
SEP: Compilation and Summary of Individual Economic Projections October 28–29, 2008
Authorized for Public Release – 7 of 32

Uncertainty and Risks - Unemployment Rate
0
5
10
15
20Number of participants
Lower(C)
Broadly similar(B)
Higher(A)
2(a): Please indicate your judgment of the uncertainty attached to your projections relative tolevels of uncertainty over the past 20 years.
0
5
10
15
20Number of participants
Weighted to downside(C)
Broadly balanced(B)
Weighted to upside(A)
2(b): Please indicate your judgment of the risk weighting around your projections.
Individual Responses
Respondent 1 2 3 4 5 6 7 8 9 10 11 12 13 14 15 16 17
2(a) A A A A A A A A A A B A A A A A A2(b) A A A A A A B A A A B A A A A A A
SEP: Compilation and Summary of Individual Economic Projections October 28–29, 2008
Authorized for Public Release – 8 of 32

Uncertainty and Risks - PCE Inflation
0
5
10
15
20Number of participants
Lower(C)
Broadly similar(B)
Higher(A)
2(a): Please indicate your judgment of the uncertainty attached to your projections relative tolevels of uncertainty over the past 20 years.
0
5
10
15
20Number of participants
Weighted to downside(C)
Broadly balanced(B)
Weighted to upside(A)
2(b): Please indicate your judgment of the risk weighting around your projections.
Individual Responses
Respondent 1 2 3 4 5 6 7 8 9 10 11 12 13 14 15 16 17
2(a) A A A A A A A A A C B A A B A A C2(b) C C B A B B B C B B B B C B C B C
SEP: Compilation and Summary of Individual Economic Projections October 28–29, 2008
Authorized for Public Release – 9 of 32

Uncertainty and Risks - Core PCE Inflation
0
5
10
15
20Number of participants
Lower(C)
Broadly similar(B)
Higher(A)
2(a): Please indicate your judgment of the uncertainty attached to your projections relative tolevels of uncertainty over the past 20 years.
0
5
10
15
20Number of participants
Weighted to downside(C)
Broadly balanced(B)
Weighted to upside(A)
2(b): Please indicate your judgment of the risk weighting around your projections.
Individual Responses
Respondent 1 2 3 4 5 6 7 8 9 10 11 12 13 14 15 16 17
2(a) A A A A A A A A A C B A A B A A B2(b) C C B A B B B C B B B B B B C B B
SEP: Compilation and Summary of Individual Economic Projections October 28–29, 2008
Authorized for Public Release – 10 of 32

SEP: Compilation and Summary of Individual Economic Projections October 28–29, 2008
Uncertainty and Risks 2(a). (Optional) If you have any explanatory comments regarding your
judgment of the uncertainty attached to your pro jections relative to levels of uncertainty over the past 20 years, you may enter them below.
Respondent 1: No Comment
Respondent 2: The global financial crisis and the potential effects of the limit to monetary policy actions posed by the zero lower bound on interest rates raise the level of uncertainty around our pro jections for economic activity. The increased volatility in commo dities prices and the heightened risks to the outlook for growth raise the level of uncertainty about our inflation pro jections.
Respondent 3: N/A
Respondent 4: N/A
Respondent 5: N/A
Respondent 6: N/A
Respondent 7: The economy is experiencing financial market stresses that not typically observed at turning points. Further, the degree to which these stresses will persist and the extent of their effect on the real economy are uncertain. As a result, I view forecast uncertainty to be higher than usual even given that we are at a turning point.
Respondent 8: On the real side, there is considerable uncertainty about the ultimate impact of financial market disruption on real activity. Previous credit crisis episo des provide little guidance in present circumstances, given both the extent of the crisis and the measures taken by the monetary and fiscal authorities to stem the crisis. On the inflation side, there is some evidence that the slope of the Phillips curve becomes steeper once the unemployment rate is sufficiently far away from the NAIRU. If this is the case, then the decline in inflation (and the risks of deflation) could be more severe than in our baseline forecast.
Respondent 9: N/A
Respondent 10: Uncertainty regarding real activity is greater than usual over the next four quarters. Under an appropriate monetary policy, inflation expectations would be more firmly anchored and inflation uncertainty would be lower than today.
Respondent 11: Because the duration/intensity of financial dislocations and headwinds remains unclear, there is greater uncertainty associated with my pro jections of GDP growth. On the other hand, uncertainty about the inflation forecast has if anything diminished because the pieces for a projected slowing in inflation appear to be falling into place.
Authorized for Public Release – 11 of 32

SEP: Compilation and Summary of Individual Economic Projections October 28–29, 2008
Respondent 12: The current period may alter our views on the ”Great Moderation.”
Respondent 13: Quantitative judgment based on standard deviation of FRBNY forecast distribution for GDP growth and core PCE inflation relative to those reported in Reifschneider and Tulip.
Respondent 14: Uncertainty about growth and unemployment stems from the difficulty of predicting the course of the housing correction, the financial crisis, and the real effects of the financial crisis.
Respondent 15: N/A
Respondent 16: N/A
Respondent 17: N/A
Authorized for Public Release – 12 of 32

SEP: Compilation and Summary of Individual Economic Projections October 28–29, 2008
Uncertainty and Risks 2(b). (Optional) If you have any explanatory comments regarding your
judgment of the risk weighting around your pro jections, you may enter them below.
Respondent 1: No Comment
Respondent 2: The risks to the outlook for growth are weighted to the downside and those for the outlook for unemployment are corresp ondingly weighted to the upside. The interaction of higher unemployment and rising delinquencies raises the potential for even greater losses by banks and other institutions and an intensification of the adverse feedback loop we have long worried about and are now experiencing. Given the sizable downside risks to the forecast for growth, the risks to the inflation forecast are likewise weighted to the downside.
Respondent 3: N/A
Respondent 4: N/A
Respondent 5: N/A
Respondent 6: N/A
Respondent 7: N/A
Respondent 8: N/A
Respondent 9: N/A
Respondent 10: N/A
Respondent 11: No comment
Respondent 12: Financial stresses may last longer than we assume.
Respondent 13: Quantitative judgment based on the difference between pro jection and expected value from FRBNY forecast distribution. Downside risk to total inflation from risks to conditioning assumption on future energy and other commodity prices.
Respondent 14: N/A
Authorized for Public Release – 13 of 32

SEP: Compilation and Summary of Individual Economic Projections October 28–29, 2008
Respondent 15: While a moderation in inflation is expected, it is possible that the disinflationary consequences of economic weakness could be stronger than shown in my forecast.
Respondent 16: N/A
Respondent 17: N/A
Authorized for Public Release – 14 of 32

SEP: Compilation and Summary of Individual Economic Projections October 28–29, 2008
Appropriate Monetary Policy 3. Does your view of the appropriate path of interest rates differ materially
from the interest rate assumed by the staff in the Greenbook?
YES 11
NO 6
Respondent 1: Yes I assume that the funds rate will need to remain at 0.5 percent until the middle of 2011.
Respondent 2: No N/A
Respondent 3: No N/A
Respondent 4: Yes I assume the federal funds rate target is maintained near current levels in the near-term and is then raised sooner and at a faster rate than Greenbook.
Respondent 5: No N/A
Respondent 6: No N/A
Respondent 7: Yes My forecast assumes a less accommo dative federal funds rate path than that in the Greenbook baseline. I view appropriate policy as keeping the funds rate at 1.5 percent until the summer of next year. The funds rate rises to 2.75 in 2009Q4 as output growth begins to accelerate in 2009H2. In 2010 the economy is growing at its trend pace and the funds rate reaches 4.25 percent by 2010Q4
Respondent 8: No N/A
Respondent 9: Yes I doubt that a federal funds rate target path this low through 2013 is consistent with the inflation objectives of the FOMC.
Respondent 10: Yes I believe price stability will require us to raise rates more rapidly following this recession than assumed in the Greenbook.
Respondent 11: Yes For the near term, my Federal funds rate target remains about 1/2 percentage point above that assumed in the Greenbook, and I further assume that the target will begin to rise early in 2010.
Respondent 12: Yes For the near term, we assume a path similar to the Greenbook. However, by mid 2009, we assume financial stresses will have dissipated enough that the fed funds rate can begin to be raised while continuing to maintain the same level of overall money market accommodation. We assume that it will be appropriate to raise rates further as growth recovers in 2010. By the end of the pro jection period, we assume that the funds rate
Authorized for Public Release – 15 of 32

SEP: Compilation and Summary of Individual Economic Projections October 28–29, 2008
will be near 3.75%, a rate that we would consider modestly accommodative. Such accommodation seems appropriate given that we expect to still have significant resource slack left in the economy.
Respondent 13: Yes Target federal funds rate lowered to 1.0% by the end of 2008Q4. In 2009, it remains at 1% at least through 2009Q3, it then starts to renormalize back to 3.0% by the end of 2010 and reaches 4.25% by the end of 2011.
Similar to the near-term path assumed in the Greenbook, higher in 2010-11.
Implies a real funds rate similar to the Greenbook in near-term, somewhat higher in 2010-11.
Respondent 14: Yes Note considerable uncertainty. The possibility exists of a binding zero bound, quantitative easing etc. If the modal forecast obtains, however, would expect rate to rise somewhat earlier than in the Greenbook.
Respondent 15: Yes N/A
Respondent 16: Yes The inflation threat has diminished while the risks to real growth have increased. These shifts would ordinarily strengthen the case for further reductions in short-term interest rates. Rate cuts are likely to be of only very limited effectiveness, however, given that the monetary transmission mechanism remains impaired.
Respondent 17: No N/A
Authorized for Public Release – 16 of 32

SEP: Compilation and Summary of Individual Economic Projections October 28–29, 2008
Forecast Narratives 4(a). Please describe the key factors shaping your central economic outlook
and the uncertainty around that outlook
Respondent 1: Fallout from the credit crisis severely impacts real economic activity; depressing business investment and production and further dampening consumer spending. This ultimately leads to a substantial recession. Coming out of the recession, my outlook accounts for some loss in potential output along the lines of the costly reallocation scenario from previous Greenbooks. A period of slower productivity growth, while the reallo cation is occurring, leads to a smaller output gap than would otherwise occur. This results in less disinflation in my outlook for 2011 than seen in the Greenbook.
There is a substantial amount of uncertainty surrounding this pro jection, as credit contractions are notoriously difficult to analyze. The primary risks remain to the downside on near-term growth and on how the economy will recover in the latter years. Zero bound issues may further complicate the implementation of monetary policy.
Respondent 2: Financial conditions have tightened tremendously, with sharply elevated risk spreads and severe dislo cations in credit markets. Housing activity has yet to show consistent signs of stabilizing, labor market conditions continue to deteriorate, consumer and business spending are in decline, and the outlook for global growth has slowed markedly. These factors contribute to the projected contraction in economic activity through the first half of 2009.
Actions aimed at preserving liquidity in key money and credit markets and the recapitalization of banks are crucial steps in restoring confidence in and improving the functioning of financial markets. Over time, risk spreads should diminish and with the funds rate low, the cost and availability of credit should improve, contributing to a gradual recovery in the economy beginning in the second half of next year.
The combination of plummeting commodity prices, the sharp appreciation of the dollar, and mounting slack in labor and goods markets, both here and abroad, should bring overall inflation down to a level consistent with price stability by next year. Continued slack causes inflation to edge down further over the forecast period.
Respondent 3: sharply greater financial stringency and reduced confidence exert considerable restraint on spending in the near term and their effects ero de slowly over the next year or two allowing lower policy interest rates to show through slowly to financial conditions to bolster demand. Fiscal stimulus early next year counters only a small part of the added restraint. In an environment of weak global growth commodity prices stay low, which together with substantial slack put inflation on a clear downward trend; inflation expectations decline, but remain above projected inflation in the out years. Downside risks to output from the possibility of even more gradual restoration of more normal credit market functioning predominate. the effect of downside output risks on inflation risks are off set by the possibility that commodity prices could recover faster than in the futures markets once global growth stabilizes, leaving risks around the gentle downward drift in inflation roughly balanced.
Respondent 4: Recent data on consumer and business spending, housing, labor markets, and financial markets have led me to revise down my forecast for growth in 2008 and 2009. As a result, I now expect real GDP to decline in the third and fourth quarter and to grow at about a 1 percent rate in 2009. Recent declines in energy prices are expected to ease the burden on household finances, but not enough to offset the negative effects of job
Authorized for Public Release – 17 of 32

SEP: Compilation and Summary of Individual Economic Projections October 28–29, 2008
losses, declining incomes and wealth, and tighter credit. With the federal funds rate remaining near current levels in the near term, and the drag from housing and financial turmoil diminishing, I expect real GDP will grow 3 percent in 2010–ab out 1/2 percentage point faster than potential.
The recent decline in energy prices, along with the expected stabilization of food and energy prices, and near-term weakness in output and spending, should allow overall and core inflation to moderate going forward.
In light of continued, severe problems in housing and financial markets and heightened caution on the part of consumers and businesses, the risks to GDP growth are weighted to the downside. However, in the case of inflation, I believe the medium-term risks are weighted to the upside if we maintain the current funds rate for ”too long” or increase the rate ”too slowly.” In addition, the large increase in the size of our balance sheet and the monetary base reinforce this concern.
Respondent 5: The extraordinary tensions in the money markets, the substantial decline in sto ck market wealth globally, and the sharp reduction in economic activity worldwide have led to a large cut in my growth forecast for the next two years. We seem to be seeing the potential for a negative feedback dynamic discussed in previous projection narratives become a concrete reality in the US and the rest of the world. The downside risks to growth and uncertainty about real activity have certainly increased. The sharp decline in commodity prices and significantly reduced resource pressures globally have led to a substantial reduction in my near term inflation forecast, but such rapid changes also suggest a high level of uncertainty about the forecast.
Respondent 6: I chose the alternate scenario - more rapid financial recovery on the assumption that Govt will continue to attack on all fronts until financial markets resume more normal functioning. The risk is that markets are slow to respond regardless of Govt action. I also assumed lending by non Wall Street commercial banks would quickly return to normal levels. This assumption comes from three factors (1) TARP capital injections (2) Consolidation of the two weakest large banks with stronger partners and (3) Portfolio loan problems in these banks still appear manageable. The risk to this assumption is that the financial health of the non Wall Street banks deteriorates more than I expect or that business and consumer conditions are more reliant than I realize on the remaining large troubled firms, including AIG. One final key assumption is that residential real estate markets bottom by mid 2009.
Respondent 7: The recent data on the economy have been weaker than what I anticipated in my June forecast. In addition, financial market stresses appear elevated and their impact on the economy going forward remains highly uncertain. I expect the economy to grow at a significantly below-trend pace through the first half of 2009 with the housing sector and financial market stresses continuing to act as a drag on growth. However, these factors are largely unwound by mid-2009 and the economy rebounds to trend growth of about 2.7 percent in 2009H2. Near-term, I anticipate that trend growth will be temporarily be lower as the financial markets restructure. Consistent with this (and my stronger growth forecast), I do not expect as large an output gap to open up as in the Greenbook projection. Inflation reaches my long-term goal of 1.7 percent in 2010 and 2011. The economy grows at its trend pace in 2010 and 2011.
Respondent 8: Real activity slowed sharply over the summer, and the more recent intensification of the credit crisis has put additional downward pressure on an economy already in recession. Accelerating house price declines, large losses in stock market wealth, and continued deterioration in labor market conditions have weakened households’ fundamentals substantially. As a result, we expect significant retrenchment in consumer spending for the rest of this year and in the first half of 2009. Multiplier effects from declining household spending will put significant restraint on other components of demand, too. In addition, the interest-sensitive com
Authorized for Public Release – 18 of 32

SEP: Compilation and Summary of Individual Economic Projections October 28–29, 2008
ponents of demand are negatively affected by the increase in yields and by non-price supply constraints on credit resulting from the credit crisis. Given the synchronicity in the decline of activity across U.S. trading partners, support from net exports is likely to prove limited. In the second half of 2009, activity should begin to expand slowly, but GDP growth is expected to post a decline for the year as a whole. The unemployment rate is expected to peak at 7.8 percent, before declining to 6.6 percent by the end of 2011.
Given the considerable amount of projected slack in labor markets over the forecast horizon, inflation is expected to moderate substantially. We pro ject core inflation to be 0.8 percent in 2011. The probability of outright deflation over the next two to three years is sizable, especially when taking into account the upward bias in measured inflation.
Risks to both economic activity and inflation are tilted to the downside. The effect of the credit crisis on real economic activity is highly uncertain, but the possibility of a more costly and lengthy resolution of the crisis remains a strong concern. As for inflation, the risks are to the downside not just because of the downside risks to real activity, but also because in current circumstances the inflation response to labor market slack could be larger.
Respondent 9: Ballooning uncertainty has made the value of the exercise at this juncture questionable.
Respondent 10: Headline inflation is likely to be low in coming months due to the recent fall in commodity prices. We are in a recession that could well bottom out by the middle of next year. Falling commercial construction is like to dampen the pace of the subsequent expansion.
Respondent 11: I expect the real economy to perform relatively poorly until (approximately) the middle of 2010, restrained by credit conditions, ongoing adjustments in housing, and relatively broad-based softness in other components of aggregate demand. Thereafter, I anticipate a resumption of healthy growth through 2011, as restraints diminish, demand recovers, and productivity reaccelerates. In the economic and policy environment I envision inflation should stay low.
Respondent 12: We expect the intensification of the financial turmoil, negative wealth effects, and slowing growth in the rest of the world will cause output to fall in the second half of 2008 and the first half of 2009. We are projecting a cumulative decline in output of about 1%. We expect growth to resume in the second half of 2009, but to be at a somewhat sluggish pace. The dissipation of financial headwinds, some fiscal stimulus, normal cyclical dynamics and accommo dative monetary policy should combine to boost growth above potential in 2010 and 2011. However, we expect an elevated unemployment rate and a significant output gap will remain at the end of the forecast period. The reduction in energy prices and the emergence of a significant amount of slack should bring both core and total PCE inflation down to around 1.6% by 2011.
We assume financial headwinds dissipate during 2009, as the effects of the recapitalization of the banking sector take hold and financial market functioning improves. The speed at which these headwinds ease presents a two-sided risk to the forecast. On the one hand, a more serious recession could occur if the weakening economy leads to further defaults and declines in asset values that reinforce the financial disruptions. On the other hand, the multitude of recently implemented policies could improve market functioning more quickly than we’ve assumed.
Respondent 13: In our central scenario pro jection the US economy entered into a recession in mid 2008. Negative growth of real GDP is expected to persist for three quarters, followed by roughly a year of below potential growth. At
Authorized for Public Release – 19 of 32

SEP: Compilation and Summary of Individual Economic Projections October 28–29, 2008
the trough, the level of real GDP is about 1 1
4 % below the peak. Thus, this pro jected recession would be similar in depth to the 1990-91 recession but of a longer duration. By the spring of 2009 recovery begins to take hold, aided by the preemptive path of monetary policy and various initiatives to foster financial market stability. Growth returns to just above its potential rate by 2010 and accelerates in 2011 to about 1% above potential, implying only a narrowing rather than a complete closing of the output gap over this period. The unemployment rate peaks at around 8%. Although we judge a moderate recession to be the most likely outcome, the risk that this downturn turns out to be more severe than any in the post-WWII period is high.
Within the central scenario pro jection, consumer spending remains relatively sluggish through 2009 as households respond to the decline in their net worth by boosting saving out of current cash flow. The housing correction is expected to be largely completed by mid-2009, with housing starts only modestly above replacement levels. At that point the large drag that residential investment has exerted on growth for the past three years will be over. Thereafter, housing is likely to be a modest plus for growth, but the surge of residential investment experienced in the early stages of past recoveries is not anticipated due to the continued high levels of homes coming onto the market through the foreclosure process. Indeed, the correction in house prices is expected to continue through the end of 2009 with a cumulative 18% peak- to-trough decline in the FHFA purchase-only home price index. With the downgrading of foreign growth prospects, the rate of growth of exports is expected to slow from its recent robust pace. Nonetheless, in the near-term net exports remains a plus for growth from an accounting sense as import growth remains very sluggish due to the weakness of domestic demand. By the second half of 2009 and into 2010 the net export contribution subsides as the gradual recovery of domestic demand induces an increase in the rate of growth of imports. Lastly, as financial market functioning returns to more normal conditions and economic prospects begin to improve, business confidence is restored and investment spending starts to provide some support to the economy.
In this central scenario, core inflation gradually slows over the forecast horizon as the rate of increase of non-oil import prices subsides and the effect of increasing slack becomes more pronounced. In the very near-term total inflation is likely to run well below core inflation, and possibly be negative, as the effects of the recent sharp declines in energy and other commodity prices show through in prices paid by consumers. This projected path for core inflation is based on our assessment of the FOMCs inflation objective as well as the assumptions that inflation expectations remain well-contained and that oil and other commo dity prices remain near recent levels.
The risks to our central pro jection for real activity are substantial and are skewed to the downside. In the near-term, the key risk is that the ongoing turmoil in financial markets results in a larger contraction in the supply of credit that we are currently expecting. This in turn leads to more pronounced weakness in a wide array of asset prices and credit markets, inducing a further contraction in the supply of credit. This adverse feed-back process is clearly evident in the housing market, and now appears to be spreading into the automobile market. A related risk is that the decline of household net worth embedded in this central projection induces a steeper-than-expected increase of the personal saving rate, keeping consumer spending weaker for longer. Finally, a risk over the medium term is the uncertainty surrounding our assumption of the economys potential growth rate.
The balance of risks is harder to categorize for inflation. Clearly there is a significant downside risk should a severe recession start to unfold. In contrast, in the current environment of aggressive policy response to the ongoing financial crisis, and with the prospect of additional fiscal action, there is some risk of higher inflation if the economy proves more resilient than in our central scenario. These two risks roughly balance as measured by the metric of comparing the expected value to the mode but other metrics suggest downside risks predominate. For total inflation, we assess near-term downside risk given recent developments in energy and other commo dity markets.
The heightened uncertainty asso ciated with turning points, the ongoing turmoil in financial markets, and
Authorized for Public Release – 20 of 32

SEP: Compilation and Summary of Individual Economic Projections October 28–29, 2008
the uncertainty associated with the timing, magnitude, and effectiveness of policy responses have resulted in highly elevated uncertainty around our central pro jection compared to typical levels.
Respondent 14: The intensification of the financial crisis, the global spreading of both financial and growth risks, the sharp effects of reduced credit availability on activity, and disappointing numbers prior to the intensification of the crisis all point to much slower growth. Government measures have helped to stabilize the banking system but the positive effects on growth will not immediately be apparent. Monetary and fiscal policy are constrained in their ability to offset the slowdown. The recession will continue into 2009, and recovery will be slow.
Sharply declining commodity prices, the stronger dollar, and rising output gaps will bring inflation down. Expect to see commodity prices begin to rise again in the early stages of the recovery.
Respondent 15: All indicators show the economy is currently in recession, and GDP is expected to decline through the third quarter of 2009 in response to a fall in household and business spending, and weakness in foreign demand. The decline in GDP is mitigated to some extent by an assumed expansion in fiscal stimulus in 2009. However, credit loses and solvency concerns remain elevated into 2010, and this slows the pace of recovery.
Lower import prices and weak domestic demand conditions result in a moderation in inflation over the forecast period. This moderation is mitigated by a temporary reduction in potential growth.
Respondent 16: Construction remains a drag well into 2009. Net export growth falters. Consumers remain shell shocked. Layoffs increase and become more widespread. Recovery, although helped along by fiscal stimulus, is likely to be slow, and will be contingent on banks resuming credit expansion.
Headline inflation in the second half of 2008 will be held down by commo dity-price declines and less aggressive pricing from intermediate and finished-goods import sources. Global slack is likely to increase through 2009, putting further downward pressure on commo dity prices and foreign and domestic labor costs. Core inflation is also likely to ease, first because of recent dollar strength; second because the fall in house prices must eventually feed through into core prices, either through rents or indirectly through weaker consumption demand; third because unit labor costs remain subdued and input prices are down, meaning price pressure from corporations is unlikely to be a factor, especially given that the overall strength of corporate balance sheets means firms can afford some margin erosion.
Respondent 17: Typical recession dynamics take hold. Potential growth rates fall and NAIRU increases. Significant uncertainty as to timing of credit market normalization. Significant risks of negative feedback loop beyond that incorporated into pro jections
Authorized for Public Release – 21 of 32

SEP: Compilation and Summary of Individual Economic Projections October 28–29, 2008
Forecast Narratives (continued) 4(b). Please describe the key judgements and assumptions affecting your
economic projections in the final pro jection year.
Respondent 1: In my pro jection for 2011, we will still not have converged to the level of potential GDP or the equilibrium unemployment rate.
Respondent 2: In 2011, the forecasted inflation rate is 1.2 percent, below my long-run inflation objective of 1.8 percent. The unemployment rate ends the year at 6.1 percent, still above my estimate of the natural rate of 4.8 percent. The stance of monetary policy remains accommodative–with a real funds rate of about 1 percent at the end of 2011–in order to foster a reduction in the unemployment rate.
Respondent 3: given the size of the shock, the economy is still adjusting in 2011. The long-run growth rate of GDP potential is 2.5 percent; the NAIRU is 4.75; and the rate of inflation consistent with pursuit of our output and price stability objectives is 1.75 percent.
Respondent 4: With monetary policy remaining especially accommo dative in the near-term, I expect real GDP growth will be above potential in 2010, approach potential in 2011, and be at potential in 2012. I also expect core PCE inflation will be at desired levels in 2011.
Respondent 5: My judgments and assumptions are largely consistent with the Greenbook.
Respondent 6: N/A
Respondent 7: By 2011 real GDP is growing at its trend pace of 2.7 percent as the current housing sector troubles and financial market stresses are well behind us. The unemployment rate is at its natural rate of 5 percent and inflation has settled at my long-term goal of 1.7 percent.
Respondent 8: Potential GDP growth is 2.5 percent. The NAIRU is 4.75 percent. Desired core PCE inflation is 2 percent. The federal funds rate is kept near zero over the forecast horizon. Despite this stance of monetary policy, by the end of 2011 inflation remains lower than the desired target and the unemployment rate is still substantially above the NAIRU. While the enactment of a new fiscal stimulus package is likely, it has not been factored into the projection.
Respondent 9: Growth at its steady state value and inflation at target, but unemployment still adjusting to its steady state value.
Respondent 10: Trend real GDP growth is around 2.7 percent, and growth is likely to be above trend as ”slack” gradually diminishes. The expected value of PCE inflation in 2001, conditional on current information, under an appropriate monetary policy is 1.5 percent.
Respondent 11:
Authorized for Public Release – 22 of 32

SEP: Compilation and Summary of Individual Economic Projections October 28–29, 2008
The economy will be in the process of recovering from the recession of 2008-2009. Thus, 2011 should be characterized by substantial growth and low inflation.
Respondent 12: We assume that inflation and inflation expectations will be in a range broadly consistent with price stability. However, we expect the level of output to still be below potential. Thus, appropriate policy will maintain a modest degree of accommodation in order to close this gap over coming years.
Respondent 13: We assume that long-term inflation expectations are between 2-2.5% on a CPI basis and the FOMC’s inflation objective to be 1.5-2.0% for the PCE deflator and 2-2.5% for the CPI. Potential growth is 2.7% (we now expect some further delay in the retirement of baby boomers relative to earlier generations), and that the output gap opens in 2008 and narrows in 2010-11. Our extended forecast also includes some implicit judgments about the likely ranges for the NAIRU and the neutral policy rate. Those judgments put the neutral policy rate in the region of 3.75% to 4.75% absent the current disruptions in financial markets and the NAIRU between 4.5% to 5%.
Respondent 14: Given how far we are from equilibrium, final year pro jections do not show steady state values. Growth is above potential but unemployment is above the natural rate, reflecting early stage of expansion. Inflation is a bit below my preferred range, reflecting lagged effects of weak economy.
Respondent 15: Year-over-year growth does not return to trend of 2.5 percent until 2011. This results in relatively high unemployment for some time. The sectoral reallo cations reflected in this forecast also results in a somewhat higher level for the long-run natural unemployment.rate. PCE inflation is assumed to be stable at 1.8 percent in 2011.
Respondent 16: Key to the pace of recovery will be the degree of thawing of credit and the tempo for the beginning of a resumption of confidence.
Respondent 17: Credit markets normalize during 4q 2008, limiting harm to real economy and employment in 2009 and beyond
Authorized for Public Release – 23 of 32

SEP: Compilation and Summary of Individual Economic Projections October 28–29, 2008
Forecast Narratives (continued) 4(c). Please describe any important differences between your current economic
forecast and the Greenbook
Respondent 1: While broadly similar to the Greenbook in the near-term, my forecast differs in the out-years. I see a costly sectoral reallo cation temporarily dampening potential GDP growth, leading to less slack than in the Green-book projection. Therefore, output growth, in my forecast, follows a slightly lower growth path out of the near-term recession, while my path for inflation remains higher than the Greenbook’s near the end of the projection.
Respondent 2: The broad contours of my forecast are similar to the Greenbooks. The most important differences are that I assume a new fiscal stimulus package will boost growth somewhat in 2009 and that the recovery in 2010 and beyond will be somewhat more rapid than projected in the Greenbook.
Respondent 3: I assumed fiscal stimulus similar to the first fiscal alt sim.
Respondent 4: Compared to my forecast, Greenbook’s decline in real GDP is both deeper and more prolonged; I expect real GDP growth to be stronger than Greenbook in 2009 and 2010. In particular, I expect real GDP growth will be above trend in 2010 whereas Greenbook expects growth will be below trend. I also expect growth to be lower in 2011 than Greenbook.
While I also expect overall and core PCE inflation to moderate in 2009 and beyond, I do not expect as large a drop-off in inflation as does Greenbook. I believe the extent and impact of slack in the economy to be smaller than does Greenbook. In addition, in my view, long-term inflation expectations of two percent or more are unlikely to allow inflation to fall as low as in Greenbook.
Respondent 5: N/A
Respondent 6: N/A
Respondent 7: I do not believe the economy will be as weak in 2009 as is predicted by the Greenbook nor do I believe that as large of an output gap will open up. The economy rebounds to trend growth in 2009H2. Consistent with this growth forecast, my path for the funds rate is considerably less accommodative than in the Greenbook baseline. I expect the Committee will need to begin bringing the funds rate up in 2009H2 and that the funds rate will need to be at its long-term equilibrium level of 4.25 percent by the end of 2010.
Respondent 8: In our forecast, inflation is more responsive to the unemployment rate gap than in the Greenbook.
Respondent 9: I have a somewhat sharper near-term deterioration and a more rapid rebound in 2009 and beyond.
Respondent 10: I do not forecast as rapid a decline in inflation as the Greenbook, and I believe negative real GDP growth will end sooner.
Authorized for Public Release – 24 of 32

SEP: Compilation and Summary of Individual Economic Projections October 28–29, 2008
Respondent 11: There appear to be two differences of note. 1) I expect a resumption of relatively rapid growth earlier (second quarter 2010) than the Greenbook. And the Greenbook has lower core inflation in 2010 and 2011, presumably because it gives greater weight to NAIRU or other measures of slack.
Respondent 12: We assume that the financial stress will be relieved somewhat sooner than in the Greenbook. Our monetary policy assumptions also differ as noted above. In addition, we assume the enactment of some fiscal stimulus that will boost growth in 2009.
Respondent 13: We pro ject slightly higher trend growth of hours worked mainly because we assume that the secular decline in the labor force participation rate will occur later and more slowly than in the GB. In terms of difference for the outlook in 2009 this implies we project a higher peak to the unemployment rate than the GB as the labor force participation rate does not decline as sharply as in the GB. We assume lower inflation persistence than does the GB. Thus, for our longer-term inflation outlook we pro ject inflation within the ”mandateconsistent” range in 2010-11.
Respondent 14: Qualitatively similar.
Respondent 15: The near term economic outlook is more negative and the recovery more protracted than in the Greenbook baseline - similar to the ”more financial fallout” alternative. The impact of the weakness on inflation is less than assumed in the Greenbook baseline because of costly sectoral reallocation that temporarily lowers potential growth.
Respondent 16: My forecast incorp orates a somewhat sharper downturn than does the Greenbook baseline, and a slower recovery. I am projecting little growth in real consumer spending over the next two years, whereas the Greenbook predicts significant growth by 2010.
Respondent 17: N/A
Authorized for Public Release – 25 of 32
SEP: Compilation and Summary of Individual Economic Projections October 28–29, 2008
Forecast Narratives (continued) 4(d). Please describe the key factors causing your forecast to change since the
previous quarter’s pro jections.
Respondent 1: The deterioration in credit markets along with incoming data has led me to dramatically revise down my forecast. Notably, I am assuming that credit factors will cause BFI to contract sharply through 2009. Also, recent data in the housing market has caused me to further lower my path for housing starts. Given the international nature of the credit crisis, along with incoming data and anecdotal reports, I have also revised down my pro jection for foreign sector growth. Inflation responds to a further decrease in energy and commodity prices, and a widening output gap. However, the breadth of that gap is tempered by a sectoral reallo cation that temporarily dampens potential output and offsets some of the disinflationary effects of the gap.
Respondent 2: Recent economic data, both for the U.S. and foreign economies, have been much worse than expected and the global financial crisis has intensified. This has caused me to lower my forecast for economic activity. The fall in oil and other commodity prices, the appreciation of the exchange value of the dollar, and the increase in the forecast for labor market slack has caused me to lower my forecast for inflation.
Respondent 3: Weaker-than-expected incoming data on activity along with the unanticipated sharp intensification of financial stress and associated tightening of financial conditions caused a substantial write down in the path of projected economic activity. A much wider output gap, decline in energy prices, strengthening of the dollar, and decrease in forecasts of foreign inflation led to a decrease in projected inflation.
Respondent 4: Incoming data has been weaker than expected, partly due to an intensification of financial turmoil, heightened problems with credit availability, and greater caution on the part of consumers and businesses. Inflation data have been better than expected partly due to sharp declines in energy prices. As a result, I have revised down my forecasts for GDP growth and near-term inflation.
Respondent 5: The significant deterioration in the functioning of credit markets, the large decline in sto ck market wealth around the world, the sharp decline in economic activity worldwide have led me to reduce substantially my growth forecasts and the uncertainty around them. The sharp decline in commodity prices and significantly reduced resource pressures globally have led to a substantial reduction in my near term total PCE forecast.
Respondent 6: N/A
Respondent 7: The key factors that have caused me to revise down my forecast are the generally weaker-than-expected data that have been coming in over the last few months, the heightened level of stress in financial markets, and a downward revision to my forecast for growth abroad.
Respondent 8: Economic and financial conditions have deteriorated dramatically since June.
Respondent 9: Substantially weaker economic data through the summer, plus intensified financial market turmoil.
Authorized for Public Release – 26 of 32

SEP: Compilation and Summary of Individual Economic Projections October 28–29, 2008
Respondent 10: Unfavorable data on real activity, including consumer spending, personal income, employment and new home sales, have led me to believe that this time period will be designated a recession. Growth and inflation are likely to be lower than I anticipated in the last projections, and the federal funds rate will be lower as well.
Respondent 11: This could take a monograph, if not a book. For the sake of brevity: financial strains have intensified; negatives identified last quarter have in fact contributed to contraction in the economy over the second half of this year and into next; and the downside risk to consumer spending in fact materialized.
Respondent 12: The disruptions to the financial system have become much more intense and widespread than we had anticipated. In addition, household wealth has fallen significantly, and growth in the rest of the world has slowed. A recessionary psychology appears to have taken hold of households and businesses. On the plus side, energy and other commodity prices have come down dramatically.
Respondent 13: In June we judged it likely that the US economy would just skirt a recession. June data releases supported this assessment but recent data on employment, consumption, manufacturing and business and consumer confidence has produced a large revision in our forecast. The intensification of financial turmoil and large declines in household net worth have put further downward pressure on the outlook for real activity. We view the decline in energy and other commodity prices as primarily a result of lowered expectations for global growth, partially offsetting the net boost to real disposable income.
Core inflation data surprised to the upside relative to our June forecast for three months in a row with some evidence of a broad-based increase in inflation. Many of our coincident measures of underlying inflation moved up to uncomfortably high levels in August. With the low reading of core CPI inflation in September, recent appreciation of the dollar, large declines in energy and other commodity prices and increasing slack in the labor market, we are placing less weight on the apparently lagging signals from most measures of underlying inflation.
The downside risks to our central scenario pro jection have increased dramatically since June. The main source of this increase has been the combination of intensified financial market stress with the weakening in the real economy.
In June the policy assumption underlying our central pro jection was a relatively quick renormalization of the policy rate in 2009-10. The large change in our forecast for real activity and decline in inflation pressures has produce a big downward shift in our policy assumption.
Respondent 14: Incoming data on consumption in particular, intensification of financial crisis, global reach of crisis, and evidence of sharp slowdown in recent weeks.
Respondent 15: Economic and financial developments have been substantially weaker than expected.
Respondent 16: The ongoing credit and overall financial-market turmoil, exacerbated by unintended consequences of the Freddie/Fannie and Lehman failures, has shifted the economic growth outlook downward, has vaporized short-term inflationary pressures, and increased overall uncertainty.
Respondent 17:
Authorized for Public Release – 27 of 32

SEP: Compilation and Summary of Individual Economic Projections October 28–29, 2008
Significantly increased financial market turmoil
Authorized for Public Release – 28 of 32
OctoberGreenbook
JuneGreenbook
OctoberGreenbook
JuneGreenbook
OctoberGreenbook
JuneGreenbook
OctoberGreenbook
2
4
6
8
10
12
14
16
Number of participants
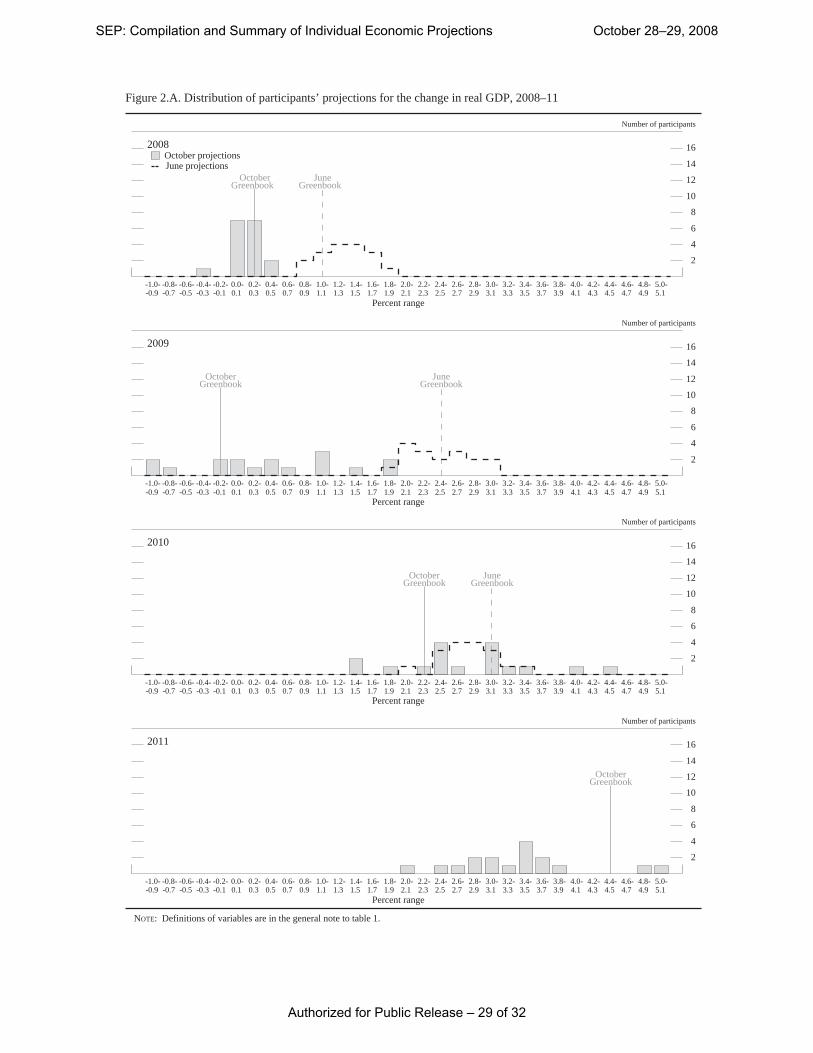
Figure 2.A. Distribution of participants’ projections for the change in real GDP, 2008–11
2008
June projections
-1.0--0.9
-0.8--0.7
-0.6--0.5
-0.4--0.3
-0.2--0.1
0.0-0.1
0.2-0.3
0.4-0.5
0.6-0.7
0.8-0.9
1.0-1.1
1.2-1.3
1.4-1.5
1.6-1.7
1.8-1.9
2.0-2.1
2.2-2.3
2.4-2.5
2.6-2.7
2.8-2.9
3.0-3.1
3.2-3.3
3.4-3.5
3.6-3.7
3.8-3.9
4.0-4.1
4.2-4.3
4.4-4.5
4.6-4.7
4.8-4.9
5.0-5.1
Percent range
October projections
2
4
6
8
10
12
14
16
Number of participants
2009
-1.0--0.9
-0.8--0.7
-0.6--0.5
-0.4--0.3
-0.2--0.1
0.0-0.1
0.2-0.3
0.4-0.5
0.6-0.7
0.8-0.9
1.0-1.1
1.2-1.3
1.4-1.5
1.6-1.7
1.8-1.9
2.0-2.1
2.2-2.3
2.4-2.5
2.6-2.7
2.8-2.9
3.0-3.1
3.2-3.3
3.4-3.5
3.6-3.7
3.8-3.9
4.0-4.1
4.2-4.3
4.4-4.5
4.6-4.7
4.8-4.9
5.0-5.1
Percent range
2
4
6
8
10
12
14
16
Number of participants
2010
-1.0--0.9
-0.8--0.7
-0.6--0.5
-0.4--0.3
-0.2--0.1
0.0-0.1
0.2-0.3
0.4-0.5
0.6-0.7
0.8-0.9
1.0-1.1
1.2-1.3
1.4-1.5
1.6-1.7
1.8-1.9
2.0-2.1
2.2-2.3
2.4-2.5
2.6-2.7
2.8-2.9
3.0-3.1
3.2-3.3
3.4-3.5
3.6-3.7
3.8-3.9
4.0-4.1
4.2-4.3
4.4-4.5
4.6-4.7
4.8-4.9
5.0-5.1
Percent range
2
4
6
8
10
12
14
16
Number of participants
2011
-1.0--0.9
-0.8--0.7
-0.6--0.5
-0.4--0.3
-0.2--0.1
0.0-0.1
0.2-0.3
0.4-0.5
0.6-0.7
0.8-0.9
1.0-1.1
1.2-1.3
1.4-1.5
1.6-1.7
1.8-1.9
2.0-2.1
2.2-2.3
2.4-2.5
2.6-2.7
2.8-2.9
3.0-3.1
3.2-3.3
3.4-3.5
3.6-3.7
3.8-3.9
4.0-4.1
4.2-4.3
4.4-4.5
4.6-4.7
4.8-4.9
5.0-5.1
Percent range
NOTE: Definitions of variables are in the general note to table 1.
SEP: Compilation and Summary of Individual Economic Projections October 28–29, 2008
Authorized for Public Release – 29 of 32

OctoberGreenbook
JuneGreenbook
OctoberGreenbook
JuneGreenbook
OctoberGreenbook
JuneGreenbook
OctoberGreenbook
2
4
6
8
10
12
14
16
Number of participants
Figure 2.B. Distribution of participants’ projections for the unemployment rate, 2008–11
2008
June projections
4.8-4.9
5.0-5.1
5.2-5.3
5.4-5.5
5.6-5.7
5.8-5.9
6.0-6.1
6.2-6.3
6.4-6.5
6.6-6.7
6.8-6.9
7.0-7.1
7.2-7.3
7.4-7.5
7.6-7.7
7.8-7.9
8.0-8.1
Percent range
October projections
2
4
6
8
10
12
14
16
Number of participants
2009
4.8-4.9
5.0-5.1
5.2-5.3
5.4-5.5
5.6-5.7
5.8-5.9
6.0-6.1
6.2-6.3
6.4-6.5
6.6-6.7
6.8-6.9
7.0-7.1
7.2-7.3
7.4-7.5
7.6-7.7
7.8-7.9
8.0-8.1
Percent range
2
4
6
8
10
12
14
16
Number of participants
2010
4.8-4.9
5.0-5.1
5.2-5.3
5.4-5.5
5.6-5.7
5.8-5.9
6.0-6.1
6.2-6.3
6.4-6.5
6.6-6.7
6.8-6.9
7.0-7.1
7.2-7.3
7.4-7.5
7.6-7.7
7.8-7.9
8.0-8.1
Percent range
2
4
6
8
10
12
14
16
Number of participants
2011
4.8-4.9
5.0-5.1
5.2-5.3
5.4-5.5
5.6-5.7
5.8-5.9
6.0-6.1
6.2-6.3
6.4-6.5
6.6-6.7
6.8-6.9
7.0-7.1
7.2-7.3
7.4-7.5
7.6-7.7
7.8-7.9
8.0-8.1
Percent range
NOTE: Definitions of variables are in the general note to table 1.
SEP: Compilation and Summary of Individual Economic Projections October 28–29, 2008
Authorized for Public Release – 30 of 32
OctoberGreenbook
JuneGreenbook
OctoberGreenbook
JuneGreenbook
OctoberGreenbook
JuneGreenbook
OctoberGreenbook
2
4
6
8
10
12
14
16
Number of participants
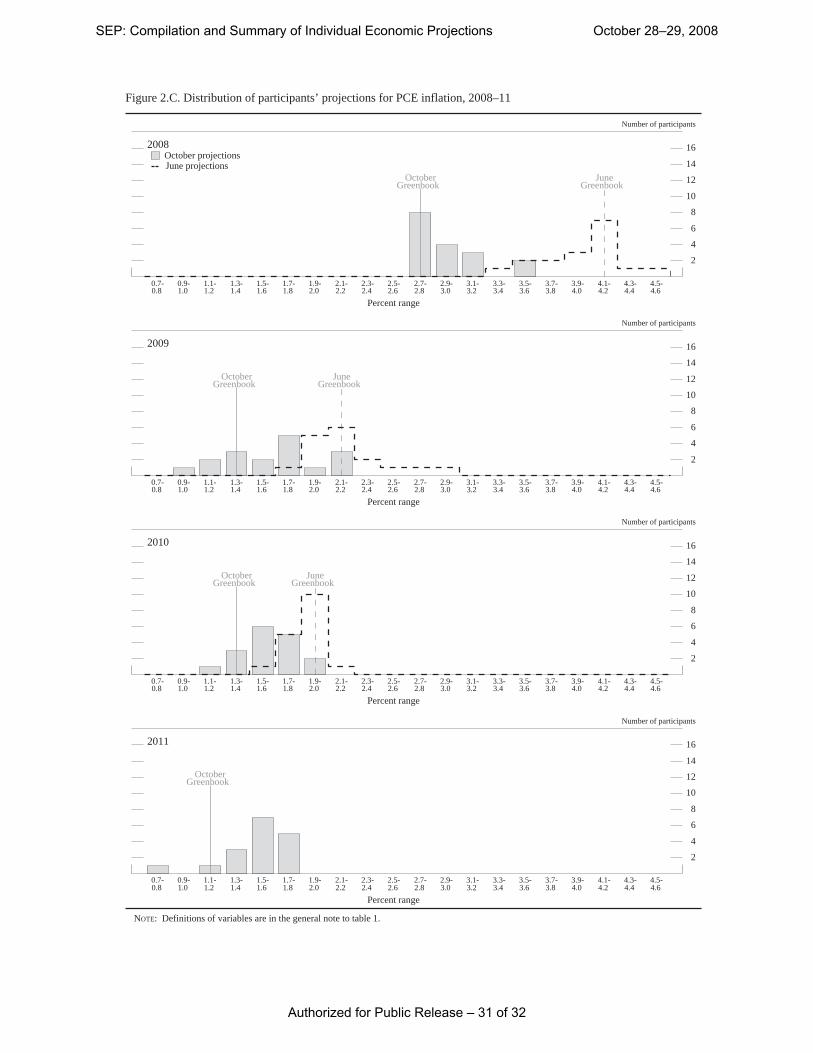
Figure 2.C. Distribution of participants’ projections for PCE inflation, 2008–11
2008
June projections
0.7-0.8
0.9-1.0
1.1-1.2
1.3-1.4
1.5-1.6
1.7-1.8
1.9-2.0
2.1-2.2
2.3-2.4
2.5-2.6
2.7-2.8
2.9-3.0
3.1-3.2
3.3-3.4
3.5-3.6
3.7-3.8
3.9-4.0
4.1-4.2
4.3-4.4
4.5-4.6
Percent range
October projections
2
4
6
8
10
12
14
16
Number of participants
2009
0.7-0.8
0.9-1.0
1.1-1.2
1.3-1.4
1.5-1.6
1.7-1.8
1.9-2.0
2.1-2.2
2.3-2.4
2.5-2.6
2.7-2.8
2.9-3.0
3.1-3.2
3.3-3.4
3.5-3.6
3.7-3.8
3.9-4.0
4.1-4.2
4.3-4.4
4.5-4.6
Percent range
2
4
6
8
10
12
14
16
Number of participants
2010
0.7-0.8
0.9-1.0
1.1-1.2
1.3-1.4
1.5-1.6
1.7-1.8
1.9-2.0
2.1-2.2
2.3-2.4
2.5-2.6
2.7-2.8
2.9-3.0
3.1-3.2
3.3-3.4
3.5-3.6
3.7-3.8
3.9-4.0
4.1-4.2
4.3-4.4
4.5-4.6
Percent range
2
4
6
8
10
12
14
16
Number of participants
2011
0.7-0.8
0.9-1.0
1.1-1.2
1.3-1.4
1.5-1.6
1.7-1.8
1.9-2.0
2.1-2.2
2.3-2.4
2.5-2.6
2.7-2.8
2.9-3.0
3.1-3.2
3.3-3.4
3.5-3.6
3.7-3.8
3.9-4.0
4.1-4.2
4.3-4.4
4.5-4.6
Percent range
NOTE: Definitions of variables are in the general note to table 1.
SEP: Compilation and Summary of Individual Economic Projections October 28–29, 2008
Authorized for Public Release – 31 of 32

October and JuneGreenbook
OctoberGreenbook
JuneGreenbook
OctoberGreenbook
JuneGreenbook
OctoberGreenbook
2
4
6
8
10
12
14
16
Number of participants
Figure 2.D. Distribution of participants’ projections for core PCE inflation, 2008–11
2008
June projections
0.7-0.8
0.9-1.0
1.1-1.2
1.3-1.4
1.5-1.6
1.7-1.8
1.9-2.0
2.1-2.2
2.3-2.4
2.5-2.6
Percent range
October projections
2
4
6
8
10
12
14
16
Number of participants
2009
0.7-0.8
0.9-1.0
1.1-1.2
1.3-1.4
1.5-1.6
1.7-1.8
1.9-2.0
2.1-2.2
2.3-2.4
2.5-2.6
Percent range
2
4
6
8
10
12
14
16
Number of participants
2010
0.7-0.8
0.9-1.0
1.1-1.2
1.3-1.4
1.5-1.6
1.7-1.8
1.9-2.0
2.1-2.2
2.3-2.4
2.5-2.6
Percent range
2
4
6
8
10
12
14
16
Number of participants
2011
0.7-0.8
0.9-1.0
1.1-1.2
1.3-1.4
1.5-1.6
1.7-1.8
1.9-2.0
2.1-2.2
2.3-2.4
2.5-2.6
Percent range
NOTE: Definitions of variables are in the general note to table 1.
SEP: Compilation and Summary of Individual Economic Projections October 28–29, 2008
Authorized for Public Release – 32 of 32