fomc20090624_accessible.pdf
TRANSCRIPT

Accessible Version
Meeting of the Federal Open Market CommitteeJune 23-24, 2009 Presentation Materials
Presentation Materials (PDF)
Pages 202 to 261 of the Transcript
Appendix 1: Materials used by Mr. Sack
Class II FOMC - Restricted FR
Page 1
Top panel(1)Title: Treasury YieldsSeries: Yields for the 2-Year, 5-Year, 10-Year, and 30-Year Treasury NotesHorizon: August 1, 2007 - June 19, 2009Description: Treasury yields rise following the April FOMC meeting.
Apr 29: FOMC
Source: Bloomberg
Middle-left panel(2)Title: Policy Expectations Implied by Futures RatesSeries: December 2009 Fed Funds implied rate, December 2010 Eurodollar rate implied by contract less 15-day moving average of forward Libor-Fed Funds Basis SwapHorizon: August 1, 2008 - June 19, 2009Description: December 2009 rate nearly remains constant, while December 2010 rate increases.
Source: Bloomberg
Middle-right panel(3)Title: Treasury Yield CurveSeries: Yields for the 1-Year, 2-Year, 3-Year, 5-Year, 7-Year, and 10-Year Treasury securitiesHorizon: April 28, 2009 and June 19, 2009Description: Treasury yield curve shifts upward ahead in June.
Source: Bloomberg
Bottom panel(4)

Title: Factors Driving 10-Year Yield Change Over Intermeeting PeriodSeries: Aggregated Primary Dealer responses indicating importance of various factors in the 10-Year YieldHorizon: As of June 17, 2009Description: Primary Dealers indicate importance of varying factors in the change of the 10-Year Yield.
Factors with average level of importance from "Important" down to "Somewhat important": Improved economic outlook, Reduction in downside inflation risk, Increase in Treasury supply, Mortgage convexity hedging, Increase in upside inflation risk.
Source: Dealer Policy Survey
Page 2
Top-left panel(5)Title: Large-Scale Asset Purchase ProgramsSeries: Cumulative and expected totals for the Agency-MBS, Agency, and Treasury purchase programsHorizon: December 2008 - December 2009Description: Cumulative and expected totals for the Agency-MBS, Agency, and Treasury purchase programs.
Source: Federal Reserve Bank of New York
Top-right panel(6) Large-Scale Asset Purchase ProgramsAs of June 19
Treasury Agency Agency-MBS
Purchases to Date 170 90 577
Announced Limit 300 200 1250
Dealer Survey*:
2009 Q4 363 200 1200
2010 Q2 363 200 1250
* Median response Return to table
Source: Dealer Survey
Middle panel(7)Title: Supply of Treasury DebtSeries: SOMA Treasury Holdings, Other Treasury Securities Outstanding, and SOMA as a Percent of TotalHorizon: January 2007 - June 2009Description: Supply of Treasury debt increases while SOMA as a percent of total decreases.
Source: Federal Reserve Bank of New York
Bottom panel(8)Title: Mortgage and Treasury RatesSeries: Fannie Mae 30-Year Current Coupon, Blended 5-and 10-Year Treasury yield, Fannie Mae Option Adjusted Spread to TreasuryHorizon: June 1, 2008 - June 19, 2009Description: Rates increase after March 18 MBS program expansion.

Nov 25: Program Announcement; Jan 5: First MBS Purchase; Mar 18: Program Expansion
Source: Bloomberg, JP Morgan Chase
Page 3
Top panel(9)Title: Breakeven Inflation RatesSeries: 5-Year Spot Breakeven Rate and 5-Year, 5-Year Forward Breakeven RateHorizon: August 1, 2007 - June 19, 2009Description: Breakeven inflation rates increase.
Source: Barclays
Middle panel(10)Title: Probability Distribution of CPI Inflation Rate in 2014-2019Series: Primary Dealer estimates for March, April, and June distributions of CPI ratesHorizon: 2014 - 2019Description: Primary Dealer estimates for March, April, and June distributions of CPI rates
Estimated probability of 2.0-2.5% and 2.5-3.0% increased with each estimate. For June, 2.0-2.5% shows greatest probability at about 35%, and 2.5-3.0% shows second-greatest probability at about 25%.
Source: Dealer Policy Survey
Bottom panel(11)Title: Yield Curve SlopeSeries: 10-Year Treasury Note Yield less Fed Funds rate, and NBER Recession PeriodsHorizon: January 1, 1982 - June 19, 2009Description: 10-Year Treasury yield spread to Fed Funds rate widens.
Shaded bars indicate periods of business recession as defined by the National Bureau of Economic Research (NBER): July 1981-November 1982, July 1990-March 1991, March 2001-November 2001, and December 2007-present (June 2009).
Source: Bloomberg
Page 4
Top panel(12)Title: Corporate Debt SpreadsSeries: High Yield and Investment Grade corporate debt spreadsHorizon: June 1, 2008 - June 19, 2009Description: Corporate debt spreads narrow.
Source: Bank of America
Middle panel(13)

Title: Equity PricesSeries: Standard & Poor's 500 Index and its implied skew based on 90-day 25 delta put minus callHorizon: June 1, 2008 - June 19, 2009Description: Equity prices increase moderately and skew decreases moderately.
Source: Optionmetrics
Bottom panel(14)Title: US Trade-Weighted DollarSeries: US Trade-Weighted DollarHorizon: June 1, 2008 - June 19, 2009Description: The US trade-weighted dollar declines.
Source: Bloomberg
Page 5
Top panel(15)Title: Equity Indices for Financial FirmsSeries: Supervisory Capital Assessment Program Banks Index and the Standard & Poor's 500 IndexHorizon: December 31, 2008 - June 19, 2009Description: SCAP Banks Index increase greater than S&P 500 Index increase.
Feb 25: SCAP announced; Apr 24: SCAP white paper published; May 7: SCAP results
Source: Bloomberg
Middle panel(16)Title: SCAP CapitalSeries: Supervisory Capital Assessment Program banks' Capital Raised and Capital RequiredHorizon: January 29, 2009 - June 19, 2009Description: Supervisory Capital Assessment Program banks' capital raised and capital required.
Source: Federal Reserve Bank of New York Staff Estimates
Bottom panel(17)Title: US Libor-OIS SpreadsSeries: 3-Month USD Libor less Overnight Indexed Swap and 12-Month USD Libor less Overnight Indexed SwapHorizon: January 1, 2007 - June 19, 2009Description: Swap spreads narrow.
Source: Bloomberg
Page 6
Top panel(18)
Title: Federal Reserve Short-Term Liquidity FacilitiesSeries: Levels of the Primary Credit Facility, Primary Dealer Credit Facility, Asset-Backed Commercial Paper Money Market Mutual Fund Liquidity Facility, Commercial Paper Funding Facility, Central Bank Liquidity Swaps, and Term Auction FacilityHorizon: August 1, 2008 - June 17, 2009Description: Short-term facility assets continue to contract.
Source: Federal Reserve Bank of New York
Middle panel(19)Title: ABS IssuanceSeries: Asset-Backed Security Term Asset-Backed Loan Facility Eligible and Non-Eligible IssuanceHorizon: Q1 2007 - Q2 2009 as of June 10, 2009Description: ABS issuance increases greatly after TALF subscriptions begin.
Source: Federal Reserve Bank of New York, JP Morgan Chase
Bottom panel(20)Title: AAA-Rated Asset-Backed SpreadsSeries: 3-Year Prime Auto, 3-Year Credit Card, and CMBS Super Senior spreadsHorizon: January 1, 2008 - June 19, 2009Description: Asset-backed spreads narrow after TALF subscriptions begin.
Sep 14: Lehman bankruptcy; Nov 25: TALF announced; Mar 19: First TALF Subscription
Source: JPMorgan Chase
Page 7
Top panel(21)Title: Balance Sheet Assets by CategorySeries: Federal Reserve balance sheet assets categorized by All Other, Lending to Systemically Important Institutions, Short-Term Liquidity Facilities, Large-Scale Asset Purchases, and Legacy TreasuriesHorizon: August 1, 2008 - June 17, 2009Description: Short-term liquidity facility assets decline while large-scale asset purchases increase.
Source: Federal Reserve Bank of New York
Appendix 2: Materials used by Mr. Carpenter
Material for FOMC Briefing on Projections of the Balance Sheet, the Monetary Base, and Federal Reserve IncomeSeth CarpenterJune 23, 2009
Class I FOMC - Restricted Controlled (FR)

Exhibit 1: Individual Balance Sheet Item Profiles
Asset Purchases and Federal Reserve Liquidity and Credit FacilitiesTwelve line charts, each showing a date range from 39783 (December 2008, expressed as an integer in days from the beginning of the twentieth century) through 42705 (December 2016). Except as noted, each chart shows two curves, "Current" and "April" projections.
• Temporary holdings of longer-term Treasuries are depicted to increase from zero at the end of 2008 to a late-2009 peak in each of four projections: "baseline," "expanded purchases," "April baseline," and "April expanded purchases." Each of the baseline scenarios peaks at approximately $300 billion and decreases to a level around $50 billion by the end of 2016. The expanded scenarios peak around $750 billion and decrease to approximately $100 billion and $150 billion under the April and current projections, respectively.
• Agency debt is depicted to increase from its December 2008 level of $20 billion to a peak of $200 billion in early 2009, and then decrease to approximately $25 billion at the end of the projection period. In the April projection, agency debt remains at the $200 billion peak through the end of 2011 and then decreases to $25 billion by the end of the projection period, whereas the current projection depicts agency debt beginning to decline immediately following the peak.
• Agency MBS is depicted to increase from zero at the beginning of the period to a peak of just over $1200 billion in early 2009, and then decrease to $600 billion under the April projection and $800 billion under the current projection.
• Primary and secondary credit facilities decrease from over $90 billion in December 2008 to near zero by early 2011 and 2012 in the current and April projections, respectively.
• Term auction facility (TAF) credit decreases from over $400 billion to zero by the end of 2010 and 2011 in the current and April projections, respectively.
• Foreign central bank liquidity swaps are shown to decrease from over $500 billion at the beginning of the projection period to zero by the end of 2010 in both projections. The rate of decrease through 2009 is greater in the current projection than in the April projection.
• Credit extended to AIG is depicted to increase from the December 2008 level of just under $40 billion to approximately $45 billion in early 2009, and then to decrease to zero at the end of 2014 in both projections.
• Current projections for the three Maiden Lane facilities. Maiden Lane III is projected to decrease from over $25 billion to zero by the end of 2012, including a sharp drop of about $7 billion in mid-2009. Maiden Lane and Maiden Lane II are depicted to decrease from over $25 billion and $20 billion, respectively, to zero at the end of 2015.
• Loans extended through the first wave of the Term Asset-Backed Securities Loan Facility (TALF v1.0) are depicted in both projections to increase from zero at the beginning of the projection period to $100 billion at the end of 2009. Under the April projection, TALF v1.0 maintains a $100 billion level through early 2012 and declines to zero by early 2013. The current projection shows TALF v1.0 increasing to $125 billion by early 2010, maintaining that level through mid-2012 and decreasing to zero by early 2014.
• For loans extended through subsequent waves of the TALF (TALF v2.0/3.0), the April projection shows credit outstanding rising from zero to $400 billion at the end of 2010, remaining at that level until early 2011, and falling to zero at the end of 2013. In the current projection, TALF v2.0/3.0 increases from zero to $50 billion at the end of 2010, remains at that level until mid-2014, and declines to zero at the end of 2015.
• Credit extended through the Commercial Paper Funding Facility (CPFF) is depicted to decline from over $300 billion at the beginning of the projection period to zero at the end of 2010 under both the current and April projections. The rate of decrease through 2009 is greater in the current projection than in the April projection.
• Credit extended through the Asset-Backed Commercial Paper Liquidity Facility (AMLF) is depicted in both projections to decrease from the December 2008 level of nearly $25 billion to around $5 billion in mid-2009. The April projection shows a gradual decline to zero at the end of 2010. In the current projection, AMLF spikes to a level over $25 billion in mid-2009, then decreases to a low level in early 2010, and to zero by the end of 2010.
Federal Reserve Liabilities and Capital

Four line charts, each showing a date range from 39783 (December 2008, expressed as an integer in days from the beginning of the twentieth century) through 42705 (December 2016).
• Federal Reserve notes are depicted to increase from their December 2008 level of just under $900 billion to over $1200 billion at the end of the period.
• Current and April projections are shown for the Treasury General Account (TGA) and the Supplementary Financing Program (SFP). The TGA declines from the December 2008 level of just over $100 billion to around $25 billion in early 2009. In the April projection, the TGA peaks in mid-2009 just below $100 billion and declines to $5 billion by the end of 2009. Under the current projection, the TGA peaks at a level over $130 billion in mid-2009, then dips below $25 billion and returns to a level above $100 billion again within a few months. Then, the current projection for the TGA declines to $5 billion by the end of 2009. The SFP drops from its December 2008 level of over $250 billion to $200 billion in mid-2009 in both projections. The level decreases to zero by the end of 2009 in the April projection, and by mid-2010 under the current projection.
• Capital is depicted to remain at a level of just over $40 billion through the entire period under the April projection, and to increase smoothly to a level of $129 billion at the end of the period under the current projection.
• Reserve balances are depicted under baseline and expanded purchases scenarios from the current and the April projections. In both of the April scenarios, reserve balances increase from their December 2008 level of around $750 billion to peak in late 2009 at nearly $2500 billion and $3000 billion, respectively. Both projections then decrease to approximately $25 billion by the end of 2015. In the current baseline and expanded scenarios, reserve balances peak in late 2009 over $1500 billion and $2000 billion, respectively, and decrease to approximately $25 billion and $100 billion, respectively, by the end of 2016.
*Corrected versions of these charts are available on pages 248-249 of 261.
Exhibit 2: Baseline Balance Sheet ProjectionsThis exhibit provides a graphical description of the assumptions underlying the baseline balance sheet projections.
Top panelFederal Reserve AssetsA line chart presents nine categories of assets: Treasury securities, Agency debt, Agency MBS, Repurchase agreements, TAF, Central bank swaps, TALF, Other loans and facilities, and Other assets. Each is depicted by a different color and the chart stacks the colors so that the share of the total that each asset represents is depicted. The date range for all projections is from 2006 to 2016. Total assets increase from their 2006 level of approximately $800 billion to peak in late 2009 at a level of approximately $2800 billion, and then decline fairly steadily until the end of 2016, ending at a level of approximately $1500 billion.
Bottom panelFederal Reserve Liabilities and CapitalA stacked line chart presents six categories of liabilities and capital: Federal Reserve notes; Reverse repurchase agreements; Deposits, other than reserve balances; Reserve balances; Other liabilities; and Capital. Total liabilities and capital follow the same path as total assets.
Exhibit 3: Expanded Balance Sheet ProjectionsThis exhibit is similar to Exhibit 2, but shows the assumptions underlying the expanded balance sheet projections.
Top panelFederal Reserve Assets

A stacked line chart shows Federal Reserve assets, which in this expanded scenario peak in late 2009 at a level of approximately $3250 billion and decline steadily until the end of 2016, where they are at a level of approximately $1500 billion.
Bottom panelFederal Reserve Liabilities and CapitalA stacked line chart shows Federal Reserve Liabilities and Capital, which follow the same pattern as the expanded scenario for assets.
Exhibit 4Growth Rates for Monetary Base
Date Baseline Expanded Purchases
April Baseline
Percent, annual rate
Monthly
Jun-09 -52.1 -52.1 60.2
Jul-09 -0.4 -0.4 131.9
Aug-09 99.3 99.3 133.9
Sep-09 97.3 97.3 120.5
Oct-09 103.1 148.3 98.1
Nov-09 95.7 173.1 79.9
Dec-09 102.1 163.8 71.1
Quarterly
Q2 2009 24.9 24.9 38.4
Q3 2009 22.7 22.7 111.9
Q4 2009 108.2 157.0 107.3
Q1 2010 48.0 78.6 26.2
Q2 2010 -7.1 -6.7 -17.2
Q3 2010 -15.6 -14.0 -17.9
Q4 2010 -19.0 -16.9 -18.8
Annual - period average
2009 92.5 98.2 120.3
2010 32.5 51.3 34.4
2011 -11.1 -10.0 -14.1
2012 -9.0 -10.0 -14.4
2013 -12.4 -14.2 -25.0
2014 -9.3 -11.2 -19.7
2015 -9.2 -10.3 -14.8
2016 -7.7 -10.2 2.3
Note: Not seasonally adjusted

Exhibit 5Projected Federal Reserve Net IncomeThis exhibit has six line charts to describe three projections ("baseline," "market based," and "high interest rate"), each over a date range from 2008 to 2016. The three left-hand panels present net income and total expenses, each in a different color. These items are stacked and sum to show gross income. The right-hand panels show remittance and dividends, transfers, etc. in different colors. These items are stacked and sum to show net income.
Top-left panelBaselineIn the baseline scenario, gross income is depicted to increase from its 2008 level of approximately $50 billion to peak in 2010 at nearly $90 billion and decline gradually through the end of the period to approximately $60 billion.
Top-right panelBaselineBaseline net income is depicted to increase from its December 2008 level of approximately $40 billion to peak in 2010 at approximately $80 billion, decrease through 2013 to approximately $45 billion, and then increase from 2014 through the end of the projection period to just over $50 billion.
Middle-left panelMarket basedIn the market based scenario, gross income peaks in 2010 around $90 billion and decreases gradually through the end of the period, ending at a level of approximately $70 billion.
Middle-right panelMarket basedNet income is depicted to peak in 2010 at approximately $70 billion, decrease until 2012 to approximately $40 billion and then increase through the end of the projection period to approximately $60 billion.
Bottom-left panelHigh interest rateIn the high interest rate scenario, gross income peaks in 2010 at around $110 billion and declines gradually through the end of the projection period to a level of about $80 billion.
Bottom-right panelHigh interest rateNet income is depicted declining sharply from approximately $45 billion in 2009 to a level of approximately negative $5 billion in 2011, then increasing gradually through the end of the period to about $50 billion.
Exhibit 6Projected Mark-to-Market Losses on the SOMA Portfolio
Top panel

A line chart plots the same three scenarios that are used in Exhibit 5 from 2009 to 2016. The baseline scenario shows gains of as much as $50 billion on the portfolio through 2013, and then losses increasing through 2016 to just over $50 billion. In the market based scenario, losses increase from zero in 2009 to approximately $125 billion in 2013, and remain at that level through 2016. The high interest rate scenario depicts losses in 2009 of about $100 billion, increasing to a loss in 2011 of more than $250 billion, and then decreasing to a loss of less than $200 billion in 2016.
Appendix 3: Materials used by Mr. English
Material for FOMC Briefing on Possible Effects of Very High Reserve Balances on Bank Balance SheetsBill EnglishJune 23, 2009
Class II FOMC - Restricted (FR)
Exhibit 1Reserve Balances and Regulatory Leverage Ratios
Top-left panelReserve balances of depository institutionsData plotted as curves. Reserve balances of depository institutions rises from about $40 billion in 2008:Q3 to about $800 billion in 2009:Q2. Thereafter, the data are projected. Under the Bluebook baseline scenario, reserve balances of depository institutions rise to a peak of about $1.7 trillion in 2010:Q1 and then gradually decline, reaching about $1.4 trillion in 2010:Q4. Under the Bluebook alternative scenario, reserve balances of depository institutions increase to a peak of about $2.1 trillion in 2010:Q1 and then gradually decline, reaching about $1.8 trillion in 2010:Q4.
Note. The data are quarterly averages in billions of dollars.
Source. Federal Reserve and staff estimates.
Top-right panelRegulatory leverage ratio• Definition:
\( \frac{Tier 1 capital}{Average total assets} \)• Ratio > 5.0 for a "well capitalized" bank
Leverage Ratio ProjectionsMiddle-left panelProjection assumptions• Reserve balances expand in line with Bluebook scenarios• Other assets unchanged• Tier 1 capital declines
Middle-right panelBaseline resultsBillions of dollars

Actual 2009:Q1
Projected 2010:Q1
Tier 1 capital 836 790
Reserve balances 491 982
Average total assets 10,811 11,302
Leverage ratio (aggregate; percent) 7.73 6.99
Note. Baseline scenario without any capital downstreamed to banks after 2009:Q1. All commercial banks with reserve balances.
Source. Call Reports and staff estimates.
Bottom-left panelAggregate leverage ratio of commercial banks with reserve balancesData plotted as curves. The aggregate leverage ratio of commercial banks with reserve balances moves in a narrow range around 7.5 percent between 1999:Q1 and 2009:Q1. Thereafter, the data are projected one year ahead, for the 2010:Q1 quarter. For the projection under the Bluebook baseline scenario, the aggregate leverage ratio of commercial banks with reserve balances is 6.99 percent in 2010:Q1. For the projection under the Bluebook alternative scenario, the aggregate leverage ratio of commercial banks with reserve balances is 6.83 percent in 2010:Q1. The projections are repeated under the assumption that all capital raised as a result of the SCAP is downstreamed to subsidiary banks. Under this assumption and for the projection under the Bluebook baseline scenario, the aggregate leverage ratio of commercial banks with reserve balances is 7.60 percent in 2010:Q1. Under this assumption and for the projection under the Bluebook alternative scenario, the aggregate leverage ratio of commercial banks with reserve balances is 7.43 percent in 2010:Q1.
Note. The data are quarterly in percent. A shaded bar indicates a period of business recession as defined by the National Bureau of Economic Research (NBER): March 2001-November 2001. A vertical line indicates the NBER Peak in December 2007.
Source. Call Reports and staff estimates.
Bottom-right panelOther results• Broadly similar results for BHCs• Leverage ratios for some individual banks could fall to low levels relative to regulatory norms
• Individual institutions can take steps to reduce unwanted reserves
Exhibit 2Qualitative Information and Policy Options
Top panelInformation from consultations with Federal Reserve System staff• Banking organizations have not expressed material concerns about their reserve balances• Some banks have maintained high levels of reserve balances as a liquidity buffer• Some banks have profited by exploiting the spread between the rate paid on excess reserves and the cost
of borrowing• Banks thought that they could reduce their reserve balances if they chose• Banking organizations have not discussed with System staff the possible effects of increased systemwide
reserves
Bottom-left panelSummary

• Depository institutions should not be significantly adversely affected by the anticipated levels of reserve balances
• No policy response appears necessary at this time• Considerable uncertainty remains• Staff will continue to monitor the impact on depository institutions
Bottom-right panelPolicy options• Option 1: Drain reserves• Option 2: Exclude reserve balances from leverage ratio for all banking institutions• Option 3: Exclude reserve balances from leverage ratio for selected banking institutions• Option 4: Issue supervisory guidance
Appendix 4: Materials used by Messrs. Clouse and Hilton
Material for FOMC Briefing on Reserve Management Tools to Target a Higher Policy RateJim ClouseSpence HiltonJune 23, 2009
Class I FOMC - Restricted-Controlled (FR)
Exhibit 1This exhibit contains three line charts that depict hypothetical demand and supply curves in the reserve market to illustrate the effects of various reserve management tools.
Top panelReserve MarketThe chart displays a hypothetical demand for reserves, with the funds rate on the vertical axis and reserve balances on the horizontal axis. The hypothetical demand curve asymptotes to the level of the rate paid on excess reserves--the so-called IOER rate--at high levels of reserve balances. A second demand curve on the same chart shows what the demand curve might have looked like in the last quarter of 2008. This demand curve drops below the level of the IOER rate at high levels of reserve balances. With this demand curve, a rapid expansion of reserve balances such as that late in 2008 would push the federal funds rate below the IOER rate.
Middle panelDemand Side ToolsThe chart displays the effect of various tools that might be employed to keep the funds rate close to the target rate even with high levels of reserve balances. The tools described in this panel are those that strengthen or shape the demand curve including increases in reserve requirements, a system of voluntary requirements, payment of interest on balances held by the government sponsored enterprises (GSEs), and collateralized funds transactions. The chart shows that these tools would tend to shift the demand curve to the right, or flatten the demand curve at high levels of reserve balances, or both. With a fixed quantity of reserves, these tools should then put upward pressure on the funds rate.

Bottom panelSupply Side ToolsThe chart displays the effects of various tools focused on the supply of reserves. These tools include reverse RPs, term deposits, issuance of so-called "Fed bills," an expanded supplementary finance program, asset sales, or reductions in liquidity programs. In the diagram, all of these tools would shift the supply of reserves to the left and so put upward pressure on the funds rate.
Appendix 5: Materials used by Mr. Madigan
Material for Briefing on Staff Proposal Regarding Liquidity FacilitiesBrian MadiganJune 23, 2009
Class I FOMC - Restricted Controlled (FR)
Staff Proposal for Extension of and Modifications to Various Liquidity Facilities[Note: In the following table, the word "Yes" indicates a checkmark in the original document.]
13(3)i
Extendii Near-term Modification Longer-term Proposal
Depository institution facilities
1. Primary credit NA None Increase spread, eliminate term loans
2. TAF NA 1. Reduce auction amounts to $125 billion2. Optionally, raise minimum bid rate
One small monthly or quarterly auction
3. Foreign currency swaps Yes None Allow to expire on 2/1/10, but study possible longer-term facility
Primary dealer facilities
4. PDCF Yes Yes Increase haircuts for most types of investment-grade and noninvestment-grade collateral
1. Later this year, restrict collateral to investment-grade
2. Allow to expire on 2/1/10
5. TSLF Yes Yes 1. Suspend Schedule 1 auctions2. Offer $75 billion of Schedule 2 monthly3. Terminate TOP auctions
Allow to expire on 2/1/10
Specific market and institution facilities
6. AMLF Yes Yes Require that ABCP pledged as collateral has been purchased from a money fund experiencing material redemptions.
Allow to expire on 2/1/10
7. CPFF Yes Yes None Allow to expire on 2/1/10
8. MMIFF Yes None Allow to expire on 10/30/09
9. TALF Yes None
10. GSE facilityiii NA None Rescind
NA--not applicable.
i Relies on Section13(3) authority. Return to table
ii Extend facility to February 1, 2010. Return to table
iii GSE facility was approved under Section 13(13) of the Federal Reserve Act. Return to table
Appendix 6: Materials used by Messrs. Kiley and Sheets
Class II FOMC - Restricted (FR)
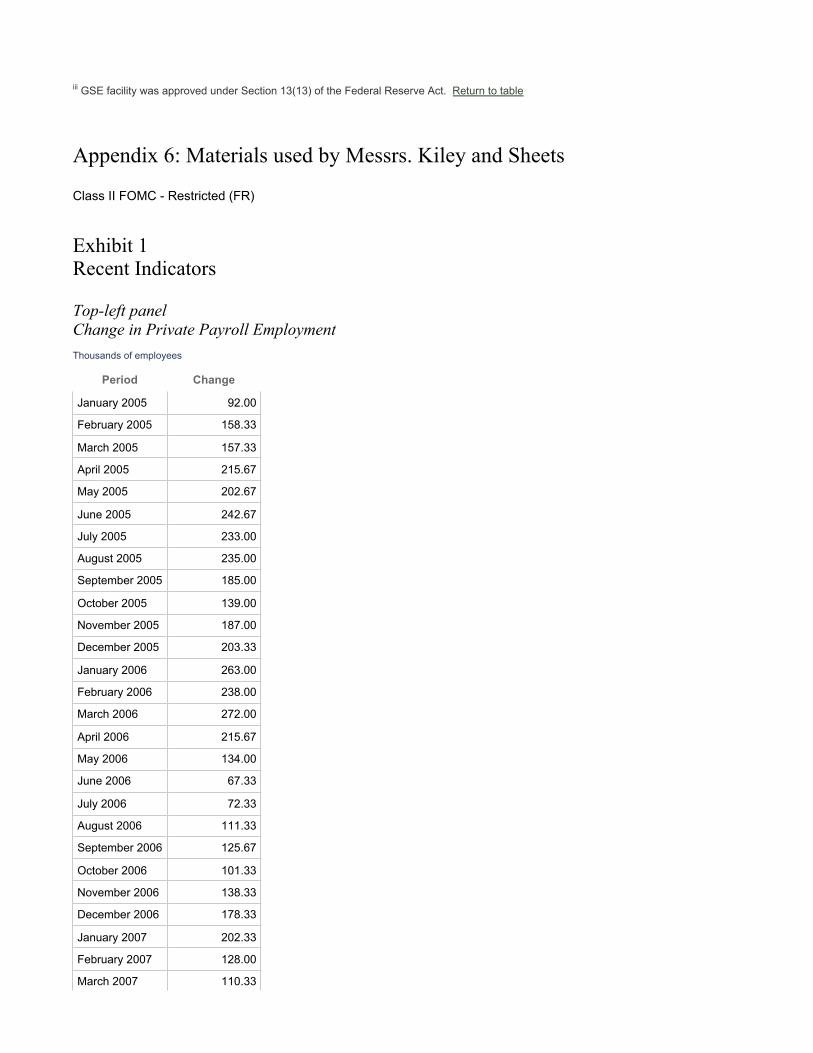
Exhibit 1Recent Indicators
Top-left panelChange in Private Payroll EmploymentThousands of employees
Period Change
January 2005 92.00
February 2005 158.33
March 2005 157.33
April 2005 215.67
May 2005 202.67
June 2005 242.67
July 2005 233.00
August 2005 235.00
September 2005 185.00
October 2005 139.00
November 2005 187.00
December 2005 203.33
January 2006 263.00
February 2006 238.00
March 2006 272.00
April 2006 215.67
May 2006 134.00
June 2006 67.33
July 2006 72.33
August 2006 111.33
September 2006 125.67
October 2006 101.33
November 2006 138.33
December 2006 178.33
January 2007 202.33
February 2007 128.00
March 2007 110.33

Period Change
April 2007 64.00
May 2007 99.00
June 2007 50.00
July 2007 51.67
August 2007 -16.33
September 2007 -3.67
October 2007 35.33
November 2007 122.67
December 2007 131.33
January 2008 56.00
February 2008 -64.00
March 2008 -136.67
April 2008 -162.00
May 2008 -162.00
June 2008 -179.67
July 2008 -170.67
August 2008 -177.33
September 2008 -212.33
October 2008 -292.67
November 2008 -428.33
December 2008 -551.67
January 2009 -673.33
February 2009 -702.33
March 2009 -695.00
April 2009 -644.00
May 2009 -527.33
Note: Three-month moving average.
Unemployment RatePercent
Mar. Apr. May
8.5 8.9 9.4
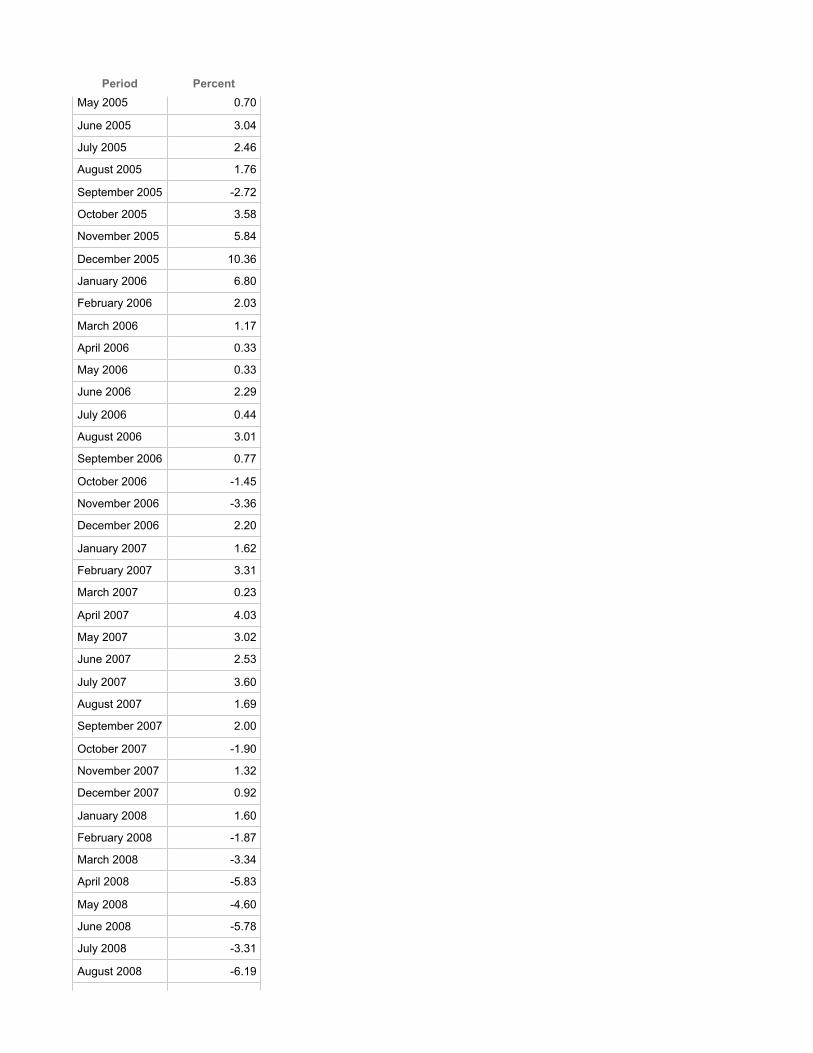
Top-right panelManufacturing IPPercent change, annual rate
Period Percent
January 2005 5.40
February 2005 8.93
March 2005 4.36
April 2005 2.02
Period PercentMay 2005 0.70
June 2005 3.04
July 2005 2.46
August 2005 1.76
September 2005 -2.72
October 2005 3.58
November 2005 5.84
December 2005 10.36
January 2006 6.80
February 2006 2.03
March 2006 1.17
April 2006 0.33
May 2006 0.33
June 2006 2.29
July 2006 0.44
August 2006 3.01
September 2006 0.77
October 2006 -1.45
November 2006 -3.36
December 2006 2.20
January 2007 1.62
February 2007 3.31
March 2007 0.23
April 2007 4.03
May 2007 3.02
June 2007 2.53
July 2007 3.60
August 2007 1.69
September 2007 2.00
October 2007 -1.90
November 2007 1.32
December 2007 0.92
January 2008 1.60
February 2008 -1.87
March 2008 -3.34
April 2008 -5.83
May 2008 -4.60
June 2008 -5.78
July 2008 -3.31
August 2008 -6.19

Period PercentSeptember 2008 -18.00
October 2008 -16.08
November 2008 -20.38
December 2008 -17.89
January 2009 -27.41
February 2009 -20.74
March 2009 -17.19
April 2009 -9.74
May 2009 -13.00
Note: Three-month percent changes.
Monthly Percent Change
Mar. Apr. May
-1.9 -0.6 -1.0
Middle-left panelReal Personal Consumption ExpendituresBillions of chained (2000) dollars
Period Real PCE
January 2005 7683.70
February 2005 7706.48
March 2005 7702.44
April 2005 7752.24
May 2005 7731.55
June 2005 7815.45
July 2005 7863.71
August 2005 7837.29
September 2005 7813.30
October 2005 7836.95
November 2005 7858.52
December 2005 7899.29
January 2006 7921.20
February 2006 7959.07
March 2006 7962.04
April 2006 7989.80
May 2006 8004.29
June 2006 8012.24
July 2006 8052.28
August 2006 8037.65
September 2006 8049.11
October 2006 8101.14
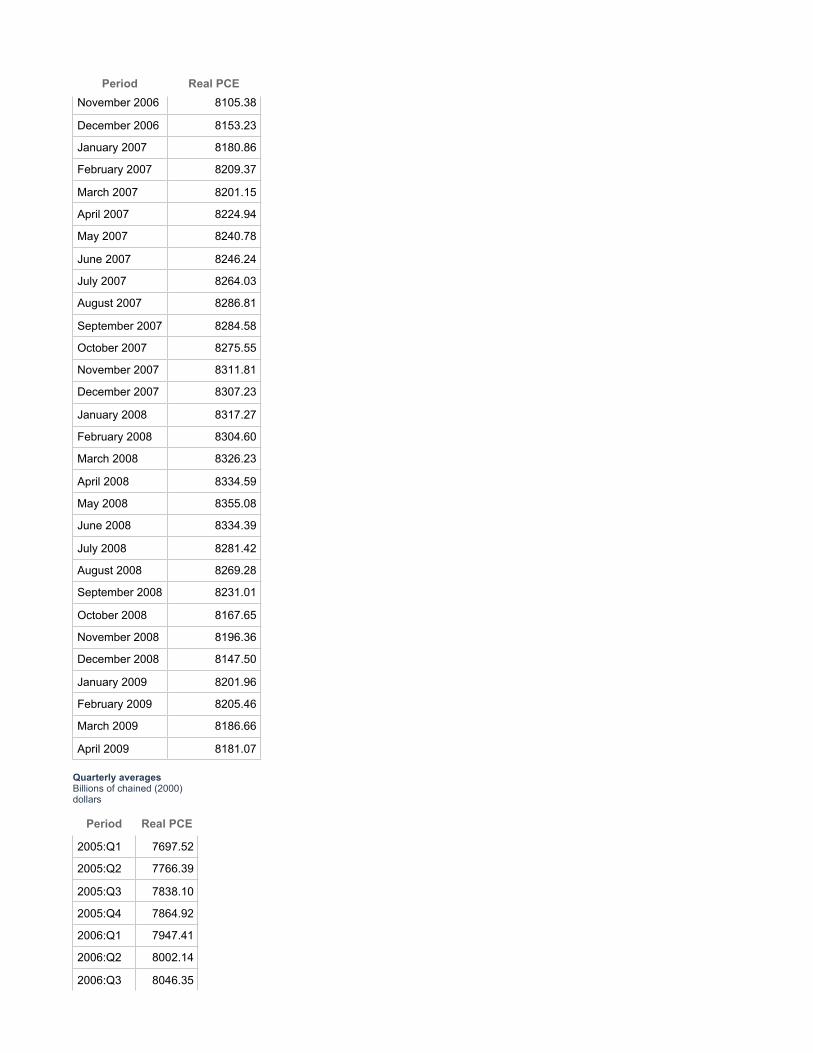
Period Real PCENovember 2006 8105.38
December 2006 8153.23
January 2007 8180.86
February 2007 8209.37
March 2007 8201.15
April 2007 8224.94
May 2007 8240.78
June 2007 8246.24
July 2007 8264.03
August 2007 8286.81
September 2007 8284.58
October 2007 8275.55
November 2007 8311.81
December 2007 8307.23
January 2008 8317.27
February 2008 8304.60
March 2008 8326.23
April 2008 8334.59
May 2008 8355.08
June 2008 8334.39
July 2008 8281.42
August 2008 8269.28
September 2008 8231.01
October 2008 8167.65
November 2008 8196.36
December 2008 8147.50
January 2009 8201.96
February 2009 8205.46
March 2009 8186.66
April 2009 8181.07
Quarterly averagesBillions of chained (2000) dollars
Period Real PCE
2005:Q1 7697.52
2005:Q2 7766.39
2005:Q3 7838.10
2005:Q4 7864.92
2006:Q1 7947.41
2006:Q2 8002.14
2006:Q3 8046.35

Period Real PCE
2006:Q4 8119.94
2007:Q1 8197.17
2007:Q2 8237.27
2007:Q3 8278.52
2007:Q4 8298.20
2008:Q1 8316.06
2008:Q2 8341.33
2008:Q3 8260.59
2008:Q4 8170.49
2009:Q1 8198.05
Staff forecast
2009:Q2 8192.63
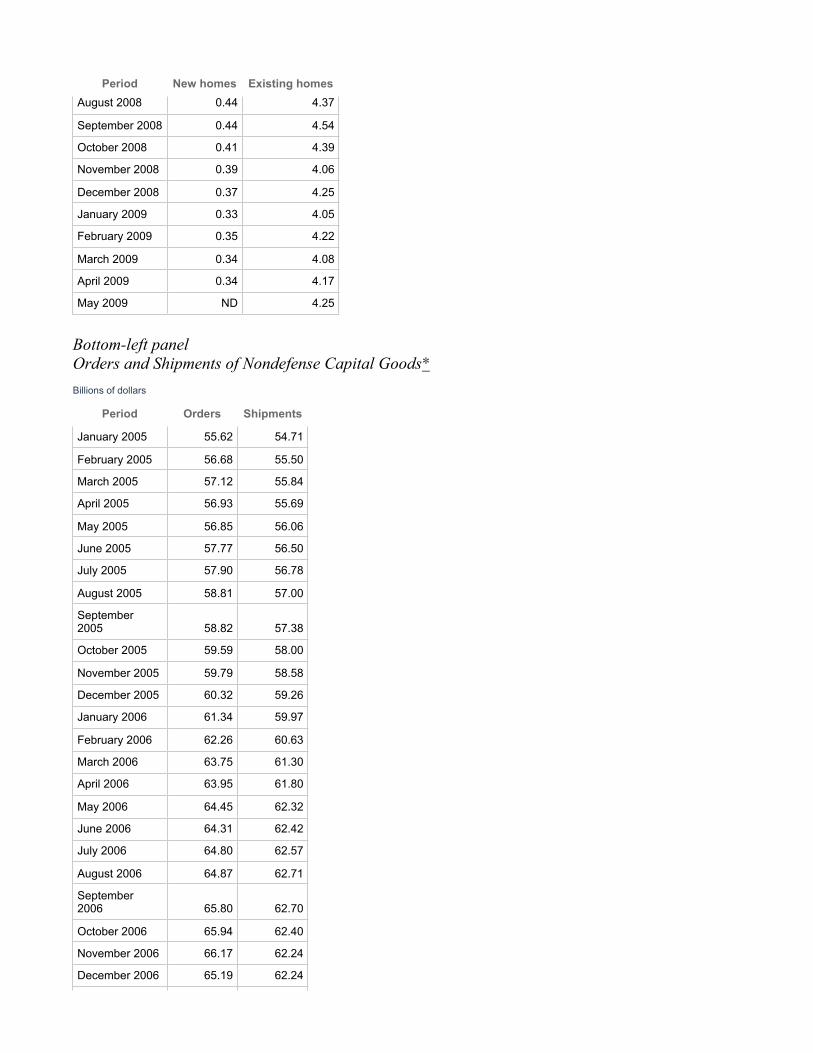
Middle-right panelSales of Single-Family HomesMillions
Period New homes Existing homes
January 2000 0.87 4.64
February 2000 0.86 4.57
March 2000 0.90 4.64
April 2000 0.84 4.63
May 2000 0.86 4.57
June 2000 0.79 4.57
July 2000 0.89 4.55
August 2000 0.85 4.60
September 2000 0.91 4.69
October 2000 0.93 4.65
November 2000 0.88 4.74
December 2000 0.98 4.52
January 2001 0.94 4.55
February 2001 0.96 4.66
March 2001 0.94 4.83
April 2001 0.91 4.73
May 2001 0.89 4.68
June 2001 0.88 4.82
July 2001 0.88 4.81
August 2001 0.87 4.85
September 2001 0.85 4.63
October 2001 0.87 4.65
November 2001 0.92 4.65

Period New homes Existing homesDecember 2001 0.98 4.86
January 2002 0.88 5.22
February 2002 0.95 5.20
March 2002 0.92 4.98
April 2002 0.94 5.00
May 2002 0.98 4.97
June 2002 0.96 4.86
July 2002 0.96 4.78
August 2002 1.01 4.73
September 2002 1.04 4.87
October 2002 1.01 5.02
November 2002 1.02 5.06
December 2002 1.05 5.28
January 2003 1.00 5.33
February 2003 0.94 5.29
March 2003 1.00 5.17
April 2003 1.01 5.15
May 2003 1.08 5.24
June 2003 1.19 5.24
July 2003 1.17 5.53
August 2003 1.21 5.76
September 2003 1.13 5.80
October 2003 1.14 5.63
November 2003 1.09 5.48
December 2003 1.13 5.70
January 2004 1.17 5.51
February 2004 1.16 5.63
March 2004 1.28 5.86
April 2004 1.19 5.92
May 2004 1.24 6.03
June 2004 1.18 6.09
July 2004 1.09 6.00
August 2004 1.18 5.87
September 2004 1.21 5.88
October 2004 1.31 6.02
November 2004 1.18 6.11
December 2004 1.24 6.05
January 2005 1.20 6.20
February 2005 1.32 6.02
March 2005 1.33 6.10

Period New homes Existing homesApril 2005 1.26 6.23
May 2005 1.29 6.18
June 2005 1.27 6.25
July 2005 1.39 6.24
August 2005 1.26 6.31
September 2005 1.24 6.34
October 2005 1.34 6.21
November 2005 1.21 6.14
December 2005 1.24 5.95
January 2006 1.17 5.88
February 2006 1.06 5.99
March 2006 1.12 5.99
April 2006 1.12 5.87
May 2006 1.09 5.75
June 2006 1.07 5.70
July 2006 0.97 5.53
August 2006 1.04 5.56
September 2006 1.02 5.50
October 2006 0.94 5.59
November 2006 1.00 5.57
December 2006 1.00 5.61
January 2007 0.89 5.57
February 2007 0.83 5.75
March 2007 0.83 5.30
April 2007 0.89 5.19
May 2007 0.84 5.14
June 2007 0.79 5.03
July 2007 0.78 4.99
August 2007 0.70 4.81
September 2007 0.69 4.47
October 2007 0.73 4.43
November 2007 0.64 4.46
December 2007 0.62 4.38
January 2008 0.61 4.36
February 2008 0.58 4.39
March 2008 0.51 4.35
April 2008 0.53 4.30
May 2008 0.51 4.38
June 2008 0.49 4.31
July 2008 0.50 4.39
Period New homes Existing homesAugust 2008 0.44 4.37
September 2008 0.44 4.54
October 2008 0.41 4.39
November 2008 0.39 4.06
December 2008 0.37 4.25
January 2009 0.33 4.05
February 2009 0.35 4.22
March 2009 0.34 4.08
April 2009 0.34 4.17
May 2009 ND 4.25
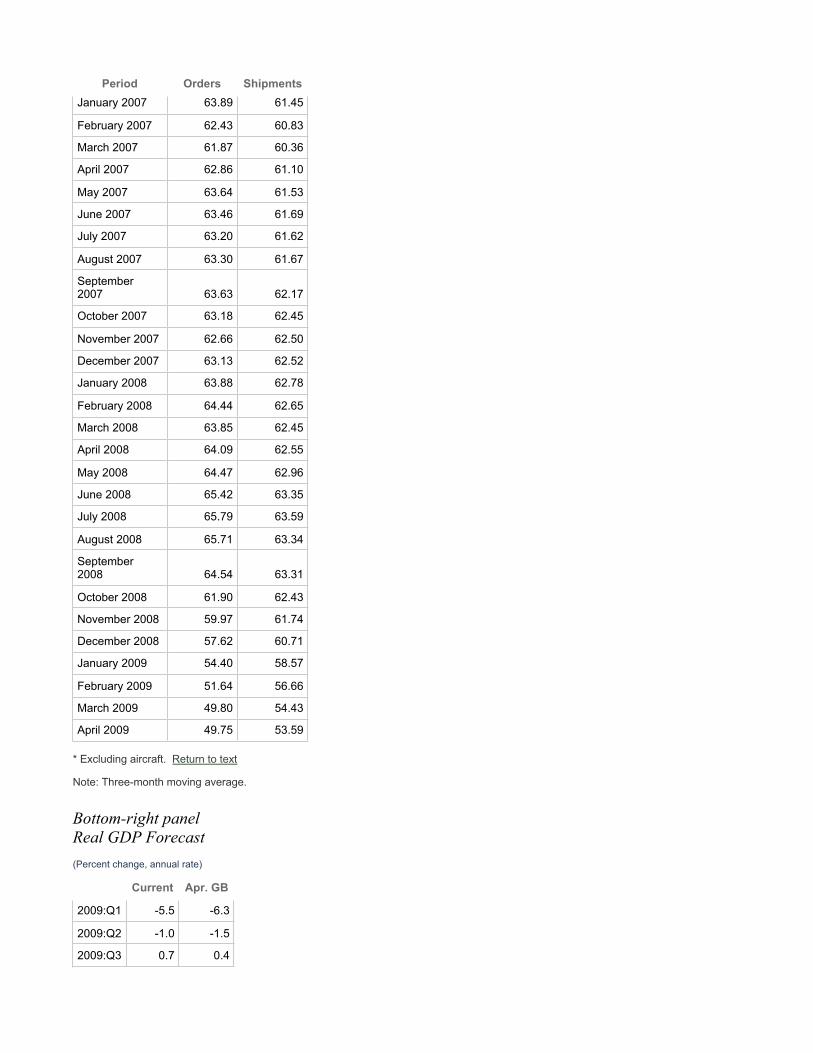
Bottom-left panelOrders and Shipments of Nondefense Capital Goods*Billions of dollars
Period Orders Shipments
January 2005 55.62 54.71
February 2005 56.68 55.50
March 2005 57.12 55.84
April 2005 56.93 55.69
May 2005 56.85 56.06
June 2005 57.77 56.50
July 2005 57.90 56.78
August 2005 58.81 57.00
September 2005 58.82 57.38
October 2005 59.59 58.00
November 2005 59.79 58.58
December 2005 60.32 59.26
January 2006 61.34 59.97
February 2006 62.26 60.63
March 2006 63.75 61.30
April 2006 63.95 61.80
May 2006 64.45 62.32
June 2006 64.31 62.42
July 2006 64.80 62.57
August 2006 64.87 62.71
September 2006 65.80 62.70
October 2006 65.94 62.40
November 2006 66.17 62.24
December 2006 65.19 62.24
Period Orders ShipmentsJanuary 2007 63.89 61.45
February 2007 62.43 60.83
March 2007 61.87 60.36
April 2007 62.86 61.10
May 2007 63.64 61.53
June 2007 63.46 61.69
July 2007 63.20 61.62
August 2007 63.30 61.67
September 2007 63.63 62.17
October 2007 63.18 62.45
November 2007 62.66 62.50
December 2007 63.13 62.52
January 2008 63.88 62.78
February 2008 64.44 62.65
March 2008 63.85 62.45
April 2008 64.09 62.55
May 2008 64.47 62.96
June 2008 65.42 63.35
July 2008 65.79 63.59
August 2008 65.71 63.34
September 2008 64.54 63.31
October 2008 61.90 62.43
November 2008 59.97 61.74
December 2008 57.62 60.71
January 2009 54.40 58.57
February 2009 51.64 56.66
March 2009 49.80 54.43
April 2009 49.75 53.59
* Excluding aircraft. Return to text
Note: Three-month moving average.
Bottom-right panelReal GDP Forecast(Percent change, annual rate)
Current Apr. GB
2009:Q1 -5.5 -6.3
2009:Q2 -1.0 -1.5
2009:Q3 0.7 0.4

Exhibit 2Medium-Term Outlook
Top panelFactors Affecting GDP Forecast• Inventory dynamics provide a lift in the second half of this year.• Housing stabilizes and we expect construction to turn up next year.• Risk premiums on corporate equity and debt decline further, contributing to gains in wealth and a lower
cost of capital.
Middle-left panelContributions to Growth in Real GDPPercentage points
Period Change in business inventories Final sales
2008:H2 0.36 -3.83
2009:H1 -1.64 -1.62
2009:H2 1.76 -0.62
2010 0.35 2.61
Middle-right panelContribution of Wealth to PCE Growth
Period Percentage points
2006 1.02
2007 0.71
2008 -1.22
2009 -2.59
2010 -1.61
Bottom-left panelBFI and the Accelerator
Period NFB output(Percent change)
BFI share(Percent)
1990:Q1 3.69 21.14
1990:Q2 2.13 20.50
1990:Q3 2.71 20.78
1990:Q4 2.20 20.62
1991:Q1 1.19 20.15
1991:Q2 -0.22 19.64
1991:Q3 -2.17 19.28
1991:Q4 -1.52 18.97
1992:Q1 -0.66 18.53

Period NFB output(Percent change)
BFI share(Percent)
1992:Q2 1.08 19.04
1992:Q3 3.10 19.03
1992:Q4 3.37 19.29
1993:Q1 3.96 19.36
1993:Q2 4.99 19.82
1993:Q3 3.86 19.70
1993:Q4 3.37 20.30
1994:Q1 3.06 20.35
1994:Q2 3.13 20.26
1994:Q3 4.16 20.40
1994:Q4 5.17 20.93
1995:Q1 4.84 21.62
1995:Q2 4.87 21.51
1995:Q3 4.15 21.30
1995:Q4 2.74 21.42
1996:Q1 3.38 21.52
1996:Q2 2.69 21.53
1996:Q3 3.12 21.95
1996:Q4 4.84 21.96
1997:Q1 4.73 22.00
1997:Q2 5.21 21.97
1997:Q3 5.19 22.59
1997:Q4 5.11 22.29
1998:Q1 5.48 22.55
1998:Q2 4.97 22.85
1998:Q3 5.58 22.62
1998:Q4 4.49 22.75
1999:Q1 4.35 22.81
1999:Q2 5.40 22.99
1999:Q3 4.93 23.03
1999:Q4 5.13 22.49
2000:Q1 5.22 22.96
2000:Q2 5.35 23.12
2000:Q3 4.36 23.18
2000:Q4 5.30 22.87
2001:Q1 3.64 22.45
2001:Q2 2.13 21.45
2001:Q3 1.87 21.19
2001:Q4 0.35 20.44

Period NFB output(Percent change)
BFI share(Percent)
2002:Q1 -0.17 19.60
2002:Q2 -0.42 19.20
2002:Q3 0.73 18.93
2002:Q4 0.77 18.76
2003:Q1 2.30 18.45
2003:Q2 2.04 18.71
2003:Q3 1.47 18.57
2003:Q4 2.20 18.59
2004:Q1 4.10 18.22
2004:Q2 4.48 18.52
2004:Q3 4.84 18.91
2004:Q4 4.99 19.27
2005:Q1 3.26 19.26
2005:Q2 3.51 19.50
2005:Q3 3.79 19.51
2005:Q4 3.28 19.57
2006:Q1 3.51 20.00
2006:Q2 3.18 20.09
2006:Q3 3.73 20.21
2006:Q4 3.71 20.10
2007:Q1 2.58 19.99
2007:Q2 2.61 20.09
2007:Q3 0.92 20.05
2007:Q4 1.63 20.10
2008:Q1 2.92 19.97
2008:Q2 2.36 19.81
2008:Q3 2.82 19.72
2008:Q4 2.09 19.04
2009:Q1 0.27 17.07
Forecast
2009:Q2 -1.85 16.63
2009:Q3 -3.91 16.07
2009:Q4 -4.97 15.55
2010:Q1 -4.40 15.26
2010:Q2 -1.76 15.21
2010:Q3 0.70 15.30
2010:Q4 1.91 15.52
Note: BFI share equals nominal BFI divided by nominal nonfarm business (NFB) output. NFB output growth is measured as the percent change from four quarters earlier, lagged two quarters.

Bottom-right panelReal GDP Forecast(Percent change, annual rate)
Current Apr. GB
2009:H1 -3.3 -3.9
2009:H2 1.1 0.8
2010 3.0 2.6
Exhibit 3Inflation
Top-left panelPCE Price Index
Total Core
Percent change, a.r.:
2008: Q4 -4.9 0.9
2009: Q1 -1.0 1.5
Q2 1.5 2.3
Monthly percent change:
2009: March 0.0 0.2
April 0.1 0.3
May 0.1 0.1
Top-right panelUnemployment RatePercent
Period Unemployment Rate April GB NAIRU April GB NAIRU
2005:Q1 5.28 5.28 4.85 4.85
2005:Q2 5.12 5.12 4.83 4.83
2005:Q3 4.97 4.97 4.85 4.85
2005:Q4 4.94 4.94 4.83 4.83
2006:Q1 4.71 4.71 4.82 4.82
2006:Q2 4.68 4.68 4.83 4.83
2006:Q3 4.65 4.65 4.81 4.81
2006:Q4 4.43 4.43 4.82 4.82
2007:Q1 4.50 4.50 4.82 4.82
2007:Q2 4.53 4.53 4.80 4.80
2007:Q3 4.67 4.67 4.78 4.78
2007:Q4 4.78 4.78 4.78 4.78
2008:Q1 4.94 4.94 4.77 4.77

Period Unemployment Rate April GB NAIRU April GB NAIRU2008:Q2 5.37 5.37 4.75 4.75
2008:Q3 6.05 6.05 4.82 4.75
2008:Q4 6.86 6.86 4.88 4.75
2009:Q1 8.06 8.06 4.95 4.76
Forecast
2009:Q2 9.27 9.01 5.01 4.82
2009:Q3 9.83 9.22 5.01 4.82
2009:Q4 9.98 9.26 5.01 4.82
2010:Q1 9.98 9.25 5.01 4.82
2010:Q2 9.95 9.22 5.01 4.82
2010:Q3 9.81 9.14 5.01 4.82
2010:Q4 9.66 9.07 5.01 4.82
Middle-left panelPCE Energy PricesFour-quarter percent change
Period Percent April GB
2005:Q1 13.06 ND
2005:Q2 9.03 ND
2005:Q3 23.72 ND
2005:Q4 23.10 ND
2006:Q1 20.40 ND
2006:Q2 21.71 ND
2006:Q3 9.81 ND
2006:Q4 -3.98 ND
2007:Q1 0.47 ND
2007:Q2 4.05 ND
2007:Q3 1.23 ND
2007:Q4 19.08 ND
2008:Q1 20.05 ND
2008:Q2 19.69 ND
2008:Q3 27.47 ND
2008:Q4 -8.54 ND
2009:Q1 -21.64 -21.66
Forecast
2009:Q2 -26.91 -28.82
2009:Q3 -24.25 -31.62
2009:Q4 1.28 -8.87
2010:Q1 15.09 3.90
2010:Q2 17.48 9.37

Period Percent April GB2010:Q3 6.72 7.63
2010:Q4 4.47 6.10
Middle-right panelCore Nonfuel Import PricesFour-quarter percent change
Period Percent April GB
2005:Q1 3.50 3.50
2005:Q2 2.88 2.88
2005:Q3 2.24 2.24
2005:Q4 2.22 2.22
2006:Q1 1.29 1.29
2006:Q2 1.68 1.68
2006:Q3 2.74 2.74
2006:Q4 2.37 2.37
2007:Q1 2.79 2.79
2007:Q2 2.91 2.91
2007:Q3 2.71 2.71
2007:Q4 3.40 3.40
2008:Q1 4.78 4.78
2008:Q2 6.49 6.49
2008:Q3 6.89 6.89
2008:Q4 3.52 3.52
2009:Q1 -0.99 -1.12
Forecast
2009:Q2 -3.71 -4.33
2009:Q3 -4.22 -5.56
2009:Q4 -1.61 -3.32
2010:Q1 1.16 -0.56
2010:Q2 1.69 0.49
2010:Q3 1.32 0.93
2010:Q4 1.08 1.07
Bottom panelPCE Price IndexFour-quarter percent change
Period Core Total
2000:Q1 1.85 2.70
2000:Q2 1.74 2.53
2000:Q3 1.62 2.44

Period Core Total2000:Q4 1.53 2.28
2001:Q1 1.62 2.22
2001:Q2 1.82 2.37
2001:Q3 1.95 2.05
2001:Q4 2.22 1.74
2002:Q1 1.84 1.15
2002:Q2 1.79 1.21
2002:Q3 1.89 1.52
2002:Q4 1.55 1.79
2003:Q1 1.51 2.32
2003:Q2 1.37 1.79
2003:Q3 1.35 1.94
2003:Q4 1.44 1.89
2004:Q1 1.77 2.00
2004:Q2 2.12 2.80
2004:Q3 2.10 2.69
2004:Q4 2.23 3.09
2005:Q1 2.25 2.82
2005:Q2 2.11 2.50
2005:Q3 2.08 3.19
2005:Q4 2.15 3.26
2006:Q1 2.06 3.08
2006:Q2 2.27 3.26
2006:Q3 2.45 2.86
2006:Q4 2.29 1.90
2007:Q1 2.35 2.31
2007:Q2 2.07 2.40
2007:Q3 2.01 2.24
2007:Q4 2.20 3.45
2008:Q1 2.18 3.51
2008:Q2 2.26 3.67
2008:Q3 2.34 4.30
2008:Q4 1.94 1.92
2009:Q1 1.75 0.77
Forecast
2009:Q2 1.78 0.11
2009:Q3 1.44 -0.26
2009:Q4 1.41 1.42
2010:Q1 1.23 2.07
2010:Q2 0.86 1.99

Period Core Total2010:Q3 0.79 1.36
2010:Q4 0.77 1.14
Exhibit 4Risk I: Uncertainty Regarding Resource Utilization
Top-left panelOutput and Unemployment Gaps
Period Output(Percent)
Unemployment(Percentage points,
inverted scale)
1987:Q1 -1.57 0.67
1987:Q2 -1.23 0.41
1987:Q3 -1.08 0.17
1987:Q4 -0.11 0.11
1988:Q1 -0.38 -0.08
1988:Q2 0.13 -0.24
1988:Q3 -0.10 -0.23
1988:Q4 0.46 -0.38
1989:Q1 0.71 -0.44
1989:Q2 0.61 -0.45
1989:Q3 0.56 -0.32
1989:Q4 0.06 -0.18
1990:Q1 0.45 -0.38
1990:Q2 -0.05 -0.36
1990:Q3 -0.70 0.07
1990:Q4 -2.11 0.51
1991:Q1 -3.27 1.01
1991:Q2 -3.28 1.23
1991:Q3 -3.45 1.37
1991:Q4 -3.64 1.57
1992:Q1 -3.26 1.92
1992:Q2 -2.95 2.14
1992:Q3 -2.63 2.15
1992:Q4 -2.19 1.97
1993:Q1 -2.72 1.80
1993:Q2 -2.86 1.73
1993:Q3 -3.01 1.45
1993:Q4 -2.32 1.28
1994:Q1 -1.96 1.17

Period Output(Percent)
Unemployment(Percentage points,
inverted scale)1994:Q2 -1.32 0.79
1994:Q3 -1.41 0.62
1994:Q4 -0.90 0.24
1995:Q1 -1.28 0.15
1995:Q2 -1.75 0.36
1995:Q3 -1.64 0.37
1995:Q4 -1.61 0.31
1996:Q1 -1.63 0.23
1996:Q2 -0.73 0.25
1996:Q3 -0.62 0.07
1996:Q4 -0.19 0.08
1997:Q1 -0.20 -0.01
1997:Q2 0.53 -0.19
1997:Q3 0.99 -0.27
1997:Q4 0.94 -0.45
1998:Q1 1.19 -0.59
1998:Q2 1.00 -0.79
1998:Q3 1.29 -0.69
1998:Q4 1.94 -0.77
1999:Q1 1.89 -0.87
1999:Q2 1.82 -0.86
1999:Q3 2.08 -0.95
1999:Q4 2.94 -1.06
2000:Q1 2.32 -1.12
2000:Q2 2.99 -1.21
2000:Q3 2.00 -1.10
2000:Q4 1.64 -1.20
2001:Q1 0.70 -0.88
2001:Q2 0.19 -0.65
2001:Q3 -0.97 -0.23
2001:Q4 -1.39 0.49
2002:Q1 -1.47 0.70
2002:Q2 -1.69 0.81
2002:Q3 -1.85 0.72
2002:Q4 -2.56 0.84
2003:Q1 -2.96 0.98
2003:Q2 -2.81 1.30
2003:Q3 -1.71 1.22
2003:Q4 -1.76 0.92

Period Output(Percent)
Unemployment(Percentage points,
inverted scale)2004:Q1 -1.56 0.82
2004:Q2 -1.23 0.70
2004:Q3 -0.87 0.53
2004:Q4 -0.77 0.52
2005:Q1 -0.59 0.44
2005:Q2 -0.49 0.26
2005:Q3 -0.09 0.14
2005:Q4 -0.30 0.06
2006:Q1 0.29 -0.13
2006:Q2 0.37 -0.14
2006:Q3 -0.01 -0.13
2006:Q4 -0.21 -0.43
2007:Q1 -0.82 -0.34
2007:Q2 -0.27 -0.31
2007:Q3 0.27 -0.09
2007:Q4 -0.39 0.01
2008:Q1 -0.77 0.12
2008:Q2 -0.67 0.64
2008:Q3 -1.39 1.18
2008:Q4 -3.63 2.01
2009:Q1 -5.53 3.11
2009:Q2 -6.26 4.27
2009:Q3 -6.58 4.82
2009:Q4 -6.67 4.97
Top-right panelInterpreting Recent Output and Unemployment Gaps• Output and unemployment gaps typically provide similar signals.• Possible explanations for recent discrepancy:
• GDP data understate contraction.• Participation boosted by EUC, wealth decline, or other factors.• Changes in NAIRU or other elements of potential.
Middle-left panelInitial and Current Staff Estimate of the Output Gap (1987-2008)Percent
Period Initial Current
1987:Q1 -2.80 -1.57
1987:Q2 -2.50 -1.23

Period Initial Current1987:Q3 -1.10 -1.08
1987:Q4 -0.90 -0.11
1988:Q1 -0.50 -0.38
1988:Q2 0.10 0.13
1988:Q3 0.50 -0.10
1988:Q4 0.00 0.46
1989:Q1 0.80 0.71
1989:Q2 1.00 0.61
1989:Q3 1.30 0.56
1989:Q4 0.90 0.06
1990:Q1 0.20 0.45
1990:Q2 0.60 -0.05
1990:Q3 0.30 -0.70
1990:Q4 -0.90 -2.11
1991:Q1 -2.80 -3.27
1991:Q2 -3.60 -3.28
1991:Q3 -3.30 -3.45
1991:Q4 -4.00 -3.64
1992:Q1 -4.50 -3.26
1992:Q2 -3.80 -2.95
1992:Q3 -4.20 -2.63
1992:Q4 -3.90 -2.19
1993:Q1 -2.80 -2.72
1993:Q2 -2.90 -2.86
1993:Q3 -3.30 -3.01
1993:Q4 -1.90 -2.32
1994:Q1 -1.10 -1.96
1994:Q2 -0.70 -1.32
1994:Q3 -0.20 -1.41
1994:Q4 0.50 -0.90
1995:Q1 0.80 -1.28
1995:Q2 0.20 -1.75
1995:Q3 -0.30 -1.64
1995:Q4 0.00 -1.61
1996:Q1 -0.30 -1.63
1996:Q2 0.40 -0.73
1996:Q3 0.50 -0.62
1996:Q4 0.70 -0.19
1997:Q1 1.00 -0.20
1997:Q2 1.70 0.53

Period Initial Current1997:Q3 1.90 0.99
1997:Q4 1.90 0.94
1998:Q1 2.00 1.19
1998:Q2 2.00 1.00
1998:Q3 1.70 1.29
1998:Q4 2.00 1.94
1999:Q1 2.70 1.89
1999:Q2 2.70 1.82
1999:Q3 2.40 2.08
1999:Q4 2.50 2.94
2000:Q1 2.30 2.32
2000:Q2 3.20 2.99
2000:Q3 2.20 2.00
2000:Q4 1.70 1.64
2001:Q1 0.10 0.70
2001:Q2 -0.10 0.19
2001:Q3 -0.40 -0.97
2001:Q4 -1.80 -1.39
2002:Q1 -1.80 -1.47
2002:Q2 -1.50 -1.69
2002:Q3 -1.50 -1.85
2002:Q4 -1.70 -2.56
2003:Q1 -2.40 -2.96
2003:Q2 -2.62 -2.81
2003:Q3 -2.43 -1.71
2003:Q4 -1.96 -1.76
2004:Q1 -1.61 -1.56
2004:Q2 -1.57 -1.23
2004:Q3 -1.34 -0.87
2004:Q4 -1.42 -0.77
2005:Q1 -1.17 -0.59
2005:Q2 -1.22 -0.49
2005:Q3 -0.31 -0.09
2005:Q4 -0.50 -0.30
2006:Q1 -0.36 0.29
2006:Q2 0.16 0.37
2006:Q3 0.47 -0.01
2006:Q4 0.14 -0.21
2007:Q1 0.37 -0.82
2007:Q2 0.40 -0.27

Period Initial Current2007:Q3 0.58 0.27
2007:Q4 0.49 -0.39
2008:Q1 -0.32 -0.77
2008:Q2 -1.25 -0.67
2008:Q3 -0.74 -1.39
2008:Q4 -3.11 -3.63
Middle-right panelModel Uncertainty and Resource Utilization• Different methods imply different estimates of potential.• Consider three methods:
• Staff estimate.• Trend/cycle Phillips curve model.• Estimated DSGE (EDO) model.
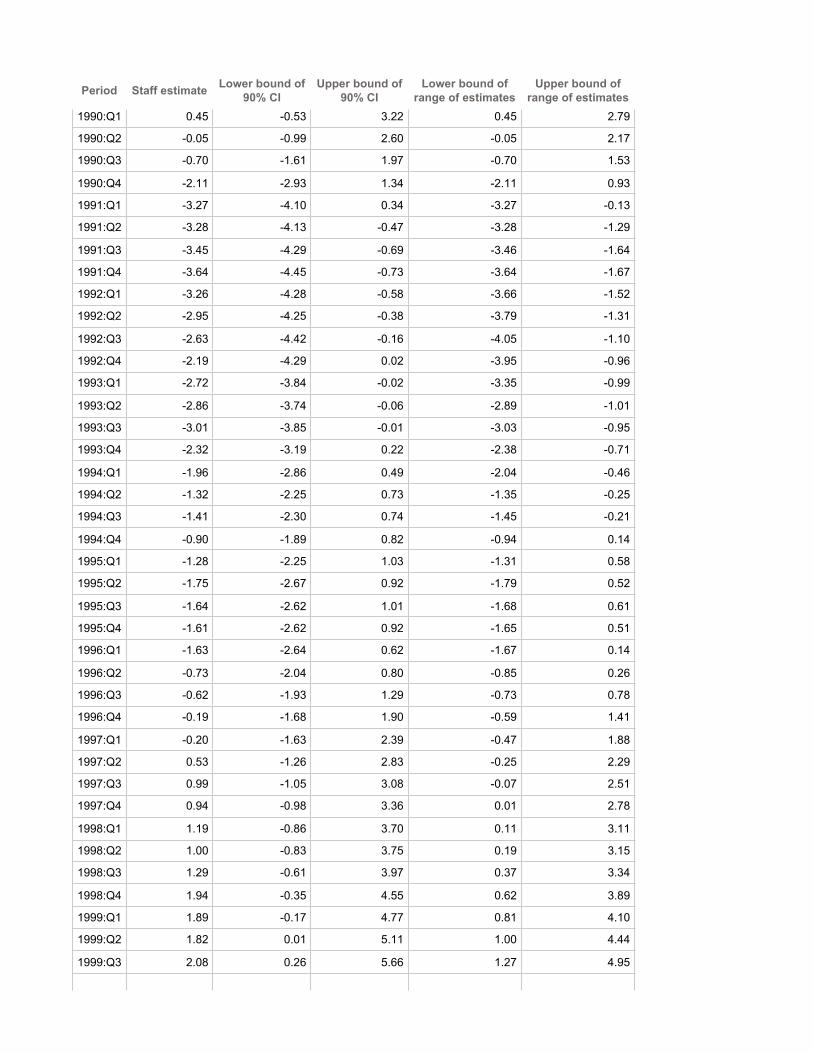
Bottom panelAlternative Estimates of the Output Gap with Confidence IntervalsPercent
Period Staff estimate Lower bound of 90% CI
Upper bound of 90% CI
Lower bound of range of estimates
Upper bound of range of estimates
1985:Q1 -2.14 -2.95 1.35 -2.13 0.34
1985:Q2 -2.05 -2.88 1.45 -2.04 0.41
1985:Q3 -1.25 -2.11 1.54 -1.25 0.56
1985:Q4 -1.24 -2.06 1.62 -1.24 0.58
1986:Q1 -1.05 -1.92 1.51 -1.04 0.53
1986:Q2 -1.41 -2.31 1.33 -1.40 0.36
1986:Q3 -1.21 -2.19 1.19 -1.21 0.25
1986:Q4 -1.47 -2.32 1.07 -1.46 0.11
1987:Q1 -1.57 -2.41 1.23 -1.56 0.18
1987:Q2 -1.23 -2.10 1.35 -1.22 0.37
1987:Q3 -1.08 -1.94 1.50 -1.08 0.54
1987:Q4 -0.11 -1.08 1.90 -0.10 1.08
1988:Q1 -0.38 -1.27 1.83 -0.37 0.80
1988:Q2 0.13 -0.83 2.27 0.13 1.53
1988:Q3 -0.10 -0.97 2.52 -0.09 1.89
1988:Q4 0.46 -0.51 2.98 0.46 2.44
1989:Q1 0.71 -0.30 3.67 0.72 3.18
1989:Q2 0.61 -0.38 3.87 0.61 3.40
1989:Q3 0.56 -0.40 3.69 0.57 3.23
1989:Q4 0.06 -0.80 3.50 0.06 3.07
Period Staff estimate Lower bound of 90% CI
Upper bound of 90% CI
Lower bound of range of estimates
Upper bound of range of estimates
1990:Q1 0.45 -0.53 3.22 0.45 2.79
1990:Q2 -0.05 -0.99 2.60 -0.05 2.17
1990:Q3 -0.70 -1.61 1.97 -0.70 1.53
1990:Q4 -2.11 -2.93 1.34 -2.11 0.93
1991:Q1 -3.27 -4.10 0.34 -3.27 -0.13
1991:Q2 -3.28 -4.13 -0.47 -3.28 -1.29
1991:Q3 -3.45 -4.29 -0.69 -3.46 -1.64
1991:Q4 -3.64 -4.45 -0.73 -3.64 -1.67
1992:Q1 -3.26 -4.28 -0.58 -3.66 -1.52
1992:Q2 -2.95 -4.25 -0.38 -3.79 -1.31
1992:Q3 -2.63 -4.42 -0.16 -4.05 -1.10
1992:Q4 -2.19 -4.29 0.02 -3.95 -0.96
1993:Q1 -2.72 -3.84 -0.02 -3.35 -0.99
1993:Q2 -2.86 -3.74 -0.06 -2.89 -1.01
1993:Q3 -3.01 -3.85 -0.01 -3.03 -0.95
1993:Q4 -2.32 -3.19 0.22 -2.38 -0.71
1994:Q1 -1.96 -2.86 0.49 -2.04 -0.46
1994:Q2 -1.32 -2.25 0.73 -1.35 -0.25
1994:Q3 -1.41 -2.30 0.74 -1.45 -0.21
1994:Q4 -0.90 -1.89 0.82 -0.94 0.14
1995:Q1 -1.28 -2.25 1.03 -1.31 0.58
1995:Q2 -1.75 -2.67 0.92 -1.79 0.52
1995:Q3 -1.64 -2.62 1.01 -1.68 0.61
1995:Q4 -1.61 -2.62 0.92 -1.65 0.51
1996:Q1 -1.63 -2.64 0.62 -1.67 0.14
1996:Q2 -0.73 -2.04 0.80 -0.85 0.26
1996:Q3 -0.62 -1.93 1.29 -0.73 0.78
1996:Q4 -0.19 -1.68 1.90 -0.59 1.41
1997:Q1 -0.20 -1.63 2.39 -0.47 1.88
1997:Q2 0.53 -1.26 2.83 -0.25 2.29
1997:Q3 0.99 -1.05 3.08 -0.07 2.51
1997:Q4 0.94 -0.98 3.36 0.01 2.78
1998:Q1 1.19 -0.86 3.70 0.11 3.11
1998:Q2 1.00 -0.83 3.75 0.19 3.15
1998:Q3 1.29 -0.61 3.97 0.37 3.34
1998:Q4 1.94 -0.35 4.55 0.62 3.89
1999:Q1 1.89 -0.17 4.77 0.81 4.10
1999:Q2 1.82 0.01 5.11 1.00 4.44
1999:Q3 2.08 0.26 5.66 1.27 4.95

Period Staff estimate Lower bound of 90% CI
Upper bound of 90% CI
Lower bound of range of estimates
Upper bound of range of estimates
1999:Q4 2.94 0.61 6.00 1.59 5.28
2000:Q1 2.32 0.63 5.93 1.68 5.21
2000:Q2 2.99 0.81 6.51 1.77 5.78
2000:Q3 2.00 0.47 6.46 1.56 5.71
2000:Q4 1.64 0.14 6.35 1.28 5.59
2001:Q1 0.70 -0.49 5.78 0.66 5.04
2001:Q2 0.19 -0.97 4.82 0.15 4.07
2001:Q3 -0.97 -1.89 3.61 -1.01 2.90
2001:Q4 -1.39 -2.31 2.07 -1.43 1.37
2002:Q1 -1.47 -2.41 1.20 -1.51 0.43
2002:Q2 -1.69 -2.61 0.80 -1.73 -0.04
2002:Q3 -1.85 -2.79 0.48 -1.89 -0.56
2002:Q4 -2.56 -3.42 0.17 -2.60 -0.82
2003:Q1 -2.96 -3.84 0.15 -3.00 -0.82
2003:Q2 -2.81 -3.77 0.36 -2.85 -0.59
2003:Q3 -1.71 -3.65 0.78 -3.13 -0.18
2003:Q4 -1.76 -3.54 1.02 -3.05 0.07
2004:Q1 -1.56 -3.41 1.21 -2.98 0.25
2004:Q2 -1.23 -3.48 1.34 -3.06 0.40
2004:Q3 -0.87 -3.27 1.45 -2.89 0.50
2004:Q4 -0.77 -2.92 1.51 -2.54 0.55
2005:Q1 -0.59 -2.65 1.56 -2.30 0.60
2005:Q2 -0.49 -2.67 1.61 -2.32 0.64
2005:Q3 -0.09 -2.56 1.71 -2.20 0.73
2005:Q4 -0.30 -1.98 1.78 -1.59 0.77
2006:Q1 0.29 -1.44 1.94 -1.02 0.89
2006:Q2 0.37 -1.17 1.99 -0.69 0.92
2006:Q3 -0.01 -1.06 1.85 -0.29 0.84
2006:Q4 -0.21 -1.16 1.74 -0.21 0.77
2007:Q1 -0.82 -1.65 1.72 -0.80 0.75
2007:Q2 -0.27 -1.15 1.93 -0.25 0.94
2007:Q3 0.27 -0.85 2.16 -0.11 1.14
2007:Q4 -0.39 -1.30 2.06 -0.37 1.07
2008:Q1 -0.77 -1.68 1.89 -0.75 0.89
2008:Q2 -0.67 -2.02 1.63 -1.35 0.58
2008:Q3 -1.39 -2.73 1.03 -2.07 -0.10
2008:Q4 -3.63 -4.66 -0.03 -3.86 -1.19
2009:Q1 -5.53 -6.68 -1.06 -5.90 -2.26
2009:Q2 -6.26 -7.88 -1.73 -7.23 -2.97

CI Confidence interval
Exhibit 5Risk II: Inflation Dynamics
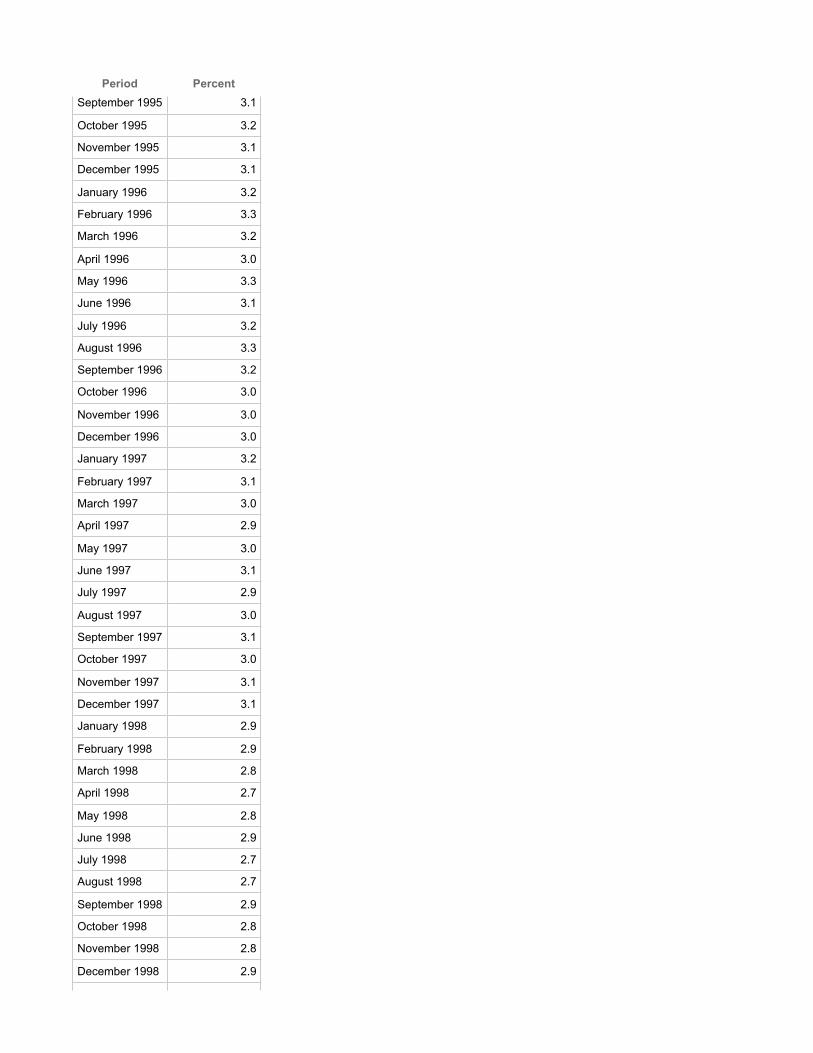
Top-left panelExpectations and Inflation• Long-run inflation expectations have been reasonably well-anchored for some time.• In our projection, this prevents a sharper deceleration in inflation.• Un-mooring of expectations is a risk.
Top-right panelLong-Term Inflation ExpectationsReuters/Michigan, next five to ten years
Period Percent
April 1990 4.0
May 1990 4.3
June 1990 4.6
July 1990 4.2
August 1990 4.6
September 1990 4.7
October 1990 4.6
November 1990 4.6
December 1990 4.5
January 1991 4.6
February 1991 4.6
March 1991 4.6
April 1991 4.2
May 1991 4.4
June 1991 4.5
July 1991 4.2
August 1991 4.0
September 1991 3.9
October 1991 3.7
November 1991 3.8
December 1991 3.8
January 1992 3.6
February 1992 3.4
March 1992 3.6
April 1992 3.9

Period PercentMay 1992 4.0
June 1992 3.4
July 1992 3.7
August 1992 4.2
September 1992 3.5
October 1992 3.7
November 1992 3.7
December 1992 3.4
January 1993 3.4
February 1993 4.1
March 1993 3.6
April 1993 3.5
May 1993 3.5
June 1993 3.8
July 1993 3.5
August 1993 3.3
September 1993 3.3
October 1993 3.5
November 1993 3.4
December 1993 3.6
January 1994 3.2
February 1994 3.3
March 1994 3.4
April 1994 3.2
May 1994 3.4
June 1994 3.4
July 1994 3.2
August 1994 3.5
September 1994 3.2
October 1994 3.3
November 1994 3.2
December 1994 3.2
January 1995 3.2
February 1995 3.2
March 1995 3.3
April 1995 3.5
May 1995 3.2
June 1995 3.1
July 1995 3.2
August 1995 3.1
Period PercentSeptember 1995 3.1
October 1995 3.2
November 1995 3.1
December 1995 3.1
January 1996 3.2
February 1996 3.3
March 1996 3.2
April 1996 3.0
May 1996 3.3
June 1996 3.1
July 1996 3.2
August 1996 3.3
September 1996 3.2
October 1996 3.0
November 1996 3.0
December 1996 3.0
January 1997 3.2
February 1997 3.1
March 1997 3.0
April 1997 2.9
May 1997 3.0
June 1997 3.1
July 1997 2.9
August 1997 3.0
September 1997 3.1
October 1997 3.0
November 1997 3.1
December 1997 3.1
January 1998 2.9
February 1998 2.9
March 1998 2.8
April 1998 2.7
May 1998 2.8
June 1998 2.9
July 1998 2.7
August 1998 2.7
September 1998 2.9
October 1998 2.8
November 1998 2.8
December 1998 2.9

Period PercentJanuary 1999 3.0
February 1999 2.8
March 1999 2.7
April 1999 2.8
May 1999 2.9
June 1999 2.8
July 1999 2.9
August 1999 2.8
September 1999 2.9
October 1999 2.8
November 1999 2.9
December 1999 2.9
January 2000 3.0
February 2000 2.9
March 2000 3.1
April 2000 2.8
May 2000 2.9
June 2000 2.8
July 2000 2.8
August 2000 2.9
September 2000 3.0
October 2000 3.0
November 2000 2.9
December 2000 3.0
January 2001 2.9
February 2001 3.0
March 2001 3.0
April 2001 3.1
May 2001 3.0
June 2001 3.0
July 2001 2.9
August 2001 3.0
September 2001 2.9
October 2001 2.7
November 2001 2.8
December 2001 3.0
January 2002 2.7
February 2002 2.8
March 2002 2.8
April 2002 2.8

Period PercentMay 2002 3.0
June 2002 2.8
July 2002 2.8
August 2002 2.9
September 2002 2.5
October 2002 2.8
November 2002 2.8
December 2002 2.8
January 2003 2.7
February 2003 2.7
March 2003 2.8
April 2003 2.7
May 2003 2.8
June 2003 2.7
July 2003 2.7
August 2003 2.7
September 2003 2.7
October 2003 2.8
November 2003 2.7
December 2003 2.8
January 2004 2.8
February 2004 2.9
March 2004 2.9
April 2004 2.7
May 2004 2.8
June 2004 2.9
July 2004 2.8
August 2004 2.7
September 2004 2.8
October 2004 2.8
November 2004 2.7
December 2004 2.8
January 2005 2.7
February 2005 2.8
March 2005 2.9
April 2005 3.0
May 2005 2.9
June 2005 2.8
July 2005 2.9
August 2005 2.8

Period PercentSeptember 2005 3.1
October 2005 3.2
November 2005 3.0
December 2005 3.1
January 2006 2.9
February 2006 2.9
March 2006 2.9
April 2006 3.1
May 2006 3.2
June 2006 2.9
July 2006 2.9
August 2006 3.2
September 2006 3.0
October 2006 3.1
November 2006 3.0
December 2006 3.0
January 2007 3.0
February 2007 2.9
March 2007 2.9
April 2007 3.1
May 2007 3.1
June 2007 2.9
July 2007 3.1
August 2007 2.9
September 2007 2.9
October 2007 2.8
November 2007 2.9
December 2007 3.1
January 2008 3.0
February 2008 3.0
March 2008 2.9
April 2008 3.2
May 2008 3.4
June 2008 3.4
July 2008 3.2
August 2008 3.2
September 2008 3.0
October 2008 2.9
November 2008 2.9
December 2008 2.6

Period PercentJanuary 2009 2.9
February 2009 3.1
March 2009 2.6
April 2009 2.8
May 2009 2.9
June 2009 3.0
SPF, next 10 years
Period Percent
1990:Q1 3.95
1990:Q2 4.21
1990:Q3 ND
1990:Q4 4.15
1991:Q1 4.05
1991:Q2 4.08
1991:Q3 ND
1991:Q4 4.00
1992:Q1 3.70
1992:Q2 3.90
1992:Q3 3.75
1992:Q4 3.60
1993:Q1 3.50
1993:Q2 3.70
1993:Q3 3.45
1993:Q4 3.45
1994:Q1 3.45
1994:Q2 3.50
1994:Q3 3.50
1994:Q4 3.50
1995:Q1 3.30
1995:Q2 3.35
1995:Q3 3.20
1995:Q4 3.00
1996:Q1 3.00
1996:Q2 3.00
1996:Q3 3.00
1996:Q4 3.00
1997:Q1 3.00
1997:Q2 2.85
1997:Q3 3.00
1997:Q4 2.65

Period Percent
1998:Q1 2.60
1998:Q2 2.50
1998:Q3 2.50
1998:Q4 2.50
1999:Q1 2.30
1999:Q2 2.50
1999:Q3 2.50
1999:Q4 2.50
2000:Q1 2.50
2000:Q2 2.50
2000:Q3 2.50
2000:Q4 2.50
2001:Q1 2.50
2001:Q2 2.50
2001:Q3 2.50
2001:Q4 2.55
2002:Q1 2.50
2002:Q2 2.50
2002:Q3 2.50
2002:Q4 2.45
2003:Q1 2.50
2003:Q2 2.50
2003:Q3 2.50
2003:Q4 2.50
2004:Q1 2.50
2004:Q2 2.50
2004:Q3 2.50
2004:Q4 2.50
2005:Q1 2.45
2005:Q2 2.50
2005:Q3 2.50
2005:Q4 2.50
2006:Q1 2.50
2006:Q2 2.50
2006:Q3 2.50
2006:Q4 2.50
2007:Q1 2.35
2007:Q2 2.40
2007:Q3 2.40
2007:Q4 2.40

Period Percent2008:Q1 2.50
2008:Q2 2.50
2008:Q3 2.50
2008:Q4 2.50
2009:Q1 2.40
2009:Q2 2.50
Middle-left panelResource Utilization and Inflation• Inflation appears to be less sensitive to resource utilization than in the past.• This reduced sensitivity contributed to our projection that inflation will decelerate by less than during similar
earlier periods.• If the effect of utilization on inflation were similar to that during the early 1980s, we could see deflation.
Middle-right panelSlope of a Simple Phillips Curve
Period Estimated slope Lower bound of70% CI
Upper bound of70% CI
1985 -0.38 -0.55 -0.22
1986 -0.37 -0.54 -0.20
1987 -0.36 -0.53 -0.19
1988 -0.34 -0.52 -0.16
1989 -0.36 -0.55 -0.17
1990 -0.37 -0.56 -0.18
1991 -0.36 -0.54 -0.18
1992 -0.36 -0.53 -0.19
1993 -0.37 -0.53 -0.20
1994 -0.33 -0.45 -0.22
1995 -0.40 -0.51 -0.29
1996 -0.35 -0.45 -0.26
1997 -0.36 -0.46 -0.26
1998 -0.35 -0.45 -0.25
1999 -0.34 -0.44 -0.25
2000 -0.38 -0.44 -0.33
2001 -0.39 -0.45 -0.34
2002 -0.32 -0.37 -0.26
2003 -0.29 -0.36 -0.23
2004 -0.21 -0.28 -0.14
2005 -0.21 -0.28 -0.13
2006 -0.22 -0.30 -0.14
2007 -0.22 -0.30 -0.14

Period Estimated slope Lower bound of70% CI
Upper bound of70% CI
2008 -0.21 -0.28 -0.14
Note: From a Phillips curve for core PCE inflation using annual data and 20-year rolling estimation samples.
CI Confidence interval
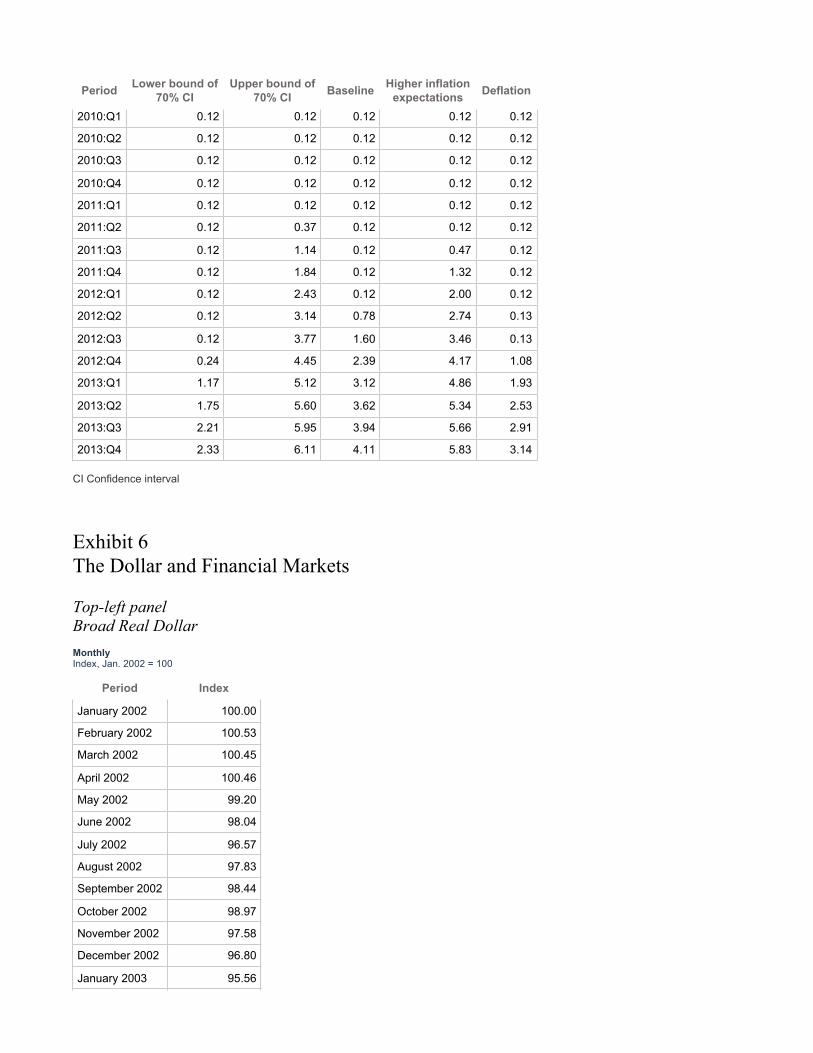
Alternative SimulationsBottom-left panelCore PCE PricesFour-quarter percent change
Period Lower bound of70% CI
Upper bound of70% CI Baseline Higher inflation
expectations Deflation
2009:Q1 ND ND 1.75 ND ND
2009:Q2 1.78 1.78 1.78 1.78 1.78
2009:Q3 1.21 1.67 1.44 1.46 1.31
2009:Q4 1.05 1.75 1.41 1.50 0.92
2010:Q1 0.78 1.70 1.23 1.44 0.55
2010:Q2 0.32 1.43 0.86 1.25 0.05
2010:Q3 0.19 1.45 0.79 1.35 0.01
2010:Q4 0.15 1.50 0.77 1.49 0.15
2011:Q1 0.09 1.52 0.75 1.60 0.10
2011:Q2 0.02 1.51 0.72 1.67 -0.02
2011:Q3 0.01 1.53 0.71 1.75 -0.16
2011:Q4 -0.03 1.56 0.72 1.82 -0.18
2012:Q1 -0.01 1.57 0.74 1.87 -0.15
2012:Q2 0.02 1.59 0.78 1.92 -0.08
2012:Q3 0.05 1.63 0.83 1.98 0.01
2012:Q4 0.12 1.72 0.89 2.06 0.13
2013:Q1 0.19 1.79 0.95 2.17 0.24
2013:Q2 0.27 1.86 1.01 2.28 0.34
2013:Q3 0.34 1.94 1.08 2.39 0.42
2013:Q4 0.40 2.01 1.13 2.49 0.50
CI Confidence interval
Bottom-right panelFederal Funds RatePercent
Period Lower bound of70% CI
Upper bound of70% CI Baseline Higher inflation
expectations Deflation
2009:Q1 ND ND 0.18 ND ND
2009:Q2 0.12 0.12 0.12 0.12 0.12
2009:Q3 0.12 0.12 0.12 0.12 0.12
2009:Q4 0.12 0.12 0.12 0.12 0.12
Period Lower bound of70% CI
Upper bound of70% CI Baseline Higher inflation
expectations Deflation
2010:Q1 0.12 0.12 0.12 0.12 0.12
2010:Q2 0.12 0.12 0.12 0.12 0.12
2010:Q3 0.12 0.12 0.12 0.12 0.12
2010:Q4 0.12 0.12 0.12 0.12 0.12
2011:Q1 0.12 0.12 0.12 0.12 0.12
2011:Q2 0.12 0.37 0.12 0.12 0.12
2011:Q3 0.12 1.14 0.12 0.47 0.12
2011:Q4 0.12 1.84 0.12 1.32 0.12
2012:Q1 0.12 2.43 0.12 2.00 0.12
2012:Q2 0.12 3.14 0.78 2.74 0.13
2012:Q3 0.12 3.77 1.60 3.46 0.13
2012:Q4 0.24 4.45 2.39 4.17 1.08
2013:Q1 1.17 5.12 3.12 4.86 1.93
2013:Q2 1.75 5.60 3.62 5.34 2.53
2013:Q3 2.21 5.95 3.94 5.66 2.91
2013:Q4 2.33 6.11 4.11 5.83 3.14
CI Confidence interval
Exhibit 6The Dollar and Financial Markets
Top-left panelBroad Real DollarMonthlyIndex, Jan. 2002 = 100
Period Index
January 2002 100.00
February 2002 100.53
March 2002 100.45
April 2002 100.46
May 2002 99.20
June 2002 98.04
July 2002 96.57
August 2002 97.83
September 2002 98.44
October 2002 98.97
November 2002 97.58
December 2002 96.80
January 2003 95.56

Period IndexFebruary 2003 95.67
March 2003 95.75
April 2003 94.95
May 2003 91.92
June 2003 91.63
July 2003 92.59
August 2003 93.78
September 2003 92.68
October 2003 90.49
November 2003 89.73
December 2003 88.29
January 2004 86.96
February 2004 87.57
March 2004 88.89
April 2004 89.68
May 2004 91.54
June 2004 90.90
July 2004 89.92
August 2004 89.94
September 2004 89.47
October 2004 88.30
November 2004 85.83
December 2004 84.61
January 2005 85.18
February 2005 85.25
March 2005 85.41
April 2005 86.70
May 2005 86.99
June 2005 87.92
July 2005 88.36
August 2005 87.50
September 2005 88.05
October 2005 88.75
November 2005 88.51
December 2005 87.57
January 2006 86.66
February 2006 86.67
March 2006 87.35
April 2006 87.35
May 2006 85.92

Period IndexJune 2006 87.12
July 2006 87.02
August 2006 86.44
September 2006 86.06
October 2006 85.61
November 2006 84.44
December 2006 83.69
January 2007 84.61
February 2007 84.23
March 2007 84.51
April 2007 84.00
May 2007 83.69
June 2007 83.52
July 2007 82.12
August 2007 82.15
September 2007 80.98
October 2007 79.04
November 2007 77.84
December 2007 78.25
January 2008 77.74
February 2008 76.55
March 2008 75.61
April 2008 75.73
May 2008 76.37
June 2008 76.94
July 2008 76.43
August 2008 78.12
September 2008 79.75
October 2008 84.04
November 2008 84.51
December 2008 83.11
January 2009 83.95
February 2009 86.07
March 2009 86.75
April 2009 85.04
May 2009 84.85
June 2009 81.68
Forecast
July 2009 81.43
August 2009 81.20

Period IndexSeptember 2009 81.16
October 2009 81.14
November 2009 81.11
December 2009 81.00
January 2010 80.87
February 2010 80.75
March 2010 80.60
April 2010 80.44
May 2010 80.28
June 2010 80.11
July 2010 79.93
August 2010 79.75
September 2010 79.57
October 2010 79.39
November 2010 79.20
December 2010 79.02
Top-center panelAFE Exchange RatesWeeklyIndex, Mar. 2, 2009 = 100
Period United Kingdom Euro area Japan Canada
6 March 2009 100.00 100.00 100.00 100.00
13 March 2009 100.99 98.32 100.16 99.12
20 March 2009 97.75 93.42 98.26 96.15
27 March 2009 98.50 95.25 100.11 96.32
3 April 2009 95.33 94.25 102.10 95.88
10 April 2009 96.41 96.43 102.47 95.40
17 April 2009 95.48 97.27 101.36 94.41
24 April 2009 96.01 95.46 99.18 94.01
1 May 2009 94.82 95.53 101.39 92.25
8 May 2009 93.51 93.92 101.15 90.01
15 May 2009 92.69 93.61 96.95 91.38
22 May 2009 88.79 90.50 96.50 87.32
29 May 2009 87.31 89.72 97.62 85.17
5 June 2009 88.09 90.59 100.31 86.62
12 June 2009 85.40 90.27 100.30 86.82
19 June 2009 85.32 90.54 98.23 87.73
26 June 2009 86.35 90.59 97.81 89.43
Note: A vertical line indicates the FOMC meeting on April 28-29, 2009.

Top-right panelEME Exchange RatesWeeklyIndex, Mar. 2, 2009 = 100
Period Korea Brazil Mexico Russia Thailand
6 March 2009 100.00 100.00 100.00 100.00 100.00
13 March 2009 95.59 97.43 95.61 97.17 99.61
20 March 2009 90.12 94.80 92.70 93.77 97.84
27 March 2009 87.18 95.90 93.84 94.44 98.09
3 April 2009 86.18 92.79 89.36 93.30 97.75
10 April 2009 85.70 91.43 86.06 93.89 98.20
17 April 2009 85.64 92.08 86.11 93.68 98.36
24 April 2009 86.36 92.52 86.83 92.73 98.06
1 May 2009 82.41 91.55 90.62 92.53 97.81
8 May 2009 80.17 87.39 85.92 90.73 96.67
15 May 2009 80.80 87.70 86.58 89.91 95.81
22 May 2009 80.15 85.42 86.32 86.94 95.23
29 May 2009 80.60 82.91 86.42 86.25 95.20
5 June 2009 80.50 82.60 87.16 86.53 94.95
12 June 2009 80.41 80.95 87.85 86.51 94.53
19 June 2009 81.58 82.33 87.44 86.87 94.59
26 June 2009 83.01 84.79 87.18 87.64 94.70
Note: A vertical line indicates the FOMC meeting on April 28-29, 2009.
Middle-left panelBBB Corporate SpreadsWeeklyBasis points
Period United States United Kingdom Euro area Japan
5 January 2007 138.04 116.59 76.70 29.35
12 January 2007 137.64 113.59 75.10 28.69
19 January 2007 135.12 113.20 73.37 27.38
26 January 2007 134.01 111.26 73.17 27.30
2 February 2007 133.64 111.06 74.65 26.76
9 February 2007 131.84 109.95 72.01 26.47
16 February 2007 130.18 109.47 71.70 27.65
23 February 2007 128.21 108.88 ND 25.80
2 March 2007 132.83 108.71 73.62 24.53
9 March 2007 134.40 109.84 ND 23.81
16 March 2007 137.01 111.57 76.26 23.57
23 March 2007 137.56 111.19 74.28 24.20

Period United States United Kingdom Euro area Japan30 March 2007 138.93 110.89 72.56 25.23
6 April 2007 ND 111.01 ND 25.45
13 April 2007 138.19 110.97 78.11 25.78
20 April 2007 137.31 109.90 75.81 26.15
27 April 2007 137.70 109.70 75.39 25.13
4 May 2007 138.06 107.67 77.20 ND
11 May 2007 136.48 107.47 76.20 25.54
18 May 2007 135.53 107.10 74.62 24.99
25 May 2007 134.79 105.01 72.73 25.54
1 June 2007 136.03 105.58 70.55 29.02
8 June 2007 138.75 106.94 73.06 27.58
15 June 2007 138.06 107.79 73.17 28.45
22 June 2007 139.38 109.31 73.83 27.87
29 June 2007 142.38 113.35 76.93 29.82
6 July 2007 142.25 117.34 82.92 27.58
13 July 2007 143.97 120.17 85.65 28.00
20 July 2007 148.84 123.52 91.54 28.47
27 July 2007 171.51 132.03 102.02 27.61
3 August 2007 170.97 137.30 108.78 29.21
10 August 2007 168.41 132.89 110.44 29.84
17 August 2007 178.76 136.91 118.12 29.76
24 August 2007 180.50 139.38 118.60 32.93
31 August 2007 180.24 143.47 120.49 32.72
7 September 2007 183.51 150.43 124.19 31.08
14 September 2007 187.66 157.11 131.35 31.64
21 September 2007 181.44 147.00 120.52 34.11
28 September 2007 178.97 144.51 118.91 35.16
5 October 2007 174.28 144.20 ND 34.55
12 October 2007 167.92 139.77 109.28 33.87
19 October 2007 172.30 142.31 112.39 34.09
26 October 2007 174.15 143.65 111.36 34.15
2 November 2007 181.36 145.57 113.87 33.41
9 November 2007 190.52 150.85 120.82 33.58
16 November 2007 198.64 155.30 129.24 35.01
23 November 2007 205.42 164.12 141.04 ND
30 November 2007 212.09 163.58 145.49 38.62
7 December 2007 221.62 169.05 150.49 36.84
14 December 2007 221.80 171.24 152.87 36.78
21 December 2007 220.20 172.55 152.64 37.15
28 December 2007 219.30 172.29 153.27 36.12

Period United States United Kingdom Euro area Japan4 January 2008 227.69 170.80 160.51 36.47
11 January 2008 239.11 178.27 170.49 35.55
18 January 2008 247.88 182.67 182.49 37.72
25 January 2008 252.44 191.61 193.14 38.92
1 February 2008 254.15 196.92 203.86 41.00
8 February 2008 259.66 203.84 ND 38.84
15 February 2008 266.98 212.15 217.53 42.64
22 February 2008 271.38 219.39 222.03 44.41
29 February 2008 274.74 220.75 222.36 45.49
7 March 2008 287.49 230.90 238.34 45.47
14 March 2008 299.18 237.05 252.90 46.25
21 March 2008 ND 239.05 ND 46.06
28 March 2008 305.57 239.09 ND 47.28
4 April 2008 301.08 243.69 244.35 47.92
11 April 2008 297.45 239.86 236.83 47.84
18 April 2008 290.63 233.59 222.79 45.82
25 April 2008 280.52 234.66 213.79 46.72
2 May 2008 264.47 224.78 199.71 46.05
9 May 2008 266.21 219.72 199.75 44.72
16 May 2008 265.38 206.60 193.15 44.23
23 May 2008 268.67 208.17 193.38 42.26
30 May 2008 265.01 206.56 192.28 42.63
6 June 2008 261.05 205.14 193.06 37.46
13 June 2008 260.05 204.92 192.20 39.50
20 June 2008 264.81 208.55 197.46 38.65
27 June 2008 279.64 211.58 208.89 39.13
4 July 2008 ND 215.22 216.68 38.15
11 July 2008 291.49 210.50 229.89 38.11
18 July 2008 294.97 207.78 226.62 39.53
25 July 2008 294.93 211.13 228.42 39.33
1 August 2008 300.26 208.65 229.02 41.74
8 August 2008 304.24 210.69 229.80 44.21
15 August 2008 307.82 212.70 227.38 44.16
22 August 2008 313.13 211.79 229.76 45.98
29 August 2008 315.06 216.39 232.98 47.60
5 September 2008 319.22 218.96 246.65 46.35
12 September 2008 329.28 218.65 251.21 46.27
19 September 2008 357.61 233.25 275.15 46.00
26 September 2008 369.30 235.29 297.88 46.69
3 October 2008 409.64 243.93 316.40 37.16

Period United States United Kingdom Euro area Japan10 October 2008 481.18 254.73 392.84 33.26
17 October 2008 511.61 274.21 441.03 42.00
24 October 2008 524.83 289.97 502.48 40.22
31 October 2008 540.95 306.78 500.53 42.61
7 November 2008 536.30 338.67 481.09 45.50
14 November 2008 544.83 361.30 480.68 46.13
21 November 2008 603.28 369.90 498.91 46.98
28 November 2008 620.41 379.13 505.49 62.36
5 December 2008 636.41 395.77 503.76 64.25
12 December 2008 651.01 397.44 499.10 66.81
19 December 2008 658.02 390.16 496.79 69.50
26 December 2008 652.10 393.94 495.05 68.39
2 January 2009 652.75 398.44 495.87 ND
9 January 2009 604.24 390.47 460.32 71.96
16 January 2009 599.04 382.20 453.43 72.16
23 January 2009 590.79 371.96 450.09 72.76
30 January 2009 558.56 370.07 457.53 72.79
6 February 2009 538.46 342.47 434.64 74.78
13 February 2009 531.56 325.65 431.29 72.62
20 February 2009 543.07 322.62 437.10 73.40
27 February 2009 558.95 326.37 436.59 74.90
6 March 2009 560.22 323.40 443.85 68.98
13 March 2009 576.58 321.66 449.98 69.66
20 March 2009 589.08 327.17 449.51 ND
27 March 2009 588.97 331.00 437.48 71.56
3 April 2009 579.77 336.79 432.55 72.24
10 April 2009 ND 336.61 ND 82.43
17 April 2009 537.06 339.21 391.75 84.85
24 April 2009 520.70 338.75 386.27 82.55
1 May 2009 478.45 331.03 ND 89.00
8 May 2009 444.02 319.65 346.90 89.50
15 May 2009 449.25 318.15 334.06 83.50
22 May 2009 431.68 313.77 316.75 84.49
29 May 2009 403.83 315.63 305.48 71.64
5 June 2009 380.71 307.73 297.89 64.89
12 June 2009 359.11 302.42 289.56 61.21
19 June 2009 354.24 300.00 290.28 61.08
Middle-right panelEquity Prices
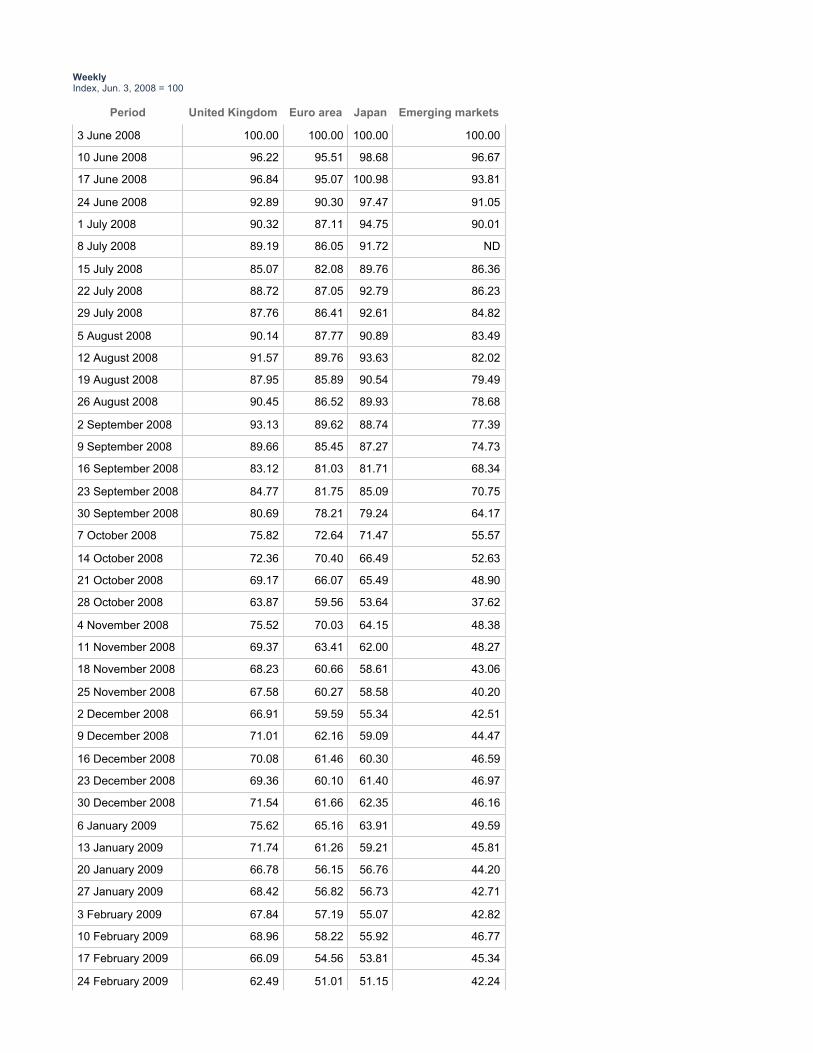
WeeklyIndex, Jun. 3, 2008 = 100
Period United Kingdom Euro area Japan Emerging markets
3 June 2008 100.00 100.00 100.00 100.00
10 June 2008 96.22 95.51 98.68 96.67
17 June 2008 96.84 95.07 100.98 93.81
24 June 2008 92.89 90.30 97.47 91.05
1 July 2008 90.32 87.11 94.75 90.01
8 July 2008 89.19 86.05 91.72 ND
15 July 2008 85.07 82.08 89.76 86.36
22 July 2008 88.72 87.05 92.79 86.23
29 July 2008 87.76 86.41 92.61 84.82
5 August 2008 90.14 87.77 90.89 83.49
12 August 2008 91.57 89.76 93.63 82.02
19 August 2008 87.95 85.89 90.54 79.49
26 August 2008 90.45 86.52 89.93 78.68
2 September 2008 93.13 89.62 88.74 77.39
9 September 2008 89.66 85.45 87.27 74.73
16 September 2008 83.12 81.03 81.71 68.34
23 September 2008 84.77 81.75 85.09 70.75
30 September 2008 80.69 78.21 79.24 64.17
7 October 2008 75.82 72.64 71.47 55.57
14 October 2008 72.36 70.40 66.49 52.63
21 October 2008 69.17 66.07 65.49 48.90
28 October 2008 63.87 59.56 53.64 37.62
4 November 2008 75.52 70.03 64.15 48.38
11 November 2008 69.37 63.41 62.00 48.27
18 November 2008 68.23 60.66 58.61 43.06
25 November 2008 67.58 60.27 58.58 40.20
2 December 2008 66.91 59.59 55.34 42.51
9 December 2008 71.01 62.16 59.09 44.47
16 December 2008 70.08 61.46 60.30 46.59
23 December 2008 69.36 60.10 61.40 46.97
30 December 2008 71.54 61.66 62.35 46.16
6 January 2009 75.62 65.16 63.91 49.59
13 January 2009 71.74 61.26 59.21 45.81
20 January 2009 66.78 56.15 56.76 44.20
27 January 2009 68.42 56.82 56.73 42.71
3 February 2009 67.84 57.19 55.07 42.82
10 February 2009 68.96 58.22 55.92 46.77
17 February 2009 66.09 54.56 53.81 45.34
24 February 2009 62.49 51.01 51.15 42.24

Period United Kingdom Euro area Japan Emerging markets
3 March 2009 57.98 48.19 50.88 39.34
10 March 2009 61.07 49.45 49.65 40.18
17 March 2009 63.43 51.48 55.94 44.68
24 March 2009 64.45 53.97 59.74 47.97
31 March 2009 64.63 53.03 57.07 46.49
7 April 2009 65.08 55.55 62.16 51.59
14 April 2009 66.43 58.33 62.23 53.04
21 April 2009 66.22 57.80 61.31 52.45
28 April 2009 68.00 58.69 59.78 52.45
5 May 2009 72.29 62.17 63.18 58.04
12 May 2009 73.34 62.35 65.44 59.91
19 May 2009 74.26 63.26 65.38 60.32
26 May 2009 73.03 63.25 65.53 61.86
2 June 2009 74.27 65.00 68.30 66.42
9 June 2009 73.12 63.51 68.88 63.94
16 June 2009 71.77 62.32 68.64 63.75
23 June 2009 70.30 60.44 67.21 60.98
Bottom-left panelCommodity PricesMonthly
Period WTI oil(Dollars per barrel)
Nonfuel commodities(Index, Jan. 2007 = 100)
January 2007 54.16 100.00
February 2007 59.26 102.22
March 2007 60.56 104.38
April 2007 63.96 109.60
May 2007 63.46 110.86
June 2007 67.48 109.33
July 2007 74.12 108.66
August 2007 72.39 103.49
September 2007 79.93 105.13
October 2007 85.93 106.45
November 2007 94.62 105.75
December 2007 91.70 104.60
January 2008 92.95 111.12
February 2008 95.35 118.32
March 2008 105.56 122.57
April 2008 112.57 121.87
May 2008 125.39 120.23

Period WTI oil(Dollars per barrel)
Nonfuel commodities(Index, Jan. 2007 = 100)
June 2008 133.93 121.21
July 2008 133.44 121.87
August 2008 116.70 114.62
September 2008 103.90 108.65
October 2008 76.66 92.22
November 2008 57.28 84.74
December 2008 41.02 77.79
January 2009 41.74 80.82
February 2009 39.16 78.82
March 2009 47.98 78.36
April 2009 49.79 83.01
May 2009 59.16 86.90
June 2009 69.67 89.87
Forecast
July 2009 66.93 89.40
August 2009 67.50 89.41
September 2009 68.32 89.40
October 2009 69.07 89.60
November 2009 69.77 89.74
December 2009 70.37 90.01
January 2010 70.83 90.27
February 2010 71.24 90.46
March 2010 71.64 90.65
April 2010 72.06 90.81
May 2010 72.48 90.93
June 2010 72.90 91.06
July 2010 73.27 91.22
August 2010 73.60 91.25
September 2010 73.93 91.23
October 2010 74.27 91.30
November 2010 74.61 91.34
December 2010 74.96 91.45
Bottom-right panelBaltic Dry IndexDailyIndex, Jan. 2, 2007 = 100
Period Index
2 January 2007 100.00
3 January 2007 100.70

Period Index4 January 2007 101.65
5 January 2007 102.67
8 January 2007 103.57
9 January 2007 104.43
10 January 2007 104.95
11 January 2007 105.11
12 January 2007 105.00
15 January 2007 104.70
16 January 2007 103.03
17 January 2007 101.36
18 January 2007 99.77
19 January 2007 98.67
22 January 2007 98.17
23 January 2007 98.62
24 January 2007 99.10
25 January 2007 99.19
26 January 2007 98.78
29 January 2007 98.24
30 January 2007 96.97
31 January 2007 95.57
1 February 2007 95.43
2 February 2007 95.97
5 February 2007 96.47
6 February 2007 97.06
7 February 2007 97.56
8 February 2007 97.78
9 February 2007 97.90
12 February 2007 98.35
13 February 2007 98.62
14 February 2007 98.76
15 February 2007 98.44
16 February 2007 98.51
19 February 2007 98.51
20 February 2007 98.60
21 February 2007 99.50
22 February 2007 100.79
23 February 2007 102.80
26 February 2007 104.25
27 February 2007 106.40
28 February 2007 107.78

Period Index1 March 2007 108.98
2 March 2007 110.20
5 March 2007 111.02
6 March 2007 111.31
7 March 2007 111.67
8 March 2007 112.26
9 March 2007 113.10
12 March 2007 114.02
13 March 2007 114.66
14 March 2007 114.84
15 March 2007 114.70
16 March 2007 115.04
19 March 2007 115.88
20 March 2007 116.99
21 March 2007 118.21
22 March 2007 119.32
23 March 2007 120.56
26 March 2007 121.17
27 March 2007 121.33
28 March 2007 121.15
29 March 2007 121.13
30 March 2007 121.87
2 April 2007 122.53
3 April 2007 123.03
4 April 2007 124.11
5 April 2007 125.13
6 April 2007 ND
9 April 2007 ND
10 April 2007 125.58
11 April 2007 125.67
12 April 2007 125.45
13 April 2007 125.61
16 April 2007 125.81
17 April 2007 126.69
18 April 2007 128.93
19 April 2007 130.78
20 April 2007 132.32
23 April 2007 133.95
24 April 2007 136.37
25 April 2007 138.48

Period Index26 April 2007 140.06
27 April 2007 140.92
30 April 2007 141.33
1 May 2007 141.48
2 May 2007 141.64
3 May 2007 141.96
4 May 2007 142.98
7 May 2007 ND
8 May 2007 144.65
9 May 2007 146.53
10 May 2007 148.95
11 May 2007 150.37
14 May 2007 151.21
15 May 2007 151.28
16 May 2007 150.42
17 May 2007 149.36
18 May 2007 148.25
21 May 2007 147.50
22 May 2007 146.37
23 May 2007 145.26
24 May 2007 142.59
25 May 2007 140.51
28 May 2007 ND
29 May 2007 138.50
30 May 2007 136.24
31 May 2007 135.06
1 June 2007 135.33
4 June 2007 135.96
5 June 2007 136.24
6 June 2007 135.44
7 June 2007 132.93
8 June 2007 129.74
11 June 2007 128.05
12 June 2007 125.27
13 June 2007 122.30
14 June 2007 119.93
15 June 2007 118.93
18 June 2007 118.84
19 June 2007 120.11
20 June 2007 123.00

Period Index21 June 2007 128.30
22 June 2007 133.95
25 June 2007 136.58
26 June 2007 138.09
27 June 2007 139.79
28 June 2007 141.01
29 June 2007 142.00
2 July 2007 142.59
3 July 2007 142.55
4 July 2007 142.34
5 July 2007 141.39
6 July 2007 140.26
9 July 2007 140.69
10 July 2007 142.52
11 July 2007 146.66
12 July 2007 150.55
13 July 2007 151.69
16 July 2007 151.37
17 July 2007 150.12
18 July 2007 148.88
19 July 2007 148.54
20 July 2007 149.31
23 July 2007 150.62
24 July 2007 152.00
25 July 2007 153.36
26 July 2007 154.67
27 July 2007 155.85
30 July 2007 156.89
31 July 2007 157.59
1 August 2007 158.18
2 August 2007 158.34
3 August 2007 158.49
6 August 2007 158.11
7 August 2007 157.57
8 August 2007 156.46
9 August 2007 156.89
10 August 2007 158.58
13 August 2007 159.83
14 August 2007 161.57
15 August 2007 163.56

Period Index16 August 2007 165.55
17 August 2007 165.42
20 August 2007 164.87
21 August 2007 163.83
22 August 2007 163.11
23 August 2007 163.70
24 August 2007 164.60
27 August 2007 ND
28 August 2007 166.95
29 August 2007 169.06
30 August 2007 171.59
31 August 2007 174.21
3 September 2007 176.05
4 September 2007 178.85
5 September 2007 182.99
6 September 2007 187.06
7 September 2007 190.23
10 September 2007 191.74
11 September 2007 191.54
12 September 2007 190.48
13 September 2007 188.65
14 September 2007 187.79
17 September 2007 187.65
18 September 2007 188.03
19 September 2007 190.66
20 September 2007 194.96
21 September 2007 202.58
24 September 2007 205.43
25 September 2007 208.44
26 September 2007 209.43
27 September 2007 211.94
28 September 2007 214.30
1 October 2007 215.72
2 October 2007 216.38
3 October 2007 216.26
4 October 2007 215.18
5 October 2007 215.68
8 October 2007 218.62
9 October 2007 223.03
10 October 2007 231.12

Period Index11 October 2007 237.80
12 October 2007 241.91
15 October 2007 243.29
16 October 2007 243.11
17 October 2007 242.57
18 October 2007 242.75
19 October 2007 244.24
22 October 2007 245.49
23 October 2007 247.55
24 October 2007 248.45
25 October 2007 248.68
26 October 2007 249.38
29 October 2007 249.56
30 October 2007 246.23
31 October 2007 241.03
1 November 2007 239.34
2 November 2007 238.59
5 November 2007 238.39
6 November 2007 239.88
7 November 2007 241.44
8 November 2007 243.02
9 November 2007 245.80
12 November 2007 248.70
13 November 2007 249.69
14 November 2007 248.70
15 November 2007 247.41
16 November 2007 245.87
19 November 2007 243.84
20 November 2007 240.83
21 November 2007 237.89
22 November 2007 233.61
23 November 2007 229.54
26 November 2007 226.26
27 November 2007 223.86
28 November 2007 224.43
29 November 2007 228.27
30 November 2007 230.94
3 December 2007 232.30
4 December 2007 232.64
5 December 2007 231.08
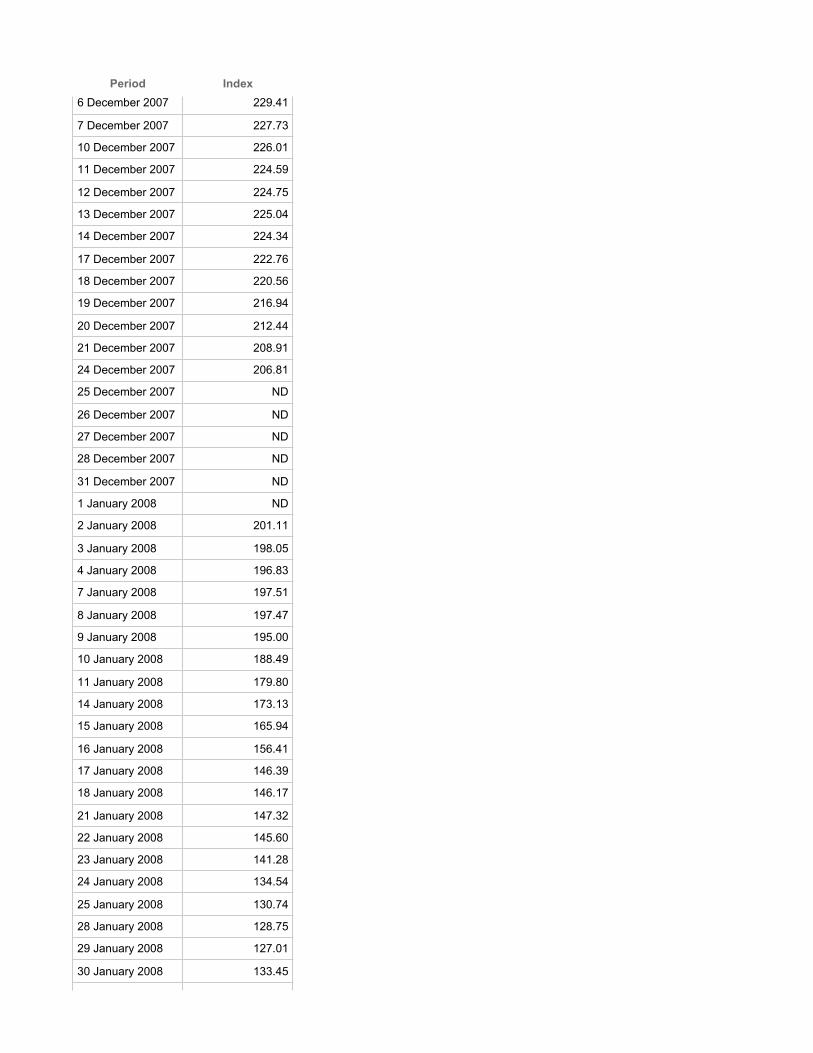
Period Index6 December 2007 229.41
7 December 2007 227.73
10 December 2007 226.01
11 December 2007 224.59
12 December 2007 224.75
13 December 2007 225.04
14 December 2007 224.34
17 December 2007 222.76
18 December 2007 220.56
19 December 2007 216.94
20 December 2007 212.44
21 December 2007 208.91
24 December 2007 206.81
25 December 2007 ND
26 December 2007 ND
27 December 2007 ND
28 December 2007 ND
31 December 2007 ND
1 January 2008 ND
2 January 2008 201.11
3 January 2008 198.05
4 January 2008 196.83
7 January 2008 197.51
8 January 2008 197.47
9 January 2008 195.00
10 January 2008 188.49
11 January 2008 179.80
14 January 2008 173.13
15 January 2008 165.94
16 January 2008 156.41
17 January 2008 146.39
18 January 2008 146.17
21 January 2008 147.32
22 January 2008 145.60
23 January 2008 141.28
24 January 2008 134.54
25 January 2008 130.74
28 January 2008 128.75
29 January 2008 127.01
30 January 2008 133.45

Period Index31 January 2008 136.89
1 February 2008 138.75
4 February 2008 138.45
5 February 2008 136.44
6 February 2008 135.76
7 February 2008 138.77
8 February 2008 143.70
11 February 2008 147.48
12 February 2008 151.82
13 February 2008 157.54
14 February 2008 163.13
15 February 2008 166.37
18 February 2008 166.95
19 February 2008 165.55
20 February 2008 160.17
21 February 2008 158.29
22 February 2008 162.57
25 February 2008 165.03
26 February 2008 165.39
27 February 2008 165.10
28 February 2008 165.84
29 February 2008 172.20
3 March 2008 178.20
4 March 2008 180.80
5 March 2008 184.62
6 March 2008 190.07
7 March 2008 193.08
10 March 2008 195.07
11 March 2008 193.62
12 March 2008 188.78
13 March 2008 183.04
14 March 2008 180.32
17 March 2008 178.99
18 March 2008 178.53
19 March 2008 176.45
20 March 2008 173.81
21 March 2008 ND
24 March 2008 ND
25 March 2008 172.34
26 March 2008 173.69
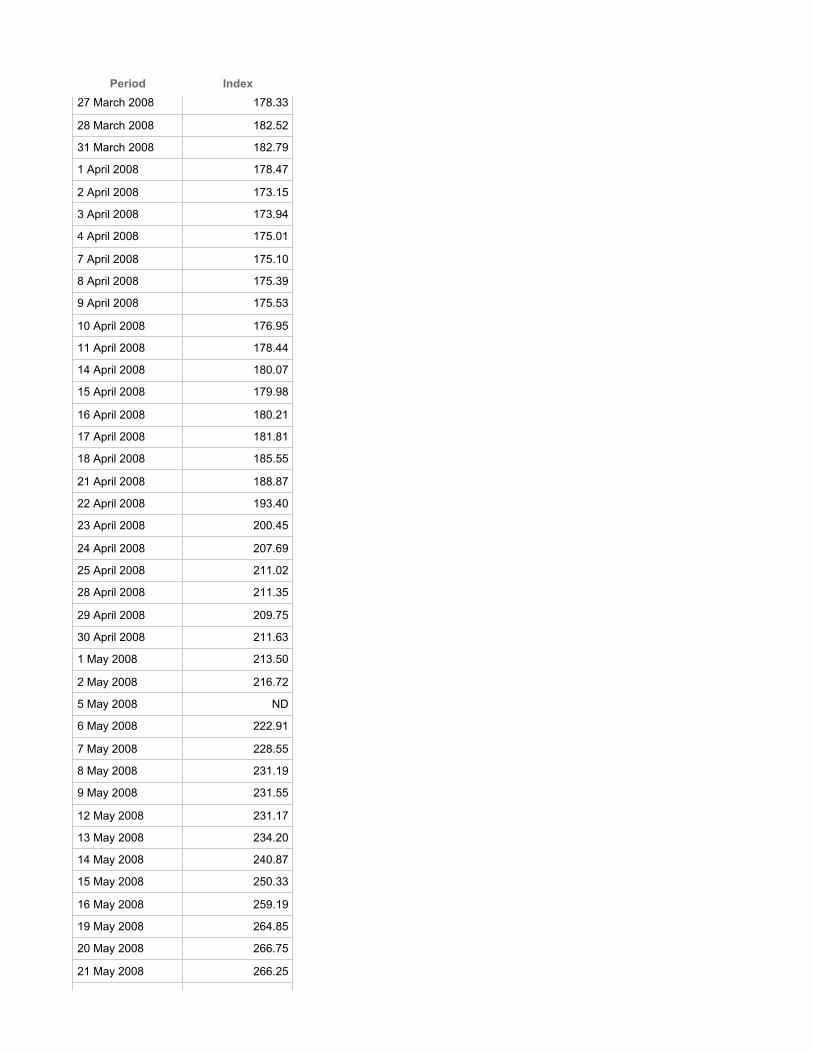
Period Index27 March 2008 178.33
28 March 2008 182.52
31 March 2008 182.79
1 April 2008 178.47
2 April 2008 173.15
3 April 2008 173.94
4 April 2008 175.01
7 April 2008 175.10
8 April 2008 175.39
9 April 2008 175.53
10 April 2008 176.95
11 April 2008 178.44
14 April 2008 180.07
15 April 2008 179.98
16 April 2008 180.21
17 April 2008 181.81
18 April 2008 185.55
21 April 2008 188.87
22 April 2008 193.40
23 April 2008 200.45
24 April 2008 207.69
25 April 2008 211.02
28 April 2008 211.35
29 April 2008 209.75
30 April 2008 211.63
1 May 2008 213.50
2 May 2008 216.72
5 May 2008 ND
6 May 2008 222.91
7 May 2008 228.55
8 May 2008 231.19
9 May 2008 231.55
12 May 2008 231.17
13 May 2008 234.20
14 May 2008 240.87
15 May 2008 250.33
16 May 2008 259.19
19 May 2008 264.85
20 May 2008 266.75
21 May 2008 266.25
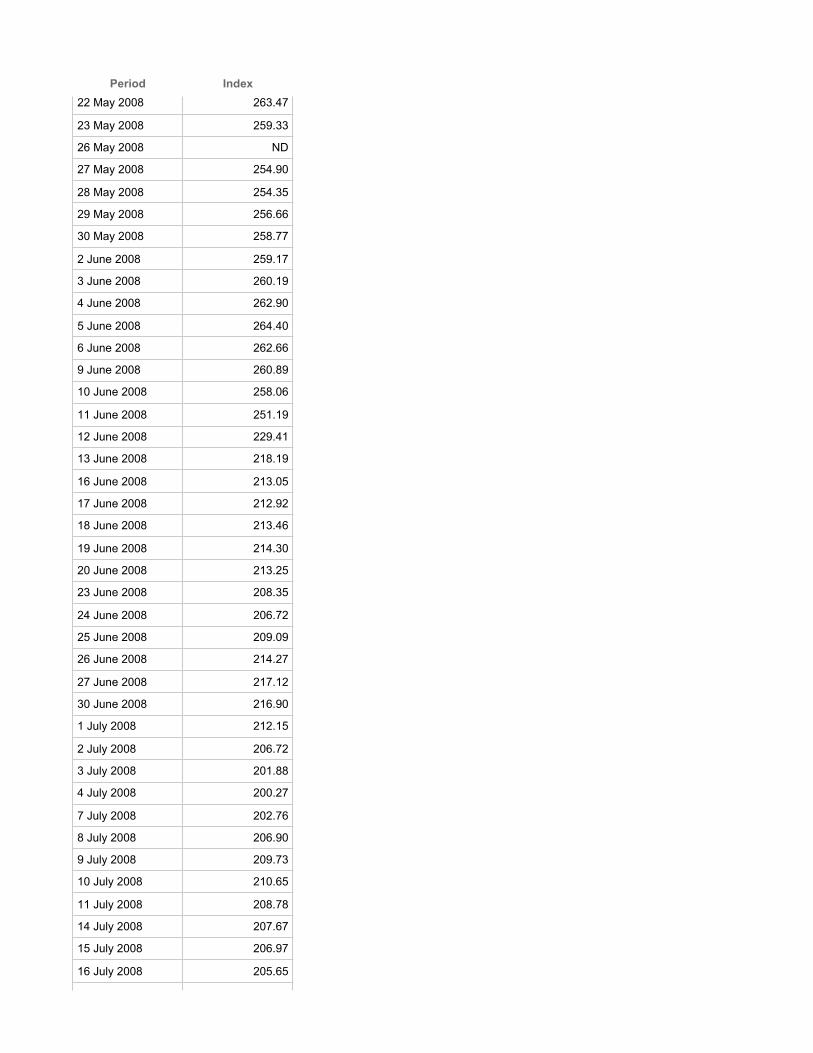
Period Index22 May 2008 263.47
23 May 2008 259.33
26 May 2008 ND
27 May 2008 254.90
28 May 2008 254.35
29 May 2008 256.66
30 May 2008 258.77
2 June 2008 259.17
3 June 2008 260.19
4 June 2008 262.90
5 June 2008 264.40
6 June 2008 262.66
9 June 2008 260.89
10 June 2008 258.06
11 June 2008 251.19
12 June 2008 229.41
13 June 2008 218.19
16 June 2008 213.05
17 June 2008 212.92
18 June 2008 213.46
19 June 2008 214.30
20 June 2008 213.25
23 June 2008 208.35
24 June 2008 206.72
25 June 2008 209.09
26 June 2008 214.27
27 June 2008 217.12
30 June 2008 216.90
1 July 2008 212.15
2 July 2008 206.72
3 July 2008 201.88
4 July 2008 200.27
7 July 2008 202.76
8 July 2008 206.90
9 July 2008 209.73
10 July 2008 210.65
11 July 2008 208.78
14 July 2008 207.67
15 July 2008 206.97
16 July 2008 205.65
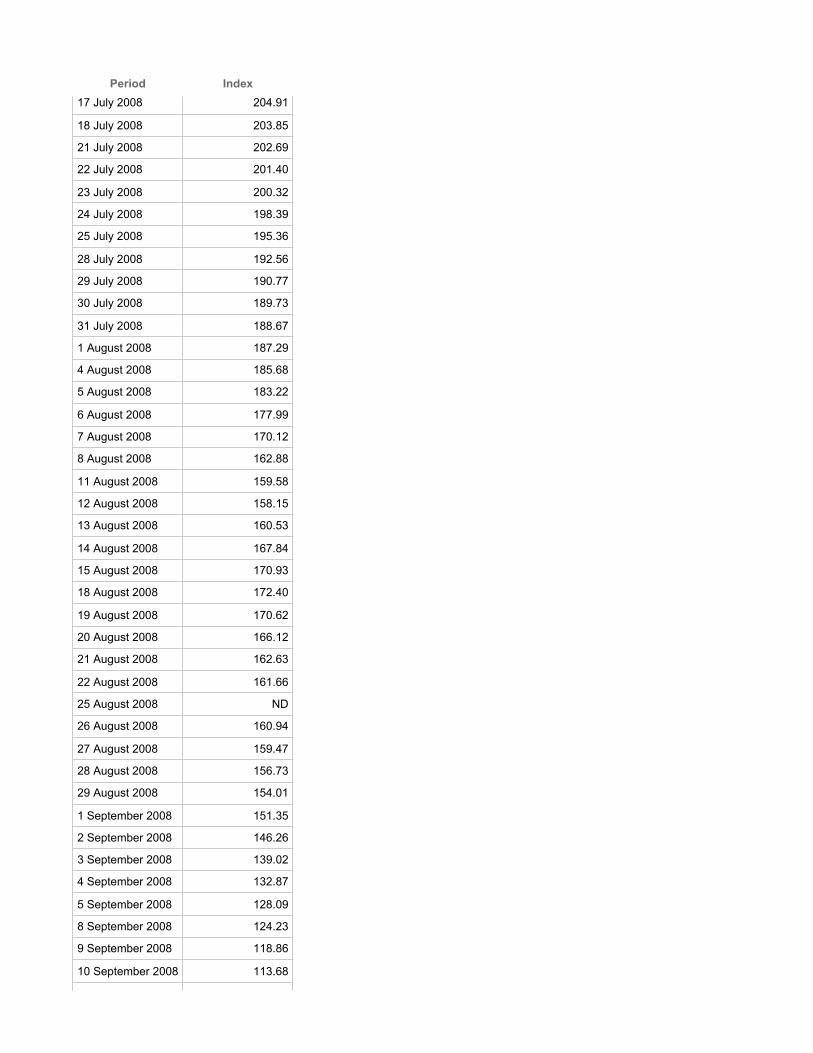
Period Index17 July 2008 204.91
18 July 2008 203.85
21 July 2008 202.69
22 July 2008 201.40
23 July 2008 200.32
24 July 2008 198.39
25 July 2008 195.36
28 July 2008 192.56
29 July 2008 190.77
30 July 2008 189.73
31 July 2008 188.67
1 August 2008 187.29
4 August 2008 185.68
5 August 2008 183.22
6 August 2008 177.99
7 August 2008 170.12
8 August 2008 162.88
11 August 2008 159.58
12 August 2008 158.15
13 August 2008 160.53
14 August 2008 167.84
15 August 2008 170.93
18 August 2008 172.40
19 August 2008 170.62
20 August 2008 166.12
21 August 2008 162.63
22 August 2008 161.66
25 August 2008 ND
26 August 2008 160.94
27 August 2008 159.47
28 August 2008 156.73
29 August 2008 154.01
1 September 2008 151.35
2 September 2008 146.26
3 September 2008 139.02
4 September 2008 132.87
5 September 2008 128.09
8 September 2008 124.23
9 September 2008 118.86
10 September 2008 113.68

Period Index11 September 2008 110.68
12 September 2008 108.57
15 September 2008 107.37
16 September 2008 107.67
17 September 2008 109.84
18 September 2008 112.15
19 September 2008 112.53
22 September 2008 111.94
23 September 2008 108.17
24 September 2008 101.54
25 September 2008 94.16
26 September 2008 84.73
29 September 2008 79.26
30 September 2008 72.77
1 October 2008 68.42
2 October 2008 67.63
3 October 2008 67.90
6 October 2008 67.68
7 October 2008 66.09
8 October 2008 62.52
9 October 2008 56.62
10 October 2008 50.24
13 October 2008 44.70
14 October 2008 40.92
15 October 2008 36.53
16 October 2008 34.06
17 October 2008 32.53
20 October 2008 30.65
21 October 2008 29.22
22 October 2008 27.62
23 October 2008 25.99
24 October 2008 24.93
27 October 2008 23.71
28 October 2008 22.21
29 October 2008 20.92
30 October 2008 20.02
31 October 2008 19.25
3 November 2008 18.71
4 November 2008 18.43
5 November 2008 18.68

Period Index6 November 2008 18.98
7 November 2008 18.75
10 November 2008 18.55
11 November 2008 18.50
12 November 2008 18.64
13 November 2008 18.95
14 November 2008 19.02
17 November 2008 19.36
18 November 2008 19.57
19 November 2008 19.43
20 November 2008 19.16
21 November 2008 18.91
24 November 2008 18.64
25 November 2008 18.19
26 November 2008 17.26
27 November 2008 16.58
28 November 2008 16.17
1 December 2008 15.83
2 December 2008 15.47
3 December 2008 15.20
4 December 2008 15.06
5 December 2008 15.00
8 December 2008 15.18
9 December 2008 15.36
10 December 2008 15.63
11 December 2008 16.08
12 December 2008 17.28
15 December 2008 18.16
16 December 2008 18.73
17 December 2008 18.91
18 December 2008 18.75
19 December 2008 18.50
22 December 2008 18.12
23 December 2008 17.73
24 December 2008 17.51
25 December 2008 ND
26 December 2008 ND
29 December 2008 ND
30 December 2008 ND
31 December 2008 ND

Period Index1 January 2009 ND
2 January 2009 17.48
5 January 2009 17.46
6 January 2009 17.53
7 January 2009 17.85
8 January 2009 18.57
9 January 2009 19.72
12 January 2009 20.11
13 January 2009 20.61
14 January 2009 20.81
15 January 2009 20.54
16 January 2009 19.93
19 January 2009 19.63
20 January 2009 19.72
21 January 2009 20.36
22 January 2009 21.38
23 January 2009 22.17
26 January 2009 22.51
27 January 2009 22.71
28 January 2009 22.94
29 January 2009 23.43
30 January 2009 24.20
2 February 2009 24.86
3 February 2009 25.97
4 February 2009 29.77
5 February 2009 33.88
6 February 2009 37.14
9 February 2009 41.05
10 February 2009 44.65
11 February 2009 46.48
12 February 2009 44.99
13 February 2009 43.16
16 February 2009 41.76
17 February 2009 42.86
18 February 2009 44.92
19 February 2009 46.53
20 February 2009 47.48
23 February 2009 47.14
24 February 2009 45.46
25 February 2009 44.33
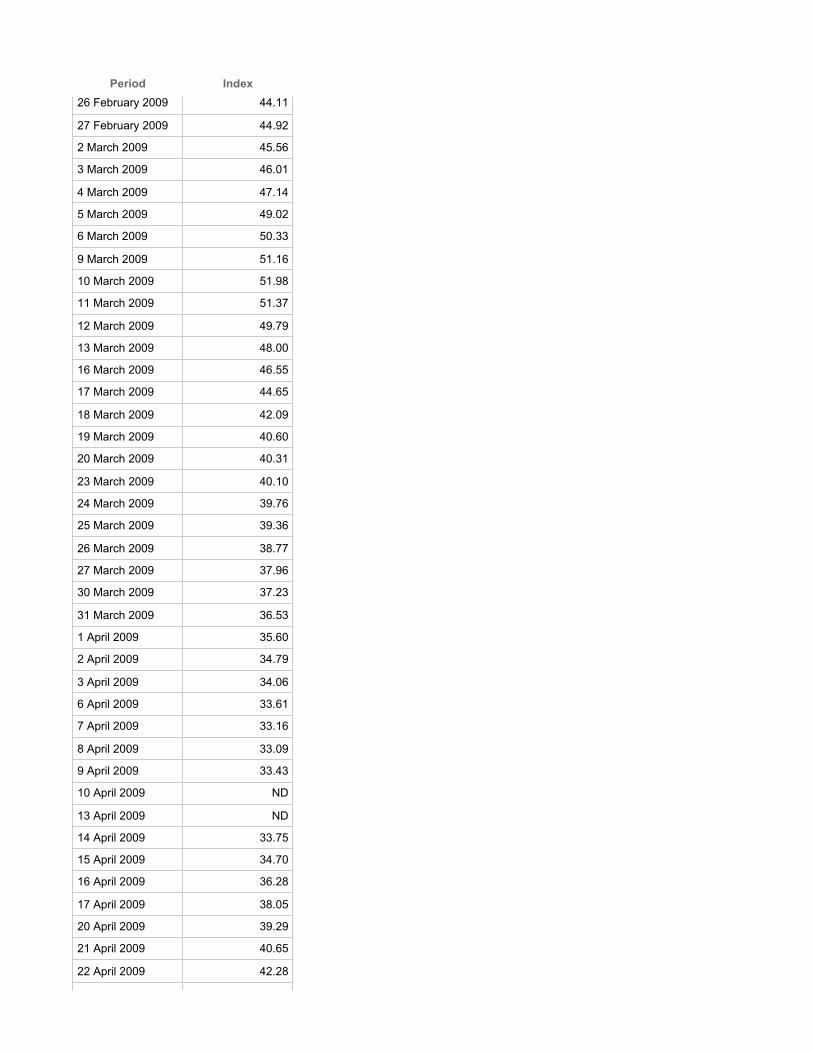
Period Index26 February 2009 44.11
27 February 2009 44.92
2 March 2009 45.56
3 March 2009 46.01
4 March 2009 47.14
5 March 2009 49.02
6 March 2009 50.33
9 March 2009 51.16
10 March 2009 51.98
11 March 2009 51.37
12 March 2009 49.79
13 March 2009 48.00
16 March 2009 46.55
17 March 2009 44.65
18 March 2009 42.09
19 March 2009 40.60
20 March 2009 40.31
23 March 2009 40.10
24 March 2009 39.76
25 March 2009 39.36
26 March 2009 38.77
27 March 2009 37.96
30 March 2009 37.23
31 March 2009 36.53
1 April 2009 35.60
2 April 2009 34.79
3 April 2009 34.06
6 April 2009 33.61
7 April 2009 33.16
8 April 2009 33.09
9 April 2009 33.43
10 April 2009 ND
13 April 2009 ND
14 April 2009 33.75
15 April 2009 34.70
16 April 2009 36.28
17 April 2009 38.05
20 April 2009 39.29
21 April 2009 40.65
22 April 2009 42.28

Period Index23 April 2009 42.91
24 April 2009 42.37
27 April 2009 41.60
28 April 2009 40.49
29 April 2009 40.08
30 April 2009 40.40
1 May 2009 40.85
4 May 2009 ND
5 May 2009 42.91
6 May 2009 46.71
7 May 2009 49.63
8 May 2009 50.08
11 May 2009 50.10
12 May 2009 50.96
13 May 2009 52.75
14 May 2009 55.01
15 May 2009 57.54
18 May 2009 58.92
19 May 2009 59.81
20 May 2009 60.28
21 May 2009 61.23
22 May 2009 63.02
25 May 2009 ND
26 May 2009 66.55
27 May 2009 71.57
28 May 2009 74.60
29 May 2009 79.03
1 June 2009 83.26
2 June 2009 92.87
3 June 2009 97.06
4 June 2009 92.58
5 June 2009 86.16
8 June 2009 82.47
9 June 2009 79.57
10 June 2009 78.08
11 June 2009 78.78
12 June 2009 81.05
15 June 2009 85.12
16 June 2009 89.37
17 June 2009 91.07

Period Index18 June 2009 92.13
19 June 2009 92.06
22 June 2009 91.13
Average 2003-2008: 102.29
Exhibit 7
Other Explanations for Recent Dollar MovementsTop-left panel10-Year Government BondsWeeklyPercent
Period United States United Kingdom Germany Japan
11 January 2008 3.85 4.42 4.11 1.45
18 January 2008 3.72 4.41 4.00 ND
25 January 2008 3.58 4.47 3.95 1.38
1 February 2008 3.67 4.52 3.96 1.44
8 February 2008 3.66 4.45 3.88 1.44
15 February 2008 3.72 4.59 3.94 ND
22 February 2008 3.85 4.67 4.01 1.46
29 February 2008 3.78 4.64 4.02 1.44
7 March 2008 3.61 4.41 3.82 1.36
14 March 2008 3.51 4.35 3.76 1.31
21 March 2008 3.39 4.31 3.74 ND
28 March 2008 3.52 4.41 3.88 1.27
4 April 2008 3.55 4.43 3.96 1.34
11 April 2008 3.54 4.48 3.99 1.34
18 April 2008 3.67 4.55 4.02 1.35
25 April 2008 3.81 4.72 4.15 1.49
2 May 2008 3.83 4.69 4.16 ND
9 May 2008 3.85 4.66 4.11 ND
16 May 2008 3.86 4.75 4.13 1.65
23 May 2008 3.84 4.88 4.25 1.67
30 May 2008 4.03 4.97 4.36 1.78
6 June 2008 3.98 4.99 4.41 1.75
13 June 2008 4.15 5.16 4.56 1.80
20 June 2008 4.20 5.18 4.63 1.81
27 June 2008 4.09 5.09 4.57 1.68
4 July 2008 4.00 5.08 4.59 1.66
11 July 2008 3.90 4.89 4.42 1.62

Period United States United Kingdom Germany Japan
18 July 2008 3.98 4.91 4.44 1.58
25 July 2008 4.11 5.01 4.62 ND
1 August 2008 4.04 4.87 4.42 1.54
8 August 2008 3.99 4.74 4.30 1.51
15 August 2008 3.91 4.63 4.22 1.45
22 August 2008 3.83 4.58 4.17 1.44
29 August 2008 3.79 4.51 4.15 1.42
5 September 2008 3.69 4.46 4.10 1.47
12 September 2008 3.66 4.49 4.09 1.51
19 September 2008 3.54 4.46 4.06 ND
26 September 2008 3.84 4.62 4.21 1.48
3 October 2008 3.70 4.41 3.97 1.49
10 October 2008 3.69 4.32 3.84 1.44
17 October 2008 4.02 4.70 4.08 ND
24 October 2008 3.74 4.51 3.86 1.53
31 October 2008 3.92 4.43 3.79 1.49
7 November 2008 3.82 4.38 3.76 1.50
14 November 2008 3.78 4.14 3.66 1.50
21 November 2008 3.38 3.99 3.53 1.46
28 November 2008 3.10 3.83 3.32 ND
5 December 2008 2.66 3.49 3.07 1.37
12 December 2008 2.67 3.59 3.22 1.40
19 December 2008 2.26 3.29 3.06 1.31
26 December 2008 2.18 3.08 2.94 ND
2 January 2009 2.24 3.05 2.94 ND
Note: As shown in the figure, the series extend to about June 19, 2009. United States generally increases to end at about 3.7. United Kingdom generally increases to about 3.75 by early February, decreases to nearly 3.0 by mid-March, and increases to end at about 3.85. Germany generally increases to end at about 3.5. Japan generally increases to end at about 1.5.
Top-right panelFive-Year Sovereign CDS PremiumsDailyBasis points
Period United States United Kingdom Germany Japan
2 January 2009 60.86 105.15 45.23 42.76
5 January 2009 62.08 109.13 45.31 41.88
6 January 2009 60.46 107.92 43.70 37.70
7 January 2009 59.46 102.10 40.12 37.93
8 January 2009 55.76 100.63 40.45 38.02
9 January 2009 54.24 101.70 43.64 37.62
12 January 2009 54.86 102.54 44.36 37.62
13 January 2009 56.25 107.25 46.13 38.82

Period United States United Kingdom Germany Japan14 January 2009 59.60 115.02 50.26 39.27
15 January 2009 58.89 118.90 51.44 40.23
16 January 2009 61.13 125.70 53.54 40.29
19 January 2009 65.13 126.42 53.79 41.50
20 January 2009 66.48 143.90 57.28 40.00
21 January 2009 62.71 147.70 59.44 40.94
22 January 2009 71.69 135.58 58.83 43.33
23 January 2009 70.67 141.56 61.76 41.43
26 January 2009 71.00 135.44 60.14 41.43
27 January 2009 66.97 129.42 56.56 42.14
28 January 2009 65.58 124.58 57.56 41.80
29 January 2009 65.58 122.64 56.79 43.37
30 January 2009 62.85 123.44 57.01 46.39
2 February 2009 62.86 125.83 57.42 53.97
3 February 2009 76.13 128.83 57.48 55.38
4 February 2009 77.00 126.56 57.78 52.81
5 February 2009 79.50 126.72 57.89 53.95
6 February 2009 79.50 126.60 61.34 55.53
9 February 2009 77.50 126.45 61.17 56.04
10 February 2009 77.83 126.25 61.45 57.59
11 February 2009 77.83 126.66 61.81 57.59
12 February 2009 80.00 134.50 63.19 69.30
13 February 2009 79.50 144.58 65.44 75.80
16 February 2009 80.00 148.17 65.43 78.07
17 February 2009 81.50 164.50 72.99 118.99
18 February 2009 89.75 162.63 84.09 105.39
19 February 2009 89.83 157.54 85.63 99.51
20 February 2009 90.00 163.28 90.38 100.74
23 February 2009 99.75 162.61 89.49 96.04
24 February 2009 97.00 164.63 91.38 96.56
25 February 2009 93.67 164.02 90.35 96.75
26 February 2009 90.75 148.94 87.73 94.76
27 February 2009 92.25 145.30 84.88 96.34
2 March 2009 93.00 149.13 85.77 95.97
3 March 2009 94.75 154.30 87.28 104.96
4 March 2009 94.67 154.88 86.93 101.55
5 March 2009 97.50 155.24 87.67 95.81
6 March 2009 100.25 158.00 89.67 112.74
9 March 2009 97.33 159.30 90.46 105.23
10 March 2009 92.33 154.38 87.58 113.16
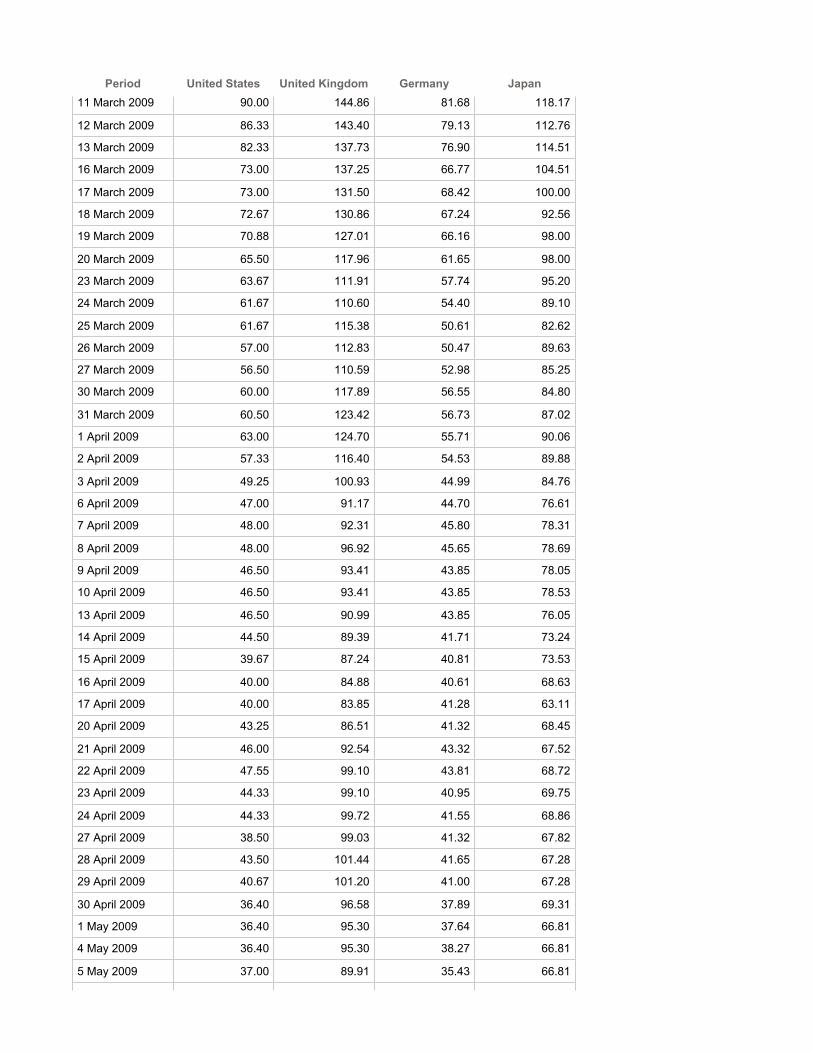
Period United States United Kingdom Germany Japan11 March 2009 90.00 144.86 81.68 118.17
12 March 2009 86.33 143.40 79.13 112.76
13 March 2009 82.33 137.73 76.90 114.51
16 March 2009 73.00 137.25 66.77 104.51
17 March 2009 73.00 131.50 68.42 100.00
18 March 2009 72.67 130.86 67.24 92.56
19 March 2009 70.88 127.01 66.16 98.00
20 March 2009 65.50 117.96 61.65 98.00
23 March 2009 63.67 111.91 57.74 95.20
24 March 2009 61.67 110.60 54.40 89.10
25 March 2009 61.67 115.38 50.61 82.62
26 March 2009 57.00 112.83 50.47 89.63
27 March 2009 56.50 110.59 52.98 85.25
30 March 2009 60.00 117.89 56.55 84.80
31 March 2009 60.50 123.42 56.73 87.02
1 April 2009 63.00 124.70 55.71 90.06
2 April 2009 57.33 116.40 54.53 89.88
3 April 2009 49.25 100.93 44.99 84.76
6 April 2009 47.00 91.17 44.70 76.61
7 April 2009 48.00 92.31 45.80 78.31
8 April 2009 48.00 96.92 45.65 78.69
9 April 2009 46.50 93.41 43.85 78.05
10 April 2009 46.50 93.41 43.85 78.53
13 April 2009 46.50 90.99 43.85 76.05
14 April 2009 44.50 89.39 41.71 73.24
15 April 2009 39.67 87.24 40.81 73.53
16 April 2009 40.00 84.88 40.61 68.63
17 April 2009 40.00 83.85 41.28 63.11
20 April 2009 43.25 86.51 41.32 68.45
21 April 2009 46.00 92.54 43.32 67.52
22 April 2009 47.55 99.10 43.81 68.72
23 April 2009 44.33 99.10 40.95 69.75
24 April 2009 44.33 99.72 41.55 68.86
27 April 2009 38.50 99.03 41.32 67.82
28 April 2009 43.50 101.44 41.65 67.28
29 April 2009 40.67 101.20 41.00 67.28
30 April 2009 36.40 96.58 37.89 69.31
1 May 2009 36.40 95.30 37.64 66.81
4 May 2009 36.40 95.30 38.27 66.81
5 May 2009 37.00 89.91 35.43 66.81

Period United States United Kingdom Germany Japan6 May 2009 34.67 81.57 33.40 66.81
7 May 2009 27.00 70.75 24.50 56.72
8 May 2009 22.00 58.88 23.40 54.43
11 May 2009 22.50 60.88 23.33 49.22
12 May 2009 23.00 60.98 24.64 49.83
13 May 2009 28.00 67.25 28.87 49.75
14 May 2009 31.00 72.24 32.83 49.75
15 May 2009 31.00 69.60 32.38 49.13
18 May 2009 36.15 75.98 35.79 53.46
19 May 2009 30.00 73.57 32.67 49.63
20 May 2009 29.00 72.32 30.40 49.63
21 May 2009 32.67 80.00 34.10 47.20
22 May 2009 32.00 82.45 36.88 42.93
25 May 2009 32.00 82.45 36.88 40.00
26 May 2009 36.00 83.03 37.08 37.40
27 May 2009 38.67 85.52 38.25 37.55
28 May 2009 45.50 88.64 39.86 38.04
29 May 2009 44.00 86.34 39.25 39.28
1 June 2009 40.50 83.20 36.17 39.62
2 June 2009 38.67 79.90 33.60 34.52
3 June 2009 39.91 80.39 33.50 34.52
4 June 2009 40.63 83.46 35.00 36.46
5 June 2009 40.00 85.20 34.00 36.62
8 June 2009 40.75 85.39 34.85 36.90
9 June 2009 40.67 87.37 35.05 37.84
10 June 2009 40.67 84.75 35.00 38.81
11 June 2009 40.67 85.38 33.75 39.06
12 June 2009 40.00 86.17 33.75 44.78
15 June 2009 41.50 85.46 34.00 42.55
16 June 2009 42.50 87.67 34.50 42.63
17 June 2009 41.70 90.29 35.50 46.52
18 June 2009 41.88 90.00 36.77 46.92
19 June 2009 44.25 86.31 36.25 47.10
22 June 2009 42.82 87.83 36.73 43.74
U.S. External SectorMiddle-left panelTrade in Real Goods and Services
2008 20092010p
Q1-Q3 Q4 Q1e Q2p H2p

2008 20092010p
Q1-Q3 Q4 Q1e Q2p H2p
Contribution to Real GDP Growth (percentage points, a.r.*)
1. Net Exports 1.6 -0.1 2.1 1.1 -0.6 -0.3
Growth Rates (percent, a.r.*)
2. Imports -3.9 -17.5 -36.3 -12.2 6.7 5.3
3. Exports 6.7 -23.6 -30.6 -5.4 3.0 4.0
* Change from final quarter of preceding period to final quarter of period indicated. Return to table
Middle-right panelReal GDPPercent change, a.r.*
Period Total foreign United States
2008:Q4 -7.2 -6.4
2009:Q1 -8.5 -5.5
2009:Q2 -1.4 -1.0
2009:H2 1.7 1.1
2010 3.1 3.0
* Approximate change from final quarter of preceding period to final quarter of period indicated. Return to table
Bottom-left panelCurrent Account
Period Percent of GDP Billions of dollars
2005:Q1 -5.74 -697.88
2005:Q2 -5.82 -716.24
2005:Q3 -5.91 -741.35
2005:Q4 -6.61 -839.26
2006:Q1 -6.13 -794.60
2006:Q2 -6.15 -808.31
2006:Q3 -6.48 -859.16
2006:Q4 -5.63 -752.12
2007:Q1 -5.89 -796.40
2007:Q2 -5.55 -762.12
2007:Q3 -4.92 -686.46
2007:Q4 -4.71 -661.32
2008:Q1 -5.07 -717.19
2008:Q2 -5.25 -750.88
2008:Q3 -5.11 -736.71
2008:Q4 -4.36 -619.50
2009:Q1 -2.88 -405.99
Forecast
2009:Q2 -3.35 -470.88

Period Percent of GDP Billions of dollars
2009:Q3 -3.60 -507.92
2009:Q4 -3.87 -551.02
2010:Q1 -4.13 -592.74
2010:Q2 -3.92 -568.92
2010:Q3 -3.88 -568.37
2010:Q4 -4.10 -607.11
Bottom-right panelOil Import Balance
Period Percent of GDP Billions of dollars
2005:Q1 -1.76 -214.18
2005:Q2 -1.87 -230.10
2005:Q3 -2.13 -266.75
2005:Q4 -2.33 -296.40
2006:Q1 -2.25 -291.44
2006:Q2 -2.38 -312.86
2006:Q3 -2.50 -331.77
2006:Q4 -2.05 -273.65
2007:Q1 -2.09 -281.80
2007:Q2 -2.27 -311.16
2007:Q3 -2.36 -329.24
2007:Q4 -2.86 -401.70
2008:Q1 -3.18 -450.25
2008:Q2 -3.48 -497.68
2008:Q3 -3.63 -523.39
2008:Q4 -2.41 -341.79
2009:Q1 -1.48 -208.90
Forecast
2009:Q2 -1.72 -241.88
2009:Q3 -1.93 -272.72
2009:Q4 -2.12 -301.18
2010:Q1 -2.18 -313.61
2010:Q2 -2.07 -300.73
2010:Q3 -1.96 -287.66
2010:Q4 -2.19 -323.69
Exhibit 8Outlook for Growth in the Advanced Foreign Economies
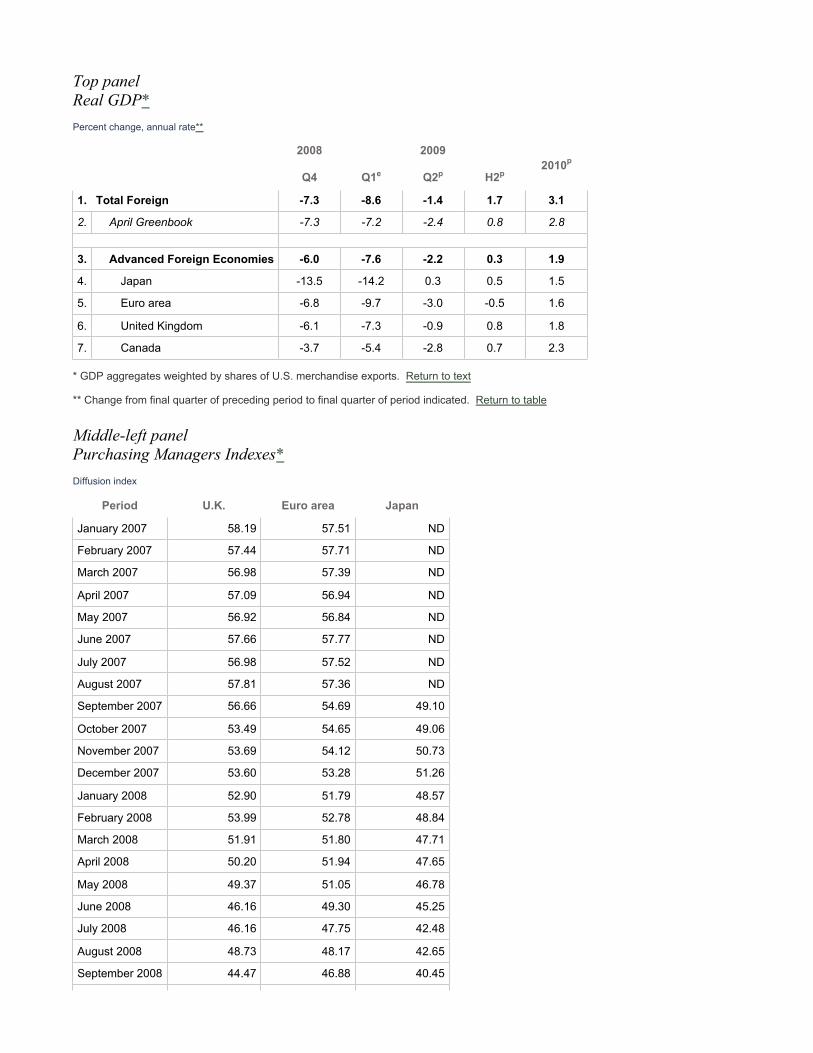
Top panelReal GDP*Percent change, annual rate**
2008 20092010p
Q4 Q1e Q2p H2p
1. Total Foreign -7.3 -8.6 -1.4 1.7 3.1
2. April Greenbook -7.3 -7.2 -2.4 0.8 2.8
3. Advanced Foreign Economies -6.0 -7.6 -2.2 0.3 1.9
4. Japan -13.5 -14.2 0.3 0.5 1.5
5. Euro area -6.8 -9.7 -3.0 -0.5 1.6
6. United Kingdom -6.1 -7.3 -0.9 0.8 1.8
7. Canada -3.7 -5.4 -2.8 0.7 2.3
* GDP aggregates weighted by shares of U.S. merchandise exports. Return to text
** Change from final quarter of preceding period to final quarter of period indicated. Return to table
Middle-left panelPurchasing Managers Indexes*Diffusion index
Period U.K. Euro area Japan
January 2007 58.19 57.51 ND
February 2007 57.44 57.71 ND
March 2007 56.98 57.39 ND
April 2007 57.09 56.94 ND
May 2007 56.92 56.84 ND
June 2007 57.66 57.77 ND
July 2007 56.98 57.52 ND
August 2007 57.81 57.36 ND
September 2007 56.66 54.69 49.10
October 2007 53.49 54.65 49.06
November 2007 53.69 54.12 50.73
December 2007 53.60 53.28 51.26
January 2008 52.90 51.79 48.57
February 2008 53.99 52.78 48.84
March 2008 51.91 51.80 47.71
April 2008 50.20 51.94 47.65
May 2008 49.37 51.05 46.78
June 2008 46.16 49.30 45.25
July 2008 46.16 47.75 42.48
August 2008 48.73 48.17 42.65
September 2008 44.47 46.88 40.45
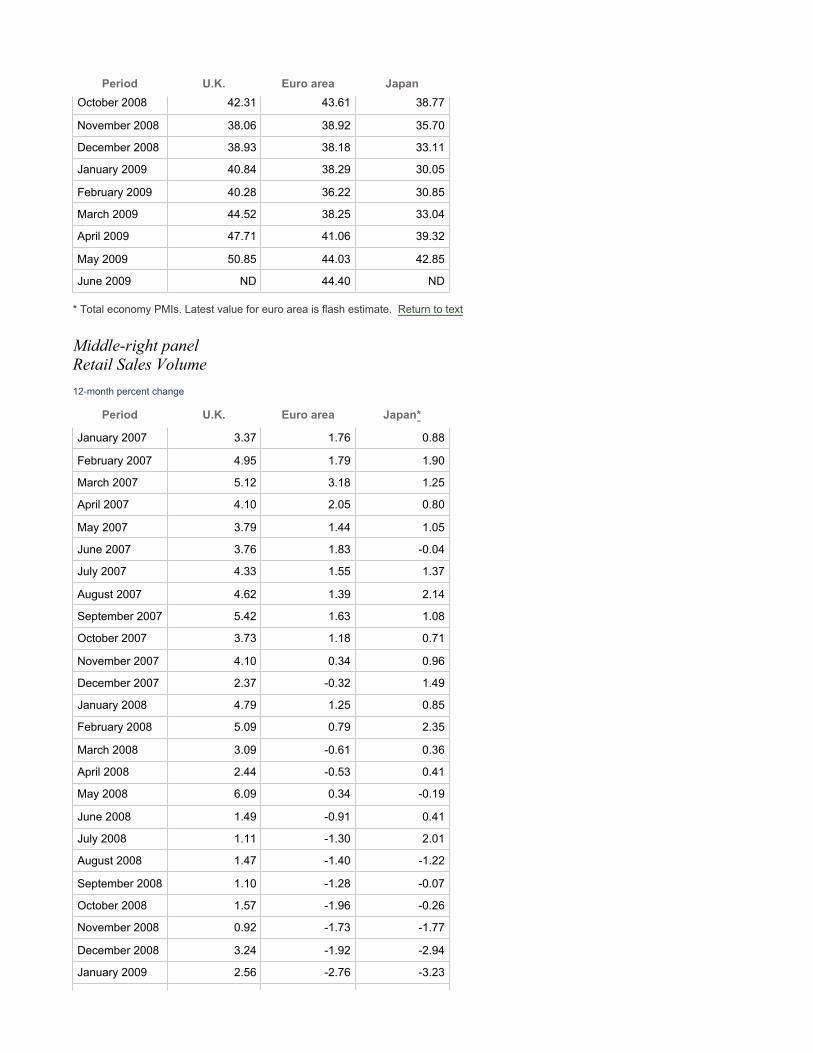
Period U.K. Euro area JapanOctober 2008 42.31 43.61 38.77
November 2008 38.06 38.92 35.70
December 2008 38.93 38.18 33.11
January 2009 40.84 38.29 30.05
February 2009 40.28 36.22 30.85
March 2009 44.52 38.25 33.04
April 2009 47.71 41.06 39.32
May 2009 50.85 44.03 42.85
June 2009 ND 44.40 ND
* Total economy PMIs. Latest value for euro area is flash estimate. Return to text
Middle-right panelRetail Sales Volume12-month percent change
Period U.K. Euro area Japan*
January 2007 3.37 1.76 0.88
February 2007 4.95 1.79 1.90
March 2007 5.12 3.18 1.25
April 2007 4.10 2.05 0.80
May 2007 3.79 1.44 1.05
June 2007 3.76 1.83 -0.04
July 2007 4.33 1.55 1.37
August 2007 4.62 1.39 2.14
September 2007 5.42 1.63 1.08
October 2007 3.73 1.18 0.71
November 2007 4.10 0.34 0.96
December 2007 2.37 -0.32 1.49
January 2008 4.79 1.25 0.85
February 2008 5.09 0.79 2.35
March 2008 3.09 -0.61 0.36
April 2008 2.44 -0.53 0.41
May 2008 6.09 0.34 -0.19
June 2008 1.49 -0.91 0.41
July 2008 1.11 -1.30 2.01
August 2008 1.47 -1.40 -1.22
September 2008 1.10 -1.28 -0.07
October 2008 1.57 -1.96 -0.26
November 2008 0.92 -1.73 -1.77
December 2008 3.24 -1.92 -2.94
January 2009 2.56 -2.76 -3.23

Period U.K. Euro area Japan*February 2009 -1.53 -3.25 -6.40
March 2009 0.91 -2.70 -3.74
April 2009 2.66 -2.19 -2.86
May 2009 -1.68 ND ND
* Monthly real consumption. Return to table
Bottom-left panelContributions of Fiscal StimulusPercentage points, Q4/Q4
Period Japan U.K. Euro area U.S.
2009 1.50 0.70 0.80 1.05
2010 0.10 -1.00 0.40 0.75
Note: Values are approximate.
Source: Staff estimates.
Bottom-center panelUnemployment Rate*Percent
Period U.S. U.K. Euro area Japan
January 2007 4.6 5.5 7.8 4.0
February 2007 4.5 5.5 7.7 4.0
March 2007 4.4 5.5 7.6 4.0
April 2007 4.5 5.4 7.5 3.9
May 2007 4.5 5.4 7.5 3.8
June 2007 4.6 5.3 7.4 3.7
July 2007 4.7 5.3 7.5 3.6
August 2007 4.7 5.3 7.4 3.8
September 2007 4.7 5.3 7.4 4.0
October 2007 4.8 5.3 7.4 4.0
November 2007 4.7 5.2 7.3 3.8
December 2007 4.9 5.2 7.3 3.7
January 2008 4.9 5.2 7.3 3.8
February 2008 4.8 5.2 7.2 3.9
March 2008 5.1 5.3 7.2 3.8
April 2008 5.0 5.2 7.3 4.0
May 2008 5.5 5.4 7.4 4.0
June 2008 5.6 5.5 7.4 4.1
July 2008 5.8 5.7 7.5 4.0
August 2008 6.2 5.8 7.6 4.1
September 2008 6.2 6.0 7.7 4.0

Period U.S. U.K. Euro area JapanOctober 2008 6.6 6.1 7.8 3.8
November 2008 6.8 6.3 8.0 4.0
December 2008 7.2 6.5 8.2 4.3
January 2009 7.6 6.7 8.4 4.1
February 2009 8.1 7.1 8.7 4.4
March 2009 8.5 7.2 8.9 4.8
April 2009 8.9 ND 9.2 5.0
May 2009 9.4 ND ND ND
Forecast
2009:Q1 ND 7.10 ND ND
2009:Q2 9.3 7.89 9.15 5.00
2009:Q3 9.8 8.63 9.59 5.30
2009:Q4 10.0 9.15 9.98 5.59
2010:Q1 10.0 9.43 10.29 5.83
2010:Q2 9.9 9.59 10.54 5.92
2010:Q3 9.8 9.66 10.73 6.00
2010:Q4 9.7 9.68 10.86 6.04
2011:Q1 9.5 9.64 10.95 6.06
2011:Q2 9.3 9.55 11.01 6.07
2011:Q3 9.2 9.44 11.03 6.07
2011:Q4 9.0 9.32 11.02 6.06
* Greenbook forecast for U.S.; forecasts from simple regression for others. Return to text
Bottom-right panelOutput GapsPercent*
Period U.S. AFE
2008:Q1 -0.77 0.62
2008:Q2 -0.67 -0.01
2008:Q3 -1.38 -0.75
2008:Q4 -3.56 -2.82
2009:Q1 -5.38 -5.20
Forecast
2009:Q2 -6.06 -6.20
2009:Q3 -6.36 -6.69
2009:Q4 -6.45 -6.98
2010:Q1 -6.38 -7.09
2010:Q2 -6.20 -7.15
2010:Q3 -5.93 -7.11
2010:Q4 -5.61 -7.02

* Deviation from potential GDP. Return to table
Exhibit 9 (Last)Outlook for Growth in the Emerging Market Economies
Top panelReal GDP*Percent change, annual rate**
2008 20092010p
Q4 Q1e Q2p H2p
1. Emerging Market Economies -8.8 -9.8 -0.4 3.4 4.5
2. China 1.6 6.5 7.0 7.7 8.9
3. Other Emerging Asia -14.0 -6.6 0.6 2.1 4.4
4. Mexico -9.8 -21.5 -5.2 3.7 3.4
5. Other Latin America -7.4 -5.0 -0.0 1.9 3.0
* GDP aggregates weighted by shares of U.S. merchandise exports. Return to text
** Change from final quarter of preceding period to final quarter of period indicated. Return to table
ChinaMiddle-left panelRecent Indicators12-month percent change, except as noted
Period Investment* Retail sales volume PMI(Diffusion index)
January 2007 23.44 10.75 55.1
February 2007 23.44 14.68 53.1
March 2007 26.83 12.52 56.1
April 2007 25.85 13.06 58.6
May 2007 27.06 13.18 55.7
June 2007 28.45 12.39 54.5
July 2007 26.39 11.49 53.3
August 2007 27.34 11.31 54.0
September 2007 24.78 11.54 56.1
October 2007 30.72 12.14 53.2
November 2007 26.07 12.08 55.4
December 2007 18.71 13.84 55.3
January 2008 24.27 14.14 53.0
February 2008 24.27 10.19 53.4
March 2008 27.31 12.71 58.4
April 2008 25.37 12.88 59.2

Period Investment* Retail sales volume PMI(Diffusion index)
May 2008 25.44 13.12 53.3
June 2008 29.49 14.85 52.0
July 2008 29.23 15.45 48.4
August 2008 28.09 16.78 48.4
September 2008 29.02 16.99 51.2
October 2008 24.39 16.66 44.6
November 2008 23.81 17.63 38.8
December 2008 22.27 17.36 41.2
January 2009 26.53 17.68 45.3
February 2009 26.53 13.41 49.0
March 2009 30.31 16.45 52.4
April 2009 33.96 16.98 53.5
May 2009 38.67 17.45 53.1
* Staff estimate from year to date figures. Return to table
Middle-right panelImports and Electricity ProductionQuarterlyPercent change, s.a.a.r.
Period Imports** Electricity production
2005:Q1 10.14 15.22
2005:Q2 35.42 9.01
2005:Q3 5.78 8.27
2005:Q4 47.13 15.50
2006:Q1 17.55 22.15
2006:Q2 7.16 6.67
2006:Q3 13.46 22.10
2006:Q4 28.12 11.72
2007:Q1 31.08 10.21
2007:Q2 1.20 26.57
2007:Q3 17.03 16.80
2007:Q4 64.81 11.98
2008:Q1 50.61 10.21
2008:Q2 3.74 8.45
2008:Q3 -7.60 -3.53
2008:Q4 -50.51 -32.05
2009:Q1* -51.4 18.5
2009:Q2* 45.7 19.2
* 2009:Q1 values are approximate. 2009:Q2 values are approximate average of April and May at annual rate. Return to table
** Source: Haver Analytics. In nominal U.S. dollars. Return to table

Other Emerging Market EconomiesBottom-left panelPurchasing Managers Indexes*Diffusion index
Period India Brazil Singapore
January 2007 55.29 52.83 52.60
February 2007 53.63 53.67 51.50
March 2007 53.00 54.90 51.10
April 2007 53.81 55.35 49.70
May 2007 53.37 54.29 50.00
June 2007 53.24 54.93 52.30
July 2007 52.91 54.80 53.30
August 2007 57.93 54.85 51.70
September 2007 59.28 56.36 53.90
October 2007 61.66 57.25 52.90
November 2007 60.85 56.45 53.80
December 2007 61.85 55.33 51.00
January 2008 60.66 54.74 50.50
February 2008 59.45 53.36 50.30
March 2008 57.49 52.79 49.40
April 2008 57.47 54.02 49.30
May 2008 57.45 53.53 49.00
June 2008 58.63 52.11 50.60
July 2008 57.76 53.51 51.60
August 2008 57.95 51.12 50.60
September 2008 57.28 50.35 49.50
October 2008 52.19 45.68 45.80
November 2008 45.76 41.60 44.30
December 2008 44.37 40.04 44.80
January 2009 46.69 38.13 45.00
February 2009 47.03 41.60 45.00
March 2009 49.46 42.18 47.10
April 2009 53.27 44.81 49.20
May 2009 55.74 47.80 51.20
* Manufacturing sector. Return to text
Bottom-center panelIndustrial ProductionIndex, Jan. 2007 = 100
Period Brazil Mexico Korea Taiwan
January 2007 100.00 100.00 100.00 100.00

Period Brazil Mexico Korea TaiwanFebruary 2007 100.97 100.18 101.26 102.97
March 2007 102.28 102.64 99.73 102.95
April 2007 102.33 101.14 100.72 104.48
May 2007 103.68 101.58 102.79 107.53
June 2007 104.02 102.11 103.06 108.27
July 2007 103.92 101.85 104.32 112.98
August 2007 105.69 101.76 105.76 110.08
September 2007 104.57 102.28 105.58 110.60
October 2007 109.06 101.85 109.27 112.89
November 2007 106.87 100.79 109.81 113.38
December 2007 106.23 102.72 110.17 114.09
January 2008 107.95 102.99 111.88 116.21
February 2008 107.54 102.64 111.61 117.31
March 2008 108.18 103.08 111.97 115.08
April 2008 108.35 101.85 111.88 115.21
May 2008 107.35 101.58 111.97 113.00
June 2008 110.51 101.85 111.88 112.95
July 2008 111.93 100.79 110.44 110.64
August 2008 110.34 101.67 109.00 110.93
September 2008 111.87 99.12 109.72 105.46
October 2008 110.30 99.21 106.93 97.16
November 2008 102.46 97.45 96.13 84.95
December 2008 89.48 95.08 86.86 78.21
January 2009 91.38 93.06 88.30 75.81
February 2009 93.16 93.23 94.60 78.23
March 2009 93.99 91.65 99.19 85.49
April 2009 95.06 92.53 101.80 91.13
Bottom-right panelExportsIndex, Jan. 2007 = 100
Period Mexico Korea Singapore
January 2007 100.00 100.00 100.00
February 2007 102.90 98.36 90.86
March 2007 101.32 100.58 96.75
April 2007 103.37 101.62 97.54
May 2007 105.50 102.50 96.90
June 2007 105.45 105.27 98.86
July 2007 107.18 105.98 104.20
August 2007 108.76 107.64 101.12
September 2007 112.23 97.04 100.89

Period Mexico Korea SingaporeOctober 2007 110.81 110.74 110.97
November 2007 116.59 115.03 111.00
December 2007 117.00 113.34 109.88
January 2008 119.65 115.14 121.79
February 2008 116.12 117.04 116.47
March 2008 123.69 119.05 111.28
April 2008 121.09 128.33 126.13
May 2008 120.37 129.04 121.56
June 2008 120.91 122.02 123.06
July 2008 128.57 143.84 133.79
August 2008 118.24 126.48 117.94
September 2008 113.57 123.17 118.88
October 2008 107.48 119.10 105.57
November 2008 100.13 92.50 93.81
December 2008 88.51 93.58 86.35
January 2009 86.12 75.92 72.40
February 2009 85.64 95.49 82.57
March 2009 84.81 92.89 79.75
April 2009 84.68 103.25 84.57
May 2009 ND 92.34 84.31
Appendix 7: Materials used by Mr. Madigan
Material for Briefing on FOMC Participants' Economic ProjectionsBrian MadiganJune 23-24, 2009
Class I FOMC - Restricted Controlled (FR)
Exhibit 1.Economic Projections of Federal Reserve Governors and Reserve Bank Presidents, June 2009(Percent)
VariableCentral tendency Range
2009 2010 2011 Longer Run 2009 2010 2011 Longer
Run
Change in real GDP (Q4/Q4)
June projection -1.5 to -1.0 2.1 to 3.3 3.8 to 4.6 2.5 to 2.7 -2.0 to -0.6 0.8 to 4.0 2.3 to 5.0 2.4 to 2.8
April projection -2.0 to -1.3 2.0 to 3.0 3.5 to 4.8 2.5 to 2.7 -2.5 to -0.5 1.5 to 4.0 2.3 to 5.0 2.4 to 3.0

VariableCentral tendency Range
2009 2010 2011 Longer Run 2009 2010 2011 Longer
RunMemo: June Greenbook
-1.1 3.0 4.8 2.5
Unemployment rate (Q4)
June projection 9.8 to 10.1 9.5 to 9.8 8.4 to 8.8 4.8 to 5.0 9.7 to 10.5 8.5 to 10.6 6.8 to 9.2 4.5 to 6.0
April projection 9.2 to 9.6 9.0 to 9.5 7.7 to 8.5 4.8 to 5.0 9.1 to 10.0 8.0 to 9.6 6.5 to 9.0 4.5 to 5.3
Memo: June Greenbook 10.0 9.7 8.0 5.0
PCE inflation (Q4/Q4)
PCE inflation 1.0 to 1.4 1.2 to 1.8 1.1 to 2.0 1.7 to 2.0 1.0 to 1.8 0.9 to 2.0 0.5 to 2.5 1.5 to 2.1
April projection 0.6 to 0.9 1.0 to 1.6 1.0 to 1.9 1.7 to 2.0 -0.5 to 1.2 0.7 to 2.0 0.5 to 2.5 1.5 to 2.0
Memo: June Greenbook 1.4 1.1 1.2 2.0
Core PCE inflation (Q4/Q4)
Core PCE inflation 1.3 to 1.6 1.0 to 1.5 0.9 to 1.7 1.2 to 2.0 0.5 to 2.0 0.2 to 2.5
April projection 1.0 to 1.5 0.7 to 1.3 0.8 to 1.6 0.7 to 1.6 0.5 to 2.0 0.2 to 2.5
Memo: June Greenbook 1.4 0.8 0.7
Exhibit 2.Risks and Uncertainty in Economic Projections
Top-left panelUncertainty about GDP GrowthNumber of participants
Lower Similar Higher
June projections 0 1 16
April projections 0 0 17
Top-right panelRisks to GDP GrowthNumber of participants
Downside Balanced Upside
June projections 7 10 0
April projections 11 6 0
Bottom-left panelUncertainty about PCE InflationNumber of participants
Lower Similar Higher

Lower Similar HigherJune projections 1 2 14
April projections 1 1 15
Bottom-right panelRisks to PCE InflationNumber of participants
Downside Balanced Upside
June projections 2 14 1
April projections 5 11 1
Appendix 8: Materials used by Mr. Stockton
Orders and Shipments of Durable Goods
Top panel(Percent change from comparable previous period, seasonally adjusted)
Category
2008 2009 2009
Q3 Q4 Q1 Mar. Apr.r Maya
Annual rate Monthly rate
Nondefense capital goods
Orders -14.0 -49.9 -49.1 -1.0 -2.9 10.0
Aircraft -66.3 -99.5 -100.0 102.3 -6.4 630.5
Excluding aircraft -5.2 -36.5 -44.2 -1.4 -2.9 4.8
Computers and peripherals -36.6 -20.8 -18.4 -4.6 -6.6 9.4
Communications equipment 16.7 -28.7 -58.7 7.8 -4.7 6.0
All other -3.5 -38.4 -44.7 -1.9 -2.3 4.2
Shipments -.8 -19.8 -28.1 -.9 -2.6 -.3
Aircraft -8.0 -65.3 233.3 9.4 -1.5 -7.6
Excluding aircraft -.3 -15.5 -35.4 -1.7 -2.7 .3
Computers and peripherals -28.7 -25.3 -.8 -2.8 -1.4 1.6
Communications equipment -10.7 -16.6 -47.3 3.0 -4.2 -2.4
All other 4.0 -14.4 -36.7 -1.9 -2.7 .4
Supplementary orders series
Durable goods -8.1 -45.2 -39.0 -2.2 1.8 1.8
Real adjusted durable goods -13.0 -45.2 -36.3 -1.3 .7 2.0
Capital goods -10.3 -47.3 -47.2 -2.6 1.7 9.5
Nondefense -14.0 -49.9 -49.1 -1.0 -2.9 10.0

Category
2008 2009 2009
Q3 Q4 Q1 Mar. Apr.r Maya
Annual rate Monthly rateDefense 20.3 -26.7 -33.9 -11.1 28.5 7.4
r Revised. Return to table
a Advance. Return to table
Source: Census Bureau.
Bottom-left panelComputers and PeripheralsA line chart shows two series, Shipments and Orders of computers and peripherals. Unit is billions of dollars, ratio scale. Shipments start at a level slightly under 9 billion dollars at the beginning of 2000. From the end of 2000 to early 2003, the series steadily drops, to around 5.5 billion dollars in early 2003, and after a brief rise, to just below 5 billion dollars in mid-2004. The series climbs, with a few sudden drops, reaching about 6 billion dollars at the beginning of 2006, before plummeting to around 4.5 billion at the end of 2006. The series fluctuates between about 4.5 and 5.8 billion until early 2008, where it continues to drop steadily until the end of the series in May 2009, at a level of about 4.3 billion. The Orders series mostly follows the trajectory of the Shipments series. It begins at a level slightly above 8 billion dollars at the beginning of 2000. From the end of 2000 to early 2003, the series steadily drops, to around 5.5 billion dollars in early 2003, and after a brief rise, to about 4.5 billion dollars in mid-2004. The series fluctuates between about 4.8 and 5.3 billion dollars until the beginning of 2006, where it peaks slightly above 6 billion before plummeting to around 4.5 billion at the end of 2006. The series fluctuates between about 4.5 and 5.8 billion until early 2008, where it continues to drop steadily until the end of the series in May 2009, at a level of about 4.3 billion.
Source: Census Bureau.
Bottom-center panelCommunications EquipmentA line chart shows two series, Shipments and Orders of communications equipment. Unit is billions of dollars, ratio scale. The Shipments series starts around 9 billion dollars in 2000, and climbs to around 10 billion in mid 2001 before falling to about 4.2 billion in early 2003. The series fluctuates between about 3.9 and 5 billion until hitting a high of about 5.8 billion in early 2006. The series continues to fluctuate, mostly exhibiting slight decreases until it falls from about 5.7 billion in early 2008 to under 4 billion by early 2009. The Orders series mostly follows the trajectory of the shipments series, but fluctuates much more wildly. It begins at a level of about 10 billion in early 2000, immediately falling to 8 billion and then rising to 14 billion, before falling again to 10 billion by early 2001. The series dips dramatically, to 6 billion by late-2001, under 4 billion in early 2002, and to just above 2 billion in late 2002. The series then fluctuates less dramatically, between about 3.8 and 6 billion, until early 2006 where it rises to about 6.5 billion, and fluctuates between about 5 and 6 billion before dipping to about 4 billion when the series ends in early 2009.
Source: Census Bureau.
Bottom-right panelOther (non-high-tech, nontransportation)A line chart shows two series, other Shipments and Orders. Unit is billions of dollars, ratio scale. Shipments starts at about 44 billion in early 2000, before steadily dropping to about 38 billion by early 2002. The series rises to about 40 billion in late 2002, falls back to about 38 billion, and then steadily increases from early 2003, reaching about 52 billion in late 2006, and 54 billion at its peak in early 2008. The series then falls dramatically, first to 51 billion in mid-2008, and then again to about 44 billion by the beginning of 2009. The Orders series mostly follows the trajectory of the shipments series. It begins at a level slightly above 46 billion dollars in 2000, fluctuates between there and 42 billion in 2000, and then steadily drops to about 36 billion in early 2002. The series then

rises continuously, except a few small drops, hitting a peak of about 56 billion in mid-2006. After dropping to about 51 billion several months later, the series hits about 56 billion again in early 2008, before dropping dramatically to about 42 billion in early 2009 when the series ends.
Source: Census Bureau.
Durable Goods Manufacturing
Top panelChange in Inventories at Durable Goods Manufacturers(book value, billions of dollars at annual rate)
2008 2009 2009
Q2 Q3 Q4 Q1 Feb. Mar. Apr. May
Durable goods 24.2 26.4 15.0 -56.0 -54.9 -68.4 -44.8 -29.7
Lumber and wood prod. -.6 1.1 -1.3 .3 -1.6 2.5 -3.1 -2.8
Nonmetalic mineral prod. -.4 .6 -.4 -1.2 -1.8 -1.8 -1.5 -.5
Primary metals 7.3 6.6 -12.1 -12.6 -13.4 -14.0 -12.5 -10.2
Fabricated metals 4.4 5.6 -2.8 -11.4 -10.0 -15.0 -11.6 -6.4
Machinery 1.2 3.1 2.5 -8.4 -10.1 -15.3 -8.5 -4.3
Computer and electronic prod. 1.2 2.7 3.5 -6.4 -2.6 -8.4 -2.7 1.2
Electrical equipment .5 .5 -2.5 -4.2 -4.6 -2.0 -2.9 -1.5
Transportation equipment 9.9 5.1 27.7 -9.2 -5.8 -11.3 3.4 -3.8
Motor vehicles -1.3 -3.2 -4.7 -7.8 -6.2 -8.1 -5.5 -4.1
Aircraft & parts 10.9 9.0 31.1 -1.8 -.9 -1.5 8.7 -.6
Furniture -.4 -.1 -1.0 -2.2 -3.1 -2.2 -2.7 -1.5
Other durables 1.0 1.1 1.3 -.9 -1.8 -1.1 -2.9 .1
Memo: Inventory-shipments ratio, durable goods 1.57 1.61 1.76 1.86 1.88 1.89 1.88 1.90
Source: Census Bureau.
Bottom-left panelReal Adjusted Durable Goods OrdersA line chart shows one series, 3-month moving average. Unit is percent. The series starts at about -1.5 percent in early 2002, and fluctuates between its beginning level and 2 percent until late 2003, where it hits a peak of about 2.5 percent before plummeting to below -2 percent, quickly rising to about 1.5 percent, and then dipping again to about -2 percent in mid-2004. The series fluctuates with mostly upward movements until reaching about 2.3 percent in early 2005, and then fluctuating between that level and 0 until mid 2006, where the series falls to about -1.8 percent in early 2007, before rising to almost 1 percent, and falling again to about -1.2 percent in late 2007. The series continues to fluctuate between -1 and 1 percent until early 2008, where it abruptly falls to about -5.5 percent in late 2008. The three-month moving average moves back up to about 0.5 percent by May 2009.
Source: Calculated by FRB staff.
Bottom-right panelInventory-Shipments Ratio at Durable Goods Manufacturers
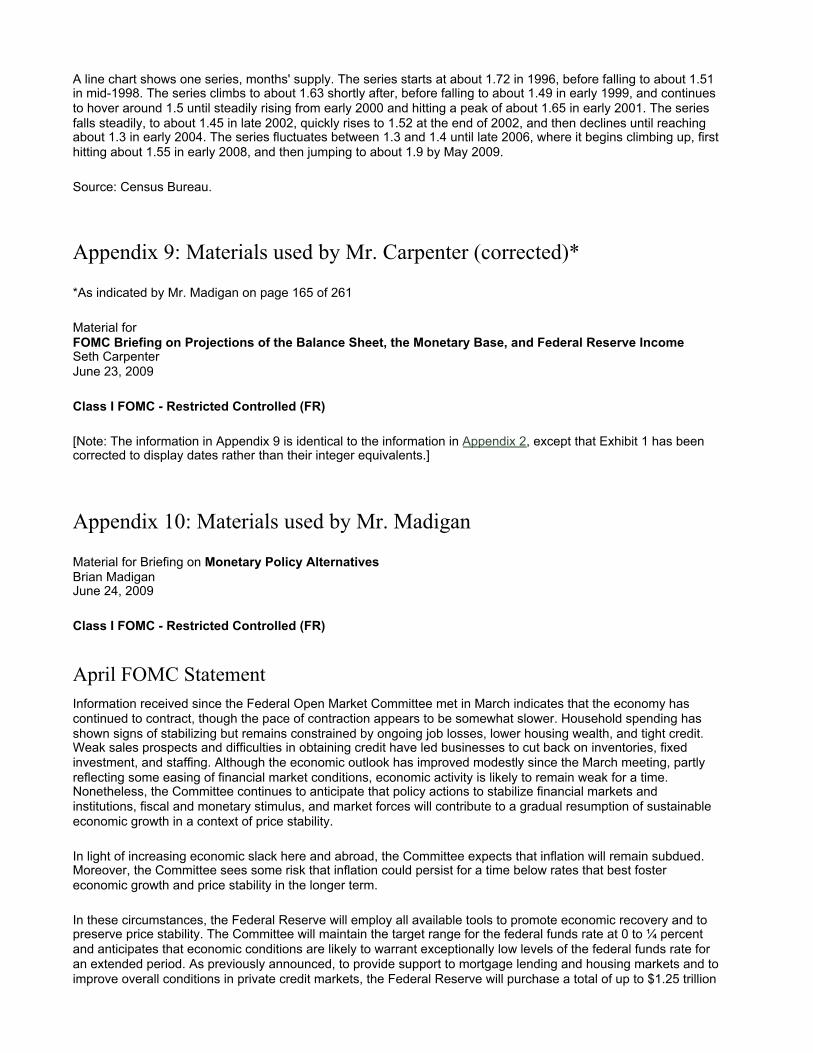
A line chart shows one series, months' supply. The series starts at about 1.72 in 1996, before falling to about 1.51 in mid-1998. The series climbs to about 1.63 shortly after, before falling to about 1.49 in early 1999, and continues to hover around 1.5 until steadily rising from early 2000 and hitting a peak of about 1.65 in early 2001. The series falls steadily, to about 1.45 in late 2002, quickly rises to 1.52 at the end of 2002, and then declines until reaching about 1.3 in early 2004. The series fluctuates between 1.3 and 1.4 until late 2006, where it begins climbing up, first hitting about 1.55 in early 2008, and then jumping to about 1.9 by May 2009.
Source: Census Bureau.
Appendix 9: Materials used by Mr. Carpenter (corrected)*
*As indicated by Mr. Madigan on page 165 of 261
Material for FOMC Briefing on Projections of the Balance Sheet, the Monetary Base, and Federal Reserve IncomeSeth CarpenterJune 23, 2009
Class I FOMC - Restricted Controlled (FR)
[Note: The information in Appendix 9 is identical to the information in Appendix 2, except that Exhibit 1 has been corrected to display dates rather than their integer equivalents.]
Appendix 10: Materials used by Mr. Madigan
Material for Briefing on Monetary Policy AlternativesBrian MadiganJune 24, 2009
Class I FOMC - Restricted Controlled (FR)
April FOMC StatementInformation received since the Federal Open Market Committee met in March indicates that the economy has continued to contract, though the pace of contraction appears to be somewhat slower. Household spending has shown signs of stabilizing but remains constrained by ongoing job losses, lower housing wealth, and tight credit. Weak sales prospects and difficulties in obtaining credit have led businesses to cut back on inventories, fixed investment, and staffing. Although the economic outlook has improved modestly since the March meeting, partly reflecting some easing of financial market conditions, economic activity is likely to remain weak for a time. Nonetheless, the Committee continues to anticipate that policy actions to stabilize financial markets and institutions, fiscal and monetary stimulus, and market forces will contribute to a gradual resumption of sustainable economic growth in a context of price stability.
In light of increasing economic slack here and abroad, the Committee expects that inflation will remain subdued. Moreover, the Committee sees some risk that inflation could persist for a time below rates that best foster economic growth and price stability in the longer term.
In these circumstances, the Federal Reserve will employ all available tools to promote economic recovery and to preserve price stability. The Committee will maintain the target range for the federal funds rate at 0 to ¼ percent and anticipates that economic conditions are likely to warrant exceptionally low levels of the federal funds rate for an extended period. As previously announced, to provide support to mortgage lending and housing markets and to improve overall conditions in private credit markets, the Federal Reserve will purchase a total of up to $1.25 trillion

of agency mortgage-backed securities and up to $200 billion of agency debt by the end of the year. In addition, the Federal Reserve will buy up to $300 billion of Treasury securities by autumn. The Committee will continue to evaluate the timing and overall amounts of its purchases of securities in light of the evolving economic outlook and conditions in financial markets. The Federal Reserve is facilitating the extension of credit to households and businesses and supporting the functioning of financial markets through a range of liquidity programs. The Committee will continue to carefully monitor the size and composition of the Federal Reserve's balance sheet in light of financial and economic developments.
[Note: In the June FOMC Statement Alternatives, strong emphasis (bold) indicates bold red underlined text in the original document.]
June FOMC Statement -- Alternative AInformation received since the Federal Open Market Committee met in April suggests that the pace of economic contraction is slowing. Indicators of consumer and business sentiment have risen, andhousehold expenditures have shown further signs of stabilizing; nonetheless, spending remains constrained by ongoing job losses, lower housing wealth, and tight credit. Businesses continue to cut back on fixed investment and staffing but are making progress in bringing inventory stocks into better alignment with sales. Although conditions in financial markets have generally improved, the Committee judges that further monetary policy stimulus is warranted to help ensure that the sharp rise in some longer-term interest rates over recent months does not undermine a recovery in overall economic activity.Substantial resource slack is likely to persist here and abroad, and the Committee expects that inflation will remain subdued. Moreover, the Committee still sees some risk that inflation could persist for a time below rates that best foster economic growth and price stability in the longer term.In these circumstances, the Federal Reserve is employing a wide array of tools to promote economic recovery and to preserve price stability. The Committee will maintain the target range for the federal funds rate at 0 to ¼ percent and anticipates that economic conditions are likely to warrant exceptionally low levels of the federal funds rate [for an extended period|at least through mid-2010 ]. To provide additional support to mortgage lending and housing markets and to facilitate further improvement in private credit market conditions, the Committee decided to increase the total amount of its large-scale securities purchases. The Committee now anticipates that over the course of this year the Federal Reserve will purchase up to $1.25 trillion of agency mortgage-backed securities, up to $200 billion of agency debt, and up to $750 billion of Treasury securities. The Committee will evaluate the timing, composition, and amounts of any additional purchases of securities in view of market conditions, the evolving economic outlook, and the necessity of ensuring that policy accommodation can ultimately be withdrawn smoothly and at the appropriate time. The Federal Reserve will also be monitoring the size and composition of its balance sheet and will make adjustments to its credit and liquidity programs as warranted in light of financial and economic developments.
June FOMC Statement -- Alternative BInformation received since the Federal Open Market Committee met in April suggests that the pace of economic contraction is slowing. Conditions in financial markets have generally improved in recent months, and indicators of consumer and business sentiment have risen. Household spending has shown further signs of stabilizing but remains constrained by ongoing job losses, lower housing wealth, and tight credit. Businesses are cutting back on fixed investment and staffing but appear to be making progress in bringing inventory stocks into better alignment with sales. Although economic activity is likely to remain weak for a time, the Committee continues to anticipate that policy actions to stabilize financial markets and institutions, fiscal and monetary stimulus, and market forces will contribute to a gradual resumption of sustainable economic growth in a context of price stability.The prices of energy and other commodities have risen of late. However, substantial resource slack is likely to dampen cost pressures, and the Committee expects that inflation will remain subdued for some time.In these circumstances, the Federal Reserve will employ all available tools to promote economic recovery and to preserve price stability. The Committee will maintain the target range for the federal funds rate at 0 to ¼ percent and continues to anticipate that economic conditions are likely to warrant exceptionally low levels of the federal funds rate for an extended period. As previously announced, to provide support to mortgage lending and housing markets and to improve overall conditions in private credit markets, the Federal Reserve will purchase a total of up to $1.25 trillion of agency mortgage-backed securities and up to $200 billion of agency debt by the end of the year. In addition, the Federal Reserve will buy up to $300 billion of Treasury securities by autumn. The Committee will continue to evaluate the timing and overall amounts of its purchases of securities in light of the evolving economic outlook and conditions in financial markets. The Federal Reserve is monitoring the size and composition of its balance sheet and will make adjustments to its credit and liquidity programs as

warranted. [Of course, the Committee will continue to take careful account of the necessity of ensuring that policy accommodation can ultimately be withdrawn smoothly and at the appropriate time.]
June FOMC Statement -- Alternative CInformation received since the Federal Open Market Committee met in April suggests that the pace of economic contraction is slowing. Conditions in financial markets have improved in recent months, and indicators of consumer and business sentiment have risen. Household spending has shown further signs of stabilizing but remains constrained by ongoing job losses, lower housing wealth, and tight credit. Businesses have continued to cut back on fixed investment and staffing but appear to be making progress in bringing inventory stocks into better alignment with sales. The Committee anticipates that policy actions to stabilize financial markets and institutions, fiscal and monetary stimulus, and market forces will contribute to a gradual recovery in economic activity that is expected to begin later this year.Although the prices of energy and other commodities have risen of late, core inflation has remained moderate, and the Committee expects that overall inflation will remain subdued.In these circumstances, the Federal Reserve is employing a wide array of tools to promote economic recovery and to preserve price stability. The Committee will maintain the target range for the federal funds rate at 0 to ¼ percent and anticipates that economic conditions are likely to warrant exceptionally low levels of the federal funds rate until late this year. As previously announced, to provide support to mortgage lending and housing markets and to improve overall conditions in private credit markets, the Federal Reserve will purchase a total of up to $1.25 trillion of agency mortgage-backed securities and up to $200 billion of agency debt by the end of the year. In addition, the Federal Reserve will buy up to $300 billion of Treasury securities by autumn. The Committee anticipates that the pace of purchases of such securities will taper off gradually by the end of this year.The Committee will continue to evaluate the timing, composition, and overall amounts of its securities purchases and to carefully monitor the Federal Reserve's balance sheet. The Federal Reserve will make adjustments to its credit and liquidity programs as warranted in light of the evolving economic outlook and conditions in financial markets.
Table 1: Overview of Alternative Language for the June 23-24, 2009 FOMC Announcement
April FOMCAlternative
A B C
1. Economic Activity
Outlook"likely to
remain weak for a time"
-----"likely to
remain weak for a time"
recovery "expected to begin
later this year"
Pace of Recovery gradual ----- gradual gradual
Risk Assessment -----
Recovery could be undermined
by higher long rates, absent further monetary
stimulus
----- -----
2. Inflation
Outlook "will remain subdued"
"will remain subdued"
"will remain subdued for a time"
"will remain subdued"
Rationaleincreasing slack here and abroad
substantial slack "likely to persist
here and abroad"
recent rise in energy prices;
substantial slack "likely to dampen cost pressures"
recent rise in energy prices
Risk Assessment
some downside
risk
still some downside risk ----- -----
Overview

April FOMCAlternative
A B C
3. Policy Decision
"all available tools"
"a wide array of tools"
"all available tools"
"a wide array of tools"
Forward Guidance on Funds Rate
"anticipates…for an
extended period"
"anticipates…for an extended
period" or "at least through
mid-2010"
"continues to anticipate…for an extended
period"
"anticipates…until late this year"
Changes in LSAPs -----
$750 billion in Treasuries
by end of year-----
"will taper off gradually" by end of year
Evaluation of LSAPs
"timing and overall
amounts"
"timing, composition,
and amounts", subject to exit
strategy
"timing and overall
amounts"
"timing, composition, and overall amounts"
Adjustments to Programs ----- "as warranted"
"as warranted" [carefully reflecting the exit strategy]
"as warranted"
Return to top
Home | Monetary policy | FOMC | FOMC transcriptsAccessibility | Contact UsLast update: March 4, 2015