food & nature digest
TRANSCRIPT

1
Accelerating theGreen Recovery
N O V E M B E R 2 0 2 0
F O O D & N AT U R E D I G E S T
2
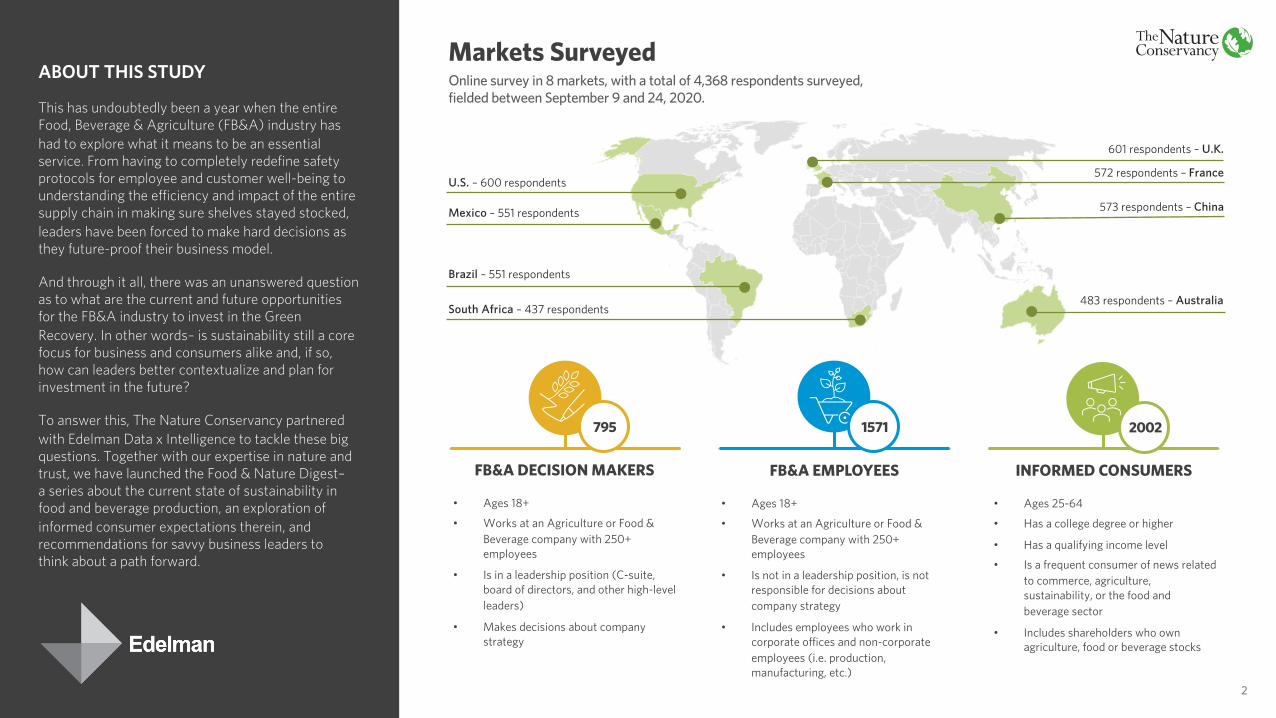
U.S. – 600 respondents
Mexico – 551 respondents
Brazil – 551 respondents
South Africa – 437 respondents
601 respondents – U.K.
572 respondents – France
573 respondents – China
483 respondents – Australia
Markets SurveyedOnline survey in 8 markets, with a total of 4,368 respondents surveyed, fielded between September 9 and 24, 2020.
ABOUT THIS STUDY
This has undoubtedly been a year when the entire Food, Beverage & Agriculture (FB&A) industry has had to explore what it means to be an essential service. From having to completely redefine safety protocols for employee and customer well-being to understanding the efficiency and impact of the entire supply chain in making sure shelves stayed stocked, leaders have been forced to make hard decisions as they future-proof their business model.
And through it all, there was an unanswered question as to what are the current and future opportunities for the FB&A industry to invest in the Green Recovery. In other words– is sustainability still a core focus for business and consumers alike and, if so, how can leaders better contextualize and plan for investment in the future?
To answer this, The Nature Conservancy partnered with Edelman Data x Intelligence to tackle these big questions. Together with our expertise in nature and trust, we have launched the Food & Nature Digest–a series about the current state of sustainability in food and beverage production, an exploration of informed consumer expectations therein, and recommendations for savvy business leaders tothink about a path forward.
1571795
• Ages 18+
• Works at an Agriculture or Food & Beverage company with 250+ employees
• Is in a leadership position (C-suite, board of directors, and other high-level leaders)
• Makes decisions about company strategy
• Ages 18+
• Works at an Agriculture or Food & Beverage company with 250+ employees
• Is not in a leadership position, is not responsible for decisions about company strategy
• Includes employees who work in corporate offices and non-corporate employees (i.e. production, manufacturing, etc.)
• Ages 25-64
• Has a college degree or higher
• Has a qualifying income level
• Is a frequent consumer of news related to commerce, agriculture, sustainability, or the food and beverage sector
• Includes shareholders who own agriculture, food or beverage stocks
2002
FB&A EMPLOYEESFB&A DECISION MAKERS INFORMED CONSUMERS

The role of sustainability (and arguably CSR overall) is officially no longer something companies do to prevent harm to the environment. Instead, modern business leaders are looking to understand how they can do proactive good for the world by investing in sustainability. This is a clear and necessary ownership of taking action at the most senior levels of organizational leadership.
Despite employees validating that their employers are making these changes, informed consumers still want more. The good news is that they continue to hold a high value on sustainability and want more opportunities to get involved, more knowledge of why and how companies are engaging, and more clarity around how the investments in sustainability are not just purpose-washing but truly being integrated into the organization’s operations.
Companies should take 2020 as the formal opportunity to have strategic conversations about appropriate investment strategies and organizational objectives in this area.
Nature-positive production and a focus on environmental sustainability have increasingly become table stakes for FB&A companies and their consumers.
3

9%
16%
20%
13%
17%
17%
45%
31%
46%
34%
53%
46%
56%
56%
58%
63%
65%
72%
73%
73%
77%
79%
Charitable giving/philanthropy
Financial returns/profitability
Product innovation
Diversity & inclusion
Supply chain resilience
Operational efficiency
Better nutrition for all people
Meeting customer demand
Environmental sustainability
Employee safety
Food & beverage safety
Important Most important moving forward
Q7: How important is it that the average food, beverage, or agriculture company focus on each of the following? Base: Informed ConsumersQ18: What should be the higher priority for food, beverage, and agriculture companies? Base: Total
“Doing good” for the environment should be a top priority for the industry today, and even more for the future.Across all audiences, environmental sustainability is of utmost importance– only behind safety. In fact, sustainability is tied with the functional needs of meeting consumer demands in volume and quality. Although the exact place it has isn’t consistent across all markets (e.g., U.S., U.K., China, and Brazil tend be a bit more focused on customer demand at the time), it is always within the top five and draws a highly vocal and passionate audience.
Looking ahead to the next three years, the higher-order priorities of safety, sustainability, and nutrition only become more of a focus for consumers. Simultaneously, all populations surveyed agree the greater priority for FB&A companies has now become doing good for the environment versus doing no harm.
Importance of Focus Areas for FB&A CompaniesReporting: % Selected
INFORMEDCONSUMERS
FB&AEMPLOYEES
FB&A DECISION MAKERS
INFORMED CONSUMERS
% who agree it’s more important to “do good” rather than “do no harm”
67% 58% 57%
4

Amidst a global pandemic fraught with distribution challenges, environmental risks out rank operational concerns.
Q19a: Please select up to three factors below that you believe pose the greatest food systems risks to your company. Base: FB&A Decision Makers
Water Quality
Climate Change
Pandemics/Disease
Water Quality
Pandemics/Disease
Climate Change
Water Quality
Pandemics/Disease
Waste
Water Quality
Waste
Climate Change
Climate Change
Pandemics/Disease
Land Degradation
Water Quality
Pandemics/Disease
Land Degradation
Water Quality
Climate Change
Deforestation
Climate Change
Water Quality
Waste
Government Restrictions
Climate Change
Pandemics/Disease
GLOBAL
U.S.
FRANCE
MEXICOU.K.
BRAZIL CHINA
SOUTH AFRICA
AUSTRALIA
Top Food System Risks to FB&A Companies Reporting: % Selected (Up to 3 Max)
Environmental Risk
Operational Risk
5
3
2
1
3
2
1
3
2
1
3
2
1
3
2
1
3
2
1
3
2
1
3
2
1
3
2
1

Q21: How has the resource allocation your company makes toward environmental sustainability changed over the past six to ten months? Base: FB&A Decision MakersQ22b: You said your company has allocated more money to sustainability in the past six to nine months. Why is this? Base: FB&A Decision Makers who Increased Allocation
Decision makers are dually-motivated to engage; they agreeit’s their duty and feel it’s good for business.
7%
21%
17%
41%
14%Significantly more resourcesallocated toward sustainability
Somewhat more resourcesallocated toward sustainability
No change
Somewhat fewer resourcesallocated toward sustainability
Significantly fewer resourcesallocated toward sustainability
Over half of decision makers have increased investment in sustainability, citing the planet and competitive advantage as top reasons.On average, decision makers say their companies are allocating 13.5% of earnings to environmental sustainability.
The need to reduce long term harmful impacts on the planet 35%
It will give us a competitive advantage 33%
Increased earnings have provided more funds to investin sustainability initiatives 33%
Growing interest from ESG investors 32%
Others in our industry are investing in sustainability 30%
Shifts in Resource Allocation, Past 6-10 MonthsReporting: % Selected
55%INCREASED
ALLOCATION
Reasons for Increased Resource Allocation towards Environmental Sustainability Reporting: % Selected
FB&A DECISIONMAKERS
6

Q7: How important is it that the average food, beverage, or agriculture company focus on each of the following? Base: Informed ConsumersQ9: Based on what you know, how well does the average food, beverage, or agriculture company deliver each of the following? Base: Informed Consumers
However, consumers continue to think FB&A businesses lagin delivering on sustainability.
Importance by Performance of Key Areas for FB&A CompaniesReporting: % Delivers, % Important, Top 2 Box
PERF
ORM
ANCE
IMPORTANCE
OPPORTUNITIES STRENGTHS
THREATS
Consumers now have an almost over-whelming number of options when it comes to food and beverage. This is most likely why industry performance is strong on functional and/or operational needs. However, as higher-level aspirations – such as nutrition and sustainability –are growing in importance, the old model of simply making good food at a reasonable price is less effective in driving consumer action.
Effectively and meaningfully engaging in net-positive sustainability initiatives is of primary importance to informed consumers. Improved performance in this area – which lags every other major category – is a business imperative for keeping customer loyalty.
INFORMEDCONSUMERS
Product innovationFood/Beverage safetyOperational efficiency
Environmental sustainability
Charitable giving/philanthropy
Financial returns/profitability
Employee safety
Diversity and inclusion
Better nutrition for all people
Supply chain resilience
Meeting customer demand
7

Consumers accept (and expect) that companies are both motivated to do good and to safeguard their business.In fact, consistently across the markets surveyed, they trust them just as much when investing for business reasons – as long as they are genuine about it.
Q28: How much would you trust a food, beverage, and agriculture company to do the right thing if they were to invest in sustainability for each of the following reasons? Base: Informed Consumers
Propensity to Trust FB&A Company Based on Reason for Investing in SustainabilityReporting: % Would Trust, Top 3 Box Average
PERFORMATIVEInvest in sustainability only to improve company image and avoid negative backlash.
EXAMPLES• Consumer demand/pressure• Shareholder demand/pressure• Demand/Pressure from NGOs• Others in the industry are investing
55%WOULD TRUST
PROCEDURALInvest in sustainability as part of necessary operational and business practices.
EXAMPLES• It’s required by regulations• It’s necessary in the production process• Pressure within the supply chain• Business differentiation
59%WOULD TRUST
PREVENTIVEInvest in sustainability to prevent and mitigate potential business risks.
EXAMPLES• Secure a supply of natural resources• Maintain a resilient business• Reduce operational risk
59%WOULD TRUST
PROACTIVEInvest in sustainability for the betterment of the environment and future generations.
EXAMPLES• It’s the right thing to do morally• Reduce the impact of the production process• A duty to protect nature and the environment• Ensure resources for future generations
60%WOULD TRUST
INFORMEDCONSUMERS
8

INFORMEDCONSUMERS
Informed consumers place a greater value on sustainably produced goods when compared to standard goods.
A Van Westendorp analysis discovered that informed consumers expectations increased across all price-points, including bargain level pricing 67% (A), premium-level pricing 43% (C), and the “optimal” price point 36% (B).
Customers recognize significant value in products that support sustainability initiatives. Translating consumer intentions into action is the critical next step for FB&A companies.
It is overly simplistic to say consumers consider sustainable goods to carry a “premium” price and they are willing to pay more. Rather, there is a value proposition inherent to sustainability that, if done right, could encourage consumer partnership, action and loyalty.
% O
F PO
PULA
TIO
N
PRICE POINT
Too cheapNot cheapNot expensiveToo expensive
A C
B
VAN WESTENDORP PRICE SENSITIVITYBased to “Sustainable” Basket of Goods Compared to the
“Standard” Basket of Goods (split-cell testing)
9

…however, actually driving purchase will necessitate more than pricing alone—instead, companies must prove the value.
Brazil actually saw a decrease in willingness to pay for sustainability given cultural sensitivities about the current reality of food shortages anda long-standing skepticism and rising nationalism against pressure from other countries.
Categories that have a less linear connection to farming/agriculture(e.g., soda, confectionery) and categories where personal preferences are seen asbeing under attack (e.g., plant-based vs. meat) tend to see flat or decreased returns for sustainably produced products, indicating an external influence more important to the consumer population than sustainability.
Emerging markets and entry-level products are more positively impacted by sustainability, indicating this is a powerful differentiator for disruptor brands.
10
NOT ALL CATEGORIESSEE THE SAME RETURNS.
DISRUPTOR BRANDS HAVETHE MOSTTO GAIN.
POLITICS PLAYS AN UNAVOIDABLE ROLE.

“Doing good” for the environment is officially a business imperative for FB&A companies.Companies that still treat environmental sustainability as a CSR-initiative need to start integrating it more formally into their core operations, strategy, and brand identity. Brands leading on this already should continue to focus on maximizing their ability to “do good” while championing and challenging their peers to rise to the occasion.
¹Supported by analysis from The World Economic Forum’s Nature Risk Rising Report
FROMTraditional Sustainability CSR Model
TOPlacing Sustainability at the Core of Business
Emphasis on raising awareness of general sustainability issues as a means to build consumer favorability and engender support from the general public.
Identify and act on specific areas where business transformation will contribute to most to environmental risk mitigation as a means of showcasing the company’s identity, values, and mission; future-proofing supply chains; and delivering against consumer expectations/demand.
Engagement in CSR-related activities that contradict with the reality of company practices and/or reactive, surface-level donations to momentary priorities.
Engrain environmental sustainability – including regenerative production models and sustainable sourcing – in core operational decisions to develop long-term dedication to initiatives and avoid costs associated with rising consumer demand for greater transparency and accountability.
Overt focus on projecting a positive company image.Develop strategies that authentically present the challenges faced by the company and industry overall, set goals against these challenges, and address provide updates on progress.
11


13
APPENDIX
13

Q1: Overall, how much do you trust the average food, beverage, or agriculture company to do what is right? Base: FB&A Employees, Informed Consumers
The FB&A industry operates from a position of strengthand with a high degree of trust.
Trust in the industryis approximately
20% higher among FB&A employees.
The industry is trusted by over two-thirds of informed consumers and eight-in-ten FB&A employees.
Global 67% 80% Global
China 80% 86% Australia
Brazil 76% 86% Brazil
Mexico 75% 84% Mexico
South Africa 72% 81% South Africa
Australia 68% 81% U.S.
U.S. 67% 78% China
UK 53% 76% UK
France 46% 67% France
Trust the FB&A Industry to Do What is RightReporting: % Agree; Top 3 Box
67%trust the FB&A
Industry
INFORMEDCONSUMERS
INFORMED CONSUMERS FB&A EMPLOYEES
14

Q31: How do you feel your company's sustainability commitments compare to those of others in the industry? Base: FB&A Decision Makers/Employees
BEHIND
19%
16%
49%
46%
32%
38%
AHEADON PAR
FB&A EMPLOYEES
FB&A DECISION MAKERS
Most companies and employees believe they are successfully on par with or ahead of their industry.
Perceptions of Sustainability Commitments Compared to Other CompaniesReporting: % Selected
My company is behind the rest of the industry My company is on par with the rest of the industry My company is ahead of the rest of the industry
BEHIND
AHEADON PAR
15

Value Analysis: Understanding the FrameworkWe asked consumers to rate expected price points against four key questions for 80+ different products within a standard FB&A basket across global markets. The average basket of goods explored had a range of $2.17 to $4.88 between marginal cheapness and expensiveness (A) with an optimal price point of $3.66 (B).
When is the product "too cheap" youquestion its quality?
When is the product "not cheap" andworth considering?
When is the product "not expensive"and still worth considering?
What is the product "too expensive"to consider?
VAN WESTENDORP PRICE SENSITIVITYBased to “Standard” Basket of Goods
Point of marginal cheapnesswhere the product is cheap but not too cheap to raise questions.
Optimal price pointwhere you maximize audience who consider the product cheap and expensive
Point of marginal expensivenesswhere the product is on the verge of being “too expensive”
KEY QUESTIONS
% O
F PO
PULA
TIO
N
PRICE POINT
B
A
INFORMED CONSUMERS
16

% O
F PO
PULA
TIO
N
We then asked a separate audience of respondents to rate the same basket of goods, but told them that it was sustainably produced. In looking at the same items made sustainably, we saw increases in the floor pricing by 67% (A), the ceiling pricing by 43% (B) and the optimal price point by 36% (C).
Value Analysis: Applying the Framework
Too cheapNot cheapNot expensiveToo expensive
A C
B
VAN WESTENDORP PRICE SENSITIVITYBased to “Sustainable” Basket of Goods Compared
to the “Standard” Basket of Goods
This said, we know that price to purchase is not a linear relationship and that to garner an audience for a higher priced audience necessitates an engaging and desirable value proposition.
INFORMED CONSUMERS
PRICE POINT
17

Q20: Currently, what percentage of your company’s total earnings is allocated towards environmental sustainability? Base: FB&A Decision Makers
FB&A DECISION MAKERS
Self-reported investments for sustainability initiatives.
27% 48% 16% 6% 3%
Percentage of Earnings Allocated towards Environmental SustainabilityReporting: % Selected
<5% 6% – 15% 16% – 30% >30%
Sustainability budgeting is rolled up with operating costs and not
considered separately
On average, decision makers say their companies are allocating 13.5% of earnings to environmental sustainability.
18