food and agriculture policy · pdf filemis market information system ... food and agriculture...
TRANSCRIPT
Food and agriculture policy decisionsTrends, emerging issues and policy alignments since the 2007/08 food security crisis

Photo on front cover: ©FAO/Assim Hafeez
Food and Agriculture Organization of the United Nations Rome, 2014
Authors: Mulat Demeke, Adriano Spinelli, Stefania Croce, Valentina Pernechele, Eugenia Stefanelli, Areej Jafari, Guendalina Pangrazio, Giovanni Carrasco, Barthelemy Lanos, Camille Roux
Food and agriculture policy decisionsTrends, emerging issues and policy alignments since the 2007/08 food security crisis
The designations employed and the presentation of material in this information product do not imply the expression of any opinion
whatsoever on the part of the Food and Agriculture Organization of the United Nations (FAO) concerning the legal or development
status of any country, territory, city or area or of its authorities, or concerning the delimitation of its frontiers or boundaries. The mention
of specific companies or products of manufacturers, whether or not these have been patented, does not imply that these have been
endorsed or recommended by FAO in preference to others of a similar nature that are not mentioned.
This product has been produced with the financial assistance from the European Union. The views expressed herein can in no way be
taken to reflect the official opinion of the European Union or the Food and Agriculture Organization of the United Nations.
ISBN 978-92-5-108031-3 (print)
E-ISBN 978-92-5-108032-0 (PDF)
© FAO, 2014
FAO encourages the use, reproduction and dissemination of material in this information product. Except where otherwise indicated,
material may be copied, downloaded and printed for private study, research and teaching purposes, or for use in non-commercial
products or services, provided that appropriate acknowledgement of FAO as the source and copyright holder is given and that FAO’s
endorsement of users’ views, products or services is not implied in any way.
All requests for translation and adaptation rights, and for resale and other commercial use rights should be made via www.fao.org/
contact-us/licencerequest or addressed to [email protected].
FAO information products are available on the FAO website (www.fao.org/ publications) and can be purchased through
This publication is funded by the European Union through the “Improved Global Governance for Hunger Reduction Programme”.
Contents
Executive summary 1
1. Introduction 7
2. Producer support measures 11
2.1 Input subsidies 11
2.1.1 The scale and trend of input subsidies 12
2.1.2 Improving efficiency of input subsidy programmes 14
2.2 Agricultural finance provisions 15
2.2.1 Special programmes to improve access to credit and reduce the cost of credit 16
2.2.2 Credit guarantee schemes (CGSs) 18
2.2.3 Agricultural financial institutions 20
2.3 Price stabilization and support policies 23
2.4 Agricultural insurance provisions and risk management 27
2.4.1 Agricultural insurance and related schemes 28
2.4.2 Premium subsidies 31
2.5 Land-related policy measures 33
2.5.1 Land policies to improve farmers’ access to land 33
2.5.2 Policies for governing foreign direct investments in land 36
3. Consumer support policy measures 41
3.1 Consumer related subsidies 41
3.1.1 Food subsidies 42
3.1.2 Fuel subsidies 47
3.2 Food-based safety net programmes 50
3.2.1 Free food distribution and nutritional programmes for vulnerable people 52
3.2.2 School feeding programmes 54
3.2.3 Food-for-work programmes 56
3.3 Cash-based consumer support programmes 57
3.3.1 Conditional and unconditional cash transfers 58
3.3.2 Cash vouchers (for food) 60
3.3.3 Cash-for-work programmes 61
4. Trade and market development policy measures 65
4.1 Trade policies 65
iii
4.1.1 Import policies 66
4.1.2 Export policies 70
4.2 Market development policies 73
4.2.1 Foodgrain stock management 73
4.2.2 Market institutions 77
5. Policy coherence, integration and harmonization at national and regional levels 85
5.1 National level policy coherence and integration 86
5.1.1 Policy coherence and integration to achieve food self-sufficiency 86
5.1.2 Integrated policies to stimulate exports of key commodities 89
5.2 Harmonization of country level policy decisions with Regional Economic Communities 91
5.2.1 Trade-related policy harmonization 92
5.2.2 Policy convergence on regional grain stocks 102
Bibliography 109
AnnexesAnnex 1: Country examples of fuel policy changes and decisions over the period 2007-2012 119
Annex 2: Cash Transfers Typology 120
Annex 3: Examples of policy coherence and integration to achieve self-sufficiency (only selected measures) 121
Annex 4: Examples of policy packages to boost agriculture exports (only selected measures) 123
FiguresFigure 1. Proportion of countries with input subsidy programmes (2007-2012) 12
Figure 2. Proportion of countries implementing measures to enhance credit provision to smallholders (2007-12) 16
Figure 3. Proportion of countries implementing price stabilization and support schemes (2007-2012) 24
Figure 4. Proportion of countries with public measures in agricultural insurance and disaster risk management 28
Figure 5. Proportion of countries implementing land policies (2007-2012) 34
Figure 6. Proportion of countries implementing direct food subsidies (including price control measures) (2007-2012) 43
Figure 7. Proportion of countries implementing fuel subsidies (2007-2012) 48
Figure 8. Proportion of countries implementing food distribution (2007-12) 51
Figure 9. Proportion of countries implementing cash-based transfer programmes (2007-12) 58
Figure 10. Proportion of countries adopting export bans (2007-2012) 70
Figure 11. proportion of countries with National food reserve system in place (2007-2012) 74
iv
TablesTable 1. Input subsidy schemes for selected countries (2007-2012) 13
Table 2. Major credit instruments adopted in selected countries over the reference period (2007-12) 17
Table 3. Examples of countries with public, partially public and non-governmental credit guarantee schemes (CGSs) 20
Table 4. Countries with financial institutions serving agriculture 22
Table 5. Examples of countries with price support measures for staple commodities 25
Table 6. Agriculture insurance schemes and disaster risk management (2007-2012) 30
Table 7. Examples of countries with land-related policy measures (2007-2012) 35
Table 8. VAT exemptions/reductions on basic food items (2007-2012) 46
Table 9. Food-based safety net programmes implemented in selected countries (2007-2012) 52
Table 10. Cash transfer programmes recently introduced and expanded or retained in selected countries (2007-2012) 60
Table 11. Cash transfer typology in selected countries 62
Table 12. Changes in import tariff policies (2007-2012) 69
Table 13. Country level trade policy alignment vs. REC on selected staples (2007-2012) 96
BoxesBox 1. Family farming policies and credits within MERCOSUR 18
Box 2. A pilot Agricultural Credit Guarantee Fund Scheme in four African countries 19
Box 3. The Land Act, Argentina 38
Box 4. Nutritional programmes in LAC 54
Box 5. Quotas and compensation system for maize and wheat in Argentina 72
Box 6. Agricultural Commodity Exchange in South Africa 81
Box 7. India ICT applications in market information and related services 82
Box 8. APTERR Operational Mechanism 106
v
vi
Acknowledgements
This report is based on the findings of the Food and Agriculture Policy Decision Analysis (FAPDA) project
financed by the EU-FAO Improved Global Governance for Hunger Reduction Programme.
The report was carried out with the supervision, guidance and contributions of Jean Balié (FAO/ESA).
Materne Maetz, Alban Mas Aparisi (FAO/ESA), Jesús Barreiro-Hurlé (FAO/ESA), Ivan Deichert (FAO/EST),
Cristian Morales Opazo (FAO/ESA), Federica Angelucci (FAO/ESA), Hélène Gourichon (FAO/ESA), Eric Jesper
Karlsson (FAO/EST), provided valuable comments and suggestions at different stages of the work.
James Whiting (FAO/ESA) reviewed and edited the language of the entire report while JuanLuis Salazar
(FAO/ESA) worked on the layout and formatting. Hilary Clarke (FAO/ESA), Alethia Cameron (FAO/ESA), Paola
Landolfi (FAO/ESA) and Janice Meerman (FAO/ESN) provided further editorial inputs.
The authors would like to thank and acknowledge the contributions of Mariana Aguirre, Liliana Balbi (FAO/
EST), Frederic Dévé (FAO/ESD), Paulo Dias (AERC/WFP), Günther Feiler (FAO/TCI), Yasaman Matinroshan
(FAO/ESA) and Sunae Kim (IFAD) to the earlier stages of FAPDA work.
Authors are grateful for the support provided by FAO regional and country offices especially in Africa where
they helped identify national consultants to collect information on policy decisions analysed in this report.
Finally, Kostas Stamoulis (FAO/ESA), Keith Wiebe (IFPRI) and Luca Russo (FAO/ESA) provided continued
support and encouragement throughout the process.
vii
Acronyms and abbreviations
AFTA ASEAN Free Trade Area
ADB Agricultural Development Bank
AMIS Agricultural Market Information System
APTERR ASEAN Plus three Emergency Rice Reserve
ASEAN Association of Southeast Asian Nations
AU African Union
CAADP Comprehensive African Agriculture Development Program
CAN Andean Community
CCT Conditional Cash Transfer
CES Commodity Exchange System
CET Common External Tariff
CFA Financial Cooperation in Central Africa
CFS Committee on World Food Security
CGS Credit Guarantee Scheme
CILSS Permanent Interstates Committee for Drought Control in the Sahel
CT Cash Transfer
CU Customs Union
DRC Democratic Republic of Congo
DRM Disaster Risk Management
EAC East African Community
EAERR East Asia Emergency Rice Reserve
ECOWAS Economic Community of West African States
ETLS ECOWAS Trade Liberalization Scheme
FAO Food and Agriculture Organization of the United Nations
FAPDA Food and Agriculture Policy Decision Analysis
FDI Foreign Direct Investment
FTA Free Trade Area
GDP Gross Domestic Product
GFD General Food Distribution
GIEWS Global Information and Early Warning System
GMP Guaranteed Minimum Price
HLPE High Level Panel of Experts
ICT Information and Communication Technologies
IEA International Energy Agency
IFAD International Fund for Agricultural Development

viii
IFPRI International Food Policy Research Institute
IMF International Monetary Fund
ISFP Initiative on Soaring Food Prices
LAC Latin America and the Caribbean
LAO PDR Lao People’s Democratic Republic
LDCs Least Developed Countries
MAFAP Monitoring African Food and Agricultural Policies Project
MCCA Central American Common Market
MENA Middle East and North Africa
MERCOSUR Southern Common Market
MFI Microfinance Institution
MIS Market Information System
MSP Minimum Support Price
NAFTA North American Free Trade Agreement
NCT Non-contributory cash transfer
NEPAD New Partnership for Africa’s Development Program
NGO Non-governmental organization
OECD Organization for Economic Co-operation and Development
OMS Open Market Sales
PFDS Public Distribution System (Bangladesh)
PMV Plan Maroc Vert
RAIP Regional Agricultural Investment Plan
REC Regional Economic Community
SAARC South Asian Association for Regional Cooperation
SADC Southern African Development Community
SAFTA South Asian Free Trade Agreement
SCT Social Cash Transfer
SFB SAARC Food Bank
SICA Central American Integration System
SSA Sub-Saharan Africa
TRQ Tariff Rate Quota
UNCTAD United Nations Conference on Trade and Development
VAT Value-added tax
WAEMU West African Economic and Monetary Union
WB The World Bank
WFP World Food Programme
WRS Warehouse Receipt System
WTO World Trade Organization
1
Executive summary
This report is based on extensive research, including document reviews and country level surveys, on policy
decisions made by governments during the period 2007 to 2012. A broad range of food security and agri-
cultural development policy decisions implemented in 71 developing countries of Africa (27), Asia (24) and
Latin America and the Caribbean, LAC, (20) was reviewed. The countries covered represent 81, 90 and
98 percent of the total population in Africa, Asia and LAC, respectively. The review has focused on policy
trends, common practices and emerging issues. Policies are increasingly designed to influence domestic food
availability and access.
Concerns about food security have increasingly prompted measures to boost production and manage price volatility and other risks
Since the global food crisis of 2007/08 there has been a renewed focus on production support measures.
Most countries have implemented policies and programmes designed to enhance support for domestic
producers, especially small farmers.
Subsidizing inputs and improving access to credit have attracted increased policy attention
Subsidizing inputs and improving access to credit have gained widespread popularity in all the three regions
during the reference period. Many countries have opted for large-scale national subsidy programmes to
lower input costs, especially following the significant and rapid increases in the international price of ferti-
lizers in 2008. However, the report also finds that there is a growing interest in improving the efficiency of
subsidy programmes by switching the design from universal coverage to targeted households and/or staple
grains. The high cost and insufficient supply of private sector credit resources have also been responsible for
government interventions to guarantee the availability of credit at preferential interest rates in many coun-
tries. Market failures in the credit market are being addressed through special programmes, credit guarantee
schemes and specialized banks in many countries.
2
Food and agriculture policy decisions | Trends, emerging issues and policy alignments since the 2007/08 food security crisis
The reduction of price, production and land tenure risks has gained widespread public support
A series of recent high price volatility events and production shocks has triggered a number of government
interventions to stabilize prices and promote insurance as part of their production support measures. Several
countries adopted price stabilization and support measures in 2007/08 to protect producers against price
risks. These policy decisions were retained in 2009/10 and 2011/12 although the interventions were applied
more consistently and systematically in Asia than in Africa or LAC. Both public and private agricultural insur-
ance schemes were expanded to tackle production shocks including disaster risk management. State-owned
insurance companies were often required to operate alongside private insurance companies and provide
special services, such as reinsurance and insurance coverage, for catastrophic risks.
The period was marked by a considerable increase in global demand for farmland. As a consequence the
proportion of countries adopting measures to improve access to land for smallholder farmers and increase
security of land tenure witnessed a marked increase during the reference period. Legislative and administra-
tive measures as well as broader land reform programmes are being applied to improve the security of tenure
of smallholders in a number of countries. Concern about potential social and political conflicts associated
with large-scale land acquisitions has also led to responses at the global level, including the Principles for
Responsible Agricultural Investment that Respect Rights, Livelihoods and Resources (PRAI) presented by FAO,
UNCTAD, IFAD and the World Bank, and the Voluntary Guidelines on the Responsible Governance of Tenure
of Land, Fisheries and Forests in the Context of National Food Security adopted by the UN Committee on
World Food Security.
Since the 2007/08 global food crisis, governments have focused on improving the access and utilization of food to ensure food security
Consumer support policies to lessen the impact of the 2007-09 food, fuel and financial crisis on the poorest
and most vulnerable groups were used by countries in all three regions (Africa, Asia and LAC). However,
although the implementation of these policy measures between 2007 and 2012 followed different trends,
approaches and practices, some common features and patterns have emerged.
Food and fuel subsidies remain popular despite ongoing attempts to reform
Food and fuel subsidy measures have remained popular with a number of countries seeking to rationalize
their public spending by gradually moving from generalized universal subsidies toward more targeted inter-
ventions directed at vulnerable households. Although attempts to phase out subsidy regimes have often
proved challenging, there is a growing recognition that universal price subsidies represent a burden for public
finances, benefit better-off groups more than poor ones and distort the market.
3
Food and cash-based transfers have received a growing attention
Food-based transfer schemes have been widely utilized to protect vulnerable people from hunger and
malnutrition. A growing number of countries in all three regions are shifting from short-term, ad-hoc food-
based interventions, in most cases implemented in response to emergencies, towards mainstreaming and
institutionalizing free food distributions, nutritional support initiatives and school feeding into their national
social safety nets programmes. School feeding has gained popularity but there is a large discrepancy among
the regions, with all selected LAC countries operating such programmes, compared to only 40 percent in
Africa and 50 percent in Asia. Several countries have institutionalized long-term nutritional interventions to
address hunger, especially among children and mothers. Nutritional programmes are more common in LAC
and are often implemented as mother and child health care, delivery of food and micronutrients, nutritional
extension and education. On the other hand, government-based food for work programmes have declined
in popularity compared to nutrition or school feeding programmes.
Cash-based transfer schemes have emerged as a preferred policy instrument against poverty and food
insecurity in LAC (mainly as conditional cash transfers) as well as Africa and Asia (mainly as unconditional
transfers). Among the major attractions of cash transfer schemes are the greater choice they give to ben-
eficiaries in how to use the additional income, the higher cost-effectiveness due to reduced administrative
costs, lower transaction costs, and the greater impact on long-term education and poverty. The Bolsa Familia
of Brazil, the best known of all conditional cash transfer schemes in the developing world, has the objective
of reducing short-term poverty by direct cash transfers and fighting long-term poverty by increasing human
capital among the poor through linking education and health services to cash transfers. A growing number
of countries are also institutionalizing cash transfer as well as cash-for-work programmes.
Trade and market development policies are being applied to influence prices in favour of producers or consumers
Various trade and market development policy measures were used to mitigate the impact of high and volatile
food prices on consumers, producers and other value chain operators throughout the reference period with
differing degrees of intensity and policy mix. Some policies were adopted on an ad-hoc and short term basis
while others were applied more consistently and with a longer term perspective.
More open import policies are being pursued often along with restrictive export policies
In the immediate aftermath of the 2007/08 food crisis a number of governments adopted more open or
non-restrictive import policies but imposed export bans and restrictions to ensure the domestic availability of
food staples at affordable prices. Import tariffs on staples were commonly reduced and/or suspended while
Executive Summary
4
Food and agriculture policy decisions | Trends, emerging issues and policy alignments since the 2007/08 food security crisis
exports of important crops such as wheat, maize and rice were banned or restricted. Over the 2009/10 to
2011/12 period, however, an increasing number of countries removed export bans and modified import
tariffs, with the goal of securing food for consumers (e.g. reducing tariffs) or protecting producers (e.g.
increasing tariffs). The negative impact of export bans on producers’ incentive was recognized and many
countries replaced the bans with export taxes, minimum export prices and quotas. A few countries also
reintroduced import tariffs to support domestic production.
Marketing development has received renewed public interest
A renewed public interest in foodgrain stocks (especially in Asia and Africa), warehouse receipt systems
(WRSs), agricultural commodity exchanges and market information systems was observed as a longer term
solution to manage price fluctuations, enhance farmers’ incomes and promote market efficiency. Many of
the countries reviewed increasingly promoted public-private partnership in grain marketing, particularly in
stock management and market information systems. Measures to address regulatory and legislative chal-
lenges in the operation of WRSs and commodity exchanges have also attracted a growing attention. Many
African, Asian and LAC countries have seen a rapid expansion of mobile phone networks and other ICT
applications to provide pricing as well as matching (sellers with buyers) services (virtual trading floors).
Policy harmonization within Regional Economic Communities remains a major challenge as integrated policies are pursued to achieve food self-sufficiency at national level
Food-self-sufficiency policies are being pursued despite regional free trade agreements
A systematic promotion of mutually reinforcing actions and coordination to achieve food-security related
goals at national or regional levels is generally seen as positive. At national level, goals such as food self-suf-
ficiency have led to an integrated and coordinated approach. Since 2007/08, a few countries in Asia, Africa
and LAC have shifted from a policy of food self-reliance (this includes food imports to achieve national food
demands) to food self-sufficiency. To this end, a comprehensive programme, which entailed a package of
subsidized technological inputs and services, price support, import tariffs to protect domestic producers,
and increased public spending in agriculture, was launched during the reference period. Strategies aimed
at national food self-sufficiency, however, could mean less dependence on trade with negative implica-
tions for regional food security and intra-regional food trade. High international prices, on the other hand,
encouraged few countries to adopt integrated policy packages to stimulate the export of selected food
commodities. A small number of countries (from all three regions) have recently launched export promotion

5
policies that include measures for facilitating trade (by easing export procedures) along with integrated pro-
grammes to boost production and enhance private sector participation. Such an export strategy is consistent
with trade and food security policies of many RECs as most of them are dependent on food imports to feed
the population and would benefit from being able to obtain adequate and reliable sources of food within
the REC. Other member countries could also see this as a sign to pursue more open trade policies rather
than follow a food self-sufficiency strategy.
National concerns about food availability and prices have led to regional policy misalignment
At the regional level, attempts have been made to harmonize trade and stock policies to achieve regional
food security. However, export restrictions were widely implemented by members of most of the RECs cov-
ered in the study, whilst at the same time reducing or suspending import tariffs, particularly in 2007/08,
causing policy misalignment with regional commitments. Food deficit countries restricted exports and facili-
tated imports with the objective of increasing domestic food supply and keeping prices lower for consumers.
As a result, most RECs appear to have run into difficulties attaining collective region-wide food security
because of divergent national interests, especially between food-deficit and food-surplus countries. In at
least one particular case, that of the Central American Common Market (MCCA), trade policies seem to
have been aligned with minimal trade restrictions on the selected staples thus boosting trade among the
REC members and enhancing regional food security during the reference period.
The food price surge of 2007/08 has revamped policy debates on strategic stocks at global and regional
levels and a few RECs in Asia and Africa have shown greater interest in harmonizing their policies to estab-
lish a regional stock during the study period. The Economic Community of West African States (ECOWAS),
the Association of South-East Asian Nations (ASEAN) Plus Three Emergency Rice Reserve (APTERR) and the
South Asian Association for Regional Cooperation (SAARC) Food Bank (SFB) are all trying to set up such
mechanisms to create regional food reserves. However, it is unclear how countries can remain committed
to regional reserves while simultaneously implementing policies and stepping up investment to establish
or expand their own national stocks. It is still to be seen whether regional stocks could be a useful and
effective tool for tackling future food emergencies, or whether national food stocks would be the most
effective option for countries dealing with unexpected food shortages, or whether a combination of the
two is a better option. Alternatively, RECs and national governments could agree to maintain a combination
of regional and national stocks with the goal of benefiting from the merits of maintaining national as well
as regional stocks.
Executive Summary

This page intentionally left blank
7
1. Introduction
The FAO Food and Agriculture Policy Decisions Analysis (FAPDA)1 initiative, led by the Agricultural
Development Economics Division (ESA)2, produced this report in collaboration with the Regional Office for
Latin America and the Caribbean (RLC), the Regional Office for Asia and the Pacific (RAP), the Regional
Office for Africa (RAF) and the Global Information and Early Warning System (GIEWS). The FAPDA team
comprises staff from FAO headquarters as well as from regional, sub-regional and country offices. With the
aim of promoting evidence-based decision making, FAPDA seeks to enhance the collection and dissemina-
tion of information on policy decisions and to create a policy database as a public good. To achieve these
goals, FAPDA provides a web-based tool which tracks national food and agriculture policy decisions from
more than 80 countries3.
Policy monitoring is about gathering evidence on a policy while it is being implemented, enabling the find-
ings to be used when deciding future courses of action. Because it is of paramount importance to FAO’s
mission of achieving food security and agricultural development, policy monitoring and analysis is now fully
included in FAO’s new Strategic Objectives (SOs), namely SO1 (Contribute to the eradication of hunger, food
insecurity and malnutrition) and SO4 (Enable more inclusive and efficient agricultural and food systems at
local, national and international levels).
Policies can be seen as a process; therefore, it is crucial to monitor them in order to provide evidence and
create a space for policy dialogue, thereby shedding light on emerging issues. FAPDA’s policy monitoring
activities started in 2008 within the framework of the Initiative on Soaring Food Prices (ISFP)4 to track policy
decisions as an immediate response to the food security crisis. The scope has subsequently been expanded
to cover medium and long term food and agriculture policy decisions. During the food crisis (2007/08), infor-
mation was collected mainly through periodic reports prepared by FAO country, sub-regional and regional
offices on a weekly basis, as well as mission reports and web-based monitoring. The first output was the
1 See FAPDA’s website: http://www.fao.org/economic/fapda
2 The FAPDA initiative started in 2008 under the former Policy Assistance and Support Service (TCSP).
3 Policy decisions discussed and analysed in this report have been registered and published in the FAPDA web-based tool and are available for con-sultation at: http://www.fao.org/economic/fapda/tool/Main.html
4 For more information, see the FAO ISFP website at: http://www.fao.org/isfp/about/en/
1
8
Food and agriculture policy decisions | Trends, emerging issues and policy alignments since the 2007/08 food security crisis
2009 publication: Country Responses to the Food Security Crisis: Nature and Preliminary Implications on the
Policies Pursued .5
After the peak of the food crisis, attempts were made to expand the scope of policy monitoring activities.
During this time, FAO country reports became less regular and the information less exhaustive. A combi-
nation of different modalities was thus adopted for collecting information on policy decisions, including:
• Web-based monitoring through governments’ official websites and online reliable sources (mainly used
for Latin America and the Caribbean and Asia regions);
• National consultants collecting information through purposely designed questionnaires (principally in
Sub-Saharan Africa);
• National focal points nominated by governments in relevant ministries, or based in national policy insti-
tutes (few pilot countries in North and Sub-Saharan Africa as well as Asia).
This methodology was adopted for preparing the second global policy report, Food and Agriculture Policy
Trends after the 2008 Food Security Crisis: Renewed Attention to Agricultural Development, covering the
2009/10 period6 , as well as for the current third global report.
This report is based on extensive research, document reviews and country level surveys on policy decisions
made by governments over three biennia (2007/08; 2009/10; 2011/12). A broad range of food and agricul-
ture policy decisions implemented in 71 developing countries have been reviewed. Selected policy decisions
were analysed following FAPDA’s classification dividing policy decisions into three main categories: produc-
er-oriented policies, consumer-oriented policies, as well as trade-oriented and macroeconomic policies. The
policy decisions selected included those most debated and most frequently implemented since the 2008
food crisis. The analysis, where applicable, focused on the three major staple food commodities, rice, wheat
and maize, due to their importance for food security, and volume of trade in the international market. The
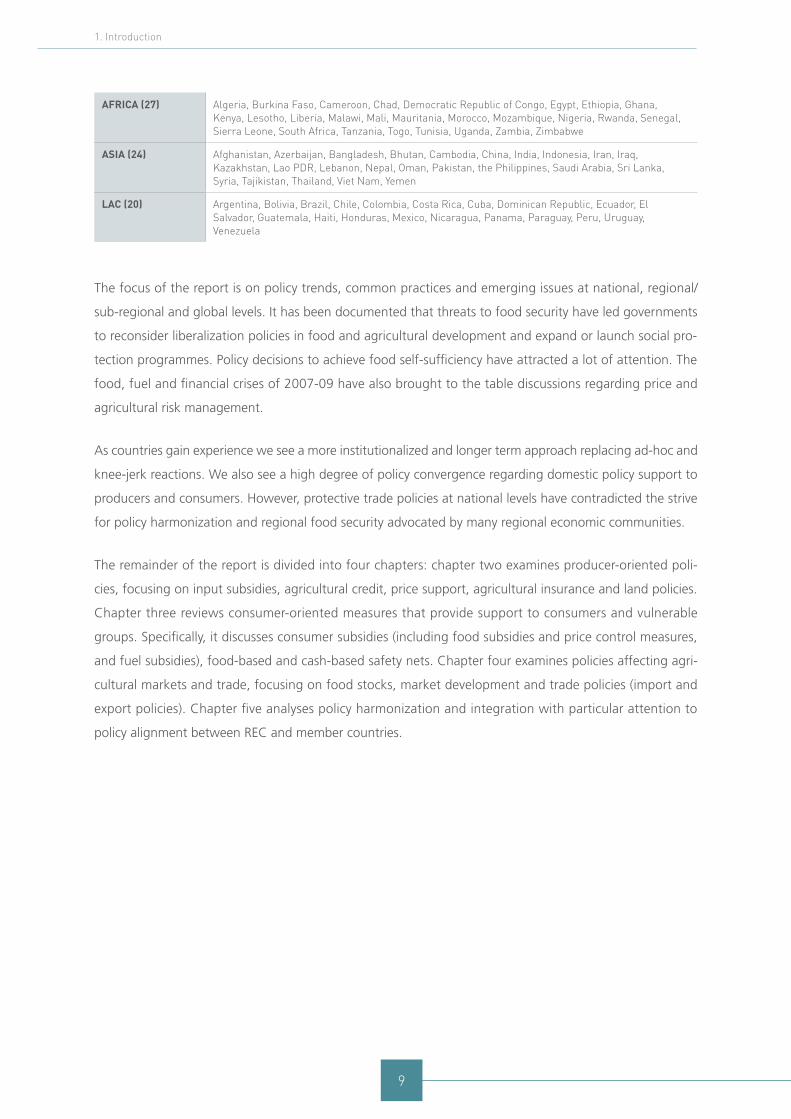
countries selected included: 27 countries in Africa (22 in Sub-Saharan Africa and 5 in North-Africa), 24
countries in Asia (14 in South and East Asia, 3 in Central Asia and 7 in Middle East) and 20 countries in Latin
America and the Caribbean (10 in Central America and the Caribbean and 10 in South America), as shown
below. Countries were selected considering: (i) the coverage in the two previous FAPDA reports; (ii) institu-
tional settings or political conditions supporting the information collection process; and (iii) human resources
and funding constraints. The countries reviewed represent 81, 90 and 98 percent of the total population in
Africa, Asia and LAC respectively.
5 Demeke M., Pangrazio G., Maetz M. (2009), Country Responses to the Food Security Crisis: Nature and Preliminary Implications on the Policies Pursued, FAO, Rome, available at http://www.fao.org/fileadmin/user_upload/ISFP/pdf_for_site_Country_Response_to_the_Food_Security.pdf
6 See Food and agriculture policy trends after the 2008 food security crisis: renewed attention to agricultural development, (2011) at: http://www.fao.org/docs/up/easypol/932/policy-trends_125en.pdf
9
1. Introduction
AFRICA (27) Algeria, Burkina Faso, Cameroon, Chad, Democratic Republic of Congo, Egypt, Ethiopia, Ghana, Kenya, Lesotho, Liberia, Malawi, Mali, Mauritania, Morocco, Mozambique, Nigeria, Rwanda, Senegal, Sierra Leone, South Africa, Tanzania, Togo, Tunisia, Uganda, Zambia, Zimbabwe
ASIA (24) Afghanistan, Azerbaijan, Bangladesh, Bhutan, Cambodia, China, India, Indonesia, Iran, Iraq, Kazakhstan, Lao PDR, Lebanon, Nepal, Oman, Pakistan, the Philippines, Saudi Arabia, Sri Lanka, Syria, Tajikistan, Thailand, Viet Nam, Yemen
LAC (20) Argentina, Bolivia, Brazil, Chile, Colombia, Costa Rica, Cuba, Dominican Republic, Ecuador, El Salvador, Guatemala, Haiti, Honduras, Mexico, Nicaragua, Panama, Paraguay, Peru, Uruguay, Venezuela
The focus of the report is on policy trends, common practices and emerging issues at national, regional/
sub-regional and global levels. It has been documented that threats to food security have led governments
to reconsider liberalization policies in food and agricultural development and expand or launch social pro-
tection programmes. Policy decisions to achieve food self-sufficiency have attracted a lot of attention. The
food, fuel and financial crises of 2007-09 have also brought to the table discussions regarding price and
agricultural risk management.
As countries gain experience we see a more institutionalized and longer term approach replacing ad-hoc and
knee-jerk reactions. We also see a high degree of policy convergence regarding domestic policy support to
producers and consumers. However, protective trade policies at national levels have contradicted the strive
for policy harmonization and regional food security advocated by many regional economic communities.
The remainder of the report is divided into four chapters: chapter two examines producer-oriented poli-
cies, focusing on input subsidies, agricultural credit, price support, agricultural insurance and land policies.
Chapter three reviews consumer-oriented measures that provide support to consumers and vulnerable
groups. Specifically, it discusses consumer subsidies (including food subsidies and price control measures,
and fuel subsidies), food-based and cash-based safety nets. Chapter four examines policies affecting agri-
cultural markets and trade, focusing on food stocks, market development and trade policies (import and
export policies). Chapter five analyses policy harmonization and integration with particular attention to
policy alignment between REC and member countries.

This page intentionally left blank
11
2. Producer support measures
Producer support measures rely on a range of policies to boost domestic food production, increase farm
income and improve food security. This report discusses only those that have been most frequently the object
of policy decisions to lower the cost of production, stabilize prices, mitigate risks, and ensure tenure secu-
rity of producers, especially smallholders, i.e. input subsidies, agricultural credit, price support, agricultural
insurance and land policies. Since the 2007/08 food crisis, the use of these policy instruments has intensified
but the trend has varied from one country or region to another.
2.1 Input subsidies
An input subsidy is a payment made from public resources to lower the price of inputs that the farmer pur-
chases for use on the farm. It could also take the form of a direct free distribution of inputs. The objective
of the use of input subsidies varies but the most common reasons are: to stimulate production and achieve
food security, to make inputs affordable for farmers who cannot afford them (as a major part of integrated
package of inputs and services), and for social equity (transfer income to farmers). The trend in the use of
input subsidies and approaches to improving efficiency of input subsidy programmes are discussed below.
Key Findings
• Input subsidies have become one of the most popular production support measures. The
proportion of countries with input subsidy programmes increased in 2009/10 and 2011/12,
compared to 2007/08, in all the three regions.
•Large-scale input subsidy schemes gained popularity in Africa and remained a preferred policy
instrument in Asia. In LAC, however, input subsidies have often been implemented as small-scale
or ad-hoc measures in recent years.
•The design of input subsidy programmes has changed from a universal coverage with diffuse
benefits and high costs to targeted households and/or staple grains using voucher systems.
2
12
Food and agriculture policy decisions | Trends, emerging issues and policy alignments since the 2007/08 food security crisis
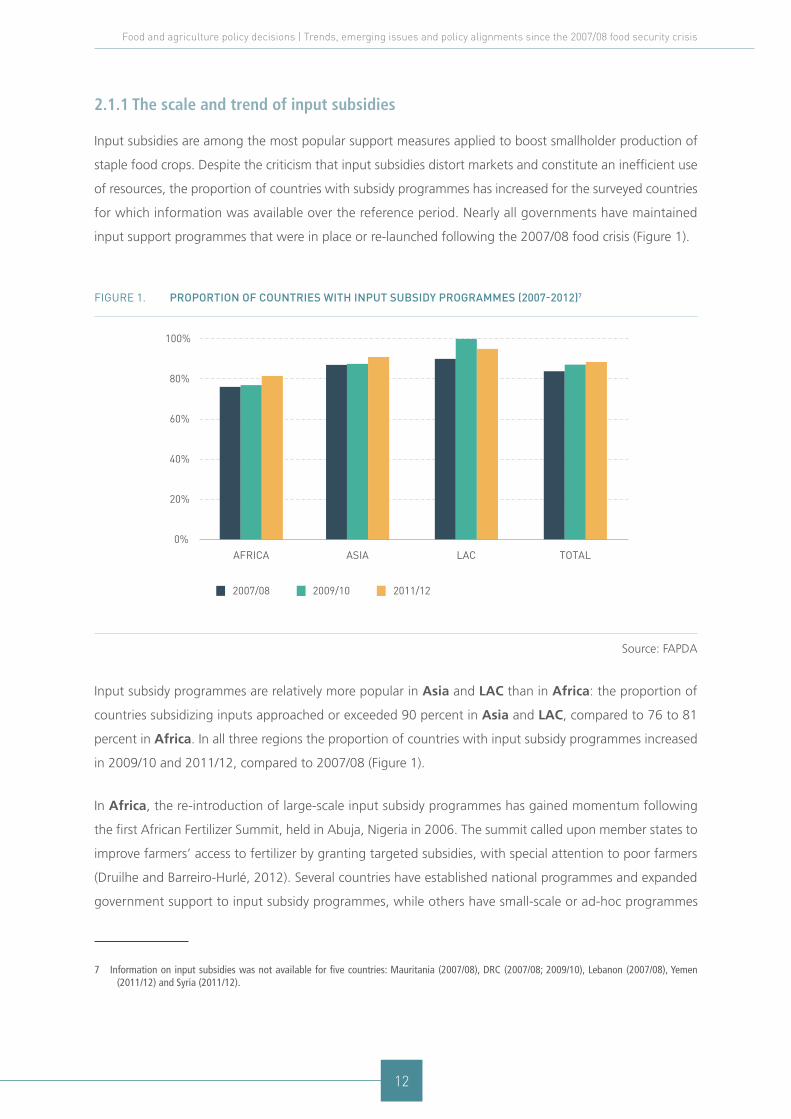
2.1.1 The scale and trend of input subsidies
Input subsidies are among the most popular support measures applied to boost smallholder production of
staple food crops. Despite the criticism that input subsidies distort markets and constitute an inefficient use
of resources, the proportion of countries with subsidy programmes has increased for the surveyed countries
for which information was available over the reference period. Nearly all governments have maintained
input support programmes that were in place or re-launched following the 2007/08 food crisis (Figure 1).
Figure 1. ProPortion of countries with inPut subsidy Programmes (2007-2012)7
0%
20%
40%
60%
80%
100%
AFRICA ASIA LAC TOTAL
2007/08 2009/10 2011/12
Source: FAPDA
Input subsidy programmes are relatively more popular in Asia and LAC than in Africa: the proportion of
countries subsidizing inputs approached or exceeded 90 percent in Asia and LAC, compared to 76 to 81
percent in Africa. In all three regions the proportion of countries with input subsidy programmes increased
in 2009/10 and 2011/12, compared to 2007/08 (Figure 1).
In Africa, the re-introduction of large-scale input subsidy programmes has gained momentum following
the first African Fertilizer Summit, held in Abuja, Nigeria in 2006. The summit called upon member states to
improve farmers’ access to fertilizer by granting targeted subsidies, with special attention to poor farmers
(Druilhe and Barreiro-Hurlé, 2012). Several countries have established national programmes and expanded
government support to input subsidy programmes, while others have small-scale or ad-hoc programmes
7 Information on input subsidies was not available for five countries: Mauritania (2007/08), DRC (2007/08; 2009/10), Lebanon (2007/08), Yemen (2011/12) and Syria (2011/12).
13
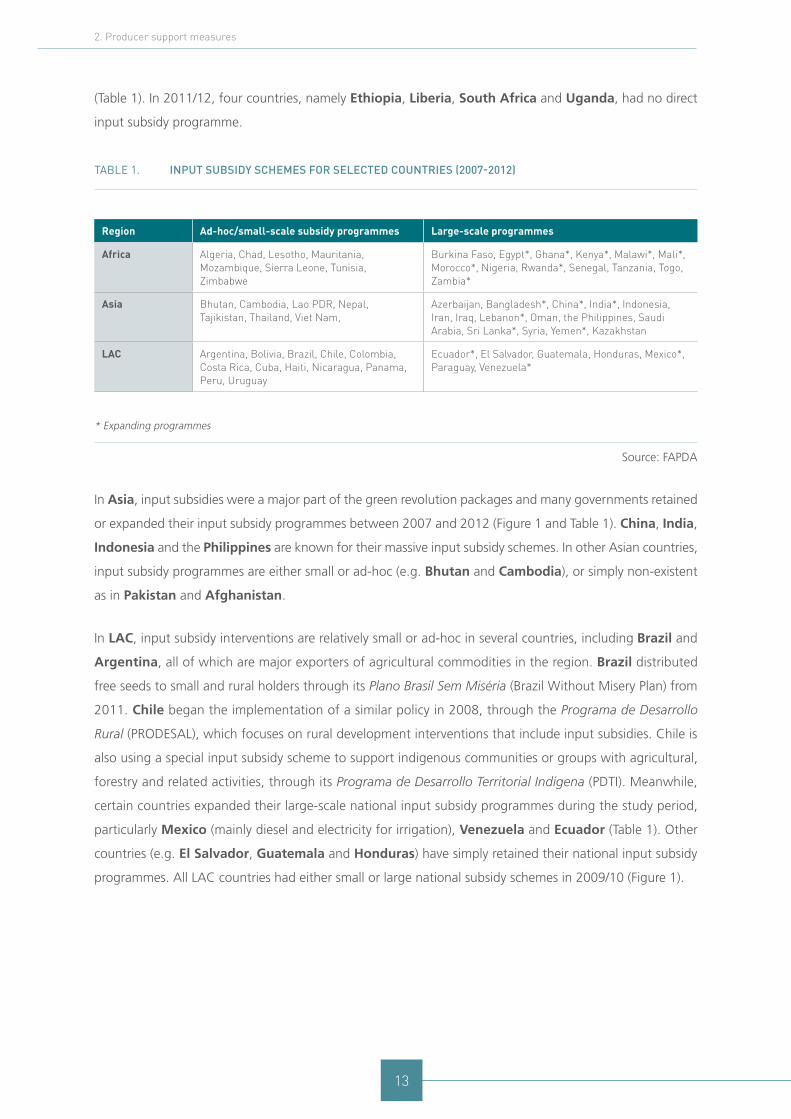
(Table 1). In 2011/12, four countries, namely Ethiopia, Liberia, South Africa and Uganda, had no direct
input subsidy programme.
Table 1. inPut subsidy schemes for selected countries (2007-2012)
Region Ad-hoc/small-scale subsidy programmes Large-scale programmes
Africa Algeria, Chad, Lesotho, Mauritania, Mozambique, Sierra Leone, Tunisia, Zimbabwe
Burkina Faso, Egypt*, Ghana*, Kenya*, Malawi*, Mali*, Morocco*, Nigeria, Rwanda*, Senegal, Tanzania, Togo, Zambia*
Asia Bhutan, Cambodia, Lao PDR, Nepal, Tajikistan, Thailand, Viet Nam,
Azerbaijan, Bangladesh*, China*, India*, Indonesia, Iran, Iraq, Lebanon*, Oman, the Philippines, Saudi Arabia, Sri Lanka*, Syria, Yemen*, Kazakhstan
LAC Argentina, Bolivia, Brazil, Chile, Colombia, Costa Rica, Cuba, Haiti, Nicaragua, Panama, Peru, Uruguay
Ecuador*, El Salvador, Guatemala, Honduras, Mexico*, Paraguay, Venezuela*
* Expanding programmes
Source: FAPDA
In Asia, input subsidies were a major part of the green revolution packages and many governments retained
or expanded their input subsidy programmes between 2007 and 2012 (Figure 1 and Table 1). China, India,
Indonesia and the Philippines are known for their massive input subsidy schemes. In other Asian countries,
input subsidy programmes are either small or ad-hoc (e.g. Bhutan and Cambodia), or simply non-existent
as in Pakistan and Afghanistan.
In LAC, input subsidy interventions are relatively small or ad-hoc in several countries, including Brazil and
Argentina, all of which are major exporters of agricultural commodities in the region. Brazil distributed
free seeds to small and rural holders through its Plano Brasil Sem Miséria (Brazil Without Misery Plan) from
2011. Chile began the implementation of a similar policy in 2008, through the Programa de Desarrollo
Rural (PRODESAL), which focuses on rural development interventions that include input subsidies. Chile is
also using a special input subsidy scheme to support indigenous communities or groups with agricultural,
forestry and related activities, through its Programa de Desarrollo Territorial Indígena (PDTI). Meanwhile,
certain countries expanded their large-scale national input subsidy programmes during the study period,
particularly Mexico (mainly diesel and electricity for irrigation), Venezuela and Ecuador (Table 1). Other
countries (e.g. El Salvador, Guatemala and Honduras) have simply retained their national input subsidy
programmes. All LAC countries had either small or large national subsidy schemes in 2009/10 (Figure 1).
2. Producer support measures
14
Food and agriculture policy decisions | Trends, emerging issues and policy alignments since the 2007/08 food security crisis
2.1.2 Improving efficiency of input subsidy programmes
In recent years, the design of input subsidy programmes around the world has changed from a universal
coverage with diffuse benefits and high costs to a more efficient design with targeted households and/or
staple grains using voucher systems and decoupled payments. In Asia, small-scale rice farmers are the most
common beneficiaries (e.g. Bangladesh, Nepal and Sri Lanka), while in Africa, subsidies are often chan-
neled towards smallholder farmers producing staples such as maize (e.g. Kenya, Malawi, Mozambique,
Tanzania and Zambia). In LAC, small and medium farmers growing food crops are the usual targets,
although cash crops, such as coffee and cotton, are also included in input subsidy programmes in some
countries (e.g. Peru, Costa Rica and Colombia). However, universal subsidy programmes still exist in some
African countries: Burkina Faso, Egypt, Ghana, Mali, Nigeria, Senegal and Togo for example. Among
Asian countries, China, India, Iran, Iraq, Lao PDR and the Philippines offered input subsidy programmes
to nearly all farmers. In LAC, only Mexico implemented universal input subsidy programmes in 2007/08 and
2009/10 and the universal approach was discontinued in 2011/12.
To minimize the negative effect of subsidized or free inputs distribution on market development, attempts
have been made to introduce input voucher systems, thus allowing targeted farmers to buy inputs
from nearby private dealers. However, voucher systems are not widely practiced. Only Malawi, Kenya,
Mozambique, Tanzania, Nigeria (pilot phase in several states) and Rwanda from Africa and Bangladesh
from Asia are reported to have used voucher systems. Ghana piloted a vouchers system but dropped it in
2010. Alternatives to the traditional system of input distribution have been introduced in countries such
as Mexico and India. Mexico, for instance, has retained its ‘decoupled’ area-based agricultural support
payments (the Procampo programme) to reduce distortions and improve farmers’ income. Starting in 2012,
India began replacing the current system of input subsidies with a direct deposit into famers’ bank accounts.
15
2.2 Agricultural finance provisions
In developing countries, lack of access to finance represents a major constraint for smallholders’ investment
and, consequently, for agricultural production as well as income creation. During the Pittsburgh Summit
(September 2009), immediately following the food crisis, G20 leaders, made a commitment to improve
access to financial services for the poor. Again, in October 2012 at the Committee on World Food Security
(Global Strategic Framework for Food Security and Nutrition, 39th Session, Rome, Italy), leaders from the
developed countries pledged to promote and implement policies that facilitate smallholders’ access to credit.
The evidence shows that in most cases such commitments had been sustained or even intensified during the
reference period. About 95 percent of the countries for which information was available had provisions for
improving access to credit or lowering interest rates (Figure 2).
Key Findings
•Policy instruments aimed at improving access to credit, reducing the cost of credit and addressing
market failures were widely applied during the reference period.
•Nearly all Asian and LAC countries and the majority of African countries took measures to
facilitate the provision of agricultural credit in 2011/12.
•The use of credit guarantee schemes (CGSs) as a tool to address market failures and improve
access to credit increased in all three regions.
•Special public agricultural financial institutions have been maintained, newly established or
reorganized to operate alongside private commercial banks.
2. Producer support measures
16
Food and agriculture policy decisions | Trends, emerging issues and policy alignments since the 2007/08 food security crisis
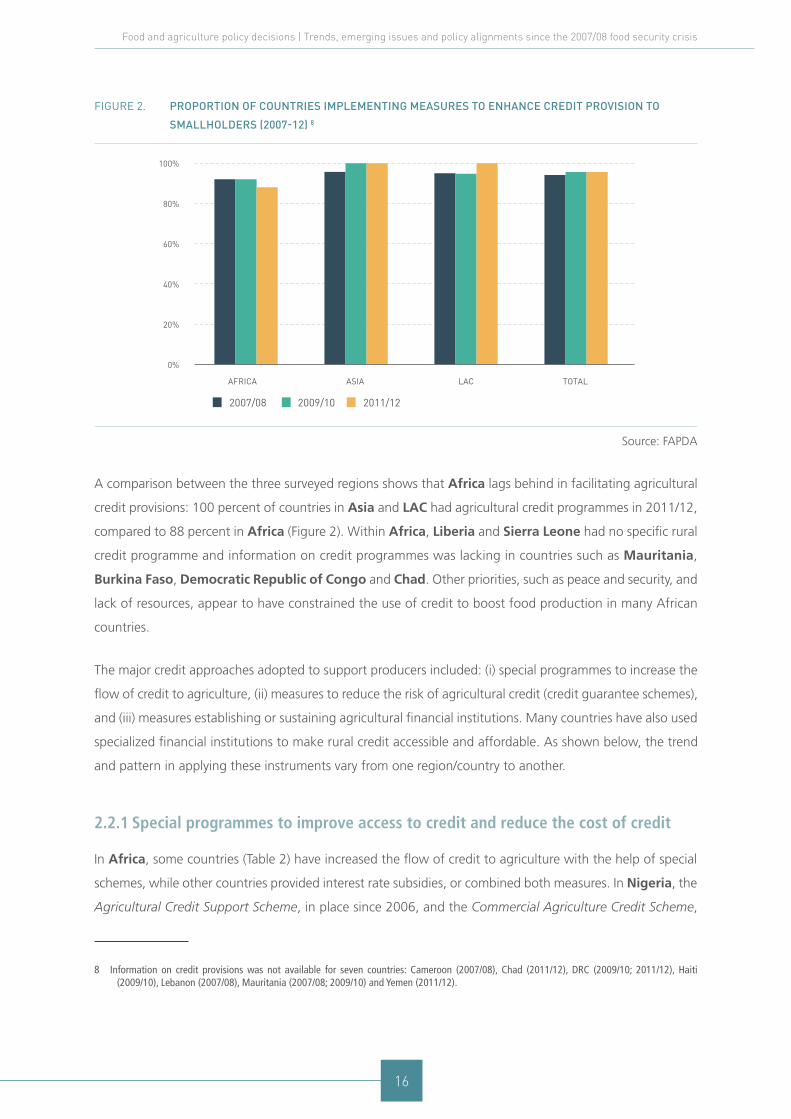
Figure 2. ProPortion of countries imPlementing measures to enhance credit Provision to
smallholders (2007-12) 8
0%
20%
40%
60%
80%
100%
AFRICA ASIA LAC TOTAL
2007/08 2009/10 2011/12
Source: FAPDA
A comparison between the three surveyed regions shows that Africa lags behind in facilitating agricultural
credit provisions: 100 percent of countries in Asia and LAC had agricultural credit programmes in 2011/12,
compared to 88 percent in Africa (Figure 2). Within Africa, Liberia and Sierra Leone had no specific rural
credit programme and information on credit programmes was lacking in countries such as Mauritania,
Burkina Faso, Democratic Republic of Congo and Chad. Other priorities, such as peace and security, and
lack of resources, appear to have constrained the use of credit to boost food production in many African
countries.
The major credit approaches adopted to support producers included: (i) special programmes to increase the
flow of credit to agriculture, (ii) measures to reduce the risk of agricultural credit (credit guarantee schemes),
and (iii) measures establishing or sustaining agricultural financial institutions. Many countries have also used
specialized financial institutions to make rural credit accessible and affordable. As shown below, the trend
and pattern in applying these instruments vary from one region/country to another.
2.2.1 Special programmes to improve access to credit and reduce the cost of credit
In Africa, some countries (Table 2) have increased the flow of credit to agriculture with the help of special
schemes, while other countries provided interest rate subsidies, or combined both measures. In Nigeria, the
Agricultural Credit Support Scheme, in place since 2006, and the Commercial Agriculture Credit Scheme,
8 Information on credit provisions was not available for seven countries: Cameroon (2007/08), Chad (2011/12), DRC (2009/10; 2011/12), Haiti (2009/10), Lebanon (2007/08), Mauritania (2007/08; 2009/10) and Yemen (2011/12).

17
established in 2009 provide finance for the country’s agricultural value chains. In South Africa, the Ministry
of Agriculture has reorganized the Agricultural Credit Scheme into the Micro-Agricultural Finance Schemes
of South Africa (MAFISA), which was piloted in 2005 and later expanded to provide micro and retail finan-
cial services to communal farmers and emerging entrepreneurs. Egypt implemented credit schemes that
included debit reduction and interest exemptions in 2011/12. It also supported small and micro enterprises
through the Social Fund for Development, which offers cash funding and advice to small farmers. Morocco
introduced interest rate subsidies on long-term loans for farmers without a bank account. Similarly, the
Kenyan government reduced interest rates (from 24 to 10 percent) for small farmers and agro-dealers in
2011. In Rwanda, the government has launched the Girinka Programme to provide credit to very poor
families to purchase a cow. Nevertheless, agriculture continues to receive only a small share of total credit in
Africa, leaving smallholder farmers to rely on meager savings and informal sources of credit (MFW4A, 2012).
During the period 2009/10 and 2011/12, a number of Asian countries took measures to expand credit
and reduce interest rates in support of small farmers (Table 2). In India, loans to agriculture increased at a
compound annual growth rate of 18.5 percent between 2005/06 and 2009/10 (FAO, 2013a). In China, a
sharp growth in the number of rural, cooperative and other banks has significantly increased the volume
of agricultural loans in recent years (e.g. 2011). The growth of microfinance institutions (MFIs) in many
countries (particularly India, Nepal, Bhutan, the Philippines and Cambodia) has also played a key role
in expanding agricultural credit (and other financial services). The Philippines, India and Cambodia have
recognized the special features of microfinance and issued appropriate regulations and supervisory prac-
tices for banks engaged in the provision of microfinance products. The Philippines is reported to be the
first country in Asia that has developed microfinance performance standards for banks, cooperatives and
microfinance institutions.
Table 2. major credit instruments adoPted in selected countries over the reference Period
(2007-12)
Region/ measure Credit expansion Interest rate subsidy Both
Africa Lesotho, Malawi, Mauritania, Rwanda, Zambia
Kenya, Tunisia, Uganda, Zimbabwe
Algeria, Egypt, Ghana Morocco, Mozambique, Nigeria, South Africa, Tanzania
Asia Bangladesh, Cambodia, China, Thailand
Indonesia, Iran, Iraq, Nepal, Saudi Arabia, Syria, Viet Nam
India, Lao PDR, Pakistan, the Philippines, Sri Lanka
LAC Cuba Argentina, Chile, Costa Rica, Dominican Republic, Guatemala, Mexico, Nicaragua, Paraguay, Panama
Bolivia, Brazil, Colombia, Ecuador, El Salvador, Peru, Venezuela
Source: FAPDA
2. Producer support measures
18
Food and agriculture policy decisions | Trends, emerging issues and policy alignments since the 2007/08 food security crisis
In LAC, some countries introduced measures to expand agricultural loans and more countries reduced
interest rates (Table 2). Special credit schemes have been designed to improve access to credit for small
and medium farms. Some countries implemented credit measures under the framework of the family farm-
ing policy of MERCOSUR (Box 1). In 2008, Ecuador launched the Programa Socio Siembra as an integral
approach for boosting agriculture (including credits, input subsidies and technical assistance) for small and
medium farms. Peru has introduced various schemes with major credit components since 2007 (Programa
Agro Rural, Programa Agro-Perú and Plan Agroequipo, among others), while it has given greater attention
to rural producers and family farmers, with credit disbursements nearly doubling between 2007 and 2010
(CEBRI, 2012). The development and sustainability of microfinance in Latin American urban areas also
stimulated microfinance activity in rural areas. This itself was facilitated by an adequate environment: a
stable macro-economy, appropriate operational policies, clear property rights, and an adequate regulatory
framework (Jaramillo, 2013).
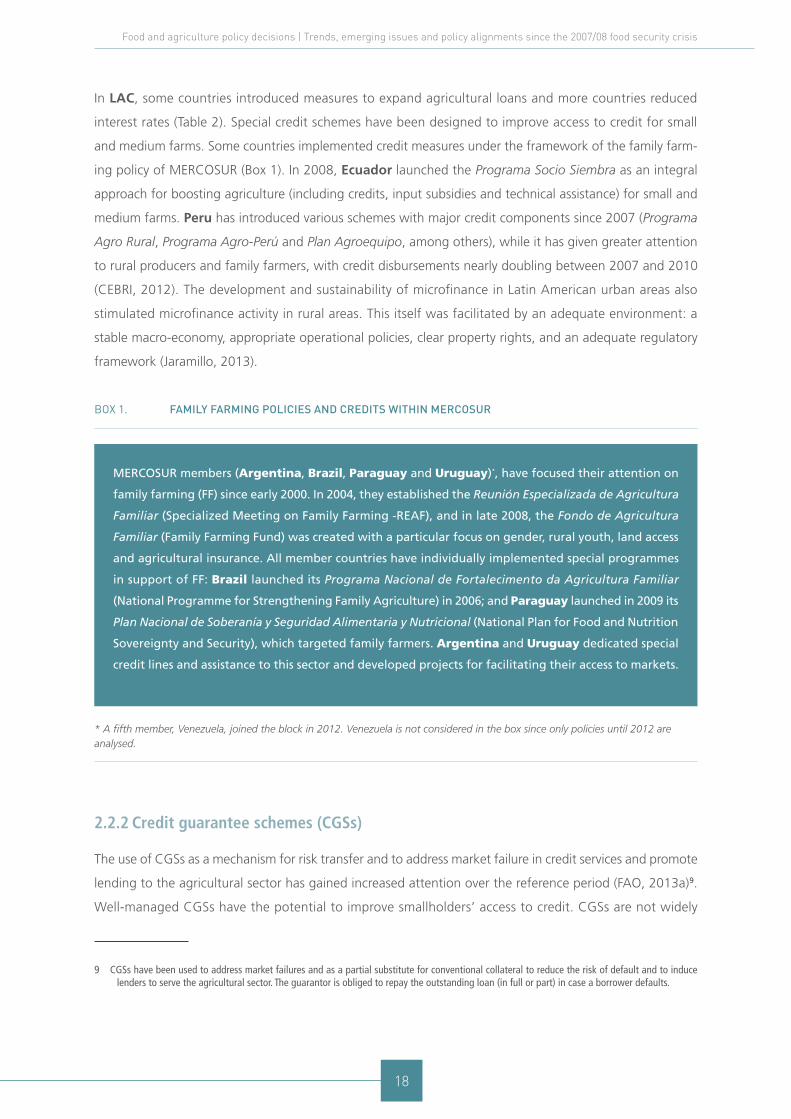
box 1. family farming Policies and credits within mercosur
* A fifth member, Venezuela, joined the block in 2012. Venezuela is not considered in the box since only policies until 2012 are analysed.
2.2.2 Credit guarantee schemes (CGSs)
The use of CGSs as a mechanism for risk transfer and to address market failure in credit services and promote
lending to the agricultural sector has gained increased attention over the reference period (FAO, 2013a)9.
Well-managed CGSs have the potential to improve smallholders’ access to credit. CGSs are not widely
9 CGSs have been used to address market failures and as a partial substitute for conventional collateral to reduce the risk of default and to induce lenders to serve the agricultural sector. The guarantor is obliged to repay the outstanding loan (in full or part) in case a borrower defaults.
MERCOSUR members (Argentina, Brazil, Paraguay and Uruguay)*, have focused their attention on
family farming (FF) since early 2000. In 2004, they established the Reunión Especializada de Agricultura
Familiar (Specialized Meeting on Family Farming -REAF), and in late 2008, the Fondo de Agricultura
Familiar (Family Farming Fund) was created with a particular focus on gender, rural youth, land access
and agricultural insurance. All member countries have individually implemented special programmes
in support of FF: Brazil launched its Programa Nacional de Fortalecimento da Agricultura Familiar
(National Programme for Strengthening Family Agriculture) in 2006; and Paraguay launched in 2009 its
Plan Nacional de Soberanía y Seguridad Alimentaria y Nutricional (National Plan for Food and Nutrition
Sovereignty and Security), which targeted family farmers. Argentina and Uruguay dedicated special
credit lines and assistance to this sector and developed projects for facilitating their access to markets.
19
available in Africa but new pilot initiatives through partnerships between governments, the private sector,
donors or NGOs have emerged during the reference period (Table 3). For instance, a partnership between
an international commercial bank and various organizations resulted in a pilot credit guarantee scheme in
four African countries (Ghana, Mozambique, Tanzania and Uganda) in 2009 (Box 2). Small-scale CGSs,
often run as partially governmental or non-governmental, were found in a few countries. On the other
hand, only Ethiopia, Egypt, Morocco and Nigeria were reported to have fully government-owned CGSs
during the period under consideration (Table 3). In Ethiopia, the government financially backed banks to
protect farmers against default of payments. In Nigeria, the government established the Agricultural Credit
Guarantee Scheme Fund (ACGSF) in 1977 to provide some measure of risk coverage as well as to encour-
age commercial banks to increase their lending to agriculture. A new initiative, the Nigeria Incentive-based
Risk-sharing System for Agricultural Lending (NIRSAL), was also launched in 2011 with the aim of de-risking
agricultural lending to farmers as well as lowering the cost of lending for the banks.
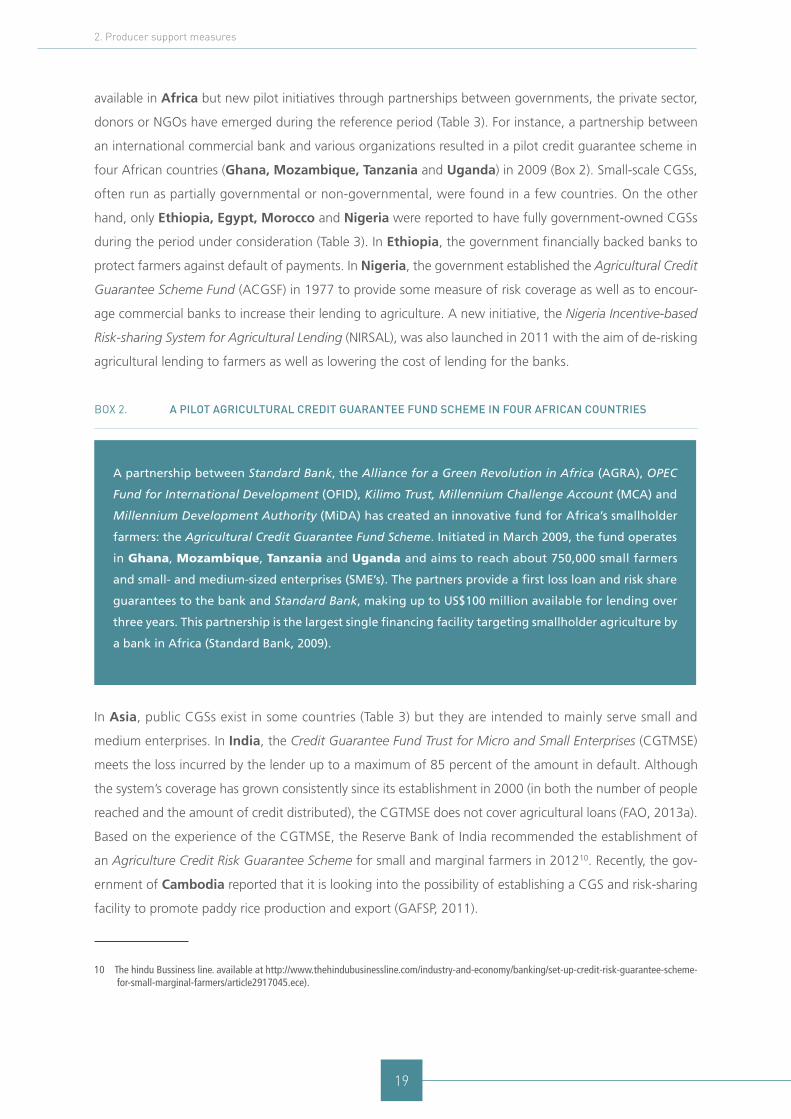
box 2. a Pilot agricultural credit guarantee fund scheme in four african countries
In Asia, public CGSs exist in some countries (Table 3) but they are intended to mainly serve small and
medium enterprises. In India, the Credit Guarantee Fund Trust for Micro and Small Enterprises (CGTMSE)
meets the loss incurred by the lender up to a maximum of 85 percent of the amount in default. Although
the system’s coverage has grown consistently since its establishment in 2000 (in both the number of people
reached and the amount of credit distributed), the CGTMSE does not cover agricultural loans (FAO, 2013a).
Based on the experience of the CGTMSE, the Reserve Bank of India recommended the establishment of
an Agriculture Credit Risk Guarantee Scheme for small and marginal farmers in 201210. Recently, the gov-
ernment of Cambodia reported that it is looking into the possibility of establishing a CGS and risk-sharing
facility to promote paddy rice production and export (GAFSP, 2011).
10 The hindu Bussiness line. available at http://www.thehindubusinessline.com/industry-and-economy/banking/set-up-credit-risk-guarantee-scheme-for-small-marginal-farmers/article2917045.ece).
A partnership between Standard Bank, the Alliance for a Green Revolution in Africa (AGRA), OPEC
Fund for International Development (OFID), Kilimo Trust, Millennium Challenge Account (MCA) and
Millennium Development Authority (MiDA) has created an innovative fund for Africa’s smallholder
farmers: the Agricultural Credit Guarantee Fund Scheme. Initiated in March 2009, the fund operates
in Ghana, Mozambique, Tanzania and Uganda and aims to reach about 750,000 small farmers
and small- and medium-sized enterprises (SME’s). The partners provide a first loss loan and risk share
guarantees to the bank and Standard Bank, making up to US$100 million available for lending over
three years. This partnership is the largest single financing facility targeting smallholder agriculture by
a bank in Africa (Standard Bank, 2009).
2. Producer support measures

20
Food and agriculture policy decisions | Trends, emerging issues and policy alignments since the 2007/08 food security crisis
CGSs are more widely available in LAC than in Asia or Africa: nearly all LAC countries surveyed had one
or more public credit guarantee scheme during the reference period. Many LAC countries operate a range
of individual and partial credit guarantee facilities. In Brazil, for instance, three different credit guarantee
schemes for agriculture and agro-processing are managed under the umbrella of the Brazilian Development
Bank. The Fundo Garantidor para Investimentos is the most important of these funds and works with 12
intermediary banks supporting investments, mainly in larger-scale agricultural production (FAO, 2013b).
Some countries have expanded the scale of their CGSs. For instance, Mexico, with one of the oldest and
largest guarantee funds in the world, the Fideicomisos Instituidos en Relación con la Agricultura (FIRA) – Trust
Funds for Rural Development – granted nearly 6 billion USD in guarantees in 2010, supporting 1.08 million
agriculture and agricultural value chain actors (FAO, 2013a).
Table 3. examPles of countries with Public, Partially Public and non-governmental
credit guarantee schemes (cgss)
Region Credit Guarantee Schemes
Africa Burkina Faso **, Egypt*, Ethiopia*, Ghana***, Kenya ***, Morocco*, Mozambique***, Nigeria*, South Africa**, Tunisia**, Tanzania**, Uganda**, Senegal***
Asia Cambodia*, India*, Indonesia*, Iraq***, Lebanon**, the Philippines*, Thailand*, Saudi Arabia**, Syria*
LAC All countries have public CGSs except Cuba, Dominican Republic and Haiti ***
*public CGSs, ** partially governmental, ***non-governmental
Source: FAPDA
2.2.3 Agricultural financial institutions
Specialised agricultural financial institutions are common in all regions and increasingly operate alongside
private commercial banks and cooperative banks. Improving access to affordable credit by small farmers has
required specialized institutions such as state-owned agricultural development banks (ADBs), community or
rural banks. The argument that private commercial banks provide sporadic and limited services, and tend to
target wealthier farmers is often used to justify the establishment of public specialised financial institutions.
In Africa, several public agricultural financial institutions have survived economic reform programmes and
played an important role in the rural credit market during the period under consideration (Table 4). In
Rwanda, the Banque Rwandaise de Développement (the Rwanda Development Bank) was reformed and
expanded to provide loans to MFIs and cooperatives. A government fund for refinancing and development
of microfinance increased during the study period (Republic of Rwanda, 2011). The Principal Bank for
Development and Agricultural Credit in Egypt and the Crédit Agricole du Maroc of Morocco have recently
been revitalized and expanded. In South Africa, MAFISA funds are administered by the government-owned
21
Land Bank11, which performs fund and treasury management functions on behalf of the Department of
Agriculture (WTO, 2009). Other countries have reversed the decision to close down specialized banks.
For instance, after nearly two decades of liquidating the Crédit Agricole of Cameroon, in January 2011
Cameroon announced the creation of the Cameroon Agriculture Financial Rural Corporation with the goal
of financing agricultural projects (Pibasso, 2011).
In Mali, the Banque Nationale de Développement Agricole (BNDA) continues to play a role in agriculture,
although its credit authorizations to the rural areas have markedly declined in recent years, mainly due to
the cotton sector crisis and the high indebtedness of actors in the two main sub-sectors, rice and cotton
(Michigan State University, 2011).
In Asia, nearly all countries monitored have specialized banks serving agriculture. Each country (except
Afghanistan) has retained one or more key long-standing financial institutions to serve the rural sector and
in recent years, the role of cooperatives (often supervised and supported by governments) has markedly
increased. The Viet Nam Bank for Agriculture and Rural Development (Agribank) is the biggest commercial
bank in the country, holding the dominant role in the economic development of Viet Nam, particularly with
regard to agricultural and rural investments. Agribank credit disbursement has rapidly expanded in recent
years12. Thailand’s Bank for Agriculture and Agricultural Cooperatives has increased outreach to 6.25 million
farm families representing nearly 98 percent of the country’s total number of farm households, as of March
2011. Financial services to agriculture, rural areas and farmers in China are delivered by public banks (e.g.
Agricultural Development Bank of China) and various types of specialized banks, including rural commercial
banks, rural credit cooperatives and township banks (Financial Stability Analysis Group of the People’s Bank
of China, 2012). In Bangladesh, state-owned specialized banks, state-owned commercial banks, together
with private commercial banks and foreign commercial banks are encouraged to extend lending facilities to
agriculture through a partnership agreement with the NGO-based microfinance institutions (Rahman et al.,
2011). In India, a number of government schemes provide credit to the agricultural sector and the flow has
significantly exceeded targets in recent years. The Reserve Bank of India regulations make it mandatory for
domestic commercial banks to direct 18 percent of their adjusted net bank credit to agriculture and allied
sectors.
In LAC, several countries have active specialized banks (Table 4). Development financial institutions (DFIs)
are the main sources of financing for the agricultural sector. The DFIs that serve the agriculture sector have
redefined themselves over the years. In many cases, they have improved their management as state or
public-private financial institutions and changed their orientation, shifting from specializing in agriculture to
11 For more information see the Land Agriculture Development Bank of South Africa website e at http://www.landbank.co.za/overview/corporate_profile.php
12 See: http://financelearners.blogspot.it/2011/02/largest-banks-in-Viet Nam.html
2. Producer support measures
22
Food and agriculture policy decisions | Trends, emerging issues and policy alignments since the 2007/08 food security crisis
a multi-sector approach, and from direct loans to farmers (first-tier) to a second-tier line of credit through
intermediaries. Chile’s Instituto Nacional de Desarrollo Agropecuario (National Institute for Agricultural
Development, INDAP) is a specialized institution under the Ministry of Agriculture. It is a major provider of
credit to small-scale agriculture at preferential rates, and its role has become more important over the years,
mainly because of the various credit initiatives introduced since 2009 (e.g. special credit for medium-size
farmers and a plan for financial support to agricultural producers). In 2011 INDAP lending increased by 31
percent from 2010. The Banco Nacional do Desenvolvimento Econômico e Social (BNDES) is Brazil’s premier
state-owned devel opment bank, providing the bulk of long-term credit (more than 70 percent) in the coun-
try and supporting activities in agriculture, industry and service sectors. BNDES, the largest creditor in South
America, provides subsidized financing in a country where credit is expensive by international standards and
still generates a huge profit. Among the successful public-private agricultural banks is Guatemala’s Banrural
SA, which serves the rural poor as well as clients from non-agricultural sectors. Banrural SA has remained a
profitable public-private bank in which the public sector initially held 30 percent of the shares and private
shareholders held the rest (Trivelli and Venero, 2007). The share of Banrural SA’s agricultural portfolio rose
steadily over the reference period (Jaramillo, 2013).
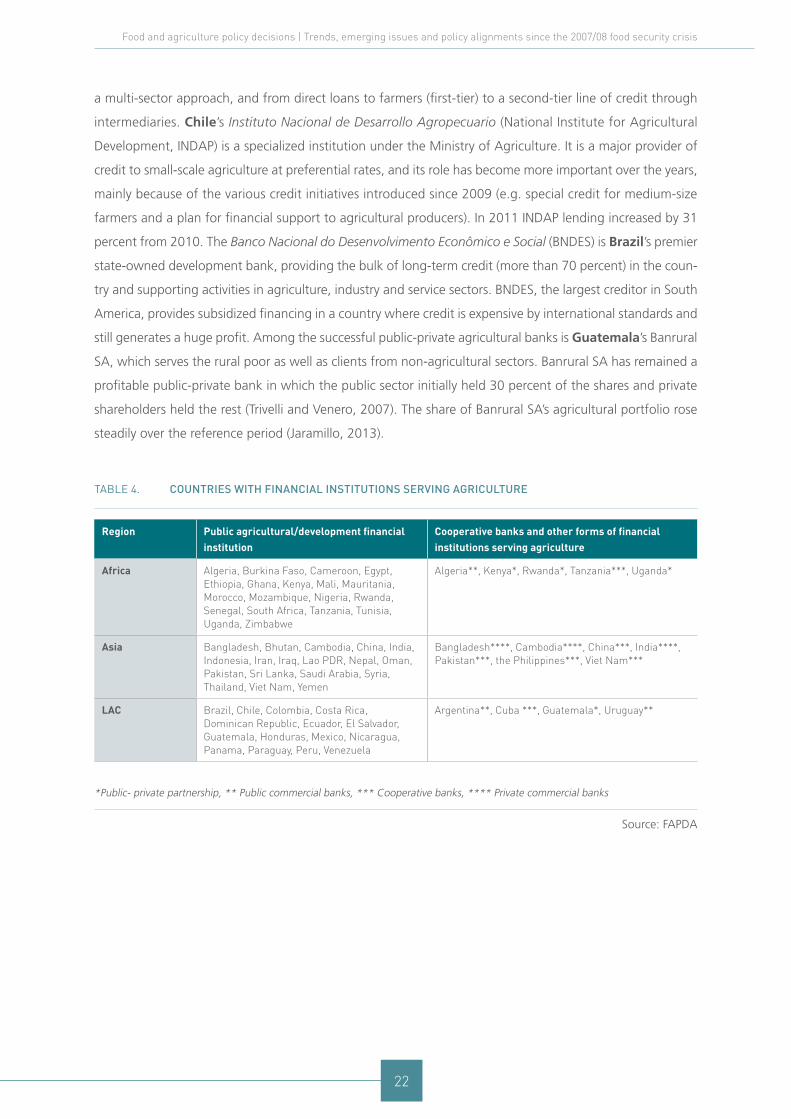
Table 4. countries with financial institutions serving agriculture
Region Public agricultural/development financial institution
Cooperative banks and other forms of financial institutions serving agriculture
Africa Algeria, Burkina Faso, Cameroon, Egypt, Ethiopia, Ghana, Kenya, Mali, Mauritania, Morocco, Mozambique, Nigeria, Rwanda, Senegal, South Africa, Tanzania, Tunisia, Uganda, Zimbabwe
Algeria**, Kenya*, Rwanda*, Tanzania***, Uganda*
Asia Bangladesh, Bhutan, Cambodia, China, India, Indonesia, Iran, Iraq, Lao PDR, Nepal, Oman, Pakistan, Sri Lanka, Saudi Arabia, Syria, Thailand, Viet Nam, Yemen
Bangladesh****, Cambodia****, China***, India****, Pakistan***, the Philippines***, Viet Nam***
LAC Brazil, Chile, Colombia, Costa Rica, Dominican Republic, Ecuador, El Salvador, Guatemala, Honduras, Mexico, Nicaragua, Panama, Paraguay, Peru, Venezuela
Argentina**, Cuba ***, Guatemala*, Uruguay**
*Public- private partnership, ** Public commercial banks, *** Cooperative banks, **** Private commercial banks
Source: FAPDA
23
2.3 Price stabilization and support policies
Price stabilization and support policies often refer to a minimum price supported by the government to pro-
tect farmers against low and fluctuating commodity prices. Price support is a government-based price risk
management tool employed to achieve self-sufficiency in key grain commodities, support farmers’ income,
and build grain stock for public distribution to vulnerable groups (stocks and public distribution are discussed
in chapter four).
Globally, around 60 percent of the countries with available data (65 to 66 countries) applied price support
schemes during the study period (Figure 3). Nearly all countries that adopted the policy in 2007/08 main-
tained it during 2009/10 and 2011/12 (Figure 3). High price volatility in the international and domestic
markets recently appears to be among the major motivations for continued government intervention in the
staple grain markets.
Key Findings
•Price stabilization and support schemes attracted greater attention in the wake of the 2007/08
crisis and for many countries; interest in such action did not fade in 2009/10 or 2011/12.
•Price support programmes are more widespread and comprehensive in Asia than in Africa or
LAC.
•Price support programmes in Africa have become more popular in recent years but comprehensive
and consistent national price support programmes are rare in the region.
2. Producer support measures
24
Food and agriculture policy decisions | Trends, emerging issues and policy alignments since the 2007/08 food security crisis
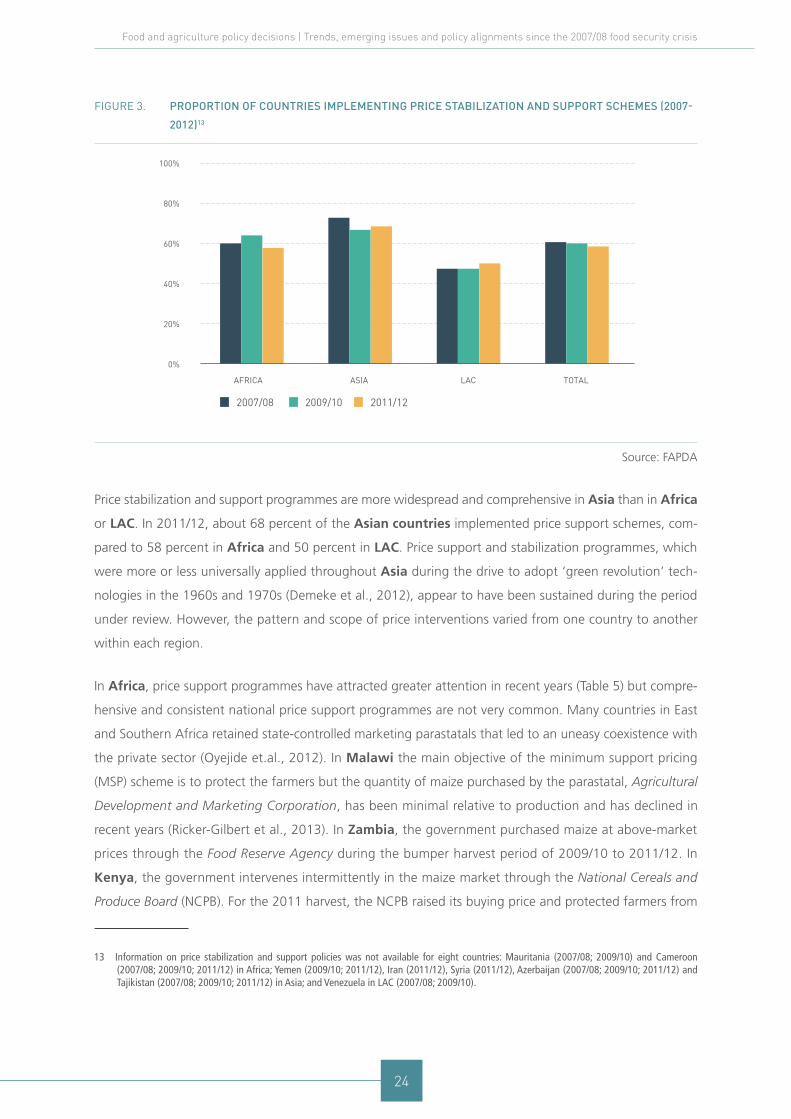
Figure 3. ProPortion of countries imPlementing Price stabilization and suPPort schemes (2007-
2012)13
2007/08 2009/10 2011/12
0%
20%
40%
60%
80%
100%
AFRICA ASIA LAC TOTAL
Source: FAPDA
Price stabilization and support programmes are more widespread and comprehensive in Asia than in Africa
or LAC. In 2011/12, about 68 percent of the Asian countries implemented price support schemes, com-
pared to 58 percent in Africa and 50 percent in LAC. Price support and stabilization programmes, which
were more or less universally applied throughout Asia during the drive to adopt ‘green revolution’ tech-
nologies in the 1960s and 1970s (Demeke et al., 2012), appear to have been sustained during the period
under review. However, the pattern and scope of price interventions varied from one country to another
within each region.
In Africa, price support programmes have attracted greater attention in recent years (Table 5) but compre-
hensive and consistent national price support programmes are not very common. Many countries in East
and Southern Africa retained state-controlled marketing parastatals that led to an uneasy coexistence with
the private sector (Oyejide et.al., 2012). In Malawi the main objective of the minimum support pricing
(MSP) scheme is to protect the farmers but the quantity of maize purchased by the parastatal, Agricultural
Development and Marketing Corporation, has been minimal relative to production and has declined in
recent years (Ricker-Gilbert et al., 2013). In Zambia, the government purchased maize at above-market
prices through the Food Reserve Agency during the bumper harvest period of 2009/10 to 2011/12. In
Kenya, the government intervenes intermittently in the maize market through the National Cereals and
Produce Board (NCPB). For the 2011 harvest, the NCPB raised its buying price and protected farmers from
13 Information on price stabilization and support policies was not available for eight countries: Mauritania (2007/08; 2009/10) and Cameroon (2007/08; 2009/10; 2011/12) in Africa; Yemen (2009/10; 2011/12), Iran (2011/12), Syria (2011/12), Azerbaijan (2007/08; 2009/10; 2011/12) and Tajikistan (2007/08; 2009/10; 2011/12) in Asia; and Venezuela in LAC (2007/08; 2009/10).
25
falling prices but maize prices decreased markedly after NCPB stopped buying the commodity in January
2012 (Kamau et. al., 2012). Nigeria introduced a guaranteed minimum price (GMP) scheme in 2009 but the
level of procurement by the National Food Reserve Agency (NFRA) fluctuated sharply.14 In 2010/11, market
prices were far higher than the GMP and farmers preferred to sell at the prevailing market price (Olomola,
2013). In North Africa, Algeria, Egypt, Morocco and Tunisia used price support programmes during the
period 2007/08 to 2011/12 but not on a regular basis.
In Asia, most of the major agricultural economies (Table 5) have price support schemes and the level of
support is increasing over time. To better support grain production and provide farmers with incentives to
grow grain, the Chinese government has been raising minimum purchase prices for wheat and rice. The
Food Corporation of India has bought wheat, rough rice and milled rice for MSPs that have been announced
well before the planting seasons. In response to rising international prices and declining wheat stocks that
began in 2005, the Indian government raised the MSP for each staple grain. The procured foodgrains are
used for distribution to poor consumers or for export at times of surplus. Similarly, in Bangladesh, domestic
procurement serves the dual purpose of building rice stocks for the Public Foodgrain Distribution System
and providing income support to farmers. The fixed MSP for rice in Bangladesh is well above the market
price and is the highest among Asian countries15. In Indonesia and the Philippines price support schemes
are used to stimulate food production and ensure self-sufficiency, while in Thailand the main objective is
to support farmers’ incomes and boost rice production for exports. Thailand’s new policy of guaranteeing
farmers’ prices at levels well above the market rate has led to a reduction in its rice exports and an increase in
government rice stocks (IFPRI, 2013). A few Asian countries, including Viet Nam, Pakistan and Sri Lanka,
maintain a small-scale intervention but the magnitude is increasing.
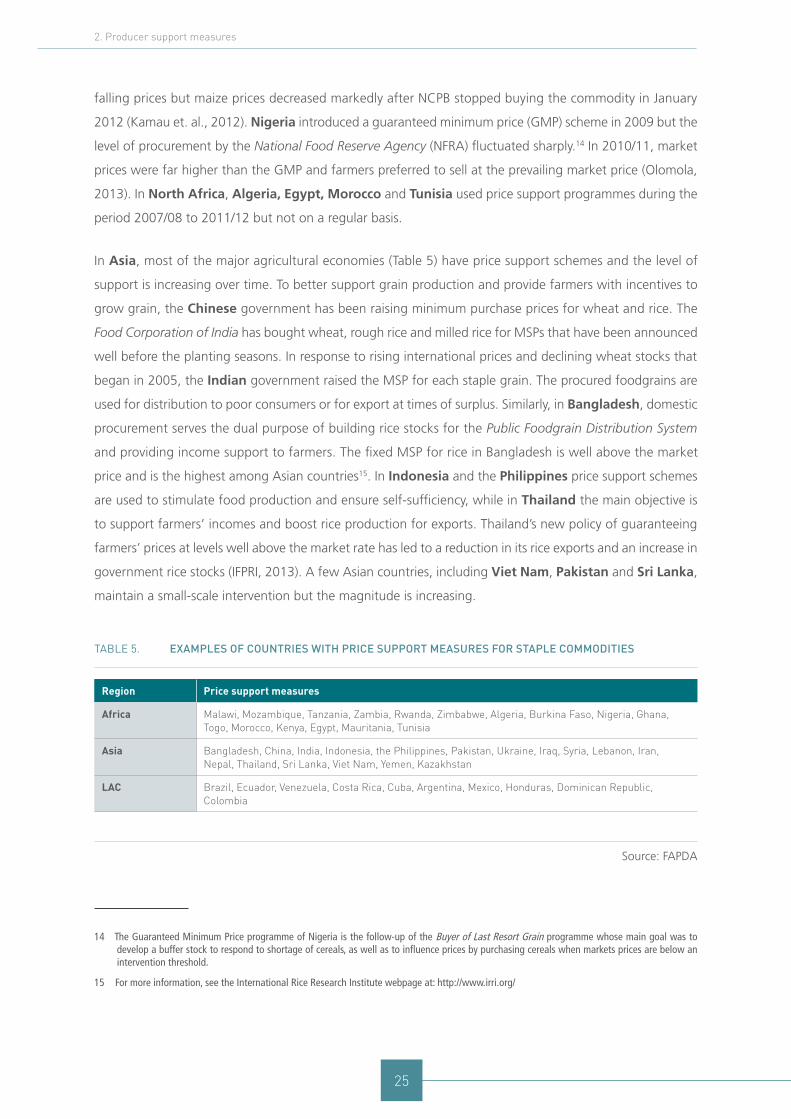
Table 5. examPles of countries with Price suPPort measures for staPle commodities
Region Price support measures
Africa Malawi, Mozambique, Tanzania, Zambia, Rwanda, Zimbabwe, Algeria, Burkina Faso, Nigeria, Ghana, Togo, Morocco, Kenya, Egypt, Mauritania, Tunisia
Asia Bangladesh, China, India, Indonesia, the Philippines, Pakistan, Ukraine, Iraq, Syria, Lebanon, Iran, Nepal, Thailand, Sri Lanka, Viet Nam, Yemen, Kazakhstan
LAC Brazil, Ecuador, Venezuela, Costa Rica, Cuba, Argentina, Mexico, Honduras, Dominican Republic, Colombia
Source: FAPDA
14 The Guaranteed Minimum Price programme of Nigeria is the follow-up of the Buyer of Last Resort Grain programme whose main goal was to develop a buffer stock to respond to shortage of cereals, as well as to influence prices by purchasing cereals when markets prices are below an intervention threshold.
15 For more information, see the International Rice Research Institute webpage at: http://www.irri.org/
2. Producer support measures
26
Food and agriculture policy decisions | Trends, emerging issues and policy alignments since the 2007/08 food security crisis
Price support programmes are applied intermittently in some Middle East economies. The Government of
Lebanon, for instance, guaranteed prices for farmers, purchased wheat at a higher price from local pro-
ducers in 2007 and 2009 and then sold it at lower prices. In 2008 and 2010, market prices were higher;
farmers sold directly to the market, and the government bought only a small quantity of locally produced
wheat. Iran, Lebanon, Iraq and conflict-affected countries such as Syria and Yemen, implemented price
support programmes sporadically.
In LAC, price support programmes are less popular than credit, input subsidies or insurance programmes.
Only a few LAC countries, such as Brazil, Mexico, Ecuador, Dominican Republic and Venezuela operate
large-scale price support programmes. Brazil uses its national food reserve system to stabilize local prices
of staple crops such as maize, and also to foster and support smallholder agriculture and family farms. The
Companhia Nacional de Abastecimento (National Supply Company, CONAB), which manages food supply,
stocks and distribution, along with the Programa de Aquisição de Alimentos (Programme for the Acquisition
of Food, PAA), guarantee a minimum price to small food producers and buy grains from smallholders at
subsidized rates. The food purchased is then donated and re-circulated through local food-security related
organizations or lodged in the national or local food reserves (IATP, 2012). Price support levels have tended
to increase in recent years (IATP, 2012). Mexico provides market price support to some commodities, and
payments based on output (through the Ingreso Objetivo programme). Mexico has significantly reduced
market price support in favour of direct historical payments and more recently increased expenditure on
payments based on inputs. The country has large direct payment programmes and subsidy schemes to inputs
and crop insurance (OECD, 2011).
In general, countries that responded to the 2007/08 food crisis with price stabilization and support measures
did not change their market intervention policies in 2009/10 and 2011/12. However, the measure is applied
more consistently and systematically in Asia for the purpose of increasing farm income, ensuring food secu-
rity, or boosting production for export.
27
2.4 Agricultural insurance provisions and risk management
Agricultural activities are particularly prone to risk, especially in relation to extreme natural events (e.g.
droughts, floods, pests and diseases) that have a significant impact on yields and in turn on price volatility.
High levels of risk in agriculture prompted many governments to get involved in agricultural insurance pro-
grammes and disaster risk management schemes during the study period. About 74 percent of the surveyed
countries with available data had provisions for improving access to insurance and disaster risk management
in 2011/12. The proportion consistently increased: from 68 percent in 2007/08 to 71 percent in 2009/10
and 74 percent in 2011/12 (Figure 4).
The incidence of agricultural insurance and disaster risk management schemes is higher in LAC and Asia
than in Africa; of the surveyed countries with data available about 80 percent of the LAC and around
90 percent of the Asian countries had national agricultural insurance and risk management schemes in
2011/12, compared to around 56 percent in Africa. Governments with national programmes have relied
on two major approaches in support of insurance programmes: public insurance and related schemes, and
premium subsidies.
Key Findings
•The proportion of countries implementing insurance and risk management measures increased:
from 68 percent in 2007/08 to 71 percent in 2009/10 and 74 percent in 2011/12.
•Government policies in agricultural insurance and reinsurance services, as well as disaster
management, have increasingly favoured public-private partnerships, especially in LAC and Asia.
• In Africa, with a few exceptions, there is almost no tradition of national agricultural insurance
provision, while disaster risk management is dependent on donors’ generosity but is being
restructured and institutionalized in many countries of the region.
• In Asia, reform measures have led to the emergence of a combination of public, private and
public-private models of agricultural insurance along with government-based natural disaster risk
management programmes.
• In LAC, state-owned insurance companies have gained popularity but operate alongside private
insurance companies, offering special services, such as reinsurance and insurance coverage, to
catastrophic risks.
2. Producer support measures
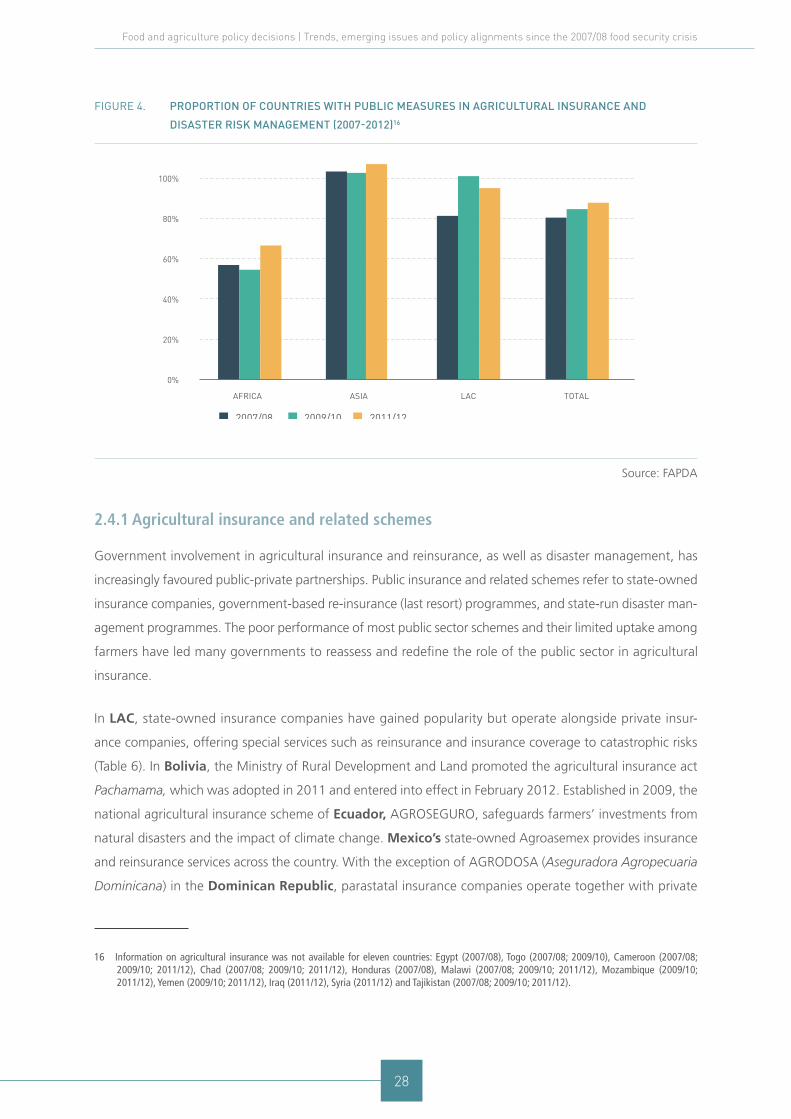
28
Food and agriculture policy decisions | Trends, emerging issues and policy alignments since the 2007/08 food security crisis
Figure 4. ProPortion of countries with Public measures in agricultural insurance and
disaster risk management (2007-2012)16
0%
20%
40%
60%
80%
100%
AFRICA ASIA LAC TOTAL
2007/08 2009/10 2011/12
Source: FAPDA
2.4.1 Agricultural insurance and related schemes
Government involvement in agricultural insurance and reinsurance, as well as disaster management, has
increasingly favoured public-private partnerships. Public insurance and related schemes refer to state-owned
insurance companies, government-based re-insurance (last resort) programmes, and state-run disaster man-
agement programmes. The poor performance of most public sector schemes and their limited uptake among
farmers have led many governments to reassess and redefine the role of the public sector in agricultural
insurance.
In LAC, state-owned insurance companies have gained popularity but operate alongside private insur-
ance companies, offering special services such as reinsurance and insurance coverage to catastrophic risks
(Table 6). In Bolivia, the Ministry of Rural Development and Land promoted the agricultural insurance act
Pachamama, which was adopted in 2011 and entered into effect in February 2012. Established in 2009, the
national agricultural insurance scheme of Ecuador, AGROSEGURO, safeguards farmers’ investments from
natural disasters and the impact of climate change. Mexico’s state-owned Agroasemex provides insurance
and reinsurance services across the country. With the exception of AGRODOSA (Aseguradora Agropecuaria
Dominicana) in the Dominican Republic, parastatal insurance companies operate together with private
16 Information on agricultural insurance was not available for eleven countries: Egypt (2007/08), Togo (2007/08; 2009/10), Cameroon (2007/08; 2009/10; 2011/12), Chad (2007/08; 2009/10; 2011/12), Honduras (2007/08), Malawi (2007/08; 2009/10; 2011/12), Mozambique (2009/10; 2011/12), Yemen (2009/10; 2011/12), Iraq (2011/12), Syria (2011/12) and Tajikistan (2007/08; 2009/10; 2011/12).
29
insurance companies. In other words, state-owned insurance and reinsurance companies in the region are
subject to the same legal framework as the privately owned insurance and reinsurance companies. Public-
private partnership is also a common trend in the region. The Brazilian government in 2008, for instance,
enacted a law creating the Fundo de Catástrofe Rural, a public-private partnership that includes the gov-
ernment of Brazil, the private insurance sector, agro-industries and cooperatives, to create mechanisms to
cap the potential losses faced by insurers and encourage them to underwrite agricultural business in risky
geographic areas and for risky crops. Pure market-based private insurers, normally backed by private rein-
surers, compete for underwriting agricultural insurance in all LAC countries.
In situations where agricultural production is exposed to the risk of catastrophic windstorms, excess rains
or droughts, the insurance industry may not have the appetite to underwrite agricultural risks and govern-
ments usually intervene after the disaster struck (in ex-post fashion). Reliance on government post-disaster
aid is widespread in most of the Caribbean countries as well as Bolivia, Mexico and Brazil. On the
other hand, agricultural insurance complements governments’ post-disaster assistance in LAC countries
with more sophisticated financial markets (such as Brazil and Mexico). The public sector (at the national
and sub-national levels) in several LAC countries (e.g. Mexico in 2001, Colombia in 2010, Peru in 2010
and Argentina in 2009) has recently begun to purchase private agricultural insurance coverage to transfer
catastrophic agricultural risks to international markets and protect small traditional and semi-commercial
farmers.
In Asia, reform measures have led to the emergence of a combination of public, private and public-private
models of agricultural insurance along with government-based natural disaster risk management pro-
grammes (Table 6). India is administering the world’s largest crop insurance programme in terms of the
number of farmers insured. The National Agricultural Insurance Scheme (NAIS) annually insures approxi-
mately 18 million farmers, or 15 percent of all farmers. The Indian government decided to reform the NAIS
in 2010/11 and move from a public social insurance programme to a market-based insurance scheme. In
China, where the People’s Insurance Company of China enjoyed a near monopoly over agricultural insur-
ance, the government promoted a major expansion of private sector-led agricultural insurance and by 2008
all agricultural insurance was provided by private and or mutual insurance companies (no public sector agri-
cultural insurers). In Iran, the governmental Insurance Fund for Agricultural Products (a monopoly) increased
insurance coverage, jumping above 30 percent of total hectares of the farming lands under cultivation
during the reporting period.
Market-based agricultural insurance companies operate in India, Pakistan, the Philippines, Thailand and
Viet Nam. However, most of the private companies are small and recently began operation as pilot schemes.
Government is involved in agricultural reinsurance in Sri Lanka, Thailand, China, Viet Nam and India.
The Sri Lankan government is understood to be the only provider of agricultural reinsurance. Meanwhile
the governments in China, Viet Nam, Thailand and India act as a catastrophe reinsurer, but their markets are
2. Producer support measures
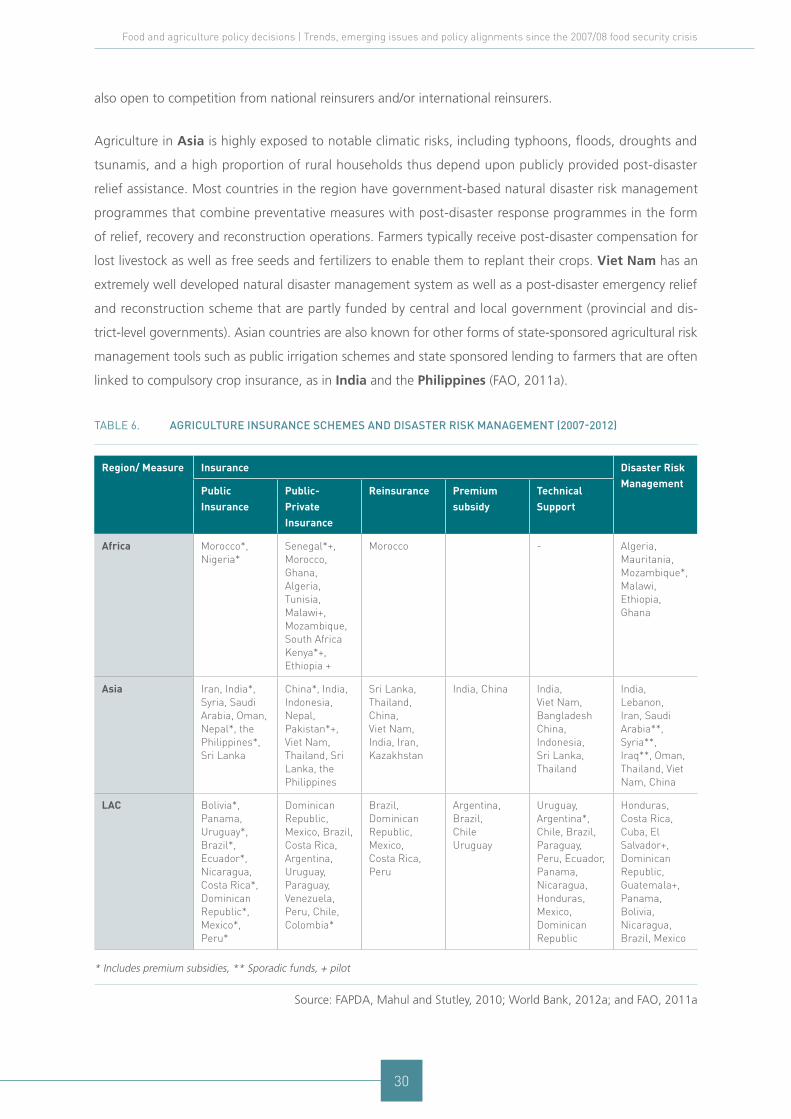
30
Food and agriculture policy decisions | Trends, emerging issues and policy alignments since the 2007/08 food security crisis
also open to competition from national reinsurers and/or international reinsurers.
Agriculture in Asia is highly exposed to notable climatic risks, including typhoons, floods, droughts and
tsunamis, and a high proportion of rural households thus depend upon publicly provided post-disaster
relief assistance. Most countries in the region have government-based natural disaster risk management
programmes that combine preventative measures with post-disaster response programmes in the form
of relief, recovery and reconstruction operations. Farmers typically receive post-disaster compensation for
lost livestock as well as free seeds and fertilizers to enable them to replant their crops. Viet Nam has an
extremely well developed natural disaster management system as well as a post-disaster emergency relief
and reconstruction scheme that are partly funded by central and local government (provincial and dis-
trict-level governments). Asian countries are also known for other forms of state-sponsored agricultural risk
management tools such as public irrigation schemes and state sponsored lending to farmers that are often
linked to compulsory crop insurance, as in India and the Philippines (FAO, 2011a).
Table 6. agriculture insurance schemes and disaster risk management (2007-2012)
Region/ Measure Insurance Disaster Risk Management
Public Insurance
Public-Private Insurance
Reinsurance Premium subsidy
Technical Support
Africa Morocco*, Nigeria*
Senegal*+, Morocco, Ghana, Algeria, Tunisia, Malawi+, Mozambique, South Africa Kenya*+, Ethiopia +
Morocco - Algeria, Mauritania, Mozambique*, Malawi, Ethiopia, Ghana
Asia Iran, India*, Syria, Saudi Arabia, Oman, Nepal*, the Philippines*, Sri Lanka
China*, India, Indonesia, Nepal, Pakistan*+, Viet Nam, Thailand, Sri Lanka, the Philippines
Sri Lanka, Thailand, China, Viet Nam, India, Iran, Kazakhstan
India, China India, Viet Nam, Bangladesh China, Indonesia, Sri Lanka, Thailand
India, Lebanon, Iran, Saudi Arabia**, Syria**, Iraq**, Oman, Thailand, Viet Nam, China
LAC Bolivia*, Panama, Uruguay*, Brazil*, Ecuador*, Nicaragua, Costa Rica*, Dominican Republic*, Mexico*, Peru*
Dominican Republic, Mexico, Brazil, Costa Rica, Argentina, Uruguay, Paraguay, Venezuela, Peru, Chile, Colombia*
Brazil, Dominican Republic, Mexico, Costa Rica, Peru
Argentina, Brazil, Chile Uruguay
Uruguay, Argentina*, Chile, Brazil, Paraguay, Peru, Ecuador, Panama, Nicaragua, Honduras, Mexico, Dominican Republic
Honduras, Costa Rica, Cuba, El Salvador+, Dominican Republic, Guatemala+, Panama, Bolivia, Nicaragua, Brazil, Mexico
* Includes premium subsidies, ** Sporadic funds, + pilot
Source: FAPDA, Mahul and Stutley, 2010; World Bank, 2012a; and FAO, 2011a
31
In Africa, with the exception of South Africa, Nigeria, Algeria, Morocco and Tunisia, there is almost
no tradition of national agricultural insurance provision. In Nigeria, the state-owned Nigeria Agricultural
Insurance Corporation holds a de-facto agricultural insurance monopoly but its coverage has remained very
limited (Eleri et.al, 2012). Conversely, South Africa has a longer tradition and stronger agricultural insur-
ance services. Seven private commercial and mutual companies and underwriting agencies currently offer
crop and livestock insurance, or both to commercial farmers (DHNA Foundation) (Mahul and Stutley, 2010).
However, South Africa has no insurance programme for small farmers. In North Africa, Morocco expanded
the coverage of its national insurance programme (the Mutuelle Agricole Marocaine d’Assurances) in 2012.
Public-private and private models of agricultural insurance have emerged in several African countries. In
Ghana, the Agricultural Insurance Programme was launched in 2011 and developed the first agricultural
insurance products to protect farmers from the negative impacts of climate change. It represents an example
of public-private partnership in the agricultural insurance system, since the steering committee coordinating
the programme is composed of representatives of the public sector, the private sector and development
agencies. In North Africa, insurance services based on public-private partnerships are found in Algeria and
Tunisia. The coverage of agricultural insurance in Algeria expanded by 98 percent in 2010. However, agri-
cultural insurance accounts for just one percent of the domestic insurance market (Mena Insurance CEO
Club, 2013). Other African countries have pilot insurance programmes which reach only a limited number
of farmers and herders. The provision of public agricultural reinsurance is also underdeveloped in Africa.
Disaster risk management is dependent on donors’ generosity but is being restructured and institutionalized
in many parts of Africa (Commission of the African Union, ISDR and the World Bank, 2008). A number of
countries have taken measures to strengthen their national disaster risk management (DRM) and formulate
national policies, strategies and action plans. In Malawi, Mozambique and Ghana, for instance, projects
were designed (in partnership with the World Bank) between 2007 and 2010 to mainstream DRM into
strategic plans and sectoral development policies. Some countries have started looking for contingency
financing mechanisms to finance the projects. For the agricultural seasons 2008/09 through to 2011/12, the
Government of Malawi purchased, with the co-financing support of donors, drought protection in the form
of weather derivative contracts which provided coverage against the risk of severe drought during the critical
rainfall season (World Bank, 2012a). In Ethiopia, contingent financing mechanisms were first introduced
by the government in 2006 for drought response. In 2010 a contingent financing window, supported by
different donors, was made a permanent feature of the country’s productive safety-net programme.
2.4.2 Premium subsidies
Premium subsidies, which refer to the proportion of the total premium subsidized by the government, are
among the most common forms of public intervention in support of agricultural insurance. Agricultural
premium subsidy schemes are often designed to increase the participation of farmers to purchase insurance
2. Producer support measures

32
Food and agriculture policy decisions | Trends, emerging issues and policy alignments since the 2007/08 food security crisis
coverage and make agricultural insurance programmes attractive to private insurers.
In LAC, premium subsidies are widely applied and have attracted increased public budgetary allocations
in recent years. Government expenditure on premium subsidies increased sharply in Brazil and Mexico in
2009 (World Bank, 2010a). Many LAC countries have developed policies that channel premium subsidies to
enhance food security objectives. Costa Rica offers higher premium subsidies to small and marginal farmers
than to larger farmers. Argentina and Uruguay channel premium subsidies to specific crop insurance pro-
grammes. In Colombia, premium subsidies currently account for 60 percent of the premium value. Several
countries, including Brazil and Chile, have a limit (cap) on the maximum amount of premium subsidies
that any farmer can receive, preventing large farmers from capturing a disproportionate share. Several LAC
governments also maintain technical support units to promote and assist the development of agricultural
insurance markets.17
Premium subsidies are less common in Asia than LAC and have taken different forms and scale (FAO,
2011a). India’s government policy is to make agricultural insurance as widely available and affordable as
possible to small farmers using a premium subsidy which can be as high as 75 percent and technical support
(e.g. conducting crop-cutting experiments (CCE) in the fields that are used to determine the average yield
levels for each crop, which are used to indemnify area-yield losses). It should be noted that India launched
the first micro-level or individual farmer weather index insurance (WII) programme in 2003. Since then, it has
been scaled up by both the public and private insurance companies with the support of a government pre-
mium subsidy. China operates variable premium subsidies and the levels of agricultural insurance premium
subsidy have increased significantly in recent years (FAO, 2011a). Viet Nam conducts extensive research and
development into weather index insurance with the aim of supporting rice farmers.
In Africa, a few pilot cases that emerged during the reference period often used premium subsidies as a
tool to promote insurance. In Senegal the agricultural-specific insurance company, Compagnie Nationale
d’Assurance Agricole du Sénégal, was established in 2009 as a pool company. It is owned by the state, local
insurers and banks and receives a 50 percent premium subsidy from the state18. Most of the pilot agricultural
insurance schemes operate with the support of agribusiness firms and donors. In Kenya, for instance, half
of the premium for the Killimo Salama agricultural insurance scheme is paid by agribusiness partners such
as Syngenta East Africa Limited. Capacity-building efforts and technical support to insurance products are
lacking for the most part in Africa. Agricultural development strategies and investment plans do not have
provisions for insurance or risk management instruments in the continent. This gap has recently prompted
17 These units perform diverse activities, including gathering basic information needed to develop agricultural insurance, assessing the risks for differ-ent agricultural activities in different areas of the country, developing products to assist farmers and the industry in risk management, developing agricultural insurance products (such as crop and/or weather risk maps), conducting agricultural risk assessments and creating farmer awareness education and training.
18 For more information, please see; http://www.swissre.com/rethinking/food_security/Agricultural_insurance_helps_enhance_food_security_in_Af-rica.html
33
the Comprehensive Africa Agriculture Development Programme (CAADP) of the New Partnership for Africa’s
Development (NEPAD) to launch an initiative aimed at integrating risk management tools, including agricul-
tural insurance, into national and regional agricultural investment plans (NEPAD, 2012).
2.5 Land-related policy measures
Overall, the proportion of countries implementing land-related measures increased from 71 percent in
2007/08 to 82 percent in 2011/12. With a growing population pressure and increased investors’ interest in
land acquisitions, land markets have expanded and governments have been forced to implement policies
in order to ensure that local communities have adequate access and tenure security over the land they
cultivate. However, there are regional differences: the percentage of countries implementing land policies
was higher in LAC (on average 88 percent) and Asia (85 percent) than in Africa (61 percent) during the
reference period. Many African countries have yet to take actions but several governments are reviewing
their land policies and the proportion of counties introducing new measures has increased sharply in recent
years, from 43 percent in 2007/08 to 70 percent in 2011/12 (Figure 5).
Land policies designed to improve access to land for smallholders and marginalized groups have used various
instruments, ranging from expanding credit for land acquisitions to land distributions. Some recent land
policies are used to target the governance of foreign land investment.
2.5.1 Land policies to improve farmers’ access to land
Governments have a number of measures at their disposal to improve access to land for small farmers: land
distribution for the extremely poor and marginalized, land titling for farmers who own land on a customary
Key findings
•The proportion of countries adopting measures to improve access to land and tenure security
increased over time. In Africa, the proportion has increased sharply.
• In Africa and Asia, legislative and administrative measures are employed to improve tenure
security of smallholders, while in LAC, land tenure issues are tackled through land distributions
and titling or broader land reform programmes.
•Concerns about potential social and political conflicts associated with large-scale land acquisitions
have led to policy responses at three different levels: investing countries, host countries and
international communities.
2. Producer support measures
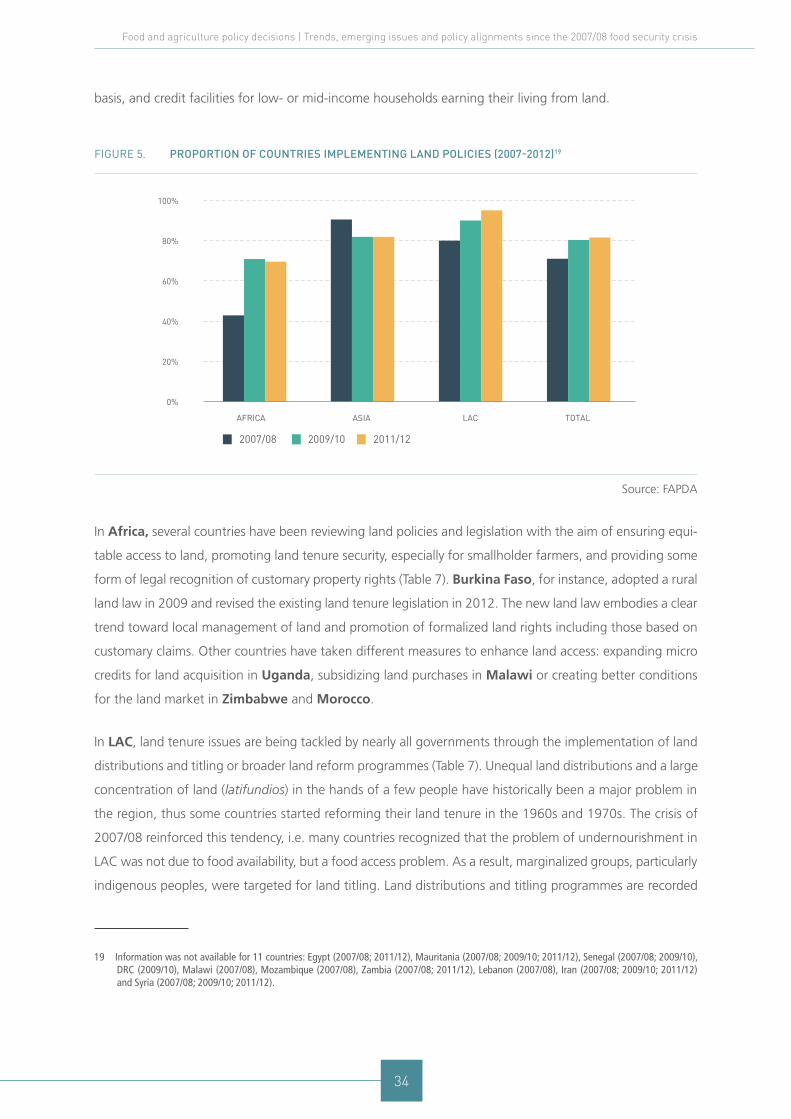
34
Food and agriculture policy decisions | Trends, emerging issues and policy alignments since the 2007/08 food security crisis
basis, and credit facilities for low- or mid-income households earning their living from land.
Figure 5. ProPortion of countries imPlementing land Policies (2007-2012)19
0%
20%
40%
60%
80%
100%
AFRICA ASIA LAC TOTAL
2007/08 2009/10 2011/12
Source: FAPDA
In Africa, several countries have been reviewing land policies and legislation with the aim of ensuring equi-
table access to land, promoting land tenure security, especially for smallholder farmers, and providing some
form of legal recognition of customary property rights (Table 7). Burkina Faso, for instance, adopted a rural
land law in 2009 and revised the existing land tenure legislation in 2012. The new land law embodies a clear
trend toward local management of land and promotion of formalized land rights including those based on
customary claims. Other countries have taken different measures to enhance land access: expanding micro
credits for land acquisition in Uganda, subsidizing land purchases in Malawi or creating better conditions
for the land market in Zimbabwe and Morocco.
In LAC, land tenure issues are being tackled by nearly all governments through the implementation of land
distributions and titling or broader land reform programmes (Table 7). Unequal land distributions and a large
concentration of land (latifundios) in the hands of a few people have historically been a major problem in
the region, thus some countries started reforming their land tenure in the 1960s and 1970s. The crisis of
2007/08 reinforced this tendency, i.e. many countries recognized that the problem of undernourishment in
LAC was not due to food availability, but a food access problem. As a result, marginalized groups, particularly
indigenous peoples, were targeted for land titling. Land distributions and titling programmes are recorded
19 Information was not available for 11 countries: Egypt (2007/08; 2011/12), Mauritania (2007/08; 2009/10; 2011/12), Senegal (2007/08; 2009/10), DRC (2009/10), Malawi (2007/08), Mozambique (2007/08), Zambia (2007/08; 2011/12), Lebanon (2007/08), Iran (2007/08; 2009/10; 2011/12) and Syria (2007/08; 2009/10; 2011/12).

35
in nearly all LAC countries (Table 7). Some countries implemented comprehensive land reform measures:
Colombia launched its land reform in 2010 (mainly to address the problem of its displaced groups after its
internal armed conflict); Brazil, although pursuing agrarian reform since the 1970s, increased its efforts in
2009 with major land distributions carried out through INCRA – Instituto Nacional de Colonização e Reforma
Agrária; Ecuador introduced major reforms in 2009, adopting a new constitution declaring that land has
a social value and thus unproductive lands can be expropriated; Bolivia pursued land reform since 2006,
establishing in 2009 the possibility of expropriating land ‘not fulfilling its social value’ and introducing in
2011 the Plan Nacional de Titulación Masiva de Tierras; Argentina imposed a limit on land ownership by
non-citizens (Box 3); and Venezuela adopted radical land reform; the Instituto Nacional de Tierras, created
in 2001, has been implementing large-scale land expropriations and redistributions to small farmers since
2006.
In Asia, most countries attempted to address land issues primarily by using legislative and administrative
frameworks. Many countries have introduced new policies or amended existing land policies (Table 7). In
India, an amended Land Acquisition Bill was passed in February 2009 with the goal of reducing involuntary
displacement and providing greater compensation and an improved legal process to those whose land is
taken away, among others. The National Land Title Registration programme (2007-2022) of Sri Lanka is
under implementation to survey and demarcate land, issue titles and strengthen land ownership within a
time frame of 15 years. By 2010, the Vietnamese government had issued approximately 31.3 million land-
use right certificates (LURCs), covering roughly half of Viet Nam’s land area, to enhance tenure security.
New land legislation was approved to improve access to land (Iraq, Oman, Thailand and Yemen). Iraq has
also facilitated foreign investments in land in 2007. Yemen passed a law allowing foreigners to own land
but restricting foreign ownership to 49 percent afterwards.
Table 7. examPles of countries with land-related Policy measures (2007-2012)
Region Policies aimed at land distribution and/or tenure security for smallholder farmers
Africa Algeria, Ethiopia, Kenya, Rwanda, Senegal, South Africa, Tanzania, Burkina Faso, Cameroon, Ethiopia, Kenya, Liberia, Malawi, Mauritania, Morocco, Rwanda, Tunisia, Uganda, Zambia, Zimbabwe
Asia Cambodia, Iraq, Oman, Sri Lanka, Afghanistan, Azerbaijan, Bangladesh, Bhutan, India, Indonesia, Iraq, Kazakhstan, the Philippines Thailand, Tajikistan, Thailand, Ukraine, Viet Nam Yemen
LAC Argentina, Bolivia, Brazil, Chile, Colombia, Ecuador, Paraguay, Uruguay, Venezuela, Costa Rica, Cuba, Dominican Republic, El Salvador, Guatemala, Haiti, Honduras, Mexico, Nicaragua, Panama
Source: FAPDA
2. Producer support measures
36
Food and agriculture policy decisions | Trends, emerging issues and policy alignments since the 2007/08 food security crisis
2.5.2 Policies for governing foreign direct investments in land
Interest in foreign direct investment (FDI) in land is mainly driven by long-term goals, such as growing
consumption of food and biofuels in the context of limited availability of arable land, water and energy.
Investors are looking for secure access to food and other agricultural products as well as attractive financial
returns, while host countries expect to benefit from job creations, increased foreign exchange earnings
and a boost in food supplies to the local market. However, there are risks associated with large-scale land
acquisitions. Investors may be allocated land and water belonging to local communities who receive little
or no compensation, resulting in social and political conflict, especially in countries with weak governance
and inadequately defined land tenure systems. Land allocated to grow food and biofuels for export may
not only reduce supply of food to local markets but may also result in land degradation and deforestation.
Such concerns have led to policy responses at three different levels: investing countries, host countries and
international communities.
Investing countries
FDI in agriculture primarily originates from emerging countries (e.g. Brazil, South Africa, India, Malaysia
and Korea), the Middle East and North Africa (MENA) region and developed nations (namely the United
States and European countries). Investors from North and South America and Europe are almost exclu-
sively private companies while the main actors from the Middle East, and to a lesser extent from China and
South Korea, are state-owned companies. For instance, some MENA countries, which are among the most
heavily dependent on imported food, have created special institutions in support of farmland purchase in
foreign countries.
Following the shift away from the expensive self-sufficiency policy in agriculture (due to scarce water
resources), Saudi Arabia launched in 2008 a package of measures in support of private investors and
established in 2009 the King Abdullah’s Initiative for Saudi Agricultural Investment Abroad. The first initia-
tive grants credit facilities through public financial institutions and finance infrastructure projects in targeted
countries. King Abdullah’s Initiative, a public organization, identifies suitable hosting countries, signs bilateral
agreements and has established the Saudi Company for Agricultural Investment and Animal Production
(Cotula et. al., 2009; Green, 2012; Hallam, 2010). Also, the Chinese government has recently issued several
regulations as well as financial subsidies and concessions to support the acquisition of land in foreign coun-
tries for production purposes, in the attempt to overcome domestic resource limitations (land and water) and
avoid over-reliance on international markets to ensure food imports (Hongzhou and Zhang, 2013).

37
Host countries
It is estimated that over 80 countries are targeted by foreign investors but 11 of them account for 70
percent of targeted surface areas according to Land Matrix.20 About two-thirds of the targeted farmland
area is located in Africa, mainly Sudan, South Sudan, Mozambique, Tanzania, Ethiopia, Madagascar,
Liberia, DRC and Zambia. Argentina and Brazil from LAC and Indonesia and Lao PDR from Asia are
also among the target countries for investment in land. The policy response of recipient countries has varied
from one of providing generous incentives with few restrictions to imposing conditions on ownership of
land by foreigners.
Some countries have special policies aimed at attracting FDI in agriculture. In Ethiopia, the government
expects FDIs to produce export crops and hence increase the country’s foreign earnings, facilitate technology
transfers, create employment opportunities, improve social infrastructure (like roads, hospitals and schools),
and promote energy security through the production of biofuels. Hence, a number of policies have been put
in place to attract investors. In Ethiopia, a large tract of land in the southern and western part of the coun-
try is designated as free and readily available to interested investors; land rent is fixed by the government
at a very cheap rate and the land acquisition process for foreigners is highly simplified with no contractual
obligations. Investors are eligible for various tax exemptions and financial facilities, including exemptions
from custom duties and taxes on imports of capital goods; and land use fee exemptions for up to five years
and the right to fully repatriate, in convertible currency, profits and dividends. Tanzania has also approved a
scheme which grants investors five-year tax exemption, facilitates residence and working permits for foreign
workers, and confers the right to repatriate funds. In Iraq, the 2009/10 amendments to the investment law
stated the need to survey all land owned by the state with the objective of transferring state land to the
National Investment Commission for allocation to investors. The amendments allowed foreign investment
companies/individuals to rent Iraqi lands in partnership with Iraqis. In Yemen, a legislation allowing foreign-
ers to acquire and own land was passed by the cabinet in September 2007. The government passed a law
in 2008 for massive land registrations as it was a major hindrance to investments.
As a result of domestic political pressure and international initiatives to protect the land right of local com-
munities, several countries have taken steps to protect the interest of local communities and the recipient
countries. Some governments, including Cambodia (May 2012) and Lao PDR (June 2012) have imposed
a moratorium on land purchases by foreigners. Many LAC countries have drafted legislation to limit land
purchased by foreigners. Argentina restricted foreign rural land ownership to 15 percent of the total land in
the country in 2011 (Box 3) while Brazil restricted foreign ownership to 25 percent (down from 40 percent)
of the area of any municipality in 2010. In Uruguay, the state has the first option to buy in every farmland
20 For more information see: http://landmatrix.org/
2. Producer support measures
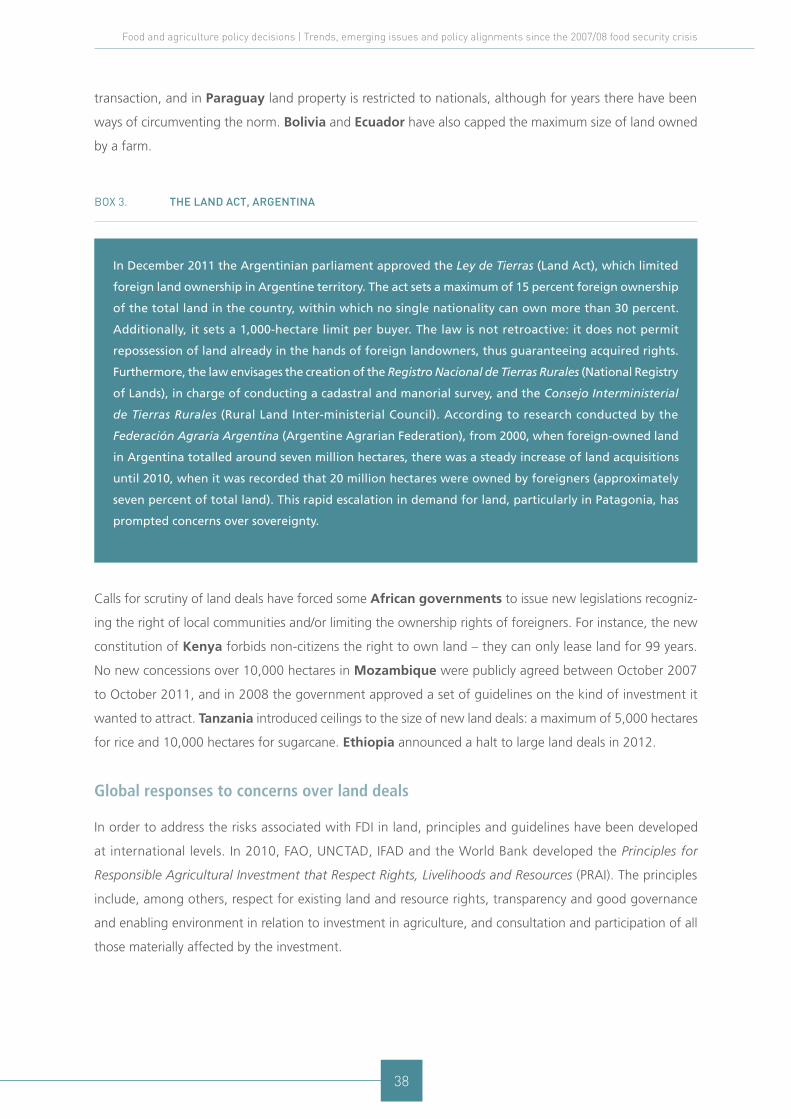
38
Food and agriculture policy decisions | Trends, emerging issues and policy alignments since the 2007/08 food security crisis
transaction, and in Paraguay land property is restricted to nationals, although for years there have been
ways of circumventing the norm. Bolivia and Ecuador have also capped the maximum size of land owned
by a farm.
box 3. the land act, argentina
Calls for scrutiny of land deals have forced some African governments to issue new legislations recogniz-
ing the right of local communities and/or limiting the ownership rights of foreigners. For instance, the new
constitution of Kenya forbids non-citizens the right to own land – they can only lease land for 99 years.
No new concessions over 10,000 hectares in Mozambique were publicly agreed between October 2007
to October 2011, and in 2008 the government approved a set of guidelines on the kind of investment it
wanted to attract. Tanzania introduced ceilings to the size of new land deals: a maximum of 5,000 hectares
for rice and 10,000 hectares for sugarcane. Ethiopia announced a halt to large land deals in 2012.
Global responses to concerns over land deals
In order to address the risks associated with FDI in land, principles and guidelines have been developed
at international levels. In 2010, FAO, UNCTAD, IFAD and the World Bank developed the Principles for
Responsible Agricultural Investment that Respect Rights, Livelihoods and Resources (PRAI). The principles
include, among others, respect for existing land and resource rights, transparency and good governance
and enabling environment in relation to investment in agriculture, and consultation and participation of all
those materially affected by the investment.
In December 2011 the Argentinian parliament approved the Ley de Tierras (Land Act), which limited
foreign land ownership in Argentine territory. The act sets a maximum of 15 percent foreign ownership
of the total land in the country, within which no single nationality can own more than 30 percent.
Additionally, it sets a 1,000-hectare limit per buyer. The law is not retroactive: it does not permit
repossession of land already in the hands of foreign landowners, thus guaranteeing acquired rights.
Furthermore, the law envisages the creation of the Registro Nacional de Tierras Rurales (National Registry
of Lands), in charge of conducting a cadastral and manorial survey, and the Consejo Interministerial
de Tierras Rurales (Rural Land Inter-ministerial Council). According to research conducted by the
Federación Agraria Argentina (Argentine Agrarian Federation), from 2000, when foreign-owned land
in Argentina totalled around seven million hectares, there was a steady increase of land acquisitions
until 2010, when it was recorded that 20 million hectares were owned by foreigners (approximately
seven percent of total land). This rapid escalation in demand for land, particularly in Patagonia, has
prompted concerns over sovereignty.
39
In May 2012, more than 100 member countries of the UN Committee on World Food Security (CFS) endorsed
the Voluntary Guidelines on the Responsible Governance of Tenure of Land, Fisheries and Forests in the
Context of National Food Security. The voluntary guidelines are a response to problems of tenure and weak
governance faced in many countries. They were developed in an inclusive and participatory process which
lasted more than three years, and provide internationally recognized principles and practices for improving
tenure governance. Many countries are currently calling the UN to help them to integrate these principles
into their national legislation as every context has to be well-addressed.
Conclusion
Producer support measures following the food crisis of 2007/08 have taken various forms. Among the
different measures reviewed in this report, subsidizing inputs and improving access to credit gained
widespread popularity in all the three regions. Many countries have opted for large-scale national
subsidy programmes and various credit policy instruments to enhance farm investment and achieve
a rapid increase in food production. Improving the efficiency of subsidy programmes has emerged
as a major issue and many countries have taken measures to change the design of input subsidy
programmes from universal coverage to targeted schemes, focusing on poorer households and/or
staple grains. Market failures in the credit market are being addressed through special programmes,
credit guarantee schemes and specialized banks in many countries.
Production support policy decisions have also included measures to address production, price and
land-right (institutional) risks. Insurance and other risk management tools to protect farmers against
price and production shocks have emerged as one of the key policy concerns in a growing number of
countries. Recent policy reforms to improve agricultural insurance services have often required state-
owned insurance companies to operate alongside private insurance companies and provide special
services, such as reinsurance and insurance coverage, to catastrophic risks. In an attempt to tackle
price risks, a number of countries adopted price stabilization and price support measures in 2007/08.
These policy decisions were sustained through 2009/10 and 2011/12 although the interventions
were applied more consistently and systematically in Asia than in Africa or LAC.
2. Producer support measures

This page intentionally left blank
41
3. Consumer support policy measures
FAO’s twin track approach to rural development aims to increase production and productivity (as discussed
in chapter two) while simultaneously leveraging the critical role played by social protection and social policy
to protect vulnerable groups from poverty and food insecurity. Consumer-support measures are part of
broader social protection strategies designed to ensure that economic access to food is guaranteed with
a particular focus on protecting poor and vulnerable groups from high and volatile food prices. Consumer
support measures discussed in this chapter are: consumer-related subsidies, food-based support programmes
and cash-based transfer programmes. The manner in which these policies were implemented during the
triple wave of food, finance and fuel crises from 2007 to 2009 and subsequent emerging issues are also
discussed in this section.
3.1 Consumer related subsidies
Universal price subsidies and untargeted sales of subsidized commodities are measures which aim to control
the prices of food and other essential goods, such as petroleum products (Grosh et al., 2008). The main
objective of consumer-related subsidies is to guarantee that all or certain groups of households have access
to these commodities at prices that they can afford. The rationale for using subsidies rather than cash trans-
fer may be to create incentives for specific consumption behaviors (Alderman, 2002) as well as administrative
considerations.
Consumer-related subsidies can be generalized (i.e. universal) or targeted. The most common design is an
untargeted subsidy that lowers the price of food or fuel for all consumers in a country (Alderman, 2002).
However, governments also use targeted subsidies to lower prices for certain households, targeting groups
by income level or by other criteria such as number of children or geographic location (HLPE, 2012). Among
the existing consumer-oriented subsidy instruments, this section focuses on direct and indirect food subsidies
and fuel subsidies.
3
42
Food and agriculture policy decisions | Trends, emerging issues and policy alignments since the 2007/08 food security crisis
3.1.1 Food subsidies
Direct food subsidies are government subsidized sales of unlimited or rationed quantities of staple food
commodities. These instruments are common in all regions, especially in Africa and Asia where close to
80 percent of the countries monitored used direct food subsidies during the reference period. On the other
hand, the proportion of LAC countries that applied direct food subsidies was lower in 2007/08 than other
regions and declined further in 2009/10 and 2011/12 (Figure 6).
Indirect food subsidies refer to tax (value added tax, VAT, or sales tax) exemptions or reductions are often
considered as an untargeted, price subsidy (Alderman, 2002). Many countries in Africa, Asia and LAC apply
some form of exemption or zero-rating on staple or unprocessed food in order to reduce the burden of high
food prices on poor households. Overall, about 73 percent of the countries surveyed had in place a regime
of VAT or sales tax exemption on basic food items over the reference period (2007-2012).21
21 Of the 71 countries surveyed, 40 implemented VAT exemptions/reduction over the reference period.
Key Findings
•Direct food subsidies and price control measures for basic staples were widely adopted and
remained popular in Africa and Asia throughout the reference period.
•The number of countries using indirect food subsidies has generally increased but VAT or sales tax
exemptions or reductions served only a temporary objective in many cases.
• In Africa, direct and indirect food subsidies were implemented mainly using targeted sales and
ad-hoc or temporary price controls measures.
• In Asia, long-established food subsidy programmes prevailed in many countries and such schemes
were expanded in some cases over the reference period. North Africa and Middle East countries
increased public spending on food subsidies in response to both the 2007/08 food crisis and the
political uprising in 2010/2011.
• In LAC, price control and domestic tax reduction measures have been used in response to the
2007-2009 food, fuel and financial crisis and a few countries have continued to implement these
measures over the reference period.
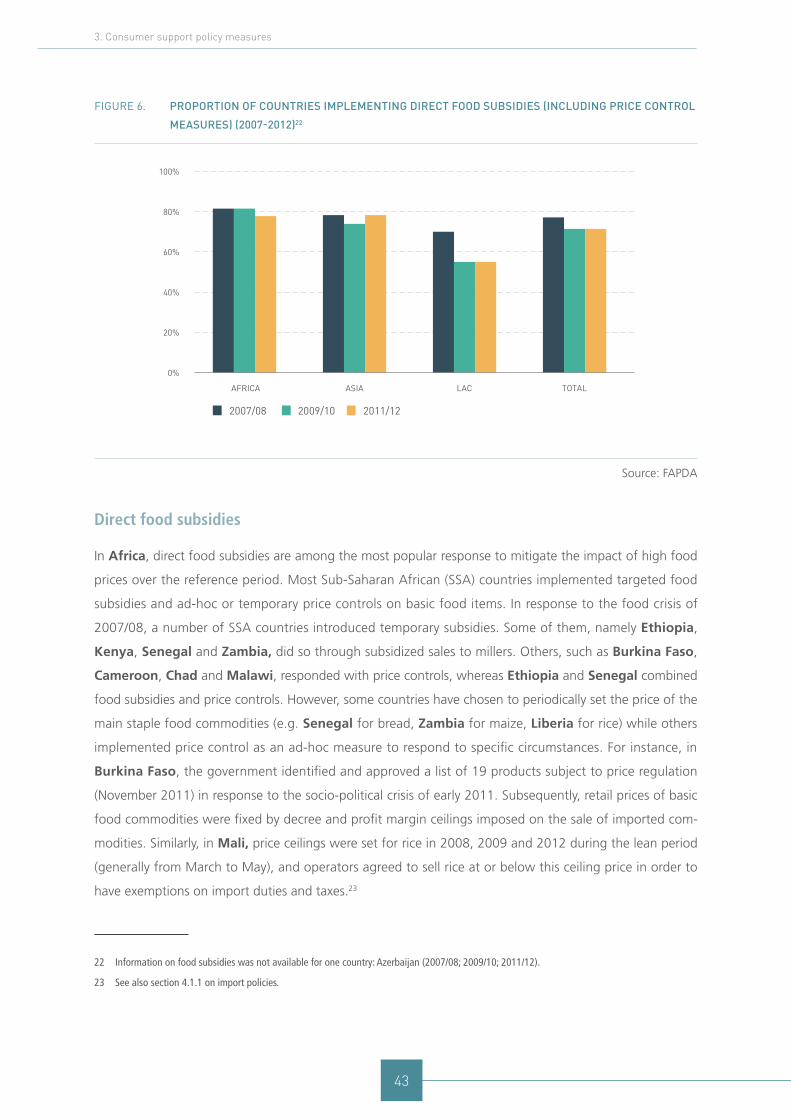
43
Figure 6. ProPortion of countries imPlementing direct food subsidies (including Price control
measures) (2007-2012)22
0%
20%
40%
60%
80%
100%
AFRICA ASIA LAC TOTAL
2007/08 2009/10 2011/12
Source: FAPDA
Direct food subsidies
In Africa, direct food subsidies are among the most popular response to mitigate the impact of high food
prices over the reference period. Most Sub-Saharan African (SSA) countries implemented targeted food
subsidies and ad-hoc or temporary price controls on basic food items. In response to the food crisis of
2007/08, a number of SSA countries introduced temporary subsidies. Some of them, namely Ethiopia,
Kenya, Senegal and Zambia, did so through subsidized sales to millers. Others, such as Burkina Faso,
Cameroon, Chad and Malawi, responded with price controls, whereas Ethiopia and Senegal combined
food subsidies and price controls. However, some countries have chosen to periodically set the price of the
main staple food commodities (e.g. Senegal for bread, Zambia for maize, Liberia for rice) while others
implemented price control as an ad-hoc measure to respond to specific circumstances. For instance, in
Burkina Faso, the government identified and approved a list of 19 products subject to price regulation
(November 2011) in response to the socio-political crisis of early 2011. Subsequently, retail prices of basic
food commodities were fixed by decree and profit margin ceilings imposed on the sale of imported com-
modities. Similarly, in Mali, price ceilings were set for rice in 2008, 2009 and 2012 during the lean period
(generally from March to May), and operators agreed to sell rice at or below this ceiling price in order to
have exemptions on import duties and taxes.23
22 Information on food subsidies was not available for one country: Azerbaijan (2007/08; 2009/10; 2011/12).
23 See also section 4.1.1 on import policies.
3. Consumer support policy measures
44
Food and agriculture policy decisions | Trends, emerging issues and policy alignments since the 2007/08 food security crisis
Unlike SSA countries, universal food subsidies have existed in North Africa for several decades. In some of
these countries, there was a clear trend of increased public spending on food subsidies in response to the
soaring prices of 2007/08 and the political uprising of 2010/2011, popularly known as the ‘Arab Spring’.
In Algeria, Morocco and Tunisia, new food items were included in the list of the 2007 and 2008 sub-
sidized products. Egypt increased the quantity of food distributed under the national ration card system
(unchanged since 1988) and new groups were included as eligible beneficiaries (e.g. retirees and people with
chronic diseases). The system reached approximately 64 million people (as of July 2011) representing nearly
79 percent of Egypt’s total population in 2008 (Ghoneim, 2012). Despite recent efforts made by some gov-
ernments to improve targeting (in Tunisia for instance), food subsidies remained universal in North Africa.
In Asia, direct food subsidies are a common practice and remained popular (similar to Africa) over the ref-
erence period. Some countries in South and East Asia have had large targeted food subsidy programmes in
place for decades which have recently been expanded (in India, Indonesia and the Philippines) or scaled
down in favour of other food-based safety nets (in Bangladesh). India, which has one of the world’s larg-
est food subsidy systems,24 significantly increased the total budget of the programme during the last six to
seven years, representing about five percent of agricultural GDP in 2010/2011 (Sharma, 2012). An ambi-
tious National Food Security Bill is currently pending, awaiting parliament endorsement. It aims to extend
the reach of subsidized food grains from 27 percent to about 67 percent of the population.25 Indonesia’s
benefit-in-kind programme ‘RASKIN’ distributes rice at a subsidized price to the poorest households on a
monthly basis. Despite a rise in the price of subsidized rice for the first time in 2008, the budgetary cost of
the programme doubled from 2007 to 2010. The Philippines also expanded its rice subsidy programme
(which has been running for more than 50 years) increasing the coverage of the poor (from 26 percent in
2006 to 48 percent in 2009). Such improvements can be attributed to measures taken by the government
to improve beneficiary selection (Fernandez and Velarde, 2012). In Bangladesh, the Public Food Distribution
System operates through two channels: in kind (see section 3.2.1) and subsidized food sales (open market
sales). The latter was recently cut back as the private sector increasingly played a prominent role in stabilizing
market supplies and prices, especially at times of natural disasters.
Within Asia, Middle East countries followed a different path. Similar to North African countries, they relied
heavily on universal food subsidies and most of them raised these subsidies in response to both the 2007/08
food crisis and to the unrest of 2010/11.26 Food subsidies and price controls of main staple food commodities
(mainly wheat, wheat flour and sugar) were in place in all the seven countries analysed27 over the reference
24 The Targeted Public Distribution System (TPDS) provides a subsidy entitlement based on family size and composition; cards entitle households to monthly food stamps from prescribed distribution centres which could be cashed in for food from any food store at a subsidised rate.
25 The National Food Security Bill was approved by the House of Representatives of India on 26 August 2013.
26 In 2009, food subsidies ranged from 0.8 percent of GDP in Jordan to 3.5 percent of GDP in Iraq. See: World Bank, 2011, Middle East and North Africa: Facing Challenges and Opportunities. Economic Developments and Prospects Report, May 2011.
27 Namely Iran, Iraq, Lebanon, Yemen, Oman, Saudi Arabia and Syria.

45
3. Consumer support policy measures
period (2007-2012). However, in two of them, the governments are attempting to rationalize (Iraq) or phase
out (Iran) subsidies.28
In LAC, direct food subsidies are less popular than in Africa or Asia and have lost support over time during
the reference period: the proportion of LAC countries with direct subsidy programmes declined from 70
percent in 2007/08 to 55 percent in 2011/12. Food subsidies and particularly price control measures were
used mainly during the 2007/08 crisis. Some countries continued to use them after the crisis, often as a tem-
porary or more long-term policy. Countries like Colombia and Mexico (in 2008), Honduras (in 2007 and
2010) and Ecuador (in 2008, 2009 and 2010) only temporarily fixed the prices of several products included
in the basic food basket (canasta básica de alimentos). Others regularly set the price of the main food items,
such as Costa Rica and Dominican Republic for rice and Ecuador for pan popular (popular bread). Since
2007, Argentina has also implemented a system of compensations to producers (initially targeting only
wheat and maize mills) to guarantee domestic supply and influence retail prices of staple food commodities.
Currently, subsidies are provided for several food products, although the biggest share of payments goes to
wheat mills and meat producers. Other countries, such as Bolivia, Honduras, Nicaragua and Venezuela
intervene in food markets through articulated public systems in charge of the procurement, storage and dis-
tribution of subsidized food items.29 In 2007, Bolivia created the public Empresa de Apoyo a la Producción
de Alimentos (Company for Support of Food Production) with the aim of supporting food production and
supplying internal markets under the principle of fair prices. In the same year, Nicaragua reactivated the
Empresa Nicaragüense de Alimentos Básicos which also operates along the entire supply chain buying the
production from local farmers, creating food stocks and selling products at affordable prices to consumers
in the entire country. Venezuela has implemented price controls on staple foods since 2003 using the
state-run company called Mercados de Alimentos, C.A., selling subsidized products through a nationwide
chain of stores. The Productora y Distribuidora Venezolana de Alimentos (Venezuelan Food Producer and
Distributor) was also established in 2008 to serve the entire supply chain and handle the final sale of basic
food items at fixed prices.
Indirect food subsidies
The number of countries using indirect food subsidies has generally increased over the study period but
VAT or sales tax exemptions or reductions served only a temporary objective in many instances30. In Africa,
reducing domestic taxes on food is a more popular policy instrument than in Asia or LAC. A number of
countries maintained exemptions or reductions which were already in place (before 2007), while some
other countries introduced the measure in response to the 2007/08 crisis. The measure was applied either
28 Iran is currently implementing a food subsidy reform approved in October 2010 that foresees a phase out of all subsidies by the end of 2014.
29 See also section 4.2.1 Foodgrain Stock Management.
30 Information on VAT exemptions/reductions was not available for 10 countries: Burkina Faso, Azerbaijan, Iraq, Kazakhstan, Oman, Saudi Arabia, Syria and Tajikistan for all the period (2007/08; 2009/10; 2011/12) and for Togo and Tunisia (2007/08; 2009/10).
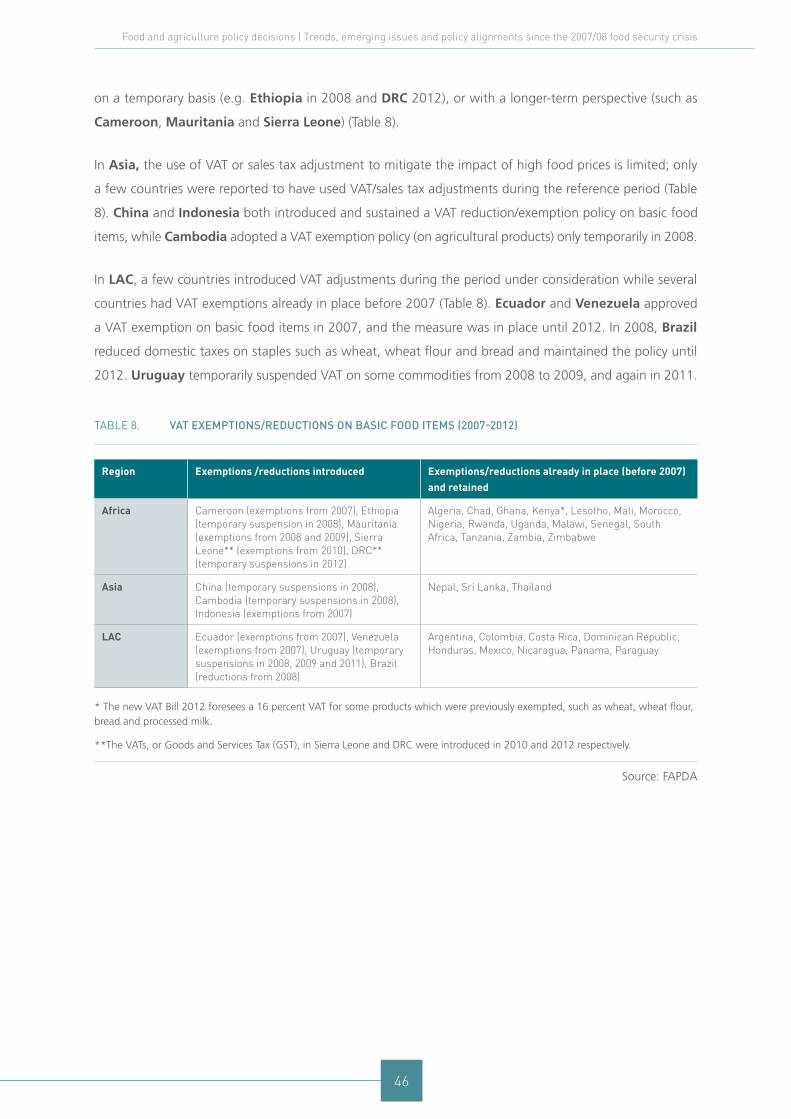
46
Food and agriculture policy decisions | Trends, emerging issues and policy alignments since the 2007/08 food security crisis
on a temporary basis (e.g. Ethiopia in 2008 and DRC 2012), or with a longer-term perspective (such as
Cameroon, Mauritania and Sierra Leone) (Table 8).
In Asia, the use of VAT or sales tax adjustment to mitigate the impact of high food prices is limited; only
a few countries were reported to have used VAT/sales tax adjustments during the reference period (Table
8). China and Indonesia both introduced and sustained a VAT reduction/exemption policy on basic food
items, while Cambodia adopted a VAT exemption policy (on agricultural products) only temporarily in 2008.
In LAC, a few countries introduced VAT adjustments during the period under consideration while several
countries had VAT exemptions already in place before 2007 (Table 8). Ecuador and Venezuela approved
a VAT exemption on basic food items in 2007, and the measure was in place until 2012. In 2008, Brazil
reduced domestic taxes on staples such as wheat, wheat flour and bread and maintained the policy until
2012. Uruguay temporarily suspended VAT on some commodities from 2008 to 2009, and again in 2011.
Table 8. vat exemPtions/reductions on basic food items (2007-2012)
Region Exemptions /reductions introduced Exemptions/reductions already in place (before 2007) and retained
Africa Cameroon (exemptions from 2007), Ethiopia (temporary suspension in 2008), Mauritania (exemptions from 2008 and 2009), Sierra Leone** (exemptions from 2010), DRC** (temporary suspensions in 2012)
Algeria, Chad, Ghana, Kenya*, Lesotho, Mali, Morocco, Nigeria, Rwanda, Uganda, Malawi, Senegal, South Africa, Tanzania, Zambia, Zimbabwe
Asia China (temporary suspensions in 2008), Cambodia (temporary suspensions in 2008), Indonesia (exemptions from 2007)
Nepal, Sri Lanka, Thailand
LAC Ecuador (exemptions from 2007), Venezuela (exemptions from 2007), Uruguay (temporary suspensions in 2008, 2009 and 2011), Brazil (reductions from 2008)
Argentina, Colombia, Costa Rica, Dominican Republic, Honduras, Mexico, Nicaragua, Panama, Paraguay
* The new VAT Bill 2012 foresees a 16 percent VAT for some products which were previously exempted, such as wheat, wheat flour, bread and processed milk.
**The VATs, or Goods and Services Tax (GST), in Sierra Leone and DRC were introduced in 2010 and 2012 respectively.
Source: FAPDA

47
3.1.2 Fuel subsidies
Nearly all countries monitored have been affected by sharply rising oil prices on the world market in recent
years. For this reason, fuel subsidies are commonly used, often as universal subsidies benefiting all consumers
in a country in order to lower the price of energy used for cooking, heating, lighting and personal transport
as well as energy used as an input for production of goods and services. Fuel subsidies include direct price
subsidies,31 when the price paid by firms and households is below supply price, and tax subsidies, when
taxes are below their efficient level (IMF, 2013). Price control mechanisms, such as price ceilings, set or freeze
prices, and price adjustment measures, such as stabilization funds mechanisms, are indirect support mech-
anisms in favour of consumers (Kojima, 2013).
In 2007, international oil and oil product prices rose sharply, challenging countries and causing their energy
bills to surge. The increase in the global amount of consumer subsidies closely followed the sharp rise in
international fossil fuel prices (IMF, 2013). Over 80 percent of the countries monitored implemented direct
fuel subsidies between 2007 and 2012 (Figure 7). The proportion of countries with fuel subsidy programmes
remained high and steady between 2007 and 2012 (Figure 7) despite the fact that many countries in all
the three regions have attempted to reduce or reform their subsidy systems (Annex 1) in order to reduce
the burden on government expenditure, improve energy efficiency and security, boost investment in clean
energy sources and address climate change.32
31 Fossil fuel subsidies from governments fall into two broad categories: ‘producer subsidies' that constitute financial transfers to the fossil fuel indus-try - mainly large oil and gas multinationals involved in extraction, processing and distribution, and ‘consumer subsidies' that are mainly provided to reduce the end-use prices of fossil fuels. The information analysed in this section is limited to consumer subsidies.
32 It is known that one of the by-products of fossil fuel burning, carbon dioxide (CO2), is released into the atmosphere, causing the global climate to change.
Key Findings
•The proportion of countries using direct fuel subsidies remained high and steady (over 80 percent)
between 2007 and 2012. Provision of fuel subsidies in favour of both consumers and producers
is common policy in all Asian countries.
•A number of countries used indirect support mechanisms such as price control and stabilization
funds to lower fuel prices. Price adjustment mechanisms in Latin America and the Caribbean
were more widely applied than direct price subsidies or tax subsidies.
•A growing number of countries have attempted to reduce or reform their fuel subsidy programmes
during the study period. Rationalization and attempts of reform seem to be at more advanced
stage in Asia than in other regions, while many African governments started to liberalize their
fuel markets.
3. Consumer support policy measures
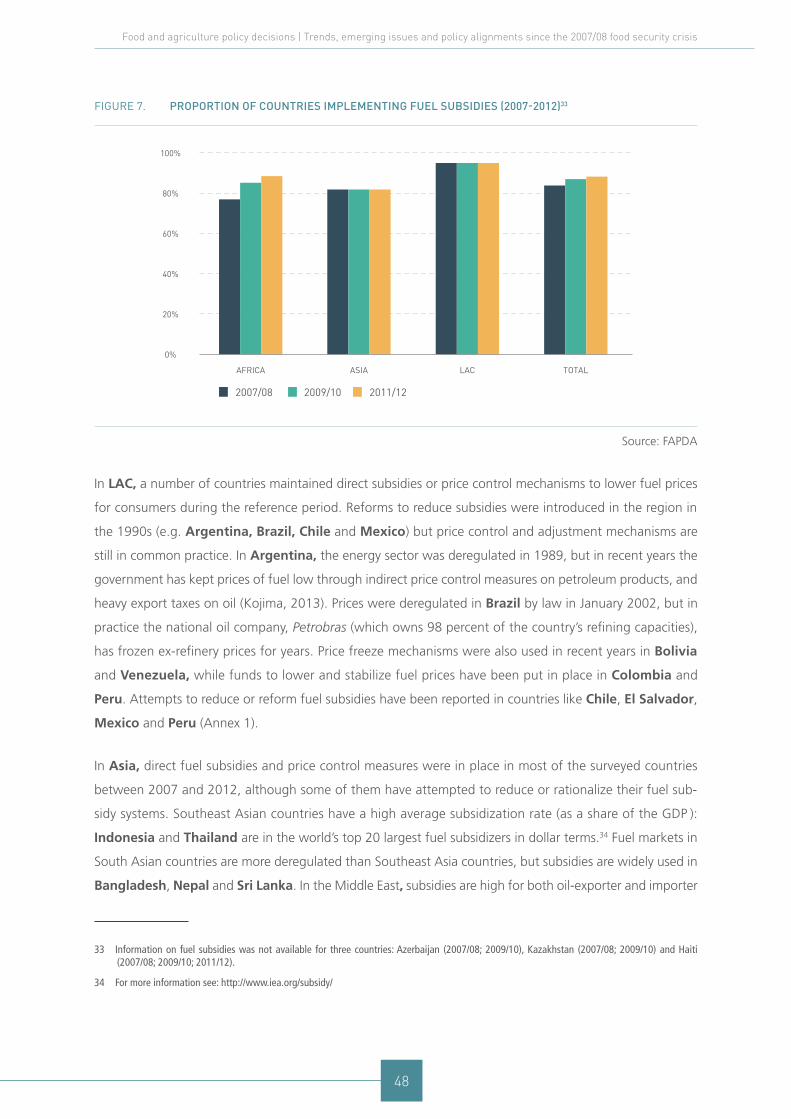
48
Food and agriculture policy decisions | Trends, emerging issues and policy alignments since the 2007/08 food security crisis
Figure 7. ProPortion of countries imPlementing fuel subsidies (2007-2012)33
0%
20%
40%
60%
80%
100%
AFRICA ASIA LAC TOTAL
2007/08 2009/10 2011/12
Source: FAPDA
In LAC, a number of countries maintained direct subsidies or price control mechanisms to lower fuel prices
for consumers during the reference period. Reforms to reduce subsidies were introduced in the region in
the 1990s (e.g. Argentina, Brazil, Chile and Mexico) but price control and adjustment mechanisms are
still in common practice. In Argentina, the energy sector was deregulated in 1989, but in recent years the
government has kept prices of fuel low through indirect price control measures on petroleum products, and
heavy export taxes on oil (Kojima, 2013). Prices were deregulated in Brazil by law in January 2002, but in
practice the national oil company, Petrobras (which owns 98 percent of the country’s refining capacities),
has frozen ex-refinery prices for years. Price freeze mechanisms were also used in recent years in Bolivia
and Venezuela, while funds to lower and stabilize fuel prices have been put in place in Colombia and
Peru. Attempts to reduce or reform fuel subsidies have been reported in countries like Chile, El Salvador,
Mexico and Peru (Annex 1).
In Asia, direct fuel subsidies and price control measures were in place in most of the surveyed countries
between 2007 and 2012, although some of them have attempted to reduce or rationalize their fuel sub-
sidy systems. Southeast Asian countries have a high average subsidization rate (as a share of the GDP ):
Indonesia and Thailand are in the world’s top 20 largest fuel subsidizers in dollar terms.34 Fuel markets in
South Asian countries are more deregulated than Southeast Asia countries, but subsidies are widely used in
Bangladesh, Nepal and Sri Lanka. In the Middle East, subsidies are high for both oil-exporter and importer
33 Information on fuel subsidies was not available for three countries: Azerbaijan (2007/08; 2009/10), Kazakhstan (2007/08; 2009/10) and Haiti (2007/08; 2009/10; 2011/12).
34 For more information see: http://www.iea.org/subsidy/
49
countries: the highest subsidy rates are represented by oil exporting countries such as Iraq (14.30 percent
of GDP) and Saudi Arabia (13.27 percent of GDP). Price control measures to lower fuel prices had been
reported by several Asian countries, including Bangladesh, India, Indonesia, Iran, Iraq, Kazakhstan,
Nepal, Sri Lanka, Syria and Yemen. Thailand and Viet Nam manage oil funds for lowering prices in
times of high world prices. Among the countries surveyed, Bangladesh, China, India, Indonesia, Iran,
Lebanon35 and Syria have taken measures to reduce fuel subsidies. In Indonesia, since the economic crisis
of 1997, the government has made several attempts to reform its fossil-fuel subsidies. In 2008, along with
the adjustment of fuel prices, a number of compensation measures were introduced in the form of uncon-
ditional cash transfers, rice distribution to the poor, financial support for the children of the lowest ranks of
civil servants and interest subsidy loans for small and medium enterprises (SMEs) (APEC, 2012).
In Africa, most of the countries surveyed relied on direct subsidies or price control mechanisms to lower
fuel prices. Countries such as Cameroon, Egypt, Ethiopia, Ghana, Malawi, Morocco, Mozambique,
Nigeria and Rwanda, have frozen prices of gasoline, diesel or both for several months or longer. Others,
like Kenya, Rwanda and Senegal, reduced taxes and fees levied on diesel and kerosene. However, in recent
years, some Sub-Saharan African countries have attempted to reform their fuel subsidy policies. In Ghana,
Nigeria and Mozambique, reforms were accompanied by the expansion of targeted social spending pro-
grammes to protect lower-income households from fuel price increase. In Nigeria, the reduction of gasoline
subsidies was announced in mid-2011 and the Subsidy Reinvestment and Empowerment (SURE) programme
was subsequently adopted to offer a variety of social safety net initiatives to mitigate the impact of removing
the subsidy on the poor (IMF, 2013). In January 2012, the Nigerian government ended the fuel subsidy for
gasoline, which caused prices to more than double. However, this price shock primarily affected low-wage
Nigeria and resulted in riots, forcing the government to back down (Hickey, 2013).
35 In Lebanon fuel price subsidies were de facto eliminated in October 2008 with the reintroduction of fuel excise taxes but in early 2011, the Lebanese government reduced fuel excise taxes in response to high world market prices and increasing domestic political tensions (Fattouh & El Kattiri, 2012).
3. Consumer support policy measures

50
Food and agriculture policy decisions | Trends, emerging issues and policy alignments since the 2007/08 food security crisis
3.2 Food-based safety net programmes
Food-based safety net programmes, which support adequate consumption to combat hunger and mal-
nutrition, are implemented in different forms. Three kinds of food-based safety nets are considered in this
section: free food distribution and nutritional support to vulnerable people, school feeding and food-for-
work programmes. Free food distribution typically involves direct distribution of food and supplementary
feeding interventions for vulnerable groups (usually targeted). To maximize the nutrition impact of this type
of support, explicit nutrition interventions may be included. School feeding is a form of supplementary
feeding that involves the provision of free food (with the exception of a few cases where governments may
request small contributions) for children at school. Food-for-work is the direct provision of food rations in
exchange for a predetermined amount of work (usually self-targeting).
These schemes are different and vary in terms of duration, scale and objectives. While distribution of food aid
to vulnerable people is mostly implemented under emergency contexts with a short-term objective, school
feeding and food for work programmes are usually more elaborate policies with a medium- to long-term
objective. Only government-led programmes, or programmes in which government has an active role, are
reviewed below, excluding the analysis of donor-funded food distributions.
Over 80 percent of countries monitored used food based safety net programmes during the reference
period. These approaches are common practice in all regions more popular in LAC (where all countries mon-
itored implemented some permutation of this type of programme over the reference period) than in Africa
Key Findings
•Food distribution measures were widely used and expanded during the reference period.
•Food aid to vulnerable people attracted growing attention throughout the period. In most cases
distributions were made on an ad-hoc basis after emergencies, but some countries, mainly in
LAC, have institutionalized them through the creation of programmes such as child and mother
national nutritional programmes.
•School feeding has gained popularity but there is a large discrepancy among the regions, with
all LAC countries operating such programmes, compared to only 40 percent in Africa and 50
percent in Asia.
•Food-for-work programmes were implemented in only a few countries and were often restricted
to a few specific locations or a limited period of time.

51
or Asia. The evidence shows that countries have not changed their policy of food-based support between
2007/08 and 2011/12 (Figure 8).
Figure 8. ProPortion of countries imPlementing food distribution (2007-12)36
0%
20%
40%
60%
80%
100%
AFRICA ASIA LAC TOTAL
2007/08 2009/10 2011/12
Source: FAPDA
Overall, food aid to vulnerable people and school feeding are more widely practiced than food for work
programmes (Table 9). Moreover, the approaches and practices of implementing food-based support pro-
grammes vary from region to region or from country to country.
36 Information on food distribution was not available for three countries: Azerbaijan and Tajikistan over the study period and for Syria in 2011/12.
3. Consumer support policy measures

52
Food and agriculture policy decisions | Trends, emerging issues and policy alignments since the 2007/08 food security crisis
Table 9. food-based safety net Programmes imPlemented in selected countries (2007-2012)
Region Free food distribution to vulnerable people
School feeding programmes Food for work programmes
Africa Egypt, Tunisia, Mauritania, Cameroon, Chad, Senegal, Togo, Burkina Faso, Ghana, Mali, Nigeria, Lesotho, Malawi, Tanzania, Zimbabwe, Ethiopia, Kenya
Mauritania, Morocco, Cameroon, Senegal, Togo, Burkina Faso, Ghana, Mali, Kenya, Rwanda, South Africa, Zambia
Mauritania, Ethiopia, Kenya
Asia Oman, Yemen, Iraq, Syria, Bangladesh, Cambodia, China, India, Indonesia, Nepal, the Philippines, Sri Lanka, Thailand, Viet Nam
Saudi Arabia, Yemen, Syria, Bangladesh, Bhutan, China, India, Indonesia, Lao PDR, Nepal, Sri Lanka, Thailand, Viet Nam
Bangladesh, Bhutan, Cambodia, India, Nepal
LAC Bolivia, Brazil, Chile, Colombia, Ecuador, Paraguay, Peru, Uruguay, Venezuela, Dominican Republic, El Salvador, Guatemala, Haiti, Honduras, Mexico, Nicaragua, Panama
All countries Haiti, Nicaragua, Bolivia, Guatemala
Source: FAPDA
3.2.1 Free food distribution and nutritional programmes for vulnerable people
Most of the countries surveyed provided free food distributions to vulnerable people over the reference
period (Table 9). In most cases distributions were targeted and implemented on an ad-hoc basis. The African
nations of Cameroon (after 2008), Mauritania (2009 and 2010), Chad (throughout the reference period)
and Togo, among others, provided in-kind food transfers to support people and regions affected by natural
disasters or chronic malnutrition. In Kenya, the General Food Distribution programme for relief and recovery
absorbed about 53 percent of all safety net spendings between 2005 and 2010; although the programme
was largely financed by development partners (71 percent).37 Several LAC countries distributed free food in
response to disasters, including Chile (2010), Paraguay (2012) and Mexico (2012). In Brazil, large-scale
food aid was also provided to specific groups, such as indigenous as well as people affected by natural
disasters. In emergency contexts or in response to high food prices over the period of analysis, free food
distribution was also common among Asian countries, including Syria (2008, 2009), Cambodia (2008,
2011), Sri Lanka (2007-2012), Pakistan (2010), China (2012), Thailand (2011) and Viet Nam (2011).
Bangladesh has been running free food distributions to vulnerable groups under the Vulnerable Group
Feeding and the Gratuitous Relief programmes which support the poor to cope with natural disasters. The
allocation of food under these schemes increased by 48 percent in the 2008/09 budget year.
37 Kenya Social Protection Sector Review: Executive Report (June 2012). Ministry of State for Planning, National Development and Vision 2030.
53
As part of medium and long-run poverty alleviation strategies, some countries are mainstreaming food and
nutrition interventions in their social safety net programmes. Among LAC countries, Brazil’s well-known
Restaurantes Populares, or Community Kitchens (established in 2003 and reinforced during the reference
period), provide free or subsidized food for those on a low income. The budget for these community kitch-
ens continuously increased over the period. Brazilian authorities also continued to implement the Programa
de Alimentación del Trabajador – Worker Feeding Programme (in place since 1975) – to provide free meals
to workers below minimum wage. In Ecuador (since 2009) and in Guatemala (since 2008), national pro-
grammes were created to institutionalize ad-hoc free food distributions. Several LAC countries have also
institutionalized explicit long-term nutritional interventions into their national programmes to address hun-
ger, targeting children and mothers. Such programmes are often implemented as mother and child health
care, delivery of food and micronutrients, nutritional extension and education (Box 4).
A few countries in Asia have established and expanded national programmes aimed at combating hunger
and malnutrition. Viet Nam has a strong public health and nutrition system that includes community health
workers and a specific cadre called ‘nutrition collaborators’. These health and nutrition workers screen chil-
dren for malnutrition and counsel mothers about breastfeeding, balanced diet, hygiene and sanitation. As
a result, Viet Nam is almost certain to attain the targets set by MDGs 4 and 5 related to child and maternal
mortality by 2015 (Save the Children, 2012).
In Africa, Mali’s government has continued using community health workers with training on several nutri-
tion-related interventions to improve child survival by delivering vitamin A to women and children under five
years old. Malawi has also put significant energy and resources into improving nutrition and health services
for its people, especially those living in rural areas (Save the Children, 2012).
3. Consumer support policy measures
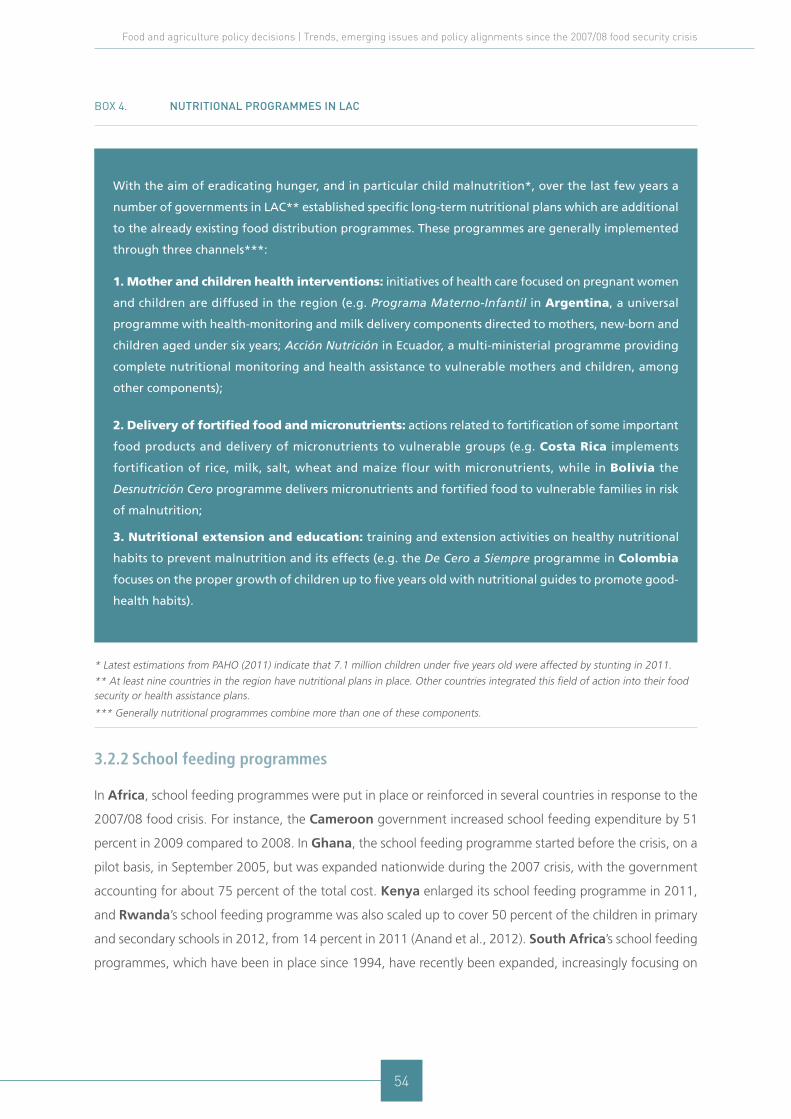
54
Food and agriculture policy decisions | Trends, emerging issues and policy alignments since the 2007/08 food security crisis
box 4. nutritional Programmes in lac
* Latest estimations from PAHO (2011) indicate that 7.1 million children under five years old were affected by stunting in 2011.
** At least nine countries in the region have nutritional plans in place. Other countries integrated this field of action into their food security or health assistance plans.
*** Generally nutritional programmes combine more than one of these components.
3.2.2 School feeding programmes
In Africa, school feeding programmes were put in place or reinforced in several countries in response to the
2007/08 food crisis. For instance, the Cameroon government increased school feeding expenditure by 51
percent in 2009 compared to 2008. In Ghana, the school feeding programme started before the crisis, on a
pilot basis, in September 2005, but was expanded nationwide during the 2007 crisis, with the government
accounting for about 75 percent of the total cost. Kenya enlarged its school feeding programme in 2011,
and Rwanda’s school feeding programme was also scaled up to cover 50 percent of the children in primary
and secondary schools in 2012, from 14 percent in 2011 (Anand et al., 2012). South Africa’s school feeding
programmes, which have been in place since 1994, have recently been expanded, increasingly focusing on
With the aim of eradicating hunger, and in particular child malnutrition*, over the last few years a
number of governments in LAC** established specific long-term nutritional plans which are additional
to the already existing food distribution programmes. These programmes are generally implemented
through three channels***:
1. Mother and children health interventions: initiatives of health care focused on pregnant women
and children are diffused in the region (e.g. Programa Materno-Infantil in Argentina, a universal
programme with health-monitoring and milk delivery components directed to mothers, new-born and
children aged under six years; Acción Nutrición in Ecuador, a multi-ministerial programme providing
complete nutritional monitoring and health assistance to vulnerable mothers and children, among
other components);
2. Delivery of fortified food and micronutrients: actions related to fortification of some important
food products and delivery of micronutrients to vulnerable groups (e.g. Costa Rica implements
fortification of rice, milk, salt, wheat and maize flour with micronutrients, while in Bolivia the
Desnutrición Cero programme delivers micronutrients and fortified food to vulnerable families in risk
of malnutrition;
3. Nutritional extension and education: training and extension activities on healthy nutritional
habits to prevent malnutrition and its effects (e.g. the De Cero a Siempre programme in Colombia
focuses on the proper growth of children up to five years old with nutritional guides to promote good-
health habits).
55
nutritional components of meals and covering up to 30 percent of daily nutritional requirements (Anand
et al., 2012). South African school feeding programmes contributed to generate spill-over effects for local
economies, creating employment opportunities for women, encouraging them to form small businesses that
supply food for the school feeding programme in a given area (Bundy et al., 2009).
In LAC, many school feeding programmes, which have been in place for decades, were reinforced during
the reference period. In 2009, Brazil expanded its national school feeding programme, Merienda Escolar,
which has been in place since 1955. Coverage was extended to children and adult students (of all basic
education) enrolled in public schools, benefitting 45 million students in 2012. Moreover, in 2009, a national
law declared that 30 percent of the total school feeding budget has to be invested in directly purchasing
products from family farms (see Box 1), thus benefitting small production and local economies as well as
granting high quality food. In Chile, the Programa de Alimentación Escolar (in place since 1964) targets chil-
dren from vulnerable and poor families, while in Ecuador, the Programa de Alimentación Escolar (launched
in 1999) was reinforced in 2011. Colombia also reinforced its programme in 2007 and introduced a new
one, Programa Leche para Todos (‘Milk for all’), in 2008, distributing milk to schools and to families in poor
areas. A school feeding system in Paraguay that was initiated in 2007 was interrupted in 2008 (due to
budgetary constraints) but re-introduced in 2009 to distribute a glass of milk to school children. El Salvador
(in 2010) and Honduras (in 2011) launched a new initiative called Vaso de Leche (‘Glass of Milk’) to deliver
milk to students. Like the Brazilian experience, milk is purchased from small domestic producers for the
programmes. An element that gives a strong sustainability to these programmes in the LAC region is that
they are run through specialized institutions or units (often under the Ministry of Education) dedicated to the
programmes’ management. With the exception of Argentina and Bolivia, where school feeding is carried
out by provinces or municipalities, school feeding in LAC is delivered through massive national programmes
through which governments seek to fulfill their obligation to guarantee the right to education, the right to
food and affirm the right to health of school children at the same time.
Most of the Asian countries had a public school feeding programme in place over the reference period, and
in some of them (e.g. India, China, Thailand and Bangladesh), the coverage is particularly broad with
significant expansion in recent years. China launched its Nutrition Improvement Plan for Rural Compulsory
Education in 2007. Its coverage is the third largest in the world, second only to the school feeding pro-
grammes in India and Brazil. The programme of Bangladesh distributes micronutrient-fortified energy
biscuits to primary school children, while the school lunch programme in Thailand provides free lunch to all
children in remote areas, and to poor or underweight children in suburban schools, middle-income commu-
nities or semi-rural areas. India has the largest school feeding programme of the world. The Mid Day Meal,
which has been in place since 1995, reached 113.6 million school children in 2011. Its aim is to ensure that
all children are adequately fed and receive primary education.38
38 The scheme is implemented through two separate procurement processes: one for food grains (subsidized centrally through the government-owned Food Corporation of India) and one for other foods like fresh fruits or vegetables (for which procedures are established at the state level).
3. Consumer support policy measures
56
Food and agriculture policy decisions | Trends, emerging issues and policy alignments since the 2007/08 food security crisis
3.2.3 Food-for-work programmes
Government-based food for work programmes have become less popular compared to nutrition or school
feeding programmes. Only about 17 percent of the countries covered (Table 7) implemented such pro-
grammes, often in fragile, chronic poverty or post-conflict settings for a limited period of time or part of
the year. Recent debate over the use of cash rather than food regularly raises concerns over the impact of
food distribution on local food markets, the transaction costs involved as well as preferences of beneficiaries
(Alderman, 2002). Food-for-work programmes have the potential of attracting labour away from recipients’
own farms, distorting the food markets or changing consumption patterns (Barrett, 2006).39
In Africa, food-for-work programmes are implemented in response to emergency or chronic food insecurity
situations. In Ethiopia, the Productive Safety Net Program, which saw a 33 percent increase in funding in
2008, provides food and cash transfers through public works (at a rate of 15kg of cereal in cash or grains, for
five working days a month) in drought prone parts of the country. In Kenya, the food for work programme,
in place since 2000, was suspended in 2009 and replaced by a Food-For-Asset programme, which effectively
started in 2011, providing food to rural households and helping rural communities to build assets. This pro-
gram was primarily implemented in arid and semi-arid lands (ASALs), to soften the impacts of likely hazards
(floods, droughts), while national food for work programmes were in place in Mauritania.
In LAC, a few countries have relied on food-for-work to address serious poverty emergency situations.
Bolivia implemented the Programa de Seguridad Alimentaria y Desarrollo Vial Urbano (Food Security and
Urban Road Development Program) in the city of El Alto in 2011. Among other food for work programmes
in the region are the Alimentos por Trabajo programme of Guatemala and similar schemes in Haiti and
Nicaragua. Some of these programmes, which have been in place since the last one or two decades, played
an important role during the reference period.
Of the Asian countries, Bangladesh has two programmes, namely the Food-for-work and Test Relief, which
distribute food grains (rice and wheat) as wage payment to both male and female workers in labour-intensive
public work programmes. Food for work schemes also exist in Cambodia and Bhutan. Nepal implemented
seasonal food for work schemes during slack agricultural seasons, when rural people are waiting for the
next harvest and wage labourers begin to face food shortages. India has implemented a countrywide food
for work programme since 2005 in the poorest rural districts (renamed Mahatma Gandhi National Rural
Employment Guarantee Act in 2009). The programme, which is 100 percent centrally sponsored, provides
resources in the form of cash and food grains to the rural poor in exchange for manual or unskilled labour.
39 Nevertheless, food-for-work programmes are one of the preferred instruments of NGOs and WFP to address temporary work shortages brought on by a slack agricultural season or after a shock, providing assistance in both post-disaster and post-conflict situations (Subbarao, et al., 2013).
57
3.3 Cash-based consumer support programmes
Cash-based transfer programmes “include the provision of assistance in the form of cash and other instru-
ments almost like cash that can be used to transfer resources to the poor or to those who, in the absence
of the transfer, face a probable risk of falling into poverty” (Grosh et al., 2008). FAO defines cash transfers
as “payment of money or vouchers provided to vulnerable individuals, households, or private sector enti-
ties” (FAO, 2012b). These transfers often refer to regular non-contributory payments of money provided by
government (sometimes in partnership with donors) to individuals or households. Contributory pensions,
which require the beneficiary to make matching contributions, are not addressed in this report. Only gov-
ernment-led programmes, or schemes in which government has an active role, are reviewed below.
Cash-based transfer programmes have been implemented to support the poor in over 90 percent of the
Asian or LAC countries surveyed and in about 80 percent of the African countries monitored. The grow-
ing use of cash transfers is evident from the larger proportion of countries applying the measure in 2011/12
compared to 2007/08 (Figure 9). Among the frequently mentioned main advantages of a cash transfer is
the choice it gives to beneficiaries in using additional income compared to other transfers and the reduced
administrative requirements or lower operating costs (Grosh et al., 2008).
Cash-based transfer programmes appeared first as a consumer support tool in middle income countries in
the 1990s and rapidly expanded throughout the world. In recent years, low income countries are increasingly
implementing cash transfer programmes, in some cases with aid from donors, in the form of conditional
and unconditional cash transfers, cash vouchers (for food) and cash-for-work programmes. Cash transfers
(conditional or unconditional) are more popular than cash vouchers or cash-for-work programmes (Table 11).
Key Findings
•The majority of the countries surveyed (80 percent) implemented cash transfer programmes
during the reference period (2007-2012).
•Several countries in LAC, Africa and Asia have launched new cash transfer programmes in the
study period, while others have expanded existing programmes and/or institutionalized them.
•Cash vouchers are less popular in all regions, while cash for work programmes are relatively more
common in Africa and Asia than in LAC.
3. Consumer support policy measures
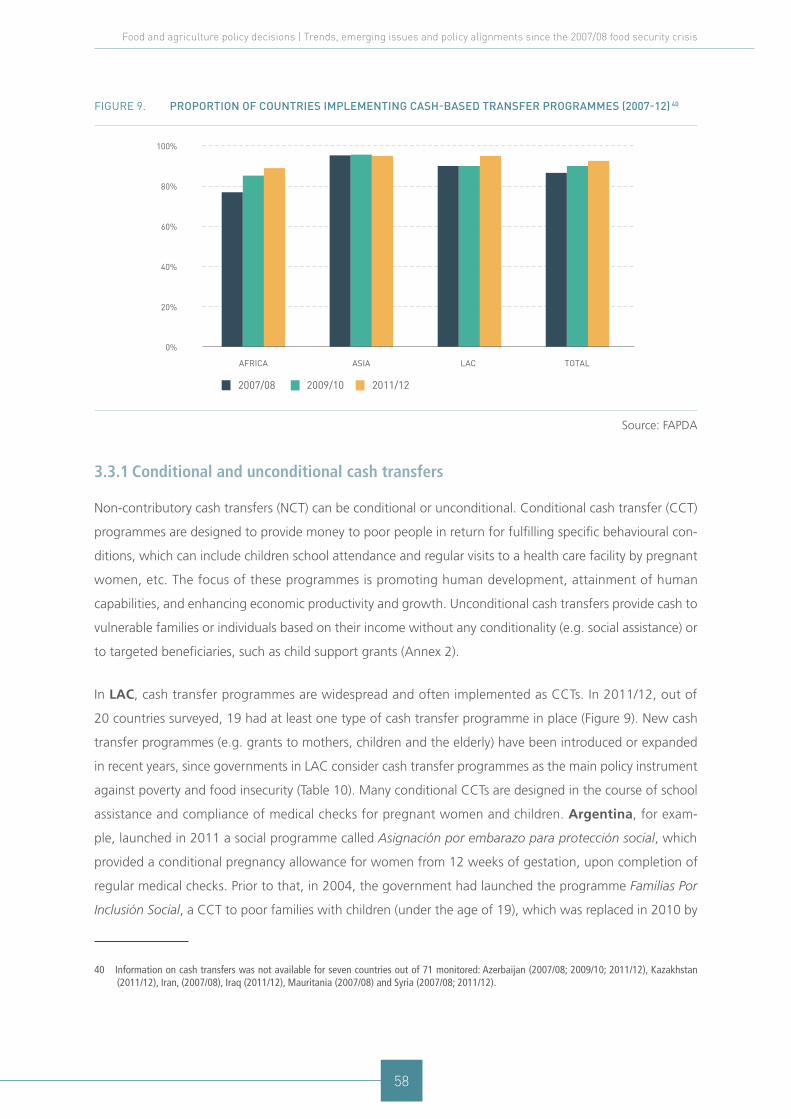
58
Food and agriculture policy decisions | Trends, emerging issues and policy alignments since the 2007/08 food security crisis
Figure 9. ProPortion of countries imPlementing cash-based transfer Programmes (2007-12) 40
0%
20%
40%
60%
80%
AFRICA ASIA LAC TOTAL
2007/08 2009/10 2011/12
100%
Source: FAPDA
3.3.1 Conditional and unconditional cash transfers
Non-contributory cash transfers (NCT) can be conditional or unconditional. Conditional cash transfer (CCT)
programmes are designed to provide money to poor people in return for fulfilling specific behavioural con-
ditions, which can include children school attendance and regular visits to a health care facility by pregnant
women, etc. The focus of these programmes is promoting human development, attainment of human
capabilities, and enhancing economic productivity and growth. Unconditional cash transfers provide cash to
vulnerable families or individuals based on their income without any conditionality (e.g. social assistance) or
to targeted beneficiaries, such as child support grants (Annex 2).
In LAC, cash transfer programmes are widespread and often implemented as CCTs. In 2011/12, out of
20 countries surveyed, 19 had at least one type of cash transfer programme in place (Figure 9). New cash
transfer programmes (e.g. grants to mothers, children and the elderly) have been introduced or expanded
in recent years, since governments in LAC consider cash transfer programmes as the main policy instrument
against poverty and food insecurity (Table 10). Many conditional CCTs are designed in the course of school
assistance and compliance of medical checks for pregnant women and children. Argentina, for exam-
ple, launched in 2011 a social programme called Asignación por embarazo para protección social, which
provided a conditional pregnancy allowance for women from 12 weeks of gestation, upon completion of
regular medical checks. Prior to that, in 2004, the government had launched the programme Familias Por
Inclusión Social, a CCT to poor families with children (under the age of 19), which was replaced in 2010 by
40 Information on cash transfers was not available for seven countries out of 71 monitored: Azerbaijan (2007/08; 2009/10; 2011/12), Kazakhstan (2011/12), Iran, (2007/08), Iraq (2011/12), Mauritania (2007/08) and Syria (2007/08; 2011/12).

59
the Asignación Universal por Hijo, a universal child allowance. Bolivia has also implemented several cash
transfer programmes: in 2008 it introduced the Renta Dignidad, a non-contributory state pension for poor
citizens over 60 years old; in 2009 the country launched the Bono Madre Niño-Niña ‘Juana Azurduy de
Padilla’, a CCT for children aged 0-2 years, and in 2012 it introduced the Renta Solidaria, a non-conditional
cash transfer programme to people with severe disabilities. In 2012, Peru replaced the Gratitud monthly
bonus programme, for adults aged over 75 years living in extreme poor conditions, with Pensión 65, where
the age was lowered to 65 years. In 2012, Colombia redesigned Familias en Acción (2001) and renamed
it as Más Familias en Acción in order to increase the amount of the transfers directed to recent graduates
from school, promoting higher education enrollment. Most countries of LAC registered an increase in GDP
during the reference period (benefiting from high prices of raw and agricultural commodities) and were
able to increase their budget dedicated to social protection, tackling the region’s long-standing concerns of
income distribution and food insecurity (FAO, 2012a).
The best known and probably the biggest of all conditional cash transfer schemes in the developing world
is the Bolsa Família in Brazil. The Bolsa Família provides financial support to poor families, who are required
to ensure that their children attend school and are vaccinated. The objective is to both reduce short-term
poverty by direct cash transfers and fight long-term poverty by increasing human capital among the poor
through linking education and health services to cash transfers. Accordingly, the Brazilian government has
continuously increased the budget and signed up new recipients to the programme over the years,41 reaching
13.7 million poor households in 2012 (the amount of transfer also increased by 45 percent).42 In 2011, Bolsa
Família designed a new sub-programme of CCTs, Bolsa Verde (“Support to Environmental Conservation”), to
support families who participate in conservation activities in national forests as well as indigenous peoples,
afro-descendants and other traditional communities.
In Africa, support for cash transfer programmes is growing. They are often implemented as unconditional
cash transfers and are attracting attention due to their ‘protective’ dimension in providing support to families
that care for orphans and other children affected by AIDS (UNDP, 2008). Among the countries analysed,
14 introduced cash transfer programmes during the study period, while in others, existing cash transfer
programmes were expanded (Table 10). The government of Ghana, for example, introduced the Livelihood
Empowerment Against Poverty (LEAP) programme in 2008. LEAP is a pioneer non-contributory cash trans-
fer in West Africa. It provides cash and free health insurance to extremely poor households. Kenya’s NCT
programme, the Orphan and Vulnerable Children programme, increased its transfer value by 33 percent in
2011, and by 2012 the programme reached 150,000 households nationwide.
In Asia, national unconditional and conditional cash transfer programmes were either introduced or
41 Bolsa Familia integrates the Plan Brasil Sem Miséria, which has its focus on the 16 million Brazilians with per capita income below R$70 monthly, and is based on income security, productive inclusion and access to public services.
42 See more at CEPAL web-based repository on cash transfer programmes in LAC: http://dds.cepal.org/bdptc/programa/?id=6
3. Consumer support policy measures

60
Food and agriculture policy decisions | Trends, emerging issues and policy alignments since the 2007/08 food security crisis
expanded in 2007/08 in response to the food crisis (Table 10). China’s Minimum Livelihood Guarantee
Scheme (the urban Di Bao programme) raised the maximum income threshold level (below which people
become eligible for payments) by 23 percent in 2007. This programme, which was originally created to serve
urban residents, was expanded to rural areas, reaching a total of 53 million recipients in 2011 (Qian Jiwei,
2013). In Viet Nam, a monthly cash transfer programme, introduced in 2004 to support elderly people
aged 90 and above with no contributory pension, was expanded in 2007: the minimum eligible age was
reduced to 85 years old, and the minimum monthly benefit increased. In 2010, the minimum eligible age
was reduced again to 80, and the minimum monthly benefit was increased further. The Philippines intro-
duced a conditional cash transfer programme in 2007: the Pantawid Pamilyang Pilipino programme provides
cash grants to beneficiary households, subject to compliance with education and health conditionality (e.g.
children regularly attending school, pregnant women and children visiting health facilities for regular health
monitoring). This programme has grown over the years to become the Philippines’ largest social assistance
scheme: it started in 2007 with 360,000 household beneficiaries and reached 2.3 million in 2012, represent-
ing about 44 percent of poor households.
Table 10. cash transfer Programmes recently introduced and exPanded or retained in
selected countries (2007-2012)
Regions Recently introduced cash transfer programmes Cash transfer programmes expanded (resources and new vulnerable groups) or retained
Africa Morocco, Ghana, Lesotho, Zambia, Malawi, Zimbabwe, Nigeria, Mozambique, Tanzania, Uganda, Rwanda, Senegal, Burkina Faso, Sierra Leone
Zambia, Mozambique, Zimbabwe, Uganda, Kenya, Malawi, South Africa, Morocco, Tunisia, Ethiopia, Tanzania, Nigeria, Egypt, Algeria, Mauritania, Liberia, Cameroon
Asia Indonesia, Pakistan, the Philippines Pakistan, Afghanistan, Bangladesh, the Philippines, Indonesia, Bhutan, Sri Lanka, China, Iran, Iraq, Saudi Arabia, India, ,Cambodia, Lao PDR, Nepal, Tajikistan, Viet Nam, Kazakhstan, Oman, Yemen, Syria
LAC Haiti Argentina, Bolivia, Brazil, Colombia, Ecuador, Paraguay, Peru, Uruguay, Venezuela, Guatemala, Honduras, El Salvador, Mexico, Chile, Costa Rica, Dominica Republic, Nicaragua, Panama
Source: FAPDA and World Bank
3.3.2 Cash vouchers (for food)
Cash vouchers are designed to increase the purchasing power of vulnerable groups who spend a big portion
of their income on food. Vouchers tend to increase food consumption more than cash transfers (because of
the link to food). However, they involve a functioning system of banks and/or post offices or local stores to
exchange vouchers for cash. The absence of an operational system for redeeming vouchers can undermine
the success of such programmes (Fiszbein and Schady, 2009). This is probably one of the reasons why few

61
countries in the three regions are using voucher systems (Table 11).
In LAC, Uruguay, Panama and Dominican Republic implemented cash voucher programmes offering
debit cards to be used in allotted shops with the objective of guaranteeing that the transfer is used only
for food purchases. In 2006, Uruguay introduced Tarjeta Uruguay Social, a magnetic card charged by the
government for the purchase of basic food in enabled shops nationwide by poor people.
The African nations of Mozambique, Zimbabwe and Senegal used vouchers during the period under
consideration. A monthly cash transfer programme in Mozambique, Programa Subsídio de Alimentos,
assists recipient households to buy food. Vulnerable people living with HIV in Zimbabwe have benefited
from an electronic voucher scheme designed to fight malnutrition among people on antiretroviral therapy
(IRIN, 2011).
Fewer countries in Asia have a voucher system and this may be partly attributed to the control of the food
marketing system and of consumer prices, which are a more common way of providing affordable food.
China uses vouchers as a means of distributing food supplies to poor households but a ‘pure’ food stamps
system, where stamps/vouchers are used to purchase food at market prices from private retailers, is not
common (Josling, 2011).
3.3.3 Cash-for-work programmes
Cash-for-work programmes provide temporary employment in public projects (such as repairing roads, clear-
ing debris or re-building infrastructure) to the most vulnerable segments of the population. These kinds of
activities enable poor households to access paid employment, hence improving their access to food. In some
public work programmes, a combination of cash (cash-for-work) and in-kind (food-for-work) modalities of
payment is used, although cash payment has become the most common form of payment in recent years
(Subbarao et al., 2013).
In Africa, cash for work programmes are relatively more popular than in LAC or Asia. A growing number of
African countries (e.g. Ethiopia, Rwanda, Malawi, Tanzania, and Mozambique) implemented cash for
work programmes over the reference period. Ethiopia’s Productive Safety Net Program (PSNP) provides food
and cash transfers through its public works. The government is paying close attention to cash payments as
the larger part of the PSNP’s budget is dedicated to cash for work. In Rwanda, the Vision 2020 Umurenge
Program (VUP) was launched in 2008 as a cash for work programme. It was scaled up in 2009 and extended
to cash transfers for the most vulnerable through two main mechanisms: public works and direct support.
Under the public works component, selected beneficiaries receive a daily wage in exchange for their work
on labour intensive community construction or rehabilitation projects. Labour scarce households (e.g. elderly
and disabled people) receive direct support in the form of a monthly cash transfer.
3. Consumer support policy measures
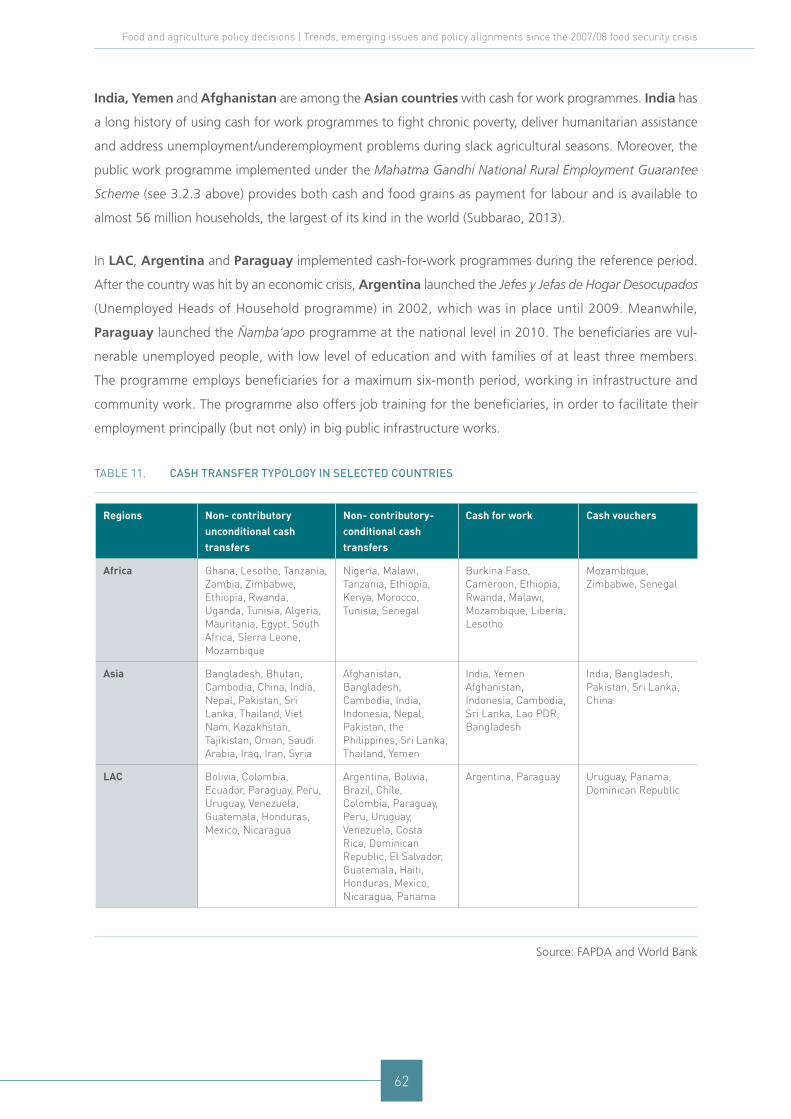
62
Food and agriculture policy decisions | Trends, emerging issues and policy alignments since the 2007/08 food security crisis
India, Yemen and Afghanistan are among the Asian countries with cash for work programmes. India has
a long history of using cash for work programmes to fight chronic poverty, deliver humanitarian assistance
and address unemployment/underemployment problems during slack agricultural seasons. Moreover, the
public work programme implemented under the Mahatma Gandhi National Rural Employment Guarantee
Scheme (see 3.2.3 above) provides both cash and food grains as payment for labour and is available to
almost 56 million households, the largest of its kind in the world (Subbarao, 2013).
In LAC, Argentina and Paraguay implemented cash-for-work programmes during the reference period.
After the country was hit by an economic crisis, Argentina launched the Jefes y Jefas de Hogar Desocupados
(Unemployed Heads of Household programme) in 2002, which was in place until 2009. Meanwhile,
Paraguay launched the Ñamba’apo programme at the national level in 2010. The beneficiaries are vul-
nerable unemployed people, with low level of education and with families of at least three members.
The programme employs beneficiaries for a maximum six-month period, working in infrastructure and
community work. The programme also offers job training for the beneficiaries, in order to facilitate their
employment principally (but not only) in big public infrastructure works.
Table 11. cash transfer tyPology in selected countries
Regions Non- contributory unconditional cash transfers
Non- contributory- conditional cash transfers
Cash for work Cash vouchers
Africa Ghana, Lesotho, Tanzania, Zambia, Zimbabwe, Ethiopia, Rwanda, Uganda, Tunisia, Algeria, Mauritania, Egypt, South Africa, Sierra Leone, Mozambique
Nigeria, Malawi, Tanzania, Ethiopia, Kenya, Morocco, Tunisia, Senegal
Burkina Faso, Cameroon, Ethiopia, Rwanda, Malawi, Mozambique, Liberia, Lesotho
Mozambique, Zimbabwe, Senegal
Asia Bangladesh, Bhutan, Cambodia, China, India, Nepal, Pakistan, Sri Lanka, Thailand, Viet Nam, Kazakhstan, Tajikistan, Oman, Saudi Arabia, Iraq, Iran, Syria
Afghanistan, Bangladesh, Cambodia, India, Indonesia, Nepal, Pakistan, the Philippines, Sri Lanka, Thailand, Yemen
India, Yemen Afghanistan, Indonesia, Cambodia, Sri Lanka, Lao PDR, Bangladesh
India, Bangladesh, Pakistan, Sri Lanka, China
LAC Bolivia, Colombia, Ecuador, Paraguay, Peru, Uruguay, Venezuela, Guatemala, Honduras, Mexico, Nicaragua
Argentina, Bolivia, Brazil, Chile, Colombia, Paraguay, Peru, Uruguay, Venezuela, Costa Rica, Dominican Republic, El Salvador, Guatemala, Haiti, Honduras, Mexico, Nicaragua, Panama
Argentina, Paraguay Uruguay, Panama, Dominican Republic
Source: FAPDA and World Bank

63
Conclusion
The consumer support measures analysed in this section were used by countries in Africa, Asia and
LAC to mitigate the impact of the 2007-2009 food, fuel and financial crisis on the poorest and most
vulnerable groups. However, the implementation of these policy measures between 2007 and 2012
has followed different trends, approaches and practices, with some common features and emerging
patterns.
Food and fuel subsidies have remained a popular measure but reforms to improve their effectiveness
and reduce their strain on the budget have emerged as a major area of policy debate. A number
of countries are seeking to rationalize their public spending by gradually moving from generalized,
universal subsidies for food and fuel, which benefit all consumers in a country, towards more targeted
interventions directed at vulnerable households. Although attempts to phase out subsidy regimes
have often proved challenging, there is a growing recognition that universal price subsidies represent
a burden on public finances, benefit the rich more than the poor and distort the market.
Food-based safety net programmes have been widely utilized to protect vulnerable people from
hunger and malnutrition. A growing number of countries in all the three regions are shifting from
short-term, ad-hoc food-based interventions, in most cases implemented in response to emergencies,
towards mainstreaming and institutionalizing free food distributions, nutritional support initiatives
and school feeding into their national social safety net programmes. Africa is lagging behind LAC and
Asia but an increasing number of African countries have moved towards institutionalized food-based
programmes in recent years.
Cash-based transfer schemes have emerged as a preferred policy instrument against poverty and
food insecurity in LAC (mainly as conditional cash transfers) as well as Africa and Asia (mainly as
unconditional transfers). Among the major attractions of cash transfer schemes for many governments
is their high cost-effectiveness due to the fact that transaction costs can be kept at a minimum
and logistics are easier to manage. A growing number of countries are also institutionalizing cash
transfers as well as cash-for-work programmes.
3. Consumer support policy measures

This page intentionally left blank
65
4. Trade and market development policy measures
In response to the global food, financial and fuel crises of 2007 to 2009, governments in developing coun-
tries have been using trade and market development policies to mitigate the impact of high and volatile
food prices. However, because international trade in foodstuffs (along with agricultural products and natural
resources) is at the centre of several emerging challenges to the multilateral and regional trade systems,
trade policies have undergone several changes and even reversals in recent years. While adopting restrictive
trade measures as short term response (i.e. 2007/08), many countries elected to relax trade restrictions and
improve the efficiency of local markets; their general objective was to enhance national food security in the
medium-term (i.e. over 2009/10 and 2011/12). The various trade policies and market-related measures, such
as foodgrain stock management and development of market institutions, pursued between 2007/08 and
2011/12 are reviewed in this section.
4.1 Trade policies
When governments intervene in the trade sector, they generally aim to influence prices in favour of either
producers or consumers. In 2007/08, policy decisions to benefit consumers, by increasing imports and
decreasing exports were more popular than measures to benefit producers by imposing import restrictions
and export bans. However, over the 2009/10 to 2011/12 period, an increasing number of countries contin-
ued to reduce import tariffs with an aim to secure domestic food supply and/or relax export restrictions to
favour producers. In this section we consider trade policies related to the main staple food crops, namely
wheat, maize and rice.
4
66
Food and agriculture policy decisions | Trends, emerging issues and policy alignments since the 2007/08 food security crisis
4.1.1 Import policies
Two groups of countries have been identified in terms of their policies towards staple grain imports: those
maintaining their pre 2007/08 policies and those changing their import policies during the period under
consideration. The information collected in several food import-dependent countries from all three regions
(Table 12) and some major food grain exporting countries (e.g. Argentina) suggests that there was no real
political or economic reason to change import policies in response to the 2007/08 crisis. Countries that
modified their policies adopted variable import tariffs, imposed import bans or pursued import quotas (Table
12) to influence grain prices in favour of consumers or producers.
Import bans
Following the high food prices of 2007/08, import bans on basic food items were imposed only marginally
among those countries where information was available43. A large number of countries did not ban imports:
only seven out of the 71 countries surveyed imposed import bans on any of the three staples. The bans were
often applied as ad-hoc, short-term measures with the objective of protecting domestic producers from
unfair trade, external competition or dumping of cheap food from overseas.
In Africa, only three countries, namely Algeria, Nigeria, and Zambia, had import bans in place during the
reference period (Table 12). Algeria, for instance, imposed a ban on wheat imports in April 2009 citing a
good domestic harvest as the main reason.44 The import ban was lifted in 2011 as the country returned to
43 Information on import bans was not available for six countries: Mauritania (2007/08; 2009/10; 2011/12), Tunisia (2007/08; 2009/10; 2011/12), Iran (2007/08; 2011/12), Syria (2007/08; 2009/10; 2011/12), Cuba (2007/08; 2009/10; 2011/12) and Venezuela (2007/08; 2009/10).
44 Cited by the Office Algerien Interprofessionnel des Céréales (OAIC).
Key Findings
•Overall, removal, suspensions and/or reductions of import tariffs on wheat, rice and maize were
widely practiced during the 2007/08 crisis.
•Over the 2009/10 to 2011/12 period, while Asian and African countries pursued a changing
policy of tariff reduction/suspension, LAC countries reduced/suspended their tariffs on staples.
• Import quotas, often applied as tariff-rate quota systems, were more widely utilized in LAC and
Asia than in Africa.
• Import bans were only marginally adopted during the reference period.
67
international markets to meet its durum wheat requirements. Nigeria had import bans in place on maize
and wheat flour until September 2008. It banned imports of cassava flour in March 2012 to encourage the
substitution of wheat flour with domestic, high quality cassava flour in bread-making.
In Asia, only Thailand, Indonesia and Iran implemented import bans during the study period. In November
2008, Thailand suspended maize imports for a few months from the Ayeyawady-Chao Praya-Mekong
Economic Cooperation Strategy countries (Thailand, Lao PDR, Viet Nam, Cambodia and Myanmar)
to protect farmers from declining domestic prices. Indonesia imposed periodic rice import bans, typically
one month before and two months after the harvest season (March to June), to ensure better prices for
producers in a period of abundant supply. Colombia was the only country in LAC that introduced a tem-
porary import ban on one of the selected staples during the study period (Table 12). In August of 2010, the
Colombian government implemented a temporary import ban on rice with the objective of ensuring higher
prices for producers.
Import tariffs
The most common responses to the 2007/08 global food crisis were the reduction and/or suspension of
import tariffs on staples: almost 60 percent of the surveyed countries with information available suspended
import tariffs with the objective of lowering prices for consumers. A number of these countries main-
tained the suspension/reduction after the crisis, while others reintroduced import tariffs to support domestic
production. A third group of countries maintained a variable approach, intermittently introducing and sus-
pending tariffs (Table 12).
In Africa, the trend in adoption of tariff measures has varied: many countries maintained the suspension/
reduction introduced during the 2007/08 crisis; others reintroduced tariff protection to support domes-
tic producers, while a few countries maintained a variable tariff policy (Table 12). For instance, in 2008,
Tanzania first reduced (from 35 to 10 percent) import tariffs on wheat and then, three years later in 2011
lifted them completely. South Africa zero-rated the two percent import duty on wheat and wheat flour in
January 2009. While the International Trade Administration Commission of South Africa has abolished the
duty, it reinstated the 1999 variable tariff with the condition that the tariff takes effect only if the wheat
price falls below US$157 a tonne. In contrast, Senegal and Burkina Faso temporarily suspended import
tariffs on rice in 2008. Both countries restored import tariffs a few months later. Mali and Nigeria both
followed a variable approach. Mali periodically suspended import tariffs and taxes on rice in 2008, 2009
and 2012, often during the lean season (generally from March to May).45 Similarly, Nigeria temporarily
suspended its rice import tariff for three months in 2008 and then drastically reduced it (from 109 to 30
percent). Subsequently, in 2012, import tariffs on rice, as well as wheat and wheat flour, were raised. The
45 In 2008 the suspension lasted from April to September.
4. Trade and market development policy measures
68
Food and agriculture policy decisions | Trends, emerging issues and policy alignments since the 2007/08 food security crisis
tariff policies of some countries (e.g. Nigeria), suggest a high degree of unpredictability and point to a dis-
cretionary approach, which may limit the scope for private participation in trade.
In Asia, many countries did not change their import policies in response to the 2007/08 food crisis. Among
those that did, however, the majority changed their approach to suit the circumstances while a small number
of countries either maintained their 2007/08 tariff reduction/suspension policies or reintroduced import tar-
iffs (Table 12). Afghanistan and Bangladesh maintained their 2007/08 policy that removed import tariffs
on wheat and rice, respectively. Pakistan reintroduced import tariffs on rice in 2011 having previously sus-
pended them. Indonesia’s tariff policy on staples has tended to vary from one year to the next: the country
re-imposed tariffs on wheat (2009/10), after their removal in 2008, while rice tariffs were first reduced,
increased and then reduced again during the reference period.
In LAC, many countries suspended or reduced import tariffs while others did not change their import policies
as a result of the 2007/08 food crisis (Table 12). Of those that introduced changes, Brazil first reduced (2008)
and then permanently suspended (2009) import duties on yellow maize. Bolivia suspended import tariffs
(2008) on many staple foods (such as wheat, wheat flour, maize and rice), then permanently lifted import
tariffs on wheat flour (2010). Conversely, Ecuador first reduced (May 2008), then lifted (2009) and finally
reintroduced (2012) import tariffs on wheat.
Import quotas and tariff rate quota (TRQ) regimes
Import quotas have often been associated with tariff systems to form tariff-rate quota (TRQ) regimes46 with
a lower (sometimes zero) tariff charged on imports below a quota threshold, and higher tariffs applied once
a specified quota threshold is exceeded.47 The main objective is to protect domestic producers from cheap
imports while making sure there is adequate supply of staple grains at a reasonable price for consumers.
Import quotas, often applied as tariff-rate quota systems, were more widely utilized in LAC and Asia than
in Africa.
TRQ regimes were widely utilized in many LAC countries, including Brazil, Colombia, Costa Rica,
Guatemala, Honduras, Mexico, Nicaragua and Panama (Table 12). Other LAC countries adopted only
quota systems (e.g. Ecuador). In Asia, China (wheat, maize and rice), the Philippines (rice) and Thailand
(maize) adopted TRQs while other countries, such as Bangladesh, India, Sri Lanka, used only a quota sys-
tem. No African country has implemented a TRQ for basic food items, but Zambia and Kenya adopted
some import quotas during the study period.
46 TRQ regimes started developing in the wake of Uruguay Round Agreement on Agriculture to facilitate the tariffication process, i.e. converting non-tariff barriers to tariffs. The 8th round (1986-1994) of multilateral trade negotiations (MTN) conducted within the framework of the General Agreement on Tariffs and Trade (GATT) which led to the creation of the World Trade Organization (WTO). The Uruguay Round provides for convert-ing quantitative restrictions to tariffs and for a phased reduction of tariffs.
47 See http://www.wto.org/english/tratop_e/agric_e/negs_bkgrnd10_access_e.htm#ft1

69
4. Trade and market development policy measures
Table 12. changes in imPort tariff Policies (2007-2012)48
Region No change in import policies-Pre-2007/08 policies sustained
Changed import policies in response to the 2007/08 food crisis
Import tariffs Imposed import ban (ad-hoc)
Pursued quota systems
Tariffs reduction/ suspension maintained after 2007/08
Variable trends after 2007/08
Import tariffs reintroduced after 2007/08
Africa Lesotho* Togo** Ethiopia* Egypt Mozambique**
Algeria (durum wheat), Sierra Leone (rice), Liberia (rice), South Africa (wheat and wheat flour), DRC (basic food items such as wheat), Rwanda (wheat, maize), Tanzania (wheat, cereals), Uganda (wheat), Tunisia****
Mali (rice), Nigeria, Morocco,
Burkina Faso (rice), Senegal (rice, wheat), Mauritania*** (rice),Ghana (rice, maize, whet), Cameroon (wheat, wheat flour, rice), Kenya (wheat, maize), Zimbabwe (maize), Chad, Malawi (wheat flour)
Nigeria, Algeria, Zambia
Zambia, Kenya
Asia Bhutan* Cambodia** Lao** Nepal** Lebanon Oman** Yemen** Iraq** Tajikistan
Afghanistan (wheat), Bangladesh (rice, wheat), Saudi Arabia (wheat), Kazakhstan (wheat),
India, the Philippines, Thailand, Indonesia, Sri Lanka, Syria (wheat maize)
Pakistan (rice) Viet Nam Azerbajan (wheat)**** China (staples)
Thailand, Indonesia, Iran
Bangladesh, China***** India, the Philippines***** Sri Lanka Thailand*****
LAC Chile, Uruguay, Paraguay, Argentina, Costa Rica, Dominican Republic
Bolivia (wheat flour), Brazil (maize, basic food items), Peru (maize, rice), El Salvador (wheat flour, maize), Mexico (wheat, rice, maize), Nicaragua (beans), Panama (basic food items, such as rice), Honduras (wheat flour)
Ecuador (wheat)
Guatemala (wheat flour)*** Colombia (rice)
Colombia Panama***** Nicaragua***** Mexico***** Honduras***** Guatemala***** Brazil***** Costa Rica***** Ecuador Colombia*****
*No tariff system for basic food items; **Tariff system in place and maintained throughout the reference period; ***Tariffs maintained at a lower level; **** Import VAT suspension; ***** TRQ in place.
Source: FAPDA
48 Information on import tariffs was not available for 11 countries: Algeria (2007/08), Chad (2011/12), Egypt (2011/12), Iran (2007/08; 2009/10; 2011/12), Kazakhstan (2007/08), Yemen (2009/10), Syria (2011/12), Cuba (2007/08; 2009/10; 2011/12), Dominican Republic (2007/08), Haiti (2007/08; 2009/10; 2011/12) and Venezuela (2007/08; 2009/10; 2011/12).
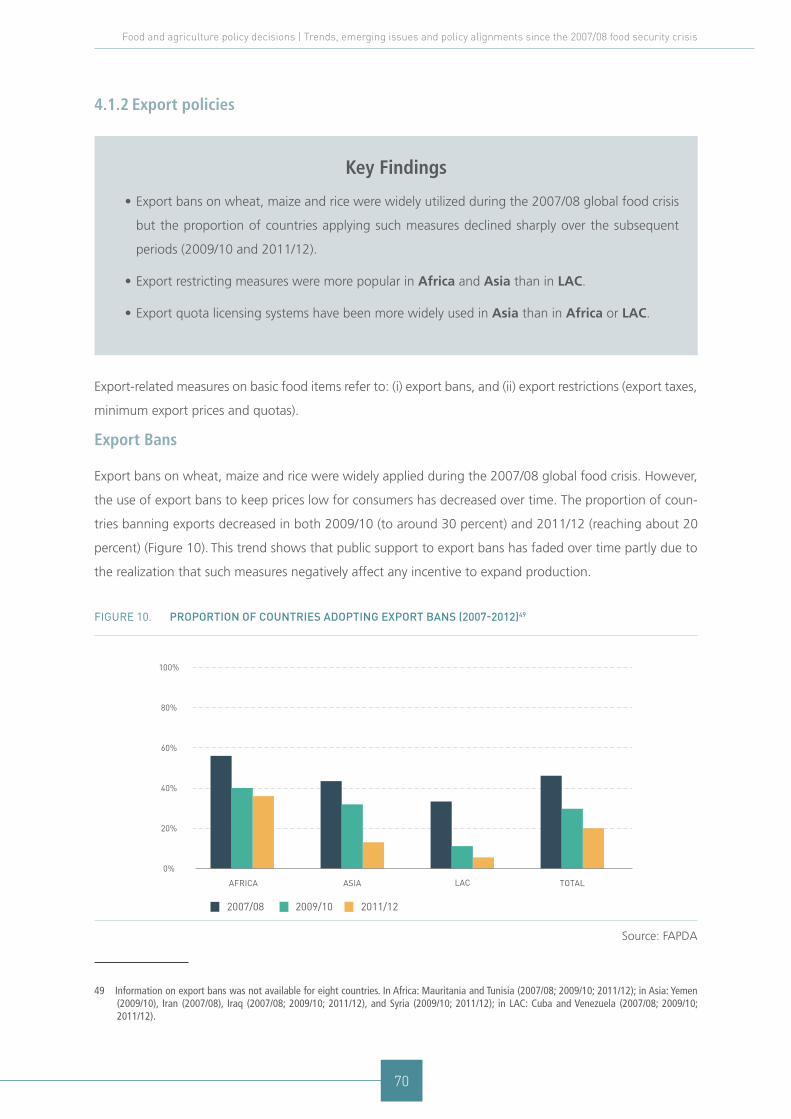
70
Food and agriculture policy decisions | Trends, emerging issues and policy alignments since the 2007/08 food security crisis
4.1.2 Export policies
Export-related measures on basic food items refer to: (i) export bans, and (ii) export restrictions (export taxes,
minimum export prices and quotas).
Export Bans
Export bans on wheat, maize and rice were widely applied during the 2007/08 global food crisis. However,
the use of export bans to keep prices low for consumers has decreased over time. The proportion of coun-
tries banning exports decreased in both 2009/10 (to around 30 percent) and 2011/12 (reaching about 20
percent) (Figure 10). This trend shows that public support to export bans has faded over time partly due to
the realization that such measures negatively affect any incentive to expand production.
Figure 10. ProPortion of countries adoPting exPort bans (2007-2012)49
Source: FAPDA
0%
20%
40%
60%
80%
100%
AFRICA ASIA LAC TOTAL
2007/08 2009/10 2011/12
49 Information on export bans was not available for eight countries. In Africa: Mauritania and Tunisia (2007/08; 2009/10; 2011/12); in Asia: Yemen (2009/10), Iran (2007/08), Iraq (2007/08; 2009/10; 2011/12), and Syria (2009/10; 2011/12); in LAC: Cuba and Venezuela (2007/08; 2009/10; 2011/12).
Key Findings
•Export bans on wheat, maize and rice were widely utilized during the 2007/08 global food crisis
but the proportion of countries applying such measures declined sharply over the subsequent
periods (2009/10 and 2011/12).
•Export restricting measures were more popular in Africa and Asia than in LAC.
•Export quota licensing systems have been more widely used in Asia than in Africa or LAC.
71
In Africa, more than half of the countries monitored (around 56 percent) banned the export of staple grains
in 2007/08 but this proportion decreased to around 36 percent in 2011/12. Many countries used export bans
only on a short-term basis. For instance, Burkina Faso (on cereals), Mali (on rice, maize and other cereals)
Sierra Leone (on rice) and Togo (on maize and others) imposed ad-hoc, short-term export bans in 2008
only. Some countries, including Tanzania, Malawi, Chad and Sierra Leone, intermittently imposed export
bans. In Egypt, the prohibition of rice exports lasted for four years with only short interruptions during the
study period. Nigeria has maintained an export ban on maize since 2009.
In Asia, more than 40 percent of the countries imposed export bans during the 2007/08 global food cri-
sis but the percentage declined to around 13 percent by 2011/12. Several Asian countries are large food
exporters (Cambodia, India, Kazakhstan, Pakistan, Thailand and Viet Nam) and all of them, except
Thailand, used export bans for a short period of time, and only as a response to a major threat. For instance,
Kazakhstan introduced export bans from April to September 2008 due to an unusually low level of stocks.
Export bans were used intermittently in other countries. India, for instance, used export bans sometimes
in combination with quotas and minimum export prices. Export of non-basmati rice was first banned (in
2007/08 and 2009/10) and then lifted (in 2011). With regards to wheat, a ban was applied in 2007, par-
tially lifted in 2009, fully re-imposed and finally lifted in 2011. Maize was also subject to a temporary ban
for three months in 2008. Bangladesh imposed rice export bans intermittently throughout the reference
period, allowing from time to time small quantities to be exported.
Export bans were generally less popular in LAC than in Africa or Asia. In LAC, only six out of the twenty
countries monitored imposed export bans in 2007/08 and their number declined to just one (Brazil on rice
in April 2011) by 2011/12 (Figure 10). Argentina (maize and wheat) and Ecuador (rice) adopted temporary
export bans in 2007/08 only. In contrast, Bolivia (maize) and Brazil (rice) intermittently adopted export bans
during the period 2007-2012.
Export restrictions: export taxes, minimum export prices (MEPs) and quotas
Some countries switched from a policy of banning exports to restricting them by using measures such as
export taxes, MEPs and quotas in order to ensure adequate domestic supply and keep domestic prices down.
Among those countries for which information is available50, export taxes on staples were found to be less
common in Africa (only one country, Egypt, applied the measure) than in Asia or LAC, while export quotas
were relatively more popular in Asia than in Africa or LAC.
In Asia, export taxes were commonly applied on a short-term, ad-hoc basis, sometimes in combination with
50 Information on export restrictions was not available for 12 countries: Tunisia (2007/08; 2009/10; 2011/12), Zambia (2007/08), Azerbaijan (2007/08; 2009/10; 2011/12), Iran (2007/08; 2009/10; 2011/12), Iraq (2007/08; 2009/10; 2011/12), Kazakhstan (2007/08; 2009/10; 2011/12), Syria (2007/08; 2011/12), Tajikistan (2007/08; 2009/10; 2011/12), Dominican Republic (2007/08; 2009/10; 2011/12), Haiti (2007/08; 2009/10), Mexico (2007/08), Venezuela (2007/08; 2009/10; 2011/12).
4. Trade and market development policy measures
72
Food and agriculture policy decisions | Trends, emerging issues and policy alignments since the 2007/08 food security crisis
MEPs and/or quotas. Viet Nam shifted from a policy of a rice export ban to an MEP system, combined with
tax increases and quota systems during the reference period. India, Lebanon, Pakistan and Syria also lifted
their export bans imposed at the peak of the food crisis, and started applying quotas and MEPs to control
export flows. In Pakistan, export taxes were applied in combination with a quota system and MEPs in 2010
when the export ban was lifted. China’s government policy on grain export tax has changed several times:
an export VAT rebate was removed in 2007/08; export taxes were increased in early 2008 (from five to 25
percent) but were largely removed in December 2008; some grain export taxes were removed in June 2009;
an export tax rebate on maize flour was removed in 2010 and an export quota introduced; and a grain
export quota/tax policy continued in 2011/12.
In LAC, there was no common trend among countries in the use of export taxes or export quotas. Argentina
increased export taxes on several food items, including wheat and maize, over the reference period, while
Uruguay removed a five percent rice export tax (in place since 2004) in July 2008. Argentina (on maize and
wheat) (Box 5) and Ecuador (on maize) maintained export quotas throughout the whole period, whereas
Bolivia adopted its export quota system in 2009/10 and 2011/12.
In Africa, the majority of countries have not used export restricting measures. Export quotas were applied
only in Ethiopia, Egypt, Malawi, Tanzania, Zambia and Zimbabwe. Egypt used export taxes to influence
the price and supply of selected staple grains on a number of occasions: grain export taxes were imposed in
2007; export taxes increased in February 2009; and in July 2009 an export ban was lifted as an export tax
was introduced. However, Egypt also combined export bans and taxes on rice with limited monthly export
quotas in October 2009.
box 5. Quotas and comPensation system for maize and wheat in argentina51
51 For more details regarding the effects of the compensation system into internal prices, please see the price support section of the consumer support chapter.
In 2007, the government of Argentina established the Registro de Operadores del Comercio de
Granos – ROE Verde (‘Grain Trade Operators Registry’), to guarantee the domestic supply of grains.
The implementation of ROE Verde meant the creation of a quota system, through which the state
authorizes a volume of grain exports exceeding the annual domestic requirement plus 20 percent
retained as emergency reserves.
At the same time, a compensation system for small and medium producers of wheat and maize was
established to offset the negative impact of the quota system on production incentives. The system
intends to pay the difference between the Free on Board official price and the Free Alongside Ship
theoretical price.
73
4.2 Market development policies
Governments have attempted to influence local grain markets using various policy instruments since the
2007 to 2009 food, fuel and financial crises. Greater emphasis has been given to the management of
public grain stocks and development of market institutions at both national and international levels. Public
stock policies have aimed at addressing market failures in stock management and securing food supplies
to prevent price volatility, while ‘modern’ market development institutions have generally aimed to reduce
information asymmetries which in turn contribute to reducing transaction costs for producers, consumers
and other economic agents.
4.2.1 Foodgrain stock management
Since the 2007/08 global food crisis, there has been renewed interest from both governments and develop-
ment partners in public food reserves in developing countries. More than 65 percent of the sample countries
maintained public grain stock during the period under consideration. The practice has also been expanded
Finally, the system provides a compensation scheme for millers as consumer prices are kept lower. Millers
are compensated for the differential between domestic and international prices, thus preventing an
excessive increase in consumer prices. The system applies to production destined for the domestic
market only.
Key Findings
•Since 2007/08, there has been renewed interest in public food reserves in Africa and Asia, with
an increasing role of public stock as a price stabilization tool.
•More than 65 percent of the surveyed countries maintained public grain stock during the
reference period.
•Many governments in Asia and Africa have been expanding their food stock capacities, whilst
at the same time ensuring that the private sector remains a key partner, especially in building
modern storage facilities.
• In LAC, only a few countries have public food stocks that in some cases involved integrated
systems of procurement, storage and distribution of food items at subsidized prices. Other
countries have subsidized grain storage by private companies or producers.
4. Trade and market development policy measures
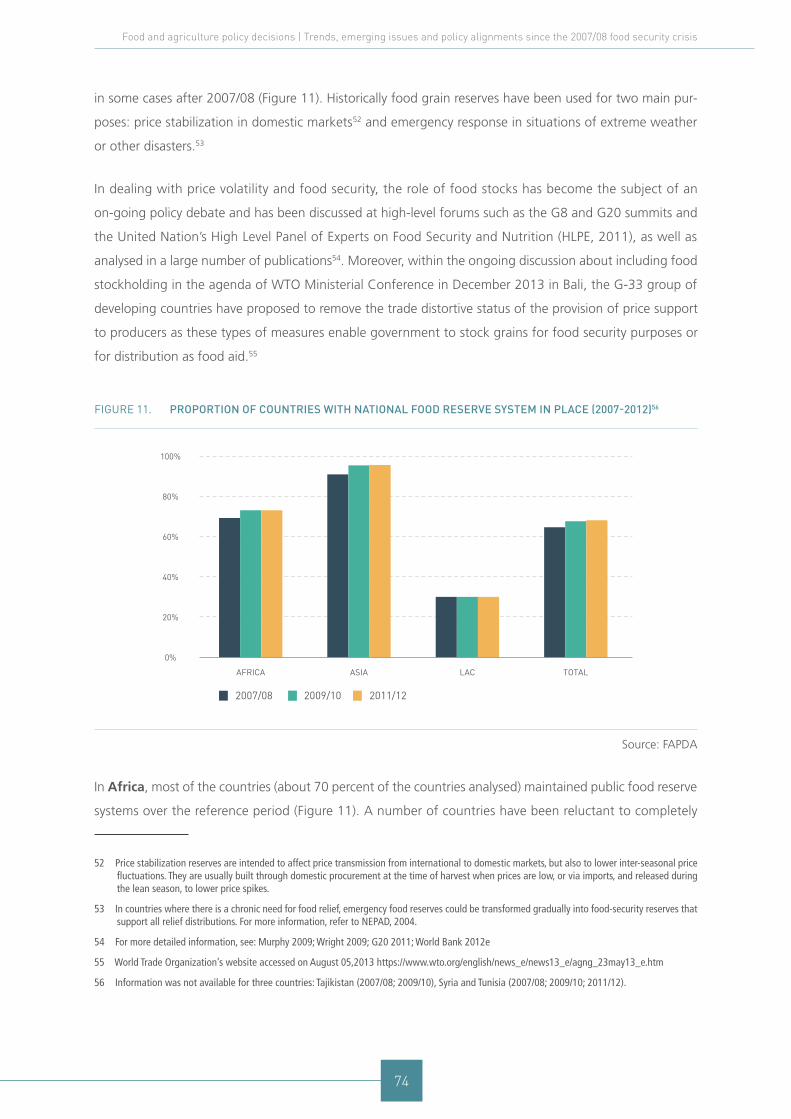
74
Food and agriculture policy decisions | Trends, emerging issues and policy alignments since the 2007/08 food security crisis
in some cases after 2007/08 (Figure 11). Historically food grain reserves have been used for two main pur-
poses: price stabilization in domestic markets52 and emergency response in situations of extreme weather
or other disasters.53
In dealing with price volatility and food security, the role of food stocks has become the subject of an
on-going policy debate and has been discussed at high-level forums such as the G8 and G20 summits and
the United Nation’s High Level Panel of Experts on Food Security and Nutrition (HLPE, 2011), as well as
analysed in a large number of publications54. Moreover, within the ongoing discussion about including food
stockholding in the agenda of WTO Ministerial Conference in December 2013 in Bali, the G-33 group of
developing countries have proposed to remove the trade distortive status of the provision of price support
to producers as these types of measures enable government to stock grains for food security purposes or
for distribution as food aid.55
Figure 11. ProPortion of countries with national food reserve system in Place (2007-2012)56
0%
20%
40%
60%
80%
100%
AFRICA ASIA LAC TOTAL
2007/08 2009/10 2011/12
Source: FAPDA
In Africa, most of the countries (about 70 percent of the countries analysed) maintained public food reserve
systems over the reference period (Figure 11). A number of countries have been reluctant to completely
52 Price stabilization reserves are intended to affect price transmission from international to domestic markets, but also to lower inter-seasonal price fluctuations. They are usually built through domestic procurement at the time of harvest when prices are low, or via imports, and released during the lean season, to lower price spikes.
53 In countries where there is a chronic need for food relief, emergency food reserves could be transformed gradually into food-security reserves that support all relief distributions. For more information, refer to NEPAD, 2004.
54 For more detailed information, see: Murphy 2009; Wright 2009; G20 2011; World Bank 2012e
55 World Trade Organization’s website accessed on August 05,2013 https://www.wto.org/english/news_e/news13_e/agng_23may13_e.htm
56 Information was not available for three countries: Tajikistan (2007/08; 2009/10), Syria and Tunisia (2007/08; 2009/10; 2011/12).

75
give up the price stabilization objective of their food reserves and continue to intervene in grain markets
with varying degrees of success.57 For instance, Zambia’s Food Reserve Agency has remained an active
player in buying maize surplus in the country (holding a reserve of over 350,000 tonnes) over the reference
period. In 2010, the country had a surplus of one million tonnes that could neither be adequately stored
nor exported, resulting in a price collapse.58 New public entities have been recently established to manage
food reserves and intervene in grain markets in some countries. Nigeria established the National Food
Reserve Agency in 2007 and adopted a policy that 15 percent of the total annual grain harvest should be
held in reserve. The agency is to hold five percent as a core strategic grain reserve, and individual states are
to hold another 10 percent, known as ‘state buffer stocks’, to ensure supply in the event of a food crisis.
In 2010 Ghana also established a parastatal under the Ministry of Agriculture, with the aim of reducing
post-harvest losses, ensuring price stability and establishing emergency grain reserves. Other African coun-
tries have decided to strengthen their grain reserves: Kenya planned to double its reserve capacity from
four to eight million sacks of 90 kg in 2011; Malawi decided to increase its food reserve from 60,000 to
more than 100,000 tonnes in 2009; and Rwanda, which had dismantled its parastatal during the era of
structural adjustment programmes, initiated measures to re-establish strategic reserve activities in 2010. The
Post-Harvest Taskforce within the Ministry of Agriculture of Rwanda entered into agreements with private
entities to store 7,000 MT of maize and 3,000 MT of beans purchased from local farmers. The government
intends to permanently establish a strategic food reserve (based on maize and beans), potentially reaching
200,000 MT. North African countries, including Algeria, Mauritania and Morocco, have also invested to
expand public storage capacities.
Over 90 percent of countries in Asia maintained food stocks (Figure 11), and private sector involvement in the
management of stocks increased throughout the reference period.59 Some countries (namely Bangladesh,
China, India, Indonesia, Pakistan, the Philippines and Viet Nam) traditionally hold large public grain
reserves to stabilize domestic prices. In Indonesia, China, the Philippines, India and Bangladesh, state-
owned agencies have been regulating maize and rice markets for decades by building public reserves
(through procurement from farmers or via imports), especially at times of high prices and releasing stocks
into the market to ensure that food prices are affordable to the most vulnerable. Sri Lanka resumed its
Paddy Marketing Board to maintain buffer stocks in 2008. Private sector involvement in the management
of stock has increased in Asia. Lao PDR, for instance, set up a pilot National Rice Reserve in 2009 as a
public-private partnership, providing subsidized credit to millers through state-owned banks to maintain a
minimum rice stock. In India, the government is implementing the Private Entrepreneurs Guarantee scheme
for construction of storage ‘godowns’ (warehouses). The Food Corporation of India provides guarantee to
57 Some of the countries which used food reserves to stabilize prices are: Ghana, Kenya, Malawi, Nigeria, Tanzania and Zambia.
58 David Mackee, “Strategic Grain Reserves”, World-Grain, 24 May 2011, http://www.davidmckee.org/2011/06/03/strategic-grain-reserves/
59 Many developing countries have inadequate storage and logistics systems, and the introduction of private sector participation in grain-storage sector allows governments to: (i) improve operational efficiencies; (ii) reduce wastage/damage, (iii) introduce latest technology and international best practices, and allow better quality control over the grains stocked (IFC, 2012).
4. Trade and market development policy measures

76
Food and agriculture policy decisions | Trends, emerging issues and policy alignments since the 2007/08 food security crisis
rent warehouses constructed under the scheme for a period of 10 years, thereby ensuring a fair return on
investment for entrepreneurs. Pakistan also implemented some pilot public-private partnerships in grain
storage projects, under which the government pays storage rent to owners of storage facilities.
In the Middle East, the common trend over the reference period has been a greater state involvement and
increased investments in strategic grain holdings. Most Middle East countries are heavily dependent on
food imports and the role of government in the procurement, storage and distribution of food grains has
increased in recent years. Some countries (e.g. Oman, Saudi Arabia and Iraq) have plans to expand their
storage capacities (from six months to one year of consumption) (Larson et al., 2012). An exception in the
region is Iran, which has deregulated most of its wheat sector and allowed private milling companies to buy
most of the over 15 million tonnes per annum of wheat produced in the country directly.60
In LAC, only a few countries maintained public food stocks while others subsidized private companies or
producers to store grains. Government involvement in the foodgrain market has been substantially reduced
under structural adjustment policies and market liberalization agreements (e.g. NAFTA) but a few countries
have introduced measures to establish or re-establish public grain stocks or support private stock operations,
mainly in response to the recent high and volatile prices. Bolivia, Honduras, Nicaragua and Venezuela
maintained food stocks as part of an integrated public system in charge of procurement, storage and dis-
tribution of food items at subsidized prices.61 Brazil reintroduced public stocks in 2003 and revitalized the
national food supply agency, CONAB, to manage food reserves for both emergency purpose and price stabi-
lization. CONAB replenishes its stocks through the Programa de Aquisição de Alimentos (Food Procurement
Programme) which purchases food products from smallholders at guaranteed minimum prices. In 2007,
Ecuador created the Unidad Nacional de Almacenamiento (National Storage Unit), a public agency in
charge of managing silos for strategic food reserves, purchasing grains from farmers at guaranteed prices.
Some countries, namely Chile, Colombia and Dominican Republic, did not have public food stocks, but
intervened in domestic markets with the objective of subsidizing the storage of grains by farmers or pri-
vate companies at the time of harvest when prices are low, and subsequently releasing stocks during the
lean season. In Chile, a partnership was established in 2009 between the Ministry of Agriculture and the
public-private company Cotrisa to ensure that the storage of grains on behalf of wheat farmers is subsi-
dized. Also, Colombia implemented the Incentivo al Almacenamiento de Arroz (Incentive for Rice Storage)
throughout the period with the objective of promoting storage of rice by private companies or the produc-
ers themselves. Since 2005, the Dominican Republic has run the Programa Nacional de Pignoraciones,
supporting storage of rice at times of lower producer prices (the government fixes a price band every year).
60 David Mackee, “Strategic Grain Reserves”, World-Grain, 24 May 2011, http://www.davidmckee.org/2011/06/03/strategic-grain-reserves/
61 See also section 3.1.1 on Food Subsidies
77
4.2.2 Market institutions
Nearly all the surveyed countries with available information62 have taken measures to develop ‘modern’
market institutions. Among the major areas of growing policy interest are warehouse receipt systems (WRSs),
commodity exchanges and market information systems.
Warehouse receipt systems
While progress in their utilization has been mixed over the reference period, overall interest in warehouse
receipts systems (WRSs) has grown. The expected benefits include improved access to credit for farmers,
creating cash and forward markets (hence enhancing price discovery and competition), and reducing risks by
stabilizing prices for producers as well as consumers. WRSs provide the holder with the ownership rights to
a certain quantity of product of a specified quality at a certain location. As this right can be bought and sold
and used as collateral,63 WRSs facilitate access to credit, support the development of grades and standards,
and play a critical role in price stabilization and the emergence of futures and derivative markets, which
manage risks. For WRSs to be successful, the trust of stakeholders and operators in these institutions, i.e. in
62 Information on market institutions was not available for 14 countries: Mauritania (2007/08; 2009/10; 2011/12), Togo (2007/08), Cameroon (2007/08; 2011/12), DRC (2009/10; 2011/12), Lesotho (2007/08), Zimbabwe (2007/08), Iran (2007/08), Syria (2011/12), Costa Rica (2007/08), Cuba (2007/08; 2011/12), Guatemala (2007/08), Mexico (2007/08), Nicaragua (2007/08) and Panama (2007/08).
63 WRS can be either 1. negotiable, i.e. they cannot be transferred or sold and the sale of the commodity requires cancellation and re-issue or 2. non-negotiable, i.e. can be transferred with legal protection against claims by previous owners.
Key Findings
•Overall, several countries showed increased interest in the development of warehouse receipt
systems and governments have focused on addressing the challenges in the form of regulatory
frameworks and contract enforcement, especially in Asia and LAC.
•Despite growing interest, fully-functioning agricultural exchange markets are rare in Africa while
many Asian countries and regional bodies are exploring the feasibility of rice futures markets.
More market friendly policies have encouraged transactions through commodity exchanges in
LAC.
•Global and national interests in market information systems have increased as a result of spiking
and volatile prices following the 2007/08 food crisis. Many countries have taken advantage of the
dramatic increase in affordable mobile phone networks and other ICTs for market development.
4. Trade and market development policy measures
78
Food and agriculture policy decisions | Trends, emerging issues and policy alignments since the 2007/08 food security crisis
the legal and regulatory (including licensing) framework, is an essential element.
Several African countries have shown interest in the development of WRSs during the study period but lack
of trust and enforceable regulations in the system means that progress has been slow. National commodity
exchanges are often designed as WRS regulators. For instance, the government in Uganda designated the
Uganda Commodity Exchange (UCE), a private registered company, as WRS regulator under the 2006 WRS
Act and the 2007 WRS Regulations. By 2012, UCE licensed six privately owned warehouses (mainly for
grains) but the warehouses were found to be operating at less than 20 percent capacity in the same year64
because of inadequate regulatory frameworks and a weak contract enforcement mechanism65. In Zambia,
the Zambian Agricultural Commodity Exchange (ZAMACE) was established as a private corporate entity in
2007. Its mandate is to certify and inspect warehouse operators. ZAMACE certified eight district warehouses
in 2010 alone (Tembo, 2011) but inadequate legislative framework to enforce contracts, thin markets and
the failure of the commercial banks to accept the receipts for the deposited grain as ‘commercial paper’
(negotiable and transferrable instruments) are among the major challenges (Sitko and Jayne, 2011).
Tanzania has passed a Warehouse Receipt Act and established a Warehouse Licensing Board but only
export crops such as coffee, cotton and cashew have so far benefited from the initiative (Onumah, 2010).
The governments of Kenya and Rwanda are collaborating with the Eastern Africa Grain Council (EAGC)
to develop WRSs, but moving beyond the pilot activities of the Council has proved to be difficult. South
Africa has no warehouse act but the South Africa Future Exchange (SAFEX) provides regulatory supervision
of SAFEX-backed silo certificates that commonly serve big commercial farmers (Box 6). The Ghana Grains
Council has so far certified only five warehouses in Ghana and a task force was formed in 2012 to prepare
the groundwork for a warehouse receipt law and related regulations (World Bank 2012d). Several West
African countries utilize warrantage66 or inventory credit (Ghana, Burkina Faso, Niger and Senegal) and
contracts de tierces detention (Mali) (USAID, 2012a).
WRSs have also attracted public attention in many Asian countries and governments have focused on
improving the regulatory environment. In Thailand, under the paddy (rice) mortgage programme (first put
in place until 2008 and reintroduced in late 2011), farmers obtained loans by pledging their rice (deposited in
one of the government-run warehouses or with private millers) to the Bank for Agriculture and Agricultural
Cooperatives. However, the programme led to extensive corruption due to inadequate regulatory frameworks
(Jessop et al., 2012). In Cambodia, the government (through Cambodia HARVEST, a project supported by
64 For more information, see the Uganda Commodity Exchange website at: http://www.uce.co.ug/page.php?tb=news&id=11
65 The CEO Magazine. ( available at http://www.theceomagazine-ug.com/news/bumpy-ride-for-the-maize-warehouse-receipt-system.html ).
66 Warrantage in its simplest form is the storage by depositors (farmers) storing thereof a commodity along-side other depositors (farmers of the same group) in a small general store. These systems have extended to include inventory credit, which is the financing of a proportion of the com-modity’s value in the store. Often the financier, the store owner, and the farmer group representative will each control a key to the door padlocks and therefore control the movement of the commodity from the store. In Mali the ‘tierce detention’ (third party holding) works in a similar manner with the banks controlling the release of traders’ goods stored in a third party warehouse.
79
USAID) is working on introducing the country’s first paddy warehouse receipt system, which will help rice
millers to expand their operations and allow Cambodia to process more rice domestically (USAID, 2012b).
India established the Warehousing Development and Regulatory Authority in October 2010 and formally
launched the Negotiable WRS (NWRS) in April 2011 (GoI, 2011). Kazakhstan’s well-structured and efficient
regulatory agency has contributed to building and maintaining trust in the system (UNCTAD, 2009).
In LAC, warehouse receipts systems (WRSs) operate in different forms but smallholders have difficulty
accessing the system. Major grain exporting countries such as Argentina, Brazil and Uruguay have seen
increased investment and public support (e.g. subsidies and tax incentives) for warehouses and grain eleva-
tors owned by cooperatives, domestic agribusiness companies and big international trading houses, such as
Bunge and Cargill (Ordoñez et al., 2001; Murphy et al., 2012), but smallholders have limited access to these
new commercial opportunities (Murphy et al., 2012). In Brazil, general warehousing services are provided by
registered grain warehouse operators but the quality of the service was found to be poor as these systems
were created quickly to mainly manage large public emergency stocks (UNCTAD, 2009).
The ownership of licensed warehousing companies in Colombia is largely held by wealthy banks and the
state, which helped in protecting depositors from fraud-related losses. Moreover, the most profitable busi-
ness in the country is field warehousing (providing warehousing services on the client’s premises)67 (UNCTAD,
2009).
Commodity exchange systems (CESs)
Many countries have put policy emphasis on developing and strengthening agricultural commodity
exchanges as a medium-term response to high and volatile food prices. Successful commodity exchange
systems, in combination with WRSs, have the potential of improving the functioning of agricultural markets
by improving price formation, enabling the management of risk, market transparency and regional trade,
thereby raising farm output and rural incomes as well as enhancing food security (UNCTAD, 2009).
In Africa, there has been a growing interest in commodity exchanges but the number of fully functioning
exchange markets is still limited. The Zambia Agricultural Commodity Exchange has undergone several
transformations since its creation in May 2007, and has not operated as an exchange since January 2011
(USAID, 2009). The role of the Malawi Agricultural Commodity Exchange has so far been limited to pro-
viding price information and facilitating procurement for the World Food Program. The Kenya Commodity
Exchange only operates as provider of price information. The Uganda Commodity Exchange has been
restructured since 2006 but the restructuring process has yet to achieve operational viability (Onumah,
67 A field warehouse is an arrangement where a collateral management or credit support company takes over the warehouse of a depositor (pro-ducer/ customer) or a public warehouse by leasing it (or part of it) for a nominal fee, and becomes responsible for the control of the commodities to be used as collateral.
4. Trade and market development policy measures
80
Food and agriculture policy decisions | Trends, emerging issues and policy alignments since the 2007/08 food security crisis
2012). More positively, the Ethiopia Commodity Exchange, which was established in 2007 and is owned
by the government, has seen an expansion of its export commodity trading activities, especially coffee and
sesame. Maize, wheat and beans are also listed for trading but the exchange is unable to attract a significant
volume of these commodities and traded is limited to spot/cash exchange (Rashid et al., 2010). The South
Africa Futures Exchange (SAFEX) is by far the most successful exchange in Africa (Box 6). On average, SAFEX
trades futures and options contracts amounting to 200,000 tonnes of white maize per day. Most large-scale
farmers in South Africa sell their grains through SAFEX, usually through brokers (Rashid et al., 2010). With
the exception of SAFEX, exchanges in Africa have yet to include futures market and sufficient trade volumes
of staples to offer an effective price discovery system.
In Asia, regional organizations and several countries have been exploring whether rice futures would help
bring down price volatility. As shown below in chapter five, member states of the Association of Southeast
Asian Nations (ASEAN), are considering the feasibility of establishing a rice futures market in the region.
A few countries (e.g. China, India, Pakistan and Thailand) have one or more commodity exchanges
trading in rice and other staple grains but face several challenges. China began early in trading rice futures
contracts in 2009 on the Zhengzhou Commodity Exchange with the goal of improving domestic grain pric-
ing and providing grain traders with more risk control measures.68 But trading volumes have shown large
variations and prices of the Zhengzhou rice futures contract are not well correlated with other Asian rice
prices, implying significant basis risk (McKenzie, 2012). Pakistan Mercantile Exchange Limited began its
operations in May 2007 (with rice and wheat among the commodities traded) but trading volumes are small
and the exchange is faced with the challenge of engaging stakeholders.69 The Agricultural Futures Exchange
of Thailand launched the first white rice futures contract in March 2007 but government involvement in
the marketplace (e.g. warehousing) has crowded out private storage and removed the need of the private
sector to use futures markets (McKenzie, 2012). The government in India banned futures trading in some
food commodities in May 2008 in an attempt to contain the price rise in essential commodities but lifted
the ban later in 2008.70
In LAC, market-friendly policies have encouraged transactions through commodity exchanges (Arias et al.,
2011). At least 10 countries in the region (including Argentina, Brazil, Chile, Colombia, Costa Rica, El
Salvador, Nicaragua and Venezuela) had at least one functioning agricultural commodity exchange. The
Bolsa de Mercadorias & Futuros (BM&F) of Brazil stands out as one of the most successful cases, and in
2008 the exchange was ranked twelfth globally for the number of futures traded and/or cleared (Arias et
al., 2011). BM&F has also introduced several innovative mechanisms in recent years, which serve as models
68 See: http://oryza.com/content/china-launches-early-rice-futures
69 See: http://www.pakistantoday.com.pk/2012/07/18/news/profit/pmex-is-the-trailblazer/ and http://www.agricorner.com/seminar-on-physical-trad-ing-of-agriculture-commodities-on-pmex/
70 See: http://www.rupe-india.org/51/commodity.html
81
for increasing the participation of small-scale farmers in futures markets (UNCTAD, 2009). Other countries,
notably Mexico and Uruguay, do not have an agricultural commodity exchange but rely on neighbouring
ones (the United States for Mexico and Argentina for Uruguay) for price information and hedging.
box 6. agricultural commodity exchange in south africa
Market information systems
Global and national interest in market information has increased as a result of spiking and volatile prices fol-
lowing the 2007/08 food crisis. Globally, the Committee on World Food Security (through its Global Strategic
Framework, 2012) and the G20 (Seoul Summit, November 2010) have supported the Agricultural Market
Information System (AMIS)71 to improve food market transparency and encourage coordination of policy
action to reduce price volatility. Improved access to new information and communication technologies (ICT),
using, for example, mobile phones and internet-based applications, has made a significant contribution to
the stabilization of staple food prices at national and regional levels.
In Africa, government-run market information services have been criticized for their irregularity and poor
accuracy but, in recent years, the policy environments in many countries have encouraged the private sector
to take advantage of the dramatic increase in affordable mobile phone networks and other ICTs to dissem-
inate market information. In East Africa, most countries have a variety of models for market information
systems: some are government-owned, some are private initiatives and a few are public-private partnerships.
Both public and private initiatives in Kenya, Uganda and Tanzania saw an expansion of mobile technology
71 For more information, see AMIS webpage at; http://www.amis‐outlook.org/
The South Africa Futures Exchange (SAFEX) was established by private sector players in 1996 and is by
far the most successful exchange in Africa. Most large-scale producers in South Africa sell their grains
through SAFEX. Small producers benefit mainly from SAFEX’s role as an effective price discovery system.
Where producers wish to defer sale, they can obtain finance against the SAFEX-backed silo certificates
(SCs). In such cases, the borrower is usually required to hedge against any downside price risks using
futures and options traded on the exchange. The main commodities traded by SAFEX are maize (white
and yellow), wheat, sunflower seeds and soybeans. SAFEX has expanded into a vehicle for speculation
by hedge funds and others. When it began, 50 percent of contracts on the exchange resulted in physical
deliveries via transfer of a warehouse receipt; by 2010 less than two percent of contracts resulted in
physical deliveries.
4. Trade and market development policy measures
82
Food and agriculture policy decisions | Trends, emerging issues and policy alignments since the 2007/08 food security crisis
and other ICTs to disseminate market information and provide matching (buyer with seller) services. Kenya,
for example, is one of the countries where the use of ICT-based market information systems has grown
rapidly and become common practice. At the end of 2011, Kenya was the leading country in East Africa
in terms of mobile usage with a 67.2 percent mobile penetration rate.72 The new technology has allowed
farmers, traders and other beneficiaries to access information on the pricing of inputs and outputs and
on finding and connecting suppliers, buyers or logistics providers (e.g. storage) and transport companies.
Several West African countries, including Burkina Faso, Ghana, Mali and Nigeria, have also benefitted
from the expansion of ICT-based market information systems. In North Africa, Morocco developed a public
MIS known as Asaar (prices in Arabic) in 2011, to provide accurate data on agricultural product prices, using
hi-tech data collection and transmission tools.
Asian governments have developed ICT programmes and encouraged the private sector and NGOs to
develop various schemes that provide various marketing services.73 For instance, Bangladesh has ICT-based
projects that provide market information as well as matching buyer and seller services through mobile
phone, SMS or IVR (interactive voice response). In China, a government scheme (established in 2006/07)
uses mobile, SMS and IVR to provide market price information and technical production information to
millions of farmers. Among the Asian countries, India has one of the largest numbers of private and public
owned ICT-based markets and other information-providing schemes. There is a multitude of services that
seek to increase access to agricultural markets via mobile phones, Internet, tele-centres and IVR (Box 7).
box 7. india ict aPPlications in market information and related services
72 This was followed by Tanzania with 56% mobile penetration and finally Uganda with 38.4%. See: http://www.ihub.co.ke/blog/2012/05/mo-bile-technology-in-east-africa/
73 For more information, see: http://markets.ischool.berkeley.edu/projects/
Agriwatch (established in 2000) is a private MIS service-provider whose subscribers have access to
information on agricultural markets through newspapers, magazines, SMS and a website.
E-Choupal (established in 2000) is a private initiative which became the largest private sector initiative
among all Internet-based interventions in rural India, reaching out to more than four million farmers
growing a range of crops, including rice, wheat and soy bean.
BSNL & NFL (established in 2010) is a public-private partnership project which provides subscribers
with a free SMS or voicemail, five times daily in the local language of the region of the subscriber. Users
have access to information on big market prices, soil testing, farming techniques, dairy and weather
forecasts.
e-Krishi (established in 2006) is a public scheme aimed at: (i) providing web-based services for facilitating
and enabling farmers and other stakeholders through Agribusiness Centres, (ii) and interacting with
agricultural service providers in the private, government and non-government sectors.
83
In LAC, nearly all countries have taken steps to improve farmers’ access to market information. Several coun-
tries, including Bolivia, Chile, Colombia, Costa Rica, Ecuador, Paraguay, and Peru, have introduced or
expanded a website or mobile-based market information service. Bolivia maintains a production and mar-
kets monitoring system, Sistema de Información a la Producción y los Mercados Nacionales (SISPAM), which
tracks the wholesale and retail prices of agricultural products at country level. In the wake of the 2007/08
global food crisis, SISPAM enabled the government to apply price bands and thus stabilize domestic prices
of food items, such as chicken, potatoes, maize and soybeans (Bosch et al., 2012). Ecuador and Paraguay
introduced an online national information system for main staple prices in major markets (through their
Ministries of Agriculture, Livestock and Fisheries) in 2009 and 2008, respectively. Peru introduced a supply
and pricing system (Sistema de Abastecimiento y Precios) in 2008, providing real-time access to information
related to volumes, prices and sources of major agricultural and agro-industrial products in the country.
Conclusion
Various trade and market development policy measures were used to mitigate the impact of high
and volatile food prices on consumers, producers and other value chain operators throughout the
reference period with varying degrees of intensity and policy combinations. Some policies were
adopted on an ad-hoc and short-term basis while others were applied more consistently and with a
longer-term perspective.
A number of governments adopted more open or non-restrictive import policies but imposed export
bans and restrictions in the immediate aftermath of the 2007/08 food crisis to ensure domestic
availability of food staples at affordable prices. Over the 2009/10 to 2011/12 period, however, an
increasing number of countries removed export bans, relaxed export restrictions, and modified import
tariffs, with the goal of either securing food for consumers or protecting producers.
The new trend in trade policies was combined with a renewed public interest in food grain stocks
(especially in Asia and Africa), warehouse receipt systems (WRSs), agricultural commodity exchanges
and market information systems as a more long-term solution to manage price fluctuations, enhance
farmers’ income and promote market efficiency. Many of the countries reviewed increasingly
promoted public-private partnership, particularly in stock management and market information
systems. Measures to address regulatory and legislative challenges in the operation of WRSs and
commodity exchanges have also attracted a growing attention. Many African, Asian and LAC
countries have seen a rapid expansion of mobile phone networks and other ICTs to provide pricing as
well as matching (sellers with buyers) services (virtual trading floors).
4. Trade and market development policy measures

This page intentionally left blank
85
5. Policy coherence, integration and harmonization at national and regional levels
Policy coherence is achieved when policies across a range of different domestic policy areas, various insti-
tutions, organizations, systems and actors complement each other. The systematic promotion of mutually
reinforcing actions and coordination is necessary to achieve predetermined food-security related or agri-
cultural transformation goals at national or regional levels more effectively (OECD, 2012). This chapter
addresses issues such as national food self-sufficiency and regional food security that require actions beyond
specific policies described in the previous chapters (national policies in favour of producers, consumers and
trade and domestic markets). The first section of the chapter is dedicated to the analysis of two different
integrated approaches adopted by states in response to the food crisis. Several governmental agencies and
institutions are involved (e.g. Ministries of Agriculture, Social Affairs, Education, Health and Trade) in the
formulation of coherent74 and integrated75 policies to achieve food self-sufficiency or pursue a food export
strategy. The implications of these national policies for regional policy harmonization, regional food security
and intra-regional free trade agreements are also discussed. The second part of the chapter looks at policy
measures enacted by groups of countries in selected76 Regional Economic Communities (RECs) following the
food, fuel and financial crises, examining trade policy harmonization77 between national policies and regional
commitments and recent regional stock initiatives to achieve regional food security.
74 Policy coherence is defined by OECD as “the systematic promotion of mutually reinforcing policy actions across government departments and agencies creating synergies towards achieving the agreed objectives. Within national governments, policy coherence issues arise between differ-ent types of public policies, between different levels of government, between different stakeholders and at an international level” (OECD, 2012).
75 “Policy integration concerns management of cross-cutting issues in policy making that transcend the boundaries of established policy fields. It also includes management of policy responsibility within a single organization or sector. Integrated policy making refers both to horizontal integration between policy sectors (different departments and/or professions in public authorities) and vertical intergovernmental integration in policy mak-ing (between different tiers of government), or combinations of both” (EAUE, 2007).
76 The selection is based on data availability as well as relevance with respect to the surveyed countries.
77 Policy harmonization is interpreted as “the process of introducing uniform or essentially similar regulations in different countries”. This could be the result of “two different processes: the enactment of common policy instruments, by agreement between the countries, and the use of similar instruments within a common framework” (Josling, 1997).
5
86
Food and agriculture policy decisions | Trends, emerging issues and policy alignments since the 2007/08 food security crisis
5.1 National level policy coherence and integration
The 2007/08 food price crisis was a critical turning point for several countries’ decisions on food and agri-
culture policies. Some policies which were abandoned during the period of market and trade liberalization
and structural reforms regained attention after the crisis broke out. Government interventions in food and
agricultural production, trade and consumption have increased. This section focuses on two approaches
adopted or revamped by certain countries to (i) achieve food self-sufficiency, and (ii) boost key agricultural
commodity exports.
5.1.1 Policy coherence and integration to achieve food self-sufficiency
Since 2007/08, the food self-reliance approach78 (including food imports to achieve national food demands)
has lost its appeal and the food self-sufficiency79 strategy has grown in popularity (Demeke et al., 2009).
For some countries with a large gap between production and consumption, relying on food imports has
78 The ‘food self-reliance’ approach implies a certain degree of dependency on food imports which can be financed by producing and exporting other high-value agricultural commodities or no-food commodities (Clay et al., 1989).
79 One notion of self-sufficiency is the situation of autarky in which all imports and exports are ruled out and the market-determined demand is met by domestic production. The other notion of self-sufficiency implies a level of production which meets not only the market-related effective demand, but also the nutritional requirement of the population. While some notions of food self-sufficiency imply self-sufficiency of food grains, others relate to self-sufficiency of all or broad range of food items (Clay et al., 1989).
Key Findings
•Many governments have pursued integrated production and trade policies with the goal of
increasing national production and becoming food self-sufficient especially following the food
crisis.
• In Asia, some countries launched comprehensive programmes of food self-sufficiency during the
reference period. Each package combined the use of subsidized technological inputs and services,
price support, import tariffs to protect domestic producers, and increased public spending in
agriculture (e.g. the Philippines and China).
• In Africa and LAC, the integrated approach, adopted since 2007/08, included various production,
trade and price policies to modernize agriculture and increase the production of food and other
commodities (e.g. Morocco, Zambia and Ecuador).
• Implementing integrated policy packages to attain food self-sufficiency entails less dependence
on trade with negative implications for regional food security and intra-regional food trade.
87
become a challenging option due to soaring costs of imported food, deteriorating balance of payments and
supply uncertainty due to export restrictions imposed by major grain exporters. Many governments have thus
integrated their production and trade policies with the goal of becoming food self-sufficient. The different
measures aim to ensure high returns for farmers while safeguarding consumers against high prices in many
cases (Annex 3).
In Asia, the comprehensive programme for self-sufficiency of the Philippines, namely the Food Staples Self
Sufficiency Road Map (2011-2016), is one of the most well-known examples. It aims to: (i) increase grain
production, through technology improvement, extension and irrigation facilities, price support to farmers,
increased credit guarantee fund and greater coverage of crop insurance; (ii) enhance farm mechanization
and reduction of post-harvest losses; and (iii) stabilize per capita rice consumption through the reduction of
table waste and incentives to encourage diet diversification (non-rice production set to be increased by 3.5
percent annually).80 The previous agriculture department’s programme, named FIELDS (2008-2010), utilized
a similar approach by covering several areas of intervention, including inputs improvement (organic fertiliz-
ers and certified seeds), irrigation development, formal credit facilities and technical assistance to farmers.
Seeking to maintain a self-sufficiency rate of at least 95 percent for major grain crops, China undertook a
major reform programme to reduce agricultural taxation and implement massive subsidies and other support
programmes in 2006. The sector benefits from the so-called Four Subsidies policy: Chinese farmers receive
subsidies according to their cultivated area, inputs and improved seeds used and machinery and equipment
employed. China, despite being one of the most open economies in Asia (overall tariff regimes have been
liberalized over the last decade), protects the food grain sector through a tariff-rate quota system. China
has thus entered a new era in its approach to agricultural policy, as it began to subsidize rather than tax
agriculture. It has also increased spending on rural infrastructure. China’s new policy considers agriculture as
a sector needing a helping hand. Indonesia also supported prices, restricted imports and increased public
spending in agriculture, among others, to achieve food self-sufficiency (Annex 3).
Morocco’s Plan Maroc Vert, launched in 2008, is a good example of an African country’s integrated
package containing a broad range of measures to accelerate and modernize agriculture. It offered finance
and credit facilities, stimulated private sector participation and adopted leveraging partnerships (value chain
partners) with banks in order to offer long-term credit and help farmers build their asset base and manage
production related risks. Morocco also imposes high import tariffs and duties on a vast range of agricultural
products, including staple food items. Zambia has provided support to farmers through the Farmer Input
Support Programme (FISP) since 2002. This self-targeting initiative provides farmers’ organizations with a
mechanism through which subsidized inputs are distributed to their members. Throughout the reference
80 For more information on the Philippines’ programmes for self-sufficiency see: http://www.gov.ph/2011/04/12/briefer-on-the-food-staples-self-suf-ficiency-roadmap-2011-2016/ and http://www.grain.org/article/entries/1654-philippines-fields-ushers-a-field-day-for-seed-companies; http://ati.da.gov.ph/rtc1/agri-info/fields-program
4. Trade and market development policy measures
88
Food and agriculture policy decisions | Trends, emerging issues and policy alignments since the 2007/08 food security crisis
period this mechanism has increased the number of beneficiaries reached, the allocated budget (from ZMW
193.1 billion in 2007 to ZMW 485 billion in 2011) and varieties of crops covered (soya, cotton, sunflowers
and rice have been added to maize). FISP is complemented by a public procurement system managed by the
Food Reserve Agency which has managed large maize purchasing operations through a guaranteed mini-
mum price. This procurement/price support system has contributed to a large increase in maize production
in the last few years.
In LAC, Ecuador’s agricultural policy has undergone a deep transformation since 2007, as part of a broader
economic, productive and agrarian revolution, which identifies agriculture as the cornerstone of its rural
development, food security and environmental preservation. The 2008-2011 Plan Nacional para el Buen
Vivir (National Plan for Good Living) and the 2010 Agenda para la Transformación Productiva (Agenda for
Productive Transformation), set two main objectives: (i) a shift from a primary export model economy to a
knowledge-based economy with high value-added exports, in harmony with environmental and social pro-
tection considerations and (ii) a reduction of 40 percent of the share of imports of maize, soybean, wheat
and barley in domestic consumption by 2013 and the achievement of ‘food sovereignty’.81 To this end, the
government pursued coordinated policies in support of producers, consumers and trade.
Some of the policy measures seeking food self-sufficiency, especially import restrictions and price subsidies,
may impose costs on consumers via sharp price increases. To counter this adverse effect, the countries con-
sidered generally grant pro-consumer subsidies and implement other safety nets schemes to ensure food
security for the most vulnerable. The RASKIN programme in Indonesia provides poor households with rice
and other commodities at a subsidized price. In Morocco subsidies are granted right along the value chain,
from millers to retail consumers, to make wheat products cheaper. Whereas in Ecuador a system of price
control on staples is in place and strategic food reserves are held by a national storage unit which intervenes
for price stabilization purposes as well. Food subsidies in Zambia, together with price control measures, are
used to provide cheap and affordable staple food (i.e. maize meal) especially to low income groups.
Food self-sufficiency policies entail protectionist measures such as import and export restrictions and non-tar-
iff barriers to insulate domestic food markets from regional and international price fluctuations. Limiting or
banning trade, however, undermines free intra-regional trade agreements and regional food security goals
(see also section 5.2 below). The policy of food self-sufficiency is particularly at odds with harmonization pol-
icies at regional levels to achieve regional food security. For instance, some RECs in Africa (e.g. East African
Community, EAC, and Common Market for Eastern and Southern Africa, COMESA) have shown interest in a
strategy of ‘maize without borders’ to achieve regional food security. However, the strategy is effective only
81 Food sovereignty, a concept developed at the World Food Summit of 1996 by La Via Campesina movement and now embraced by several gov-ernments around the world, is defined as the right of peoples and sovereign states to democratically determine their own agricultural and food policies. In September 2008, Ecuador became the first country to embed food sovereignty into its constitution. Since then another six countries have integrated food sovereignty into their national constitutions or laws including: Venezuela, Nicaragua, Mali, Bolivia, Nepal and Senegal.

89
if tariffs are removed and the free trade policy is accompanied by harmonized policies and regulatory frame-
works as well as commitments to eliminate all non-tariff barriers to regional trade (COMESA and EAC, 2003).
The cost of a food self-sufficiency strategy can also be very high. Unlike the examples mentioned here, other
poorer countries face enormous challenges in pursuing comprehensive and harmonized producer support
policy strategies. These countries often provide limited support to agriculture with no protection against
cheap and subsidized imports. Many poor countries even adopt contradictory or non-harmonized policies
by using different measures to keep prices lower for consumers without considering the disincentive impact
of such policies on producers. For instance, many African countries offer direct and indirect grain price
subsidies to protect consumers against high prices (section 3.1.1) but have limited and inadequate producer
price support programmes (section 2.3). A recent OECD study (OECD, 2013) has also shown that, based on
a sample of 47 developed and developing countries, the level of support to producers tends to be higher
in countries with higher income levels. Only relatively better-off countries can afford the cost of setting up
effective support programmes for producers while offering subsidies and other social protection programmes
to consumers.
5.1.2 Integrated policies to stimulate exports of key commodities
The post 2007/08 period has prompted some countries to aim beyond national food security. With the goal
of taking advantage of high international prices, some food-producing countries adopted integrated and
harmonized policy packages to stimulate the production and export of selected commodities, for which
Key Findings
•With the goal of taking advantage of high international prices and conjugating trade liberalization
and agriculture growth, some countries have adopted integrated and coherent policy packages
to stimulate the export of selected food commodities.
• In Asia, LAC and Africa, countries with comparative advantages in producing specific commodities
have recently launched an export promotion policy that includes measures to facilitate trade (by
easing export procedures), along with integrated programmes to boost production and enhance
private sector participation.
•The export strategy is consistent with trade and food security policies of many RECs since most
countries are food-deficit and would benefit from having adequate and reliable sources of food
within the REC.
5. Policy coherence, integration and harmonization at national and regional levels
90
Food and agriculture policy decisions | Trends, emerging issues and policy alignments since the 2007/08 food security crisis
some countries have comparative advantages.82 The overall strategy includes a set of complementary inter-
ventions to: provide incentives to farmers to increase production especially through technical and financial
assistance; create an enabling environment for trade (post-production infrastructure, storage facilities, roads,
etc.) and for private investments, especially in R&D and on new technologies; and to facilitate exports by eas-
ing restrictions (quotas and licenses) and procedures (testing and certification, packaging, compliance with
international standards etc.). (See Annex 4 for details of pro-export policies adopted by selected countries).
In Asia, a comprehensive export strategy has been implemented by Viet Nam and more recently by
Cambodia, among other countries. In 2010 Cambodia launched its Rice Export Policy which includes meas-
ures to facilitate trade by easing export procedures along with programmes to boost rice production. The
latter entails provision of inputs, infrastructure expansion as well as land titling enhancement to secure
land tenure for rice farmers. In Viet Nam, a country which changed its status from food importer to one
of the world’s major exporters (second largest rice exporter) in less than two decades, a recent decree by
the Prime Minister replaced the food security objective by a policy of “implementing international trade
commitments and ensuring efficient export supplies” (Government of Viet Nam, 2010).83 The government
is strongly committed to supporting domestic production (especially rice) trough credit and finance facilities,
improved land management and investments in R&D (rather than direct price support and input subsidies).
Additionally, the growing trade liberalization, while ensuring adequate supply to meet domestic demand,
has encouraged exports: the country has abandoned the export quota policy in favour of a less restrictive
Minimum Export Price policy.84
In LAC, Peru, among other countries, has recently enhanced its export promotion and trade openness pol-
icy (already in place since the 1990s) with an integrated and coherent approach. With its Plan Estratégico
Nacional Exportador 2003-2013 (National Strategic Exporting Plan 2003-2013), the Ministry of Foreign
Trade and Tourism has argued for “developing trade aggressively based on the efforts of the state and the
private sector to increase and diversify exports and achieve a competitive insertion in international markets”.
This view firmly subscribes to the belief that major advantages (for both national producers and consum-
ers) are generated by an open trade policy, while supported by a concurrent role of the state in granting
82 Export-oriented agriculture is one of the pillars of neoliberal economic development plans. It promotes the expansion of traditional (e.g. maize, wheat, rice and sugar) and non-traditional (e.g. asparagus, strawberries and palm oil) agricultural exports in order to increase capital flows between countries and economic growth in the long run. Foods that are exported are replaced in national diets by imports from other exporting countries, which citizens are expected to purchase with cash income earned from participation in export-oriented agribusiness or industry. Some criticalities of the export-based approach reveal that this strategy may take the form of excessive encouragement to promote export crops to the detriment of food crops intended for domestic consumption (food staple), also leading to less diversification in production. In addition, an export oriented economy exposes countries to international shocks and price volatility as the system mainly relies on international markets to sustain its growth (Gakou, 1987).
83 Viet Nam’s success in achieving rapid agricultural growth since the implementation of policy reforms in the late 1980s was mainly fuelled by growth in rice productivity following the rapid adoption of modern varieties, increased fertilizer use, and increased cropping intensity. The policy reforms created the right economic incentives for farmers to adopt yield- increasing technologies. Rice production grew at more than five percent per annum during the early 1990s and Viet Nam rapidly achieved the status of a major exporting country (Tran Manh Hung, 2009).
84 Given the importance of rice in the Vietnamese economy and society, the government has maintained a certain degree of control over rice exports, by adjusting rice export targets throughout the year (subject to changes in domestic supply and demand) and regulating the minimum export price to ensure at least 30 percent profit for farmers. The government, at its discretion, can also suspend rice exports whenever deemed necessary, while state-owned enterprises have control over a big share of the rice exports.

91
5. Policy coherence, integration and harmonization at national and regional levels
equitable market access to all citizens.85 To this end, the government implemented an integrated approach,
complementing its policy of opening and facilitating trade with producer support measures, such as credits,
technical assistance or infrastructure construction.86
Among African countries, in 2007 Uganda launched the National Export Strategy 2008-2012 (NES) to
serve as holistic national medium-term plan to revamp the country’s export sector. Priority commodities
included in the strategy are coffee, fish, tea, cotton, flowers and services. Peculiarities of the NES are the high
involvement of the private sector in the strategy and the focus on the gender dimension to create a dynamic
and competitive export sector with more participation by women. The government is expected to enhance
the competitiveness of Uganda’s exports through developing supply-side capabilities, improving the business
environment and reducing the cost of doing business. Among the key measures identified to improve the
overall environment are: providing effective trade support services (market information, trade finance devel-
opment, trade promotion and quality management) and enhancing coherence of export support policies,
by improving institutional capacity and inter-institutional coordination.87 Furthermore, Morocco is pursuing
an export strategy through its National Plan for the Development and Promotion of Exports.
The adoption of complementary policy measures (trade, production, post-production infrastructure and
the overall business environment) to promote agricultural exports appears feasible only for countries with
adequate resources as well as comparative and competitive advantages. Nonetheless, the strategy of export
promotion is consistent with trade and food security policies of many RECs. As most countries are food-defi-
cit, adequate and reliable sources of food within REC member countries could encourage more open trade
policies rather than food self-sufficiency strategies. It is generally argued that national food self-sufficiency
is less efficient than free regional trade which increases the availability of food for deficit regions, stabilizes
market prices and offers incentives for surplus producing regions.
5.2 Harmonization of country level policy decisions with Regional Economic Communities
Regional Economic Communities (RECs) are established to foster economic development by facilitating
trade. Closer trade links among REC members allow countries to overcome obstacles caused by the relatively
small size of domestic markets. Regional trade with food staples enhances food security by increasing the
availability of food through the free movement of food commodities from a surplus to a deficit area. The free
movement of food within a region can reduce the volatility of food prices by absorbing external or internal
85 See the Peru’s Ministerial vision on foreign trade at: http://www.mincetur.gob.pe/newweb/Default.aspx?tabid=124
86 In 2011, four percent of the food and agricultural exports in LAC were from Peru (FAO, 2012a).
87 NES specific targets include (i) at least USD 5 billion per year in revenues from the export of goods and services; (ii) more than 16 percent contri-bution to GPD and (iii) per capita export ratio of USD 200 by 2012. The NES development and implementation was coordinated by the Uganda Export Promotion Board.

92
Food and agriculture policy decisions | Trends, emerging issues and policy alignments since the 2007/08 food security crisis
price shocks. This section analyses policy harmonization between national and regional levels with respect
to trade-related policies for staples and regional grain stock initiatives. The first sub-section complements
the analysis of trade measures carried out in chapter four and assesses harmonization and the degree of
alignment or misalignment between country level policy decisions and RECs,88 specifically export and import
measures related to wheat, maize and rice, while the second examines recent regional stock agreements89.
5.2.1 Trade-related policy harmonization
88 The selection of the seven RECs is based on data availability as well as relevance with respect to the surveyed countries. In Africa, three RECs are selected: 1) the Economic Community of West African States (ECOWAS)/West African Economic and Monetary Union (UEMOA); 2) the Southern African Development Community (SADC), and 3) East African Community (EAC). In Asia, two RECs are selected: 1) the ASEAN Free Trade Area (AFTA), and 2) the South Asian Free Trade Area (SAFTA). In LAC, three main free trade agreements were analysed: 1) the Southern Common Market (MERCOSUR); 2) the Andean Community (CAN), and 3) the Central American Common Market (MCCA).
89 This report does not intend to provide an exhaustive analysis on other important aspects on regional policy harmonization.
Key Findings
In Africa:
•Export restrictions were widely implemented by members of all selected RECs (ECOWAS/UEMOA,
SADC and EAC) particularly in 2007/08, causing misalignment with regional commitments, while
pursuing import tariff reductions or suspensions to facilitate grain import.
•Food deficit African countries have pursued different export and import policies essentially to
augment domestic food supply and reduce consumer prices.
In Asia:
•Export restrictions have been imposed by members of both RECs: only temporarily in 2007/08
in AFTA, but for a prolonged period in SAFTA. In contrast, import tariffs have been reduced
although some non-tariff barriers still exist in some SAFTA member countries.
•Trade opportunities in staple grains are high for exporting countries as there are several food-defi-
cit countries in the region where tariff and non-tariff barriers are being reduced or suspended.
In LAC:
•Protectionist export bans by MERCOSUR main grain exporting countries in the first period
(2007/08) were subsequently transformed into quotas and high export taxes, while CAN members
pursued different policies, with some favouring open trade and others opting for greater state
intervention and control over trade.
•Trade policies were more aligned in MCCA countries than in MERCOSUR or CAN. Minimal trade
restrictions have boosted trade among MCCA members during the reference period.
93
Africa
The extent to which national trade policies are aligned with regional trade agreements is examined taking
the case of three RECs in Africa, namely ECOWAS/UEMOA, SADC and EAC.
Economic Community of West African States and the West African Economic and Monetary Union
The major regional economic organizations in West Africa are the Economic Community of West African
States (ECOWAS) and the West African Economic and Monetary Union (WAEMU, also known by its French
acronym UEMOA). ECOWAS was created in 1975 to foster cooperation and economic integration and to
promote a free trade area90 under the ECOWAS Trade Liberation Scheme (ETLS), launched in 1990.91 UEMOA
was established in 1994 by eight French-speaking countries of Western Africa,92 which are also all members
of ECOWAS, to promote economic integration among countries sharing the CFA Franc as a common cur-
rency. UEMOA is both a customs93 and monetary union94.
ECOWAS and UEMOA have developed a common plan of action on trade liberalization and macroeco-
nomic policy convergence. Since 2001, ECOWAS heads of state required member countries to harmonize
their import tariffs with the existing UEMOA’s common external tariff (CET), which was adopted in 1998.
However, the UEMOA-ECOWAS joint technical committee was only launched in December 2012, and
ECOWAS countries will adopt UEMOA’s external tariff system after having gone through a transition period
(it will enter formally into force in January 2014) and applying some modifications.95
Policy alignment and misalignment: temporary export restrictions were adopted by some member coun-
tries, while relatively more harmonized policies were registered with regard to imports during the period
under consideration.
ECOWAS/UEMOA members adopted some export restrictions which conflicted with their regional agree-
ments. However, most of these restrictions were temporary (Table 14). In 2007/08, Senegal, Togo, Sierra
90 A free trade area (FTA) is an area within which members agree to impose no import or export restrictions of any kind (tariffs, quotas nor bans) on goods and services among them, and thus the circulation of goods and services is theoretically free within the bloc.
91 There are currently 15 ECOWAS members in total. However, for the purposes mentioned above, only nine are covered in this section: Burkina Faso, Ghana, Liberia, Mali, Mauritania, Nigeria, Senegal, Sierra Leone and Togo.
92 UEMOA members are: Benin, Burkina Faso, Cote d’Ivoire, Mali, Niger, Senegal and Togo. Guinea-Bissau joined the organization in 1997, becoming the eighth (and only non-Francophone) member.
93 A customs union (CU) is a further integrated form of FTA: besides the free movement of goods and services within the bloc, members set a common external tariff (CET) to be applied to goods originating from non-members.
94 A monetary union is an agreement thorough which a group of states chooses to adopt a single currency. It doesn’t necessarily imply further forms of integration.
95 UEMOA’s CET is composed of four bands ranging from 0 to 20 percent. However a fifth tariff band of 35 percent will be included to protect ‘sen-sitive products’, i.e. specific goods that contribute to the promotion of the region’s economic development.
5. Policy coherence, integration and harmonization at national and regional levels

94
Food and agriculture policy decisions | Trends, emerging issues and policy alignments since the 2007/08 food security crisis
Leone, Burkina Faso and Mali adopted short-term export bans on cereals, including rice and maize, to
ensure food supply to domestic markets. Nigeria has retained an export ban on maize since 2009.96 Informal
export restrictions have been in place in Burkina Faso and Mali on some staple food grains, which are
strategic for the countries’ food security. These restrictions are in the form of instructions passed to customs
(export red tape) (MAFAP, 2013b).
In general, there is an alignment of national import policies with regional commitments, with misalignment
recorded in only a few cases. Nigeria imposed, throughout the reference period, various import tariffs fol-
lowing the removal of import bans on staple foods in 2008.97 Just recently, in July 2012, Nigeria raised the
effective duty on wheat grain imports from 5 to 20 percent, and imposed a supplementary levy of 65 percent
on wheat flour imports, taking the effective duty to 100 percent.98 Ghana at times blocked the duty-free
importation of goods originating in ECOWAS by applying a wide range of additional taxes and fees on all
imports (MAFAP, 2012).
Southern African Development Community
The Southern African Development Community (SADC) was created in 1992 with the objective of achieving
regional integration and eradicating hunger within the 15 member states,99 eight of which are among the
countries covered in this report.100 Several protocols (binding agreements) were signed between members,
including the 1996 Protocol on Trade that aimed to achieve an FTA among members by 2000, with a phased
liberalization programme. The SADC protocol on trade was later amended in 2005, postponing the estab-
lishment of the FTA101 to 2008.102
Policy alignment and misalignment: export restrictions such as intermittent export bans were more com-
monly applied than import restrictions (e.g. (re)introduction of import tariffs) during the period 2007-2012.
Members’ export policies were misaligned with SADC FTA in many cases. In 2009/10 and 2011/12 Malawi,
Tanzania, Zambia and Zimbabwe imposed temporary export bans on basic food items (such as maize
96 It is unclear whether the prohibition was in place even previously (MAFAP, 2013a).
97 The Federal Government of Nigeria prohibited the importation of a number of agricultural commodities in 2004, as an incentive for the develop-ment of local production. In September 2008, import bans were removed on maize and wheat flour (MAFAP, 2013b).
98 The Nigerian government sees tariff and non-tariff restrictions as a central component of the policy framework aimed at stimulating investments in the transformation of the domestic agricultural sector.
99 SADC members are: Angola, Botswana, Democratic Republic of Congo, Lesotho, Madagascar, Malawi, Mauritius, Mozambique, Namibia, Sey-chelles, South Africa, Swaziland, Tanzania, Zambia and Zimbabwe.
100 The SADC members covered in this report are: Democratic Republic of Congo, Lesotho, Malawi, Mozambique, South Africa, Tanzania, Zambia and Zimbabwe.
101 Twelve SADC member states signed the protocol on trade and are therefore part of the FTA, with only Angola, the Democratic Republic of Congo and Seychelles remaining outside.
102 For more information see Southern African Development Community website at: http://www.sadc.int/about-sadc/integration-milestones/free-trade-area/
95
and other grains). In 2009/10 Malawi, Tanzania and Zambia also utilized other export restrictions, such as
export quotas and licensing systems. On the other hand, export policies of some countries, including South
Africa and Lesotho, were more in line with SADC FTA. Import policies were misaligned only in some cases
during the reference period. Some members reinforced (e.g. Malawi) or reintroduced (e.g. Zimbabwe
and Mozambique) tariffs that were initially suspended/reduced. Other members, such as Tanzania, either
reduced (maize) or waived (wheat) import tariffs, in line with SADC FTA.
East African Community
The East African Community (EAC) is a regional intergovernmental organization among five Eastern African
countries, namely Burundi, Kenya, Rwanda, Tanzania and Uganda, established in 1999.103 Overall, the
EAC aims to strengthen cooperation and attain food security among member states; a customs union (CU)
and a common market were created in 2005 and in 2010 respectively. The CU applied a common external
tariff (CET) based on a three-band tariff frame: 0, 10 and 25 percent. Yet, the free trade area in EAC is
still not fully in place and is impeded by numerous border checks and fees for cross country trade (MAFAP,
2013d).
Policy alignment and misalignment: export restrictions on strategic commodities of some member coun-
tries violated EAC agreements, whereas import tariffs were largely aligned. In the wake of the 2007/08
global food crisis, nearly all member countries implemented export restrictions. Kenya maintained an export
ban on maize between 2008 and 2012; similarly, Tanzania imposed protectionist export bans and other
restrictions (as shown above – Tanzania is a member of both SADC and EAC). Conversely, Uganda main-
tained a less restrictive approach on exports, i.e. issuing a temporary export ban on maize only once, while
Rwanda maintained a free export policy.
Import liberalization was common among member countries. Tariffs on wheat: Tanzania and Rwanda
reduced tariffs to zero in 2007 and 2010 respectively. Similarly, Uganda (2011) and Kenya (2011) gradually
reduced them to zero. In 2012, Kenya was allowed by the EAC secretariat to impose a 10 percent import
duty on wheat. Regarding tariffs on rice, member countries were granted a lower level of CET. However,
Kenya created a preferential rate for Pakistani rice imports in 2007, and then aligned its policy with the
agreed CET in 2010. For tariffs on maize, Kenya waived its CET on maize, while Tanzania, Rwanda and
Uganda continued to align their policies with EAC’s maize policy.
Overall, the response of African countries to the 2007/08 food price crisis resulted in policy misalignments,
especially relating to export restrictions, which were continued over the analysed period in some cases
(particularly for SADC and certain EAC members). In contrast, import restrictions have been less common
103 Among the EAC members, Burundi is the only country not covered in this report.
5. Policy coherence, integration and harmonization at national and regional levels
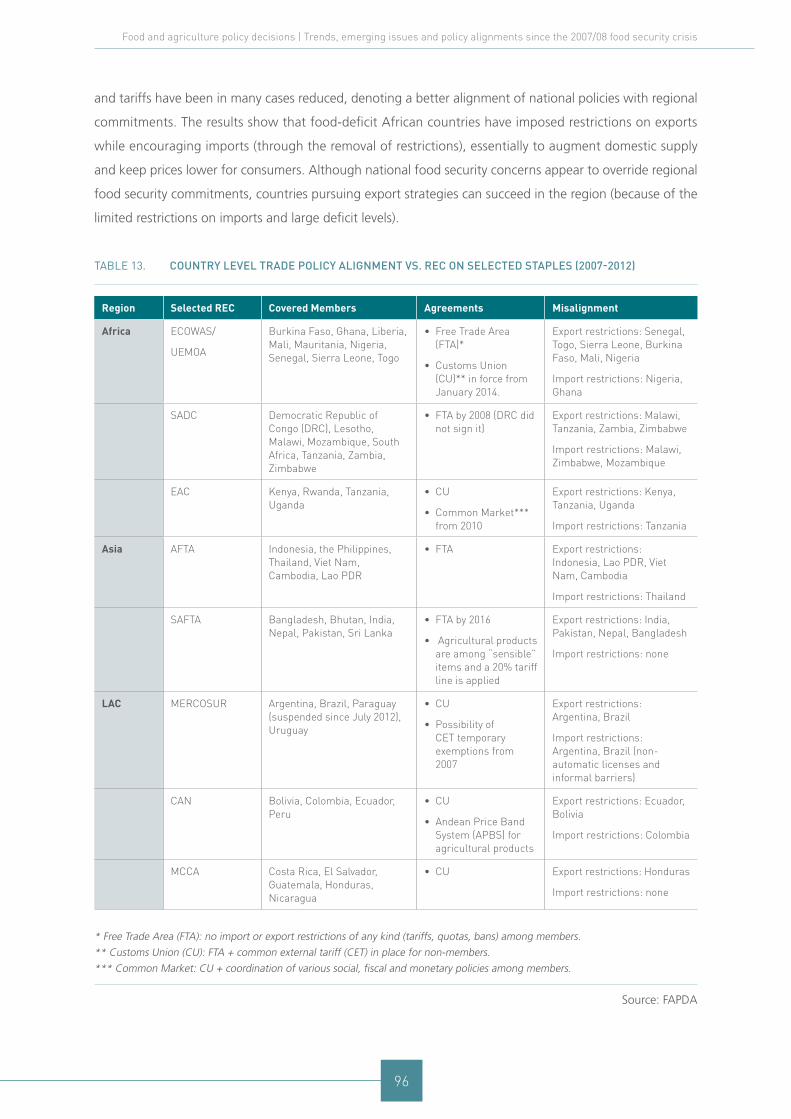
96
Food and agriculture policy decisions | Trends, emerging issues and policy alignments since the 2007/08 food security crisis
and tariffs have been in many cases reduced, denoting a better alignment of national policies with regional
commitments. The results show that food-deficit African countries have imposed restrictions on exports
while encouraging imports (through the removal of restrictions), essentially to augment domestic supply
and keep prices lower for consumers. Although national food security concerns appear to override regional
food security commitments, countries pursuing export strategies can succeed in the region (because of the
limited restrictions on imports and large deficit levels).
Table 13. country level trade Policy alignment vs. rec on selected staPles (2007-2012)
Region Selected REC Covered Members Agreements Misalignment
Africa ECOWAS/
UEMOA
Burkina Faso, Ghana, Liberia, Mali, Mauritania, Nigeria, Senegal, Sierra Leone, Togo
• Free Trade Area (FTA)*
• Customs Union (CU)** in force from January 2014.
Export restrictions: Senegal, Togo, Sierra Leone, Burkina Faso, Mali, Nigeria
Import restrictions: Nigeria, Ghana
SADC Democratic Republic of Congo (DRC), Lesotho, Malawi, Mozambique, South Africa, Tanzania, Zambia, Zimbabwe
• FTA by 2008 (DRC did not sign it)
Export restrictions: Malawi, Tanzania, Zambia, Zimbabwe
Import restrictions: Malawi, Zimbabwe, Mozambique
EAC Kenya, Rwanda, Tanzania, Uganda
• CU
• Common Market*** from 2010
Export restrictions: Kenya, Tanzania, Uganda
Import restrictions: Tanzania
Asia AFTA Indonesia, the Philippines, Thailand, Viet Nam, Cambodia, Lao PDR
• FTA Export restrictions: Indonesia, Lao PDR, Viet Nam, Cambodia
Import restrictions: Thailand
SAFTA Bangladesh, Bhutan, India, Nepal, Pakistan, Sri Lanka
• FTA by 2016
• Agricultural products are among “sensible” items and a 20% tariff line is applied
Export restrictions: India, Pakistan, Nepal, Bangladesh
Import restrictions: none
LAC MERCOSUR Argentina, Brazil, Paraguay (suspended since July 2012), Uruguay
• CU
• Possibility of CET temporary exemptions from 2007
Export restrictions: Argentina, Brazil
Import restrictions: Argentina, Brazil (non-automatic licenses and informal barriers)
CAN Bolivia, Colombia, Ecuador, Peru
• CU
• Andean Price Band System (APBS) for agricultural products
Export restrictions: Ecuador, Bolivia
Import restrictions: Colombia
MCCA Costa Rica, El Salvador, Guatemala, Honduras, Nicaragua
• CU Export restrictions: Honduras
Import restrictions: none
* Free Trade Area (FTA): no import or export restrictions of any kind (tariffs, quotas, bans) among members.
** Customs Union (CU): FTA + common external tariff (CET) in place for non-members.
*** Common Market: CU + coordination of various social, fiscal and monetary policies among members.
Source: FAPDA

97
Asia
The cases of two RECs in Asia, AFTA and SAFTA, have been studied to assess the degree to which national
trade policies are aligned with regional trade agreements.
Association of Southeast Asian Nations (ASEAN) Free Trade Area
The Association of Southeast Asian Nations (ASEAN) established the ASEAN Free Trade Area (AFTA) in
1992104 in order to promote the free movement of goods and services within the bloc. For goods originat-
ing within ASEAN, members are expected to apply an import tariff rate of zero to five percent, called the
Common Effective Preferential Tariff (CEPT), with no quantitative restrictions (non-tariff barriers). AFTA does
not apply a common external tariff and each member may impose tariffs on goods from outside the bloc
based on its national schedules. Options for excluding products from the CEPT are envisaged for ASEAN
members and include, among others, sensitive agricultural products such as rice.
Policy alignment and misalignment: the response to the 2007/08 food crisis at the national level tempo-
rarily affected sub-regional trade of some staple commodities, given the introduction of temporary export
restrictions by major rice exporters of the region. Some short-term misalignments were recorded, especially
in the rice sector, considered to be the primary agricultural commodity with high levels of political sensi-
tivity. A few countries imposed temporary export restrictions in 2008; Indonesia, Lao PDR, Viet Nam
and Cambodia temporarily banned rice exports (the last two countries being large rice exporters).105 The
restrictions were removed in the subsequent years. On the other hand, tariff reductions on most agricultural
products have signaled a certain degree of policy harmonization between national and REC commitments.
Only one incidence of an import restriction, an import ban on maize, was recorded for Thailand in 2008.
South Asian Association for Regional Cooperation Free Trade Agreement
In the framework of the South Asian Association for Regional Cooperation (SAARC), the South Asian Free
Trade Agreement (SAFTA) was implemented in 2006 among Bangladesh, Bhutan, India, Nepal, Pakistan
and Sri Lanka.106 Under the Agreement, the South Asian region will move to a free trade area with the
implementation of the tariff liberalization programme by 2016. The agreement differentiates least developed
104 The Association of Southeast Asian Nations was established in 1967. Its members are Indonesia, Malaysia, the Philippines, Singapore, Thailand, Brunei, Viet Nam, Cambodia, Lao PDR and Myanmar. This section does not cover Malaysia, Singapore, Brunei or Myanmar, as they are not among the countries surveyed in this report.
105 Two other ASEAN members, Malaysia and Myanmar (not included among the countries analysed in this report), temporarily banned rice exports in 2008 as well.
106 SAFTA superseded the SAARC Preferential Trade Agreement (SAPTA) that was introduced in 1995 as a first step to begin closer relations among the eight SAARC countries. All members are covered in the section except for the Maldives.
5. Policy coherence, integration and harmonization at national and regional levels
98
Food and agriculture policy decisions | Trends, emerging issues and policy alignments since the 2007/08 food security crisis
countries (LDCs)107 from non-LDC member states,108 envisaging special and differential treatments for the
first group, which would include lower tariff reductions and longer periods of implementation.109 One of the
most critical provisions in the agreement refers to the ‘sensitive’ sectors, which include agricultural products,
to which a 20 percent tariff line is applied without mandatory reduction of the country list.110
Policy alignment and misalignment: some important producer countries extensively used export restric-
tions during the recent food price escalation. In 2007/08, India responded to the high international food
prices by banning exports of rice, wheat and maize. Exports were only fully resumed after a bumper harvest
in 2011. Pakistan imposed an export tax and subsequently a ban on wheat in 2007; the ban was lifted in
2010 and replaced by export quotas. In 2008, Nepal banned exports of all food grains and Bangladesh
did the same for rice exports, with the exception of the wheat ban in Nepal (lifted in 2010), prohibitions
remain in place in both countries today, with only few export quotas allowed.
In contrast to the export bans, no member country applied any import bans. In general, an alignment is
noted on import tariffs, with the exception of Pakistan, which reintroduced import tariffs on rice in 2011.
However, a misalignment is visible in relation to several specific policies on agriculture products, which are
included in the sensitive products group (negative-list). Policies to restrict the list are ‘voluntary’ (only India
made relevant attempts to reduce the list in recent years) and non-tariff barriers (technical, sanitary and
phyto-sanitary barriers and licensing systems) in many SAARC countries are still considerable. In addition, a
proliferation of competing bilateral trade agreements in the region has encouraged some countries to grant
concessions and preferences to specific trade partners in the framework of those agreements, rather than
complying with provisions mandated by SAFTA111 (FAORAP, 2012).
In general, some major producer/exporter countries in both RECs introduced temporary export restrictions,
particularly for rice, which is the primary staple in Asia. The restrictions were more short-lived in AFTA than
in SAFTA. Explicit and implicit import restrictions were also relatively more widespread in SAFTA than in AFTA.
Nevertheless, trade opportunities in staple grains are high for exporting countries as there are several food
deficit countries in the region as tariff and non-tariff barriers are being reduced or suspended.
107 LCDs: Bangladesh, Bhutan, the Maldives and Nepal.
108 Non-LCDs: India, Pakistan and Sri Lanka.
109 During phase one (achieved in 2006), non-LDC member states were to reduce their tariffs to 20 percent, and LDC members to 30 percent. In the second phase, non-LDCs were to reduce their tariffs below five percent on imports from LDCs by 2009, and to complete the full implementation of zero tariffs by 2012 (2013 for Sri Lanka). LDCs are to reciprocate by January 2016.
110 According to the country sensitive products list, more than 50 percent of the total imports trade among South Asia countries is excluded from the tariff liberalization plan proposed under the SAFTA Treaty (with Bangladesh and Nepal the most protectionist countries and Pakistan the least trade restricting).
111 Bilateral trade agreements within SAARC countries include: the India-Bhutan Agreement on Trade and Commerce, the India-Nepal Treaty of Trade, the India-Afghanistan Preferential Trade Agreement, the India-Sri Lanka FTA and the Pakistan-Sri Lanka FTA.
99
Latin America and the Caribbean
Among the RECs within LAC, MERCOSUR, CAN and MCCA were selected to examine the extent to which
national trade policies are aligned with regional trade agreements.
Southern Common Market
The Southern Common Market (MERCOSUR) is the most important trade bloc in South America (in terms of
aggregate GDP), comprising two major regional112 and global food producers.113 MERCOSUR was created in
1991 by Argentina, Brazil, Paraguay (suspended since July 2012) and Uruguay, as an FTA, becoming a
customs union with a CET in 1994. Venezuela joined the bloc in 2012 and Bolivia is on its way to joining
the block.114 In 2007, MERCOSUR members decided to allow temporary exemptions to the CET on some
sensitive items, including agricultural goods.115
Policy alignment and misalignment: during the period of analysis, country level export and import pol-
icies have often contrasted with the FTA of MERCOSUR. Argentina and Brazil, the biggest members of
the bloc, have mostly adopted protectionist measures and controls on agricultural products.116 Argentina
imposed an export ban on wheat and maize in 2007/08; the bans were then transformed into quotas (open-
ing the Registry of Grains in June 2008 for wheat and in February 2009 for maize, and export licenses were
accorded on an ad-hoc basis).117 Brazil adopted a temporary rice export ban in 2008 to safeguard domestic
supplies. Argentina sharply increased export taxes for maize and wheat from November 2007 to March
2008, but gradually reduced them in the subsequent period.
Non-automatic licenses and informal barriers on imports have been recorded. In 2009, Brazil adopted
non-automatic licenses for some important Argentinean products like wheat flour, wine, oil, processed foods
and other agricultural items, in response to a similar measure adopted by Argentina in 2008. Alternatively,
the two minor partners of the bloc, Paraguay and Uruguay, had an aligned policy regarding trade (export
and import) of the three considered staples.
112 Namely Argentina and Brazil, the biggest producers in the region of maize, soybeans and wheat. Agriculture accounts for 32 percent of total exports in Brazil and for 37 percent of total exports in Argentina in 2011. Both countries are net exporters of agricultural products with large surpluses.
113 After the EU, ASEAN and NAFTA (OECD, 2009).
114 All MERCOSUR members are included in this research, except for Venezuela, for which official data on trade are difficult to access.
115 Consejo del Mercado Común Decision no. 59/07 at http://www.mercosur.int/t_generic.jsp?contentid=3964&site=1&channel=secretaria
116 Whereas, the two minor partners of the bloc, Paraguay and Uruguay, have pursued a more open trade policy, in line with the agreements, also due to their large dependence on imports from the bigger members (Argentina and Brazil).
117 Argentina’s trade policy has focused mainly on guaranteeing its domestic supply at low prices, setting this issue above any other, including above MERCOSUR’s principles.
5. Policy coherence, integration and harmonization at national and regional levels
100
Food and agriculture policy decisions | Trends, emerging issues and policy alignments since the 2007/08 food security crisis
The conflicting policies have generated tensions among the partners, requiring diplomatic negotiations
to resolve them. Governments attempt to settle their disputes through their national diplomacy and bilat-
eral agreements, rather than through MERCOSUR bodies, undermining the bloc’s supranational capacities
(Klonsky et al., 2012).
Andean Community
The Andean Community (CAN) is a customs union comprising South American countries Bolivia, Colombia,
Ecuador and Peru, and was established with the Cartagena Agreement in 1969.118 The Andean customs
union has four basic tariff levels: 5, 10, 15, and 20 percent determined according to the products’ degree of
processing, with raw materials subject to lower tariffs. There are some exceptions to this common external
tariff: since 1994 a price band system (the Andean Price Band System) has been adopted for agricultural
products, to protect Andean agricultural products from price variations in the international market and
agricultural tariffs are normally higher compared to non-agricultural products.
Policy alignment and misalignment: governments of the bloc responded very differently to the 2007/08
crisis, with some countries adopting trade restricting measures during and after the crisis. Export restrictions
were adopted particularly in the first period (2007/08) by two countries. Ecuador temporarily banned rice
exports from September 2007 to March 2009, whereas Bolivia extensively banned maize exports from
August 2007 to October 2008, imposing again a temporary export ban on maize in 2010. After the removal
of the bans, exports of these goods were restricted through imposition of quotas by both countries.
Import bans were rarely recorded, while import tariffs were reduced by all members. Only Colombia adopted
a temporary import ban on rice in 2010. Import tariffs were reduced by all CAN countries, allowing duty-free
import of: almost all staple food items by Bolivia in 2008, wheat and wheat flour by Ecuador from 2009
to 2011, rice by Colombia in 2007, and lifting tariffs on staples in 2007 (wheat) and 2011 (maize and rice)
by Peru.
CAN members generally pursued different policies, with Peru and Colombia trying to maintain an adequate
food supply through open trade,119 whereas Bolivia and Ecuador responded with greater state interven-
tion and control over trade. CAN countries also shifted their attention from trade matters to social issues120
following the 2007/08 food crisis.121
118 Chile and Venezuela were former members of CAN: Chile withdrew in 1976 and Venezuela in 2006. All of the current CAN members are included in this research.
119 Peru and Colombia, together with Chile and Mexico, signed the Alianza del Pacífico (Pacific Alliance) in 2012, aimed at economic integration and free trade within the area.
120 For example, in 2010 the bloc enacted the Decisión 742, creating the Programa Andino para Garantizar la Seguridad y Soberanía Alimentaria y Nutricional (‘Andean Programme to Ensure the Food and Nutritional Security’).
121 See the Andean Community website at: http://www.comunidadandina.org/Quienes.aspx
101
Central American Common Market
The Central American Common Market (MCCA) was created in 1960 by Guatemala, El Salvador, Honduras,
Nicaragua and Costa Rica,122 and is now integrated into SICA (Central America Integration System).123 The
MCCA includes an FTA for 96 percent of the products marketed, and a CET for goods and services.
Policy alignment and misalignment: trade policies have generally been aligned within the bloc, with
only one export ban recorded and some deviations from the CET. Export restrictions were minimal. The
only registered case was the export prohibition for maize in Honduras in 2007/08. Import bans were not
imposed by any member country, whereas zero tariffs or temporary lifting of tariffs for some key products
were commonly used by all member countries during the study period. Costa Rica lifted tariffs on maize
(2010 and 2012) and on rice (2011); El Salvador lifted tariffs on maize (2010) and on wheat flour (2008
and 2012); Guatemala lifted tariffs on maize (2008, 2009 and 2011), wheat flour (2008, 2009 and 2011)
and rice (2008); Honduras on wheat flour (2008 and 2009), maize (2011) and rice (2011); and Nicaragua
on wheat flour (2008) and white maize (2011).
Trade volumes among Central American countries are high: in 2010, 49 percent of agricultural imports
in El Salvador and Nicaragua came from MCCA members; the corresponding figures were 40 percent for
Honduras, 24 percent for Guatemala and 15 percent for Costa Rica (FAO, 2011b). Trade restrictions and
limitations have been minimal, even after the crisis.
Overall, harmonization of trade policies shows mixed results among RECs in LAC: protectionist export poli-
cies and import bans were pursued by the major food exporting members of MERCOSUR and by some CAN
members, compared to more open and aligned trade policies among MCCA countries. Conflicting policies
have resulted in trade disputes and undermined regional trade in MERCOSUR and led to increased state
control over trade in CAN. By contrast, minimal trade restrictions have led to an expansion of trade among
MCCA countries during the reference period.
122 All MCCA members are covered in this research.
123 The Central American Integration System (SICA) is a political agreement between Belize, Costa Rica, El Salvador, Guatemala, Honduras, Nicaragua and Panama, created in 1991. Not all SICA members are part of the common market; but all country members are covered in this research.
5. Policy coherence, integration and harmonization at national and regional levels

102
Food and agriculture policy decisions | Trends, emerging issues and policy alignments since the 2007/08 food security crisis
5.2.2 Policy convergence124 on regional grain stocks125
Since the extraordinary food price surge of 2007/08, policy debates have intensified126 on maintaining stra-
tegic reserves at national, regional and global levels. A coordinated response at supra-national (regional or
international) level has gained new attention among the international community, with the argument that
such measures could better address emergency situations, especially in cases of large-scale or catastrophic
crises that overcome national borders. While stocks at the global level are more difficult to manage, since
124 Policy convergence: “Any increase in the similarity between one or more characteristics of a certain policy (e.g. policy objectives, policy instru-ments, policy settings) across a given set of political jurisdictions (supranational institutions, states, regions, local authorities) over a given period of time. Policy convergence thus describes the end result of a process of policy change over time towards some common point, regardless of the causal processes.” (Holzinger et al, 2008).
125 Three regional stock agreements are considered in this section: the ECOWAS Regional Food Stock in Africa, and the ASEAN Plus Three Emergency Rice Reserve and South Asian Association for Regional Cooperation Food Bank in Asia. The LAC does not have a stock initiative at regional level.
126 Refer to section 4.2.1 for stocks at national level.
Key Findings
•The extraordinary food price surge of 2007/08 revamped policy debates on strategic stocks at
global and regional level; a few RECs in Asia and Africa have shown greater interest in regional
stocks.
• In Africa, ECOWAS is taking the lead (2011/12) in coordinating the establishment of a West
African regional reserve but it is not clear how national commitments for regional reserves are
ensured, given that some member countries are making policy decisions and stepping up their
investment to establish or expand national stocks.
• In Asia:
- The ASEAN Plus Three Emergency Rice Reserve (APTERR) intends to meet the emergency rice
requirements of East Asia but concerns over implementation procedures, financial sustainability
and implications for free trade remain serious.
- The SAARC Food Bank (SFB) acts as a regional food security reserve for SAARC member
countries; despite the convergence in needs and policies adopted at the country level the SFB
could not help any member country in the 2007 to 2012 period.
• In LAC, no REC has shown interest in regional stocks. Resorting to bilateral and regional trade
agreements rather than to regional reserve may be perceived as a better solution to acquire food
in times of food production shortages in the region.
103
they respond to the needs of very different groups of countries,127 a more viable option appears to be repre-
sented by regional food stocks, which have to deal with fewer countries with more similarities, often already
linked by a cooperation agreement.
Setting up regional food stock has three positive aspects compared to national reserves: (i) economies of
scale can save costs, (ii) independent management could prevent governments from using reserves for
political gains, and (iii) the provision of forums for collective agreements could help avoid trade restrictions
during major food crises (World Bank, 2012f).
However, a number of policy harmonization and technical issues have constrained the establishment of
regional stocks. Among the major issues that need to be addressed are: (i) procedures and guidelines for
storage and release of stocks (requiring efficient organization, agreement and coordination among mem-
bers, relating to: terms of definition of volumes to be provided by each country; timing and location of
storage; and modalities of stock release during crises); (ii) costs of creating and maintaining a regional stock
(which are sometimes on top of already existing national reserve costs and entail mobilizing continuous
funding support by all member countries); and (iii) implications of stocks to free trade (it is argued that grain
reserves aimed at price stabilization cause trade distortions in markets and domestic prices). In the past, a
lack of strong and shared political support has hindered the establishment of stocks at the regional level.
In recent years, however, some RECs from Asia and Africa have shown keen interest in regional stocks. In
contrast, there has been no regional stock initiative in LAC. The main issues that regional stock agreements
in Africa and Asia currently face are discussed below.
Africa: the example of the ECOWAS Regional Food Stock Strategy
In 2009, ECOWAS members launched the Regional Agricultural Investment Plan 2011-2015 (RAIP). As part
of the RAIP, ECOWAS members approved a Regional Food Stock Strategy, mainly for two purposes: to regu-
late the market of major food crops and to serve as an emergency reserve and promote food safety nets in
the region. Following the different attempts by close allies of ECOWAS to establish a regional grain reserve,
ECOWAS formed a task force to manage the process and bring together the different initiatives. Building on
concrete proposals of a feasibility study on regional food stock capacities that was completed in September
2012 (ECOWAS, 2012), the ECOWAS Task Force officially endorsed the creation of the reserve and laid out
the next steps towards making it operational by mid-2013. Member states agreed that ECOWAS would lead
the coordination of the reserve in close collaboration with UEMOA and CILSS, the Permanent Inter-State
Committee for Drought Control in the Sahel.128 Technical management of the reserve would be handled by
a specialized ECOWAS agency, the Regional Agency for Agriculture and Food, in close collaboration with
127 Only one international stock was attempted but failed: the International Emergency Food Reserve initiated in 1975 under WFP with the aim of addressing an efficient response to international food crises. Donors did not fully contribute to it and it actually relies on minimal reserves.
128 CILSS includes: Benin, Burkina Faso, Cape Verde, Ivory Coast, the Gambia, Guinea, Guinea-Bissau, Mali, Mauritania, Niger, Senegal and Togo.
5. Policy coherence, integration and harmonization at national and regional levels
104
Food and agriculture policy decisions | Trends, emerging issues and policy alignments since the 2007/08 food security crisis
RESOGEST (Stocks Offices Management Network).129 The task force agreed to start operations with an initial
capacity of 180,000 tonnes of stocks; one third of this reserve will be stored in physical reserves, and the
remainder in financial reserves. By its eighth year, the reserve is envisioned to grow to a capacity of 410,000
tonnes of physical and financial reserves. The release of stocks is to be determined based on the Enhanced
Harmonised Framework, the consensus tool for the analysis of food insecurity in the sub-region (ECOWAS,
2012).
At national level, as discussed earlier (chapter four), many West African governments have taken measures
to strengthen their national food reserves (following the food crisis of 2007/08) while striving to build a
regional stock through ECOWAS. It is not clear how the management of the regional stock is coordinated
with national stocks and how national commitment to the regional stocks initiative is guaranteed when
member countries are stepping up their investment to establish or expand national grain reserves at the
same time. Countries with different levels of national stocks and with considerable difference in exposure
to natural disasters (e.g. Sahelian countries have drier weather than others) may not show the same level of
commitment to regional grain reserves.
Asia
(i) The East Asia Emergency Rice Reserve and the ASEAN Plus Three
Emergency Rice Reserves
The practice of a regional rice emergency reserve has a long history in East Asia. As early as 1979, ASEAN
countries established the ASEAN Emergency Rice Reserve (AERR) to build up physical rice reserves, based
on voluntary contributions from member states, that could be used if a member was unable to meet its
people’s needs through its own production or through rice purchases in international markets. However, the
system was never made operational,130 and the idea was revamped in 2003, under the framework of the
ASEAN+3 agreements. The new East Asia Emergency Rice Reserve (EAERR) is a pilot project established with
the purpose of: (i) coping with food emergencies; and (ii) ensuring long-term food security and improving
livelihoods of farmers in ASEAN member countries. Although the EAERR’s secretariat was established to
operate independently and facilitate rice trade between countries facing an emergency food requirement
and countries holding reserves, no country resorted to the EAERR over the past decade. In reaction to soar-
ing and volatile prices in late 2011, the ASEAN+3 countries agreed on an improved model, the ASEAN Plus
Three Emergency Rice Reserve (APTERR), which came into force in July 2012 (see Box 8 for details on the
129 RESOGEST (Réseau des Structures Publiques en charge de la Gestion des Stocks nationaux de sécurité alimentaire au Sahel et en Afrique de l’Ouest) includes the 15 ECOWAS member countries as well as Mauritania.
130 AERR was unable to respond to any crisis that occurred in a member country and never made releases from its stocks. The main deficiencies were due to: excessively small reserves made available by members; a complicated procedure of implementation (which merely duplicated govern-ment-to-government transactions); lack of funds within the secretariat.
105
operational mechanism). The reserves consist mostly of 787,000 tonnes of rice stocks that have been desig-
nated (physically) or earmarked by ASEAN+3 countries to meet emergency food requirements in the region
plus rice stocks that have been voluntarily donated to the reserve (unspecified quantities from Japan, China
and Thailand) to be used as a humanitarian response to acute emergencies.131 In the period of reference, at
the national level, all member countries tended to increase their national reserves (as discussed in chapter
four) to cope with price shocks: the ASEAN+3 countries generally pursued this type of policy. Therefore, it
appears that the cooperation framework of this emerging regional rice reserve initiative is still too weak to
enforce. As a matter of fact, despite the relatively increased commitment of countries to contribute to the
reserve, the earmarked quantity is insufficient to contain a potential domestic crisis in larger countries (e.g.
Indonesia or the Philippines).
There are still some serious concerns and weaknesses to be addressed, which have been derived from the
two previous attempts to create a rice emergency reserve on a regional basis:
• Implementation challenges: similar past initiatives had limited success due to coordination difficulties, and
unclear stockpiling programmes and sharing of costs between countries. Administrative and technical
issues (on terms, prices and conditions) remain a challenge to APTERR as well.
• Financial sustainability concerns: under the mechanism of voluntary contributions, the Plus Three coun-
tries132 are currently by far the largest contributors.
• ‘Trade non-interference’ challenges: despite being a trade facilitating mechanism (see Box 8), the system is
not designed or empowered to replace rice trade among member countries. In addition, it has to comply
with WTO agreements which prohibit trade distortions and has to be used only in emergency situations.
In this context, in a region that comprises the biggest rice producers and importers in the world, as well
as the biggest rice deficit and exporting countries, resorting to bilateral and regional trade agreements
rather than to the regional reserve could still be perceived as a better solution to acquire food in times of
food production shortages (Trethewie, 2013).
131 To put this in perspective, Southeast Asia and East Asia combined consumed 542,000 tonnes of rice per day. Earmarked pledges form the major part of the APTERR: China has pledged to earmark 300,000 tonnes, South Korea 250,000 and Japan 150,000, with ASEAN member countries pledging a collective total of 87,000 tonnes initially. As of February 2013, two releases of APTERR stockpiled rice have taken place since the soft implementation of the APTERR in 2010: Thailand donated 520 metric tonnes of rice to the Philippines for those affected by typhoons and La Niña; and Japan donated 347 tonnes to Lao PDR for the victims of Typhoon Ketsana.
132 The Plus Three countries are Japan, China and South Korea.
5. Policy coherence, integration and harmonization at national and regional levels
106
Food and agriculture policy decisions | Trends, emerging issues and policy alignments since the 2007/08 food security crisis
box 8. aPterr oPerational mechanism
(ii) South Asian Association for Regional Cooperation Food Bank
The South Asian Association for Regional Cooperation Food Bank (SFB) was created in April 2007 with
two objectives: (a) to act as a regional food security reserve for SAARC members during normal times,
food shortages and emergencies; (b) to provide regional support to national food security efforts, to foster
inter-country partnerships and regional integration, and tackle regional food shortages through collective
action.133
The SFB started functioning with stocks of 241,580 tonnes of rice and wheat and the stocks later doubled
to 482,000 tonnes (the contribution of each country has doubled accordingly).134 Countries are entitled to
withdraw the needed grains in the event of natural or man-made emergencies during periods of food short-
ages. Food grains are released in emergency circumstances only after negotiations between the concerned
member countries regarding the price of grains (requesting and releasing) have taken place. Negotiations
are based on existing guidelines, and prices offered to members will be at a discount rate, compared to food
grain prices offered to non-members.
133 A first attempt to set up a SAARC Food Security Reserve was made in 1988 but it essentially failed to accomplish its end purpose because it was never actually put in place beyond the signing of an agreement.
134 India was to contribute 153,200 metric tonnes, Bangladesh and Pakistan 40,000 tonnes each, Nepal and Sri Lanka 4,000 tonnes each and Af-ghanistan, Maldives and Bhutan 1,420 tones, 200 tonnes and 180 tonnes respectively.
The APTERR three-tier system to meet emergency demand for rice envisages:
Tier One: Release of earmarked APTERR reserves through specialized commercial contracts between
supplying and receiving countries. The supplying country agrees to supply a specific quantity of rice
of a specific grade, out of its earmarked stock, to the recipient country in the event of an emergency.
Tier Two: Release of earmarked APTERR reserves under long-term loan agreements or grants between
supplying and receiving countries. It is similar to Tier One but there is no prearranged delivery scheme,
and it is voluntary.
Tier Three: This tier provides for the release of physical APTERR reserves to meet acute and emergency
needs for food aid. Stocks will be released when a recipient country makes a request or via an automatic
trigger system managed by the APTERR Secretariat. Recipient countries will be responsible for the
distribution of the rice.
Member countries will be responsible for maintaining the reserves; in many cases, the stock comes
from existing national rice reserves. They will also be responsible for funding costs of procurement
and storage management.
107
Similar to Southeast Asia, SAARC member countries promptly increased national stockpiles in 2007/08; also
through public-private storage facilities schemes, as in the case of India and Sri Lanka. Despite the conver-
gence in needs and policies adopted at the country level, between 2007 and 2012, the SFB could not help
any member country to tide over any supply shock.
As underlined in the case of APTERR, it is challenging to ensure commitment from very different countries
(with different economic statuses, poverty levels, production patterns and food deficit levels) to voluntarily
contribute to a regional food reserve. SFB operations are also faced with the challenge of actually storing
food and delivering it when needed: some studies noted that grain storage facilities in South Asian coun-
tries are currently inadequate to store the required buffer stock of grains. Without storage facilities in place,
the food bank de-facto does not exist, regardless of any signed policy frameworks. Moreover, procedures
regarding timely and effective distribution of grains and price negotiations are still unclear (Robinson, 2011).
Lastly, design and implementation of the mechanism seem to be vulnerable to bureaucratic and political
issues: lack of political will to quickly ratify decisions in times of emergency (when the bank should intervene)
is still a big constraint (SAARC Summit, 2011).
Conclusion
Policy coherence or a systematic promotion of mutually reinforcing actions and coordination is
required to achieve food security-related goals at national or regional levels. At national level, goals
such as food self-sufficiency and food export promotion have required an integrated and coordinated
approach. Since 2007/08, a few countries in Asia, Africa and LAC have shifted from a policy of food
self-reliance (this includes food imports to achieve national food demands) to food self-sufficiency.
A comprehensive programme, which entailed a package of subsidized technological inputs and
services, price support, import tariffs to protect domestic producers, and increased public spending
in agriculture, was thus launched during the reference period. The strategy of national food self-
sufficiency, however, would mean less dependence on trade with negative implications for regional
food security and intra-regional food trade.
High international prices, on the other hand, have motivated some countries to adopt integrated
policy packages to stimulate the export of selected food commodities. A few countries (from all three
regions) with comparative advantages have recently launched export promotion policies that included
measures for facilitating trade (by easing export procedures) along with integrated programmes to
boost production and enhance private sector participation. The export strategy is consistent with
trade and food security policies of many RECs since most countries are food-deficit and would benefit
from having adequate and reliable sources of food within the REC. It can also encourage member
countries to pursue a more open trade policy rather than a food self-sufficiency strategy.
5. Policy coherence, integration and harmonization at national and regional levels
108
Food and agriculture policy decisions | Trends, emerging issues and policy alignments since the 2007/08 food security crisis
At the regional level, attempts have been made to harmonize trade and stock policies to achieve
regional food security. However, export restrictions were widely practiced by members of most of
the selected RECs, particularly in 2007/08, causing misalignment with regional commitments, while
pursuing a policy of import tariff reductions or suspensions. Food deficit countries have restricted
export and facilitated import with the objective of increasing domestic food supply and keeping
prices lower for consumers. Most RECs appear to run into difficulties in attaining collective food
security because of divergent interests among member countries. At least in one particular case
(the Central American Common Market - MCCA), however, trade policies seem to have been better
aligned with minimal trade restrictions and thus boosted trade among REC members and enhanced
regional food security.
The food price surge of 2007/08 has revamped policy debates on strategic stocks at global and
regional level and a few RECs in Asia and Africa have shown greater interest in harmonizing their
policies to establish regional stocks during the study period. ECOWAS from Africa as well as the
ASEAN Plus Three Emergency Rice Reserve and the SAARC Food Bank from Asia are working to set
up such mechanisms to constitute regional food reserves. However, establishing procedures and
guidelines for storage and release of stocks as well as allocating costs of regional stocks among
member countries have emerged as a major policy-harmonization challenge. The costs of regional
stock come on top of already existing national reserve costs for many countries. It is thus unclear how
such countries remain committed to regional reserves while simultaneously enacting policy decisions
and stepping up investment to establish or expand their own national stocks. It is also not evident
whether regional stocks could be a useful and effective solution for tackling future food emergencies,
or whether stocks at the national level or open trade policies could represent the best and most
viable option for countries to deal with unexpected food shortages. Alternatively, RECs and national
governments could agree on a combination of regional and national stocks benefiting from the
merits of maintaining national as well as regional stocks.
109
Bibliography
Agriculture Corner. 2012. Seminar on physical trading of agriculture commodities on PMEX. (Available
at http://www.agricorner.com/seminar-on-physical-trading-of-agriculture-commodities-on-pmex/#sthash.
hc5FUeKl.dpuf)
Alderman, H. 2002. Subsidies as a safety net: effectiveness and challenges, social pro-
tection. World Bank. Washington. (Also available at http://citeseerx.ist.psu.edu/viewdoc/
download?doi=10.1.1.201.6358&rep=rep1&type=pdf)
Anand, S., Desmond, C., & Fuje H., Marques N. 2012. The Cost of Inaction : Case Studies from Rwanda and
Angola. Francois-Xavier Bagnoud Center for Health and Human Rights. Harvard University. USA
Arias D., Lamas A. F., & Kpaka M. 2011. Agricultural Commodity Exchanges in Latin America and the
Caribbean, Latin America and the Caribbean Region. LCSSD Food Papers Series, March 17, 2011.
Arze del Granado, J., Coady, D., & Gillingham, R. 2010. The Unequal Benefits of Fuel Subsidies: A Review
of Evidence for Developing Countries. International Monetary Fund (IMF). (Also available at http://www.imf.
org/external/pubs/ft/wp/2010/wp10202.pdf)
APEC (Asia-Pacific Economic Cooperation). 2012. Reforming fossil‐fuel subsidies to reduce waste and limit
CO2 emissions while protecting the poor. (Available at http://www.iisd.org/gsi/sites/default/files/ffs_apec.
pdf)
Barrett, C. B. 2006. Food aid’s intended and unintended consequences. FAO, ESA Working Paper No. 06-05.
Rome.
Bosch, M., Rodrigues, M., Hopkins, R., Mamani, V., Chavarría H., Espinel B., & Brossard F., 2012. Agriculture
and ICT. Economic Commission for Latin America and the Caribbean (ECLAC), Newsletter eLAC 2015 n18,
March 2012.
Brock, L., Omoluabi, O. & Van Duse, N. 2010. Ghana – Gap Analysis - ECOWAS Free Trade Area. West Africa
Trade Hub Technical Report #36. (Available at http://www.watradehub.com/sites/default/files/Ghana%20

110
Food and agriculture policy decisions | Trends, emerging issues and policy alignments since the 2007/08 food security crisis
ECOWAS%20Free%20Trade%20Area%20Gap%20Analysis.pdf).
Bundy, D., Burbano, C., Grosh, M., Gelli, A., Jukes, M., & Drake, L. 2009. Rethinking school feeding: social
safety nets, child development, and the education sector. World Bank and WFP. Washington.
CEBRI (Centro Brasileiro de Relaçoes Internacionais). 2012. Explaining the BNDES: What is it, what does and
how it works. Vol. 3 Ano. VII CEBRI Artigos. CEBRI. Rio De Janeiro, Brazil. (Available at http://www.cebri.org/
midia/documentos/bndes.pdf accessed on September 9,2013).
CEPAL. 2011. Statistical bulletin: International merchandise trade in Latin America and the Caribbean. Second
Quarter 2011. (Available at http://www.eclac.org/cgi-bin/getProd.asp?xml=/publicaciones/xml/6/43896/
P43896.xml&xsl=/publicaciones/ficha.xsl&base=/publicaciones/top_publicaciones.xsl.
Clay E., Jones, S., Rahman, A., & Shahbbuddin, Q. 1989. Introduction in food strategies in Bangladesh:
medium and long term perspectives. University Press Limited, Dhaka.
COMESA and EAC. 2003. Regional Maize Trade Policy Paper. RATES, Nairobi. (Available at http://www.ifpri.
org/sites/default/files/p6regional_maize.pdf).
Cotula, L., Vermeulen, S., Leonard, R., & Keeley, J., 2009. Land grab or development opportunity? Agricultural
investment and international land deals in Africa. IIED/FAO/IFAD, London/Rome.
Commission of the African Union, UNISDR and the World Bank. 2008. Status of disaster risk reduction in the
Sub-Saharan Africa region. (Available http://www.unisdr.org/files/2229_DRRinSubSaharanAfricaRegion.pdf).
Demeke, M., Pangrazio, G., & Maetz, M. 2009. Country Responses to the Food Security Crisis: Nature and
Preliminary Implications on the Policies Pursued, FAO, Rome. (Available at http://www.fao.org/fileadmin/
user_upload/ISFP/pdf_for_site_Country_Response_to_the_Food_Security.pdf).
Demeke, M., Dawe, D., Tefft, J., Ferede, T., & Bell, W. 2012. Stabilizing price incentives for staple grain pro-
ducers in the context of broader agricultural policies Debates and country experiences, design, evidence, and
implementation. FAO, ESA Working Paper No. 12-05. Rome. (Available at http://www.fao.org/docrep/016/
ap536e/ap536e.pdf).
DHNA Foundation. Crop insurance for sustainable agriculture production. Policy Brief # 5. Centre for Policy
Planning. India. (Available at http://dhan.org/cpp/pdf/policybrief5.pdf ).
Druilhe, Z. and Barreiro-Hurlé, J. 2012. Fertilizer subsidies in sub-Saharan Africa. FAO, ESA Working paper
No. 12-04. Rome.

111
EAUE(: European Academy for Urban Environment). 2007. Supportive institutional conditions for policy
integration of transport, environment and health. (Available at http://www.eaue.de/Publikation/THEPEP-
brochure-content-final-B16.pdf)
ECOWAS. 2012. Regional Food Security Reserve - Feasibility Study. (Available at http://www.inter-reseaux.
org/IMG/pdf/Faisabilite_Reserve_Regionale_EN.pdf.
Eleri, O.E., Uduka, I.K., Akuto, N., Onuvae, P. & Anwara, O. 2012. Towards a Climate-based Agricultural
Insurance Reform in Nigeria. Presented at the Workshop on Legal and Regulatory Frameworks for Agricultural
Insurance Reform in Nigeria – Protecting Nigeria’s Farmers from Climate Change. Nigeria. International Centre
for Energy, Environment and Development. (Available at http://www.abuja.diplo.de/contentblob/3589720/
Daten/2490297/).
FAO. 2011a. Agricultural insurance in Asia and the Pacific region. FAO Regional Office for Asia and the
Pacific. (Also available at www.fao.org).
FAO. 2011b. Panorama of Food and Nutritional Security in Latin America and the Caribbean. Santiago: FAO
Regional Office for Latin America and the Caribbean.
FAO. 2012a. Panorama de la Seguridad Alimentaria y Nutricional en América Latina. FAO Regional Office for
Latin America and the Caribbean. (Also available at www.fao.org ).
FAO. 2012b. FAO Policy on Cash-Based Transfers. Rome: FAO. (Also available at: http://www.fao.org/
docrep/018/aq417e/aq417e.pdf).
FAO. 2012c. The State of Food Insecurity in the World. Rome: FAO. (Also available at: www.fao.org)
FAO. 2013a. Four case studies on credit guarantee fund for agriculture. (Also available at www.fao.org).
FAO. 2013b. Credit guarantee systems for agriculture and rural enterprise development. Rome.
Fattouh, B. & El Kattiri, L. 2012. Energy Subsidies in the Arab World. Arab Human Development Report.
(Available at: http://www.arab-hdr.org/publications/other/ahdrps/Energy%20Subsidies-Bassam%20Fattouh-
Final.pdf)
Fernandez, L. & Velarde, R.. 2012. Who benefits from social assistance in the Philippines? Evidence from the
latest national household surveys. The World Bank. Philippine Social Protection Note, No.4. (Available at:
http://www-wds.worldbank.org/servlet/WDSContentServer/WDSP/IB/2012/06/08/000333038_2012060804
1740/Rendered/PDF/694160BRI0P1180PUBLIC00FINAL0PSPN04.pdf)
Bibliography
112
Food and agriculture policy decisions | Trends, emerging issues and policy alignments since the 2007/08 food security crisis
Financial Stability Analysis Group of the People’s Bank of China. 2012. China financial stability report. China
Financial Publishing House. China, Beijing. (Also available at http://www.pbc.gov.cn/image_public/UserFiles/
english/upload/File/China%20Financial%20%20Stability%20Report(1).pdf).
Fiszbein, A. & Schady, N. 2009. Conditional cash transfers: reducing present and future poverty. Washington
DC: World Bank.
G20. 2011. Price Volatility in Food and Agricultural Markets: Policy Responses. Policy Report for G20 with
the contributions by FAO, IFAD, IMF, UNCTAD, WFP, the World Bank, the WTO, IFPRI, and the UN HLTF, May
3, 2011.
GAFSP (Global Agriculture and Food Security Program). 2011. Policy document: the promotion of paddy
rice production and export of milled rice. (Available at http://www.gafspfund.org/sites/gafspfund.org/files/
Documents/Cambodia_10_of_16_STRATEGY_SNEC-Rice%20Export%20Policy_0.pdf)
Gakou M. L., 1987. The crisis in African agriculture. The United Nations University Press. New Jersey, and
Zed Book, London.
Ghoneim, A. F. 2012. The Political Economy of Food Price Policy in Egypt. Working Paper Series UNU-WIDER
Research Paper, World Institute for Development Economic Research (UNU-WIDER). (Available at: http://
www.wider.unu.edu/publications/working-papers/2012/en_GB/wp2012-096/)
GoI (Government of India). 2011. Report of working group on warehousing development and regulation
for the twelfth plan period (2012-17). Planning Commission New Delhi. (Available at http://planningcom-
mission.gov.in/aboutus/committee/wrkgrp12/pp/wg_ware.pdf)
Green, Adam R. 2012. Africa: growing Africa’s land. All Africa. (Available at http://allafrica.com/sto-
ries/201207030260.html?viewall=1)
Grosh, M., del Ninno, C., Tesliuc, E. & Ouerghi, A. 2008. For protection and promotion: the design and
implementation of effective safety nets. Washington, DC: World Bank.
Hallam, D. 2010. International investment in developing country agriculture – issues and challenges.
(Available at http://www.maff.go.jp/primaff/meeting/kaisai/pdf/0903_3.pdf ).
Hickey, Will. 2013. Asia’s addiction to fossil fuel subsidies continues unabated. Asian Pathways. (Available
at http://www.asiapathways-adbi.org/2013/04/asias-addiction-to-fossil-fuel-subsidies-continues-unabated/)
HLPE 2012. Social protection for food security. A report by the High Level Panel of Experts on Food Security
and Nutrition of the Committee on World Food Security, Rome 2012. (Available at: http://www.fao.org/
113
fileadmin/user_upload/hlpe/hlpe_documents/HLPE_Reports/HLPE-Report-4-Social_protection_for_food_
security-June_2012.pdf).
HLPE. 2011. Price volatility and food security. A report by the High Level Panel of Experts on Food (Available
at: http://www.fao.org/fileadmin/user_upload/hlpe/hlpe_documents/HLPE-price-volatility-and-food-security-
report-July-2011.pdf)
Holzinger, K., Knillm, C., & Sommerer, T. 2008. Environmental policy convergence: the impact of inter-
national harmonization, transnational communication, and regulatory competition. International
Organization Foundation, volume 62, Issue 04. (Available at http://journals.cambridge.org/action/
displayAbstract?fromPage=online&aid=2360736)
Hongzhou, Z. 2013. China’s food security: from self-sufficiency to a dual strategy. Eurasia review. (Available at http://
www.eurasiareview.com/19032013-chinas-food-security-from-self-sufficiency-to-a-dual-strategy-analysis/).
IEA, OECD & WB. 2010. The scope of fossil- fuel subsidies in 2009 and a road-map for phasing out fossil-fuel
subsidies. An IEA, OECD and World Bank Joint Report Prepared for the G-20 Summit, Seoul, Republic of
Korea.
IFC (International Finance Corporation- Wold Bank Group). 2012. Public-Private partnership in Agricultural
Storage. PPP Workshop Bhubaneswar. (Available at http://www.ppiaf.org/sites/ppiaf.org/files/documents/
NEERAJ-Agribusiness-Storage-PPP.pdf).
IFPRI.2013. Global Food Policy Report. IFPRI. Washington DC. (Available at http://www.ifpri.org).
IMF. 2013. Energy subsidy reform: lessons and implications. (Available at: http://www.imf.org/external/np/
pp/eng/2013/012813.pdf).
IATP (Institute for Agriculture and Trade Policy). 2012. Grain reserves and the food price crisis: selected
writings from 2008–2012. IATP. Minnesota. (Available at http://www.iatp.org/files/2012_07_13_IATP_
GrainReservesReader.pdf).
IRIN news. 2011. ZIMBABWE: Food voucher scheme benefits HIV-positive people. (Available at http://www.
irinnews.org/report/94024/zimbabwe-food-voucher-scheme-benefits-hiv-positive-people)
Jaramillo, M. 2013. ELLA Policy brief: Expanding microfinance in Latin America’s rural areas. Lima. (Available at
http://ella.practicalaction.org/node/1084?automodal=true&automodalClose=true&automodalReload=true).
Jessop, R., Diallo, B., Duursma, M., Mallek, A., Harsm J., & Van Manen, B., 2012. Creating Access to
Agricultural Finance Based on a horizontal study of Cambodia, Mali, Senegal, Tanzania, Thailand and Tunisia.
Bibliography

114
Food and agriculture policy decisions | Trends, emerging issues and policy alignments since the 2007/08 food security crisis
A Savoir Collection, 14. Agence Française de Développement (AFD). (Available at http://www.afd.fr/webdav/
shared/PUBLICATIONS/RECHERCHE/Scientifiques/A-savoir/14-VA-A-Savoir.pdf)
Josling, Tim. 2011. Global food stamps: An idea worth considering?. International Centre for Trade and
Sustainable Development (ICTSD) Issue Paper No. 36.
Josling, Tim. 1997. Policy dynamics in North American agriculture: Definitions of and pressure for harmo-
nization, convergence and compatibility in policies and program affecting the agri-food sector. Agriculture
and Food Policy Systems Information Workshop: Harmonization/ Convergence/ Compatibility in Agriculture
and Agri-Food Policy. Farm Foundation. Arizona, USA.
Kamau, M., Mathenge, M., & Kirimi, L. 2012. How can Kenya better manage maize prices? Effects of import
tariffs, regional trade and producer price support. Tegemeo Institute of Agricultural Policy and Development.
Policy Brief No.7. Nairobi.
Klonsky, J., Hanson, S. & Lee, B. 2012. MERCOSUR: South America’s Fractious Trade Bloc. Council of Foreign
Affairs. (Available at http://www.cfr.org/trade/mercosur-south-americas-fractious-trade-bloc/p12762).
Kojima, M. 2013. Petroleum product pricing and complementary policies experience of 65 developing coun-
tries since 2009. Policy Research Working Paper 6396. World Bank. Washington, DC. (Available at http://
www-wds.worldbank.org/external/default/WDSContentServer/IW3P/IB/2013/04/01/000158349_20130401
160010/Rendered/PDF/wps6396.pdf).
Larson, D., Lampietti, J., Gouel C., Cafiero, C, & Roberts J. 2012. Food security and storage in the Middle
East and North Africa. Policy Research Working Paper 6031, the World Bank, Washington, DC.
MAFAP. 2012. Analysis of Incentives and Disincentives for Maize in Ghana. MAFAP Technical notes, FAO,
Rome, Italy.
MAFAP. 2013a. Analysis of Incentives and Disincentives for Maize in Nigeria. MAFAP Technical notes, FAO,
Rome, Italy.
MAFAP. 2013b. Review of food and agricultural policies in Mali. MAFAP Country Report Series, FAO, Rome,
Italy.
MAFAP. 2013c. Review of food and agricultural policies in Burkina Faso. MAFAP Country Report Series, FAO,
Rome, Italy.
MAFAP. 2013d. Review of food and agricultural policies in Kenya. MAFAP Country Report Series, FAO, Rome,
Italy.
115
Mahul, O. & Stutley, C.J. 2010. Government support to agriculture insurance. Report No. 53881. World
Bank. Washington DC. (Available at http://siteresources.worldbank.org).
McKenzie, A., 2012. Prefeasibility study of an ASEAN Rice futures market. (ADB) Sustainable Development,
Working Paper Series no 19. Asian Development Bank. Manila.
Mena Insurance CEO Club. 2013. Agriculture- food crisis: can insurance help?. (Available at www.meinsur-
ancereview.com).
MFW4A (Making Finance Work for Africa). 2012. Policy brief on agricultural finance in Africa. Tunis. (avail-
able at www.mfw4a.org).
Michigan State University. 2011. Mali agriculture sector assessment. (Available at http://fsg.afre.msu.edu/
promisam_2/MSU_Mali_Ag_Sector_Assessment_2011.pdf).
Murphy, S. 2009. Strategic Grain Reserves in an Era of Volatility. Institute for Agriculture and Trade Policy
(IATP). (Available at http://www.iatp.org/documents/strategic-grain-reserves-in-an-era-of-volatility-0)
Murphy, S., Burch, D. & Clapp, J. 2012. Cereal secrets – the world’s largest grain traders and global agricul-
ture. Oxfam Research Reports. Oxfam. Oxford, UK.
NEPAD. 2004. NEPAD Study to Explore Further Options for Food Security Reserve Systems in Africa. NEPAD
and WFP. (Available at http://reliefweb.int/sites/reliefweb.int/files/resources/nepa-afr-30jun.pdf)
NEPAD. 2012. NEPAD Agency workshop on integrating agriculture and food security risk management issues
in CAADP investment plans in southern and eastern Africa. NEPAD. Johannesburg. (Available at http://www.
nepad.org) .
OECD. 2009. Trade Impacts of Selected Regional Trade Agreements in Agriculture. OECD Trade Policy
Working Papers, No. 87. (Available at http://www.oecd.org/tad/benefitlib/42770785.pdf)
OECD. 2011. Agricultural policy monitoring and evaluation 2011: OECD countries and emerging economies.
OECD Publishing.
OECD. 2012. Policy framework for policy coherence for development. Working Paper no 1, 2012. (Available
at http://www.oecd.org/development/pcd/50461952.pdf )
OECD. 2013. Agricultural policy monitoring and evaluation 2013: OECD countries and emerging economies.
OECD Publishing.
Bibliography
116
Food and agriculture policy decisions | Trends, emerging issues and policy alignments since the 2007/08 food security crisis
Olomola, A. S. 2013. The political economy of food price policy in Nigeria. WIDER Working Paper No.
2013/016. United Nation University. (Available at http://www.wider.unu.edu).
Onumah, G. 2012. Promoting Agricultural Commodity Exchanges in Ghana and Nigeria: A review report.
Report to UNCTAD. (Available at http://www.unctad.info/upload/SUC/EcowasGhanaCerealMarkets/
Presentations/COMEX_Report_Onumah_en.PDF)
Ordoñez, H., Lalor, A., & Fuller, S. 2001. Grain production, marketing, and transportation in Argentina.
TAMRC International Market Research Report No. IM-3-01, October, 2001.
Oyejide, T.A., Alaba, O. , Abidem, A., & Balakrishnan, U. 2012. Agricultural pricing and public procurement
in Sub-Saharan Africa. GDN Agriculture Policy Series. Briefing Paper Number 5. (Available at http://www.
gdn.int).
Pibasso, A. M. 2011. Cameroun : la nouvelle banque agricole dans le pipe. Les Afriques. Douala. (Available
at http://www.lesafriques.com/banques-et-assurances/cameroun-la-nouvelle-banque-agricole-dans-le.
html?Itemid=308).
Qian, Jiwei. 2013. Anti-Poverty in China: Minimum Livelihood Guarantee. East Asian Institute, National
University of Singapore. Singapore.
Rahman, M.W., Luo, J. & Cheng, E. 2011. Policies and performances of agricultural/rural credit in Bangladesh:
What is the influence on agricultural production?. African Journal of Agricultural Research Vol. 6(31), pp.
6440-6452. (Available at http://www.academicjournals.org/ajar/PDF/pdf2011/19%20Dec/Rahman%20
et%20al.pdf).
Rashid, S., Nelson, A.W. & Garcia, P. 2010. Purpose and Potential for Commodity Exchanges in African
Economies. IFPRI Discussion Paper 01035. IFPRI
Republic of Rwanda. 2011. Government annual report July 2010-June 2012. Office of Prime Minister, Kigali.
(Available at http://www.primature.gov.rw/home.html?eID=dam_frontend_push&docID=6150).
Ricker-Gilbert, J., Mason, N., Darko, F. & Tembo, S. 2013. What are the effects of input subsidy programmes
on equilibrium maize prices? Evidence from Malawi and Zambia. Purdue University. USA. (Available at http://
ageconsearch.umn.edu/bitstream/149259/2/maize_price_AAEA_final_submit.pdf).
Robinson M.J.D. 2011. Regional grain banking for food security: past and present realities from SAARC
Initiatives. CUTS International, India.
SAARC Summit. 2011. SAFTA and the stakes of LDCs. 17th SAARC Summit Briefing Paper 3. (Available at:
http://www.alternative-regionalisms.org/wp-content/uploads/2012/03/safta-and-the-stakes-of-ldcs.pdf).

117
Save the Children. 2012. Nutrition in the First 1,000 days: State of the World’s Mothers 2012. Save the
Children USA and Save the Children International. USA/UK.
Sharma, V.P. 2012. Food subsidy in India: Trends, causes and policy reform options. Working Paper No. 2012-
08-02, Indian Institute of Management.
Sitko, N. J. & Jayne, T.S. 2011. Constraints to the development of commodity exchange in Africa: A case
study of ZAMACE. FSRP Working Paper No. 53, Food Security Research Project, Lusaka, Zambia,
Standard Bank. 2009. The Agriculture Guarantee Fund Scheme. Development finance initiative of the year:
Press release. (Available at http://agriculture.standardbank.com/Content/PressReleases/AI%20deal%20
of%20year%20entry%20Standard%20Bank.pdf)
Subbarao, K., del Ninno, C., Andrews, C., & Rodríguez-Alas, C. 2012. Public works as a safety net:
design, evidence, and implementation. Directions in development; human development. World Bank
Washington D.C. (Available at: http://documents.worldbank.org/curated/en/2012/11/16988159/
public-works-safety-net-design-evidence-implementation)
Tembo, Brian. 2011. Zamace: Facilitating the development of a WRS in Zambia. (Available at http://fsg.afre.
msu.edu/zambia/4_ZAMACE_Facilitates_Development_Commodity_Exchange.pdf)
Tran Manh Hung, 2009. Food security and sustainable agriculture in Vietnam. The 4th Session of the Technical
Commitee of APCAEM, February 10-13/2009, Chiang Rai, Thailand. Institute of Agricultural Engineering and
Post-harvest Technology (VIAEP). (Available at http://un-csam.org/Activities%20Files/A0902/vn.pdf)
Trethewie, S. 2013. Is the ASEAN Plus Three Emergency Rice Reserve (APTERR) the answer to the Southeast
Asia’s food security challenges?. NTS Alert no. AL13-02. (Available at http://www.rsis.edu.sg/nts/html-news-
letter/alert/nts-alert-1302.html).
Trivelli, C. & Venero, H. 2007. Agricultural Development Banking: Lessons from Latin America?. Instituto
de Estudios Peruanos. Lima. (Available at http://www.ruralfinance.org/fileadmin/templates/rflc/docu-
ments/1193827266161_ADB_lesson_from_Latin_America.pdf).
UNCTAD. 2009. Development impacts of commodity exchanges in emerging markets. UNCTAD. New York
and Geneva.
USAID. 2009. 10 Preconditions for a Successful Commodity Exchange – a Comparison between ACE
and ZAMACE. COMPETE - The Competitiveness and Trade Expansion Programme. East Africa Trade Hub
– USAID. (Available at http://www.competeafrica.org/Files/Preconditions_for_a_Commodity_Exchange_
ACE_ZAMACE_Final_240113.pdf).
Bibliography
118
Food and agriculture policy decisions | Trends, emerging issues and policy alignments since the 2007/08 food security crisis
USAID. 2012a. ICT to Enhance Warehouse Receipt Systems and Commodity Exchanges in Africa. Briefing
Paper. (Available at http://www.microlinks.org/sites/microlinks/files/resource/files/FACETWRSCEXv2.pdf).
USAID. 2012b. Cambodia Harvest: Helping address rural vulnerabilities and ecosystem stability, Issue No.
14. Phnom Penh, Cambodia.
Wiggins, S. & Keats, S. 2009. Grains stocks and price spikes. Overseas Development Institute (ODI). (Available
at http://www.odi.org.uk/sites/odi.org.uk/files/odi-assets/publications-opinion-files/7631.pdf)
World Bank. 2010a. Agricultural insurance in Latin America: Developing the market. Report No. 61963-LAC.
World Bank. Washington DC. (Available at http://siteresources.worldbank.org).
World Bank. 2010b. Government support to agricultural insurance. World Bank. Washington D.C. (Available
at https://openknowledge.worldbank.org/bitstream/handle/10986/2432/538810PUB0Gove101Official0U-
se0Only1.pdf?sequence=1).
World Bank. 2011. Middle East and North Africa: Facing challenges and opportunities. Economic
Developments and Prospects Report. (Available at: http://siteresources.worldbank.org/INTMENA/Resources/
MENAFacingChallengestextjuly13.pdf).
World Bank. 2012a. Disaster risk financing and insurance in Sub Saharan Africa. Report No 75061. World Bank.
Washington DC. (Available at http://www-wds.worldbank.org/external/default/WDSContentServer/WDSP/
IB/2013/02/01/000356161_20130201161548/Rendered/PDF/750610WP0P12390andInsuranceNov20120.
pdf).
World Bank. 2012b. Fourth agricultural development policy preparation to Republic of Ghana. Report No.
65540- GH. (Available at http://www-wds.worldbank.org/external/default/WDSContentServer/WDSP/IB/20
12/04/24/000350881_20120424103018/Rendered/PDF/655400PGD0P1220osed0402401200SIMULT.pdf).
World Bank. 2012c. Using public foodgrain stocks to enhance food security. World Bank. Washington D.C.
World Bank. 2012d. Agribusiness indicators: Ghana. World Bank and Agriculture and Rural Development,
Report Number 68163-GH. World Bank. Washington D.C.
World Bank. 2012e. Using public food grain stocks to enhance food security. World Bank. Washington D.C.
WFP (World Food Programme). 2013. State of School Feeding World Wide. Rome, Italy.
Wright, B. 2009. International grain reserves and other instruments to address volatility in grain markets.
World Bank Policy Research Working Paper 5028. Washington, D.C.
WTO, 2009. Trade Policy Review: Botswana, Lesotho, Namibia, South Africa and Swaziland. Annex 4 - South
Africa. (available at http://www.wto.org/english/tratop_e/tpr_e/tp322_e.htm)
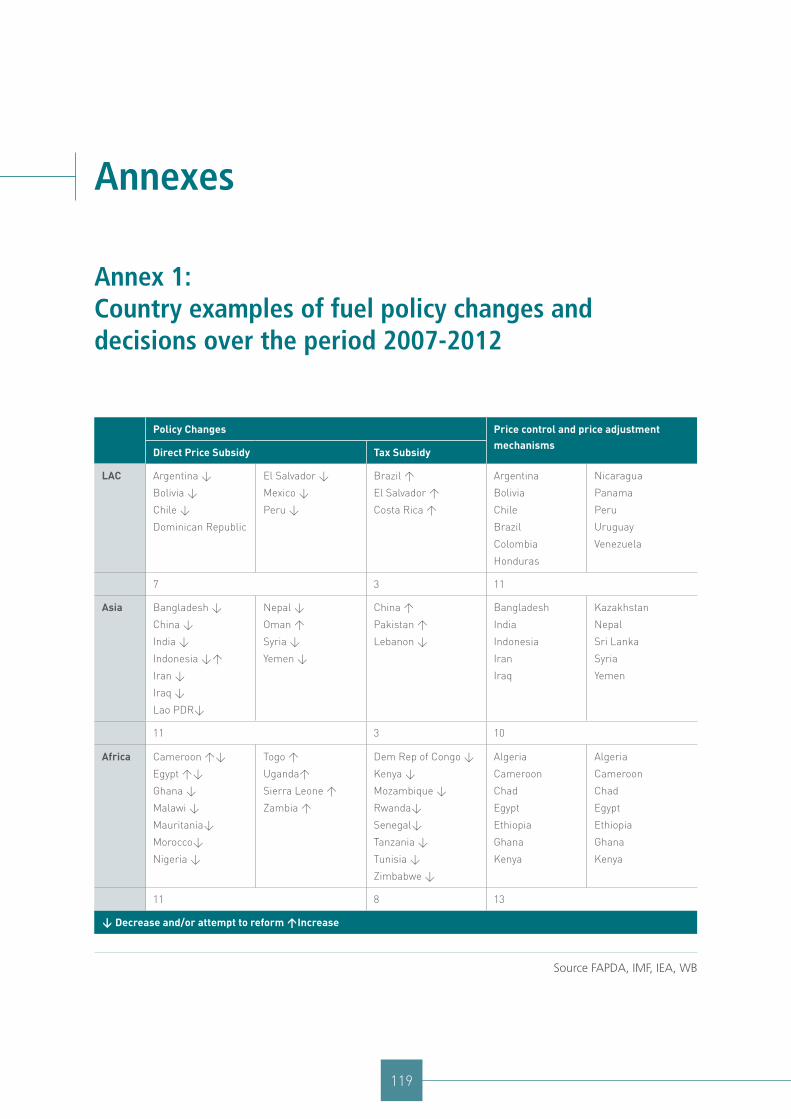
119
Annexes
Annex 1: Country examples of fuel policy changes and decisions over the period 2007-2012
Policy Changes Price control and price adjustment mechanisms
Direct Price Subsidy Tax Subsidy
LAC Argentina ↓
Bolivia ↓
Chile ↓
Dominican Republic
El Salvador ↓
Mexico ↓
Peru ↓
Brazil ↑
El Salvador ↑
Costa Rica ↑
Argentina
Bolivia
Chile
Brazil
Colombia
Honduras
Nicaragua
Panama
Peru
Uruguay
Venezuela
7 3 11
Asia Bangladesh ↓
China ↓
India ↓
Indonesia ↓↑
Iran ↓
Iraq ↓
Lao PDR↓
Nepal ↓
Oman ↑
Syria ↓
Yemen ↓
China ↑
Pakistan ↑
Lebanon ↓
Bangladesh
India
Indonesia
Iran
Iraq
Kazakhstan
Nepal
Sri Lanka
Syria
Yemen
11 3 10
Africa Cameroon ↑↓
Egypt ↑↓
Ghana ↓
Malawi ↓
Mauritania↓
Morocco↓
Nigeria ↓
Togo ↑
Uganda↑
Sierra Leone ↑
Zambia ↑
Dem Rep of Congo ↓
Kenya ↓
Mozambique ↓
Rwanda↓
Senegal↓
Tanzania ↓
Tunisia ↓
Zimbabwe ↓
Algeria
Cameroon
Chad
Egypt
Ethiopia
Ghana
Kenya
Algeria
Cameroon
Chad
Egypt
Ethiopia
Ghana
Kenya
11 8 13
↓ Decrease and/or attempt to reform ↑Increase
Source FAPDA, IMF, IEA, WB
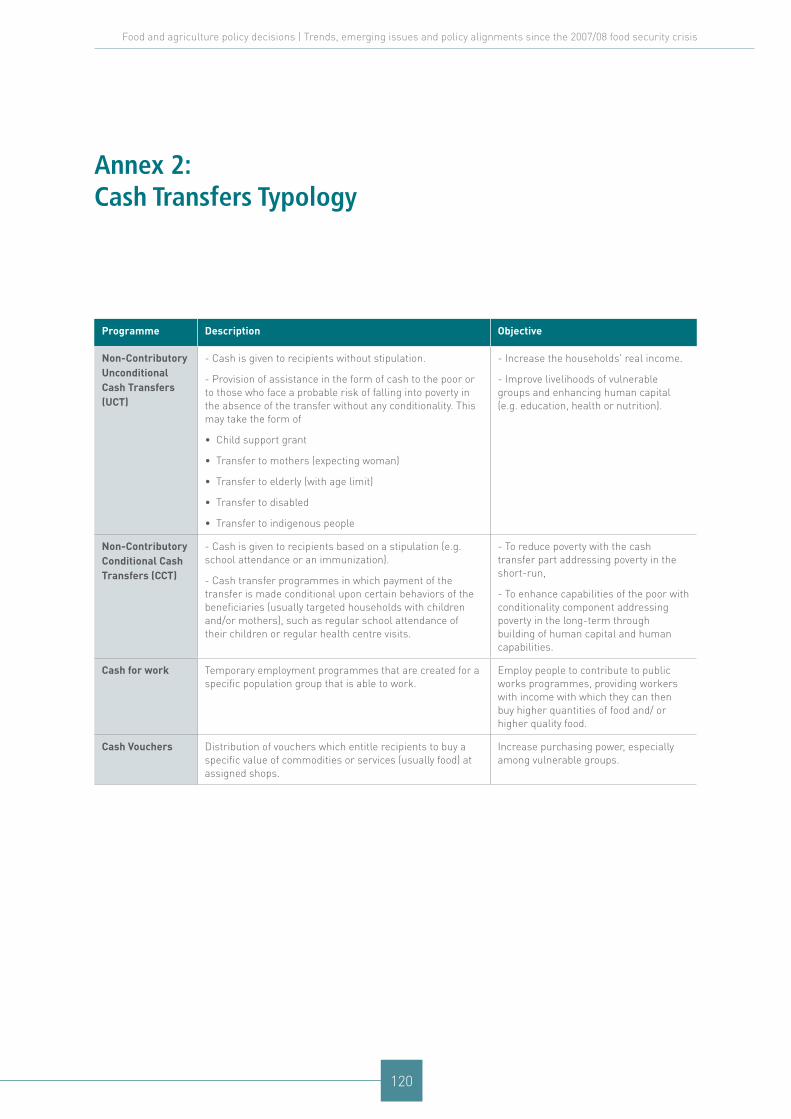
120
Food and agriculture policy decisions | Trends, emerging issues and policy alignments since the 2007/08 food security crisis
Annex 2: Cash Transfers Typology
Programme Description Objective
Non-Contributory Unconditional Cash Transfers (UCT)
- Cash is given to recipients without stipulation.
- Provision of assistance in the form of cash to the poor or to those who face a probable risk of falling into poverty in the absence of the transfer without any conditionality. This may take the form of
• Child support grant
• Transfer to mothers (expecting woman)
• Transfer to elderly (with age limit)
• Transfer to disabled
• Transfer to indigenous people
- Increase the households' real income.
- Improve livelihoods of vulnerable groups and enhancing human capital (e.g. education, health or nutrition).
Non-Contributory Conditional Cash Transfers (CCT)
- Cash is given to recipients based on a stipulation (e.g. school attendance or an immunization).
- Cash transfer programmes in which payment of the transfer is made conditional upon certain behaviors of the beneficiaries (usually targeted households with children and/or mothers), such as regular school attendance of their children or regular health centre visits.
- To reduce poverty with the cash transfer part addressing poverty in the short-run,
- To enhance capabilities of the poor with conditionality component addressing poverty in the long-term through building of human capital and human capabilities.
Cash for work Temporary employment programmes that are created for a specific population group that is able to work.
Employ people to contribute to public works programmes, providing workers with income with which they can then buy higher quantities of food and/ or higher quality food.
Cash Vouchers Distribution of vouchers which entitle recipients to buy a specific value of commodities or services (usually food) at assigned shops.
Increase purchasing power, especially among vulnerable groups.
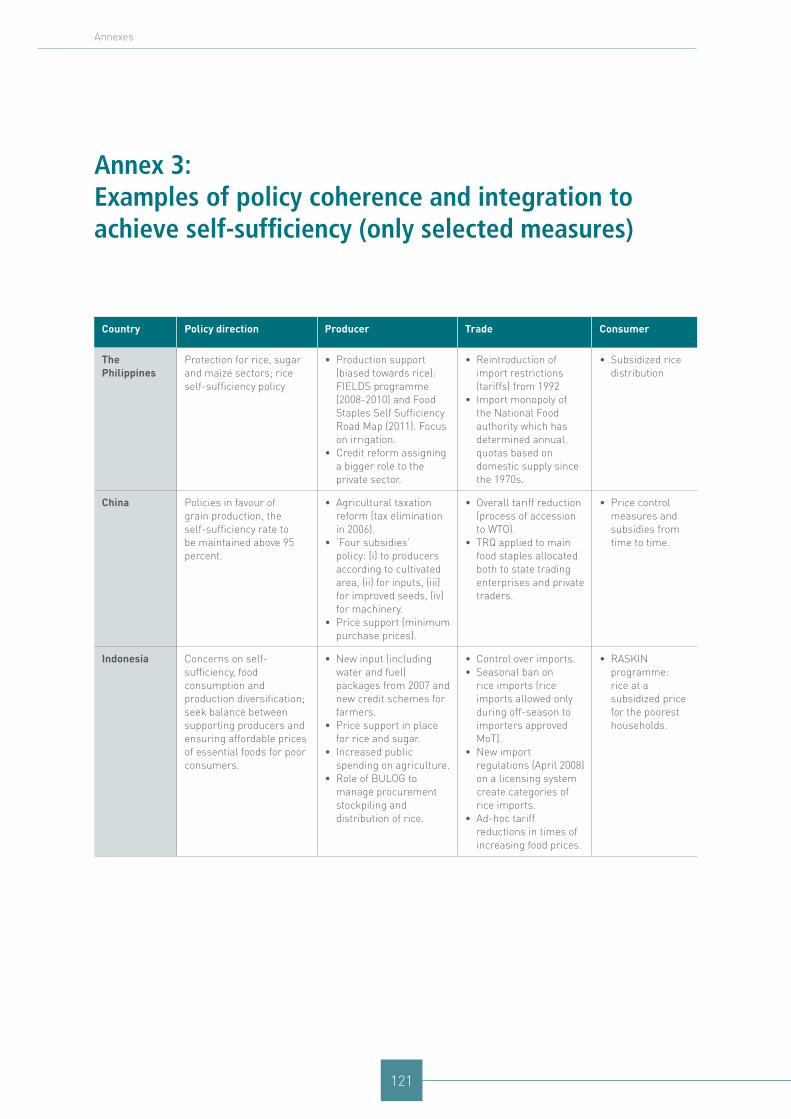
121
Annex 3: Examples of policy coherence and integration to achieve self-sufficiency (only selected measures)
Country Policy direction Producer Trade Consumer
The Philippines
Protection for rice, sugar and maize sectors; rice self-sufficiency policy
• Production support (biased towards rice): FIELDS programme (2008-2010) and Food Staples Self Sufficiency Road Map (2011). Focus on irrigation.
• Credit reform assigning a bigger role to the private sector.
• Reintroduction of import restrictions (tariffs) from 1992
• Import monopoly of the National Food authority which has determined annual quotas based on domestic supply since the 1970s.
• Subsidized rice distribution
China Policies in favour of grain production, the self-sufficiency rate to be maintained above 95 percent.
• Agricultural taxation reform (tax elimination in 2006).
• ‘Four subsidies’ policy: (i) to producers according to cultivated area, (ii) for inputs, (iii) for improved seeds, (iv) for machinery.
• Price support (minimum purchase prices).
• Overall tariff reduction (process of accession to WTO).
• TRQ applied to main food staples allocated both to state trading enterprises and private traders.
• Price control measures and subsidies from time to time.
Indonesia Concerns on self-sufficiency, food consumption and production diversification; seek balance between supporting producers and ensuring affordable prices of essential foods for poor consumers.
• New input (including water and fuel) packages from 2007 and new credit schemes for farmers.
• Price support in place for rice and sugar.
• Increased public spending on agriculture.
• Role of BULOG to manage procurement stockpiling and distribution of rice.
• Control over imports.• Seasonal ban on
rice imports (rice imports allowed only during off-season to importers approved MoT).
• New import regulations (April 2008) on a licensing system create categories of rice imports.
• Ad-hoc tariff reductions in times of increasing food prices.
• RASKIN programme: rice at a subsidized price for the poorest households.
Annexes
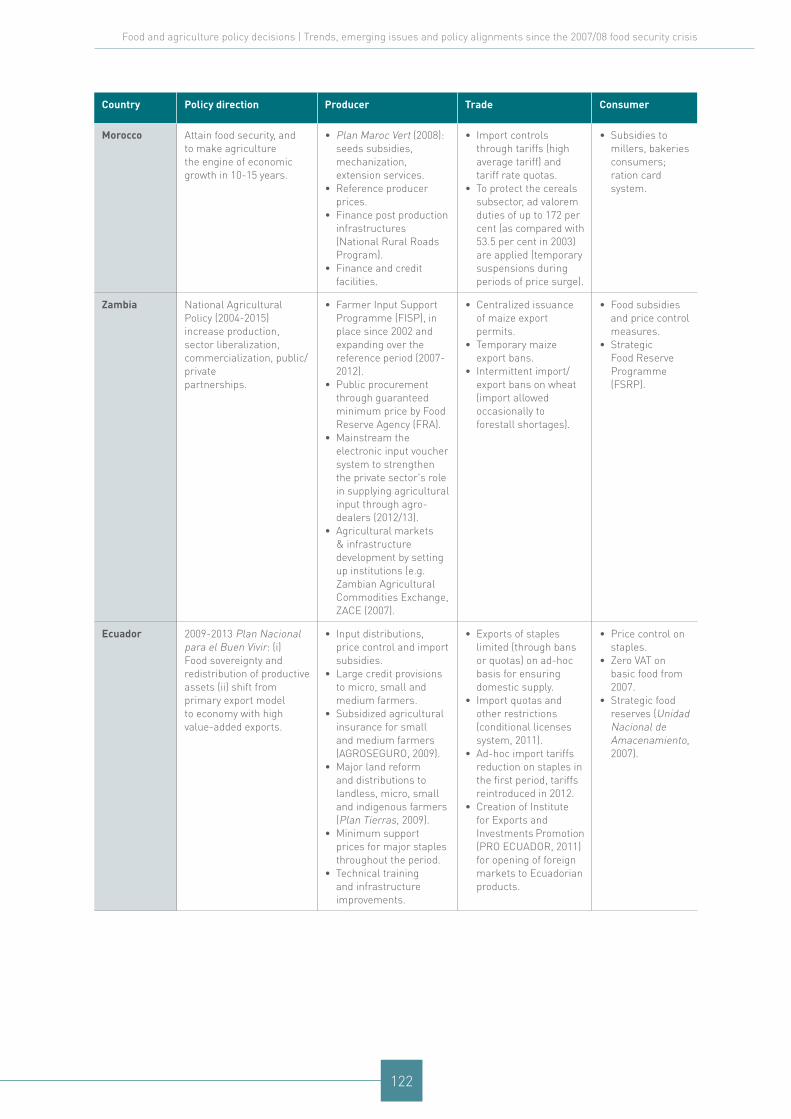
122
Food and agriculture policy decisions | Trends, emerging issues and policy alignments since the 2007/08 food security crisis
Country Policy direction Producer Trade Consumer
Morocco Attain food security, and to make agriculture the engine of economic growth in 10-15 years.
• Plan Maroc Vert (2008): seeds subsidies, mechanization, extension services.
• Reference producer prices.
• Finance post production infrastructures (National Rural Roads Program).
• Finance and credit facilities.
• Import controls through tariffs (high average tariff) and tariff rate quotas.
• To protect the cereals subsector, ad valorem duties of up to 172 per cent (as compared with 53.5 per cent in 2003) are applied (temporary suspensions during periods of price surge).
• Subsidies to millers, bakeries consumers; ration card system.
Zambia National Agricultural Policy (2004-2015) increase production,sector liberalization, commercialization, public/privatepartnerships.
• Farmer Input Support Programme (FISP), in place since 2002 and expanding over the reference period (2007-2012).
• Public procurement through guaranteed minimum price by Food Reserve Agency (FRA).
• Mainstream the electronic input voucher system to strengthen the private sector's role in supplying agricultural input through agro-dealers (2012/13).
• Agricultural markets & infrastructure development by setting up institutions (e.g. Zambian Agricultural Commodities Exchange, ZACE (2007).
• Centralized issuance of maize export permits.
• Temporary maize export bans.
• Intermittent import/export bans on wheat (import allowed occasionally to forestall shortages).
• Food subsidies and price control measures.
• Strategic Food Reserve Programme (FSRP).
Ecuador 2009-2013 Plan Nacional para el Buen Vivir: (i) Food sovereignty and redistribution of productive assets (ii) shift from primary export model to economy with high value-added exports.
• Input distributions, price control and import subsidies.
• Large credit provisions to micro, small and medium farmers.
• Subsidized agricultural insurance for small and medium farmers (AGROSEGURO, 2009).
• Major land reform and distributions to landless, micro, small and indigenous farmers (Plan Tierras, 2009).
• Minimum support prices for major staples throughout the period.
• Technical training and infrastructure improvements.
• Exports of staples limited (through bans or quotas) on ad-hoc basis for ensuring domestic supply.
• Import quotas and other restrictions (conditional licenses system, 2011).
• Ad-hoc import tariffs reduction on staples in the first period, tariffs reintroduced in 2012.
• Creation of Institute for Exports and Investments Promotion (PRO ECUADOR, 2011) for opening of foreign markets to Ecuadorian products.
• Price control on staples.
• Zero VAT on basic food from 2007.
• Strategic food reserves (Unidad Nacional de Amacenamiento, 2007).
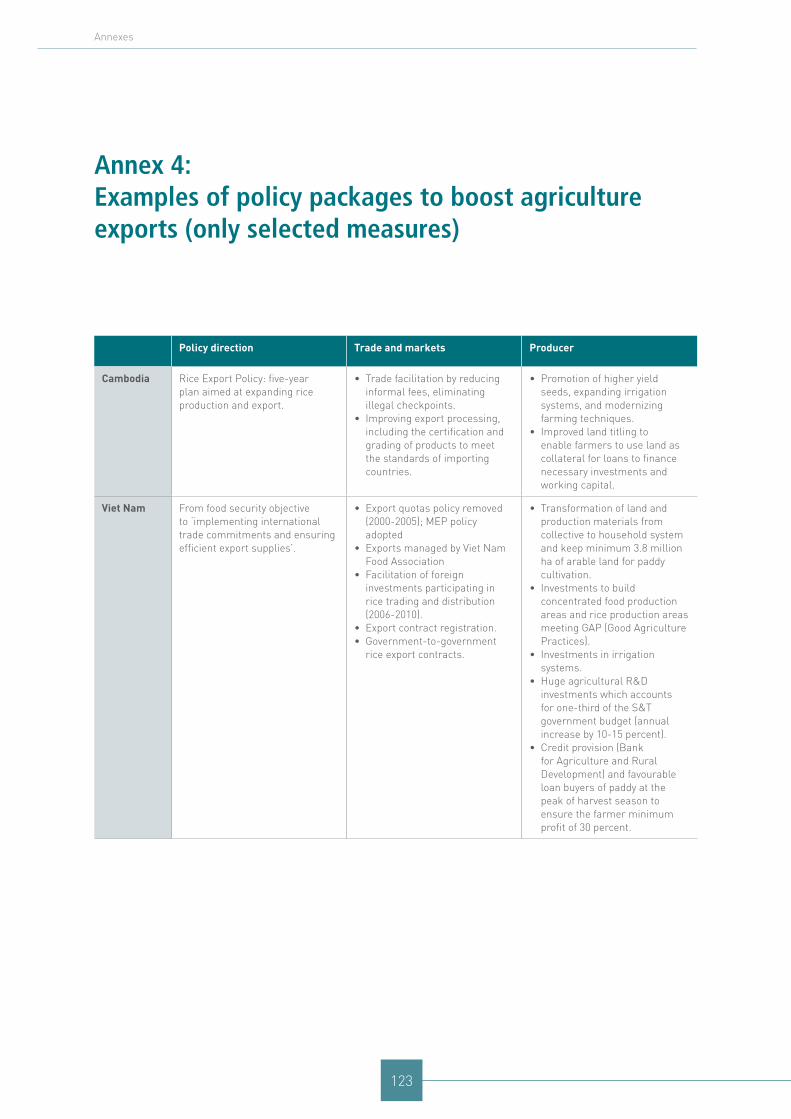
123
Annex 4: Examples of policy packages to boost agriculture exports (only selected measures)
Policy direction Trade and markets Producer
Cambodia Rice Export Policy: five-year plan aimed at expanding rice production and export.
• Trade facilitation by reducing informal fees, eliminating illegal checkpoints.
• Improving export processing, including the certification and grading of products to meet the standards of importing countries.
• Promotion of higher yield seeds, expanding irrigation systems, and modernizing farming techniques.
• Improved land titling to enable farmers to use land as collateral for loans to finance necessary investments and working capital.
Viet Nam From food security objective to ‘implementing international trade commitments and ensuring efficient export supplies’.
• Export quotas policy removed (2000-2005); MEP policy adopted
• Exports managed by Viet Nam Food Association
• Facilitation of foreign investments participating in rice trading and distribution (2006-2010).
• Export contract registration.• Government-to-government
rice export contracts.
• Transformation of land and production materials from collective to household system and keep minimum 3.8 million ha of arable land for paddy cultivation.
• Investments to build concentrated food production areas and rice production areas meeting GAP (Good Agriculture Practices).
• Investments in irrigation systems.
• Huge agricultural R&D investments which accounts for one-third of the S&T government budget (annual increase by 10-15 percent).
• Credit provision (Bank for Agriculture and Rural Development) and favourable loan buyers of paddy at the peak of harvest season to ensure the farmer minimum profit of 30 percent.
Annexes

124
Food and agriculture policy decisions | Trends, emerging issues and policy alignments since the 2007/08 food security crisis
Policy direction Trade and markets Producer
Peru Export promotion and trade openness
• No import or export restriction imposed
• General slowdown of import tariffs
• Free or preferential trade agreements signed in the reference period (with EFTA, South Korea, China, Panama and Costa Rica)
• Efforts to accomplish sanitary standards of commercial partners.
• Expansion of credit lines at preferential rates to small, medium and large farmers (with technical assistance), plus special credit lines targeted to traditional crop (cotton, alpaca and coffee).
• Creation of a Business Guarantee Fund (FOGEM, 2009) guaranteeing loans of financial institutions to productive micro and small institutions.
• Development of market information systems: Sistema Nacional de Información Agraria (2006); Sistema de Abastecimiento y Precios (SISAP, 2008)
• Development of post-production infrastructure (logistics centres, rural markets etc.).
• Public insurance and risk management schemes: Fondo de Garantía para el Campo y del Seguro Agropecuario (2007) and Seguro Agrario Catastrófico (2009).
Uganda Dynamic and competitive export-driven economy for national prosperity and development.
• Uganda Export Promotion Board (UEPB) set up a coordination institution.
• Trade support services (market information, promotion and quality management).
• Infrastructure developments (roads and hydropower plants)
• Set up trade information and export development centres.
• Integration in EAC.
• Training programmes for farmers.
• Finance and credit facilities.

Graphic designer: Juan Luis Salazar