food-bridging: a new network construction to unveil … a new network construction to unveil the...
TRANSCRIPT

Food-bridging: a new network construction tounveil the principles of cooking
Tiago Simas∗1,2, Michal Ficek1, Albert Diaz-Guilera3,4,Pere Obrador1, and Pablo R. Rodriguez1
1Telefonica Research, Edificio Telefonica, Barcelona, Spain2Department of Psychiatry, University of Cambridge,
Cambridge, UK3Departament de Fisica de la Materia Condensada, Marti i
Franques 1, Universitat de Barcelona, 08028 Barcelona, Spain4Universitat de Barcelona Institute of Complex Systems
(UBICS), Universitat de Barcelona, Barcelona, Spain
April 17, 2017
Abstract
In this manuscript we propose, analyse, and discuss a possiblenew principle behind traditional cuisine: the Food-bridging hypothesisand its comparison with the food-pairing hypothesis using the samedataset and graphical models employed in the food-pairing study byAhn et al. [1].
The Food-bridging hypothesis assumes that if two ingredients donot share a strong molecular or empirical affinity, they may becomeaffine through a chain of pairwise affinities. That is, in a graphicalmodel as employed by Ahn et al., a chain represents a path that jointsthe two ingredients, the shortest path represents the strongest pairwisechain of affinities between the two ingredients.
∗Email: [email protected]
1
arX
iv:1
704.
0333
0v2
[ph
ysic
s.so
c-ph
] 1
4 A
pr 2
017

Food-pairing and Food-bridging are different hypotheses that maydescribe possible mechanisms behind the recipes of traditional cuisines.Food-pairing intensifies flavour by mixing ingredients in a recipe withsimilar chemical compounds, and food-bridging smoothes contrast be-tween ingredients. Both food-pairing and food-bridging are observedin traditional cuisines, as shown in this work.
We observed four classes of cuisines according to food-pairing andfood-bridging: (1) East Asian cuisines, at one extreme, tend to avoidfood-pairing as well as food-bridging; and (4) Latin American cuisines,at the other extreme, follow both principles. For the two middleclasses: (2) Southeastern Asian cuisines, avoid food-pairing and followfood-bridging; and (3) Western cuisines, follow food-pairing and avoidfood-bridging.
1 Introduction
Since the introduction by Francois Benzi and Heston Blumenthal of the Food-pairing hypothesis, a debate on this hypothesis has been risen in gastronomyscience and cuisine. Originally it states that, if two ingredients share im-portant flavour compounds1, there is a good chance that they will result ina tasty combination, [1, 2]. In the last few years, this hypothesis attractedfoodies, many chefs, and scientists. If food-pairing is one of the main princi-ples behind our taste preferences, scientifically this would allow us to predictand build many successful new ingredient affinities based on which flavoursthey are composed.
Ahn et al. [1], present a study of the food-pairing hypothesis acrossseveral regional cuisines, employing a set of tools which derive from a newscientific field: complex networks, a sub-field of complex systems [4]. Thesemathematical techniques were applied to several regional cuisines, to encodea relation between ingredients and flavours as a network, where nodes andedges represent ingredients and flavours sharing respectively. This network iscalled flavour network from now on. The authors have observed that Westerncuisines show a tendency towards the food-pairing hypothesis, i.e. theirflavour network contains many pairs of ingredients that share many flavourcompounds, and that Eastern Asian cuisines tend to avoid compound sharing
1By flavour compounds we mean molecular chemical compounds and from now on willdescribe these as flavours compounds or, in short, flavours.
2
between ingredients. The study of food-pairing has lately been applied toother specific regional cuisines [5, 6, 7].
The hypothesis of food-bridging stems from the combination of the theoryof complex networks and gastronomy [1, 2, 3, 5, 8, 9, 12, 13]. It assumes thatif two ingredients do not share a strong molecular or empirical affinity, theymay become affine through a chain of pairwise affinities. That is, apricot andwhiskey gum may not be affine, but if we join (or bridge) them with tomatothey may become affine – assuming that tomato is affine with apricot andwhiskey gum, thus creating a chain of affinities. In a graphical model of aflavour network this corresponds to a path that joints the two ingredients,but not necessarily the shortest path. However, the shortest path representsthe strongest pairwise chain of affinities between the two ingredients.
In this manuscript we analyse and discuss the food-bridging hypothesiswith a restriction to the optimal case, which corresponds to the shortestpath in the graphical model. We use the same dataset and graphical modelsemployed in the study of Ahn et al. [1]. This allows us to perform a directcomparative study between food-pairing and food-bridging.
2 Methods and Materials
2.1 Data and Ingredient Networks
The data used in this work as well as the methods employed to build in-gredient networks, are based on the work of Ahn et. al. [1]. In short, theflavour network is a weighted graph obtained from a bi-partite graph that re-lates 1530 ingredients with 1106 flavour compounds [1]. Nodes in the flavournetwork represent the ingredients, edge weights are the number of flavourscompounds shared between pairs of ingredients [1].
We removed some regional cuisines from the original work [1]. The rea-son behind is that we employed the null-model Frequency-conserving de-scribed in the supplementary materials [1], and after a permutation test andmulti-comparison correction (False Discovery Rate), they show evidence ofno statistical difference when compared with the null-model on the variables:food-pairing and food-bridging.
In general, the weights of a weighted network lie in a non-normalisedinterval Zij ∈ [a, b] ⊂ R. Normalising the network weights to the unitinterval I = [0, 1] does not affect network properties, if the normalisation
3

is performed by a linear function. As shown in [9] there is only one uniquelinear function that performs such normalisation.
wij =(1− 2ε)Zij + (2ε− 1) ·MIN(Zij)
MAX(Zij)−MIN(Zij)+ ε (1)
We have parameterise this function with ε in order to avoid merging and/orisolating vertices with weights at the boundaries of Zij ∈ [a, b]. In general εis set to 0.01.
This normalisation allows us to apply the framework described in [9],i.e. allows us to treat weighted graphs as mathematical objects defined ina specific algebra, similar to the way in which we use algebras to deal withnumbers.
2.2 Food-pairing, Food-bridging and Flavour NetworkSemi-metricity
Food-pairing . As defined in [1] Food-pairing is measured by the numberof flavours a pair of ingredients share. The food-pairing value of a recipe isthe average number of shared flavours in the recipe, as defined in [1] and iscalculated from the following equation:
Ns(R) =2
nR(nR − 1)
∑i,j∈R,i 6=j
|Ci ∩ Cj| (2)
where Ck corresponds to the edge weight between the pair of ingredientsin the flavour network, and nR is the number of ingredients in the recipeR. Each recipe defines a sub-graph in the flavour network and Ns(R) corre-sponds to the average of all edges in such sub-graph.
Metric and Semi-metric edges and paths . As defined in [13, 12, 9, 11,15, 14, 10], an edge in a weighted graph is metric if the shortest path is equalto the edge by itself (direct connection). Otherwise the edge is consideredsemi-metric, which means that there is at least one alternative path thatinvolves other nodes. See figure 1 for an example.
We may observe in a network of ingredients that two nodes are morestrongly connected by other paths (semi-metric paths), whether or not thereis a direct edge between them. Figure 1 shows an example of the combina-tion of ”garlic” and ”strawberry” from the flavour network, which share 5
4

flavours when mixed together. In this figure we show how we may increasethe poor affinity between these two ingredients by adding additional ingre-dients that play in the semi-metric paths of the flavour network. From theflavour network, at least two semi-metric paths are stronger than the edgethat connects them. In this case, among the possible stronger paths, the opti-mal semi-metric path is the path that indirectly connects the two ingredientsin this network; that is, the path ”garlic + roasted onion + bantu beer +strawberry”. These intermediate ingredients potentiate the affinity between”garlic - strawberry”. Other semi-metric paths may exist as we show in thisexample: ”garlic + roast beef + strawberry”.
Food-pairing is a particular case for which we only consider direct con-nections, if they exist. In another words k = 0 hops (zero nodes in between).However, with semi-metric paths we allow two ingredients to be stronglyconnected with k > 0 hops, whether the edge between the ingredients existsor not.
There are many ways to calculate such alternative paths between any twonodes in a weighted graph. Refer to the Figure 1 in [15] for a summary ofthis calculation and, see further details in [9, 11, 15, 14, 16].
Food-bridging . Food-briging is a hypothesis which assumes that if twoingredients do not share a strong molecular or empirical affinity, they maybecome affine through a chain of pairwise affinities. That is, apricot andwhiskey gum may not be affine, but if we join (or bridge) them with tomatothey may become affine – assuming that tomato is affine with both apricotand whiskey gum, thus creating a chain of affinities.
Food-bridging is the ability to connect a pair of ingredients, that may ormay not have a direct connection, through a path of non-repeating ingredi-ents within a network of ingredient affinities; in the specific case of this workthe flavour network. Several paths may exist, or none. In the case that nopath exists, we say that no bridge exists, otherwise a bridge exists and allpossible bridges are ranked by the strength of the path.
The notion of food-bridging is directly related to semi-metric connectionsbetween ingredients in a network of ingredients as briefly mentioned above.Semi-metricity in weighted graphs is a mathematical property of distancethat measures all levels of triangle inequality violations. That is, all k− hopinequalities violations between two ingredients, where k ≥ 1 means that we
5
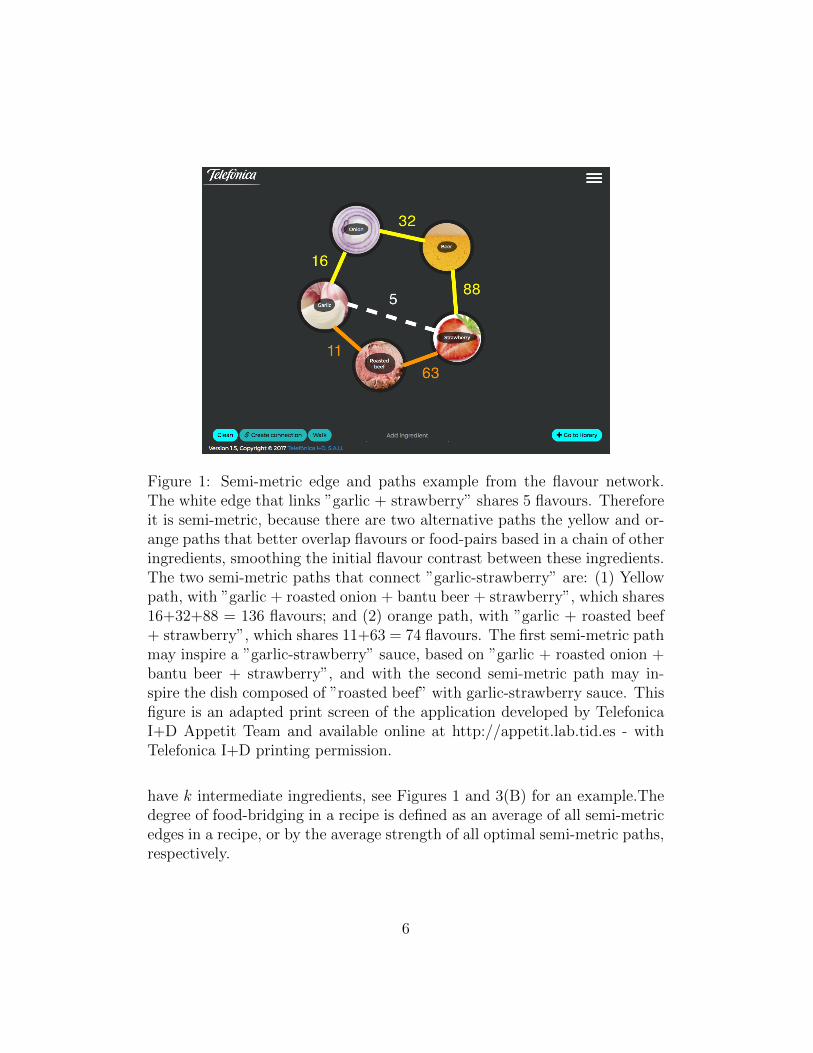
Figure 1: Semi-metric edge and paths example from the flavour network.The white edge that links ”garlic + strawberry” shares 5 flavours. Thereforeit is semi-metric, because there are two alternative paths the yellow and or-ange paths that better overlap flavours or food-pairs based in a chain of otheringredients, smoothing the initial flavour contrast between these ingredients.The two semi-metric paths that connect ”garlic-strawberry” are: (1) Yellowpath, with ”garlic + roasted onion + bantu beer + strawberry”, which shares16+32+88 = 136 flavours; and (2) orange path, with ”garlic + roasted beef+ strawberry”, which shares 11+63 = 74 flavours. The first semi-metric pathmay inspire a ”garlic-strawberry” sauce, based on ”garlic + roasted onion +bantu beer + strawberry”, and with the second semi-metric path may in-spire the dish composed of ”roasted beef” with garlic-strawberry sauce. Thisfigure is an adapted print screen of the application developed by TelefonicaI+D Appetit Team and available online at http://appetit.lab.tid.es - withTelefonica I+D printing permission.
have k intermediate ingredients, see Figures 1 and 3(B) for an example.Thedegree of food-bridging in a recipe is defined as an average of all semi-metricedges in a recipe, or by the average strength of all optimal semi-metric paths,respectively.
6

More specifically, we define the recipe optimal food-bridging strength N∗sm(R)as an average of the strengths of all the optimal paths between any pair ofingredients in the defined recipe sub-graph:
N∗sm(R) =2
nR(nR − 1)
∑i,j∈R,i 6=j
δ(si,j > 1 ∧ si,j < +∞)
dci,j + 1(3)
where
si,j =di,jdci,j
is the semi-metric ratio in the weighted sub-graph defined by the recipe Rin the flavour network [9, 11, 15, 14]: di,j is the direct distance and dci,jdenotes the shortest path between ingredients i and j, respectively. δ is thediscrete-Kronecker function, i.e. δ(condition) = 1, if the logical conditionTrue, otherwise δ(condition) = 0 – for logical condition equals False. Thatis, the equation numerator;
∑i,j δ(si,j > 1 ∧ si,j < +∞), counts only the
semi-metric edges.Although we define the recipe optimal food-bridging strength N∗sm(R), in
this work we measure the degree of food-bridging in a recipe as the averageof all semi-metric edges in a recipe, which represents a simpler version.
Network semi-metric percentage . As defined in [9, 11, 15, 14] the net-work semi-metric percentage is given by the following equation:
SMP =
∑i,j δ(si,j > 1 ∧ si,j < +∞)∑i,j δ(si,j ≥ 1 ∧ si,j < +∞)
(4)
where si,j is the semi-metric ratio between ingredients i and j in the flavournetwork. The dominator of this equation;
∑i,j δ(si,j ≥ 1∧si,j < +∞) counts
all edges in the network and the numerator;∑
i,j δ(si,j > 1 ∧ si,j < +∞),counts only the semi-metric edges.
Recipe food-bridging percentage . Semi-metric percentage of the sub-graph representing a recipe in the ingredient network is called recipe food-bridging percentage. In other words, Equation 4 above is applied to thesub-graph defined by the recipe.
Network metric backbone . As defined in [9, 11, 15, 14] the metric back-bone is the smallest weighted sub-graph of a weighed graph that preserves
7
the shortest paths: sub-graph with all metric edges.
Network semi-metric backbone . The semi-metric backbone is a sub-graph of a weighted graph with only semi-metric edges, i.e. all metric edgesremoved from the network [11, 15].
3 Results
In Figure 2 we analysed food-pairing and optimal food-bridging (semi-metricpercentage) according to equations 2 and 4, respectively. We plotted the av-erages of these variables for each of the seven distinct world regions, againsthow they rank, (Figure 2 (A) and (C)), and against the number of ingredi-ents, (Figure 2 (B) and (D)).
Food-pairing : In Figures 2 (A) and (B) we observe that there are clearlytwo distinct groups with respect to food-pairing: Western-based cuisines;and Eastern Asian cuisines. It corroborates with the observations in [1, 2, 5]that Eastern Asian cuisines avoid food-pairing more than the Western basedcuisines. Moreover, from Figure 2 (B), we observe that there is a negativetrend of food-pairing against the average number of ingredients used in arecipe. Note that in this case, East Asian and Southeast Asian cuisines differmainly in the average number of ingredients used in a recipe. East Asiancuisine is a complete outlier in this trend – flagging that Southeast Asiancuisine may differ from East Asian cuisine in some other dimension. Wealso observe that Eastern European as well as Southeast Asian cuisines showhigher variability, suggesting a richer cuisine. In fact, the source of the vari-ability may stem from a size effect, since these two cuisines present lowervolume of recipes when compared to the others, a collection of 381 and 457recipes, respectively, with the others containing over 2000 recipes each.
Food-bridging : In Figures 2 (C) and (D) we observe that food-bridingranks non-linear and depends positively linearly on the average number ofthe ingredients used in recipes. From the rank we observe that, in this case,food-bridging: East and Southeast Asian cuisines differ significantly fromeach other; Western cuisines cluster together at the bottom extreme; andSoutheast Asian at the other extreme.
8

Figure 2: < N(R) > is the average over all recipes of the recipe food-pairing,< SMP (R) > is the average over all recipes of the recipe food-bridging,Rank is the sorted cuisine type by < N(R) > or < SMP (R) >, and < n >the average number of ingredients per recipe for a given cuisine type. (A)Average recipe Food-pairing (< N(R) >) vs. cuisine type Rank. (B) Averagerecipe Food-pairing (< N(R) >) vs. average number of ingredients per recipe(< n >) . (C) Average recipe Food-bridging (< SMP (R) >) vs. cuisine typeRank. (D) Average Food-bridging (< SMP (R) >) vs. average number ofingredients per recipe (< n >).
In this case we note that food-bridging (semi-metric percentage) dependson the number of ingredients used in a recipe. This was an expected resultsince there are more possibilities to bridge ingredients, i.e. more degrees offreedom.
Food-pairing and Food-bridging : In Figure 3 (A) we observe the relation
9

between food-pairing and food-bridging. We divided the group into four non-overlapping regions, which represent the following four classes.
1. Low food-pairing + Low food-bridging.
2. Low food-pairing + High food-bridging.
3. High food-pairing + Low food-bridging.
4. High food-pairing + High food-bridging.
We observe that East Asian falls into class (1), Southeast Asian into class(2), Southern, Eastern, Western European and North American into class (3)and Latin American into class (4).
In class (1), with low food-pairing and low food-bridging, the recipe ingre-dients depend less on the co-occurrence of their flavour compounds, directlyor indirectly (chains of pairings). Class (2) pairs flavour compounds mainlyindirectly by chains or bridges between ingredients. In class (3), the ingredi-ents mainly pair their flavour compounds without that many indirect chainsor bridges. In class (4) the ingredients strongly pair and bridge their flavourcompounds.
In Figure 3 (B) we have an example of a SouthEast Asian recipe withsix ingredients2. We can observe five semi-metric edges (red) and six metricedges (blue). The semi-metric percentage of this recipe is SMP = 5
5+6×
100% = 45%. It shares in average eleven flavour compounds between pairsof ingredients, falling into class (2) according to figure 3 (A). Moreover, thisrecipe has nine possible semi-metric paths or bridges, where some of themare shown in the Figure 3 (B).
In Figures 4-5, we show a sub-graph of the flavour network with the top100 ingredients that have stronger connections or pairings (node strength).Figure 4 edges represent only metric connections (metric backbone) and Fig-ure 5 edges show only semi-metric connections (semi-metric backbone). Nodecolours represent network clusters after applying a community detection al-gorithm, e.g. Louvain algorithm [17], and node size proportional to the
2The meaning of general ingredients products from Fenaroli’s book of Flavors [8] is forexample:
fish: sweet fish, fatty fish, raw fatty fish, ...
seed: lovage seed, toasted sesame seed, angelica seed, ...
10

node metric or semi-metric strength, respectively. The metric percentage is27, 4% of the edges from the flavour network and the semi-metric percentageis 72, 6% from the flavour network, which demonstrates that there are a highnumber of bridge possibilities between pairs of ingredients.
Highly metric ingredients (node size) tend to food-pair in pairs, and highlysemi-metric ingredients (node size) tend to food-pair with the addition ofintermediate ingredients. For example, from Figure 4 the ingredients ”beer”,”black tea”, ”gruyere cheese” etc, are good food-pairing ingredients. Figure5 shows that ”port wine”, ”rose wine”, ”tea”, ”tomato” are better mixedwith intermediate ingredients, according to food-bridging hypothesis.
In general, we may observe from Figures 4-5 that there is a dichotomy;with ingredients that are less suited to food-pairing tending to use the food-bridging mechanism, and vice-versa.
4 Discussion
We have shown that the flavour network is 72, 6% semi-metric, which allowsfood-bridging to work extensively, i.e. the number of possible semi-metricpaths between ingredients is large. Food-bridging or semi-metricity, by hy-pothesis may increase affinities between ingredients with or without a strongdirect affinity based on chain of intermediate ingredient pairings, in this casea chain of flavour compounds affines.
Food-pairing and food-bridging are different hypothesis that may repre-sent possible mechanisms behind traditional cuisines. Food-pairing inten-sifies flavour with similar flavoured ingredients and food-bridging smoothscontrasted flavoured ingredients in a recipe, respectively. Both hypothesisfood-pairing and food-bridging, are jointly observed in traditional cuisines,as shown in this work.
Regional cuisines cluster in four distinct classes defined by the possible re-lationship between these two mechanisms. Where East Asian cuisine is at oneextreme class (1), and tends to avoid food-pairing as well as food-bridging;and Latin American cuisine is at the other extreme class (4), following bothprinciples. Southeastern Asian and Western cuisines are in middle classes(2) and (3): class (2) avoids food-pairing and follows food-bridging; class (3)follows food-pairing and avoids food-bridging.
It is worthwhile noting from figure 3 (A) that the represented cuisineclasses follow in some way their geo-political distribution.
11

Figure 3: < N(R) > is the average over all recipes of the recipe food-pairing, and < SMP (R) > is the average over all recipes of the recipe food-bridging. (A) Classes of cooking based on average recipe Food-pairing (<N(R) >) versus average recipe Food-bridging (< SMP (R) >) . We dividedthe space into four distinct regions or classes, as follows: (1) Low food-pairing + Low food-bridging, (2) Low food-pairing + High food-bridging,(3) High food-pairing + Low food-bridging, (4) High food-pairing + Highfood-bridging. (B) An example of semi-metric analysis of a Southeast Asiancuisine with six ingredients. The semi-metric percentage of this recipe isSMP = 5
5+6× 100% = 45%. It shares in average eleven flavour compounds
between pairs of ingredients, falling into class (2) according to (A). Moreover,this recipe has nine possible semi-metric paths or bridges, of which some areshown above.
12

Figure 4: Metric Backbone. Top 100 ingredients of Flavour Network withhigher node strength. Edges represent metric connections and edge colourthe target community colour (target node). Node colours represent networkclusters after applying a community detection algorithm, e.g. Louvain algo-rithm, and size proportional to the node metric strength.
East Asia cuisine, represented by Korean, Chinese, and Japanese cuisines,tends to use contrasted ingredients with respect to flavour. This results in acuisine that contrasts several flavours.
At the other extreme is Latin American cuisine, represented by Caribbean,Central America, South American, and Mexican cuisines. These tend to rein-
13

Figure 5: Semi-metric Backbone. Top 100 ingredients of Flavour Networkwith higher node strength. Edges represent semi-metric connections and edgecolour the target community colour (target node). Node colours representnetwork clusters after applying a community detection algorithm, e.g. Lou-vain algorithm, and size proportional to the node semi-metric strength.
force the intensity of flavour using both mechanisms, food-pairing and food-bridging. That is, direct and indirect intensification of flavours in a recipe,reinforcing common flavours and smoothing contrasts between flavoured con-trasted ingredients.
In class (2) we found Southeast Asian cuisine, represented by Indonesian,
14
Malaysian, Filipino, Thai, and Vietnamese. These cuisines are similar to EastAsian cuisines with respect to food-pairing, using contrasted ingredients, butat the same time they smooth these contrasts with other ingredients thatbridge the contrast.
The other intermediate class is class (3), where we found Eastern, South-ern, Western European, and North American cuisines. Eastern Europeancuisines are represented by Eastern Europe in general, and Russian cuisines.Southern European cuisine is represented by Greek, Italian, Mediterranean,Spanish, and Portuguese. Western European cuisine is represented by French,Austrian, Belgian, English, Scottish, Dutch, Swiss, German, and Irish. AndNorth American is represented by American in general, Canada, Cajun,Southern soul food, and Southwestern U.S. These cuisines tend to followthe food pairing with the direct intensification of flavours in a recipe, avoid-ing contrasted ingredients. Therefore, these cuisines are characterised byavoiding flavour contrasted ingredients. Moreover, in this class, at one ex-treme we have Southern European, and at the other North American. Thelatter sub-clustering better with Western and Eastern European cuisines.
We may suggest several explanations for why, in this analysis, traditionalcuisines cluster in this way across these two dimensions: food-pairing andfood-bridging. The clustering aligns well with a geo-political distribution.These cuisines may be driven by particular geographical weather and resourceconstrains as well as political trade in goods, which may influence the differentstyles of cuisine analysed in this work.
Food-bridging, as shown, opens the possibility of better understandingpossible mechanisms behind mixing ingredients in a recipe. This is a newmechanism or hypothesis, different from food-pairing, and both mechanismsare observed in traditional cuisines, in particular in this dataset [1].
We recognise a number of limitations in this work. We have not includedin this analysis important features such as texture, ingredient concentrations,processes used during the recipes, such as cooking method among others[3]. We restricted our analysis to the number of shared chemical flavourcompounds between ingredients as in the works of Ahn et al. [1, 2]. However,for food-bridging, a contra-part of its mathematical representation – semi-metricity – is not restricted to the flavour space or more specifically to theflavour network. In general, it may be employed to other modalities: texture,colour, among other empirical or scientifically affinities.
Besides this work, semi-metricity as a topological property of weightedgraphs has been shown to be a topological analysis, sensitive and specific
15

in identifying how the flow of information propagates in the human brain[11, 15], provide better recommendations in social networks [9, 13], and abetter optimisation of large scale graphical algorithms [14].
This work brings a new perspective on food-pairing, and introduces food-bridging as a new principle or vector behind cooking.
Author Contributions
All authors made significant contributions to the drafting of the article.
Acknowledgements
The authors would like to acknowledge Telefonica I+D for all support donein the Appetit project that have turn possible the present work. We alsothank all of our colleagues involved in the Appetit project. We would like toacknowledge Oliver Smith and Emily Stott for their persistence on editingthis manuscript.
References
[1] Y-Y. Ahn, S.E. Ahnert, J. P. Bagrow, and A-L. Barabasi. Flavor networkand the principles of food pairing. Scientific Reports 1:196 (2011).
[2] Y-Y. Ahn and S.E. Ahnert. The Flavor Network. Leonardo, Vol. 46, No.3, pp. 272-273, 2013. doi: 10.1162/LEON.a.00569.
[3] Vega C., Ubbink J., and Van der Linden, E. The Kitchen as laboratory:reflexions on the science of food and cooking. Columbia University Press,New York, 2012.
[4] S. Boccaletti, V. Latora, Y. Moreno, M. Chavez, D.-U. Hwang, Complexnetworks: Structure and dynamics, Physics Reports, Volume 424, Issues4-5, February 2006, Pages 175-308. doi: 10.1016/j.physrep.2005.10.009.
[5] Jain A, N K R, Bagler G (2015) Analysis of Food Pairingin Regional Cuisines of India. PLoS ONE 10(10): e0139539.doi:10.1371/journal.pone.0139539.
16

[6] Kim S, Sung J, Foo M, Jin Y-S, Kim P-J (2015) Uncoveringthe Nutritional Landscape of Food. PLoS ONE 10(3): e0118697.doi:10.1371/journal.pone.0118697.
[7] Varshney, Kush R., Varshney, Lav R., Wang, Jun, and Myers, Daniel.Flavor Pairing in Medieval European Cuisine: A Study in Cooking withDirty Data. June 30, 2013. arXiv:1307.7982 [physics.soc-ph].
[8] Burdock, G.A. Fenaroli’s handbook of flavor ingredients. CRC Press,5th edition, 2004.
[9] T. Simas, and L. M. Rocha. Distance Closures on Complex Networks.Network Science (3) 2 (2015) 227-268. doi:10.1017/nws.2015.11.
[10] Simas T, Chavez M, Rodriguez PR and Diaz-Guilera A (2015) An al-gebraic topological method for multimodal brain networks comparisons.Front. Psychol. 6:904. doi: 10.3389/fpsyg.2015.00904.
[11] Simas T, Chattopadhyay S, Hagan C, Kundu P, Patel A, Holt R, et al.(2015) Semi-Metric Topology of the Human Connectome: Sensitivityand Specificity to Autism and Major Depressive Disorder. PLoS ONE10(8): e0136388. doi:10.1371/journal.pone.0136388.
[12] Simas T.M.L.M. Stochastic Models and Transitivity in Complex Net-works. Indiana University, May 2012. Ph.D Thesis.
[13] T. Simas and L.M. Rocha. Semi-metric networks for recommender sys-tems. Proceedings of the The 2012 IEEE/WIC/ACM International JointConferences on Web Intelligence and Intelligent Agent Technology-Volume 03, pp. 175-179.
[14] Kalavri V., Simas T. and Logothetis D. The shortest path is not alwaysa straight line: leveraging semi-metricity in graph analysis. Proceedingsof the VLDB Endowment Volume 9 Issue 9, May 2016, Pages 672-683.doi: 10.14778/2947618.2947623.
[15] Simas T and Suckling J (2016) Commentary: Semi-Metric Topol-ogy of the Human Connectome: Sensitivity and Specificity toAutism and Major Depressive Disorder. Front. Neurosci. 10:353. doi:10.3389/fnins.2016.00353.
17

[16] D. B. Johnson, Efficient algorithms for shortest paths in sparse networks.Journal of the ACM 24 (1977) 1-13,
[17] Santo Fortunato (2010) Community detection in graphs, Physics Re-ports, Volume 486, Issues 3?5, February 2010, Pages 75-174, ISSN 0370-1573, http://dx.doi.org/10.1016/j.physrep.2009.11.002.
18