food demand in australia: trends and food security...
TRANSCRIPT

Food demand in Australia: Trends and food security issues Lindsay Hogan
Research by the Australian Bureau of Agricultural and Resource Economics and Sciences
Research Report 17.7 June 2017
Food demand in Australia: Trends and food security issues ABARES
i
© Commonwealth of Australia 2017
Ownership of intellectual property rights Unless otherwise noted, copyright (and any other intellectual property rights, if any) in this publication is owned by the Commonwealth of Australia (referred to as the Commonwealth).
Creative Commons licence All material in this publication is licensed under a Creative Commons Attribution 4.0 International Licence except content supplied by third parties, logos and the Commonwealth Coat of Arms.
Inquiries about the licence and any use of this document should be emailed to [email protected].
Cataloguing data Hogan, L 2017, Food demand in Australia: Trends and food security issues, ABARES Research Report 17.7, Canberra, June. CC BY 4.0.
ISSN 1447-8358 ISBN 978-1-74323-346-7 ABARES project 43574
Internet This publication is available at agriculture.gov.au/abares/publications.
Australian Bureau of Agricultural and Resource Economics and Sciences (ABARES) Postal address GPO Box 858 Canberra ACT 2601 Switchboard +61 2 6272 2010 Email [email protected] Web agriculture.gov.au/abares
Disclaimer The Australian Government acting through the Department of Agriculture and Water Resources, represented by the Australian Bureau of Agricultural and Resource Economics and Sciences, has exercised due care and skill in preparing and compiling the information and data in this publication. Notwithstanding, the Department of Agriculture and Water Resources, ABARES, its employees and advisers disclaim all liability, including for negligence and for any loss, damage, injury, expense or cost incurred by any person as a result of accessing, using or relying on information or data in this publication to the maximum extent permitted by law.
Acknowledgements The author very much appreciates information and helpful comments from Nick Blong, Usha Sriram-Prasad and Lynda Hayden from the Agricultural Policy Division in the Department of Agriculture and Water Resources, and Peter Gooday, David Galeano, Sally Thorpe, Trish Gleeson, Diane Stefaniac and Peter Berry from ABARES. Thanks also to Mihir Gupta for preparing the data visualisation tool that accompanies this report.
Food demand in Australia: Trends and food security issues ABARES
ii
Contents Summary .................................................................................................................................................................................................... 1
1 Introduction ............................................................................................................................................................................... 7
2 Long-term trends in Australia’s household food consumption ................................................................... 9
Recent trends ............................................................................................................................................................................... 9
Indicative projections to 2049-50 ................................................................................................................................... 13
3 Household characteristics and food expenditure in Australia ................................................................. 15
Recent trends ............................................................................................................................................................................ 15
Household food expenditure by income quintile: 2009-10 ................................................................................. 17
Household food expenditure by net worth quintile: 2009-10 ............................................................................ 21
Household food expenditure by age category: 2009-10 ....................................................................................... 25
4 Trade and Australia’s food market ............................................................................................................................ 29
Australia’s food production and processing industries ......................................................................................... 29
International transmission of food prices ................................................................................................................... 30
Importance of food trade ..................................................................................................................................................... 33
5 Food security issues ........................................................................................................................................................... 38
Definitions of food security and the role of government ...................................................................................... 38
Australia’s tax-transfer system ......................................................................................................................................... 39
Information policies: food prices and quality attributes....................................................................................... 44
6 Conclusion ................................................................................................................................................................................ 48
Appendix A: Food consumption and related measures ....................................................................................................... 49
Appendix B: Food types and demand elasticities ................................................................................................................... 51
Appendix C: Private risk management strategies in food markets ................................................................................ 53
Appendix D: Australia’s consumer policy framework and food safety ......................................................................... 54
Appendix E: OECD classification of taxes ................................................................................................................................... 55
References ................................................................................................................................................................................................ 58
Food demand in Australia: Trends and food security issues ABARES
iii
Tables Table 1 Household food consumption and related indicators, Australia, selected years ..................................... 10
Table 2 Household food consumption in Australia: assumptions to 2049-50 .......................................................... 13
Table 3 Household food consumption in Australia: indicative projections to 2049-50 ....................................... 13
Table 4 Household food expenditure in Australia, by food category, selected years ............................................. 15
Table 5 Household characteristics and food expenditure, by income quintile, 2009-10 ..................................... 18
Table 6 Household characteristics and food expenditure, by net worth quintile, 2009-10 ................................ 22
Table 7 Household characteristics and food expenditure, by age category, 2009-10 ........................................... 26
Table 8 Value of Australia's food trade, by food category, 2015-16 .............................................................................. 34
Table 9 Taxes on goods and services and VAT coverage, by OECD country, 2014 ................................................. 42
Table 10 VAT treatment of food, by OECD country, 2016 .................................................................................................. 43
Table B1 Estimates of food demand elasticities in Australia, by category .................................................................. 52
Table E1 OECD classification of taxes .......................................................................................................................................... 56
Figures Figure S1 Australia's household food consumption: indicative projections to 2049-50......................................... 1
Figure S2 Distribution of Australia's average household food expenditure, selected years .................................. 2
Figure S3 Household food expenditure per person in Australia, by category, 2009-10 .......................................... 3
Figure S4 Total household food expenditure in Australia, by category, 2009-10 ...................................................... 4
Figure S5 Importance of trade in Australia's food consumption and production, 1989-90 to 2015-16 .......... 5
Figure 1 Key components in Australia's household income account, 1964-65 to 2015-16 ................................... 9
Figure 2 Household food consumption expenditure per person in Australia, 1964-65 to 2015-16 ............... 12
Figure 3 Australia's household income per person and food prices, 1964-65 to 2015-16 ................................. 12
Figure 4 Australia's household food consumption: indicative projections to 2049-50 ........................................ 14
Figure 5 Household food expenditure in Australia, selected years ................................................................................ 16
Figure 6 Household food expenditure per person in Australia, by food type, selected years ............................ 16
Figure 7 Household food expenditure in Australia, by income quintile, 2009-10................................................... 17
Figure 8 Average food expenditure per person, by food type and income quintile, 2009-10............................ 19
Figure 9 Total household food expenditure, by food type and income quintile, 2009-10 ................................... 20
Figure 10 Household food expenditure in Australia, by net worth quintile, 2009-10 .......................................... 21
Figure 11 Average food expenditure per person, by food type and net worth quintile, 2009-10 .................. 23
Figure 12 Total household food expenditure in Australia, by food type and net worth quintile, 2009-10 . 24
Figure 13 Household food expenditure in Australia, by age category, 2009-10 ...................................................... 25
Figure 14 Average food expenditure per person, by food type and age category, 2009-10 ............................... 27
Figure 15 Total household food expenditure, by food type and age category, 2009-10 ...................................... 28
Figure 16 Agriculture and fisheries—food and non-food commodities and uses ................................................... 29
Figure 17 Australia's gross value of production of food commodities, 1975-76 to 2015-16 ............................. 29
Figure 18 Output and employment in key food industries in Australia, 1989-90 to 2015-16 .......................... 30
Figure 19 Commodity prices and exchange rates, 1989-90 to 2015-16 ...................................................................... 31
Food demand in Australia: Trends and food security issues ABARES
iv
Figure 20 Real food prices and consumption in Australia, by main food type, 1988-89 to 2015-16 ............. 32
Figure 21 Importance of trade in Australia's food consumption and production, 1989-90 to 2015-16 ....... 33
Figure 22 Value of Australia's food trade, by food category, 1989-90 to 2015-16 ................................................. 35
Figure 23 Australia's food expenditure: households highly reliant on income transfers, 2009-10 ................ 40
Figure 24 Revenue from taxes on goods and services, Australia and OECD, 1965 to 2014 ................................ 44
Figure B1 Growth rates in food consumption, prices and income in Australia, 1999-00 to 2015-16 ............ 51
Boxes Box 1 Definitions of food security ................................................................................................................................................. 38
Box 2 Information market failures................................................................................................................................................ 45
Box 3 Australian Government guidelines for healthy lifestyle choices ........................................................................ 47
Food demand in Australia: Trends and food security issues ABARES
1
Summary In recent years, ABARES has undertaken research programs that focus on two key economic aspects of Australia’s food exports: world food demand to 2050 and implications for Australia’s food exports; and the efficiency of Australia’s infrastructure and food export supply chains. To complement these research programs, this report examines trends and issues in Australia’s food market with a focus on domestic food demand.
Long-term trends in Australia’s household food consumption In Australia, total household food consumption expenditure was $92 billion in 2015-16, compared with $83 billion in 2009-10 and $49 billion in 1989-90 (in 2014-15 prices). Food is a necessity good overall, although food products and services may vary widely in terms of price and quality. In high income countries, the share of the household budget spent on food tends to fall as household incomes rise. In Australia, the long-term decline in the household food budget share has slowed appreciably in recent decades—the share of food in household consumption expenditure has declined from 17 per cent in 1964-65 to 11 per cent in 1989-90 and 10 per cent in 2015-16. The food industry has therefore been relatively successful in competing with non-food industries in the domestic market.
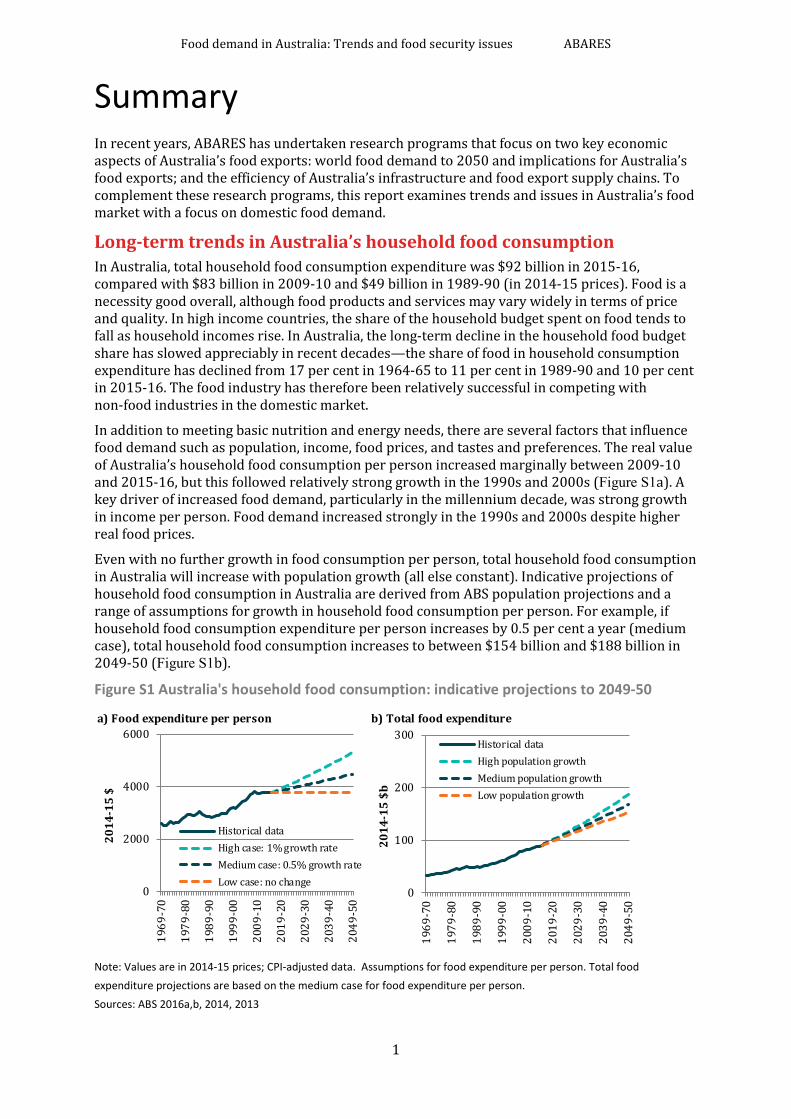
In addition to meeting basic nutrition and energy needs, there are several factors that influence food demand such as population, income, food prices, and tastes and preferences. The real value of Australia’s household food consumption per person increased marginally between 2009-10 and 2015-16, but this followed relatively strong growth in the 1990s and 2000s (Figure S1a). A key driver of increased food demand, particularly in the millennium decade, was strong growth in income per person. Food demand increased strongly in the 1990s and 2000s despite higher real food prices.
Even with no further growth in food consumption per person, total household food consumption in Australia will increase with population growth (all else constant). Indicative projections of household food consumption in Australia are derived from ABS population projections and a range of assumptions for growth in household food consumption per person. For example, if household food consumption expenditure per person increases by 0.5 per cent a year (medium case), total household food consumption increases to between $154 billion and $188 billion in 2049-50 (Figure S1b).
Figure S1 Australia's household food consumption: indicative projections to 2049-50
Note: Values are in 2014-15 prices; CPI-adjusted data. Assumptions for food expenditure per person. Total food expenditure projections are based on the medium case for food expenditure per person. Sources: ABS 2016a,b, 2014, 2013
a) Food expenditure per person b) Total food expenditure
0
100
200
300
1969
-70
1979
-80
1989
-90
1999
-00
2009
-10
2019
-20
2029
-30
2039
-40
2049
-50
2014
-15
$b
Historical dataHigh population growthMedium population growthLow population growth
0
2000
4000
6000
1969
-70
1979
-80
1989
-90
1999
-00
2009
-10
2019
-20
2029
-30
2039
-40
2049
-50
2014
-15
$
Historical dataHigh case: 1% growth rateMedium case: 0.5% growth rateLow case: no change
Food demand in Australia: Trends and food security issues ABARES
2
Food expenditure trends across households in Australia The Australian Bureau of Statistics (ABS) conducts a household expenditure survey (HES) every five to six years. In 2009-10, the latest year available, the top four expenditure categories were current housing costs (18 per cent of average household expenditure), food (17 per cent), transport (16 per cent) and recreation (13 per cent). In both 1998-99 and 1988-89, food was the highest household expenditure category, followed by transport, current housing costs and recreation.
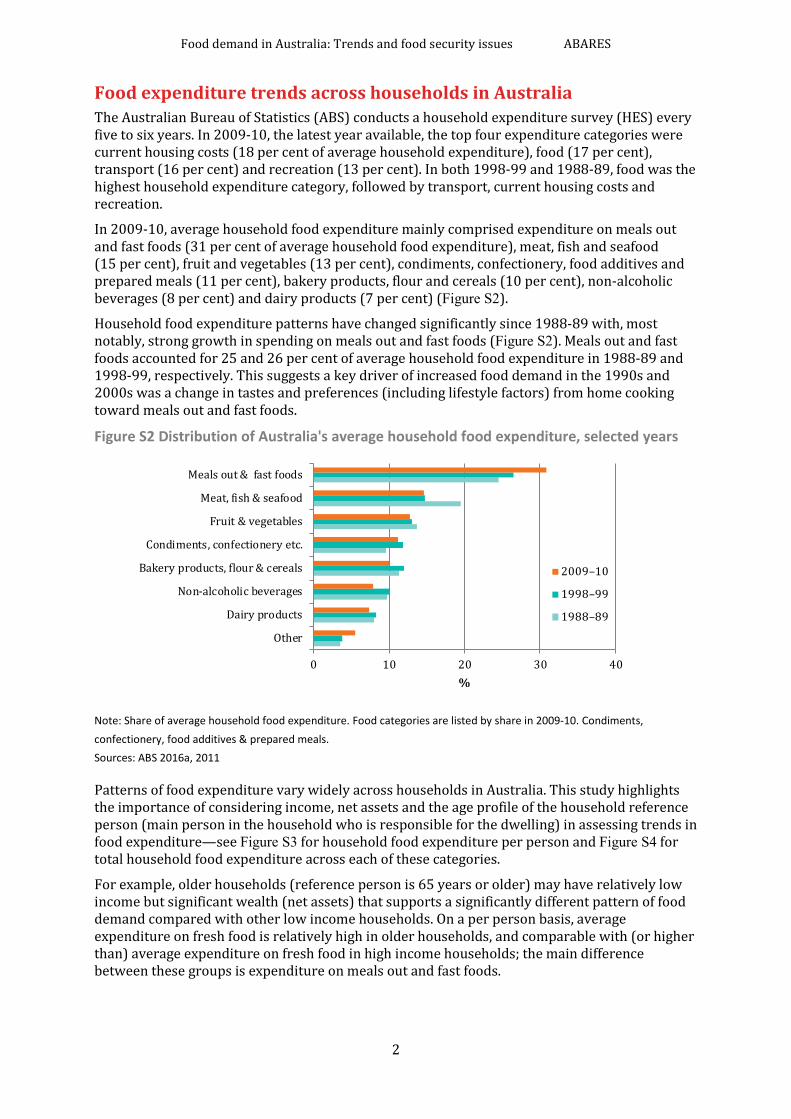
In 2009-10, average household food expenditure mainly comprised expenditure on meals out and fast foods (31 per cent of average household food expenditure), meat, fish and seafood (15 per cent), fruit and vegetables (13 per cent), condiments, confectionery, food additives and prepared meals (11 per cent), bakery products, flour and cereals (10 per cent), non-alcoholic beverages (8 per cent) and dairy products (7 per cent) (Figure S2).
Household food expenditure patterns have changed significantly since 1988-89 with, most notably, strong growth in spending on meals out and fast foods (Figure S2). Meals out and fast foods accounted for 25 and 26 per cent of average household food expenditure in 1988-89 and 1998-99, respectively. This suggests a key driver of increased food demand in the 1990s and 2000s was a change in tastes and preferences (including lifestyle factors) from home cooking toward meals out and fast foods.
Figure S2 Distribution of Australia's average household food expenditure, selected years
Note: Share of average household food expenditure. Food categories are listed by share in 2009-10. Condiments, confectionery, food additives & prepared meals. Sources: ABS 2016a, 2011
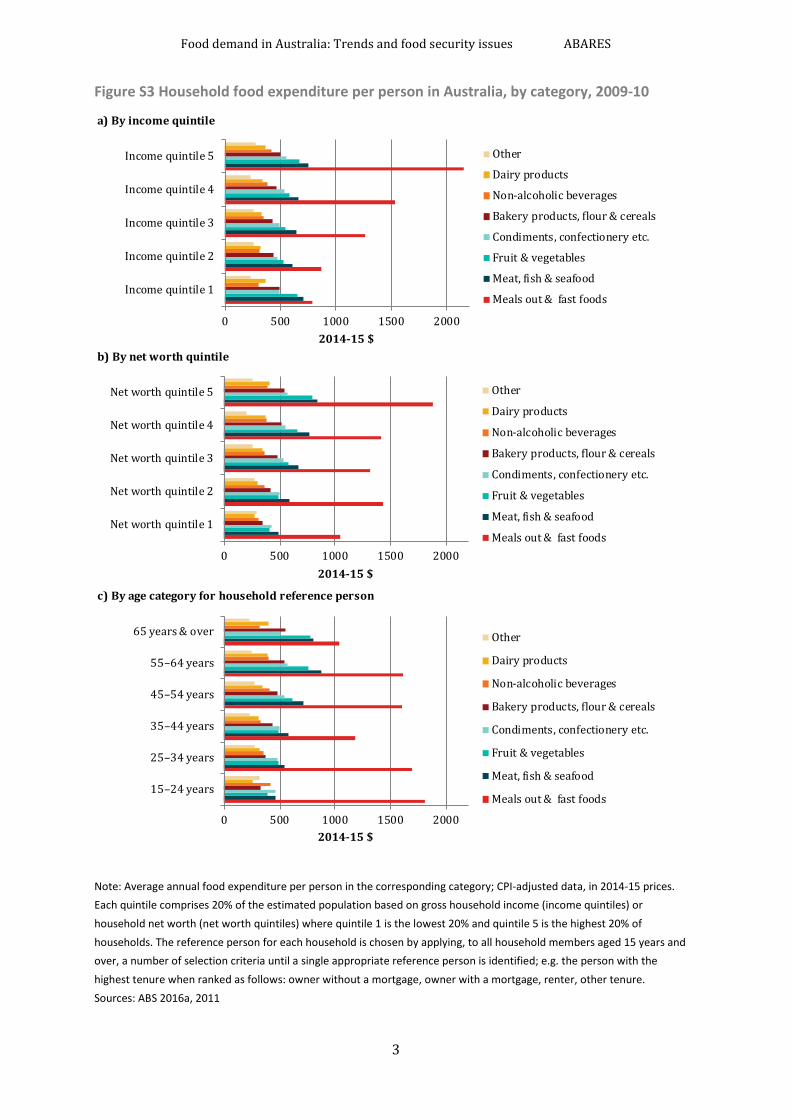
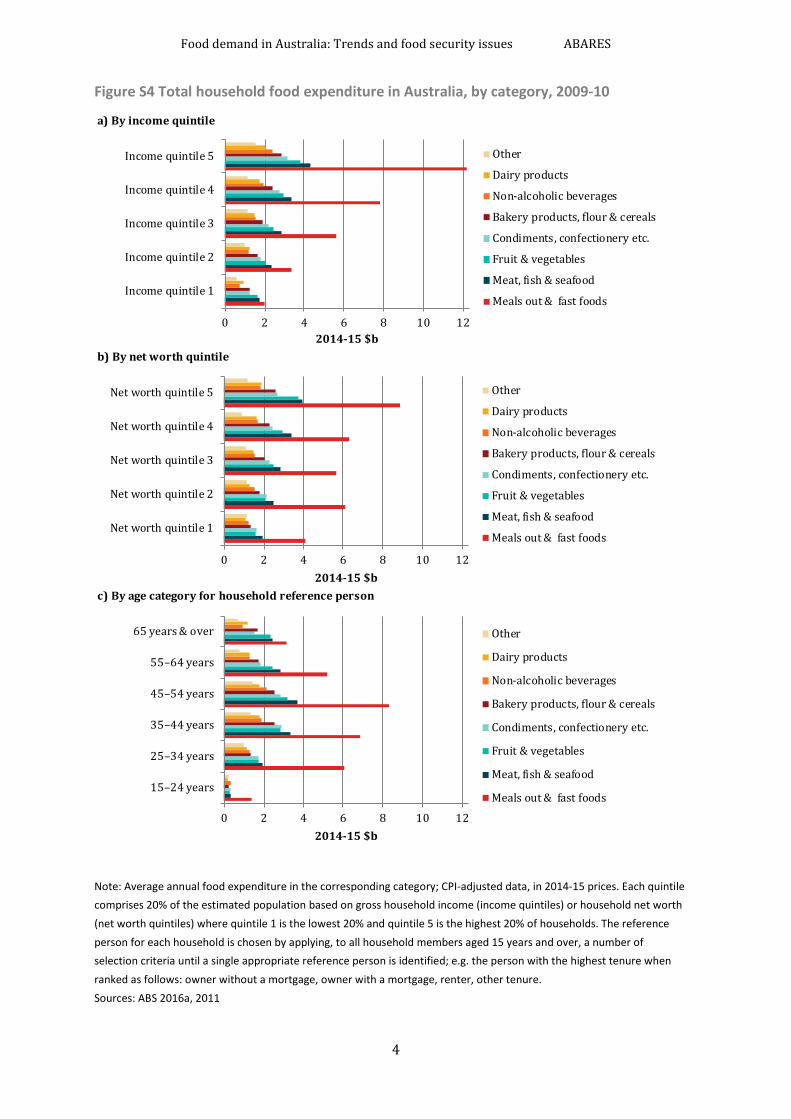
Patterns of food expenditure vary widely across households in Australia. This study highlights the importance of considering income, net assets and the age profile of the household reference person (main person in the household who is responsible for the dwelling) in assessing trends in food expenditure—see Figure S3 for household food expenditure per person and Figure S4 for total household food expenditure across each of these categories.
For example, older households (reference person is 65 years or older) may have relatively low income but significant wealth (net assets) that supports a significantly different pattern of food demand compared with other low income households. On a per person basis, average expenditure on fresh food is relatively high in older households, and comparable with (or higher than) average expenditure on fresh food in high income households; the main difference between these groups is expenditure on meals out and fast foods.
0 10 20 30 40
Other
Dairy products
Non-alcoholic beverages
Bakery products, flour & cereals
Condiments, confectionery etc.
Fruit & vegetables
Meat, fish & seafood
Meals out & fast foods
%
2009–10
1998–99
1988–89
Food demand in Australia: Trends and food security issues ABARES
3
Figure S3 Household food expenditure per person in Australia, by category, 2009-10
Note: Average annual food expenditure per person in the corresponding category; CPI-adjusted data, in 2014-15 prices. Each quintile comprises 20% of the estimated population based on gross household income (income quintiles) or household net worth (net worth quintiles) where quintile 1 is the lowest 20% and quintile 5 is the highest 20% of households. The reference person for each household is chosen by applying, to all household members aged 15 years and over, a number of selection criteria until a single appropriate reference person is identified; e.g. the person with the highest tenure when ranked as follows: owner without a mortgage, owner with a mortgage, renter, other tenure. Sources: ABS 2016a, 2011
a) By income quintile
b) By net worth quintile
c) By age category for household reference person
0 500 1000 1500 2000
Income quintile 1
Income quintile 2
Income quintile 3
Income quintile 4
Income quintile 5
2014-15 $
Other
Dairy products
Non-alcoholic beverages
Bakery products, flour & cereals
Condiments, confectionery etc.
Fruit & vegetables
Meat, fish & seafood
Meals out & fast foods
0 500 1000 1500 2000
Net worth quintile 1
Net worth quintile 2
Net worth quintile 3
Net worth quintile 4
Net worth quintile 5
2014-15 $
Other
Dairy products
Non-alcoholic beverages
Bakery products, flour & cereals
Condiments, confectionery etc.
Fruit & vegetables
Meat, fish & seafood
Meals out & fast foods
0 500 1000 1500 2000
15–24 years
25–34 years
35–44 years
45–54 years
55–64 years
65 years & over
2014-15 $
Other
Dairy products
Non-alcoholic beverages
Bakery products, flour & cereals
Condiments, confectionery etc.
Fruit & vegetables
Meat, fish & seafood
Meals out & fast foods
Food demand in Australia: Trends and food security issues ABARES
4
Figure S4 Total household food expenditure in Australia, by category, 2009-10
Note: Average annual food expenditure in the corresponding category; CPI-adjusted data, in 2014-15 prices. Each quintile comprises 20% of the estimated population based on gross household income (income quintiles) or household net worth (net worth quintiles) where quintile 1 is the lowest 20% and quintile 5 is the highest 20% of households. The reference person for each household is chosen by applying, to all household members aged 15 years and over, a number of selection criteria until a single appropriate reference person is identified; e.g. the person with the highest tenure when ranked as follows: owner without a mortgage, owner with a mortgage, renter, other tenure. Sources: ABS 2016a, 2011
a) By income quintile
b) By net worth quintile
c) By age category for household reference person
0 2 4 6 8 10 12
Income quintile 1
Income quintile 2
Income quintile 3
Income quintile 4
Income quintile 5
2014-15 $b
Other
Dairy products
Non-alcoholic beverages
Bakery products, flour & cereals
Condiments, confectionery etc.
Fruit & vegetables
Meat, fish & seafood
Meals out & fast foods
0 2 4 6 8 10 12
Net worth quintile 1
Net worth quintile 2
Net worth quintile 3
Net worth quintile 4
Net worth quintile 5
2014-15 $b
Other
Dairy products
Non-alcoholic beverages
Bakery products, flour & cereals
Condiments, confectionery etc.
Fruit & vegetables
Meat, fish & seafood
Meals out & fast foods
0 2 4 6 8 10 12
15–24 years
25–34 years
35–44 years
45–54 years
55–64 years
65 years & over
2014-15 $b
Other
Dairy products
Non-alcoholic beverages
Bakery products, flour & cereals
Condiments, confectionery etc.
Fruit & vegetables
Meat, fish & seafood
Meals out & fast foods
Food demand in Australia: Trends and food security issues ABARES
5
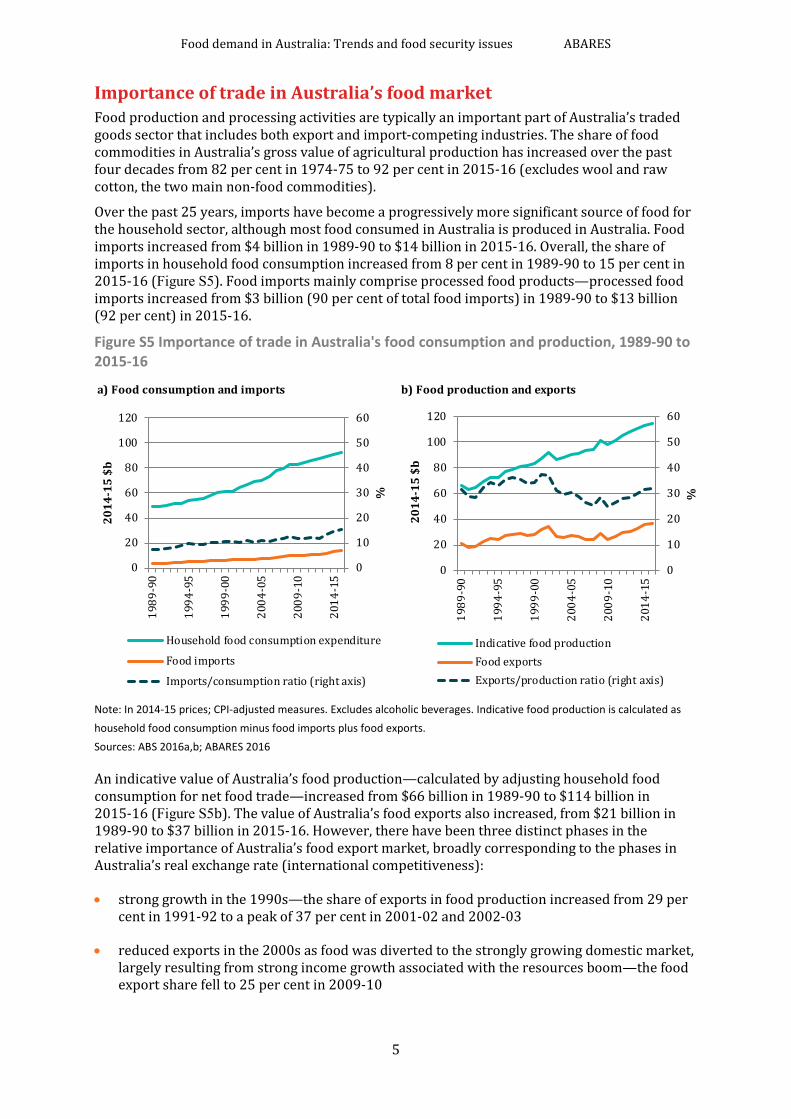
Importance of trade in Australia’s food market Food production and processing activities are typically an important part of Australia’s traded goods sector that includes both export and import-competing industries. The share of food commodities in Australia’s gross value of agricultural production has increased over the past four decades from 82 per cent in 1974-75 to 92 per cent in 2015-16 (excludes wool and raw cotton, the two main non-food commodities).
Over the past 25 years, imports have become a progressively more significant source of food for the household sector, although most food consumed in Australia is produced in Australia. Food imports increased from $4 billion in 1989-90 to $14 billion in 2015-16. Overall, the share of imports in household food consumption increased from 8 per cent in 1989-90 to 15 per cent in 2015-16 (Figure S5). Food imports mainly comprise processed food products—processed food imports increased from $3 billion (90 per cent of total food imports) in 1989-90 to $13 billion (92 per cent) in 2015-16.
Figure S5 Importance of trade in Australia's food consumption and production, 1989-90 to 2015-16
Note: In 2014-15 prices; CPI-adjusted measures. Excludes alcoholic beverages. Indicative food production is calculated as household food consumption minus food imports plus food exports. Sources: ABS 2016a,b; ABARES 2016
An indicative value of Australia’s food production—calculated by adjusting household food consumption for net food trade—increased from $66 billion in 1989-90 to $114 billion in 2015-16 (Figure S5b). The value of Australia’s food exports also increased, from $21 billion in 1989-90 to $37 billion in 2015-16. However, there have been three distinct phases in the relative importance of Australia’s food export market, broadly corresponding to the phases in Australia’s real exchange rate (international competitiveness):
• strong growth in the 1990s—the share of exports in food production increased from 29 per cent in 1991-92 to a peak of 37 per cent in 2001-02 and 2002-03
• reduced exports in the 2000s as food was diverted to the strongly growing domestic market, largely resulting from strong income growth associated with the resources boom—the food export share fell to 25 per cent in 2009-10
a) Food consumption and imports b) Food production and exports
0
10
20
30
40
50
60
0
20
40
60
80
100
120
1989
-90
1994
-95
1999
-00
2004
-05
2009
-10
2014
-15
%
2014
-15
$b
Household food consumption expenditure
Food imports
Imports/consumption ratio (right axis)
0
10
20
30
40
50
60
0
20
40
60
80
100
120
1989
-90
1994
-95
1999
-00
2004
-05
2009
-10
2014
-15
%
2014
-15
$b
Indicative food productionFood exportsExports/production ratio (right axis)
Food demand in Australia: Trends and food security issues ABARES
6
• a resumption of strong export growth in the first half of the 2010s associated with the fall in the real exchange rate and slower growth in domestic food demand—the food export share increased to 32 per cent in 2015-16.
Overall, net food exports were $22 billion in 2015-16, indicating Australia continues to have an important international competitive advantage in food trade. In 2015-16, Australia was a significant net importer in six categories: seafood; processed fruit and vegetables; soft drink, cordials and syrups; confectionary; bakery products; and oils and fats.
Issues This report briefly examines key factors in Australia’s policy approach that underpin Australia’s high level of food security. One of the most important roles of government is to ensure the food security of the population. In general terms, food security refers to the adequate and reliable provision of food that is safe, nutritious and affordable. In aggregate, as a net food exporter, Australia produces food in excess of domestic requirements. Key domestic food security concerns relate to food access and use for low income people, particularly in regional and remote areas. Governments also have an important role in ensuring people have access to adequate food in emergency situations following natural disasters such as floods and bushfires.
From an economic perspective, governments aim to address market failures and achieve distributional goals. The tax-transfer system is a key component of the overarching policy framework that contributes to Australia’s high level of food security. Two mechanisms that are significant contributors to food security are:
• income support to low-income households through transfer payments, and
• exemption of fresh food in the goods and services tax (GST).
The economic justification for transfer payments to low-income households is based on equity considerations. In 2009-10, government pensions and allowances were the main source of income in 25 per cent of total households covering 20 per cent of the total population. Income support enabled people in these households, on average, to purchase food close to Australia’s average in all categories except for meals out and fast food. In aggregate, food expenditure by these households was $15 billion, accounting for 15 per cent of total food expenditure in 2009-10. This group of households is most important for dairy products (19 per cent of total expenditure on dairy products) and least important for meals out and fast foods (8 per cent of total expenditure in this category).
Fresh food is exempt in Australia’s goods and services tax (GST), reducing the consumer price of fresh food (all else constant). There are two economic implications of exempting fresh food in the GST relating to key food security concerns across households.
• Equity implications—complementing the transfer system by reducing the tax burden in low-income households; meat, fish and seafood, and fruit and vegetables are major food expenditure categories, on average, for people in households that are highly reliant on income transfers.
• Encouraging the consumption of fresh food—consumption of nutritious fresh food has important positive health benefits for people (positive externalities), reducing future health costs to the individual and society overall (all else constant).
Broad-based consumption taxes—referred to as a value added tax (VAT) or a goods and services tax (GST)—apply in 34 of 35 OECD countries. A wide range of VAT rates and coverage apply across OECD countries, but exemptions or reduced rates for food apply in 28 OECD countries. For example, VAT exemptions for food apply in the United Kingdom where the standard VAT
Food demand in Australia: Trends and food security issues ABARES
7
rate is 20 per cent, and in Canada (for basic groceries) where the standard VAT rate is 5 per cent. By contrast, New Zealand applies a broad-based consumption tax to nearly all goods and services, including food, at a rate of 15 per cent.
In addition to income and food prices, the tastes and preferences of individuals are important economic influences on consumer food choices. An important aspect of information market failure occurs when consumers are not fully informed about the quality attributes of a product or the health implications of food choices. Australian governments have had a major role in developing two important food labels that provide consumers with information about food nutrition.
• Nutrition label—a relatively detailed guide to the nutrition content of a food product; a nutrition information panel is included on most food products.
• Health star rating label—a summary guide to the nutrition content of a food product, implemented since June 2014 on a voluntary basis by the food industry; the health star rating is a front-of-pack labelling system that rates the overall nutritional profile of packaged food and assigns it a rating from ½ a star to 5 stars where a higher star rating indicates a healthier food option.
The education system also contributes to consumer understanding of healthy food choices over the longer term in two ways—by teaching nutrition as part of the school curriculum, and by providing a range of healthy food options in school canteens. For example, in February 2017, the NSW Government released a new healthy schools canteen strategy whereby 75 per cent of canteen menus must comprise healthy food options (such as fruits, vegetables, sandwiches, pastas and stir fries), while the remaining food options require a health star rating of 3.5 stars or higher.
Conclusion The domestic market is important for Australia’s food producers including farmers, food processors and food service providers. Food expenditure per person tends to be higher, on average, in households with higher incomes—notably, the share of total food expenditure spent on meals out and fast foods is significantly higher for households with higher incomes. By contrast, the distribution of food expenditure is broadly similar across household groups based on net worth—that is, households with high net worth spend relatively more on food in aggregate, but the shares spent on the main food categories are broadly similar.
The food industry supplies a broad range of food products and services in response to food demand in different segments of the domestic market. There is ongoing innovation by the food industry to increase the efficiency and effectiveness of the food supply chain, including to enhance further Australia’s high level of food security. For example, major food retailers have developed product lines to sell imperfect fruit and vegetables at lower prices. Patterns of food expenditure indicate there are also likely to be ongoing economic opportunities to obtain a price premium for reliable food quality attributes.
Food demand in Australia: Trends and food security issues ABARES
8
1 Introduction In recent years, ABARES has undertaken research programs that focus on two key economic aspects of Australia’s food exports.
• World food demand to 2050 and implications for Australia’s food exports—the world’s long-term food requirements are likely to be substantial, particularly as the world population is projected to increase from around 7 billion in 2011 to 9.3 billion in 2050 and 10.1 billion in 2100 (UN 2011; medium variant; HLPE 2011). ABARES projections indicate that world agrifood consumption and imports are likely to increase markedly to 2050, with relatively strong growth in food demand in the Asian region (see, for example, Gunning-Trant et al. 2015; Hamshere et al. 2014 a,b; ABARES 2013; Linehan et al. 2013, 2012 a,b).
• Efficiency of Australia’s infrastructure and food export supply chains—ensuring Australia’s infrastructure and biosecurity systems allow food producers, processors and exporters to move food cost-effectively and efficiently to destination markets is a key to realising potential new and expanded export market opportunities. A preliminary economic assessment was released in November 2013 (Nguyen et al. 2013), followed by studies on Australia’s airfreight food exports (Hogan and Morey 2014), Australia’s wheat industry (Nguyen et al. 2015) and Australia’s beef industry (Goesch et al. 2015). Some background information on the farm-to-retail price spread and farm share in food supply chains in Australia is provided in Nguyen et al. (2016).
To complement these research programs, this report examines trends and issues in Australia’s food demand. Food is a necessity good overall, although food products may vary widely in terms of price and quality. In 2015-16, household food consumption expenditure in Australia was $92 billion, accounting for 10 per cent of total household consumption expenditure (in 2014-15 prices; ABS 2016a,b). In this report, unless otherwise specified, food excludes alcoholic beverages and, for consistency with ABS national accounts data, all real values are given in 2014-15 prices. Definitions of household food consumption expenditure and related measures are given in appendix A.
The structure of the report is as follows.
• Trends (chapters 2-4)—chapter 2 briefly examines long-term trends in household food consumption expenditure, including indicative projections to 2049-50; chapter 3 examines household food consumption in more detail using household expenditure survey data; and chapter 4 examines the importance of trade in Australia’s food market.
• Issues (chapter 5)—chapter 5 briefly examines economic issues relevant to food demand in Australia with a focus on key factors in the policy approach that underpin Australia’s high level of food security.
Some concluding comments are provided in chapter 6.
Food demand in Australia: Trends and food security issues ABARES
9
2 Long-term trends in Australia’s household food consumption
This chapter briefly examines historical trends in Australia’s household food consumption and three important influences on food demand: population, food prices and household incomes. Indicative projections to 2049-50 are also provided.
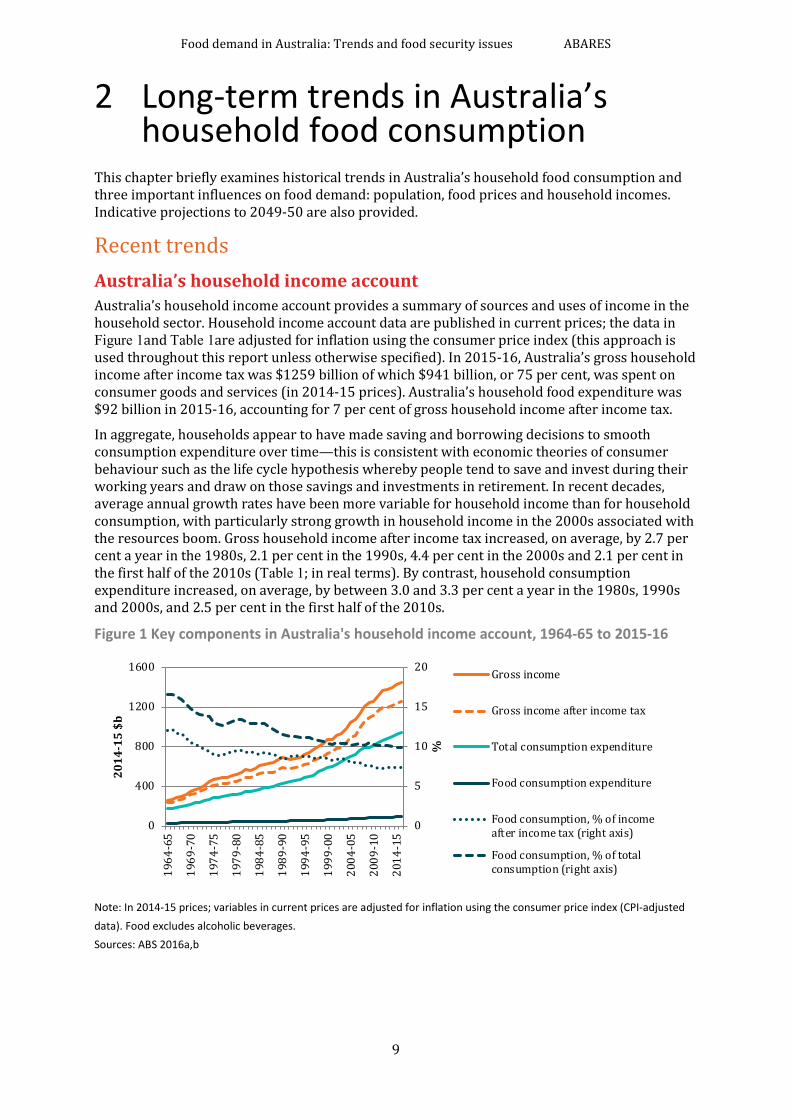
Recent trends Australia’s household income account Australia’s household income account provides a summary of sources and uses of income in the household sector. Household income account data are published in current prices; the data in Figure 1and Table 1are adjusted for inflation using the consumer price index (this approach is used throughout this report unless otherwise specified). In 2015-16, Australia’s gross household income after income tax was $1259 billion of which $941 billion, or 75 per cent, was spent on consumer goods and services (in 2014-15 prices). Australia’s household food expenditure was $92 billion in 2015-16, accounting for 7 per cent of gross household income after income tax.
In aggregate, households appear to have made saving and borrowing decisions to smooth consumption expenditure over time—this is consistent with economic theories of consumer behaviour such as the life cycle hypothesis whereby people tend to save and invest during their working years and draw on those savings and investments in retirement. In recent decades, average annual growth rates have been more variable for household income than for household consumption, with particularly strong growth in household income in the 2000s associated with the resources boom. Gross household income after income tax increased, on average, by 2.7 per cent a year in the 1980s, 2.1 per cent in the 1990s, 4.4 per cent in the 2000s and 2.1 per cent in the first half of the 2010s (Table 1; in real terms). By contrast, household consumption expenditure increased, on average, by between 3.0 and 3.3 per cent a year in the 1980s, 1990s and 2000s, and 2.5 per cent in the first half of the 2010s.
Figure 1 Key components in Australia's household income account, 1964-65 to 2015-16
Note: In 2014-15 prices; variables in current prices are adjusted for inflation using the consumer price index (CPI-adjusted data). Food excludes alcoholic beverages. Sources: ABS 2016a,b
0
5
10
15
20
0
400
800
1200
1600
1964
-65
1969
-70
1974
-75
1979
-80
1984
-85
1989
-90
1994
-95
1999
-00
2004
-05
2009
-10
2014
-15
%
2014
-15
$b
Gross income
Gross income after income tax
Total consumption expenditure
Food consumption expenditure
Food consumption, % of incomeafter income tax (right axis)
Food consumption, % of totalconsumption (right axis)
Food demand in Australia: Trends and food security issues ABARES
10
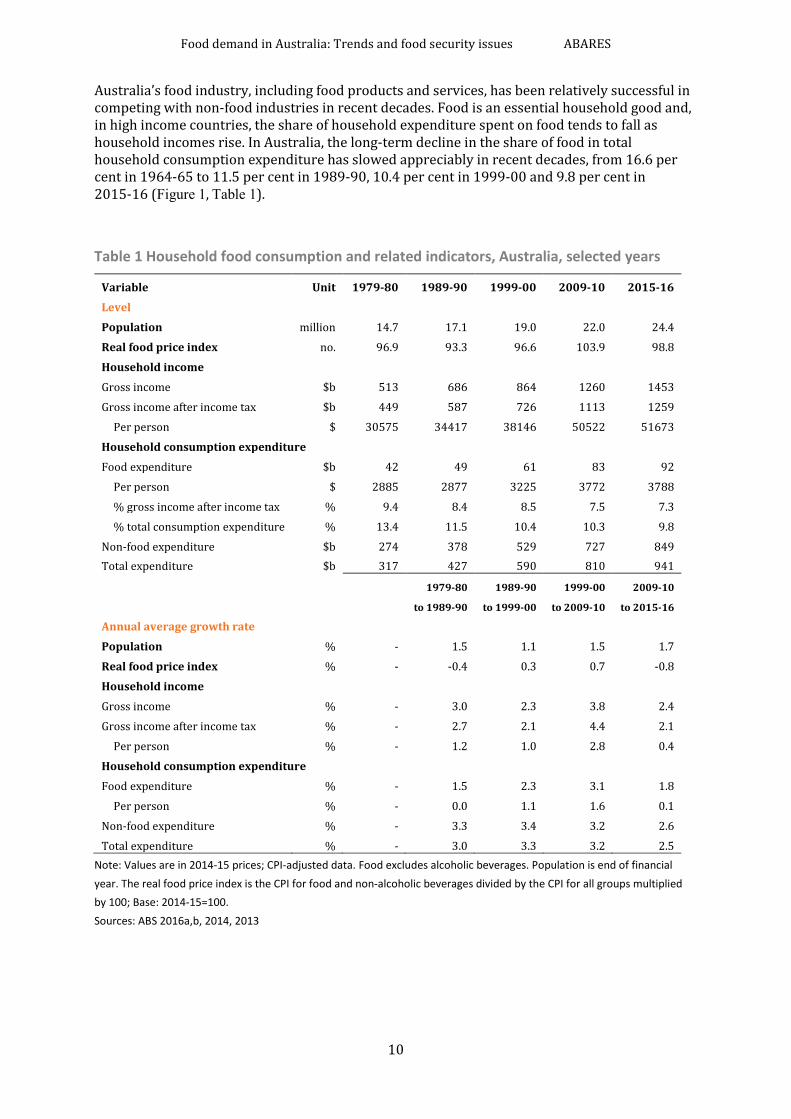
Australia’s food industry, including food products and services, has been relatively successful in competing with non-food industries in recent decades. Food is an essential household good and, in high income countries, the share of household expenditure spent on food tends to fall as household incomes rise. In Australia, the long-term decline in the share of food in total household consumption expenditure has slowed appreciably in recent decades, from 16.6 per cent in 1964-65 to 11.5 per cent in 1989-90, 10.4 per cent in 1999-00 and 9.8 per cent in 2015-16 (Figure 1, Table 1).
Table 1 Household food consumption and related indicators, Australia, selected years
Variable Unit 1979-80 1989-90 1999-00 2009-10 2015-16 Level Population million 14.7 17.1 19.0 22.0 24.4 Real food price index no. 96.9 93.3 96.6 103.9 98.8 Household income Gross income $b 513 686 864 1260 1453 Gross income after income tax $b 449 587 726 1113 1259
Per person $ 30575 34417 38146 50522 51673 Household consumption expenditure Food expenditure $b 42 49 61 83 92
Per person $ 2885 2877 3225 3772 3788 % gross income after income tax % 9.4 8.4 8.5 7.5 7.3 % total consumption expenditure % 13.4 11.5 10.4 10.3 9.8
Non-food expenditure $b 274 378 529 727 849 Total expenditure $b 317 427 590 810 941
1979-80 1989-90 1999-00 2009-10
to 1989-90 to 1999-00 to 2009-10 to 2015-16
Annual average growth rate Population % - 1.5 1.1 1.5 1.7 Real food price index % - -0.4 0.3 0.7 -0.8 Household income Gross income % - 3.0 2.3 3.8 2.4 Gross income after income tax % - 2.7 2.1 4.4 2.1
Per person % - 1.2 1.0 2.8 0.4 Household consumption expenditure Food expenditure % - 1.5 2.3 3.1 1.8
Per person % - 0.0 1.1 1.6 0.1 Non-food expenditure % - 3.3 3.4 3.2 2.6 Total expenditure % - 3.0 3.3 3.2 2.5
Note: Values are in 2014-15 prices; CPI-adjusted data. Food excludes alcoholic beverages. Population is end of financial year. The real food price index is the CPI for food and non-alcoholic beverages divided by the CPI for all groups multiplied by 100; Base: 2014-15=100. Sources: ABS 2016a,b, 2014, 2013
Food demand in Australia: Trends and food security issues ABARES
11
Food demand and consumption The terms food demand and food consumption are often used interchangeably but, from an economic perspective, it can be useful to distinguish between these terms. Food consumption is the market outcome based on demand and supply conditions, including international trade. The food demand curve, also referred to as the marginal benefit curve, indicates the willingness of consumers to pay for an additional quantity of food. Consumers are assumed to demand food provided the price does not exceed the marginal benefit of purchasing the food.
At a minimum, food is required to meet the basic nutrition and energy needs of people. Food demand is influenced by factors such as the population, household income, food prices, food quality, and consumer tastes and preferences (including lifestyle choices). Estimates of the responsiveness of food demand in Australia to changes in price, income and expenditure—referred to as food demand elasticities—are presented in appendix B. For example, a USDA study provides food demand elasticity estimates for Australia (Muhammad et al. 2011).
• Price elasticity of demand—measures the percentage change in demand for a good when the real price of the good increases by 1 per cent (all else constant); for example, demand for food, beverages and tobacco in Australia is estimated to fall (rise) by 0.3 per cent if the real price increases (decreases) by 1 per cent.
• Income elasticity of demand—measures the percentage change in demand for a good when real consumer income increases by 1 per cent (all else constant); for example, demand for food, beverages and tobacco in Australia is estimated to increase by 0.5 per cent if real income increases by 1 per cent.
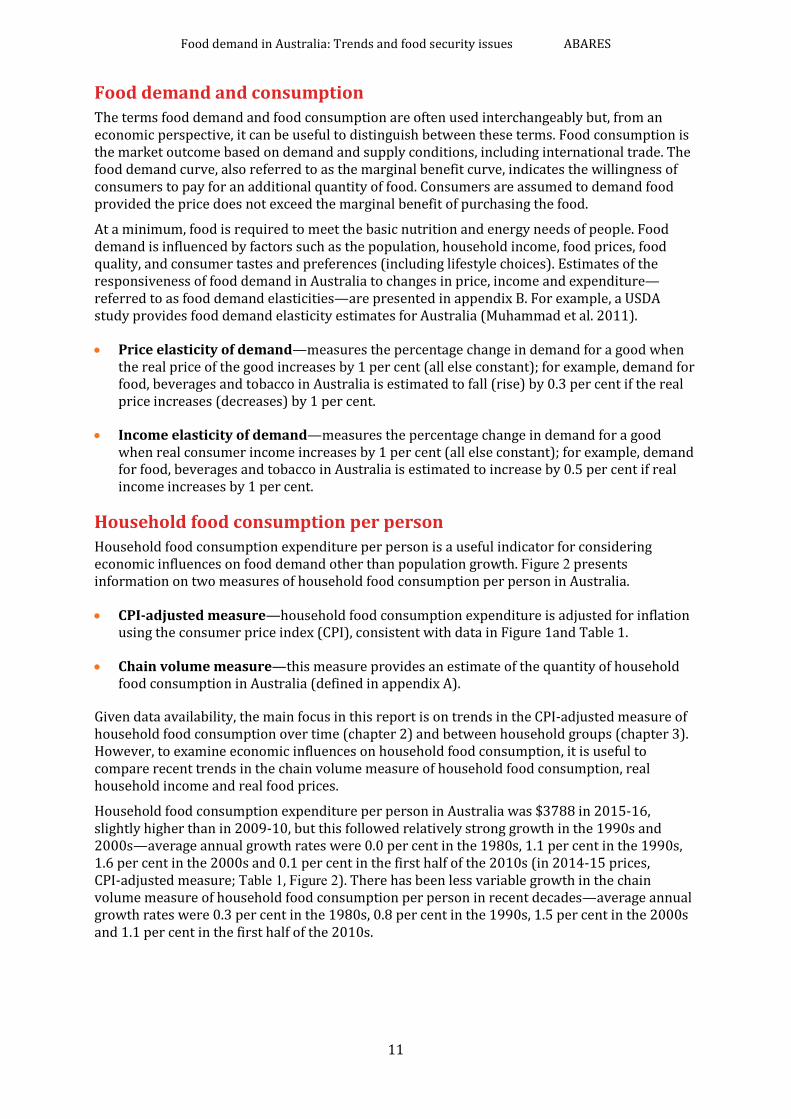
Household food consumption per person Household food consumption expenditure per person is a useful indicator for considering economic influences on food demand other than population growth. Figure 2 presents information on two measures of household food consumption per person in Australia.
• CPI-adjusted measure—household food consumption expenditure is adjusted for inflation using the consumer price index (CPI), consistent with data in Figure 1and Table 1.
• Chain volume measure—this measure provides an estimate of the quantity of household food consumption in Australia (defined in appendix A).
Given data availability, the main focus in this report is on trends in the CPI-adjusted measure of household food consumption over time (chapter 2) and between household groups (chapter 3). However, to examine economic influences on household food consumption, it is useful to compare recent trends in the chain volume measure of household food consumption, real household income and real food prices.
Household food consumption expenditure per person in Australia was $3788 in 2015-16, slightly higher than in 2009-10, but this followed relatively strong growth in the 1990s and 2000s—average annual growth rates were 0.0 per cent in the 1980s, 1.1 per cent in the 1990s, 1.6 per cent in the 2000s and 0.1 per cent in the first half of the 2010s (in 2014-15 prices, CPI-adjusted measure; Table 1, Figure 2). There has been less variable growth in the chain volume measure of household food consumption per person in recent decades—average annual growth rates were 0.3 per cent in the 1980s, 0.8 per cent in the 1990s, 1.5 per cent in the 2000s and 1.1 per cent in the first half of the 2010s.
Food demand in Australia: Trends and food security issues ABARES
12
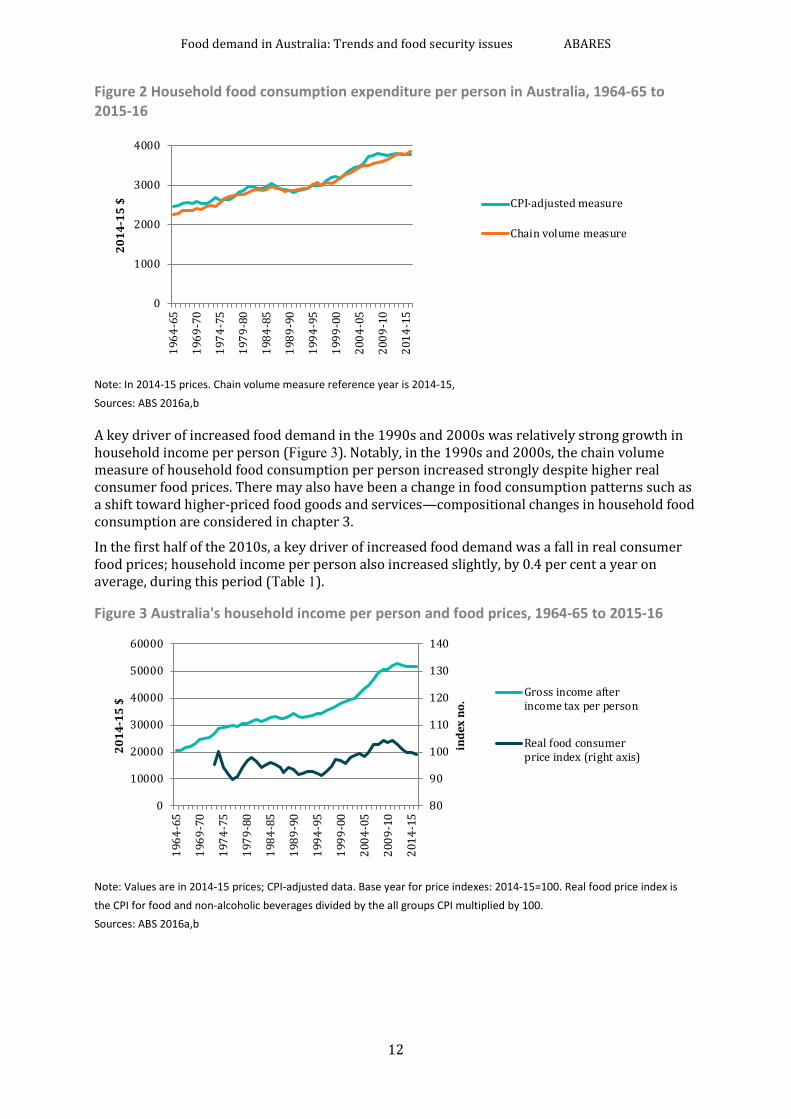
Figure 2 Household food consumption expenditure per person in Australia, 1964-65 to 2015-16
Note: In 2014-15 prices. Chain volume measure reference year is 2014-15, Sources: ABS 2016a,b
A key driver of increased food demand in the 1990s and 2000s was relatively strong growth in household income per person (Figure 3). Notably, in the 1990s and 2000s, the chain volume measure of household food consumption per person increased strongly despite higher real consumer food prices. There may also have been a change in food consumption patterns such as a shift toward higher-priced food goods and services—compositional changes in household food consumption are considered in chapter 3.
In the first half of the 2010s, a key driver of increased food demand was a fall in real consumer food prices; household income per person also increased slightly, by 0.4 per cent a year on average, during this period (Table 1).
Figure 3 Australia's household income per person and food prices, 1964-65 to 2015-16
Note: Values are in 2014-15 prices; CPI-adjusted data. Base year for price indexes: 2014-15=100. Real food price index is the CPI for food and non-alcoholic beverages divided by the all groups CPI multiplied by 100. Sources: ABS 2016a,b
0
1000
2000
3000
4000
1964
-65
1969
-70
1974
-75
1979
-80
1984
-85
1989
-90
1994
-95
1999
-00
2004
-05
2009
-10
2014
-15
2014
-15
$ CPI-adjusted measure
Chain volume measure
80
90
100
110
120
130
140
0
10000
20000
30000
40000
50000
60000
1964
-65
1969
-70
1974
-75
1979
-80
1984
-85
1989
-90
1994
-95
1999
-00
2004
-05
2009
-10
2014
-15
inde
x no
.
2014
-15
$
Gross income afterincome tax per person
Real food consumerprice index (right axis)
Food demand in Australia: Trends and food security issues ABARES
13
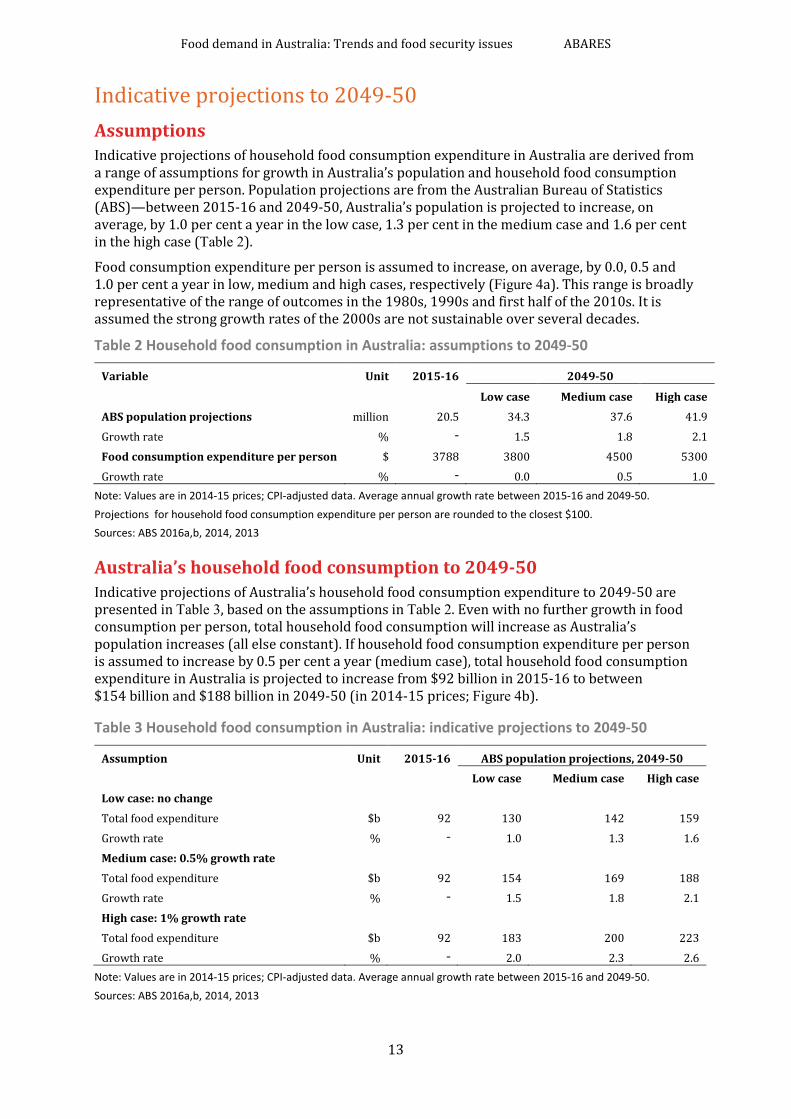
Indicative projections to 2049-50 Assumptions Indicative projections of household food consumption expenditure in Australia are derived from a range of assumptions for growth in Australia’s population and household food consumption expenditure per person. Population projections are from the Australian Bureau of Statistics (ABS)—between 2015-16 and 2049-50, Australia’s population is projected to increase, on average, by 1.0 per cent a year in the low case, 1.3 per cent in the medium case and 1.6 per cent in the high case (Table 2).
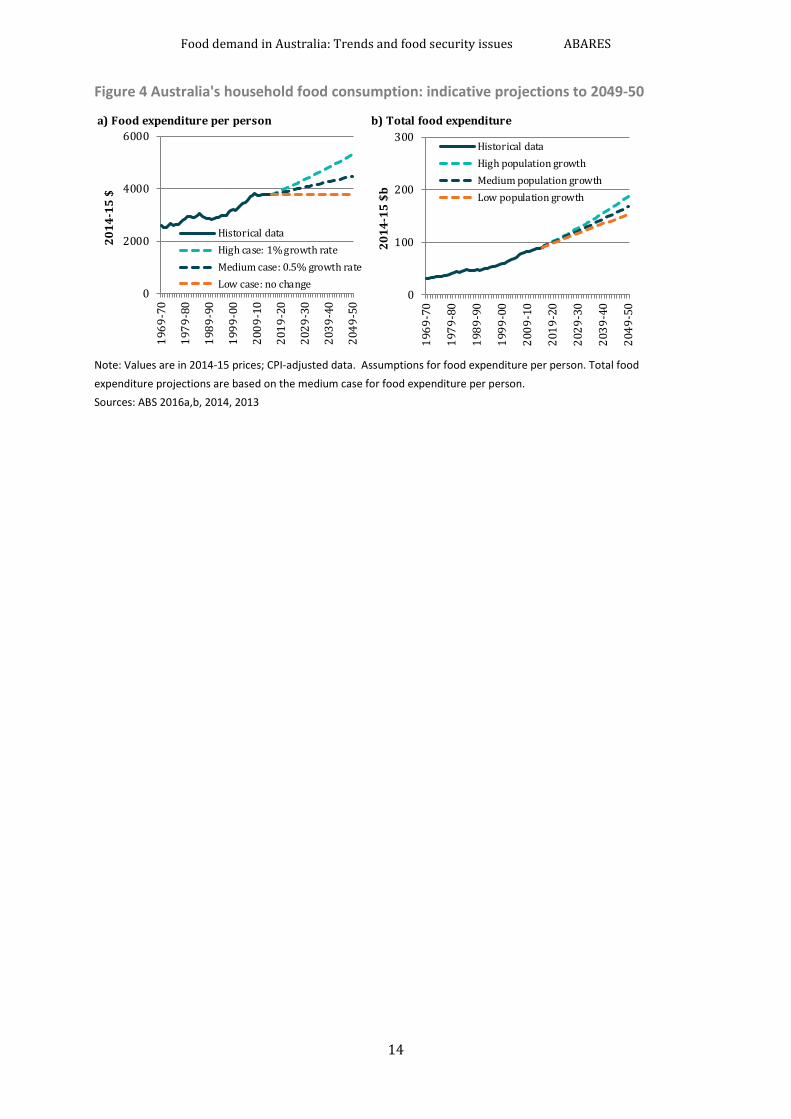
Food consumption expenditure per person is assumed to increase, on average, by 0.0, 0.5 and 1.0 per cent a year in low, medium and high cases, respectively (Figure 4a). This range is broadly representative of the range of outcomes in the 1980s, 1990s and first half of the 2010s. It is assumed the strong growth rates of the 2000s are not sustainable over several decades.
Table 2 Household food consumption in Australia: assumptions to 2049-50
Variable Unit 2015-16 2049-50
Low case Medium case High case ABS population projections million 20.5 34.3 37.6 41.9 Growth rate % - 1.5 1.8 2.1 Food consumption expenditure per person $ 3788 3800 4500 5300 Growth rate % - 0.0 0.5 1.0
Note: Values are in 2014-15 prices; CPI-adjusted data. Average annual growth rate between 2015-16 and 2049-50. Projections for household food consumption expenditure per person are rounded to the closest $100. Sources: ABS 2016a,b, 2014, 2013
Australia’s household food consumption to 2049-50 Indicative projections of Australia’s household food consumption expenditure to 2049-50 are presented in Table 3, based on the assumptions in Table 2. Even with no further growth in food consumption per person, total household food consumption will increase as Australia’s population increases (all else constant). If household food consumption expenditure per person is assumed to increase by 0.5 per cent a year (medium case), total household food consumption expenditure in Australia is projected to increase from $92 billion in 2015-16 to between $154 billion and $188 billion in 2049-50 (in 2014-15 prices; Figure 4b).
Table 3 Household food consumption in Australia: indicative projections to 2049-50
Assumption Unit 2015-16 ABS population projections, 2049-50
Low case Medium case High case Low case: no change Total food expenditure $b 92 130 142 159 Growth rate % - 1.0 1.3 1.6 Medium case: 0.5% growth rate Total food expenditure $b 92 154 169 188 Growth rate % - 1.5 1.8 2.1 High case: 1% growth rate Total food expenditure $b 92 183 200 223 Growth rate % - 2.0 2.3 2.6
Note: Values are in 2014-15 prices; CPI-adjusted data. Average annual growth rate between 2015-16 and 2049-50. Sources: ABS 2016a,b, 2014, 2013
Food demand in Australia: Trends and food security issues ABARES
14
Figure 4 Australia's household food consumption: indicative projections to 2049-50
Note: Values are in 2014-15 prices; CPI-adjusted data. Assumptions for food expenditure per person. Total food expenditure projections are based on the medium case for food expenditure per person. Sources: ABS 2016a,b, 2014, 2013
a) Food expenditure per person b) Total food expenditure
0
100
200
300
1969
-70
1979
-80
1989
-90
1999
-00
2009
-10
2019
-20
2029
-30
2039
-40
2049
-50
2014
-15
$b
Historical dataHigh population growthMedium population growthLow population growth
0
2000
4000
6000
1969
-70
1979
-80
1989
-90
1999
-00
2009
-10
2019
-20
2029
-30
2039
-40
2049
-50
2014
-15
$
Historical dataHigh case: 1% growth rateMedium case: 0.5% growth rateLow case: no change
Food demand in Australia: Trends and food security issues ABARES
15
3 Household characteristics and food expenditure in Australia
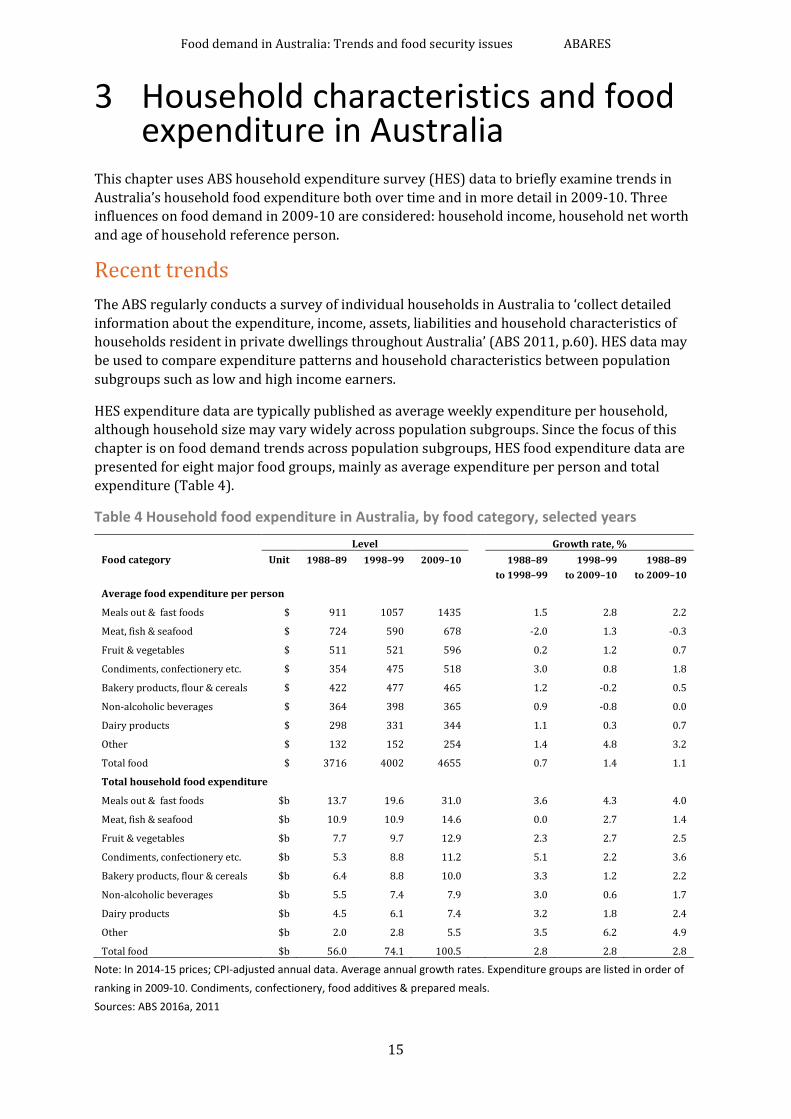
This chapter uses ABS household expenditure survey (HES) data to briefly examine trends in Australia’s household food expenditure both over time and in more detail in 2009-10. Three influences on food demand in 2009-10 are considered: household income, household net worth and age of household reference person.
Recent trends The ABS regularly conducts a survey of individual households in Australia to ‘collect detailed information about the expenditure, income, assets, liabilities and household characteristics of households resident in private dwellings throughout Australia’ (ABS 2011, p.60). HES data may be used to compare expenditure patterns and household characteristics between population subgroups such as low and high income earners.
HES expenditure data are typically published as average weekly expenditure per household, although household size may vary widely across population subgroups. Since the focus of this chapter is on food demand trends across population subgroups, HES food expenditure data are presented for eight major food groups, mainly as average expenditure per person and total expenditure (Table 4).
Table 4 Household food expenditure in Australia, by food category, selected years
Level Growth rate, % Food category Unit 1988–89 1998–99 2009–10 1988–89 1998–99 1988–89
to 1998–99 to 2009–10 to 2009–10
Average food expenditure per person
Meals out & fast foods $ 911 1057 1435 1.5 2.8 2.2
Meat, fish & seafood $ 724 590 678 -2.0 1.3 -0.3
Fruit & vegetables $ 511 521 596 0.2 1.2 0.7
Condiments, confectionery etc. $ 354 475 518 3.0 0.8 1.8
Bakery products, flour & cereals $ 422 477 465 1.2 -0.2 0.5
Non-alcoholic beverages $ 364 398 365 0.9 -0.8 0.0
Dairy products $ 298 331 344 1.1 0.3 0.7
Other $ 132 152 254 1.4 4.8 3.2
Total food $ 3716 4002 4655 0.7 1.4 1.1
Total household food expenditure
Meals out & fast foods $b 13.7 19.6 31.0 3.6 4.3 4.0
Meat, fish & seafood $b 10.9 10.9 14.6 0.0 2.7 1.4
Fruit & vegetables $b 7.7 9.7 12.9 2.3 2.7 2.5
Condiments, confectionery etc. $b 5.3 8.8 11.2 5.1 2.2 3.6
Bakery products, flour & cereals $b 6.4 8.8 10.0 3.3 1.2 2.2
Non-alcoholic beverages $b 5.5 7.4 7.9 3.0 0.6 1.7
Dairy products $b 4.5 6.1 7.4 3.2 1.8 2.4
Other $b 2.0 2.8 5.5 3.5 6.2 4.9
Total food $b 56.0 74.1 100.5 2.8 2.8 2.8
Note: In 2014-15 prices; CPI-adjusted annual data. Average annual growth rates. Expenditure groups are listed in order of ranking in 2009-10. Condiments, confectionery, food additives & prepared meals. Sources: ABS 2016a, 2011
Food demand in Australia: Trends and food security issues ABARES
16
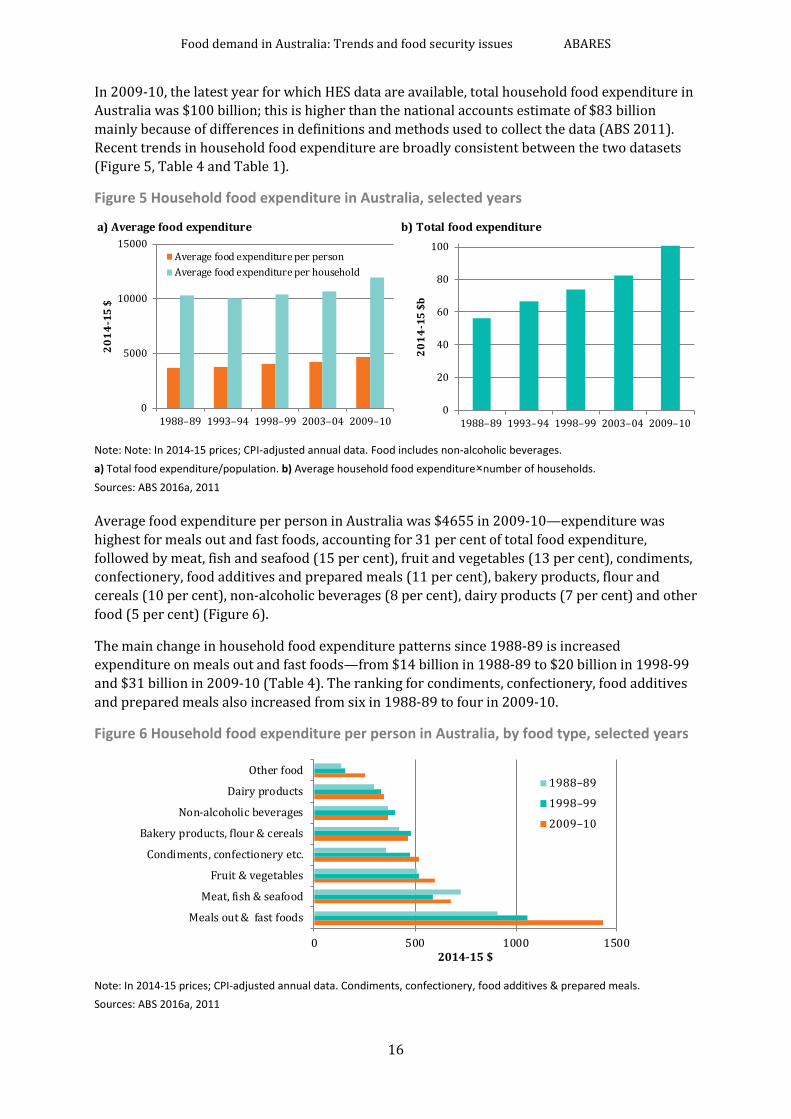
In 2009-10, the latest year for which HES data are available, total household food expenditure in Australia was $100 billion; this is higher than the national accounts estimate of $83 billion mainly because of differences in definitions and methods used to collect the data (ABS 2011). Recent trends in household food expenditure are broadly consistent between the two datasets (Figure 5, Table 4 and Table 1).
Figure 5 Household food expenditure in Australia, selected years
Note: Note: In 2014-15 prices; CPI-adjusted annual data. Food includes non-alcoholic beverages. a) Total food expenditure/population. b) Average household food expenditurenumber of households. Sources: ABS 2016a, 2011
Average food expenditure per person in Australia was $4655 in 2009-10—expenditure was highest for meals out and fast foods, accounting for 31 per cent of total food expenditure, followed by meat, fish and seafood (15 per cent), fruit and vegetables (13 per cent), condiments, confectionery, food additives and prepared meals (11 per cent), bakery products, flour and cereals (10 per cent), non-alcoholic beverages (8 per cent), dairy products (7 per cent) and other food (5 per cent) (Figure 6).
The main change in household food expenditure patterns since 1988-89 is increased expenditure on meals out and fast foods—from $14 billion in 1988-89 to $20 billion in 1998-99 and $31 billion in 2009-10 (Table 4). The ranking for condiments, confectionery, food additives and prepared meals also increased from six in 1988-89 to four in 2009-10.
Figure 6 Household food expenditure per person in Australia, by food type, selected years
Note: In 2014-15 prices; CPI-adjusted annual data. Condiments, confectionery, food additives & prepared meals. Sources: ABS 2016a, 2011
a) Average food expenditure b) Total food expenditure
0
20
40
60
80
100
1988–89 1993–94 1998–99 2003–04 2009–1020
14-1
5 $b
0
5000
10000
15000
1988–89 1993–94 1998–99 2003–04 2009–10
2014
-15
$
Average food expenditure per personAverage food expenditure per household
0 500 1000 1500
Meals out & fast foods
Meat, fish & seafood
Fruit & vegetables
Condiments, confectionery etc.
Bakery products, flour & cereals
Non-alcoholic beverages
Dairy products
Other food
2014-15 $
1988–89
1998–99
2009–10
Food demand in Australia: Trends and food security issues ABARES
17
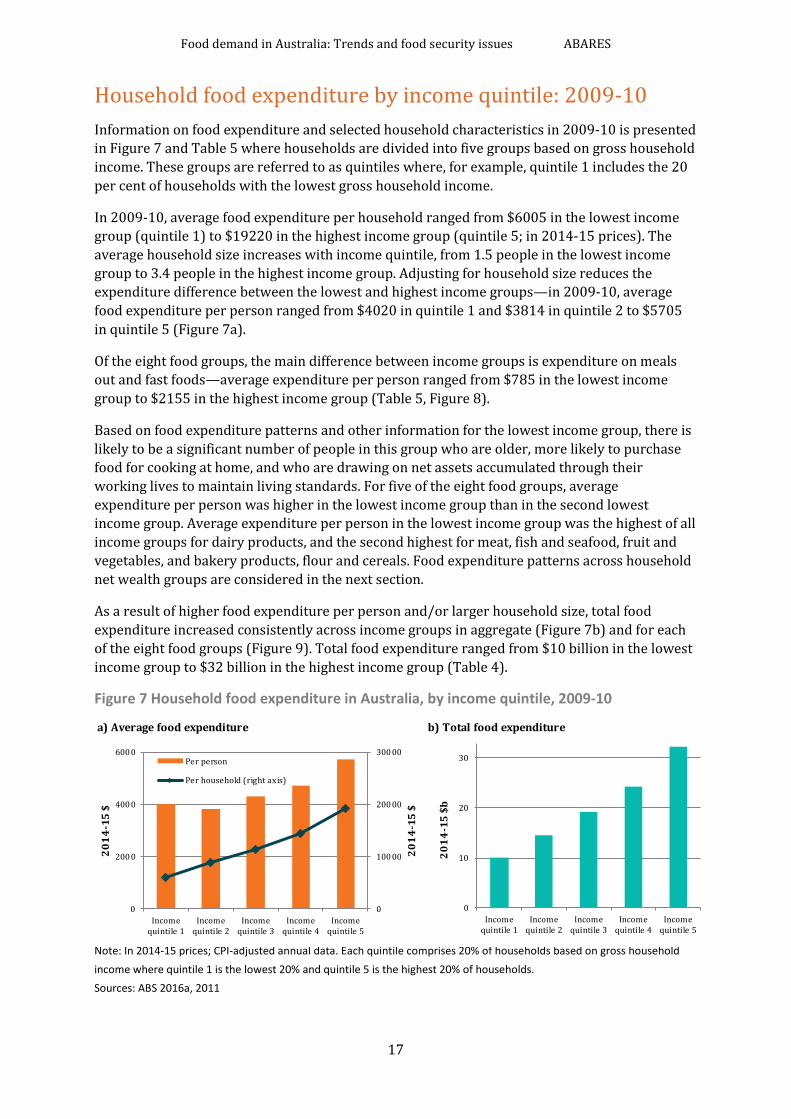
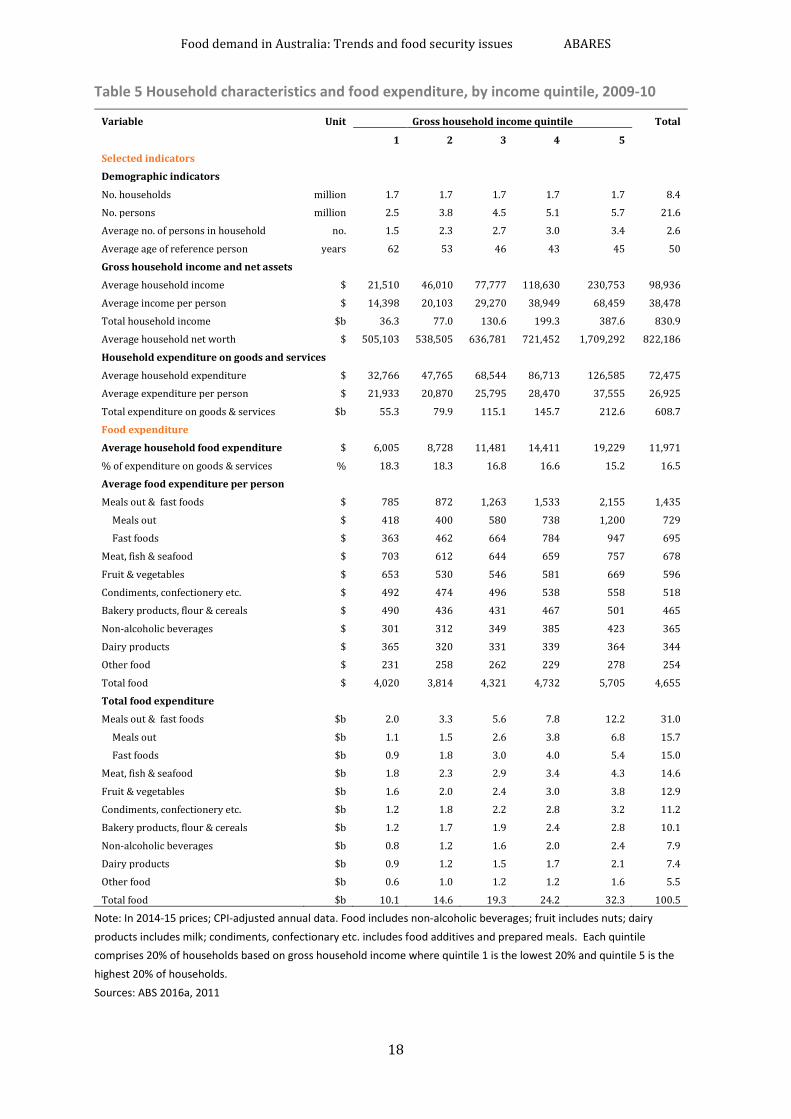
Household food expenditure by income quintile: 2009-10 Information on food expenditure and selected household characteristics in 2009-10 is presented in Figure 7 and Table 5 where households are divided into five groups based on gross household income. These groups are referred to as quintiles where, for example, quintile 1 includes the 20 per cent of households with the lowest gross household income.
In 2009-10, average food expenditure per household ranged from $6005 in the lowest income group (quintile 1) to $19220 in the highest income group (quintile 5; in 2014-15 prices). The average household size increases with income quintile, from 1.5 people in the lowest income group to 3.4 people in the highest income group. Adjusting for household size reduces the expenditure difference between the lowest and highest income groups—in 2009-10, average food expenditure per person ranged from $4020 in quintile 1 and $3814 in quintile 2 to $5705 in quintile 5 (Figure 7a).
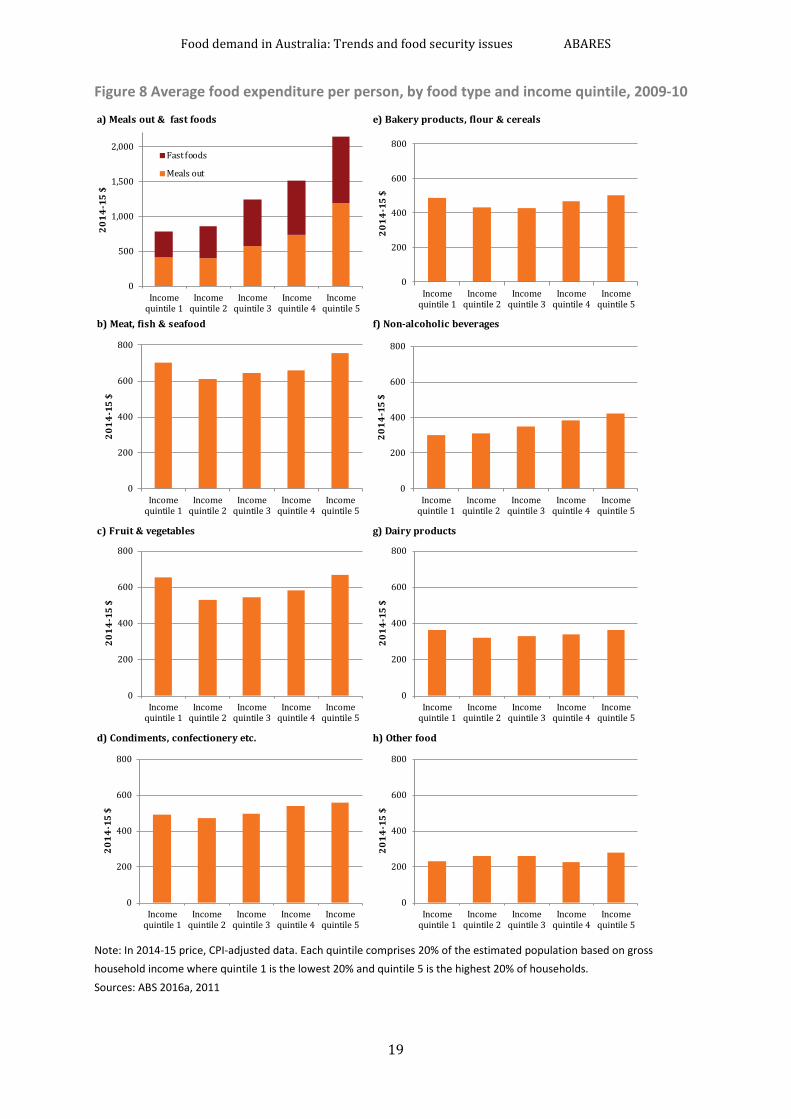
Of the eight food groups, the main difference between income groups is expenditure on meals out and fast foods—average expenditure per person ranged from $785 in the lowest income group to $2155 in the highest income group (Table 5, Figure 8).
Based on food expenditure patterns and other information for the lowest income group, there is likely to be a significant number of people in this group who are older, more likely to purchase food for cooking at home, and who are drawing on net assets accumulated through their working lives to maintain living standards. For five of the eight food groups, average expenditure per person was higher in the lowest income group than in the second lowest income group. Average expenditure per person in the lowest income group was the highest of all income groups for dairy products, and the second highest for meat, fish and seafood, fruit and vegetables, and bakery products, flour and cereals. Food expenditure patterns across household net wealth groups are considered in the next section.
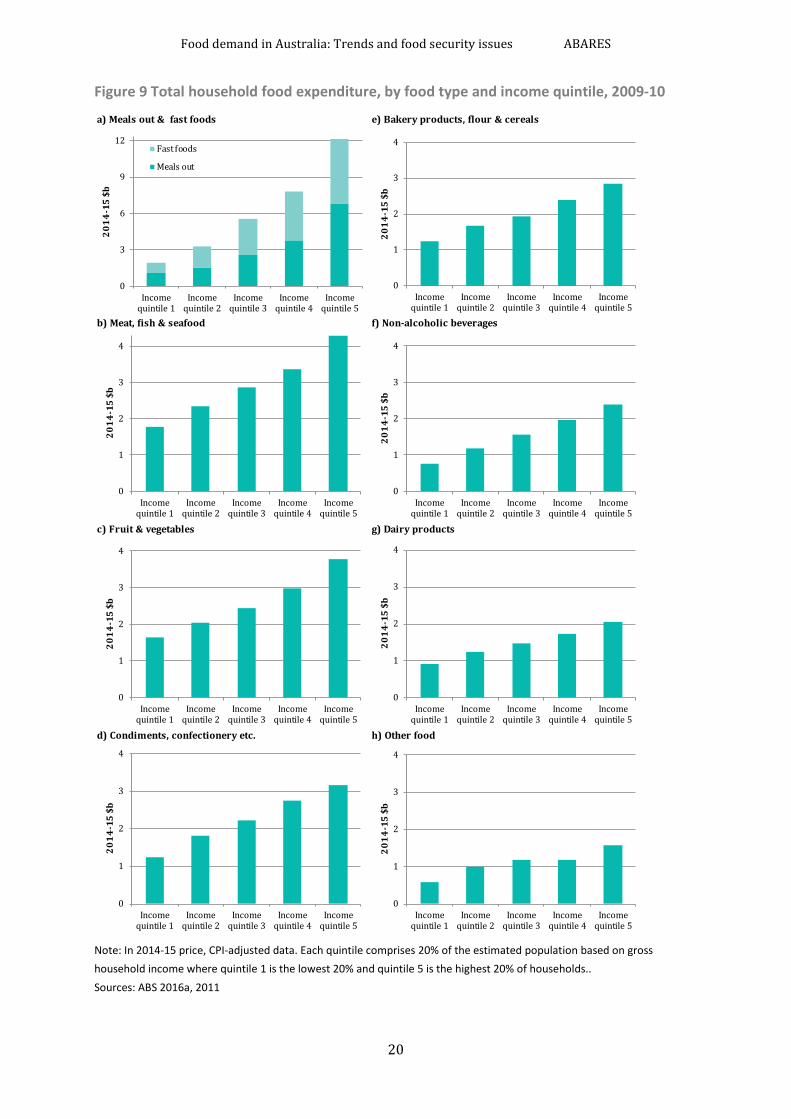
As a result of higher food expenditure per person and/or larger household size, total food expenditure increased consistently across income groups in aggregate (Figure 7b) and for each of the eight food groups (Figure 9). Total food expenditure ranged from $10 billion in the lowest income group to $32 billion in the highest income group (Table 4).
Figure 7 Household food expenditure in Australia, by income quintile, 2009-10
Note: In 2014-15 prices; CPI-adjusted annual data. Each quintile comprises 20% of households based on gross household income where quintile 1 is the lowest 20% and quintile 5 is the highest 20% of households. Sources: ABS 2016a, 2011
a) Average food expenditure b) Total food expenditure
0
10
20
30
Incomequintile 1
Incomequintile 2
Incomequintile 3
Incomequintile 4
Incomequintile 5
2014
-15
$b
0
100 00
200 00
300 00
0
200 0
400 0
600 0
Incomequintile 1
Incomequintile 2
Incomequintile 3
Incomequintile 4
Incomequintile 5
2014
-15
$
2014
-15
$
Per person
Per household (right axis)
Food demand in Australia: Trends and food security issues ABARES
18
Table 5 Household characteristics and food expenditure, by income quintile, 2009-10
Variable Unit Gross household income quintile Total
1 2 3 4 5 Selected indicators
Demographic indicators
No. households million 1.7 1.7 1.7 1.7 1.7 8.4
No. persons million 2.5 3.8 4.5 5.1 5.7 21.6
Average no. of persons in household no. 1.5 2.3 2.7 3.0 3.4 2.6
Average age of reference person years 62 53 46 43 45 50
Gross household income and net assets
Average household income $ 21,510 46,010 77,777 118,630 230,753 98,936
Average income per person $ 14,398 20,103 29,270 38,949 68,459 38,478
Total household income $b 36.3 77.0 130.6 199.3 387.6 830.9
Average household net worth $ 505,103 538,505 636,781 721,452 1,709,292 822,186
Household expenditure on goods and services
Average household expenditure $ 32,766 47,765 68,544 86,713 126,585 72,475
Average expenditure per person $ 21,933 20,870 25,795 28,470 37,555 26,925
Total expenditure on goods & services $b 55.3 79.9 115.1 145.7 212.6 608.7
Food expenditure
Average household food expenditure $ 6,005 8,728 11,481 14,411 19,229 11,971
% of expenditure on goods & services % 18.3 18.3 16.8 16.6 15.2 16.5
Average food expenditure per person
Meals out & fast foods $ 785 872 1,263 1,533 2,155 1,435
Meals out $ 418 400 580 738 1,200 729
Fast foods $ 363 462 664 784 947 695
Meat, fish & seafood $ 703 612 644 659 757 678
Fruit & vegetables $ 653 530 546 581 669 596
Condiments, confectionery etc. $ 492 474 496 538 558 518
Bakery products, flour & cereals $ 490 436 431 467 501 465
Non-alcoholic beverages $ 301 312 349 385 423 365
Dairy products $ 365 320 331 339 364 344
Other food $ 231 258 262 229 278 254
Total food $ 4,020 3,814 4,321 4,732 5,705 4,655
Total food expenditure
Meals out & fast foods $b 2.0 3.3 5.6 7.8 12.2 31.0
Meals out $b 1.1 1.5 2.6 3.8 6.8 15.7
Fast foods $b 0.9 1.8 3.0 4.0 5.4 15.0
Meat, fish & seafood $b 1.8 2.3 2.9 3.4 4.3 14.6
Fruit & vegetables $b 1.6 2.0 2.4 3.0 3.8 12.9
Condiments, confectionery etc. $b 1.2 1.8 2.2 2.8 3.2 11.2
Bakery products, flour & cereals $b 1.2 1.7 1.9 2.4 2.8 10.1
Non-alcoholic beverages $b 0.8 1.2 1.6 2.0 2.4 7.9
Dairy products $b 0.9 1.2 1.5 1.7 2.1 7.4
Other food $b 0.6 1.0 1.2 1.2 1.6 5.5
Total food $b 10.1 14.6 19.3 24.2 32.3 100.5
Note: In 2014-15 prices; CPI-adjusted annual data. Food includes non-alcoholic beverages; fruit includes nuts; dairy products includes milk; condiments, confectionary etc. includes food additives and prepared meals. Each quintile comprises 20% of households based on gross household income where quintile 1 is the lowest 20% and quintile 5 is the highest 20% of households. Sources: ABS 2016a, 2011
Food demand in Australia: Trends and food security issues ABARES
19
Figure 8 Average food expenditure per person, by food type and income quintile, 2009-10
Note: In 2014-15 price, CPI-adjusted data. Each quintile comprises 20% of the estimated population based on gross household income where quintile 1 is the lowest 20% and quintile 5 is the highest 20% of households. Sources: ABS 2016a, 2011
a) Meals out & fast foods e) Bakery products, flour & cereals
b) Meat, fish & seafood f) Non-alcoholic beverages
c) Fruit & vegetables g) Dairy products
d) Condiments, confectionery etc. h) Other food
0
500
1,000
1,500
2,000
Incomequintile 1
Incomequintile 2
Incomequintile 3
Incomequintile 4
Incomequintile 5
2014
-15
$
Fast foods
Meals out
0
200
400
600
800
Incomequintile 1
Incomequintile 2
Incomequintile 3
Incomequintile 4
Incomequintile 5
2014
-15
$
0
200
400
600
800
Incomequintile 1
Incomequintile 2
Incomequintile 3
Incomequintile 4
Incomequintile 5
2014
-15
$
0
200
400
600
800
Incomequintile 1
Incomequintile 2
Incomequintile 3
Incomequintile 4
Incomequintile 5
2014
-15
$
0
200
400
600
800
Incomequintile 1
Incomequintile 2
Incomequintile 3
Incomequintile 4
Incomequintile 5
2014
-15
$
0
200
400
600
800
Incomequintile 1
Incomequintile 2
Incomequintile 3
Incomequintile 4
Incomequintile 5
2014
-15
$
0
200
400
600
800
Incomequintile 1
Incomequintile 2
Incomequintile 3
Incomequintile 4
Incomequintile 5
2014
-15
$
0
200
400
600
800
Incomequintile 1
Incomequintile 2
Incomequintile 3
Incomequintile 4
Incomequintile 5
2014
-15
$
Food demand in Australia: Trends and food security issues ABARES
20
Figure 9 Total household food expenditure, by food type and income quintile, 2009-10
Note: In 2014-15 price, CPI-adjusted data. Each quintile comprises 20% of the estimated population based on gross household income where quintile 1 is the lowest 20% and quintile 5 is the highest 20% of households.. Sources: ABS 2016a, 2011
a) Meals out & fast foods e) Bakery products, flour & cereals
b) Meat, fish & seafood f) Non-alcoholic beverages
c) Fruit & vegetables g) Dairy products
d) Condiments, confectionery etc. h) Other food
0
1
2
3
4
Incomequintile 1
Incomequintile 2
Incomequintile 3
Incomequintile 4
Incomequintile 5
2014
-15
$b
0
1
2
3
4
Incomequintile 1
Incomequintile 2
Incomequintile 3
Incomequintile 4
Incomequintile 5
2014
-15
$b
0
1
2
3
4
Incomequintile 1
Incomequintile 2
Incomequintile 3
Incomequintile 4
Incomequintile 5
2014
-15
$b
0
1
2
3
4
Incomequintile 1
Incomequintile 2
Incomequintile 3
Incomequintile 4
Incomequintile 5
2014
-15
$b
0
1
2
3
4
Incomequintile 1
Incomequintile 2
Incomequintile 3
Incomequintile 4
Incomequintile 5
2014
-15
$b
0
1
2
3
4
Incomequintile 1
Incomequintile 2
Incomequintile 3
Incomequintile 4
Incomequintile 5
2014
-15
$b
0
1
2
3
4
Incomequintile 1
Incomequintile 2
Incomequintile 3
Incomequintile 4
Incomequintile 5
2014
-15
$b
0
3
6
9
12
Incomequintile 1
Incomequintile 2
Incomequintile 3
Incomequintile 4
Incomequintile 5
2014
-15
$b
Fast foods
Meals out
Food demand in Australia: Trends and food security issues ABARES
21
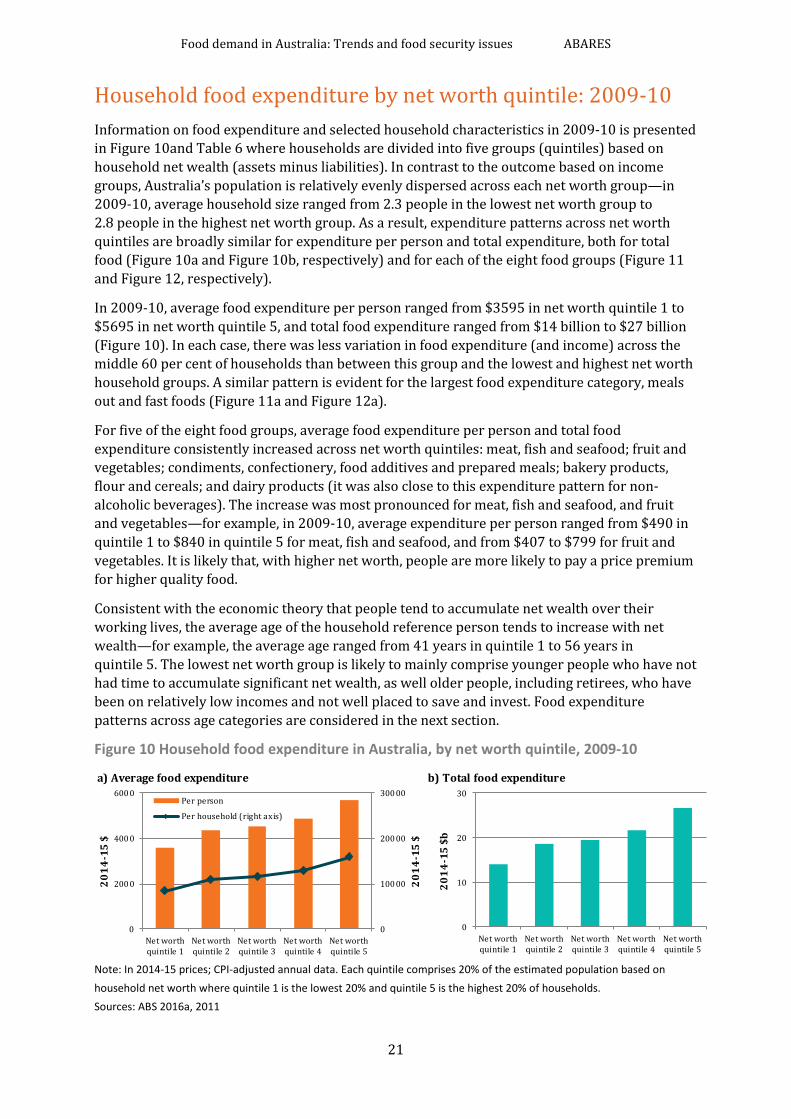
Household food expenditure by net worth quintile: 2009-10 Information on food expenditure and selected household characteristics in 2009-10 is presented in Figure 10and Table 6 where households are divided into five groups (quintiles) based on household net wealth (assets minus liabilities). In contrast to the outcome based on income groups, Australia’s population is relatively evenly dispersed across each net worth group—in 2009-10, average household size ranged from 2.3 people in the lowest net worth group to 2.8 people in the highest net worth group. As a result, expenditure patterns across net worth quintiles are broadly similar for expenditure per person and total expenditure, both for total food (Figure 10a and Figure 10b, respectively) and for each of the eight food groups (Figure 11 and Figure 12, respectively).
In 2009-10, average food expenditure per person ranged from $3595 in net worth quintile 1 to $5695 in net worth quintile 5, and total food expenditure ranged from $14 billion to $27 billion (Figure 10). In each case, there was less variation in food expenditure (and income) across the middle 60 per cent of households than between this group and the lowest and highest net worth household groups. A similar pattern is evident for the largest food expenditure category, meals out and fast foods (Figure 11a and Figure 12a).
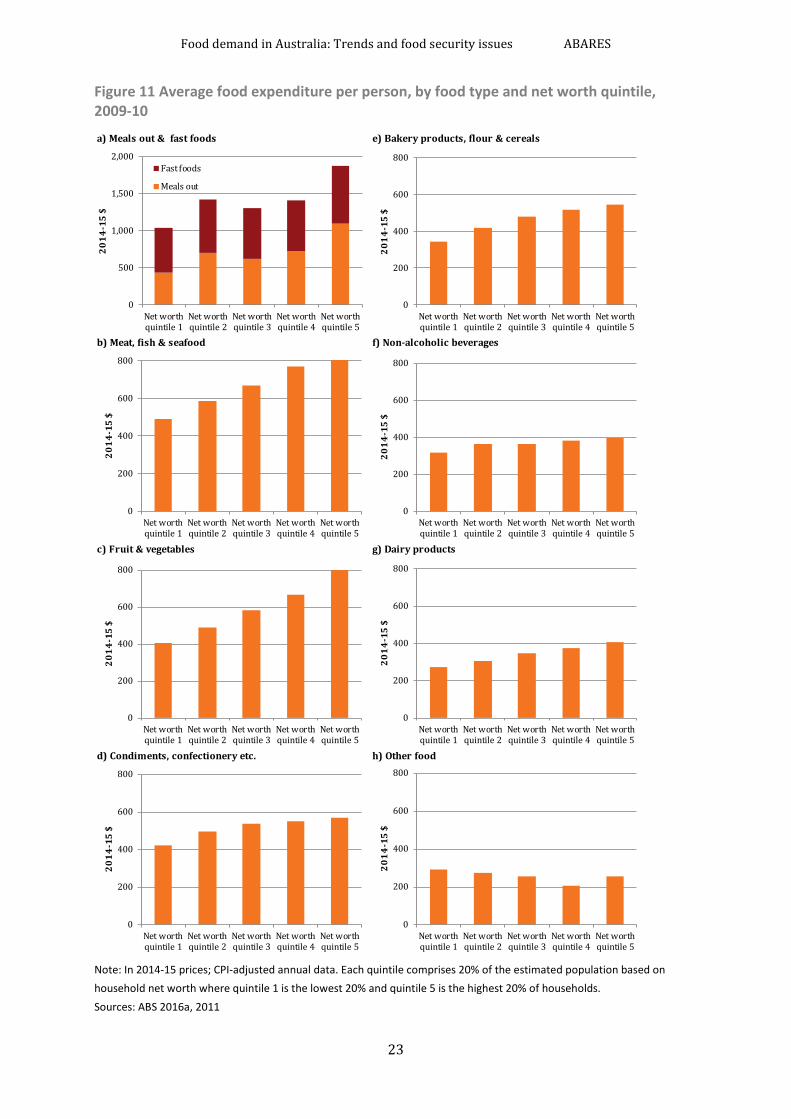
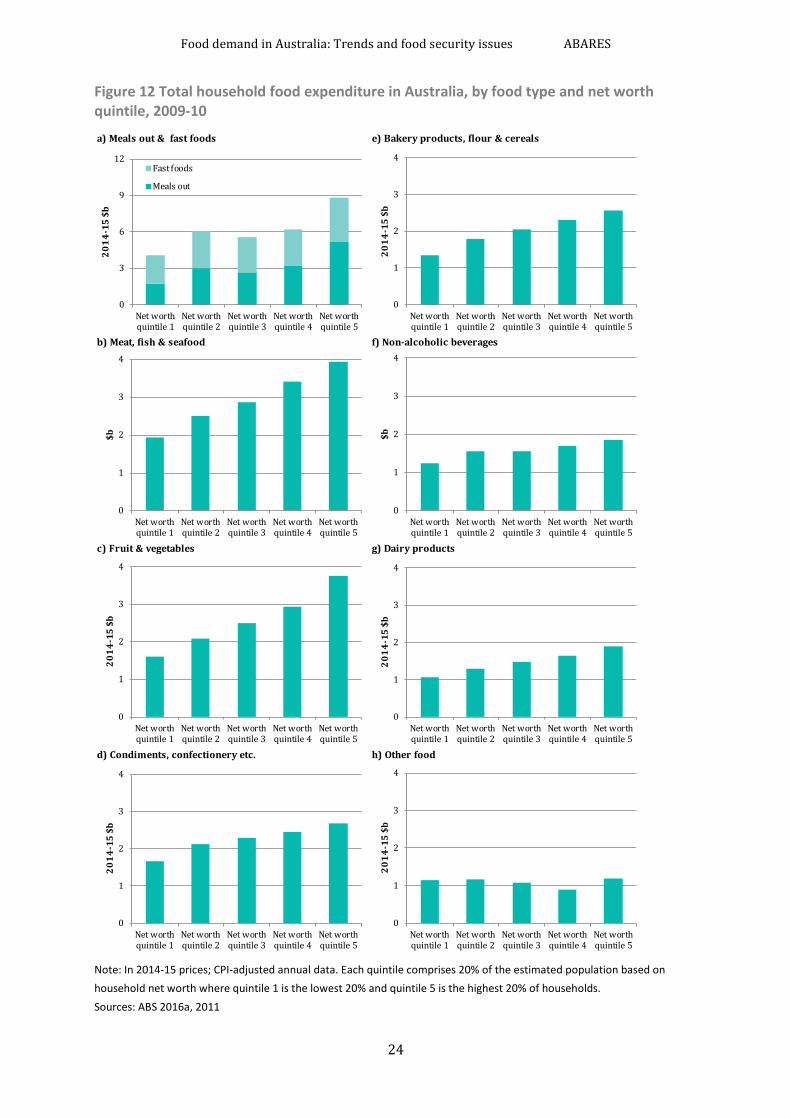
For five of the eight food groups, average food expenditure per person and total food expenditure consistently increased across net worth quintiles: meat, fish and seafood; fruit and vegetables; condiments, confectionery, food additives and prepared meals; bakery products, flour and cereals; and dairy products (it was also close to this expenditure pattern for non-alcoholic beverages). The increase was most pronounced for meat, fish and seafood, and fruit and vegetables—for example, in 2009-10, average expenditure per person ranged from $490 in quintile 1 to $840 in quintile 5 for meat, fish and seafood, and from $407 to $799 for fruit and vegetables. It is likely that, with higher net worth, people are more likely to pay a price premium for higher quality food.
Consistent with the economic theory that people tend to accumulate net wealth over their working lives, the average age of the household reference person tends to increase with net wealth—for example, the average age ranged from 41 years in quintile 1 to 56 years in quintile 5. The lowest net worth group is likely to mainly comprise younger people who have not had time to accumulate significant net wealth, as well older people, including retirees, who have been on relatively low incomes and not well placed to save and invest. Food expenditure patterns across age categories are considered in the next section.
Figure 10 Household food expenditure in Australia, by net worth quintile, 2009-10
Note: In 2014-15 prices; CPI-adjusted annual data. Each quintile comprises 20% of the estimated population based on household net worth where quintile 1 is the lowest 20% and quintile 5 is the highest 20% of households. Sources: ABS 2016a, 2011
a) Average food expenditure b) Total food expenditure
0
10
20
30
Net worthquintile 1
Net worthquintile 2
Net worthquintile 3
Net worthquintile 4
Net worthquintile 5
2014
-15
$b
0
100 00
200 00
300 00
0
200 0
400 0
600 0
Net worthquintile 1
Net worthquintile 2
Net worthquintile 3
Net worthquintile 4
Net worthquintile 5
2014
-15
$
2014
-15
$
Per person
Per household (right axis)
Food demand in Australia: Trends and food security issues ABARES
22
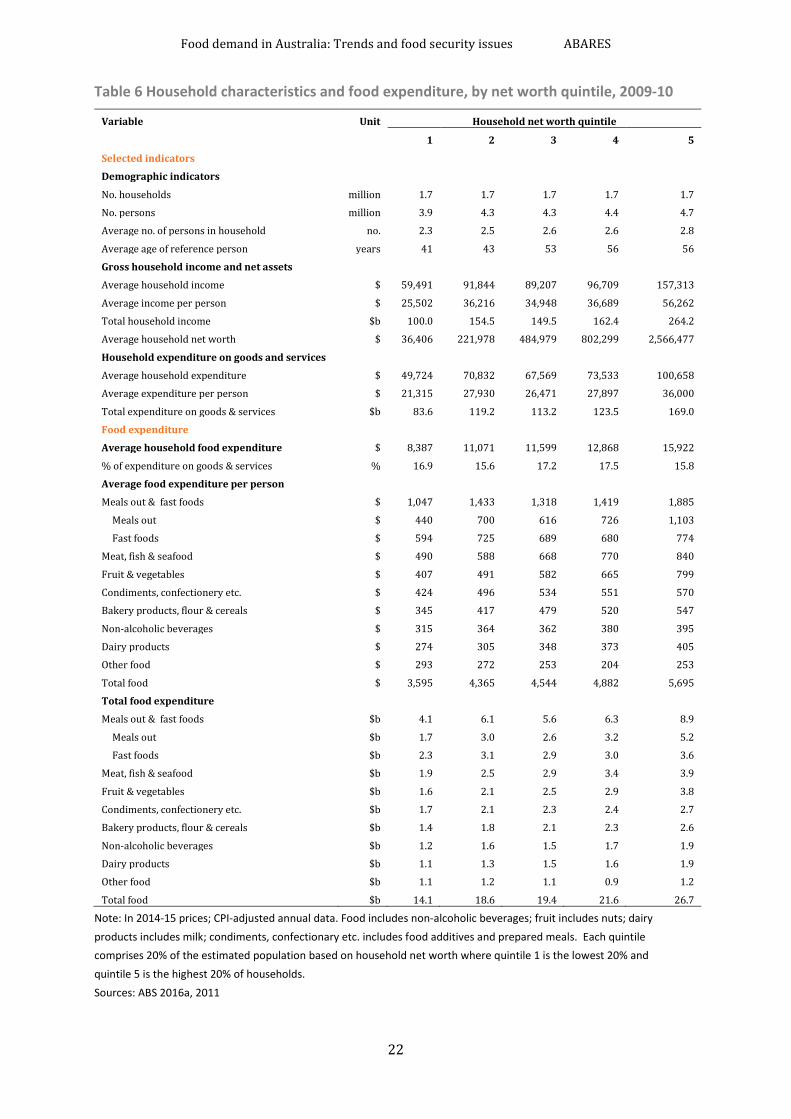
Table 6 Household characteristics and food expenditure, by net worth quintile, 2009-10
Variable Unit Household net worth quintile
1 2 3 4 5
Selected indicators
Demographic indicators
No. households million 1.7 1.7 1.7 1.7 1.7
No. persons million 3.9 4.3 4.3 4.4 4.7
Average no. of persons in household no. 2.3 2.5 2.6 2.6 2.8
Average age of reference person years 41 43 53 56 56
Gross household income and net assets
Average household income $ 59,491 91,844 89,207 96,709 157,313
Average income per person $ 25,502 36,216 34,948 36,689 56,262
Total household income $b 100.0 154.5 149.5 162.4 264.2
Average household net worth $ 36,406 221,978 484,979 802,299 2,566,477
Household expenditure on goods and services
Average household expenditure $ 49,724 70,832 67,569 73,533 100,658
Average expenditure per person $ 21,315 27,930 26,471 27,897 36,000
Total expenditure on goods & services $b 83.6 119.2 113.2 123.5 169.0
Food expenditure
Average household food expenditure $ 8,387 11,071 11,599 12,868 15,922
% of expenditure on goods & services % 16.9 15.6 17.2 17.5 15.8
Average food expenditure per person
Meals out & fast foods $ 1,047 1,433 1,318 1,419 1,885
Meals out $ 440 700 616 726 1,103
Fast foods $ 594 725 689 680 774
Meat, fish & seafood $ 490 588 668 770 840
Fruit & vegetables $ 407 491 582 665 799
Condiments, confectionery etc. $ 424 496 534 551 570
Bakery products, flour & cereals $ 345 417 479 520 547
Non-alcoholic beverages $ 315 364 362 380 395
Dairy products $ 274 305 348 373 405
Other food $ 293 272 253 204 253
Total food $ 3,595 4,365 4,544 4,882 5,695
Total food expenditure
Meals out & fast foods $b 4.1 6.1 5.6 6.3 8.9
Meals out $b 1.7 3.0 2.6 3.2 5.2
Fast foods $b 2.3 3.1 2.9 3.0 3.6
Meat, fish & seafood $b 1.9 2.5 2.9 3.4 3.9
Fruit & vegetables $b 1.6 2.1 2.5 2.9 3.8
Condiments, confectionery etc. $b 1.7 2.1 2.3 2.4 2.7
Bakery products, flour & cereals $b 1.4 1.8 2.1 2.3 2.6
Non-alcoholic beverages $b 1.2 1.6 1.5 1.7 1.9
Dairy products $b 1.1 1.3 1.5 1.6 1.9
Other food $b 1.1 1.2 1.1 0.9 1.2
Total food $b 14.1 18.6 19.4 21.6 26.7
Note: In 2014-15 prices; CPI-adjusted annual data. Food includes non-alcoholic beverages; fruit includes nuts; dairy products includes milk; condiments, confectionary etc. includes food additives and prepared meals. Each quintile comprises 20% of the estimated population based on household net worth where quintile 1 is the lowest 20% and quintile 5 is the highest 20% of households. Sources: ABS 2016a, 2011
Food demand in Australia: Trends and food security issues ABARES
23
Figure 11 Average food expenditure per person, by food type and net worth quintile, 2009-10
Note: In 2014-15 prices; CPI-adjusted annual data. Each quintile comprises 20% of the estimated population based on household net worth where quintile 1 is the lowest 20% and quintile 5 is the highest 20% of households. Sources: ABS 2016a, 2011
a) Meals out & fast foods e) Bakery products, flour & cereals
b) Meat, fish & seafood f) Non-alcoholic beverages
c) Fruit & vegetables g) Dairy products
d) Condiments, confectionery etc. h) Other food
0
500
1,000
1,500
2,000
Net worthquintile 1
Net worthquintile 2
Net worthquintile 3
Net worthquintile 4
Net worthquintile 5
2014
-15
$
Fast foods
Meals out
0
200
400
600
800
Net worthquintile 1
Net worthquintile 2
Net worthquintile 3
Net worthquintile 4
Net worthquintile 5
2014
-15
$
0
200
400
600
800
Net worthquintile 1
Net worthquintile 2
Net worthquintile 3
Net worthquintile 4
Net worthquintile 5
2014
-15
$
0
200
400
600
800
Net worthquintile 1
Net worthquintile 2
Net worthquintile 3
Net worthquintile 4
Net worthquintile 5
2014
-15
$
0
200
400
600
800
Net worthquintile 1
Net worthquintile 2
Net worthquintile 3
Net worthquintile 4
Net worthquintile 5
2014
-15
$
0
200
400
600
800
Net worthquintile 1
Net worthquintile 2
Net worthquintile 3
Net worthquintile 4
Net worthquintile 5
2014
-15
$
0
200
400
600
800
Net worthquintile 1
Net worthquintile 2
Net worthquintile 3
Net worthquintile 4
Net worthquintile 5
2014
-15
$
0
200
400
600
800
Net worthquintile 1
Net worthquintile 2
Net worthquintile 3
Net worthquintile 4
Net worthquintile 5
2014
-15
$
Food demand in Australia: Trends and food security issues ABARES
24
Figure 12 Total household food expenditure in Australia, by food type and net worth quintile, 2009-10
Note: In 2014-15 prices; CPI-adjusted annual data. Each quintile comprises 20% of the estimated population based on household net worth where quintile 1 is the lowest 20% and quintile 5 is the highest 20% of households. Sources: ABS 2016a, 2011
a) Meals out & fast foods e) Bakery products, flour & cereals
b) Meat, fish & seafood f) Non-alcoholic beverages
c) Fruit & vegetables g) Dairy products
d) Condiments, confectionery etc. h) Other food
0
3
6
9
12
Net worthquintile 1
Net worthquintile 2
Net worthquintile 3
Net worthquintile 4
Net worthquintile 5
2014
-15
$b
Fast foods
Meals out
0
1
2
3
4
Net worthquintile 1
Net worthquintile 2
Net worthquintile 3
Net worthquintile 4
Net worthquintile 5
2014
-15
$b
0
1
2
3
4
Net worthquintile 1
Net worthquintile 2
Net worthquintile 3
Net worthquintile 4
Net worthquintile 5
2014
-15
$b
0
1
2
3
4
Net worthquintile 1
Net worthquintile 2
Net worthquintile 3
Net worthquintile 4
Net worthquintile 5
$b
0
1
2
3
4
Net worthquintile 1
Net worthquintile 2
Net worthquintile 3
Net worthquintile 4
Net worthquintile 5
2014
-15
$b
0
1
2
3
4
Net worthquintile 1
Net worthquintile 2
Net worthquintile 3
Net worthquintile 4
Net worthquintile 5
$b
0
1
2
3
4
Net worthquintile 1
Net worthquintile 2
Net worthquintile 3
Net worthquintile 4
Net worthquintile 5
2014
-15
$b
0
1
2
3
4
Net worthquintile 1
Net worthquintile 2
Net worthquintile 3
Net worthquintile 4
Net worthquintile 5
2014
-15
$b
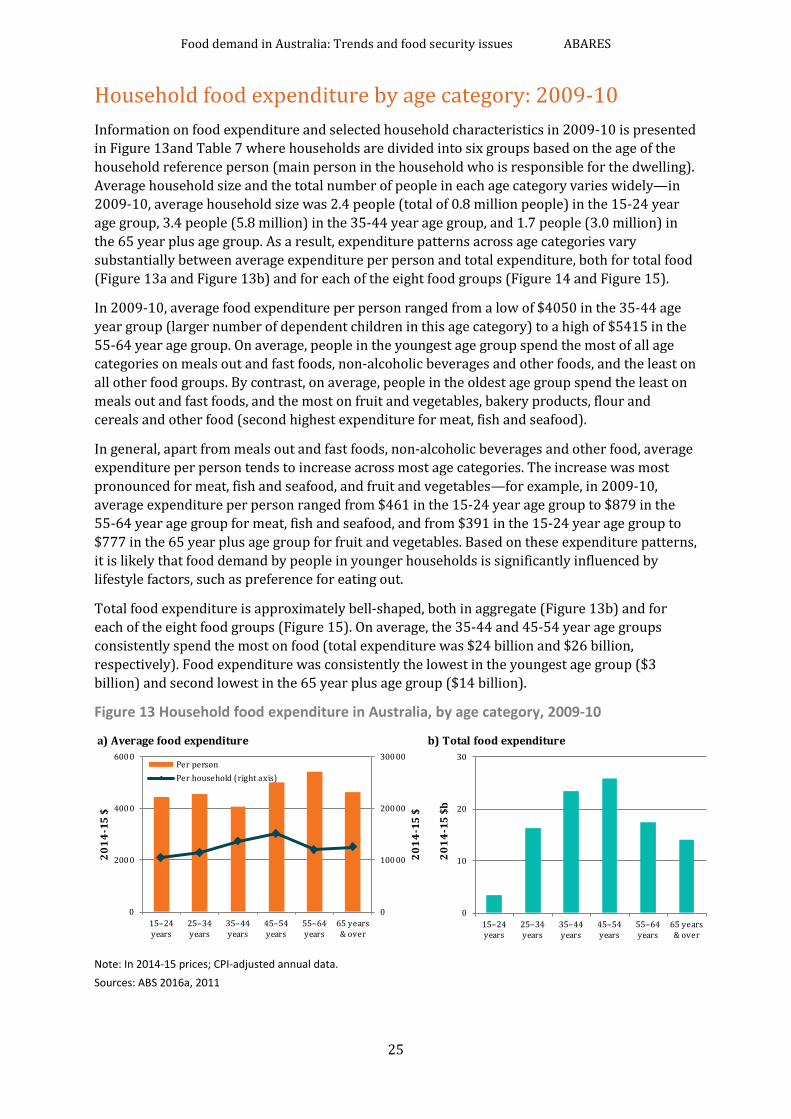
Food demand in Australia: Trends and food security issues ABARES
25
Household food expenditure by age category: 2009-10 Information on food expenditure and selected household characteristics in 2009-10 is presented in Figure 13and Table 7 where households are divided into six groups based on the age of the household reference person (main person in the household who is responsible for the dwelling). Average household size and the total number of people in each age category varies widely—in 2009-10, average household size was 2.4 people (total of 0.8 million people) in the 15-24 year age group, 3.4 people (5.8 million) in the 35-44 year age group, and 1.7 people (3.0 million) in the 65 year plus age group. As a result, expenditure patterns across age categories vary substantially between average expenditure per person and total expenditure, both for total food (Figure 13a and Figure 13b) and for each of the eight food groups (Figure 14 and Figure 15).
In 2009-10, average food expenditure per person ranged from a low of $4050 in the 35-44 age year group (larger number of dependent children in this age category) to a high of $5415 in the 55-64 year age group. On average, people in the youngest age group spend the most of all age categories on meals out and fast foods, non-alcoholic beverages and other foods, and the least on all other food groups. By contrast, on average, people in the oldest age group spend the least on meals out and fast foods, and the most on fruit and vegetables, bakery products, flour and cereals and other food (second highest expenditure for meat, fish and seafood).
In general, apart from meals out and fast foods, non-alcoholic beverages and other food, average expenditure per person tends to increase across most age categories. The increase was most pronounced for meat, fish and seafood, and fruit and vegetables—for example, in 2009-10, average expenditure per person ranged from $461 in the 15-24 year age group to $879 in the 55-64 year age group for meat, fish and seafood, and from $391 in the 15-24 year age group to $777 in the 65 year plus age group for fruit and vegetables. Based on these expenditure patterns, it is likely that food demand by people in younger households is significantly influenced by lifestyle factors, such as preference for eating out.
Total food expenditure is approximately bell-shaped, both in aggregate (Figure 13b) and for each of the eight food groups (Figure 15). On average, the 35-44 and 45-54 year age groups consistently spend the most on food (total expenditure was $24 billion and $26 billion, respectively). Food expenditure was consistently the lowest in the youngest age group ($3 billion) and second lowest in the 65 year plus age group ($14 billion).
Figure 13 Household food expenditure in Australia, by age category, 2009-10
Note: In 2014-15 prices; CPI-adjusted annual data. Sources: ABS 2016a, 2011
a) Average food expenditure b) Total food expenditure
0
10
20
30
15–24 years
25–34 years
35–44 years
45–54 years
55–64 years
65 years& over
2014
-15
$b
0
100 00
200 00
300 00
0
200 0
400 0
600 0
15–24 years
25–34 years
35–44 years
45–54 years
55–64 years
65 years& over
2014
-15
$
2014
-15
$
Per personPer household (right axis)
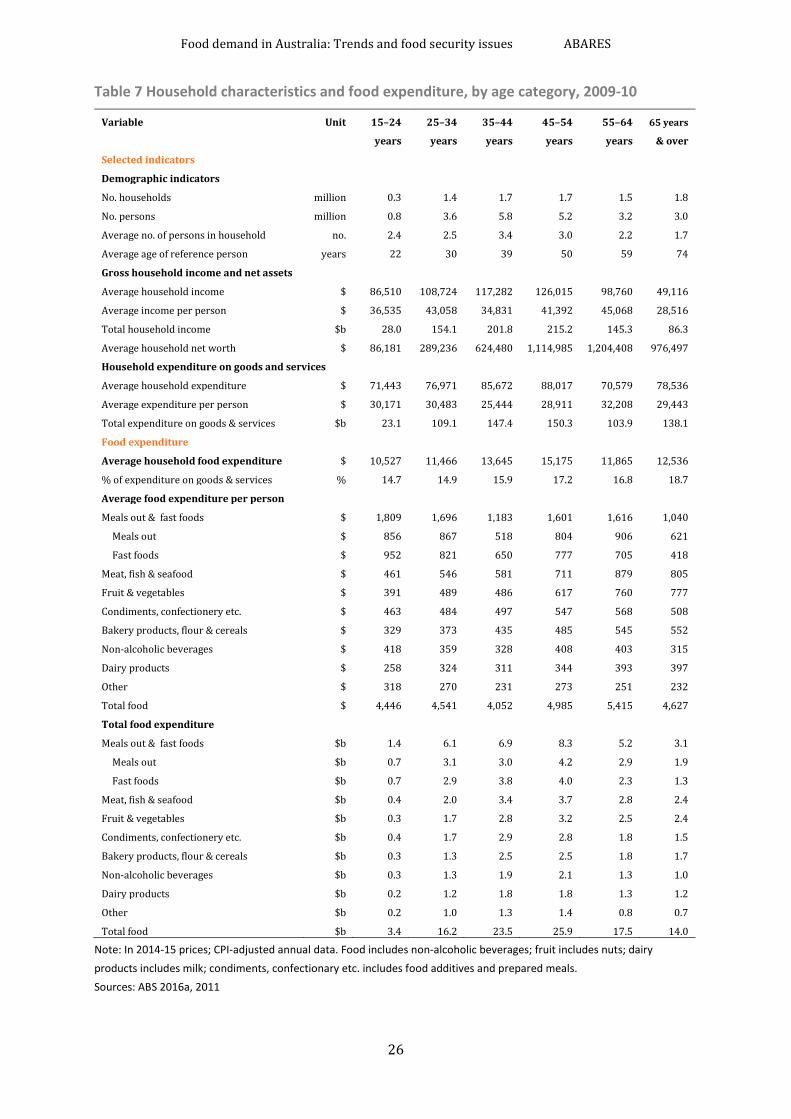
Food demand in Australia: Trends and food security issues ABARES
26
Table 7 Household characteristics and food expenditure, by age category, 2009-10
Variable Unit 15–24 25–34 35–44 45–54 55–64 65 years
years years years years years & over
Selected indicators
Demographic indicators
No. households million 0.3 1.4 1.7 1.7 1.5 1.8
No. persons million 0.8 3.6 5.8 5.2 3.2 3.0
Average no. of persons in household no. 2.4 2.5 3.4 3.0 2.2 1.7
Average age of reference person years 22 30 39 50 59 74
Gross household income and net assets
Average household income $ 86,510 108,724 117,282 126,015 98,760 49,116
Average income per person $ 36,535 43,058 34,831 41,392 45,068 28,516
Total household income $b 28.0 154.1 201.8 215.2 145.3 86.3
Average household net worth $ 86,181 289,236 624,480 1,114,985 1,204,408 976,497
Household expenditure on goods and services
Average household expenditure $ 71,443 76,971 85,672 88,017 70,579 78,536
Average expenditure per person $ 30,171 30,483 25,444 28,911 32,208 29,443
Total expenditure on goods & services $b 23.1 109.1 147.4 150.3 103.9 138.1
Food expenditure
Average household food expenditure $ 10,527 11,466 13,645 15,175 11,865 12,536
% of expenditure on goods & services % 14.7 14.9 15.9 17.2 16.8 18.7
Average food expenditure per person
Meals out & fast foods $ 1,809 1,696 1,183 1,601 1,616 1,040
Meals out $ 856 867 518 804 906 621
Fast foods $ 952 821 650 777 705 418
Meat, fish & seafood $ 461 546 581 711 879 805
Fruit & vegetables $ 391 489 486 617 760 777
Condiments, confectionery etc. $ 463 484 497 547 568 508
Bakery products, flour & cereals $ 329 373 435 485 545 552
Non-alcoholic beverages $ 418 359 328 408 403 315
Dairy products $ 258 324 311 344 393 397
Other $ 318 270 231 273 251 232
Total food $ 4,446 4,541 4,052 4,985 5,415 4,627
Total food expenditure
Meals out & fast foods $b 1.4 6.1 6.9 8.3 5.2 3.1
Meals out $b 0.7 3.1 3.0 4.2 2.9 1.9
Fast foods $b 0.7 2.9 3.8 4.0 2.3 1.3
Meat, fish & seafood $b 0.4 2.0 3.4 3.7 2.8 2.4
Fruit & vegetables $b 0.3 1.7 2.8 3.2 2.5 2.4
Condiments, confectionery etc. $b 0.4 1.7 2.9 2.8 1.8 1.5
Bakery products, flour & cereals $b 0.3 1.3 2.5 2.5 1.8 1.7
Non-alcoholic beverages $b 0.3 1.3 1.9 2.1 1.3 1.0
Dairy products $b 0.2 1.2 1.8 1.8 1.3 1.2
Other $b 0.2 1.0 1.3 1.4 0.8 0.7
Total food $b 3.4 16.2 23.5 25.9 17.5 14.0
Note: In 2014-15 prices; CPI-adjusted annual data. Food includes non-alcoholic beverages; fruit includes nuts; dairy products includes milk; condiments, confectionary etc. includes food additives and prepared meals. Sources: ABS 2016a, 2011
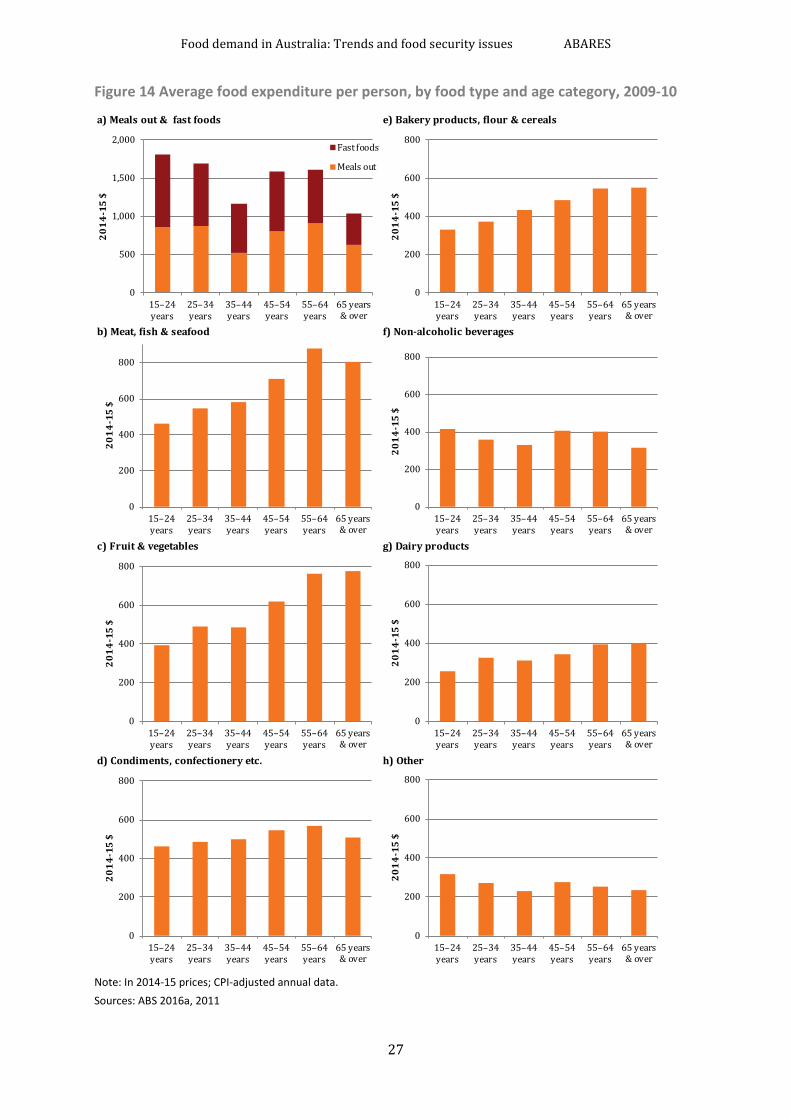
Food demand in Australia: Trends and food security issues ABARES
27
Figure 14 Average food expenditure per person, by food type and age category, 2009-10
Note: In 2014-15 prices; CPI-adjusted annual data. Sources: ABS 2016a, 2011
a) Meals out & fast foods e) Bakery products, flour & cereals
b) Meat, fish & seafood f) Non-alcoholic beverages
c) Fruit & vegetables g) Dairy products
d) Condiments, confectionery etc. h) Other
0
500
1,000
1,500
2,000
15–24 years
25–34 years
35–44 years
45–54 years
55–64 years
65 years& over
2014
-15
$
Fast foods
Meals out
0
200
400
600
800
15–24 years
25–34 years
35–44 years
45–54 years
55–64 years
65 years& over
2014
-15
$
0
200
400
600
800
15–24 years
25–34 years
35–44 years
45–54 years
55–64 years
65 years& over
2014
-15
$
0
200
400
600
800
15–24 years
25–34 years
35–44 years
45–54 years
55–64 years
65 years& over
2014
-15
$
0
200
400
600
800
15–24 years
25–34 years
35–44 years
45–54 years
55–64 years
65 years& over
2014
-15
$
0
200
400
600
800
15–24 years
25–34 years
35–44 years
45–54 years
55–64 years
65 years& over
2014
-15
$
0
200
400
600
800
15–24 years
25–34 years
35–44 years
45–54 years
55–64 years
65 years& over
2014
-15
$
0
200
400
600
800
15–24 years
25–34 years
35–44 years
45–54 years
55–64 years
65 years& over
2014
-15
$
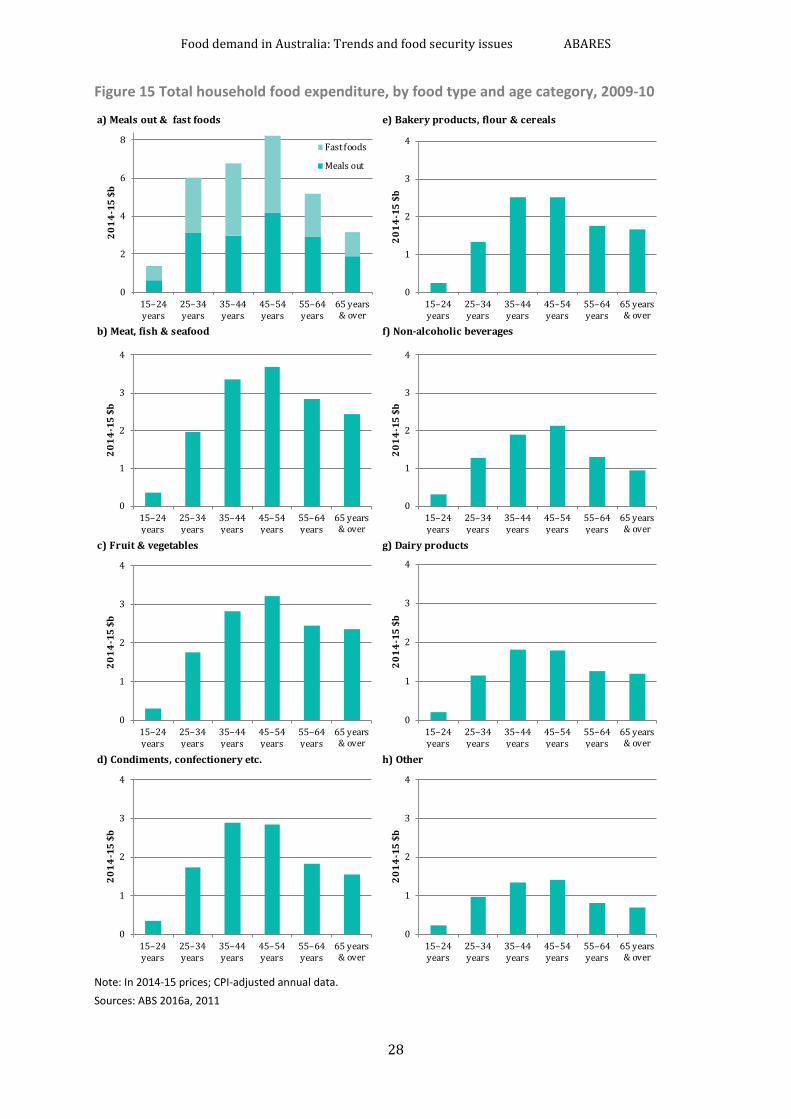
Food demand in Australia: Trends and food security issues ABARES
28
Figure 15 Total household food expenditure, by food type and age category, 2009-10
Note: In 2014-15 prices; CPI-adjusted annual data. Sources: ABS 2016a, 2011
a) Meals out & fast foods e) Bakery products, flour & cereals
b) Meat, fish & seafood f) Non-alcoholic beverages
c) Fruit & vegetables g) Dairy products
d) Condiments, confectionery etc. h) Other
0
2
4
6
8
15–24 years
25–34 years
35–44 years
45–54 years
55–64 years
65 years& over
2014
-15
$b
Fast foods
Meals out
0
1
2
3
4
15–24 years
25–34 years
35–44 years
45–54 years
55–64 years
65 years& over
2014
-15
$b
0
1
2
3
4
15–24 years
25–34 years
35–44 years
45–54 years
55–64 years
65 years& over
2014
-15
$b
0
1
2
3
4
15–24 years
25–34 years
35–44 years
45–54 years
55–64 years
65 years& over
2014
-15
$b
0
1
2
3
4
15–24 years
25–34 years
35–44 years
45–54 years
55–64 years
65 years& over
2014
-15
$b
0
1
2
3
4
15–24 years
25–34 years
35–44 years
45–54 years
55–64 years
65 years& over
2014
-15
$b
0
1
2
3
4
15–24 years
25–34 years
35–44 years
45–54 years
55–64 years
65 years& over
2014
-15
$b
0
1
2
3
4
15–24 years
25–34 years
35–44 years
45–54 years
55–64 years
65 years& over
2014
-15
$b
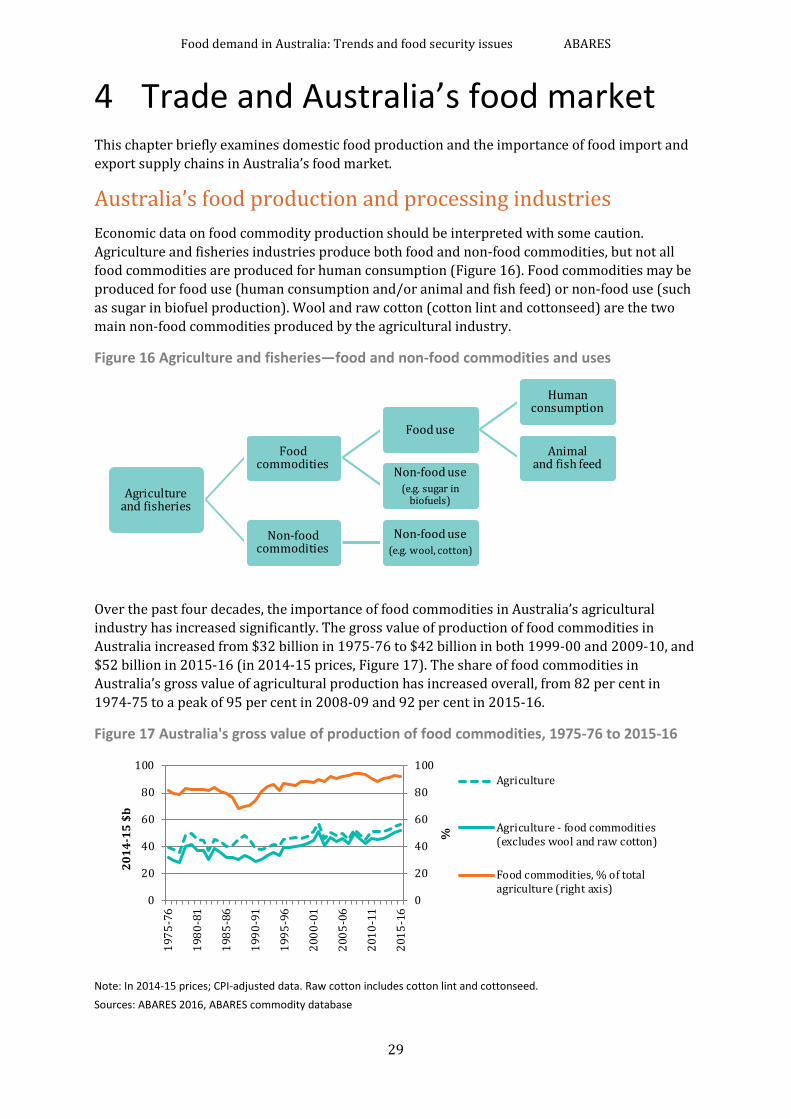
Food demand in Australia: Trends and food security issues ABARES
29
4 Trade and Australia’s food market This chapter briefly examines domestic food production and the importance of food import and export supply chains in Australia’s food market.
Australia’s food production and processing industries Economic data on food commodity production should be interpreted with some caution. Agriculture and fisheries industries produce both food and non-food commodities, but not all food commodities are produced for human consumption (Figure 16). Food commodities may be produced for food use (human consumption and/or animal and fish feed) or non-food use (such as sugar in biofuel production). Wool and raw cotton (cotton lint and cottonseed) are the two main non-food commodities produced by the agricultural industry.
Figure 16 Agriculture and fisheries—food and non-food commodities and uses
Over the past four decades, the importance of food commodities in Australia’s agricultural industry has increased significantly. The gross value of production of food commodities in Australia increased from $32 billion in 1975-76 to $42 billion in both 1999-00 and 2009-10, and $52 billion in 2015-16 (in 2014-15 prices, Figure 17). The share of food commodities in Australia’s gross value of agricultural production has increased overall, from 82 per cent in 1974-75 to a peak of 95 per cent in 2008-09 and 92 per cent in 2015-16.
Figure 17 Australia's gross value of production of food commodities, 1975-76 to 2015-16
Note: In 2014-15 prices; CPI-adjusted data. Raw cotton includes cotton lint and cottonseed. Sources: ABARES 2016, ABARES commodity database
Agricultureand fisheries
Food commodities
Food use
Human consumption
Animaland fish feedNon-food use
(e.g. sugar in biofuels)
Non-food commodities
Non-food use(e.g. wool, cotton)
0
20
40
60
80
100
0
20
40
60
80
100
1975
-76
1980
-81
1985
-86
1990
-91
1995
-96
2000
-01
2005
-06
2010
-11
2015
-16
%
2014
-15
$b
Agriculture
Agriculture - food commodities(excludes wool and raw cotton)
Food commodities, % of totalagriculture (right axis)
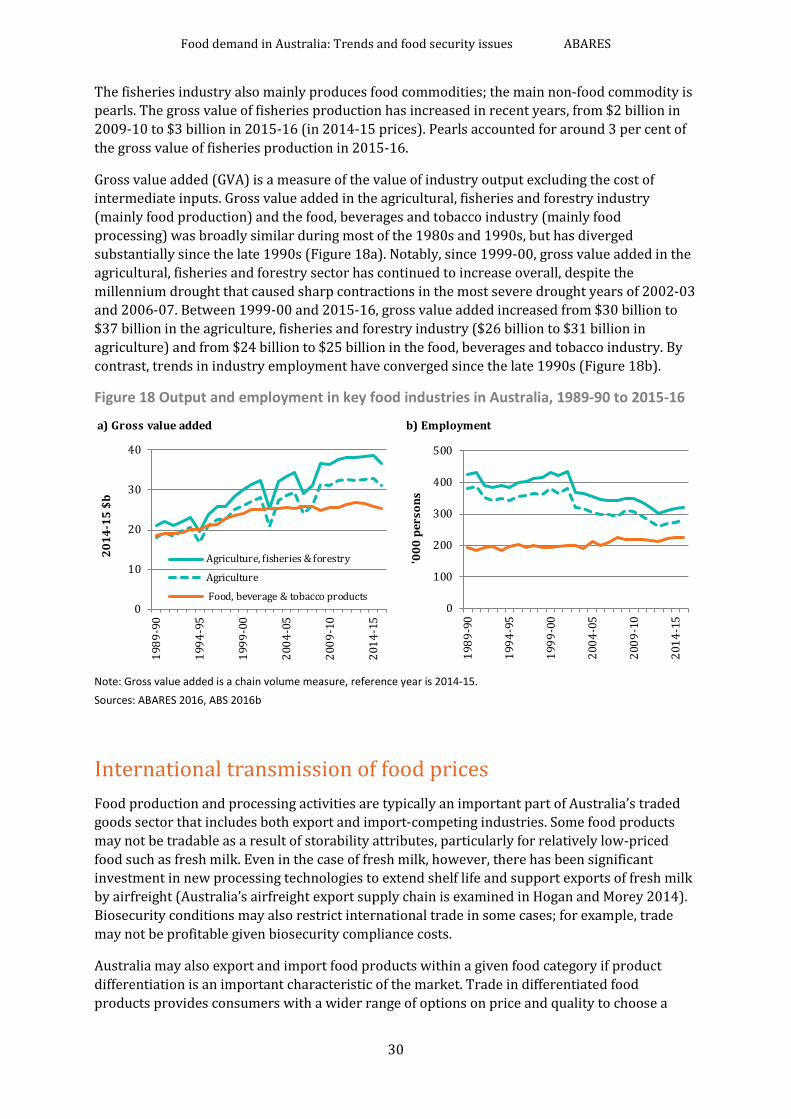
Food demand in Australia: Trends and food security issues ABARES
30
The fisheries industry also mainly produces food commodities; the main non-food commodity is pearls. The gross value of fisheries production has increased in recent years, from $2 billion in 2009-10 to $3 billion in 2015-16 (in 2014-15 prices). Pearls accounted for around 3 per cent of the gross value of fisheries production in 2015-16.
Gross value added (GVA) is a measure of the value of industry output excluding the cost of intermediate inputs. Gross value added in the agricultural, fisheries and forestry industry (mainly food production) and the food, beverages and tobacco industry (mainly food processing) was broadly similar during most of the 1980s and 1990s, but has diverged substantially since the late 1990s (Figure 18a). Notably, since 1999-00, gross value added in the agricultural, fisheries and forestry sector has continued to increase overall, despite the millennium drought that caused sharp contractions in the most severe drought years of 2002-03 and 2006-07. Between 1999-00 and 2015-16, gross value added increased from $30 billion to $37 billion in the agriculture, fisheries and forestry industry ($26 billion to $31 billion in agriculture) and from $24 billion to $25 billion in the food, beverages and tobacco industry. By contrast, trends in industry employment have converged since the late 1990s (Figure 18b).
Figure 18 Output and employment in key food industries in Australia, 1989-90 to 2015-16
Note: Gross value added is a chain volume measure, reference year is 2014-15. Sources: ABARES 2016, ABS 2016b
International transmission of food prices Food production and processing activities are typically an important part of Australia’s traded goods sector that includes both export and import-competing industries. Some food products may not be tradable as a result of storability attributes, particularly for relatively low-priced food such as fresh milk. Even in the case of fresh milk, however, there has been significant investment in new processing technologies to extend shelf life and support exports of fresh milk by airfreight (Australia’s airfreight export supply chain is examined in Hogan and Morey 2014). Biosecurity conditions may also restrict international trade in some cases; for example, trade may not be profitable given biosecurity compliance costs.
Australia may also export and import food products within a given food category if product differentiation is an important characteristic of the market. Trade in differentiated food products provides consumers with a wider range of options on price and quality to choose a
a) Gross value added b) Employment
0
10
20
30
40
1989
-90
1994
-95
1999
-00
2004
-05
2009
-10
2014
-15
2014
-15
$b
Agriculture, fisheries & forestry
Agriculture
Food, beverage & tobacco products0
100
200
300
400
50019
89-9
0
1994
-95
1999
-00
2004
-05
2009
-10
2014
-15
'000
per
sons
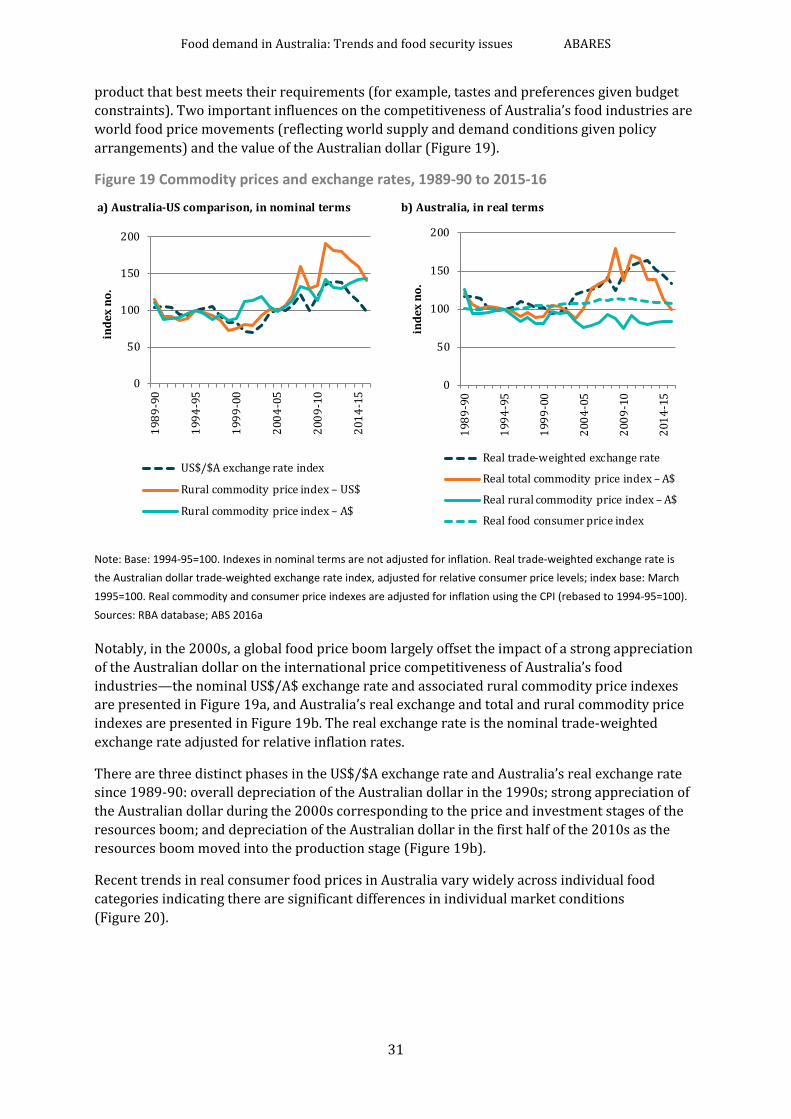
Food demand in Australia: Trends and food security issues ABARES
31
product that best meets their requirements (for example, tastes and preferences given budget constraints). Two important influences on the competitiveness of Australia’s food industries are world food price movements (reflecting world supply and demand conditions given policy arrangements) and the value of the Australian dollar (Figure 19).
Figure 19 Commodity prices and exchange rates, 1989-90 to 2015-16
Note: Base: 1994-95=100. Indexes in nominal terms are not adjusted for inflation. Real trade-weighted exchange rate is the Australian dollar trade-weighted exchange rate index, adjusted for relative consumer price levels; index base: March 1995=100. Real commodity and consumer price indexes are adjusted for inflation using the CPI (rebased to 1994-95=100). Sources: RBA database; ABS 2016a
Notably, in the 2000s, a global food price boom largely offset the impact of a strong appreciation of the Australian dollar on the international price competitiveness of Australia’s food industries—the nominal US$/A$ exchange rate and associated rural commodity price indexes are presented in Figure 19a, and Australia’s real exchange and total and rural commodity price indexes are presented in Figure 19b. The real exchange rate is the nominal trade-weighted exchange rate adjusted for relative inflation rates.
There are three distinct phases in the US$/$A exchange rate and Australia’s real exchange rate since 1989-90: overall depreciation of the Australian dollar in the 1990s; strong appreciation of the Australian dollar during the 2000s corresponding to the price and investment stages of the resources boom; and depreciation of the Australian dollar in the first half of the 2010s as the resources boom moved into the production stage (Figure 19b).
Recent trends in real consumer food prices in Australia vary widely across individual food categories indicating there are significant differences in individual market conditions (Figure 20).
a) Australia-US comparison, in nominal terms b) Australia, in real terms
0
50
100
150
200
1989
-90
1994
-95
1999
-00
2004
-05
2009
-10
2014
-15
inde
x no
.
US$/$A exchange rate index
Rural commodity price index – US$
Rural commodity price index – A$
0
50
100
150
200
1989
-90
1994
-95
1999
-00
2004
-05
2009
-10
2014
-15
inde
x no
.
Real trade-weighted exchange rate
Real total commodity price index – A$
Real rural commodity price index – A$
Real food consumer price index
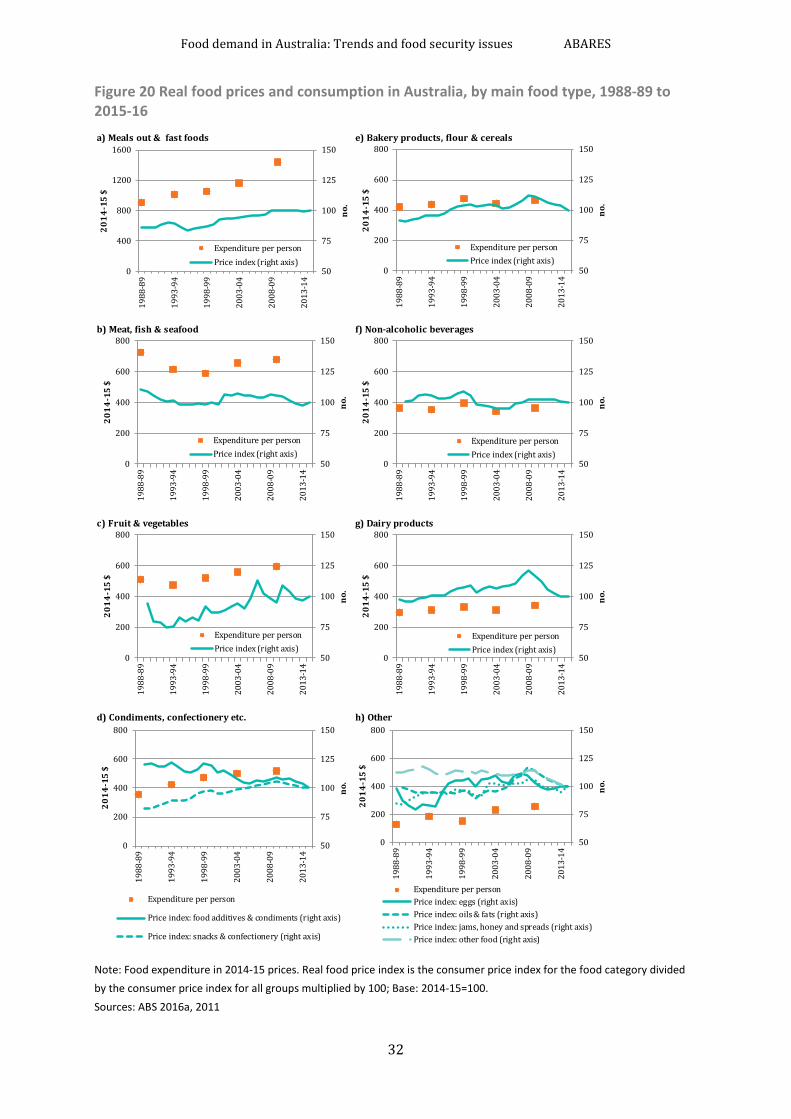
Food demand in Australia: Trends and food security issues ABARES
32
Figure 20 Real food prices and consumption in Australia, by main food type, 1988-89 to 2015-16
Note: Food expenditure in 2014-15 prices. Real food price index is the consumer price index for the food category divided by the consumer price index for all groups multiplied by 100; Base: 2014-15=100. Sources: ABS 2016a, 2011
a) Meals out & fast foods e) Bakery products, flour & cereals
b) Meat, fish & seafood f) Non-alcoholic beverages
c) Fruit & vegetables g) Dairy products
d) Condiments, confectionery etc. h) Other
50
75
100
125
150
0
400
800
1200
160019
88-8
9
1993
-94
1998
-99
2003
-04
2008
-09
2013
-14
no.
2014
-15
$
Expenditure per personPrice index (right axis)
50
75
100
125
150
0
200
400
600
800
1988
-89
1993
-94
1998
-99
2003
-04
2008
-09
2013
-14
no.
2014
-15
$
Expenditure per personPrice index (right axis)
50
75
100
125
150
0
200
400
600
800
1988
-89
1993
-94
1998
-99
2003
-04
2008
-09
2013
-14
no.
2014
-15
$
Expenditure per personPrice index (right axis)
50
75
100
125
150
0
200
400
600
800
1988
-89
1993
-94
1998
-99
2003
-04
2008
-09
2013
-14
no.
2014
-15
$
Expenditure per person
Price index: food additives & condiments (right axis)
Price index: snacks & confectionery (right axis)
50
75
100
125
150
0
200
400
600
800
1988
-89
1993
-94
1998
-99
2003
-04
2008
-09
2013
-14
no.
2014
-15
$
Expenditure per personPrice index (right axis)
50
75
100
125
150
0
200
400
600
800
1988
-89
1993
-94
1998
-99
2003
-04
2008
-09
2013
-14
no.
2014
-15
$
Expenditure per personPrice index (right axis)
50
75
100
125
150
0
200
400
600
800
1988
-89
1993
-94
1998
-99
2003
-04
2008
-09
2013
-14
no.
2014
-15
$
Expenditure per personPrice index (right axis)
50
75
100
125
150
0
200
400
600
800
1988
-89
1993
-94
1998
-99
2003
-04
2008
-09
2013
-14
no.
2014
-15
$
Expenditure per personPrice index: eggs (right axis)Price index: oils & fats (right axis)Price index: jams, honey and spreads (right axis)Price index: other food (right axis)

Food demand in Australia: Trends and food security issues ABARES
33
Importance of food trade Over the past 25 years, imports have become a progressively more significant source of food for the household sector, although most food consumed in Australia is produced in Australia. The value of Australia’s household food consumption increased from $49 billion in 1989-90 to $92 billion in 2015-16 (in 2014-15 prices, Figure 21a; see also chapter 2). Australia’s food imports increased from $4 billion in 1989-90 to $14 billion in 2015-16. Overall, the share of imports in household food consumption increased from 8 per cent in 1989-90 to 15 per cent in 2015-16 (Figure 21a).
Figure 21 Importance of trade in Australia's food consumption and production, 1989-90 to 2015-16
Note: In 2014-15 prices; CPI-adjusted measures. Excludes alcoholic beverages. Indicative food production is calculated as household food consumption minus food imports plus food exports. Sources: ABS 2016a,b; ABARES 2016
An indicative value of Australia’s food production—calculated by adjusting household food consumption for net food trade—increased from $66 billion in 1989-90 to $114 billion in 2015-16 (Figure 21b). The value of Australia’s food exports also increased, from $21 billion in 1989-90 to $37 billion in 2015-16. However, there have been three distinct phases in the relative importance of Australia’s food export market, broadly corresponding to the phases in Australia’s real exchange rate in Figure 19b:
• strong growth in the 1990s—the share of exports in food production increased from 29 per cent in 1991-92 to a peak of 37 per cent in 2001-02 and 2002-03
• reduced exports in the 2000s as food was diverted to the strongly growing domestic market, largely resulting from strong income growth associated with the resources boom (see chapter 2)—the food export share fell to 25 per cent in 2009-10
• a resumption of strong export growth in the first half of the 2010s associated with the fall in the real exchange rate and slower growth in domestic food demand—the food export share increased to 32 per cent in 2015-16.
Overall, net food exports were $22 billion in 2015-16, indicating Australia continues to have an important international competitive advantage in food trade (Table 8, Figure 22).
a) Food consumption and imports b) Food production and exports
0
10
20
30
40
50
60
0
20
40
60
80
100
120
1989
-90
1994
-95
1999
-00
2004
-05
2009
-10
2014
-15
%
2014
-15
$b
Household food consumption expenditureFood importsImports/consumption ratio (right axis)
0
10
20
30
40
50
60
0
20
40
60
80
100
120
1989
-90
1994
-95
1999
-00
2004
-05
2009
-10
2014
-15
%
2014
-15
$b
Indicative food productionFood exportsExports/production ratio (right axis)
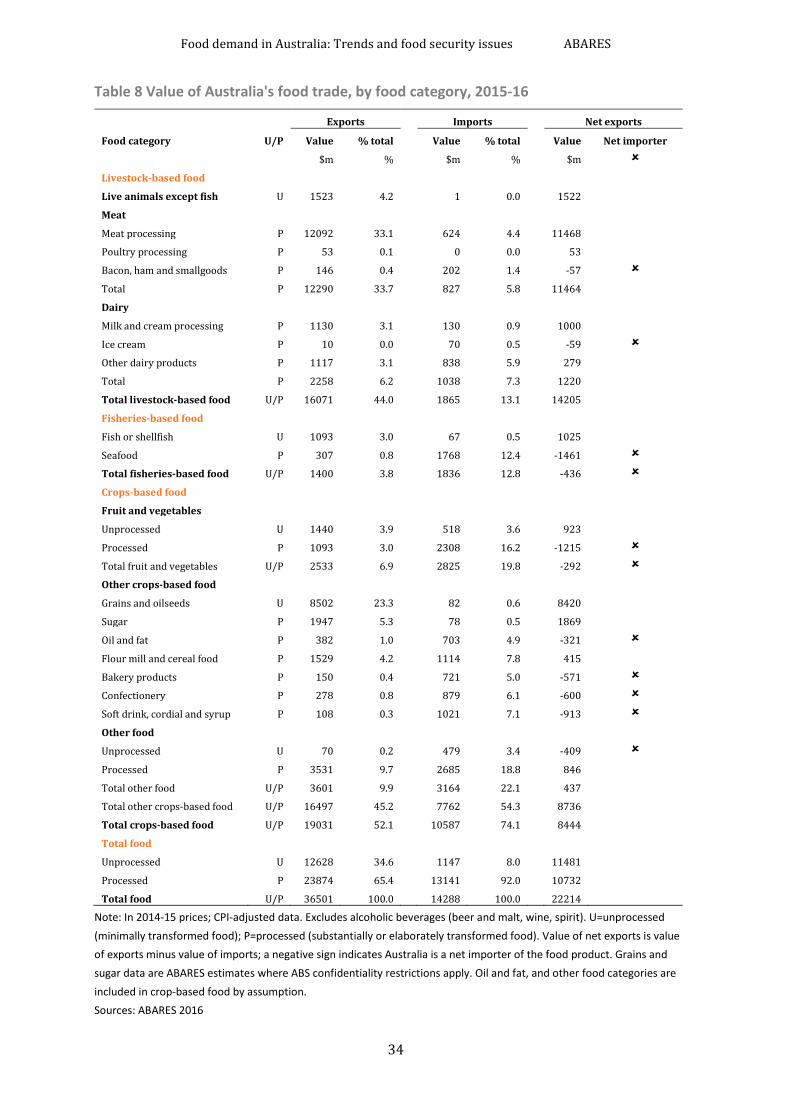
Food demand in Australia: Trends and food security issues ABARES
34
Table 8 Value of Australia's food trade, by food category, 2015-16
Food category U/P
Exports Imports Net exports
Value % total Value % total Value Net importer
$m % $m % $m
Livestock-based food
Live animals except fish U 1523 4.2 1 0.0 1522 Meat
Meat processing P 12092 33.1 624 4.4 11468
Poultry processing P 53 0.1 0 0.0 53
Bacon, ham and smallgoods P 146 0.4 202 1.4 -57
Total P 12290 33.7 827 5.8 11464 Dairy
Milk and cream processing P 1130 3.1 130 0.9 1000 Ice cream P 10 0.0 70 0.5 -59
Other dairy products P 1117 3.1 838 5.9 279
Total P 2258 6.2 1038 7.3 1220
Total livestock-based food U/P 16071 44.0 1865 13.1 14205
Fisheries-based food
Fish or shellfish U 1093 3.0 67 0.5 1025 Seafood P 307 0.8 1768 12.4 -1461
Total fisheries-based food U/P 1400 3.8 1836 12.8 -436 Crops-based food
Fruit and vegetables
Unprocessed U 1440 3.9 518 3.6 923 Processed P 1093 3.0 2308 16.2 -1215
Total fruit and vegetables U/P 2533 6.9 2825 19.8 -292 Other crops-based food
Grains and oilseeds U 8502 23.3 82 0.6 8420
Sugar P 1947 5.3 78 0.5 1869
Oil and fat P 382 1.0 703 4.9 -321
Flour mill and cereal food P 1529 4.2 1114 7.8 415 Bakery products P 150 0.4 721 5.0 -571
Confectionery P 278 0.8 879 6.1 -600 Soft drink, cordial and syrup P 108 0.3 1021 7.1 -913 Other food
Unprocessed U 70 0.2 479 3.4 -409 Processed P 3531 9.7 2685 18.8 846
Total other food U/P 3601 9.9 3164 22.1 437
Total other crops-based food U/P 16497 45.2 7762 54.3 8736
Total crops-based food U/P 19031 52.1 10587 74.1 8444
Total food
Unprocessed U 12628 34.6 1147 8.0 11481
Processed P 23874 65.4 13141 92.0 10732
Total food U/P 36501 100.0 14288 100.0 22214
Note: In 2014-15 prices; CPI-adjusted data. Excludes alcoholic beverages (beer and malt, wine, spirit). U=unprocessed (minimally transformed food); P=processed (substantially or elaborately transformed food). Value of net exports is value of exports minus value of imports; a negative sign indicates Australia is a net importer of the food product. Grains and sugar data are ABARES estimates where ABS confidentiality restrictions apply. Oil and fat, and other food categories are included in crop-based food by assumption. Sources: ABARES 2016
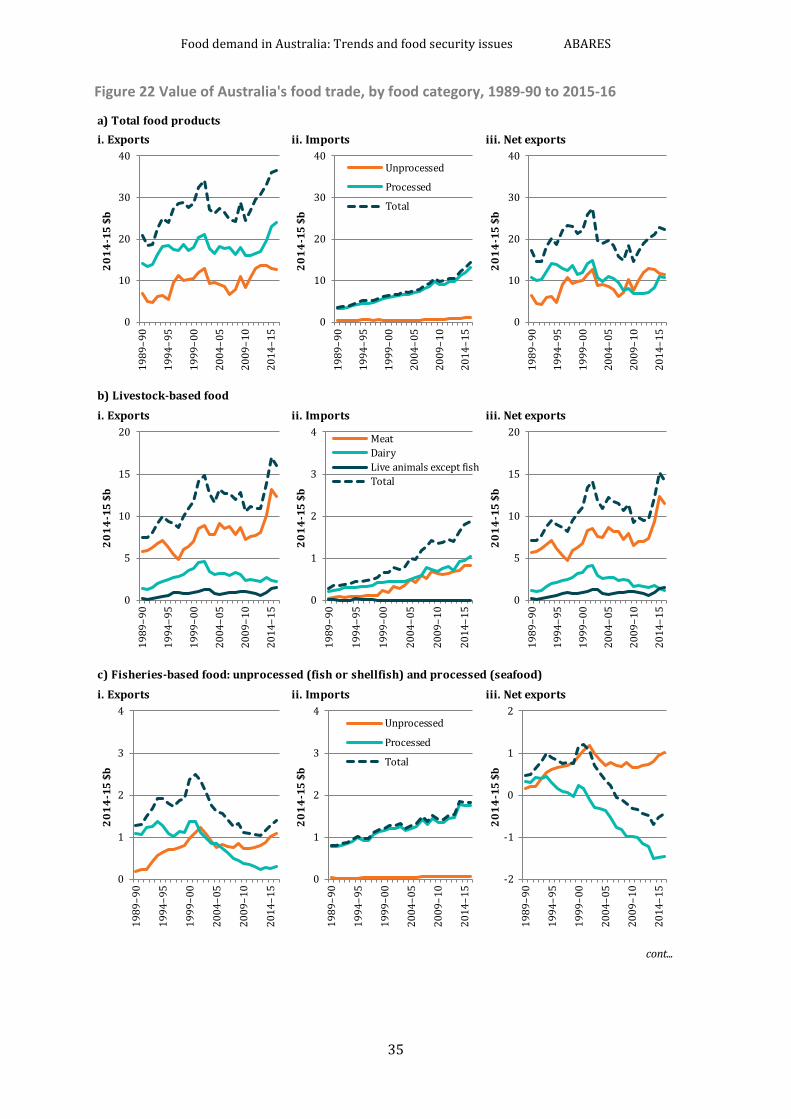
Food demand in Australia: Trends and food security issues ABARES
35
Figure 22 Value of Australia's food trade, by food category, 1989-90 to 2015-16
a) Total food productsi. Exports ii. Imports iii. Net exports
b) Livestock-based foodi. Exports ii. Imports iii. Net exports
c) Fisheries-based food: unprocessed (fish or shellfish) and processed (seafood)i. Exports ii. Imports iii. Net exports
cont...
0
10
20
30
4019
89–9
0
1994
–95
1999
–00
2004
–05
2009
–10
2014
–15
2014
-15
$b
0
10
20
30
40
1989
–90
1994
–95
1999
–00
2004
–05
2009
–10
2014
–15
2014
-15
$b
Unprocessed
Processed
Total
0
10
20
30
40
1989
–90
1994
–95
1999
–00
2004
–05
2009
–10
2014
–15
2014
-15
$b
0
1
2
3
4
1989
–90
1994
–95
1999
–00
2004
–05
2009
–10
2014
–15
2014
-15
$b
0
1
2
3
4
1989
–90
1994
–95
1999
–00
2004
–05
2009
–10
2014
–15
2014
-15
$b
Unprocessed
Processed
Total
-2
-1
0
1
2
1989
–90
1994
–95
1999
–00
2004
–05
2009
–10
2014
–15
2014
-15
$b
0
5
10
15
20
1989
–90
1994
–95
1999
–00
2004
–05
2009
–10
2014
–15
2014
-15
$b
0
1
2
3
4
1989
–90
1994
–95
1999
–00
2004
–05
2009
–10
2014
–15
2014
-15
$b
MeatDairyLive animals except fishTotal
0
5
10
15
20
1989
–90
1994
–95
1999
–00
2004
–05
2009
–10
2014
–15
2014
-15
$b
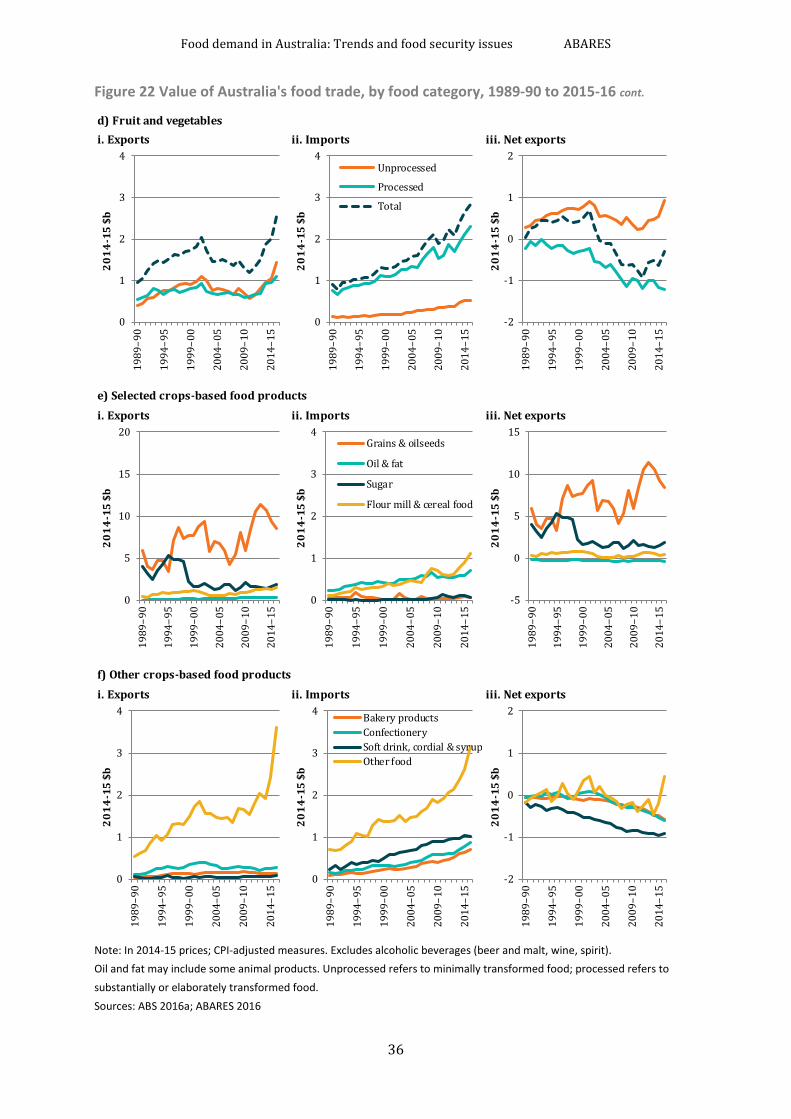
Food demand in Australia: Trends and food security issues ABARES
36
Figure 22 Value of Australia's food trade, by food category, 1989-90 to 2015-16 cont.
Note: In 2014-15 prices; CPI-adjusted measures. Excludes alcoholic beverages (beer and malt, wine, spirit). Oil and fat may include some animal products. Unprocessed refers to minimally transformed food; processed refers to substantially or elaborately transformed food. Sources: ABS 2016a; ABARES 2016
d) Fruit and vegetablesi. Exports ii. Imports iii. Net exports
e) Selected crops-based food productsi. Exports ii. Imports iii. Net exports
f) Other crops-based food productsi. Exports ii. Imports iii. Net exports
0
1
2
3
4
1989
–90
1994
–95
1999
–00
2004
–05
2009
–10
2014
–15
2014
-15
$b
0
1
2
3
4
1989
–90
1994
–95
1999
–00
2004
–05
2009
–10
2014
–15
2014
-15
$b
Unprocessed
Processed
Total
-2
-1
0
1
2
1989
–90
1994
–95
1999
–00
2004
–05
2009
–10
2014
–15
2014
-15
$b
0
1
2
3
4
1989
–90
1994
–95
1999
–00
2004
–05
2009
–10
2014
–15
2014
-15
$b
0
1
2
3
4
1989
–90
1994
–95
1999
–00
2004
–05
2009
–10
2014
–15
2014
-15
$b
Bakery productsConfectionerySoft drink, cordial & syrupOther food
-2
-1
0
1
2
1989
–90
1994
–95
1999
–00
2004
–05
2009
–10
2014
–15
2014
-15
$b
0
5
10
15
20
1989
–90
1994
–95
1999
–00
2004
–05
2009
–10
2014
–15
2014
-15
$b
0
1
2
3
4
1989
–90
1994
–95
1999
–00
2004
–05
2009
–10
2014
–15
2014
-15
$b
Grains & oilseeds
Oil & fat
Sugar
Flour mill & cereal food
-5
0
5
10
15
1989
–90
1994
–95
1999
–00
2004
–05
2009
–10
2014
–15
2014
-15
$b
Food demand in Australia: Trends and food security issues ABARES
37
The three export market phases were most evident for Australia’s exports of meat (Figure 22b) and fruit and vegetables (Figure 22d), although there were broadly similar phases (timing and magnitude differ somewhat) for unprocessed fisheries-based food (fish or shellfish; Figure 22c), grains and oilseeds (Figure 22e) and other food (Figure 22f). Food imports mainly comprise processed food products (92 per cent of total in 2015-16).
In 2015-16, Australia was a significant net importer in six food categories: seafood; processed fruit and vegetables; soft drink, cordials and syrups; confectionary; bakery products; and oils and fats (Table 8). There are several areas of increasing net import reliance since at least around 1999-00.
• Processed fisheries-based food (seafood)—through a combination of falling exports since 1999-00 and increasing imports, there has been a switch in the net trade position, from net exports of $0.2 billion in 1999-00 to net imports of $1.5 billion in 2015-16 (Figure 22c).
• Processed fruit and vegetables—exports have increased since 1999-00, but imports have continued to increase; net imports increased from $0.02 billion in 1992-93 to $1.2 billion in 2015-16 (Figure 22d).
• Soft drinks, cordials and syrups—net imports have increased from $0.2 billion in 1989-90 to $1.0 billion in 2014-15 and $0.9 billion in 2015-16 (Figure 22f).
• Confectionary—the net trade position was approximately balanced between 1989-90 and 2003-04, but net imports have since increased to $0.6 billion in 2015-16 (Figure 22f).
• Bakery products—with increasing imports, net imports have increased gradually in recent years from $0.1 billion in 2005-06 to $0.6 billion in 2015-16 (Figure 22f).
The real value of Australia’s net exports of dairy products have also declined over the past fifteen years, largely reversing the improvement in the net trade position over the previous decade. Net dairy exports increased from $1.1 billion in 1990-91 to $4.2 billion in 2001-02, but have since declined to $1.2 billion in 2015-16 (Figure 22b).
Food demand in Australia: Trends and food security issues ABARES
38
5 Food security issues The main focus in this chapter is to examine key factors in Australia’s policy approach that underpin Australia’s high level of food security. Not-for-profit organisations also make an important contribution to food security in low-income households, supported by individual donations and contributions from government, industry and volunteer workers.
Definitions of food security and the role of government One of the most important roles of government is to ensure the food security of the population. In general terms, food security refers to the adequate and reliable provision of food that is safe, nutritious and affordable (Box 1). In aggregate, as a net food exporter, Australia produces food in excess of domestic requirements (Table 8). Key domestic food security concerns relate to food access and use for low income people, particularly in regional and remote areas.
Several important private risk management strategies in the food market are briefly discussed in appendix C. Private investment in food supply reliability is key to supporting a high level of food security in Australia, but may still be below the optimal level in some circumstances. Notably, governments have an important role in ensuring people have access to adequate food in emergency situations following natural disasters such as floods and bushfires. By international standards, Australia has a relatively strong consumer policy framework covering, for example, food safety issues (appendix D).
Box 1 Definitions of food security
FAO (2012) distinguishes between food security and nutrition security.
• Food security ‘exists when all people, at all times, have physical, social and economic access to sufficient, safe and nutritious food that meets their dietary needs and food preferences for an active and healthy life’ (FAO 2012, p. 57).
• Nutrition security is a related concept that ‘exists when secure access to an appropriately nutritious diet is coupled with a sanitary environment, adequate health services and care, in order to ensure a healthy and active life for all household members. Nutrition security differs from food security in that it also considers aspects of adequate caring practices, health and hygiene in addition to dietary adequacy’ (FAO 2012, p. 57).
Food security may be examined at the global, national, regional and household level. For example, FAO (2012) defines household food security as the application of the food security concept to the family level, with individuals within households the focus of concern. Goodall (2009) defines food security in five contexts.
• Global food security—production and distribution of sufficient food to meet fundamental nutritional requirements around the world.
• National food security—a nation’s ability to meet domestic food demand.
• Household food security—a household or community’s ability to access food (particularly healthy food), given physical and income constraints.
• Emergency food security—continuity of food supply in the face of sudden disruptions.
• Future food security—given resource constraints and the threat of impacts from climate change, sustainable production of sufficient food to meet domestic and global food demands in the future.
The World Bank (2007) highlights three key aspects of food security—food availability (producing enough to eat), food access (having enough to eat) and food use (ending hidden hunger). Food use translates food security into nutrition security, and is also linked to water access and sanitation.
Food insecurity is mainly a problem in developing countries—in 2014-16, 775 million people or 13 per cent of the total population in low and middle income countries were unable to access sufficient food to meet their daily minimum dietary energy requirements (FAO 2017). In high income countries, food insecurity was an issue for 23 million people or 1.6 per cent of the total population in 2014-16 (FAO 2017).
Food demand in Australia: Trends and food security issues ABARES
39
From an economic perspective, governments aim to address market failures and achieve distributional goals. The failure of private markets to produce a socially optimal level of goods and services provides the economic rationale for considering government intervention. Two market failures are relevant for considering food security issues in the remainder of this chapter.
• Externalities or spillover effects—where there are significant flow-on health benefits (or costs) from consuming particular food types that are not reflected in food prices.
• Imperfect information—where consumers have inadequate market information in making consumption decisions.
Market failures are not always a sufficient reason for governments to intervene in the market. Governments should also ensure that policy interventions are assessed to be cost effective; for example, ideally, government policies should not have significant unintended negative consequences or cause further distortions in the market. Three important criteria may be used to assess policy options relevant to local, regional and global food security.
• Efficiency—produce food of a given quality at least cost over time.
• Equity—ensure low income people have adequate access to food and related essential goods and services (such as clean water, education and health services).
• Resilience—reduce the probability of major supply disruptions occurring (for example, through investing in Australia’s biosecurity system to manage the risk of a serious pest incursion) and reduce the cost of supply disruptions when they do occur (for example, ensuring adequate emergency food supply to local or regional communities in natural disasters).
Other criteria include, for example, administrative simplicity (taking into account administration and compliance costs to government, industry and others) and flexibility to adapt to changing economic and other circumstances. Some aspects of the policy assessment and implementation process rely on the subjective judgment of governments. This is particularly important in assessing the equity implications of a policy option. It may also not be possible to quantify all the costs and benefits of a policy option (or even, in some cases, to identify all significant consequences).
Australia’s tax-transfer system The tax-transfer system is a key component of the overarching policy framework that contributes to Australia’s high level of food security. Two mechanisms that are significant contributors to food security are:
• income support to low-income households through transfer payments, and
• exemption of fresh food in the goods and services tax (GST).
As noted in chapter 2, income and food prices are important economic influences on consumer food choices (see also appendix B). The aim in this section is to note some key features of the system, particularly as they relate to food security (broader issues are examined in, for example, Australian Government 2015a).
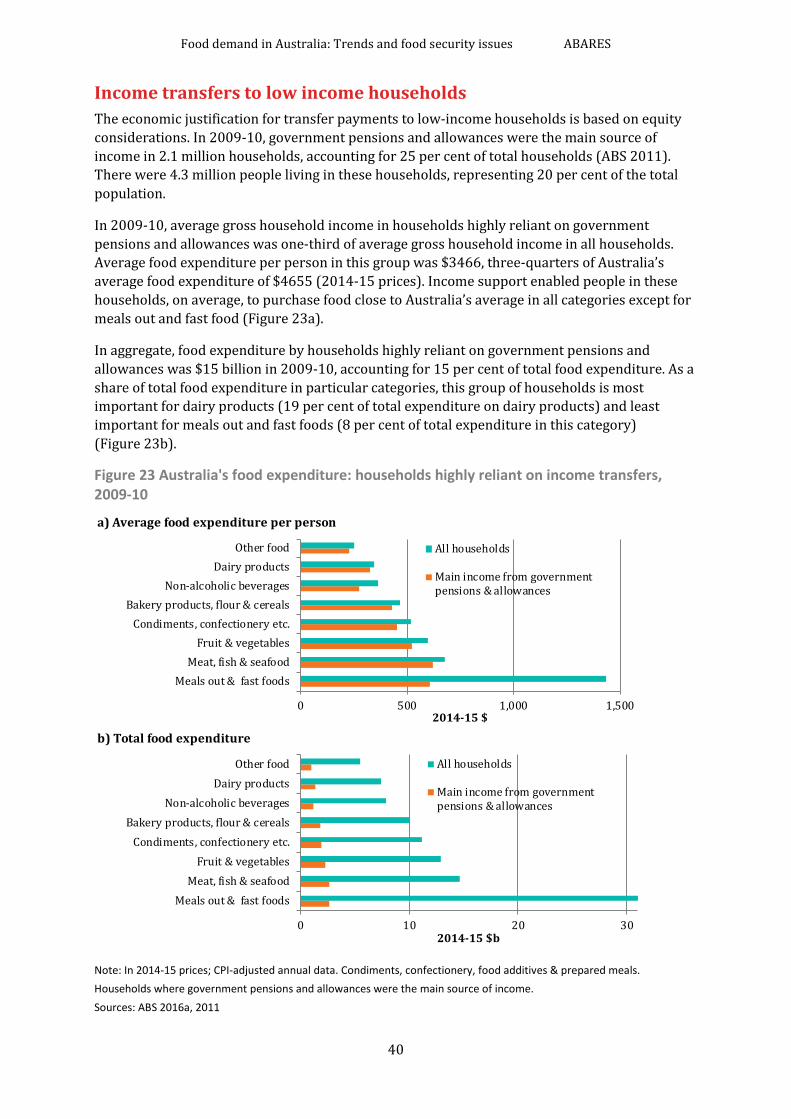
Food demand in Australia: Trends and food security issues ABARES
40
Income transfers to low income households The economic justification for transfer payments to low-income households is based on equity considerations. In 2009-10, government pensions and allowances were the main source of income in 2.1 million households, accounting for 25 per cent of total households (ABS 2011). There were 4.3 million people living in these households, representing 20 per cent of the total population.
In 2009-10, average gross household income in households highly reliant on government pensions and allowances was one-third of average gross household income in all households. Average food expenditure per person in this group was $3466, three-quarters of Australia’s average food expenditure of $4655 (2014-15 prices). Income support enabled people in these households, on average, to purchase food close to Australia’s average in all categories except for meals out and fast food (Figure 23a).
In aggregate, food expenditure by households highly reliant on government pensions and allowances was $15 billion in 2009-10, accounting for 15 per cent of total food expenditure. As a share of total food expenditure in particular categories, this group of households is most important for dairy products (19 per cent of total expenditure on dairy products) and least important for meals out and fast foods (8 per cent of total expenditure in this category) (Figure 23b).
Figure 23 Australia's food expenditure: households highly reliant on income transfers, 2009-10
Note: In 2014-15 prices; CPI-adjusted annual data. Condiments, confectionery, food additives & prepared meals. Households where government pensions and allowances were the main source of income. Sources: ABS 2016a, 2011
a) Average food expenditure per person
b) Total food expenditure
0 10 20 30
Meals out & fast foodsMeat, fish & seafood
Fruit & vegetablesCondiments, confectionery etc.
Bakery products, flour & cerealsNon-alcoholic beverages
Dairy productsOther food
2014-15 $b
All households
Main income from governmentpensions & allowances
0 500 1,000 1,500
Meals out & fast foodsMeat, fish & seafood
Fruit & vegetablesCondiments, confectionery etc.
Bakery products, flour & cerealsNon-alcoholic beverages
Dairy productsOther food
2014-15 $
All households
Main income from governmentpensions & allowances
Food demand in Australia: Trends and food security issues ABARES
41
Australia’s goods and services tax: OECD comparisons Fresh food is exempt in Australia’s goods and services tax (GST), reducing the consumer price of fresh food (all else constant). There are two economic implications of exempting fresh food in the GST relating to key food security concerns across households.
• Equity implications—complementing the transfer system by reducing the tax burden in low-income households; meat, fish and seafood, and fruit and vegetables are major food expenditure categories, on average, for people in households that are highly reliant on income transfers.
• Encouraging the consumption of fresh food—consumption of nutritious fresh food has important positive health benefits for people (positive externalities), reducing future health costs to the individual and society overall (all else constant).
The GST applies to meals out and fast foods, the largest food expenditure category except, on average, in households highly reliant on government transfer payments (Figure 23). Notably, average expenditure per person on meals out and fast foods increases strongly with income (Table 5, Figure 8). Forgone GST revenue from the exemption of fresh food was around $6.7 billion in 2015-16 (Australian Government 2015b).
Australia’s GST was introduced in 2000, replacing a number of narrow-based taxes including, most notably, the complex wholesale sales tax (WST) system (Figure 24a). Changes were also made to personal income tax arrangements and family payments, ‘in part to compensate for the effect of an expected small net increase in indirect taxes’ (Australian Government 2015a, p.131). In Australia, the GST is a broad-based consumption tax that applies at a rate of 10 per cent. The GST does not apply to all consumer goods and services in Australia—in total, around 49 per cent of Australia’s consumption spending is subject to the GST (VAT revenue ratio or VRR in Table 9).
The change to a GST system occurred later in Australia than in many OECD countries (Figure 24b). Broad-based consumption taxes—referred to as a value added tax (VAT) or a goods and services tax (GST)—apply in nearly all OECD countries (Figure 24, Table 9 and Table 10; see category 5111 in the OECD classification of taxes outlined in appendix E). A wide range of VAT rates and coverage apply across OECD countries. Notably, exemptions or reduced rates for food apply in 28 OECD countries (Table 10).
Most countries implement reduced VAT rates on necessities such as food and water in order to alleviate the tax burden on low-income households. (OECD 2016a, p. 77)
Reduced VAT rates are also used for stimulating consumption of “merit goods” (e.g. cultural products and education) and goods with positive externalities (e.g. energy-saving appliances). (OECD 2016a, p. 77)
That is, in most OECD countries, reduced rates or exemptions for food complement transfer payments in the welfare system to achieve food security objectives (see also Sassi et al. 2013). For example, VAT exemptions for food apply in the United Kingdom where the standard VAT rate is 20 per cent, and in Canada (for basic groceries) where the standard VAT rate is 5 per cent. By contrast, New Zealand applies a broad-based consumption tax to nearly all goods and services, including food, at a rate of 15 per cent.
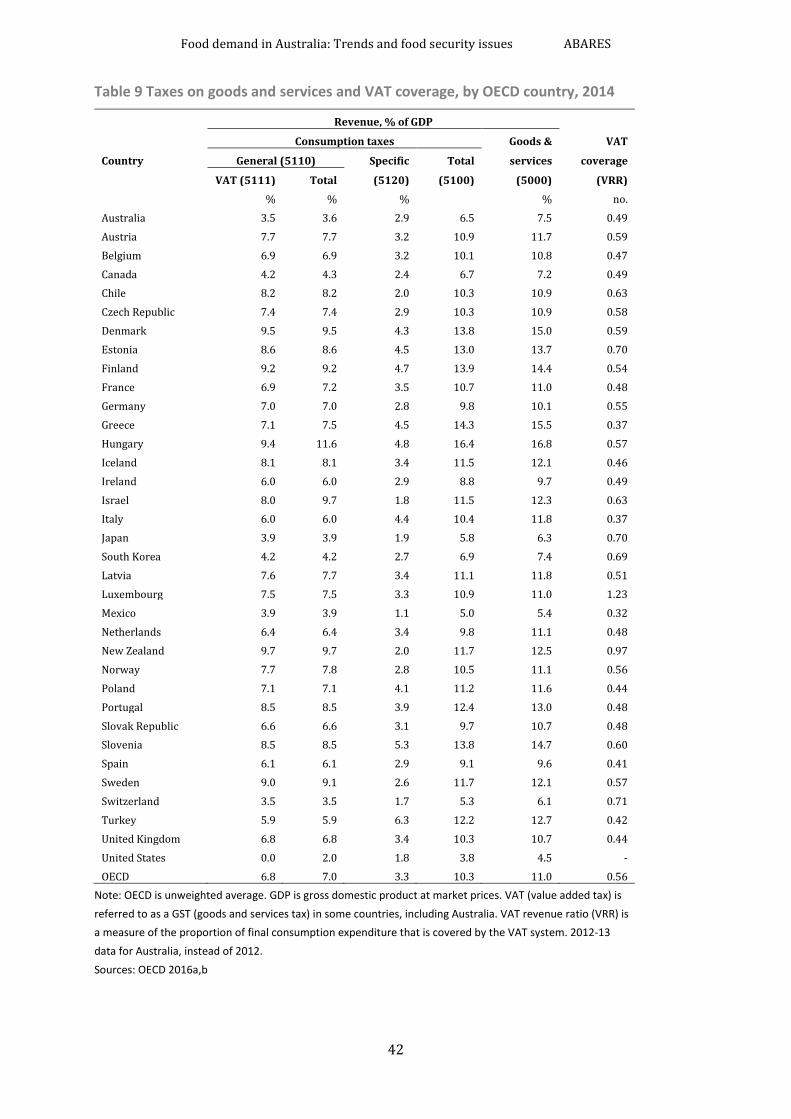
Food demand in Australia: Trends and food security issues ABARES
42
Table 9 Taxes on goods and services and VAT coverage, by OECD country, 2014
Country
Revenue, % of GDP
VAT Consumption taxes Goods &
General (5110) Specific Total services coverage
VAT (5111) Total (5120) (5100) (5000) (VRR) % % % % no.
Australia 3.5 3.6 2.9 6.5 7.5 0.49 Austria 7.7 7.7 3.2 10.9 11.7 0.59 Belgium 6.9 6.9 3.2 10.1 10.8 0.47 Canada 4.2 4.3 2.4 6.7 7.2 0.49 Chile 8.2 8.2 2.0 10.3 10.9 0.63 Czech Republic 7.4 7.4 2.9 10.3 10.9 0.58 Denmark 9.5 9.5 4.3 13.8 15.0 0.59 Estonia 8.6 8.6 4.5 13.0 13.7 0.70 Finland 9.2 9.2 4.7 13.9 14.4 0.54 France 6.9 7.2 3.5 10.7 11.0 0.48 Germany 7.0 7.0 2.8 9.8 10.1 0.55 Greece 7.1 7.5 4.5 14.3 15.5 0.37 Hungary 9.4 11.6 4.8 16.4 16.8 0.57 Iceland 8.1 8.1 3.4 11.5 12.1 0.46 Ireland 6.0 6.0 2.9 8.8 9.7 0.49 Israel 8.0 9.7 1.8 11.5 12.3 0.63 Italy 6.0 6.0 4.4 10.4 11.8 0.37 Japan 3.9 3.9 1.9 5.8 6.3 0.70 South Korea 4.2 4.2 2.7 6.9 7.4 0.69 Latvia 7.6 7.7 3.4 11.1 11.8 0.51 Luxembourg 7.5 7.5 3.3 10.9 11.0 1.23 Mexico 3.9 3.9 1.1 5.0 5.4 0.32 Netherlands 6.4 6.4 3.4 9.8 11.1 0.48 New Zealand 9.7 9.7 2.0 11.7 12.5 0.97 Norway 7.7 7.8 2.8 10.5 11.1 0.56 Poland 7.1 7.1 4.1 11.2 11.6 0.44 Portugal 8.5 8.5 3.9 12.4 13.0 0.48 Slovak Republic 6.6 6.6 3.1 9.7 10.7 0.48 Slovenia 8.5 8.5 5.3 13.8 14.7 0.60 Spain 6.1 6.1 2.9 9.1 9.6 0.41 Sweden 9.0 9.1 2.6 11.7 12.1 0.57 Switzerland 3.5 3.5 1.7 5.3 6.1 0.71 Turkey 5.9 5.9 6.3 12.2 12.7 0.42 United Kingdom 6.8 6.8 3.4 10.3 10.7 0.44 United States 0.0 2.0 1.8 3.8 4.5 - OECD 6.8 7.0 3.3 10.3 11.0 0.56
Note: OECD is unweighted average. GDP is gross domestic product at market prices. VAT (value added tax) is referred to as a GST (goods and services tax) in some countries, including Australia. VAT revenue ratio (VRR) is a measure of the proportion of final consumption expenditure that is covered by the VAT system. 2012-13 data for Australia, instead of 2012. Sources: OECD 2016a,b
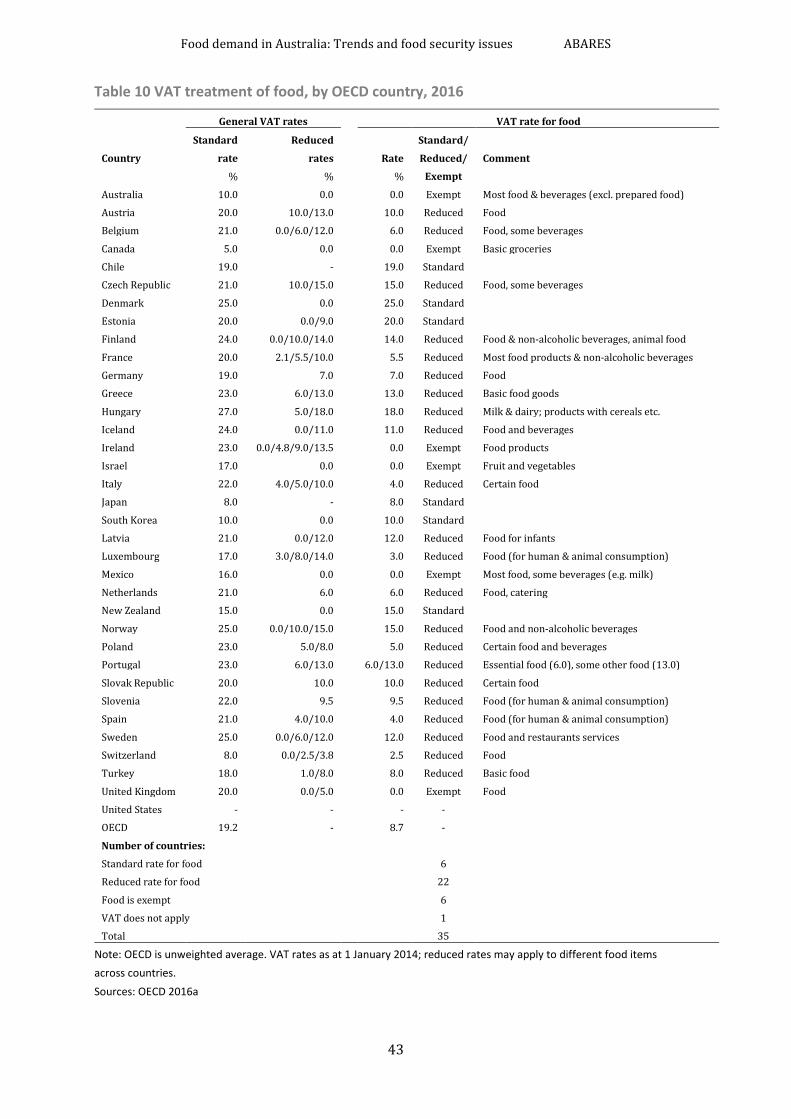
Food demand in Australia: Trends and food security issues ABARES
43
Table 10 VAT treatment of food, by OECD country, 2016
General VAT rates VAT rate for food
Country
Standard Reduced Standard/
Comment rate rates Rate Reduced/
% % % Exempt
Most food & beverages (excl. prepared food) Australia 10.0 0.0 0.0 Exempt
Austria 20.0 10.0/13.0 10.0 Reduced Food
Belgium 21.0 0.0/6.0/12.0 6.0 Reduced Food, some beverages
Canada 5.0 0.0 0.0 Exempt Basic groceries
Chile 19.0 - 19.0 Standard
Food, some beverages Czech Republic 21.0 10.0/15.0 15.0 Reduced
Denmark 25.0 0.0 25.0 Standard
Food & non-alcoholic beverages, animal food
Estonia 20.0 0.0/9.0 20.0 Standard
Finland 24.0 0.0/10.0/14.0 14.0 Reduced
France 20.0 2.1/5.5/10.0 5.5 Reduced Most food products & non-alcoholic beverages
Germany 19.0 7.0 7.0 Reduced Food
Greece 23.0 6.0/13.0 13.0 Reduced Basic food goods
Hungary 27.0 5.0/18.0 18.0 Reduced Milk & dairy; products with cereals etc.
Iceland 24.0 0.0/11.0 11.0 Reduced Food and beverages
Ireland 23.0 0.0/4.8/9.0/13.5 0.0 Exempt Food products
Israel 17.0 0.0 0.0 Exempt Fruit and vegetables
Italy 22.0 4.0/5.0/10.0 4.0 Reduced Certain food
Japan 8.0 - 8.0 Standard
Food for infants
South Korea 10.0 0.0 10.0 Standard
Latvia 21.0 0.0/12.0 12.0 Reduced
Luxembourg 17.0 3.0/8.0/14.0 3.0 Reduced Food (for human & animal consumption)
Mexico 16.0 0.0 0.0 Exempt Most food, some beverages (e.g. milk)
Netherlands 21.0 6.0 6.0 Reduced Food, catering
New Zealand 15.0 0.0 15.0 Standard
Food and non-alcoholic beverages Norway 25.0 0.0/10.0/15.0 15.0 Reduced
Poland 23.0 5.0/8.0 5.0 Reduced Certain food and beverages
Portugal 23.0 6.0/13.0 6.0/13.0 Reduced Essential food (6.0), some other food (13.0)
Slovak Republic 20.0 10.0 10.0 Reduced Certain food
Slovenia 22.0 9.5 9.5 Reduced Food (for human & animal consumption)
Spain 21.0 4.0/10.0 4.0 Reduced Food (for human & animal consumption)
Sweden 25.0 0.0/6.0/12.0 12.0 Reduced Food and restaurants services
Switzerland 8.0 0.0/2.5/3.8 2.5 Reduced Food
Turkey 18.0 1.0/8.0 8.0 Reduced Basic food
United Kingdom 20.0 0.0/5.0 0.0 Exempt Food
United States - - - -
OECD 19.2 - 8.7 -
Number of countries: Standard rate for food 6
Reduced rate for food 22
Food is exempt 6
VAT does not apply 1
Total 35
Note: OECD is unweighted average. VAT rates as at 1 January 2014; reduced rates may apply to different food items across countries. Sources: OECD 2016a
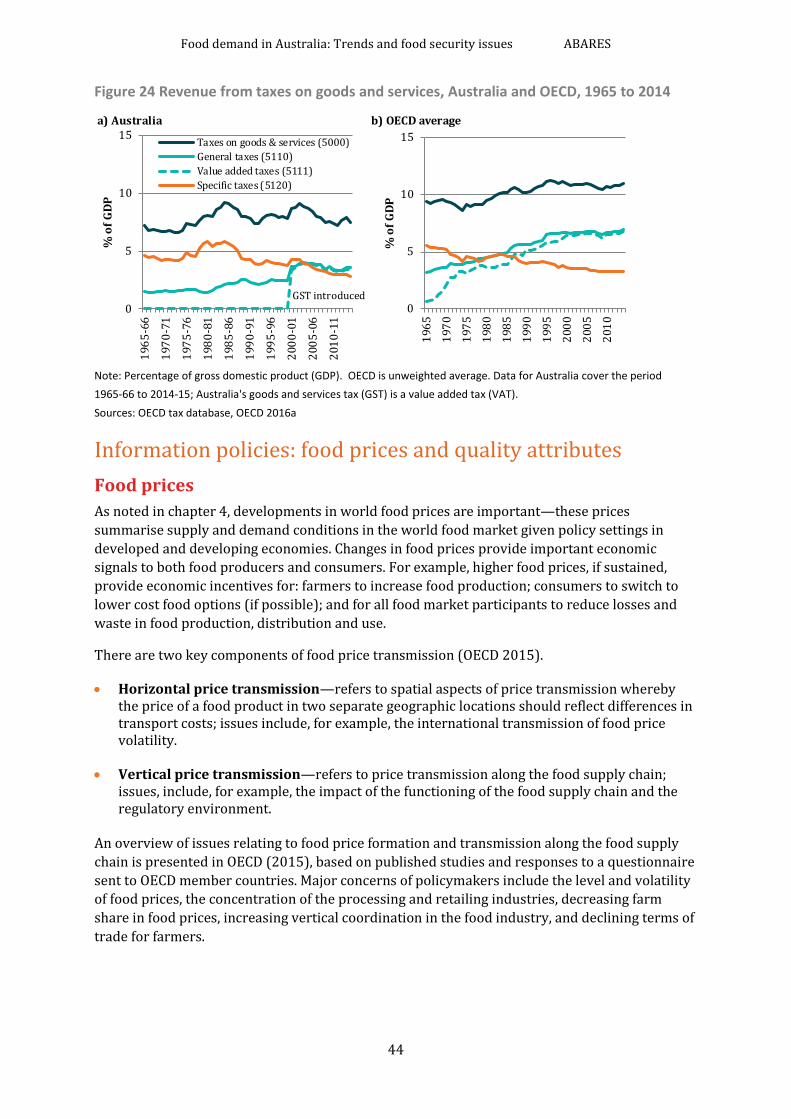
Food demand in Australia: Trends and food security issues ABARES
44
Figure 24 Revenue from taxes on goods and services, Australia and OECD, 1965 to 2014
Note: Percentage of gross domestic product (GDP). OECD is unweighted average. Data for Australia cover the period 1965-66 to 2014-15; Australia's goods and services tax (GST) is a value added tax (VAT). Sources: OECD tax database, OECD 2016a
Information policies: food prices and quality attributes Food prices As noted in chapter 4, developments in world food prices are important—these prices summarise supply and demand conditions in the world food market given policy settings in developed and developing economies. Changes in food prices provide important economic signals to both food producers and consumers. For example, higher food prices, if sustained, provide economic incentives for: farmers to increase food production; consumers to switch to lower cost food options (if possible); and for all food market participants to reduce losses and waste in food production, distribution and use.
There are two key components of food price transmission (OECD 2015).
• Horizontal price transmission—refers to spatial aspects of price transmission whereby the price of a food product in two separate geographic locations should reflect differences in transport costs; issues include, for example, the international transmission of food price volatility.
• Vertical price transmission—refers to price transmission along the food supply chain; issues, include, for example, the impact of the functioning of the food supply chain and the regulatory environment.
An overview of issues relating to food price formation and transmission along the food supply chain is presented in OECD (2015), based on published studies and responses to a questionnaire sent to OECD member countries. Major concerns of policymakers include the level and volatility of food prices, the concentration of the processing and retailing industries, decreasing farm share in food prices, increasing vertical coordination in the food industry, and declining terms of trade for farmers.
a) Australia b) OECD average
0
5
10
1519
65-6
6
1970
-71
1975
-76
1980
-81
1985
-86
1990
-91
1995
-96
2000
-01
2005
-06
2010
-11
% o
f GDP
Taxes on goods & services (5000)General taxes (5110)Value added taxes (5111)Specific taxes (5120)
0
5
10
15
1965
1970
1975
1980
1985
1990
1995
2000
2005
2010
% o
f GDP
GST introduced
Food demand in Australia: Trends and food security issues ABARES
45
Information market failure and food quality attributes In addition to income and food prices, the tastes and preferences of individuals are important economic influences on consumer food choices. An important aspect of information market failure occurs when consumers are not fully informed about the quality attributes of a product or the health implications of food choices (Box 5.2).
In practice, consumers demand a range of fresh food and processed food products (Table 4). In general terms, product attributes can be grouped into three categories (see, for example, Karl and Orwat 1999).
• Search—product attributes may be checked by searching the product before purchase (for example, by looking at or feeling the product).
• Experience—product attributes may be checked after the product is consumed or experienced (allowing consumers to learn through experience and adjust their spending patterns accordingly).
• Credence—claims about product attributes may not be reasonably checked by consumers at all, even after consumption (this is related to the adverse selection problem, which in this case occurs when an individual is uncertain about the quality of a product both before and after purchase; producers of 'good' products are not sufficiently rewarded for quality because consumers cannot discern between 'good' and 'bad' products).
Information market failure mainly relates to the credence attributes of products. Issues relating to the experience attributes of products may include food poisoning incidents in the meals out and fast foods sector, but these food safety issues are addressed through consumer policy and related regulation in the states and territories (Productivity Commission 2009; see also Hogan 2012).
An important issue for Australian food producers is that a potential price premium for food quality is dependent on consumers (in either the domestic or export market) having relevant information about the credence attributes of Australian food produce. Food product labels, discussed briefly below, may be associated with quality attributes that have the potential to earn a price premium in the end use market.
Box 2 Information market failures
Important market failures in food markets relate to the provision of information to consumers.
• Information gaps—in the absence of government intervention, consumers are provided with an inadequate level of information about the quality of a product.
• Limits on the capacity to use information—even with access to sufficient information, consumers may not be able to effectively use that information; that is, the capacity to make optimal decisions may be diminished because of limited knowledge and processing abilities (referred to as ‘bounded rationality’ in the economic literature; see, for example, Garnaut 2008). For example, consumers and producers may adopt rules of thumb in decision making to avoid gathering and processing costs (an example of a rule of thumb is the payback period for a capital investment).
Asymmetric information occurs when information about the attributes of a good differs between buyers and sellers. There are two types of asymmetric information problems: moral hazard and adverse selection. The moral hazard problem occurs when the actions of one individual are not observable to others. The adverse selection problem occurs when one individual cannot identify the type or character of others and, as a consequence, cannot assess the quality of a potential good or service; this has important implications for food producers, especially of fresh food, because it can significantly influence consumer food choices—for example, reliable detection of high quality fruit in the harvest allows avocado producers to earn a price premium for those quality attributes.
Food demand in Australia: Trends and food security issues ABARES
46
Information policies and product labelling A range of information and education policies, such as product labelling and certification programs, may be considered to address information market failures (see, for example, Hogan and Thorpe 2009). There are three types of product labels, which vary according to the approach used to signal information on credence attributes to consumers.
• Type I labels are criteria based, third-party certification programs—these labels signal to consumers that criteria, which define a minimum quality level, have been met with verification by a reputable independent organisation. Examples of Type I labels include the Heart Foundation tick, organic certification, the FAIRTRADE mark and the dolphin-safe tuna label.
• Type II labels are information self-declaration programs—these labels rely on the reputation of the business.
• Type III labels are quantified product information label programs, using preset indices—these labels are report cards that provide more information to consumers about specific attributes of the product. Examples of Type III labels include nutrition labels on food, star ratings labels on food, and energy and water star ratings on appliances to indicate energy and water efficiency, respectively.
Information policies complement Australia’s tax-transfer system by allowing people to be better informed about the health implications of food and lifestyle choices given their individual circumstances. For example, the Australian Government Department of Health has a website with guidelines on healthy lifestyle choices for various population groups including information on nutrition and physical activity (Box 5.3).
Australian governments have had a major role in developing two important food labels that provide consumers with information about food nutrition (both type III labels) (http://healthstarrating.gov.au/internet/healthstarrating/publishing.nsf/Content/About-health-stars).
• Nutrition label—a relatively detailed guide to the nutrition content of a food product; a nutrition information panel is included on most food products.
• Health star rating label—a summary guide to the nutrition content of a food product, implemented since June 2014 on a voluntary basis by the food industry; the health star rating is a front-of-pack labelling system that rates the overall nutritional profile of packaged food and assigns it a rating from ½ a star to 5 stars where a higher star rating indicates a healthier food option.
The education system also contributes to consumer understanding of healthy food choices over the longer term in two ways—by teaching nutrition as part of the school curriculum, and by providing a range of healthy food options in school canteens. For example, in February 2017, the NSW Government released a new healthy schools canteen strategy whereby 75 per cent of canteen menus must comprise healthy food options (such as fruits, vegetables, sandwiches, pastas and stir fries), while the remaining food options require a health star rating of 3.5 stars or higher (Gerathy 2017).
Food demand in Australia: Trends and food security issues ABARES
47
Box 3 Australian Government guidelines for healthy lifestyle choices
Australia currently has a range of guidelines and recommendations for various population groups regarding physical activity, sedentary behaviour, and healthy eating. In the Australian guide to healthy eating, the advice to people is to drink plenty of water and adopt a diet that largely comprises the following five food groups.
• grain (cereal) foods, mostly wholegrain and/or high cereal fibre varieties
• vegetables and legumes/beans
• lean meats and poultry, fish, eggs, tofu, nuts and seeds and legumes/beans
• milk, yoghurt, cheese and/or alternatives, mostly reduced fat
• fruit.
Australia’s physical activity guidelines for adults (18-64 years), for example, include the following.
• doing any physical activity is better than doing none. If you currently do no physical activity, start by doing some, and gradually build up to the recommended amount
• be active on most, preferably all, days every week
• accumulate 150 to 300 minutes (2 ½ to 5 hours) of moderate intensity physical activity or 75 to 150 minutes (1 ¼ to 2 ½ hours) of vigorous intensity physical activity, or an equivalent combination of both moderate and vigorous activities, each week
• do muscle strengthening activities on at least 2 days each week
Source: Australian Government Department of Health (http://www.healthyactive.gov.au/internet/healthyactive/publishing.nsf/Content/recommendations-guidelines)
Food demand in Australia: Trends and food security issues ABARES
48
6 Conclusion The domestic market is important for Australia’s food producers including farmers, food processors and food service providers. By value, around two-thirds of Australia’s food production is used in the domestic market. Food imports have become more important, particularly for processed food, but still account for a relatively low share of household food consumption (15 per cent in 2015-16).
Food is a major expenditure category for households in Australia—current housing costs, food and transport are consistently the three top expenditure categories (based on data from the 1990s and 2000s). The three top food expenditure categories are: meals out and fast foods; meat, fish and seafood; and fruit and vegetables.
Food expenditure per person tends to be higher, on average, for households with higher incomes—notably, the share of total food expenditure spent on meals out and fast foods is significantly higher for households with higher incomes. By contrast, the distribution of food expenditure is broadly similar across household groups based on net worth—that is, households with high net worth spend relatively more on food in aggregate, but the shares spent on the main food categories are broadly similar.
The food industry supplies a broad range of food products and services in response to food demand in different segments of the domestic market. There is ongoing innovation by the food industry to increase the efficiency and effectiveness of the food supply chain, including to enhance further Australia’s high level of food security. For example, major food retailers have developed product lines to sell imperfect fruit and vegetables at lower prices. Patterns of food expenditure indicate there are also likely to be ongoing economic opportunities to obtain a price premium for reliable food quality attributes.
Food demand in Australia: Trends and food security issues ABARES
49
Appendix A: Food consumption and related measures ABS national accounts Several key national accounts measures of food consumption and related variables, presented in chapters 2 and 4, are defined as follows (ABS 2016b).
Gross domestic product (GDP): The total market value of goods and services produced in Australia within a given period after deducting the cost of goods and services used up in the process of production but before deducting allowances for the consumption of fixed capital. It is equivalent to gross national expenditure plus exports of goods and services less imports of goods and services. Gross value added: The value of output at basic prices minus the value of intermediate consumption at purchasers' prices. The term is used to describe gross product by industry and by sector. Basic prices valuation of output removes the distortion caused by variations in the incidence of commodity taxes and subsidies across the output of individual industries. Gross income – households: The total income, whether in cash or kind, receivable by persons normally resident in Australia. It includes both income in return for productive activity (such as compensation of employees, the gross mixed income of unincorporated enterprises, gross operating surplus on dwellings owned by persons, and property income receivable, etc.) as well as transfers receivable (such as social assistance benefits and non-life insurance claims). Net worth In the national and sectoral balance sheets, net worth represents the difference between the stock of assets (both financial and non-financial) and the stock of liabilities (including shares and other equity). Because it is derived residually, it can be negative. Final consumption expenditure – households: Net expenditure on goods and services by persons and expenditure of a current nature by private non-profit institutions serving households. This item excludes expenditures by unincorporated businesses and expenditures on assets by non-profit institutions (included in gross fixed capital formation). Also excluded is expenditure on maintenance of dwellings (treated as intermediate expenses of private enterprises), but personal expenditure on motor vehicles and other durable goods and the imputed rent of owner-occupied dwellings are included. The value of 'backyard' production (including food produced and consumed on farms) is included in household final consumption expenditure and the payment of wages and salaries in kind (e.g. food and lodging supplied free to employees) is counted in both household income and household final consumption expenditure. Current prices: Estimates are valued at the prices of the period to which the observation relates. For example, estimates for this financial year are valued using this financial year’s prices. This contrasts to chain volume measures where the prices used in valuation refer to the prices of the previous year. Chain volume measure: Annually-reweighted chain Laspeyres volume indexes referenced to the current price values in a chosen reference year (i.e. the year when the quarterly chain volume measures sum to the current price annual values). Chain Laspeyres volume measures are compiled by linking together (compounding) movements in volumes, calculated using the average prices of the previous financial year, and applying the compounded movements to the current price estimates of the reference year. Quarterly chain volume estimates are benchmarked to annual chain volume estimates, so that the quarterly estimates for a financial year sum to the corresponding annual estimate.
Food demand in Australia: Trends and food security issues ABARES
50
Implicit price deflator (IPD): Obtained by dividing a current price value by its real counterpart (the chain volume measure). When calculated from the major national accounting aggregates, such as gross domestic product, implicit price deflators relate to a broader range of goods and services in the economy than that represented by any of the individual price indexes that are published by the ABS. Movements in an implicit price deflator reflect both changes in price and changes in the composition of the aggregate for which the deflator is calculated. Reference period: For price or volume indexes, the reference period means the period to which the indexes relate. It is typically set equal to 100 for price indexes and to the corresponding current price values of the reference year for volume indexes, and it does not necessarily coincide with the base period.
ABS household expenditure survey (HES) Household expenditure survey measures of expenditure and related variables, presented in chapters 3 and 5, are defined as follows (ABS 2011).
Household: A person living alone or a group of related or unrelated people who usually live in the same private dwelling. Expenditure: The cost of goods and services acquired during the reference period for private use, whether or not the goods were paid for or consumed. Expenditure is net of refunds. Expenditure is classified according to the Household Expenditure Classification which contains over 600 detailed items. Income: Income consists of all current receipts, whether monetary or in kind, that are received by the household or by individual members of the household, and which are available for, or intended to support, current consumption. Income includes receipts from: • wages and salaries and other receipts from employment (whether from an employer or own
incorporated enterprise) • profit/loss from own unincorporated business (including partnerships) • net investment income (interest, rent, dividends, royalties) • government pensions and allowances • private transfers (e.g. superannuation, workers' compensation, income from annuities, child
support, and financial support received from family members living in another household). Gross income is the sum of the income from all these sources before income tax, the Medicare levy and the Medicare levy surcharge are deducted. Government pensions and allowances: Income support payments from government to persons under social security and related government programs. Included are pensions and allowances received by aged, disabled, unemployed and sick persons, families and children, veterans or their survivors, and study allowances for students. All overseas pensions and benefits are included here, although some may not be paid by overseas governments. Family Tax Benefit, Baby Bonus and Child Disability Assistance Payment paid to recipients of Carer Allowance are also included in government pensions and allowances. Net worth: Net worth is the value of a household's assets less the value of its liabilities. Net worth may be negative when household liabilities exceed household assets. Reference person: The reference person for each household is chosen by applying, to all household members aged 15 years and over, selection criteria, until a single appropriate reference person is identified. Quintiles: Groupings that result from ranking all households or persons in the population in ascending order according to some characteristic (e.g. household income) and then dividing the population into five equal groups, each comprising 20% of the estimated population.
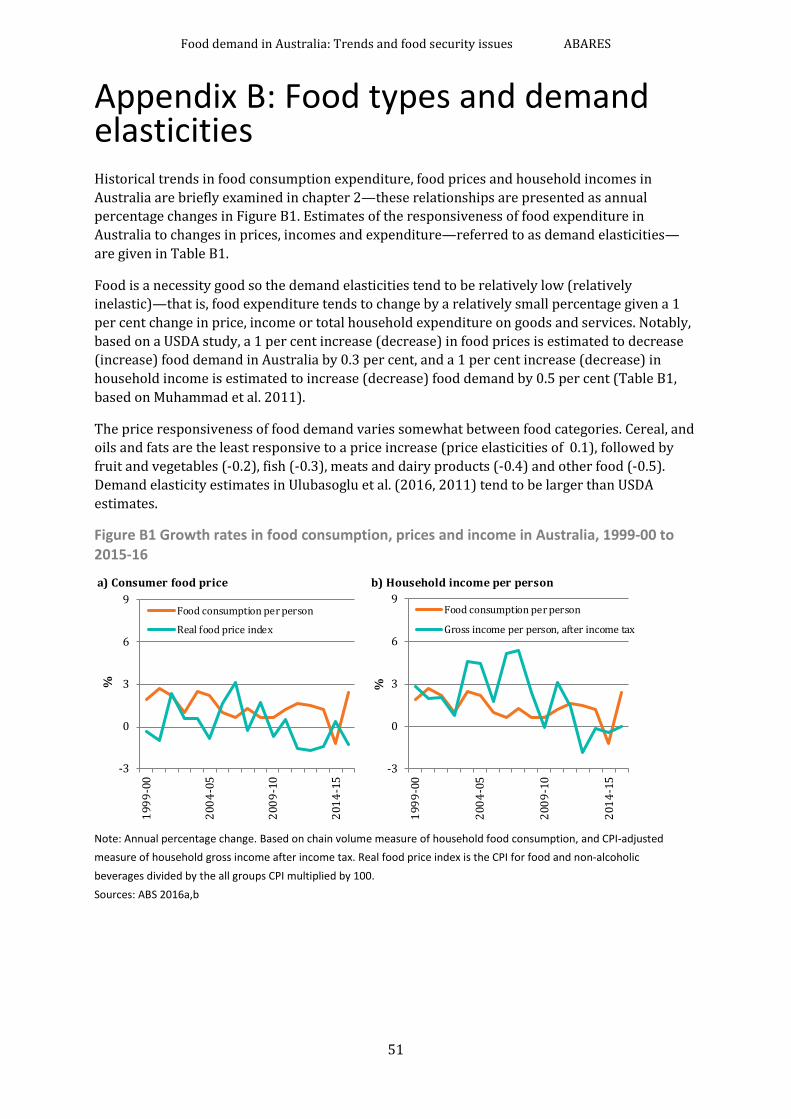
Food demand in Australia: Trends and food security issues ABARES
51
Appendix B: Food types and demand elasticities Historical trends in food consumption expenditure, food prices and household incomes in Australia are briefly examined in chapter 2—these relationships are presented as annual percentage changes in Figure B1. Estimates of the responsiveness of food expenditure in Australia to changes in prices, incomes and expenditure—referred to as demand elasticities—are given in Table B1.
Food is a necessity good so the demand elasticities tend to be relatively low (relatively inelastic)—that is, food expenditure tends to change by a relatively small percentage given a 1 per cent change in price, income or total household expenditure on goods and services. Notably, based on a USDA study, a 1 per cent increase (decrease) in food prices is estimated to decrease (increase) food demand in Australia by 0.3 per cent, and a 1 per cent increase (decrease) in household income is estimated to increase (decrease) food demand by 0.5 per cent (Table B1, based on Muhammad et al. 2011).
The price responsiveness of food demand varies somewhat between food categories. Cereal, and oils and fats are the least responsive to a price increase (price elasticities of 0.1), followed by fruit and vegetables (-0.2), fish (-0.3), meats and dairy products (-0.4) and other food (-0.5). Demand elasticity estimates in Ulubasoglu et al. (2016, 2011) tend to be larger than USDA estimates.
Figure B1 Growth rates in food consumption, prices and income in Australia, 1999-00 to 2015-16
Note: Annual percentage change. Based on chain volume measure of household food consumption, and CPI-adjusted measure of household gross income after income tax. Real food price index is the CPI for food and non-alcoholic beverages divided by the all groups CPI multiplied by 100. Sources: ABS 2016a,b
a) Consumer food price b) Household income per person
-3
0
3
6
9
1999
-00
2004
-05
2009
-10
2014
-15
%
Food consumption per person
Real food price index
-3
0
3
6
9
1999
-00
2004
-05
2009
-10
2014
-15
%
Food consumption per person
Gross income per person, after income tax
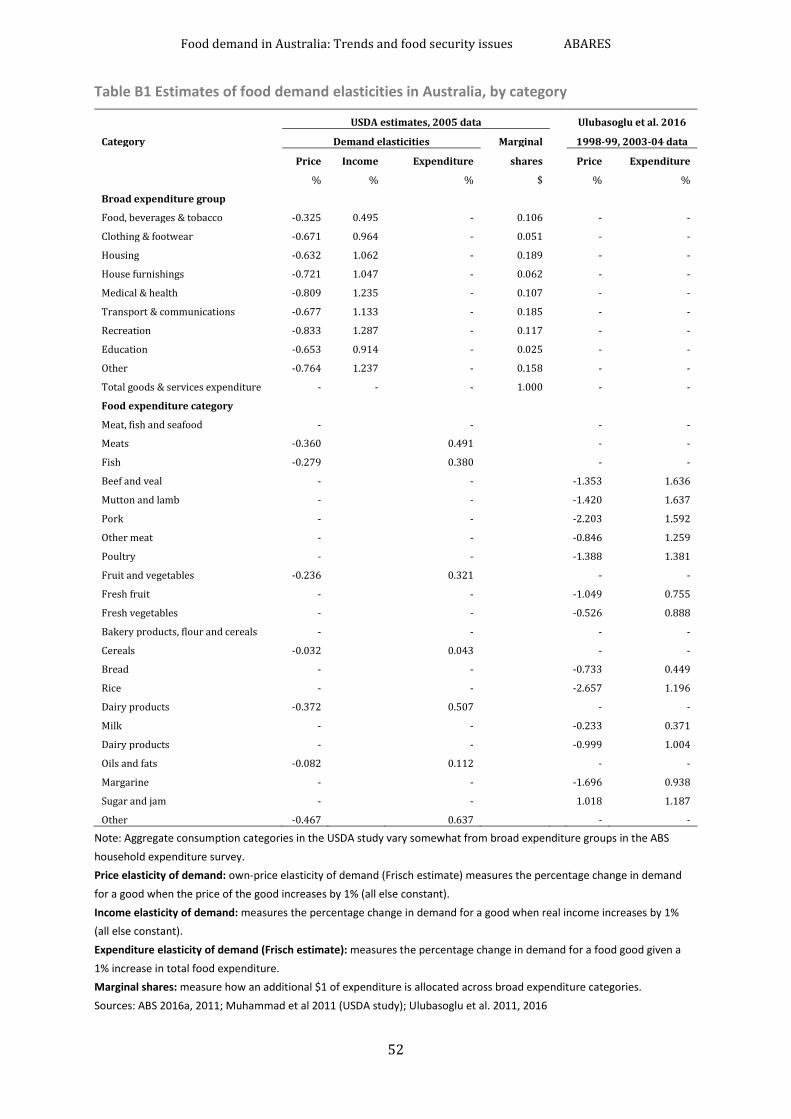
Food demand in Australia: Trends and food security issues ABARES
52
Table B1 Estimates of food demand elasticities in Australia, by category
Category
USDA estimates, 2005 data Ulubasoglu et al. 2016
Demand elasticities Marginal 1998-99, 2003-04 data
Price Income Expenditure shares Price Expenditure
% % % $ % %
Broad expenditure group
Food, beverages & tobacco -0.325 0.495 - 0.106 - -
Clothing & footwear -0.671 0.964 - 0.051 - -
Housing -0.632 1.062 - 0.189 - -
House furnishings -0.721 1.047 - 0.062 - -
Medical & health -0.809 1.235 - 0.107 - -
Transport & communications -0.677 1.133 - 0.185 - -
Recreation -0.833 1.287 - 0.117 - -
Education -0.653 0.914 - 0.025 - -
Other -0.764 1.237 - 0.158 - -
Total goods & services expenditure - - - 1.000 - -
Food expenditure category
Meat, fish and seafood - - - -
Meats -0.360 0.491 - -
Fish -0.279 0.380 - -
Beef and veal - - -1.353 1.636
Mutton and lamb - - -1.420 1.637
Pork - - -2.203 1.592
Other meat - - -0.846 1.259
Poultry - - -1.388 1.381
Fruit and vegetables -0.236 0.321 - -
Fresh fruit - - -1.049 0.755
Fresh vegetables - - -0.526 0.888
Bakery products, flour and cereals - - - -
Cereals -0.032 0.043 - -
Bread - - -0.733 0.449
Rice - - -2.657 1.196
Dairy products -0.372 0.507 - -
Milk - - -0.233 0.371
Dairy products - - -0.999 1.004
Oils and fats -0.082 0.112 - -
Margarine - - -1.696 0.938
Sugar and jam - - 1.018 1.187
Other -0.467 0.637 - -
Note: Aggregate consumption categories in the USDA study vary somewhat from broad expenditure groups in the ABS household expenditure survey. Price elasticity of demand: own-price elasticity of demand (Frisch estimate) measures the percentage change in demand for a good when the price of the good increases by 1% (all else constant). Income elasticity of demand: measures the percentage change in demand for a good when real income increases by 1% (all else constant). Expenditure elasticity of demand (Frisch estimate): measures the percentage change in demand for a food good given a 1% increase in total food expenditure. Marginal shares: measure how an additional $1 of expenditure is allocated across broad expenditure categories. Sources: ABS 2016a, 2011; Muhammad et al 2011 (USDA study); Ulubasoglu et al. 2011, 2016
Food demand in Australia: Trends and food security issues ABARES
53
Appendix C: Private risk management strategies in food markets An important aspect of food security is assessing the capacity of the private sector to respond to the risk of food supply disruptions. All markets are characterised by risk, although there is considerable variation between economic activities. Risk is an important consideration in policy formulation particularly where the risks are relatively high and the consequences of adverse outcomes are costly.
A risk averse investor is relatively more concerned about the risk of unexpected losses than the possibility of unexpected gains. In assessing investment options to manage the risk of food supply disruptions, private food market participants assess the trade-off between incurring with certainty the cost of the food supply reliability measures (such as holding stocks) against the risk of lower than expected benefits of the investment.
Farmers and other food market participants may adopt a range of risk sharing and risk reducing measures designed to offset, at least to some extent, the negative impact of adverse outcomes (such as drought) on profitability, or to gain profit opportunities during temporary supply disruptions (selling produce at higher prices). For example, farmers or private food companies may manage risks, either directly or indirectly, by investing in the following.
• Stocks—a major approach for smoothing fluctuations in supply and demand where it is feasible to store the food type.
• Excess capacity—an option for food types that may not be stored.
• Diversification or risk sharing—such as diversifying farming activities and income source (multiple agricultural activities, off-farm income), diversifying farming location (owning farms in geographically diverse locations) and participation in joint ventures.
• Technology research, development and deployment (RD&D)—such as investing in water efficient technologies to manage water security risks (‘drought proofing’ farms).
• Long term contracts—an option where long term security for buyers and sellers is important (for example, farmers selling fresh produce to a regional food processing facility).
• Insurance and futures markets—to manage production and price risk, respectively.
• Market and other relevant information—to provide more accurate assessments of the benefits, costs and risks in the outlook.
Private risk management by food market participants is key to supporting a high level of food supply reliability in Australia. Risk management strategies in agriculture are discussed further, for example, in OECD (2009) and Kimura et al. (2010) (see also, for example, Hogan and Morris 2010).
Issues relating to specific food security concerns in regional and remote areas of Australia are beyond the scope of this report.
Food demand in Australia: Trends and food security issues ABARES
54
Appendix D: Australia’s consumer policy framework and food safety Australia’s consumer policy framework provides important overarching protection for consumers. The broad objective of consumer policy is “to improve consumer wellbeing by fostering effective competition and enabling the confident participation of consumers in markets in which both consumers and suppliers can trade fairly and in good faith” (Productivity Commission 2008a, p. 2).
In Australia, the federal, state and territory governments share responsibility for consumer policy. The generic consumer provisions in the Competition and Consumer Act 2010 and state and territory fair trading legislation form the basic framework for consumer policy in Australia (Productivity Commission 2008b). These provisions fall into three main categories: prohibitions on certain types of conduct; imposition of non-excludable conditions and warranties into consumer contracts; and provisions relating to product safety and product information.
Industry-specific regulation may be used to supplement generic consumer laws. For example, food safety standards developed by Food Standards Australia and New Zealand (FSANZ) are implemented and enforced by state and territory governments (Productivity Commission 2008b). There are three broad industry-specific regulation options.
• Self-regulation—a market-based approach whereby an industry develops, administers and enforces a workable regulatory framework to achieve accepted performance standards, with minimal prescription by government. Self-regulation may include service charters, accreditation, certification, standards, codes of conduct and dispute resolution schemes.
• Co-regulation—an approach whereby industry typically develops and administers its own arrangements, but government provides legislative backing to enable the arrangements to be enforced by the industry concerned.
• Government regulation—a non-market based approach whereby governments typically adopt highly prescriptive regulations.
Non-regulatory options include, for example, education campaigns through which governments provide information to educate and assist consumers, including publications on key consumer issues and alerting the public to product safety concerns and scams.
In a 2009 review of business regulation in food safety, the Productivity Commission (2009, p. 4) noted that food-related regulation ‘has a number of objectives, including: the protection of public health and safety; ensuring export market access and protecting the international reputation of food products; providing consumers with information to enable informed choices; and preventing misleading and deceptive conduct’. The Productivity Commission focused on regulations directed at food safety, defined as those regulations concerned with reducing the direct risk of an adverse effect from eating food. This includes food safety regulations aimed at: preventing food-borne illnesses; preventing foreign objects and contaminants entering food; and minimising the risk of physical harm from chemicals in food. Regulations directed at health outcomes—that is, food regulations concerned with reducing and minimising indirect risks of harm or adverse impacts from eating food were outside the scope of the review.
Food demand in Australia: Trends and food security issues ABARES
55
Appendix E: OECD classification of taxes The international comparisons of taxes in chapter 5 is mainly based on information from the OECD tax database and related publications (OECD 2016 a,b). This appendix presents an overview of the OECD classification of taxes.
Main components There are six main components of the OECD tax classification (Table E1; the following text is drawn from Annex A in OECD 2014, pp.324-333).
• 1000 Taxes on income, profits and capital gains—taxes levied on the net income or profits (i.e. gross income minus allowable tax reliefs) of individuals and enterprises. Also covered are taxes levied on the capital gains of individuals and enterprises, and gains from gambling.
• 2000 Social security contributions—all compulsory payments that confer an entitlement to receive a (contingent) future social benefit. Such payments are usually earmarked to finance social benefits and are often paid to institutions of general government that provide such benefits.
• 3000 Taxes on payroll and workforce—taxes paid by employers, employees or the self-employed either as a proportion of payroll or as a fixed amount per person, and which do not confer entitlement to social benefits.
• 4000 Taxes on property—recurrent and non-recurrent taxes on the use, ownership or transfer of property. These include taxes on immovable property or net wealth, taxes on the change of ownership of property through inheritance or gift and taxes on financial and capital transactions.
• 5000 Taxes on goods and services—taxes and duties levied on the production, extraction, sale, transfer, leasing or delivery of goods, and the rendering of services (5100), or in respect of the use of goods or permission to use goods or to perform activities (5200) are included here.
• 6000 Other taxes—taxes levied on a base, or bases, other than those described under headings 1000, 3000, 4000 and 5000, or on bases of which none could be regarded as being predominantly the same as that of any one of these headings, are covered here.
Taxes on goods and services Consumption taxes are included in the category, 5000 taxes on goods and services.
• 5100 Taxes on the production, sale, transfer, leasing and delivery of goods and rendering of services—taxes levied on transactions in goods and services on the basis of their intrinsic characteristics (e.g. value, weight of tobacco, strength of alcohol) as distinct from taxes imposed on the use of goods, or permission to use goods or perform activities, which fall under 5200.
• 5110 General taxes on goods and services—taxes, other than import and export duties (5123 and 5124), levied on the production, leasing, transfer, delivery or sales of a wide range of goods and/or the rendering of a wide range of services, irrespective of whether they are domestically produced or imported and irrespective of the stage of production or distribution at which they are levied.
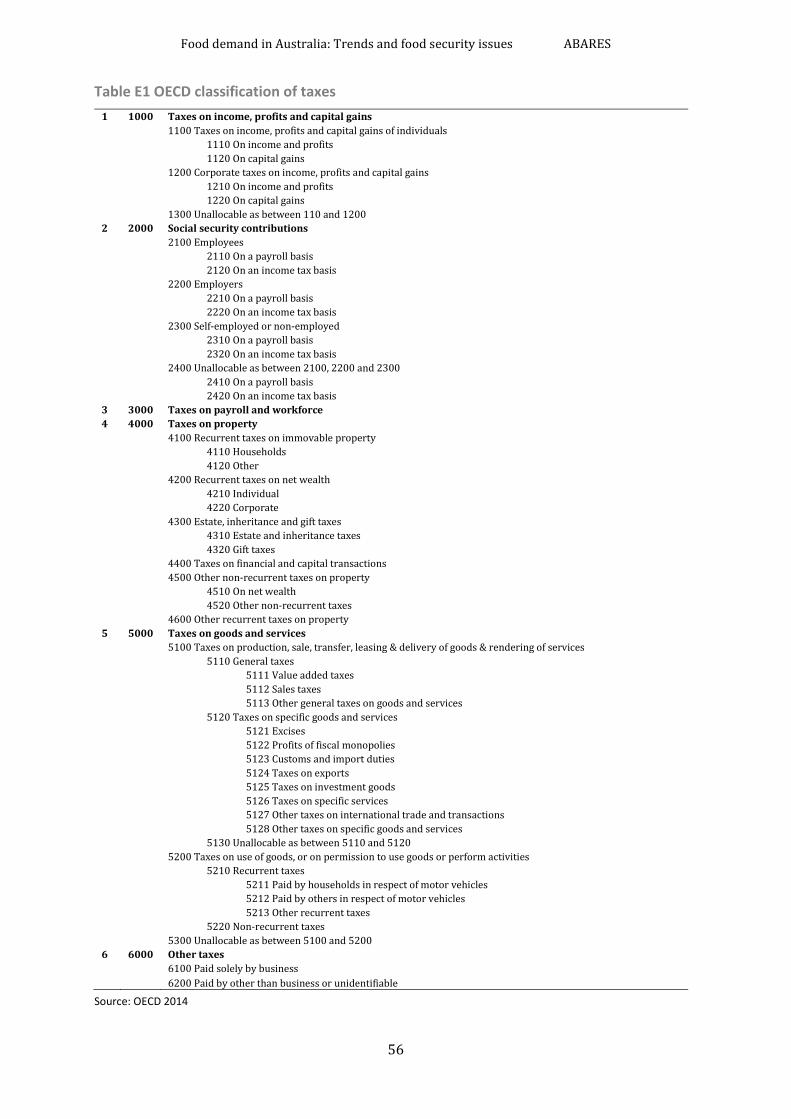
Food demand in Australia: Trends and food security issues ABARES
56
Table E1 OECD classification of taxes 1 1000 Taxes on income, profits and capital gains 1100 Taxes on income, profits and capital gains of individuals 1110 On income and profits 1120 On capital gains 1200 Corporate taxes on income, profits and capital gains 1210 On income and profits 1220 On capital gains 1300 Unallocable as between 110 and 1200 2 2000 Social security contributions 2100 Employees 2110 On a payroll basis 2120 On an income tax basis 2200 Employers 2210 On a payroll basis 2220 On an income tax basis 2300 Self-employed or non-employed 2310 On a payroll basis 2320 On an income tax basis 2400 Unallocable as between 2100, 2200 and 2300 2410 On a payroll basis 2420 On an income tax basis 3 3000 Taxes on payroll and workforce 4 4000 Taxes on property 4100 Recurrent taxes on immovable property 4110 Households 4120 Other 4200 Recurrent taxes on net wealth 4210 Individual 4220 Corporate 4300 Estate, inheritance and gift taxes 4310 Estate and inheritance taxes 4320 Gift taxes 4400 Taxes on financial and capital transactions 4500 Other non-recurrent taxes on property 4510 On net wealth 4520 Other non-recurrent taxes 4600 Other recurrent taxes on property 5 5000 Taxes on goods and services 5100 Taxes on production, sale, transfer, leasing & delivery of goods & rendering of services 5110 General taxes 5111 Value added taxes 5112 Sales taxes 5113 Other general taxes on goods and services 5120 Taxes on specific goods and services 5121 Excises 5122 Profits of fiscal monopolies 5123 Customs and import duties 5124 Taxes on exports 5125 Taxes on investment goods 5126 Taxes on specific services 5127 Other taxes on international trade and transactions 5128 Other taxes on specific goods and services 5130 Unallocable as between 5110 and 5120 5200 Taxes on use of goods, or on permission to use goods or perform activities 5210 Recurrent taxes 5211 Paid by households in respect of motor vehicles 5212 Paid by others in respect of motor vehicles 5213 Other recurrent taxes 5220 Non-recurrent taxes 5300 Unallocable as between 5100 and 5200 6 6000 Other taxes 6100 Paid solely by business 6200 Paid by other than business or unidentifiable
Source: OECD 2014
Food demand in Australia: Trends and food security issues ABARES
57
• 5111 Value-added taxes—general consumption taxes charged on value-added are classified in this subheading, irrespective of the method of deduction and the stages at which the taxes are levied. In practice, all OECD countries with value-added taxes normally allow immediate deduction of taxes on purchases by all but the final consumer and impose tax at all stages.
• 5112 Sales taxes—general taxes levied at one stage only, whether at manufacturing or production, wholesale or retail stage are classified here.
• 5113 Other general taxes on goods and services—multi-stage cumulative taxes (also known as “cascade taxes”) where tax is levied each time a transaction takes place without deduction for tax paid on inputs, and also those general consumption taxes where elements of value-added, sales or cascade taxes are combined.
• 5120 Taxes on specific goods and services—excises, profits generated and transferred from fiscal monopolies, and customs and imports duties as well as taxes on exports, foreign exchange transactions, investment goods and betting stakes and special taxes on services, which do not form part of a general tax of 5110, are included in this category.
Social service contributions (category 2000) In contrast to Australia, many OECD countries have significant social security contributions (category 2000). For example, table D in OECD (2014, p.31) presents tax revenue, as a share of GDP, across sub-sectors of general government for each OECD country; social security contributions are included as a separate sub-sector.
OECD (2014, see paragraphs 7-8 on p.319) notes that compulsory social security contributions paid to general government, are treated in category 2000 as tax revenues. Being compulsory payments to general government they clearly resemble taxes. They may, however, differ from other taxes in that the receipt of social security benefits depends, in most countries, upon appropriate contributions having been made, although the size of the benefits is not necessarily related to the amount of the contributions. Better comparability between countries is obtained by treating social security contributions as taxes, but they are listed under a separate heading so that they can be distinguished in any analysis.
Social security contributions which are either voluntary or not payable to general government are not treated as taxes, though in some countries, as indicated in the country footnotes, there are difficulties in eliminating voluntary contributions and certain compulsory payments to the private sector.
Food demand in Australia: Trends and food security issues ABARES
58
References ABARES 2016, Agricultural commodity statistics 2016, Canberra, December.
——2013, What Asia wants: Long-term food consumption trends in Asia, Andrews, N and Gunning-Trant, C (eds.), ABARES Research Report 13.12, Canberra, October.
ABS (Australian Bureau of Statistics) 2016a, Consumer price index, Australia, cat. no. 6401.0, Canberra, December.
——2016b, Australian system of national accounts, 2015-16, cat. no. 5204.0, Canberra, October.
——2014, Australian historical population statistics, 2014, cat. no. 3105.0, Canberra, August.
——2013, Population projections, Australia, 2012 (base) to 2101, cat. no. 3222.0, Canberra, November.
——2011, Household expenditure survey, Australia: Summary of results, 2009-10, cat. no. 6530.0, Canberra, September.
Australian Government 2015a, Re:think: tax discussion paper, Canberra, March.
——2015b, ‘Statement 4: Revenue’ in Budget 2015-16: Budget Paper No. 1, Budget strategy and outlook 2015-16, Canberra, March, available at http://www.budget.gov.au/2015-16/content/bp1/html/index.htm.
FAO (Food and Agriculture Organization of the United Nations) 2017, The future of food and agriculture – Trends and challenges, Rome.
——2012, The state of food insecurity in the world: Economic growth is necessary but not sufficient to accelerate reduction of hunger and malnutrition, Rome, available at www.fao.org.
Garnaut, R. 2008, The Garnaut climate change review final report, September, Canberra, available at www.garnautreview.org.au.
Gerathy, S 2017, ‘NSW launches new healthy school canteen strategy to increase fresh food offerings’, ABC News, 28 Feb 2017, http://www.abc.net.au/news/2017-02-28/gladys-berejiklian-launches-new-healthy-eating-scheme-at-schools/8310378, accessed 9 March.
Goesch, T, Lawson, K, Green, R and Morey, K 2015, Australia’s beef supply chains: infrastructure issues and implications, ABARES research report 15.7, Canberra, October.
Goodall, K. 2009, 'Food security: What is it all about?', Victorian Department of Primary Industries, Melbourne, available at http://www.agrifood.info/connections/2009/Goodall.pdf.
Gunning-Trant, C, Sheng, Y, Hamshere, P, Gleeson, T and Moir, B 2015, What Indonesia wants: Analysis of Indonesia's food demand to 2050, ABARES research report no 15.9, Canberra, November.
Hamshere, P, Sheng, Y, Moir, B, Gunning-Trant, C and Mobsby, D 2014a, What India wants: Analysis of India's food demand to 2050, ABARES research report no. 14.16, Canberra, November.
Hamshere, P, Sheng, Y, Moir, B, Syed, F and Gunning-Trant, C 2014b, ‘What China wants: Analysis of China's food demand to 2050’, ABARES conference paper 14.3, Canberra, March.
Food demand in Australia: Trends and food security issues ABARES
59
HLPE 2011, Price volatility and food security, a report by the High Level Panel of Experts on Food Security and Nutrition of the Committee on World Food Security, Rome.
Hogan L 2012, Pet food safety in Australia: Economic assessment of policy options, ABARES Research Report 12.8, Canberra, June.
Hogan, L and Morey, K 2014, Australia’s airfreight food exports: Trends, issues and case studies, ABARES Research Report 14.14, Canberra, September.
Hogan, L and Morris, P 2010, ‘Agricultural and food policy choices in Australia’, ABARE-BRS Conference Paper 10.15, presented at the conference Sustainable Agriculture and Food Policy in the 21st Century: Challenges and Solutions, convened by the Australian National University, 26-27 October 2010, Brussels, Belgium.
Hogan, L. and Thorpe, S. 2009, Issues in food miles and carbon labelling, ABARE Research Report 09.18, Prepared for the Australian Government Department of Agriculture Fisheries and Forestry, Canberra, December.
Karl, H. and Orwat, C. 1999, ‘Economic aspects of environmental labelling’, in H. Folmer and T.H. Tietenberg (eds), The International Yearbook of Environmental and Resource Economics 1999/2000, Edward Elgar, Cheltenham, United Kingdom, pp. 107-70.
Kimura, S, Anton, J and LeThi, C 2010, ‘Farm level analysis of risk and risk management strategies and policies: cross country analysis’, OECD Food, Agriculture and Fisheries Working Papers, No. 26, OECD, France, available at www.oecd.org.
Linehan, V, Thorpe, S, Gunning-Trant, C, Heyhoe, E, Harle, K, Hormis, M and Harris-Adams, K 2013, ‘Global food production and prices to 2050: scenario analysis under policy assumptions’, ABARES conference paper 13.6, Canberra, March.
Linehan, V, Thorpe, S, Andrews, N, Kim, Y and Beaini, F 2012a, ‘Food demand to 2050: Opportunities for Australian agriculture’, ABARES conference paper 12.4, Canberra, March.
Linehan, V, Thorpe, S, Andrews, N and Beaini, F 2012b, ‘Food demand to 2050: opportunities for Australian agriculture—algebraic description of agrifood model’, technical annex to ABARES Outlook conference paper, Canberra, May.
Muhammad, A, Seale Jr, JL, Meade, B and Regmi, A 2011, International evidence on food consumption patterns: An update using 2005 international comparison program data, Report from the Economic Research Service (ERS), US Department of Agriculture (USDA), Technical Bulletin no. 1929, March 2011, revised February 2013, Washington DC.
Nguyen, N, Hogan, L, Lawson, K, Gooday, P, Green, R, Harris-Adams, K and Mallawaarachchi, T 2013, Infrastructure and Australia’s food industry: Preliminary economic assessment, ABARES research report 13.13, Canberra, November.
Nguyen, N, Green, R, Lawson, K and Goesch, T, 2015, Australia's wheat supply chains: infrastructure issues and implication, ABARES research report no. 15.1, Canberra, March.
Nguyen, N, Mobsby, D & Goesch, T 2016, Farm-to-retail price spread and farm share in food supply chains: background paper, ABARES research report 16.5, Canberra, December.
OECD 2016a, Consumption tax trends 2016 Paris.
——2016b, Revenue statistics, 1965-2014, Paris.
Food demand in Australia: Trends and food security issues ABARES
60
——2015, Food price formation, 7th Food Chain Analysis Network Meeting, Trade and Agriculture Directorate, Paris, Oectober.
——2014, Revenue statistics, 1965-2013, Paris.
——2009, Managing Risk in Agriculture: A Holistic Approach, Highlights, Paris.
Productivity Commission 2008a, Review of Australia’s consumer policy framework: volume 1—summary, Productivity Commission Inquiry report no. 45, Productivity Commission, Melbourne, available at www.pc.gov.au.
—— 2008b, Review of Australia’s consumer policy framework: volume 2—chapters and appendixes, Productivity Commission Inquiry report no. 45, Productivity Commission, Melbourne, available at www.pc.gov.au.
——2009, Performance benchmarking of Australian and New Zealand business regulation: food safety, research report, Productivity Commission, Melbourne, available at www.pc.gov.au.
Sassi, F, Belloni, A and Capobianco, C 2013, The role of fiscal policies in health promotion, OECD Health Working Paper No. 66, OECD, 11 December.
Ulubasoglu, M, Mallick, D, Wadud, M, Hone, P and Haszler, H 2016, ‘Food demand elasticities for Australia’, Australian Journal of Agricultural and Resource Economics, vol 60, pp. 177-195.
——2011, How price affects the demand for food in Australia: Australian domestic demand elasticities for rural marketing and policy, Report for RIRDC (Rural Industries Research and Development Corporation), RIRDC publication no. 11/062, October, ACT.
UN (United Nations) 2011, World population prospects, the 2010 revision, New York, April.
World Bank 2007, World development report 2008: Agriculture for development, Washington DC, October, available at www.worldbank.org.