food fish consumer survey
TRANSCRIPT
Food Fish Consumer Survey Findings 1
Food Fish Consumer SurveyMarch 2021
Food Fish Consumer Survey Findings 2
Contents• • • •Executive Summary 3
Demographics 6
Findings 9Consumption and Purchasing Behaviors 10Minnesota-Raised Fish: Awareness and Demand 13Purchasing Preferences and Decision-Making Factors 17Information and Benefits of Minnesota-Raised Fish 22
Recommendations
Appendix
32
34
ABOUT AURIThe Agriculture Utilization Research Institute (AURI) has a mission to foster long-term economic benefit for Minnesota through value-added agricultural products. AURI helps businesses and entrepreneurs pursue innovative opportunities in biobased products, renewable energy, coproducts and food. This includes conducting extensive research about potential industries and supply chains that could bring additional jobs and economic stability to the state, in addition to advancing the agricultural field. Market expansion and process improvement are also impactful services AURI offers to the Minnesota agricultural industry.
Food Fish Consumer Survey Findings 3
Executive Summary• • • •BACKGROUNDFood fish comprise a diverse category in Minnesota from its legendary walleye to trout. Besides wild caught fishing, which goes back many generations, commercially viable fish farm opportunities have been expanding as an interest area in recent years, creating employment, economic impact and growth for related sectors in the form of fish feed, fish health and byproducts. AURI retained research and strategic communications firm, Russell Herder, to undertake a consumer survey to better understand current fish consumption behaviors in Minnesota, perceptions of the food fish industry and market potential. The research findings will ultimately exist as part of a larger guide to serve as a resource and educational tool for decision makers, industry, academia and others to expand market opportunities in Minnesota, resulting in a positive shift in public perception, and serving to inspire successive projects with stakeholders’ partners.
OBJECTIVESThis research:
Informs and supports expansion of current work in the field;
Creates actionable information for Minnesota aquaculture producers and related businesses;
Identifies consumer demand and perceptions within Minnesota markets; and
Determines necessary purchase drivers to grow the industry.
METHODOLOGYTo gain statistically reliable consumer insights, Russell Herder undertook a statewide telephone survey, on behalf of the Agricultural Utilization Research Institute, to assess market demand, current perceptions and purchasing barriers of food fish grown and/or sold in Minnesota. The surveying company completed a total of 352 interviews were completed with adult Minnesotans for a statistical reliability of +/-5.3 percent at the 95 percent confidence level. The survey sample took into consideration appropriate geographical distribution, age, income, race, etc. The surveys were conducted by phone between November 23 and December 2, 2020.
Food Fish Consumer Survey Findings 4
KEY FINDINGSRespondents indicated they consume chicken and beef on a more regular basis than fish, with approximately half of consumers saying that they eat these meats more than once per week. Conversely, only three percent report eating salmon at this frequency, six percent consumeshrimp and 11 percent eat other fish more than once per week.
Consumers feel fish is good for a healthy diet to a far great extent than they are buying it. In fact, nearly two-thirds agree salmon (65%) and other fish (71%) are either somewhat or very important as a healthy, sustainable food choice.
Consumers most trust government, grocery stores and commercial fish producers when it comes to assuring the safety of the food fish they buy.
Consumers have little awareness of which breeds of fish are currently raised in Minnesota, but 46% are interested in learning more –especially online or at the place of purchase. Walleye and trout are the species most commonly perceived as being commercially raised local fish, with 50 percent identifying walleye and 36 percent saying trout. However, nearly one-fourth (22%) of consumers are unable to name any locally raised species, indicating a lack of awareness. Almost half (46%) of consumers indicate that they are interested in learning more about fish that are commercially raised in Minnesota.
There is strong potential for increasing purchase of Minnesota grown fish. Consumers say that they would not only buy more but could pay additional. If Minnesota-raised salmon was available in either restaurants or grocery stores, 37 percent of consumers report they would be either somewhat or very likely to increase their purchase of such. Similarly, 40 percent feel their purchase of shrimp would increase and 41 percent indicate their purchase of walleye would increase if raised and available in Minnesota.
Flavor is the factor rated as the highest priority when purchasing fish.
Nearly two-thirds (62%) of consumers indicate that they sometimes or always read the product label for information (beyond price) when making a purchase of salmon, fish or shrimp while grocery shopping.
Those who would be willing to pay more for Minnesota-raised fish place the greatest importance on nutritional value, sustainability and being locally raised. Over half (57%) of consumers agree that eating Minnesota-raised fish, salmon or shrimp is more sustainable, and 51 percent feel such would be safer to eat than other fish options.
Eight in 10 (82%) consumers agree that commercially regulated fisheries or fish farms in Minnesota are good for the local economy. Seventy percent feel that these businesses would provide products with a high nutritional value, and over half (56%) agree such would have a positive impact on the environment. Furthermore, nearly half (46%) of consumers report that they are willing to pay more for food fish products that would benefit the state’s economy.
Food Fish Consumer Survey Findings 5
The top three perceived barriers to purchasing Minnesota-raised salmon, shrimp or other fish were overall quality (70%), taste (66%) and smell (58%). As well, 57 percent say that being able to locate Minnesota-raised fish and seafood products in stores or restaurants is a potential barrier to purchase (57%) and knowing how to cook it could also be a prohibitive factor (47%).
Those who would pay more for Minnesota-raised fish and seafood products are more likely to agree that commercially regulated fisheries and fish farms have a positive impact on the environment. Just over half (55%) agree commercially regulated fisheries or fish farms in Minnesota are a more sustainable method than wild caught.
RECOMMENDATIONSAdvance awareness, attitudes and understanding of the availability of Minnesota farm-raised fish and shrimp, by undertaking a consumer education campaign.
Share information about Minnesota aquaculture operations — when applicable — as environmentally friendly, healthy, sustainable, and energy efficient.
Clarify the economic advantages of expanding the aquaculture industry.
Ensure clear point-of-purchase information through accurate nutritional and source labeling, utilizing tools such as QR codes to increase traceability or identity preservation.
Establish centralized online information that provides detail about food fish aquaculture products available in Minnesota.
Increase the industry’s profile of Minnesota aquaculture developments and the economic potential success could bring.
Food Fish Consumer Survey Findings 6
Demographics• • • •
Food Fish Consumer Survey Findings 7
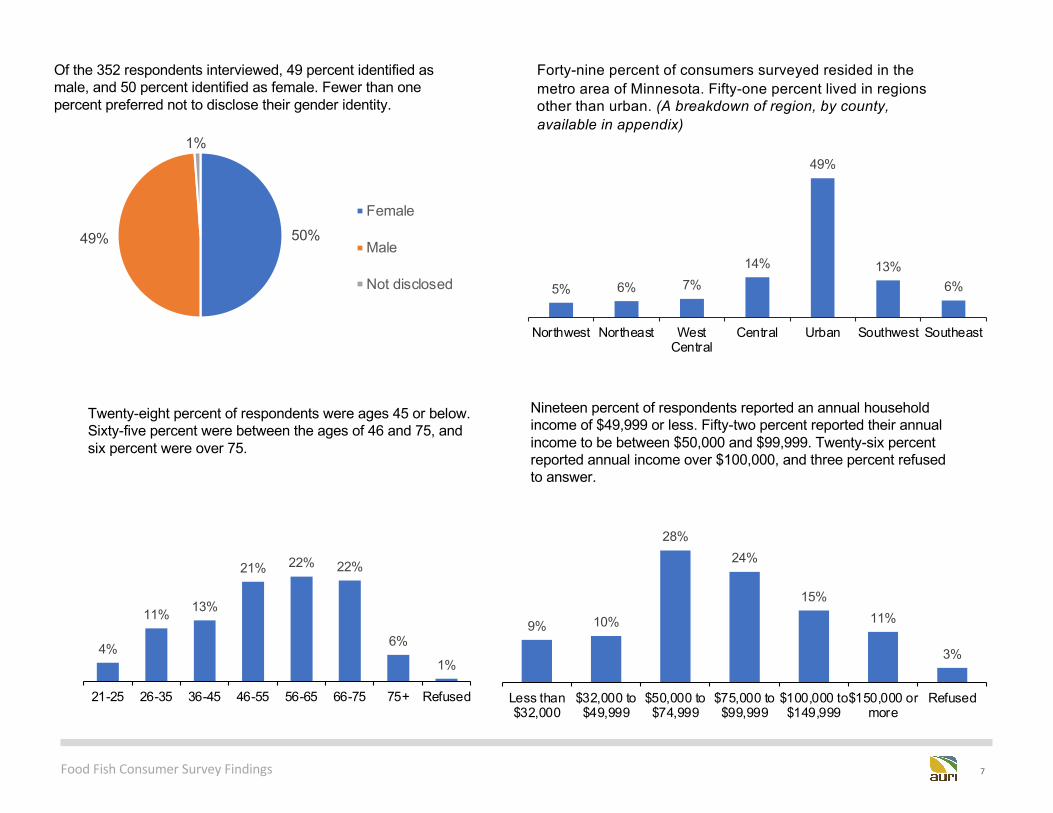
Of the 352 respondents interviewed, 49 percent identified as male, and 50 percent identified as female. Fewer than one percent preferred not to disclose their gender identity.
Twenty-eight percent of respondents were ages 45 or below. Sixty-five percent were between the ages of 46 and 75, and six percent were over 75.
Nineteen percent of respondents reported an annual household income of $49,999 or less. Fifty-two percent reported their annual income to be between $50,000 and $99,999. Twenty-six percent reported annual income over $100,000, and three percent refused to answer.
4%
11% 13%
21% 22% 22%
6%
1%
21-25 26-35 36-45 46-55 56-65 66-75 75+ Refused
9% 10%
28%24%
15%11%
3%
Less than$32,000
$32,000 to$49,999
$50,000 to$74,999
$75,000 to$99,999
$100,000 to$149,999
$150,000 ormore
Refused
50%49%
1%
Female
Male
Not disclosed 5% 6% 7%14%
49%
13%6%
Northwest Northeast WestCentral
Central Urban Southwest Southeast
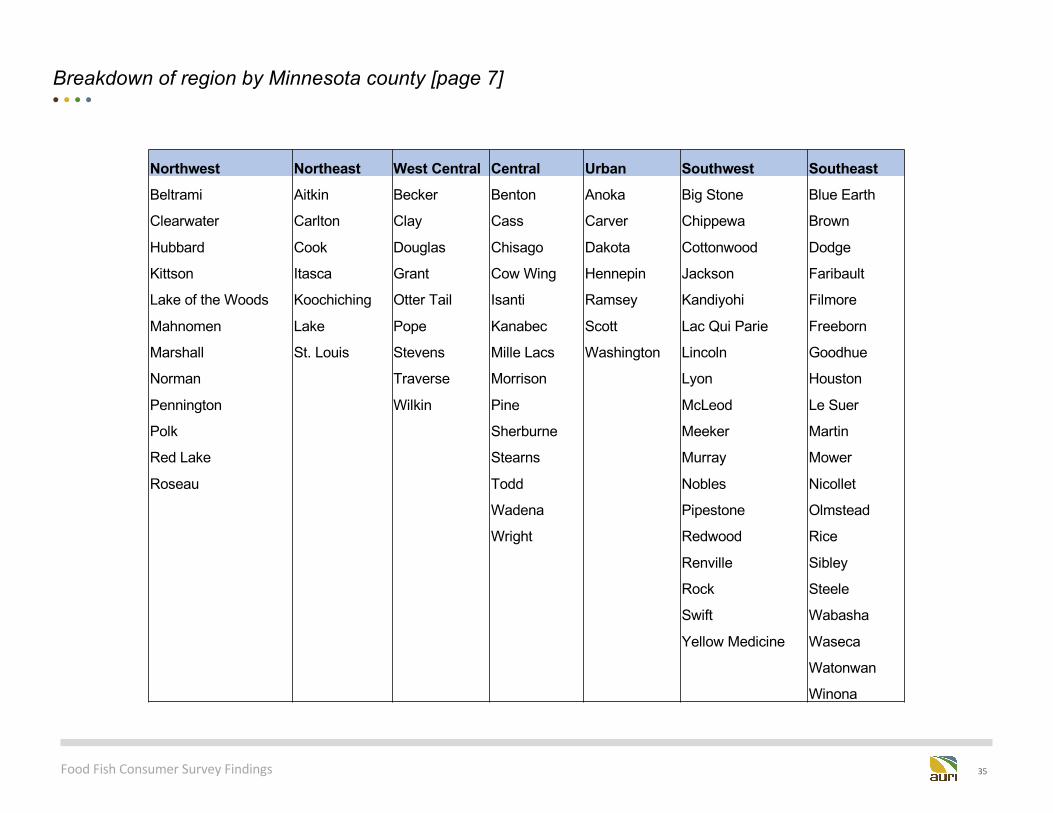
Forty-nine percent of consumers surveyed resided in the metro area of Minnesota. Fifty-one percent lived in regions other than urban. (A breakdown of region, by county, available in appendix)
Food Fish Consumer Survey Findings 8
2% 2% 4%
85%
1% 2% 2% 2%
American Indianor Alaskan
Native
Asian Black or AfricanAmerican
Caucasian Native Hawaiianor PacificIslander
Hispanic, Latinoor Spanish origin
Prefer not toanswer
Other [pleasespecify]
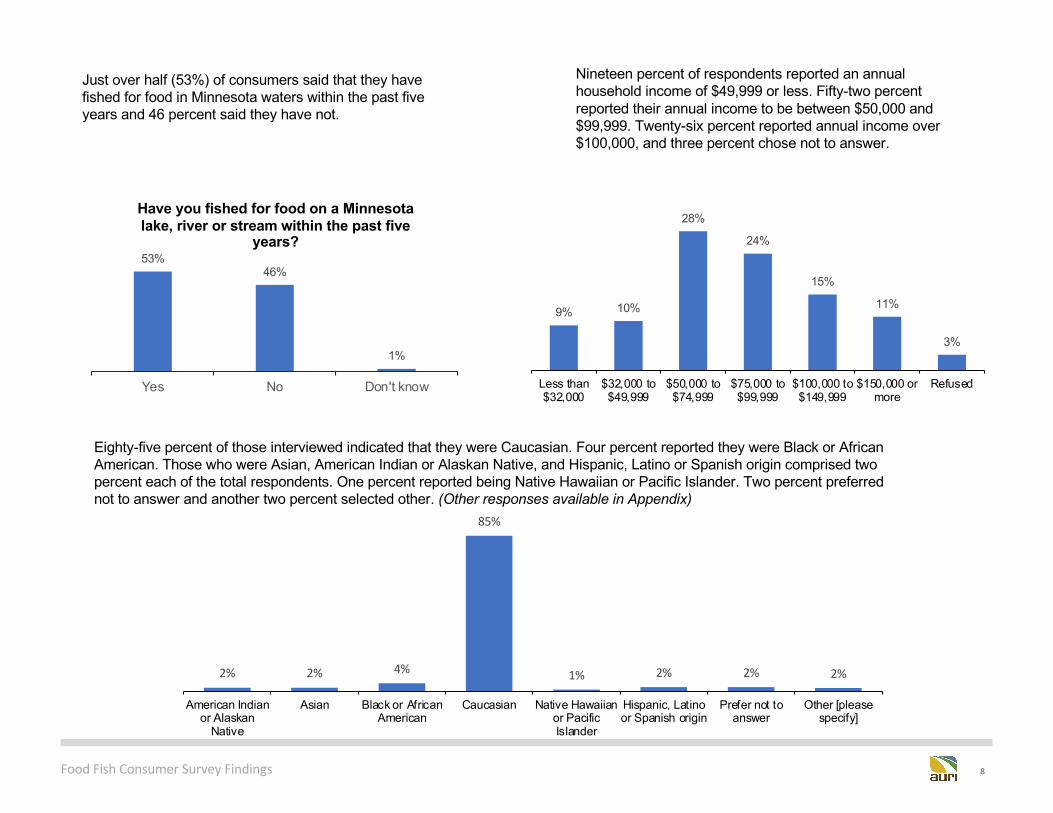
Eighty-five percent of those interviewed indicated that they were Caucasian. Four percent reported they were Black or African American. Those who were Asian, American Indian or Alaskan Native, and Hispanic, Latino or Spanish origin comprised two percent each of the total respondents. One percent reported being Native Hawaiian or Pacific Islander. Two percent preferred not to answer and another two percent selected other. (Other responses available in Appendix)
Nineteen percent of respondents reported an annual household income of $49,999 or less. Fifty-two percent reported their annual income to be between $50,000 and $99,999. Twenty-six percent reported annual income over $100,000, and three percent chose not to answer.
9% 10%
28%
24%
15%
11%
3%
Less than$32,000
$32,000 to$49,999
$50,000 to$74,999
$75,000 to$99,999
$100,000 to$149,999
$150,000 ormore
Refused
53%46%
1%
Yes No Don't know
Have you fished for food on a Minnesota lake, river or stream within the past five
years?
Just over half (53%) of consumers said that they have fished for food in Minnesota waters within the past five years and 46 percent said they have not.
Food Fish Consumer Survey Findings 9
Findings• • • •
Food Fish Consumer Survey Findings 10
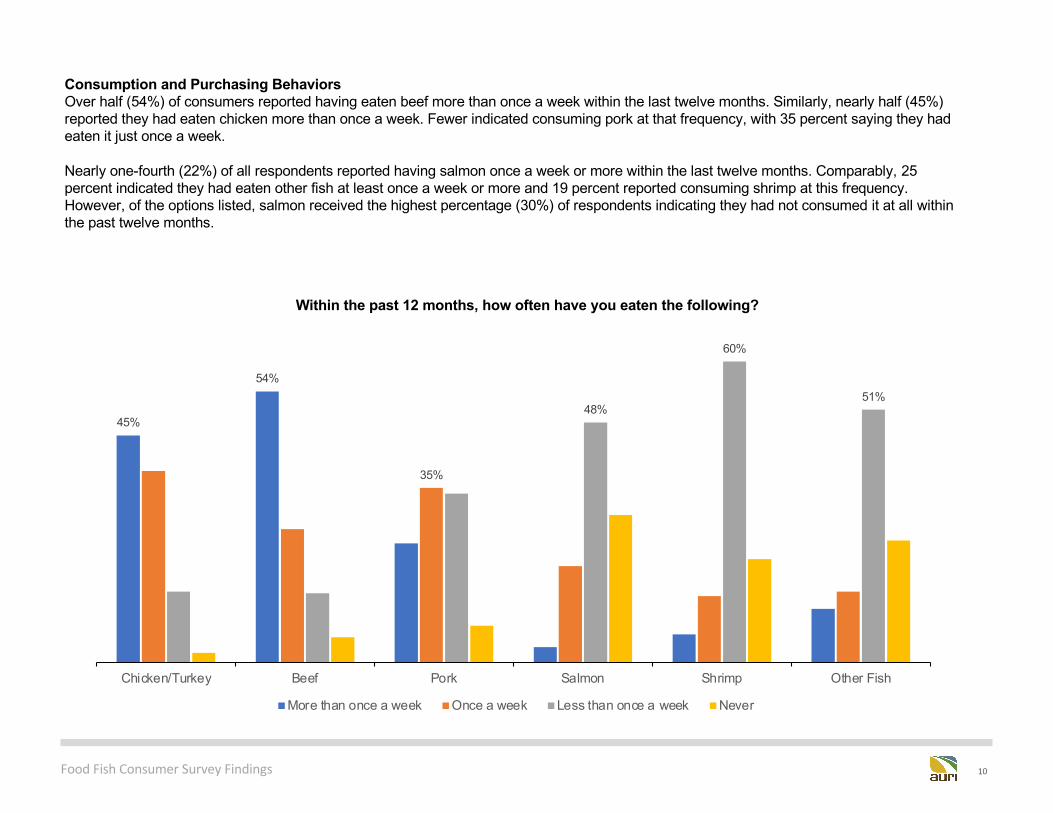
Consumption and Purchasing BehaviorsOver half (54%) of consumers reported having eaten beef more than once a week within the last twelve months. Similarly, nearly half (45%) reported they had eaten chicken more than once a week. Fewer indicated consuming pork at that frequency, with 35 percent saying they had eaten it just once a week.
Nearly one-fourth (22%) of all respondents reported having salmon once a week or more within the last twelve months. Comparably, 25 percent indicated they had eaten other fish at least once a week or more and 19 percent reported consuming shrimp at this frequency. However, of the options listed, salmon received the highest percentage (30%) of respondents indicating they had not consumed it at all within the past twelve months.
45%
54%
35%
48%
60%
51%
Chicken/Turkey Beef Pork Salmon Shrimp Other Fish
Within the past 12 months, how often have you eaten the following?
More than once a week Once a week Less than once a week Never
Food Fish Consumer Survey Findings 11
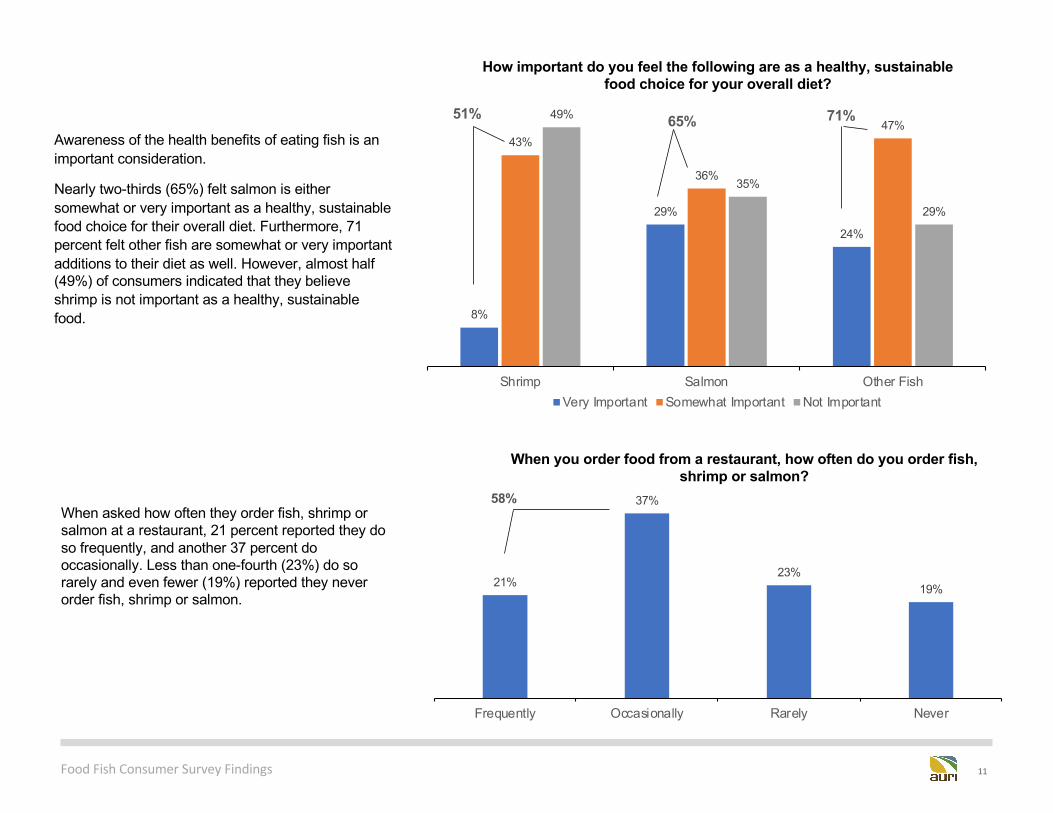
Awareness of the health benefits of eating fish is an important consideration.
Nearly two-thirds (65%) felt salmon is either somewhat or very important as a healthy, sustainable food choice for their overall diet. Furthermore, 71 percent felt other fish are somewhat or very important additions to their diet as well. However, almost half (49%) of consumers indicated that they believe shrimp is not important as a healthy, sustainable food. 8%
29%
24%
43%
36%
47%49%
35%
29%
Shrimp Salmon Other Fish
How important do you feel the following are as a healthy, sustainable food choice for your overall diet?
Very Important Somewhat Important Not Important
51% 71%65%
21%
37%
23%19%
Frequently Occasionally Rarely Never
When you order food from a restaurant, how often do you order fish, shrimp or salmon?
58%When asked how often they order fish, shrimp or salmon at a restaurant, 21 percent reported they do so frequently, and another 37 percent do occasionally. Less than one-fourth (23%) do so rarely and even fewer (19%) reported they never order fish, shrimp or salmon.
Food Fish Consumer Survey Findings 12
22%
34% 34%
31%
27%26%
28%
21%19%
14%13%
14%
5%6%
7%
Shrimp Salmon Other fish
How often do you buy the following at a grocery store, either fresh or frozen?
Never Less than once a month Once a month Couple of times a month More than twice a month
21%
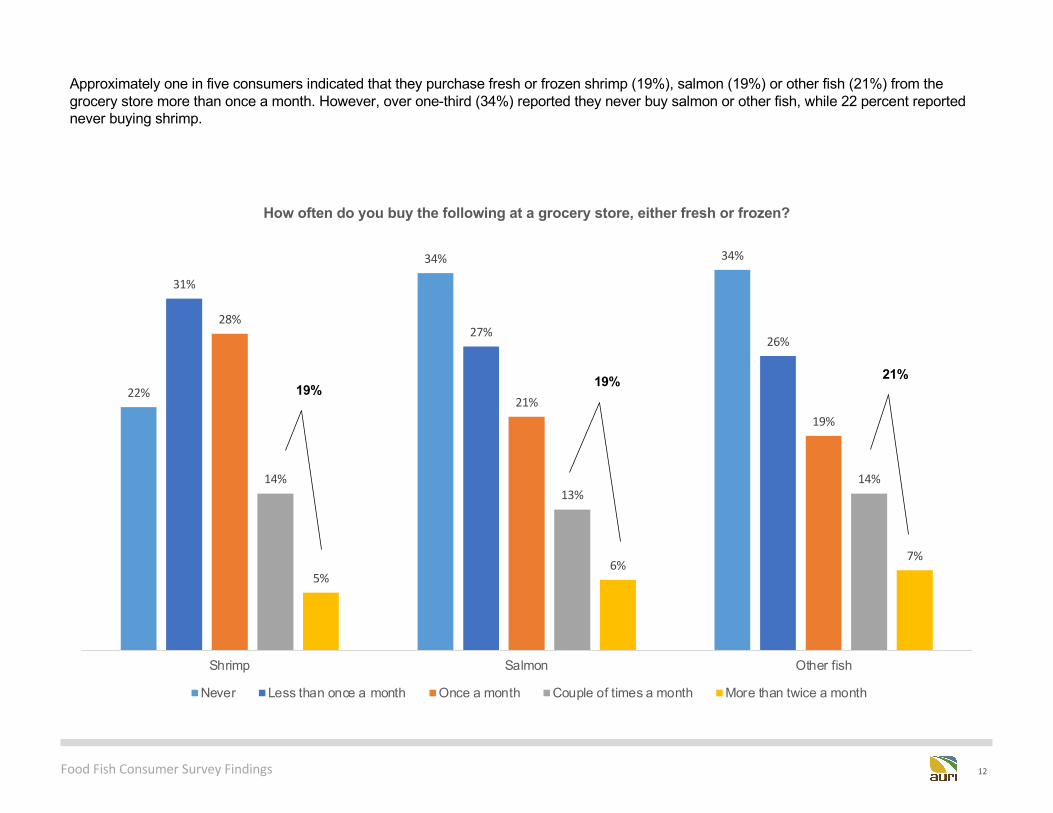
Approximately one in five consumers indicated that they purchase fresh or frozen shrimp (19%), salmon (19%) or other fish (21%) from the grocery store more than once a month. However, over one-third (34%) reported they never buy salmon or other fish, while 22 percent reported never buying shrimp.
19% 19%
Food Fish Consumer Survey Findings 13
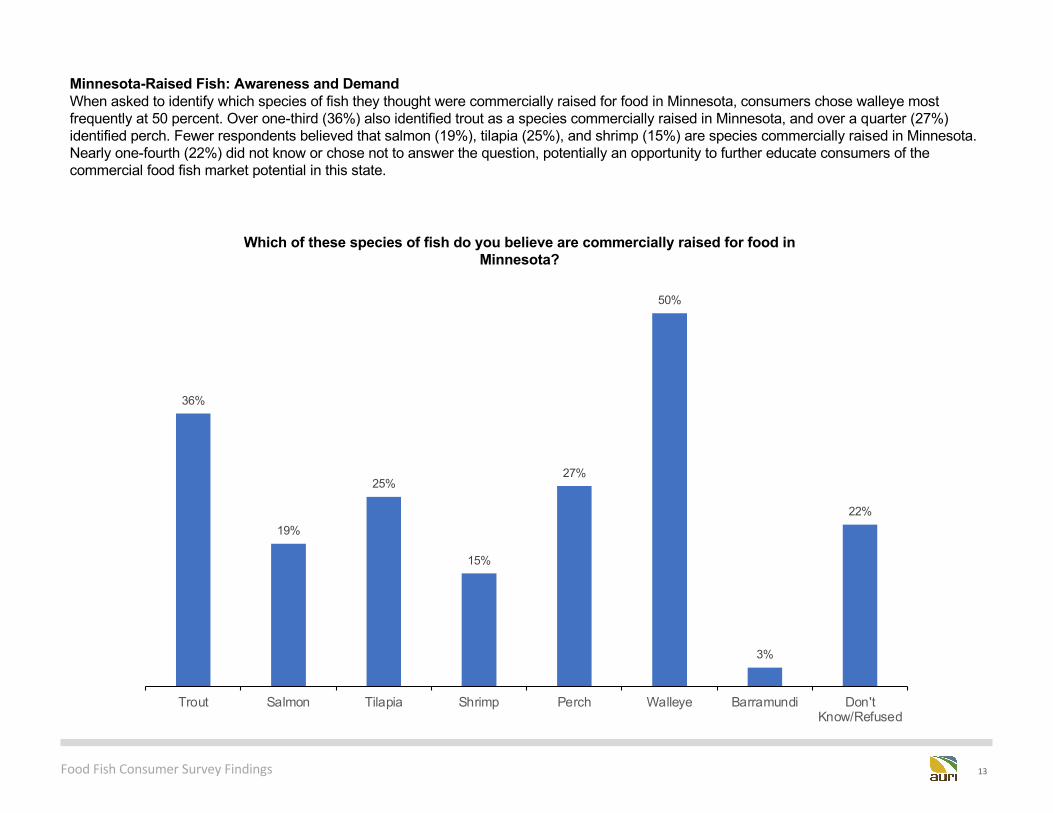
Minnesota-Raised Fish: Awareness and DemandWhen asked to identify which species of fish they thought were commercially raised for food in Minnesota, consumers chose walleye most frequently at 50 percent. Over one-third (36%) also identified trout as a species commercially raised in Minnesota, and over a quarter (27%) identified perch. Fewer respondents believed that salmon (19%), tilapia (25%), and shrimp (15%) are species commercially raised in Minnesota. Nearly one-fourth (22%) did not know or chose not to answer the question, potentially an opportunity to further educate consumers of the commercial food fish market potential in this state.
36%
19%
25%
15%
27%
50%
3%
22%
Trout Salmon Tilapia Shrimp Perch Walleye Barramundi Don'tKnow/Refused
Which of these species of fish do you believe are commercially raised for food in Minnesota?
Food Fish Consumer Survey Findings 14
53%
46%47%
7% 6%
11%
14%
11%
14%
10%
13%
10%
16%
24%
17%
Trout Salmon Tilapia
How likely is it that you would increase your purchase of Minnesota grown fish, if it were available in a grocery store or restaurant you frequent?
Not Likely at All 2 3 4 Very Likely
27%
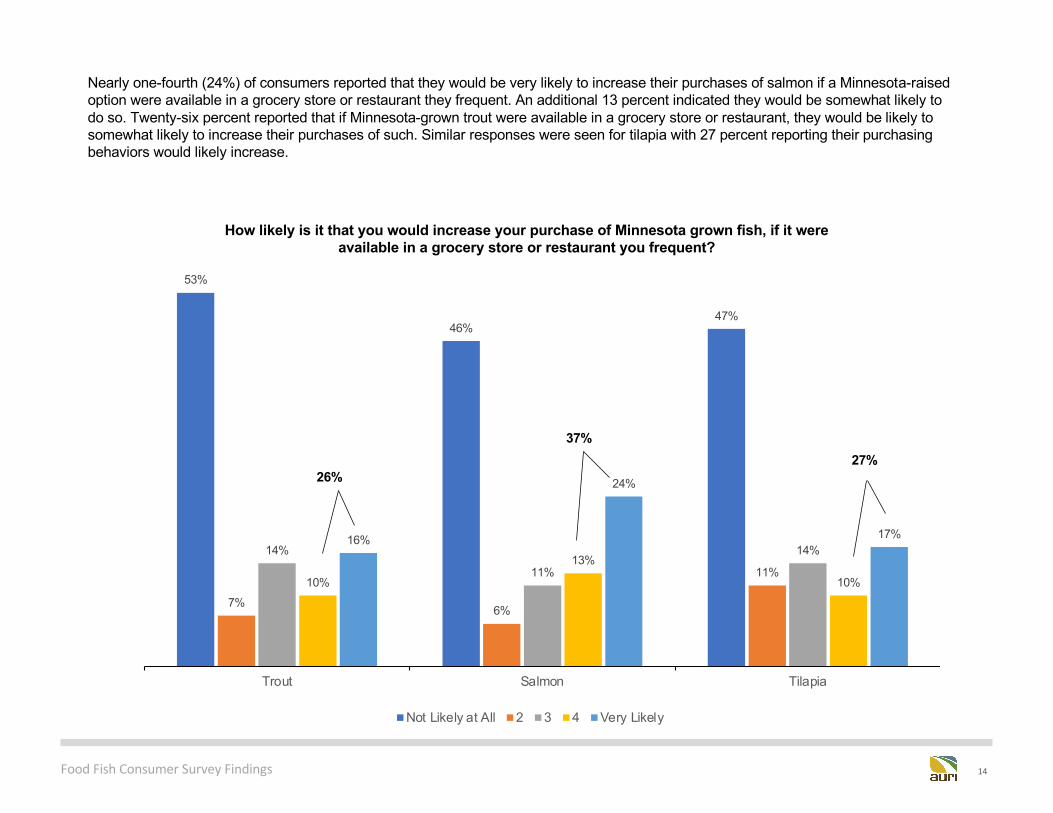
Nearly one-fourth (24%) of consumers reported that they would be very likely to increase their purchases of salmon if a Minnesota-raised option were available in a grocery store or restaurant they frequent. An additional 13 percent indicated they would be somewhat likely to do so. Twenty-six percent reported that if Minnesota-grown trout were available in a grocery store or restaurant, they would be likely to somewhat likely to increase their purchases of such. Similar responses were seen for tilapia with 27 percent reporting their purchasing behaviors would likely increase.
26%
37%
Food Fish Consumer Survey Findings 15
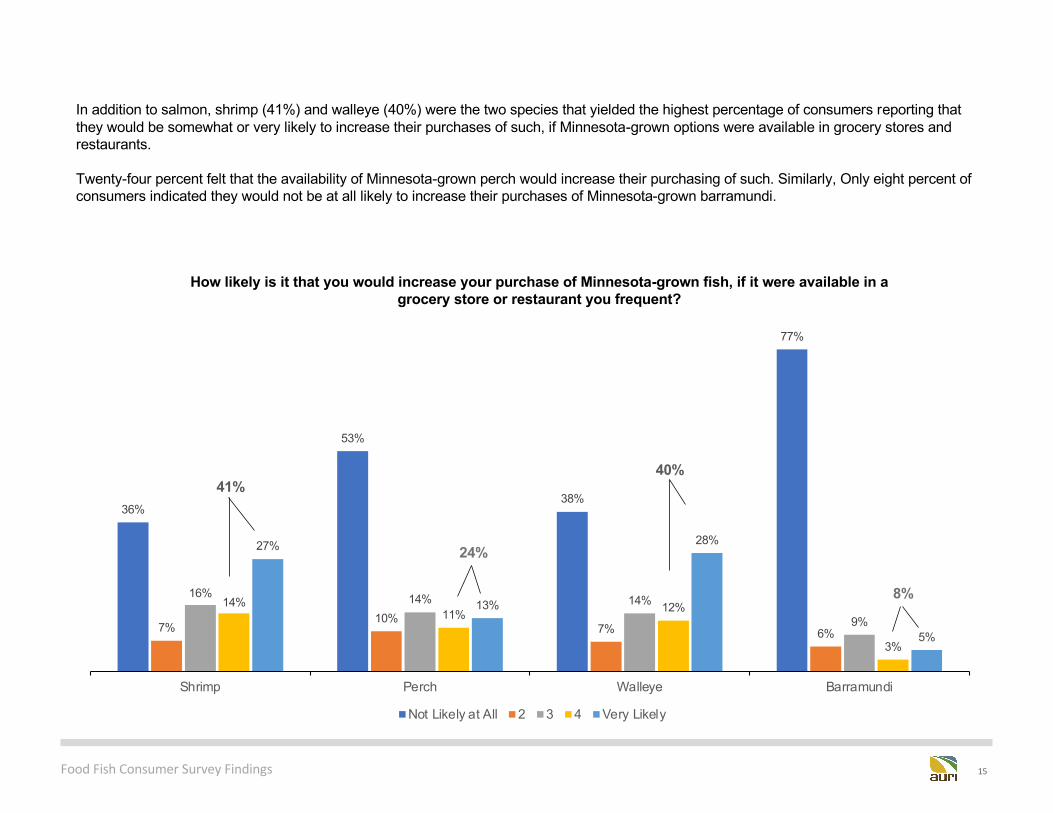
In addition to salmon, shrimp (41%) and walleye (40%) were the two species that yielded the highest percentage of consumers reporting that they would be somewhat or very likely to increase their purchases of such, if Minnesota-grown options were available in grocery stores and restaurants.
Twenty-four percent felt that the availability of Minnesota-grown perch would increase their purchasing of such. Similarly, Only eight percent of consumers indicated they would not be at all likely to increase their purchases of Minnesota-grown barramundi.
36%
53%
38%
77%
7%10%
7% 6%
16% 14% 14%
9%14%
11% 12%
3%
27%
13%
28%
5%
Shrimp Perch Walleye Barramundi
How likely is it that you would increase your purchase of Minnesota-grown fish, if it were available in a grocery store or restaurant you frequent?
Not Likely at All 2 3 4 Very Likely
41%
8%
40%
24%
Food Fish Consumer Survey Findings 16
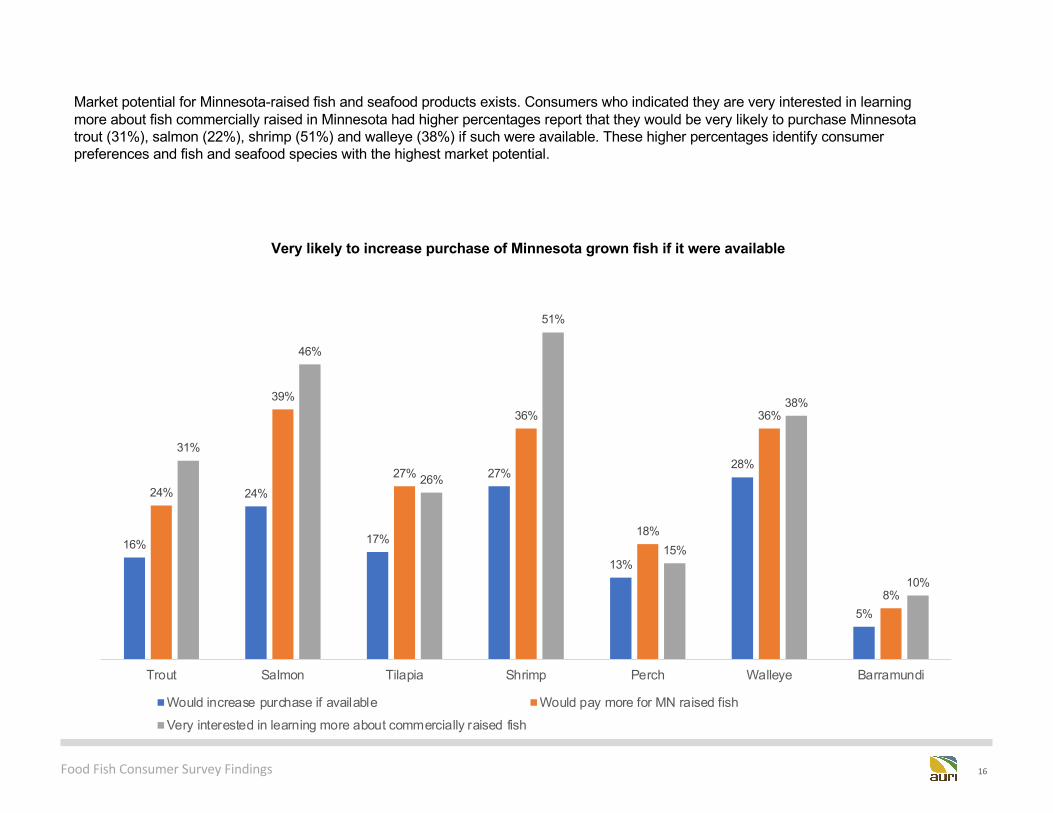
Market potential for Minnesota-raised fish and seafood products exists. Consumers who indicated they are very interested in learning more about fish commercially raised in Minnesota had higher percentages report that they would be very likely to purchase Minnesota trout (31%), salmon (22%), shrimp (51%) and walleye (38%) if such were available. These higher percentages identify consumer preferences and fish and seafood species with the highest market potential.
16%
24%
17%
27%
13%
28%
5%
24%
39%
27%
36%
18%
36%
8%
31%
46%
26%
51%
15%
38%
10%
Trout Salmon Tilapia Shrimp Perch Walleye Barramundi
Very likely to increase purchase of Minnesota grown fish if it were available
Would increase purchase if available Would pay more for MN raised fishVery interested in learning more about commercially raised fish
Food Fish Consumer Survey Findings 17
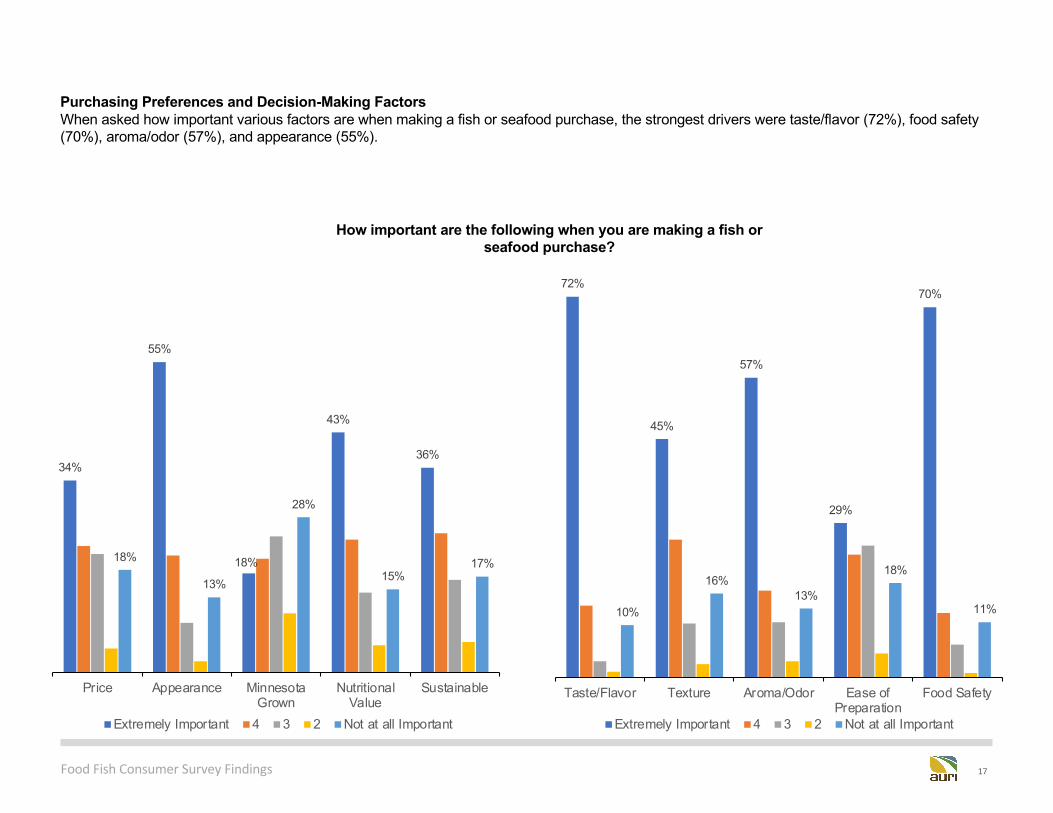
Purchasing Preferences and Decision-Making FactorsWhen asked how important various factors are when making a fish or seafood purchase, the strongest drivers were taste/flavor (72%), food safety (70%), aroma/odor (57%), and appearance (55%).
34%
55%
18%
43%
36%
18%
13%
28%
15%17%
Price Appearance MinnesotaGrown
NutritionalValue
Sustainable
Extremely Important 4 3 2 Not at all Important
72%
45%
57%
29%
70%
10%
16%13%
18%
11%
Taste/Flavor Texture Aroma/Odor Ease ofPreparation
Food Safety
Extremely Important 4 3 2 Not at all Important
How important are the following when you are making a fish or seafood purchase?
Food Fish Consumer Survey Findings 18
2.9
3.4
3.5
3.6
3.7
3.8
4
4
4.3
4.4
Minnesota-GrownEase of Preparation
PriceSustainable
Nutritional ValueTexture
AppearanceAroma/OdorFood SafetyTaste/Flavor
How important are the following when you are making a fish purchase?
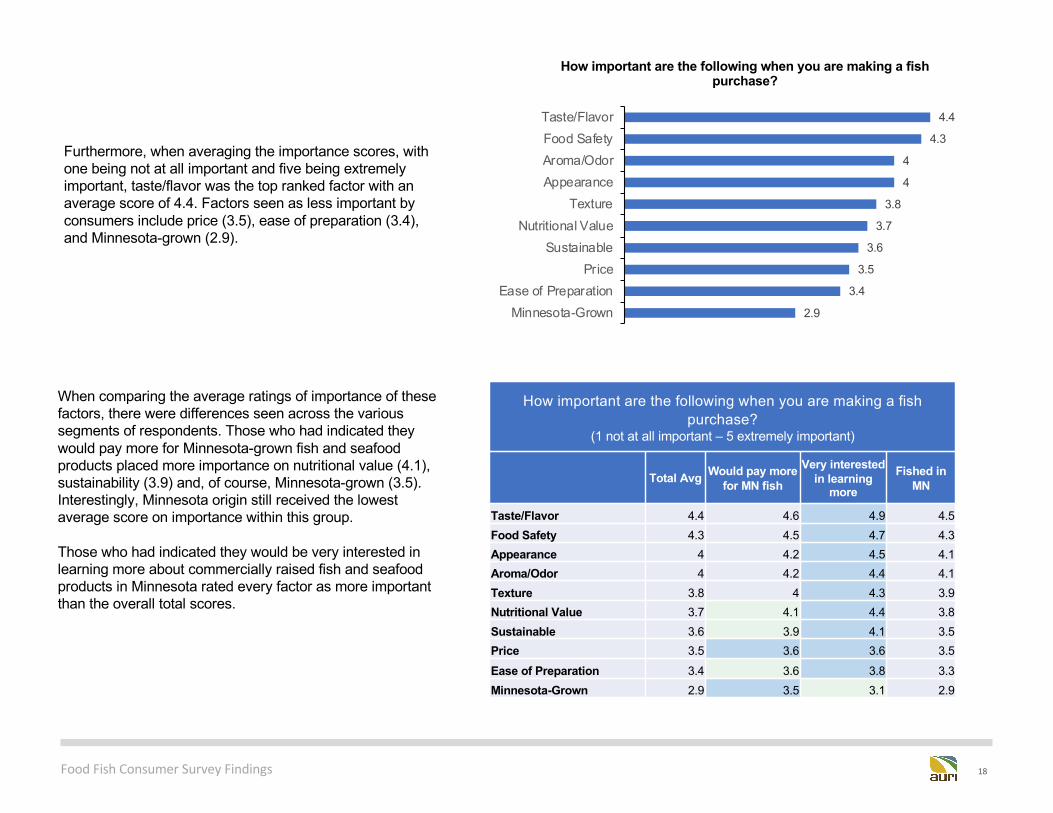
Furthermore, when averaging the importance scores, with one being not at all important and five being extremely important, taste/flavor was the top ranked factor with an average score of 4.4. Factors seen as less important by consumers include price (3.5), ease of preparation (3.4), and Minnesota-grown (2.9).
When comparing the average ratings of importance of these factors, there were differences seen across the various segments of respondents. Those who had indicated they would pay more for Minnesota-grown fish and seafood products placed more importance on nutritional value (4.1), sustainability (3.9) and, of course, Minnesota-grown (3.5). Interestingly, Minnesota origin still received the lowest average score on importance within this group.
Those who had indicated they would be very interested in learning more about commercially raised fish and seafood products in Minnesota rated every factor as more important than the overall total scores.
How important are the following when you are making a fish purchase?
(1 not at all important – 5 extremely important)
Total Avg Would pay more for MN fish
Very interested in learning
moreFished in
MN
Taste/Flavor 4.4 4.6 4.9 4.5Food Safety 4.3 4.5 4.7 4.3Appearance 4 4.2 4.5 4.1Aroma/Odor 4 4.2 4.4 4.1Texture 3.8 4 4.3 3.9Nutritional Value 3.7 4.1 4.4 3.8Sustainable 3.6 3.9 4.1 3.5Price 3.5 3.6 3.6 3.5Ease of Preparation 3.4 3.6 3.8 3.3Minnesota-Grown 2.9 3.5 3.1 2.9
Food Fish Consumer Survey Findings 19
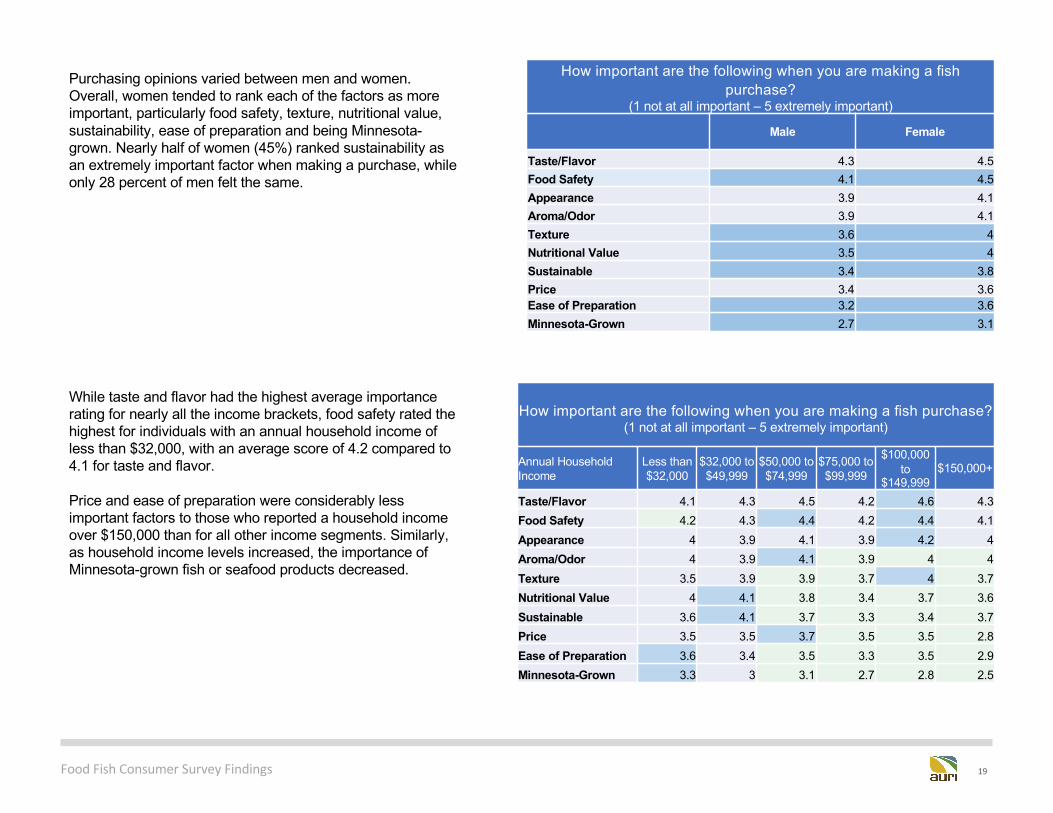
Purchasing opinions varied between men and women. Overall, women tended to rank each of the factors as more important, particularly food safety, texture, nutritional value, sustainability, ease of preparation and being Minnesota-grown. Nearly half of women (45%) ranked sustainability as an extremely important factor when making a purchase, while only 28 percent of men felt the same.
How important are the following when you are making a fish purchase?
(1 not at all important – 5 extremely important)
Male Female
Taste/Flavor 4.3 4.5Food Safety 4.1 4.5Appearance 3.9 4.1Aroma/Odor 3.9 4.1Texture 3.6 4Nutritional Value 3.5 4Sustainable 3.4 3.8Price 3.4 3.6Ease of Preparation 3.2 3.6Minnesota-Grown 2.7 3.1
While taste and flavor had the highest average importance rating for nearly all the income brackets, food safety rated the highest for individuals with an annual household income of less than $32,000, with an average score of 4.2 compared to 4.1 for taste and flavor.
Price and ease of preparation were considerably less important factors to those who reported a household income over $150,000 than for all other income segments. Similarly, as household income levels increased, the importance of Minnesota-grown fish or seafood products decreased.
How important are the following when you are making a fish purchase? (1 not at all important – 5 extremely important)
Annual Household Income
Less than $32,000
$32,000 to $49,999
$50,000 to $74,999
$75,000 to $99,999
$100,000 to
$149,999$150,000+
Taste/Flavor 4.1 4.3 4.5 4.2 4.6 4.3Food Safety 4.2 4.3 4.4 4.2 4.4 4.1Appearance 4 3.9 4.1 3.9 4.2 4Aroma/Odor 4 3.9 4.1 3.9 4 4Texture 3.5 3.9 3.9 3.7 4 3.7Nutritional Value 4 4.1 3.8 3.4 3.7 3.6Sustainable 3.6 4.1 3.7 3.3 3.4 3.7Price 3.5 3.5 3.7 3.5 3.5 2.8Ease of Preparation 3.6 3.4 3.5 3.3 3.5 2.9Minnesota-Grown 3.3 3 3.1 2.7 2.8 2.5
Food Fish Consumer Survey Findings 20
34% 38%46%
11% 7% 6%
56% 56%48%
Raised in Minnesota Sustainably Raised Products that benefit thestate's economy
Would you be willing to pay more, less or the same for fish, salmon or shrimp with these attributes?
More Less The same
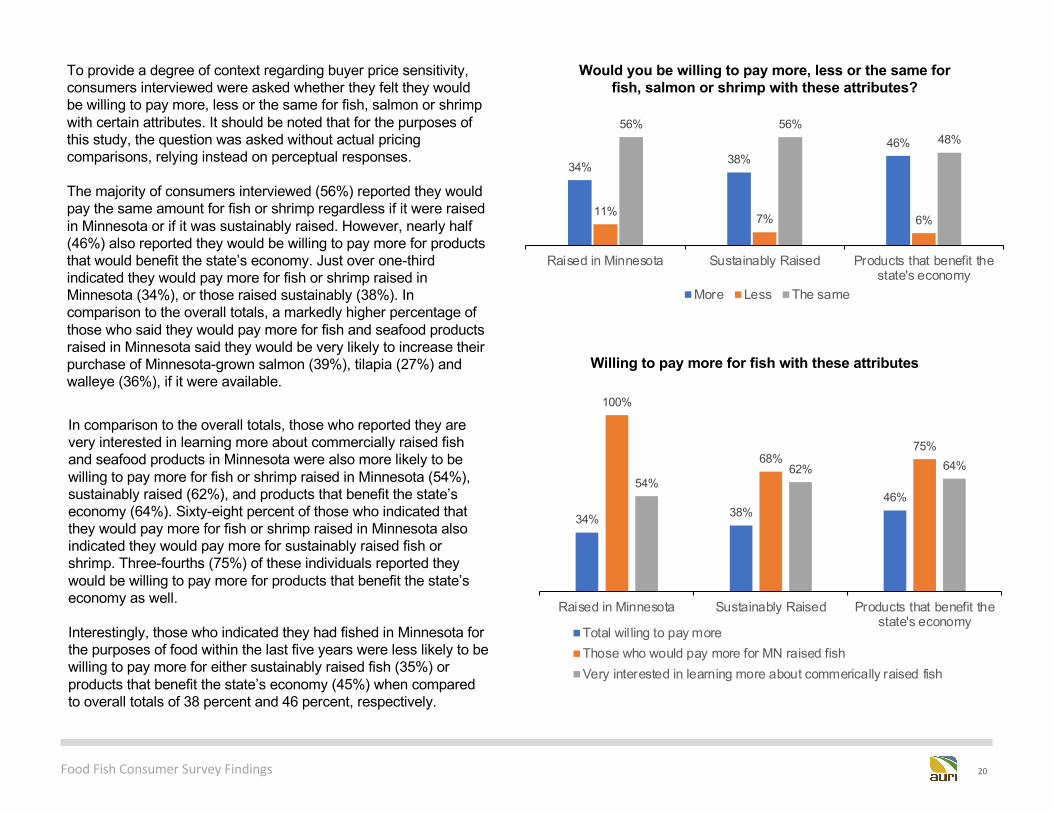
In comparison to the overall totals, those who reported they are very interested in learning more about commercially raised fish and seafood products in Minnesota were also more likely to be willing to pay more for fish or shrimp raised in Minnesota (54%), sustainably raised (62%), and products that benefit the state’s economy (64%). Sixty-eight percent of those who indicated that they would pay more for fish or shrimp raised in Minnesota also indicated they would pay more for sustainably raised fish or shrimp. Three-fourths (75%) of these individuals reported they would be willing to pay more for products that benefit the state’s economy as well.
Interestingly, those who indicated they had fished in Minnesota for the purposes of food within the last five years were less likely to be willing to pay more for either sustainably raised fish (35%) or products that benefit the state’s economy (45%) when compared to overall totals of 38 percent and 46 percent, respectively.
To provide a degree of context regarding buyer price sensitivity, consumers interviewed were asked whether they felt they would be willing to pay more, less or the same for fish, salmon or shrimp with certain attributes. It should be noted that for the purposes of this study, the question was asked without actual pricing comparisons, relying instead on perceptual responses.
The majority of consumers interviewed (56%) reported they would pay the same amount for fish or shrimp regardless if it were raised in Minnesota or if it was sustainably raised. However, nearly half (46%) also reported they would be willing to pay more for products that would benefit the state’s economy. Just over one-third indicated they would pay more for fish or shrimp raised in Minnesota (34%), or those raised sustainably (38%). In comparison to the overall totals, a markedly higher percentage of those who said they would pay more for fish and seafood products raised in Minnesota said they would be very likely to increase their purchase of Minnesota-grown salmon (39%), tilapia (27%) and walleye (36%), if it were available.
34% 38%46%
100%
68%75%
54%62% 64%
Raised in Minnesota Sustainably Raised Products that benefit thestate's economy
Willing to pay more for fish with these attributes
Total wil ling to pay moreThose who would pay more for MN raised fishVery interested in learning more about commerically raised fish
Food Fish Consumer Survey Findings 21
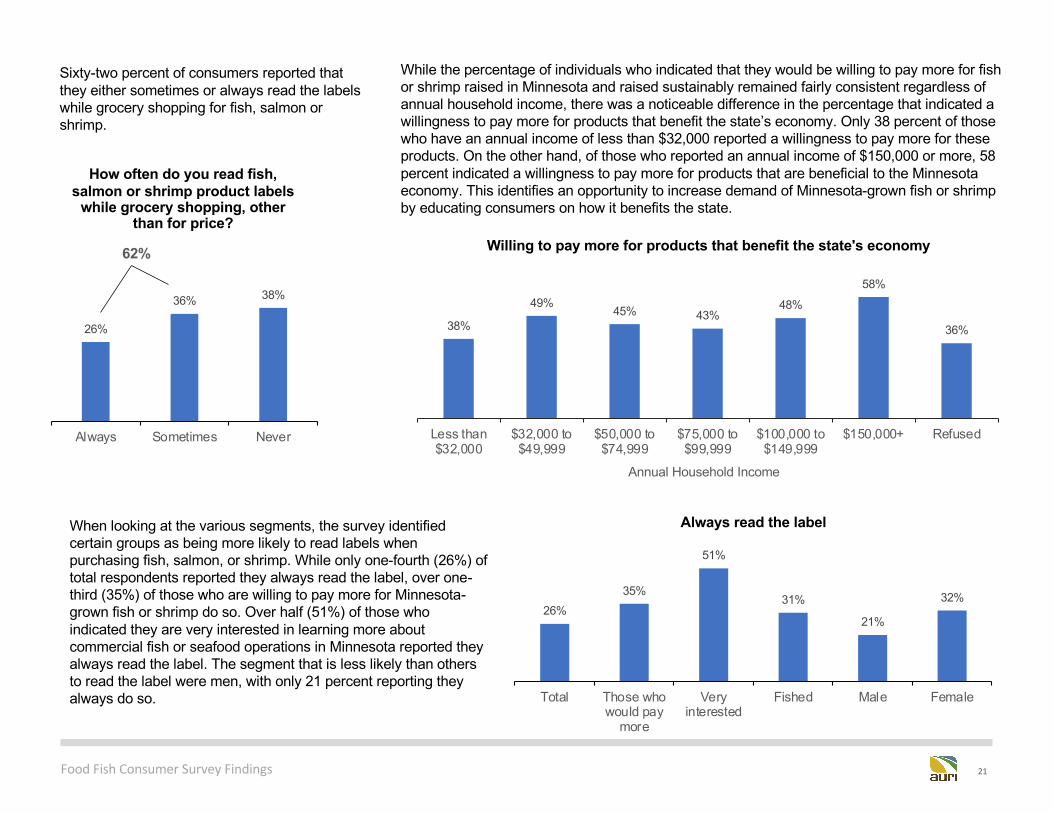
Sixty-two percent of consumers reported that they either sometimes or always read the labels while grocery shopping for fish, salmon or shrimp.
When looking at the various segments, the survey identified certain groups as being more likely to read labels when purchasing fish, salmon, or shrimp. While only one-fourth (26%) of total respondents reported they always read the label, over one-third (35%) of those who are willing to pay more for Minnesota-grown fish or shrimp do so. Over half (51%) of those who indicated they are very interested in learning more about commercial fish or seafood operations in Minnesota reported they always read the label. The segment that is less likely than othersto read the label were men, with only 21 percent reporting they always do so.
26%
36% 38%
Always Sometimes Never
How often do you read fish, salmon or shrimp product labels
while grocery shopping, other than for price?
62%
26%35%
51%
31%
21%
32%
Total Those whowould pay
more
Veryinterested
Fished Male Female
Always read the label
38%
49%45% 43%
48%
58%
36%
Less than$32,000
$32,000 to$49,999
$50,000 to$74,999
$75,000 to$99,999
$100,000 to$149,999
$150,000+ Refused
Annual Household Income
Willing to pay more for products that benefit the state's economy
While the percentage of individuals who indicated that they would be willing to pay more for fish or shrimp raised in Minnesota and raised sustainably remained fairly consistent regardless of annual household income, there was a noticeable difference in the percentage that indicated a willingness to pay more for products that benefit the state’s economy. Only 38 percent of those who have an annual income of less than $32,000 reported a willingness to pay more for these products. On the other hand, of those who reported an annual income of $150,000 or more, 58 percent indicated a willingness to pay more for products that are beneficial to the Minnesota economy. This identifies an opportunity to increase demand of Minnesota-grown fish or shrimp by educating consumers on how it benefits the state.
Food Fish Consumer Survey Findings 22
54%
30%
36%
26%
14%
32%
51% 51% 50%
38%
15%
19%
13%
24%
48%
Government Agencies Commercial fish operations Grocery stores orsupermarkets
Food processors International fish farms
How much do you trust the following entities to keep the fish sold in restaurants and stores safe?
Quite a bit/A great deal Some None/Very Little
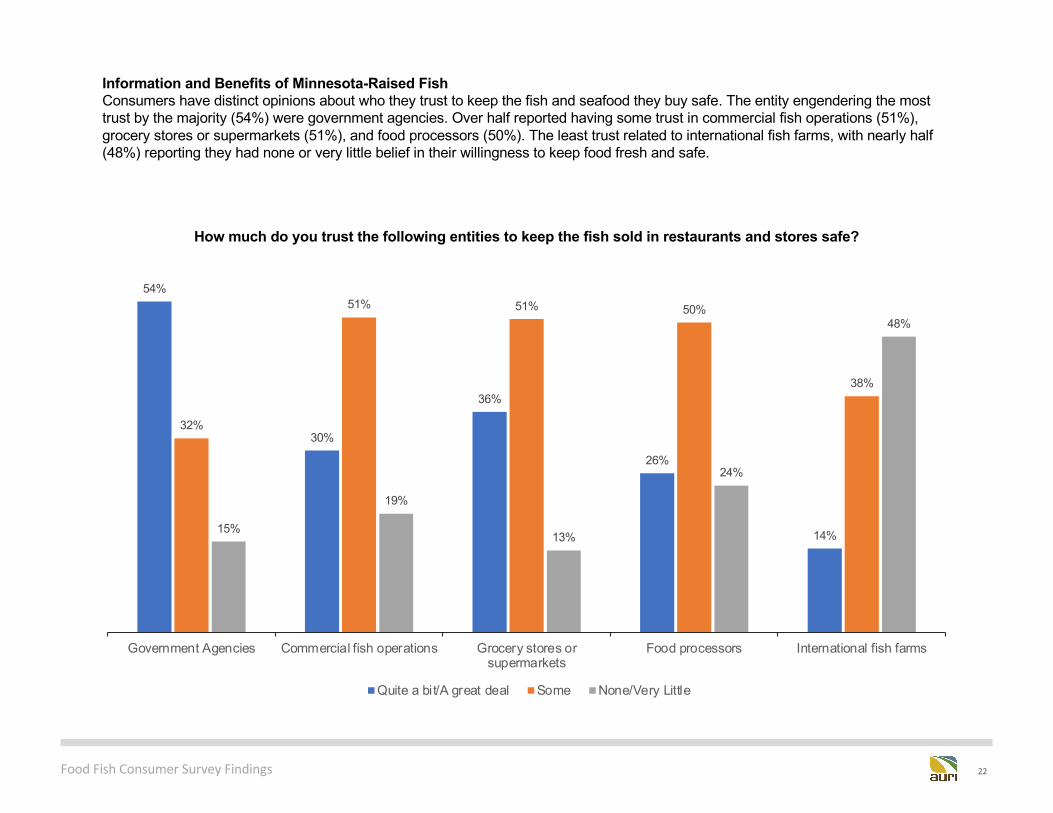
Information and Benefits of Minnesota-Raised FishConsumers have distinct opinions about who they trust to keep the fish and seafood they buy safe. The entity engendering the most trust by the majority (54%) were government agencies. Over half reported having some trust in commercial fish operations (51%), grocery stores or supermarkets (51%), and food processors (50%). The least trust related to international fish farms, with nearly half (48%) reporting they had none or very little belief in their willingness to keep food fresh and safe.
Food Fish Consumer Survey Findings 23
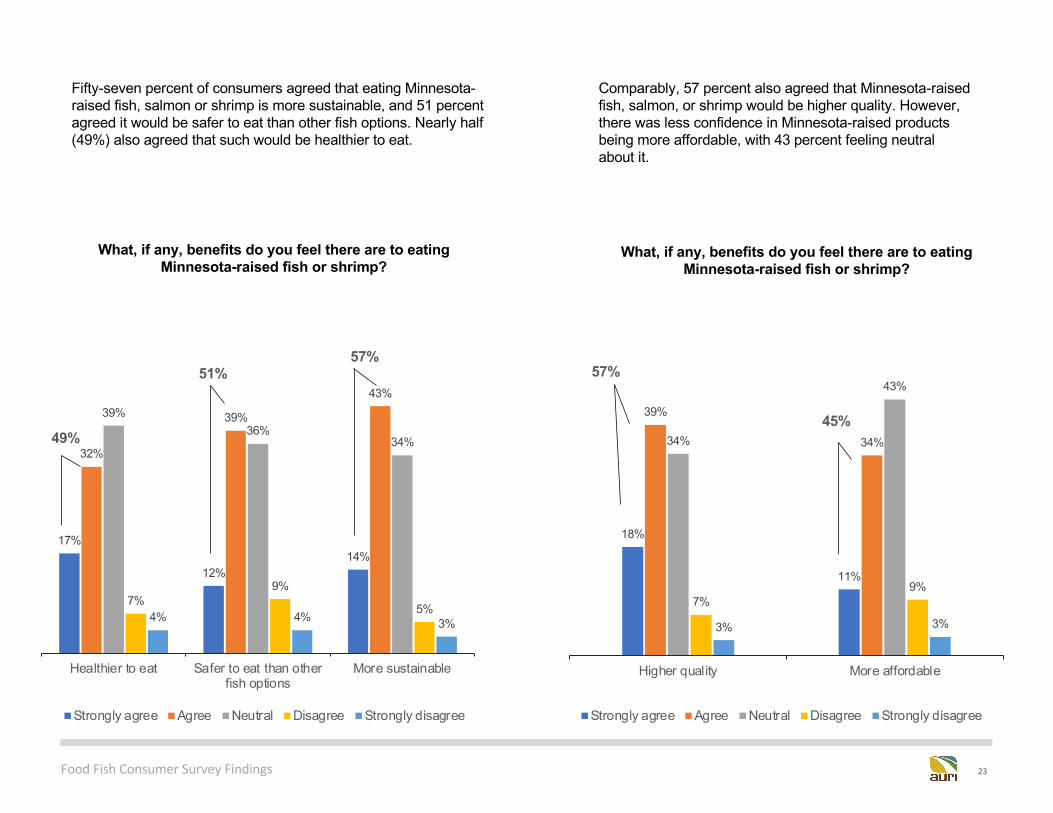
Comparably, 57 percent also agreed that Minnesota-raised fish, salmon, or shrimp would be higher quality. However, there was less confidence in Minnesota-raised products being more affordable, with 43 percent feeling neutral about it.
Fifty-seven percent of consumers agreed that eating Minnesota-raised fish, salmon or shrimp is more sustainable, and 51 percent agreed it would be safer to eat than other fish options. Nearly half (49%) also agreed that such would be healthier to eat.
17%
12%14%
32%
39%
43%39%
36%34%
7%9%
5%4% 4% 3%
Healthier to eat Safer to eat than otherfish options
More sustainable
What, if any, benefits do you feel there are to eating Minnesota-raised fish or shrimp?
Strongly agree Agree Neutral Disagree Strongly disagree
51%57%
18%
11%
39%
34%34%
43%
7%9%
3% 3%
Higher quality More affordable
What, if any, benefits do you feel there are to eating Minnesota-raised fish or shrimp?
Strongly agree Agree Neutral Disagree Strongly disagree
49%
57%
45%
Food Fish Consumer Survey Findings 24
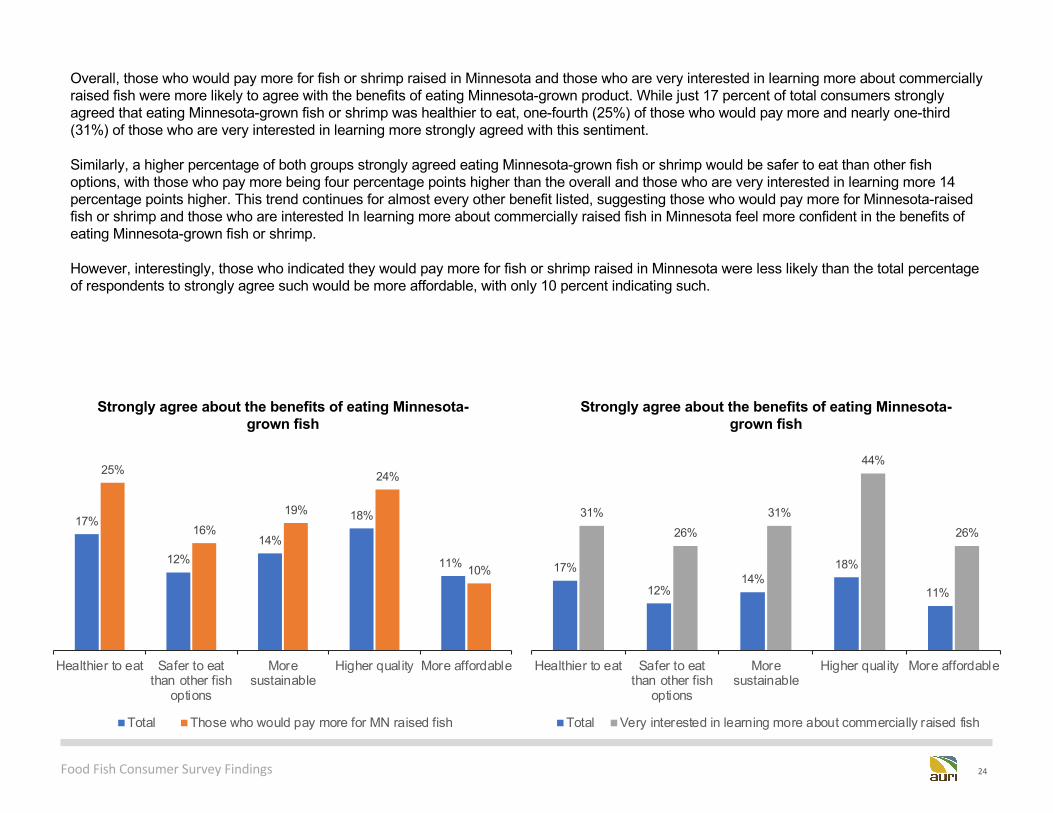
Overall, those who would pay more for fish or shrimp raised in Minnesota and those who are very interested in learning more about commercially raised fish were more likely to agree with the benefits of eating Minnesota-grown product. While just 17 percent of total consumers strongly agreed that eating Minnesota-grown fish or shrimp was healthier to eat, one-fourth (25%) of those who would pay more and nearly one-third (31%) of those who are very interested in learning more strongly agreed with this sentiment.
Similarly, a higher percentage of both groups strongly agreed eating Minnesota-grown fish or shrimp would be safer to eat than other fish options, with those who pay more being four percentage points higher than the overall and those who are very interested in learning more 14 percentage points higher. This trend continues for almost every other benefit listed, suggesting those who would pay more for Minnesota-raised fish or shrimp and those who are interested In learning more about commercially raised fish in Minnesota feel more confident in the benefits ofeating Minnesota-grown fish or shrimp.
However, interestingly, those who indicated they would pay more for fish or shrimp raised in Minnesota were less likely than the total percentage of respondents to strongly agree such would be more affordable, with only 10 percent indicating such.
17%
12%14%
18%
11%
25%
16%19%
24%
10%
Healthier to eat Safer to eatthan other fish
options
Moresustainable
Higher quality More affordable
Strongly agree about the benefits of eating Minnesota-grown fish
Total Those who would pay more for MN raised fish
17%
12%14%
18%
11%
31%26%
31%
44%
26%
Healthier to eat Safer to eatthan other fish
options
Moresustainable
Higher quality More affordable
Strongly agree about the benefits of eating Minnesota-grown fish
Total Very interested in learning more about commercially raised fish
Food Fish Consumer Survey Findings 25
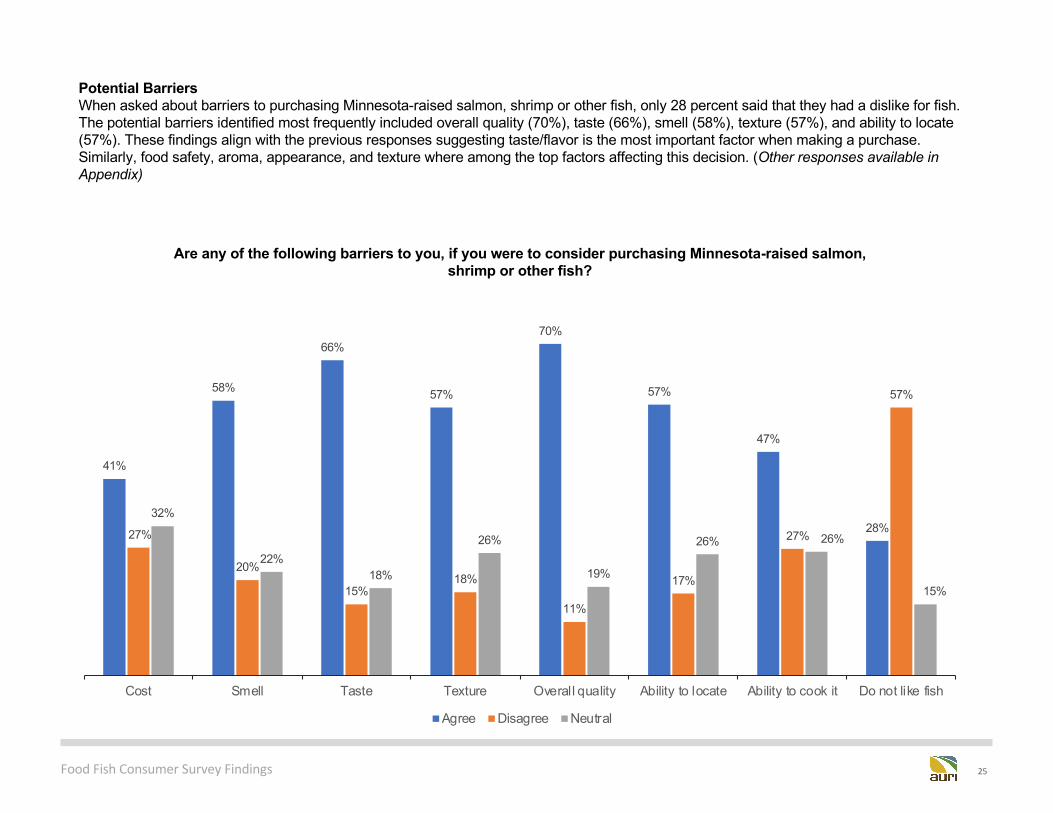
Potential BarriersWhen asked about barriers to purchasing Minnesota-raised salmon, shrimp or other fish, only 28 percent said that they had a dislike for fish. The potential barriers identified most frequently included overall quality (70%), taste (66%), smell (58%), texture (57%), and ability to locate (57%). These findings align with the previous responses suggesting taste/flavor is the most important factor when making a purchase. Similarly, food safety, aroma, appearance, and texture where among the top factors affecting this decision. (Other responses available in Appendix)
41%
58%
66%
57%
70%
57%
47%
28%27%
20%
15%18%
11%
17%
27%
57%
32%
22%18%
26%
19%
26% 26%
15%
Cost Smell Taste Texture Overall quality Ability to locate Ability to cook it Do not like fish
Are any of the following barriers to you, if you were to consider purchasing Minnesota-raised salmon, shrimp or other fish?
Agree Disagree Neutral
Food Fish Consumer Survey Findings 26
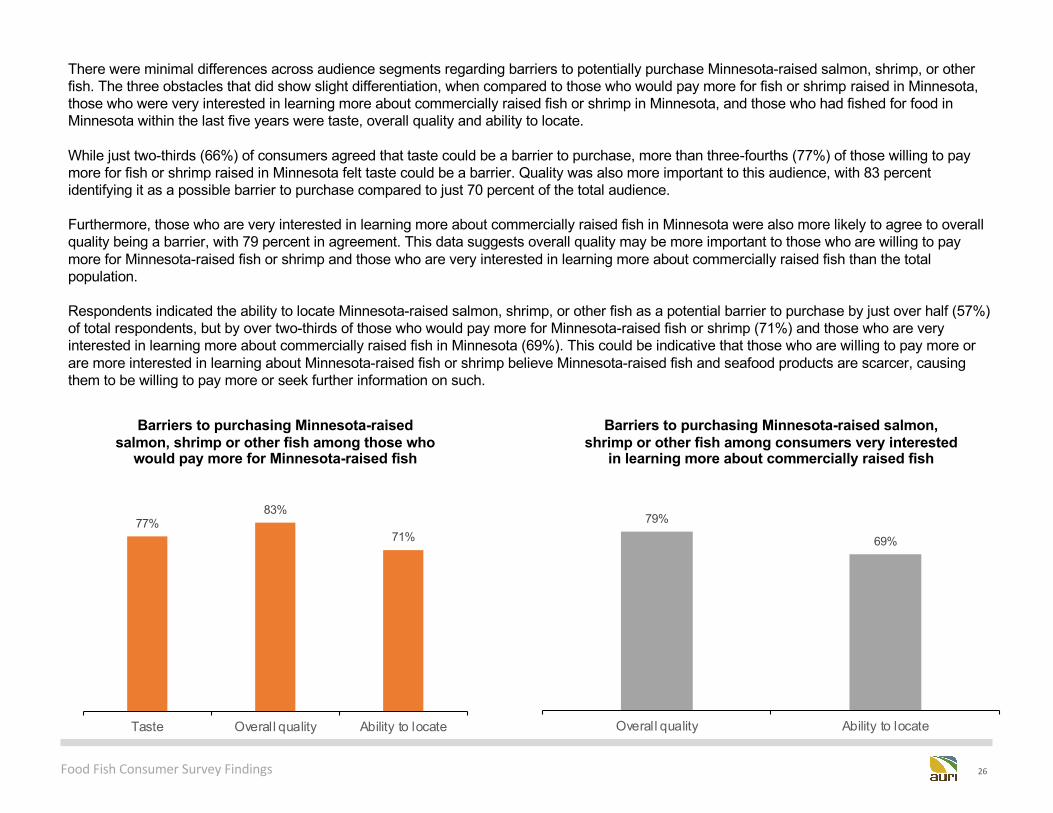
There were minimal differences across audience segments regarding barriers to potentially purchase Minnesota-raised salmon, shrimp, or other fish. The three obstacles that did show slight differentiation, when compared to those who would pay more for fish or shrimp raised in Minnesota, those who were very interested in learning more about commercially raised fish or shrimp in Minnesota, and those who had fished for food in Minnesota within the last five years were taste, overall quality and ability to locate.
While just two-thirds (66%) of consumers agreed that taste could be a barrier to purchase, more than three-fourths (77%) of those willing to pay more for fish or shrimp raised in Minnesota felt taste could be a barrier. Quality was also more important to this audience, with 83 percent identifying it as a possible barrier to purchase compared to just 70 percent of the total audience.
Furthermore, those who are very interested in learning more about commercially raised fish in Minnesota were also more likely to agree to overall quality being a barrier, with 79 percent in agreement. This data suggests overall quality may be more important to those who are willing to pay more for Minnesota-raised fish or shrimp and those who are very interested in learning more about commercially raised fish than the total population.
Respondents indicated the ability to locate Minnesota-raised salmon, shrimp, or other fish as a potential barrier to purchase by just over half (57%) of total respondents, but by over two-thirds of those who would pay more for Minnesota-raised fish or shrimp (71%) and those who are very interested in learning more about commercially raised fish in Minnesota (69%). This could be indicative that those who are willing to pay more or are more interested in learning about Minnesota-raised fish or shrimp believe Minnesota-raised fish and seafood products are scarcer, causing them to be willing to pay more or seek further information on such.
79%
69%
Overall quality Ability to locate
Barriers to purchasing Minnesota-raised salmon, shrimp or other fish among consumers very interested
in learning more about commercially raised fish
77%83%
71%
Taste Overall quality Ability to locate
Barriers to purchasing Minnesota-raised salmon, shrimp or other fish among those who
would pay more for Minnesota-raised fish
Food Fish Consumer Survey Findings 27
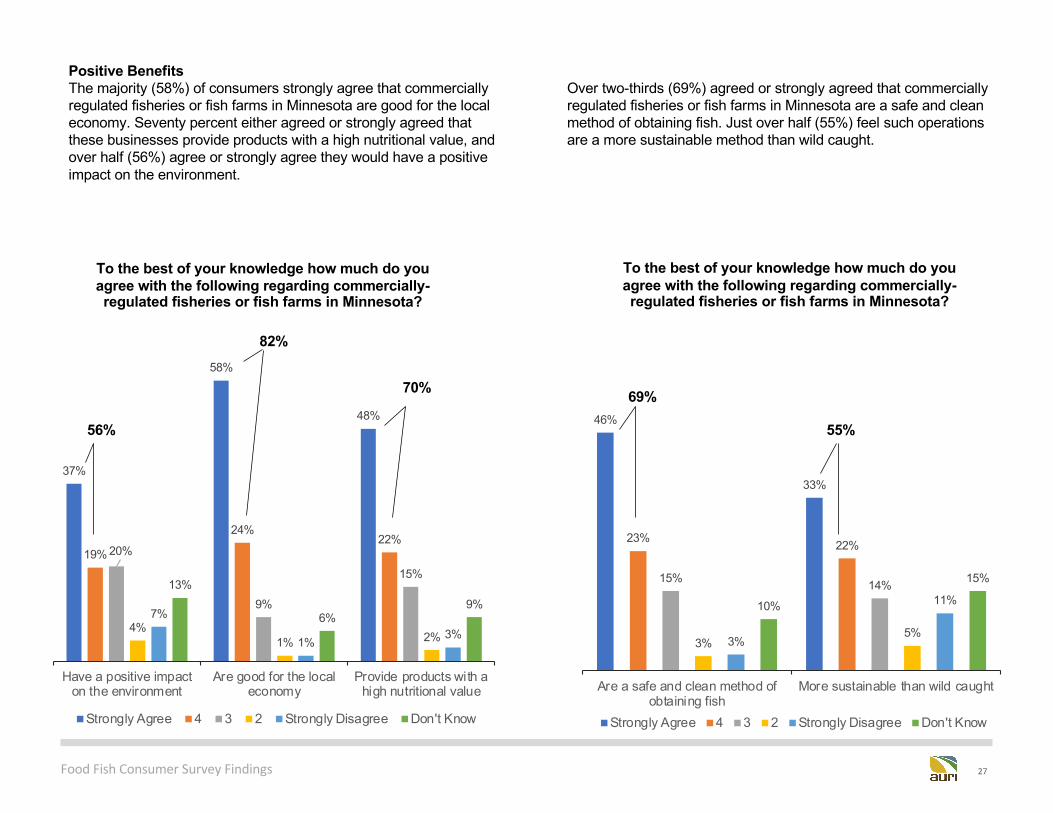
Over two-thirds (69%) agreed or strongly agreed that commercially regulated fisheries or fish farms in Minnesota are a safe and clean method of obtaining fish. Just over half (55%) feel such operationsare a more sustainable method than wild caught.
Positive BenefitsThe majority (58%) of consumers strongly agree that commercially regulated fisheries or fish farms in Minnesota are good for the local economy. Seventy percent either agreed or strongly agreed that these businesses provide products with a high nutritional value, and over half (56%) agree or strongly agree they would have a positive impact on the environment.
37%
58%
48%
19%
24%22%
20%
9%
15%
4%1% 2%
7%
1%3%
13%
6%9%
Have a positive impacton the environment
Are good for the localeconomy
Provide products with ahigh nutritional value
To the best of your knowledge how much do you agree with the following regarding commercially-regulated fisheries or fish farms in Minnesota?
Strongly Agree 4 3 2 Strongly Disagree Don't Know
82%
56%46%
33%
23% 22%
15% 14%
3%5%
3%
11%10%
15%
Are a safe and clean method ofobtaining fish
More sustainable than wild caught
To the best of your knowledge how much do you agree with the following regarding commercially-regulated fisheries or fish farms in Minnesota?
Strongly Agree 4 3 2 Strongly Disagree Don't Know
69%
55%
70%
Food Fish Consumer Survey Findings 28
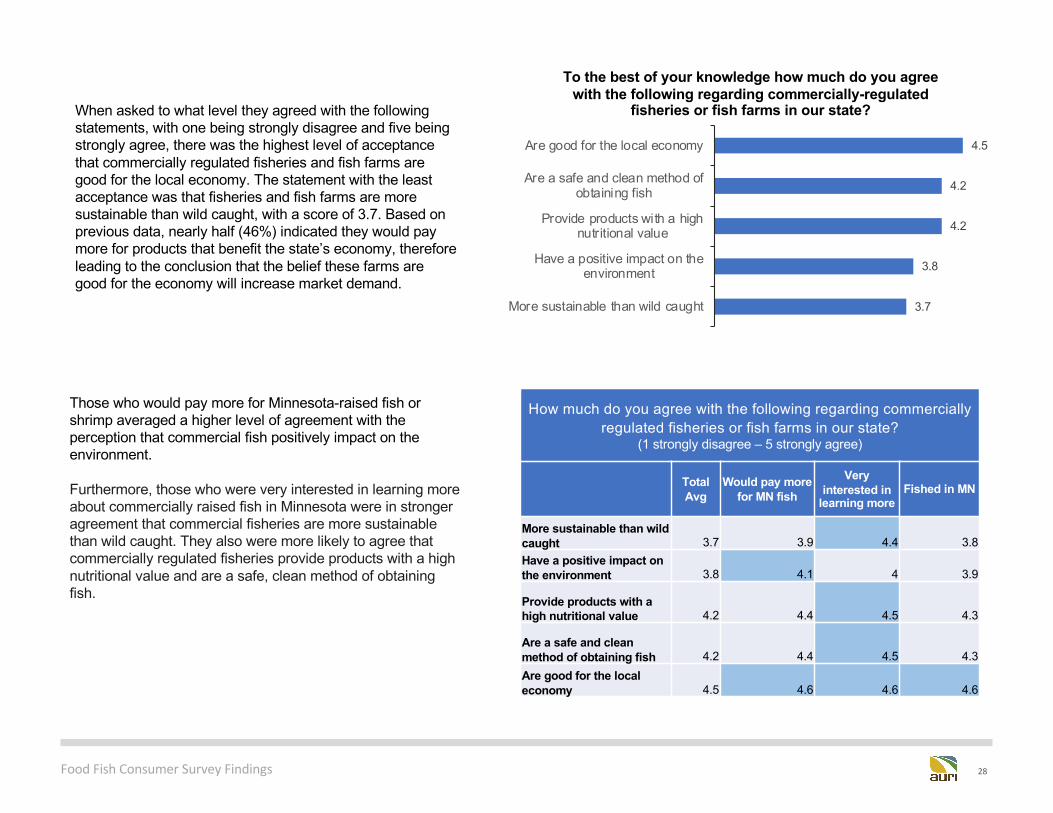
Those who would pay more for Minnesota-raised fish or shrimp averaged a higher level of agreement with the perception that commercial fish positively impact on the environment.
Furthermore, those who were very interested in learning more about commercially raised fish in Minnesota were in stronger agreement that commercial fisheries are more sustainable than wild caught. They also were more likely to agree that commercially regulated fisheries provide products with a high nutritional value and are a safe, clean method of obtaining fish.
How much do you agree with the following regarding commercially regulated fisheries or fish farms in our state?
(1 strongly disagree – 5 strongly agree)
Total Avg
Would pay more for MN fish
Very interested in
learning moreFished in MN
More sustainable than wild caught 3.7 3.9 4.4 3.8Have a positive impact on the environment 3.8 4.1 4 3.9
Provide products with a high nutritional value 4.2 4.4 4.5 4.3
Are a safe and clean method of obtaining fish 4.2 4.4 4.5 4.3Are good for the local economy 4.5 4.6 4.6 4.6
3.7
3.8
4.2
4.2
4.5
More sustainable than wild caught
Have a positive impact on theenvironment
Provide products with a highnutritional value
Are a safe and clean method ofobtaining fish
Are good for the local economy
To the best of your knowledge how much do you agree with the following regarding commercially-regulated
fisheries or fish farms in our state? When asked to what level they agreed with the following statements, with one being strongly disagree and five being strongly agree, there was the highest level of acceptance that commercially regulated fisheries and fish farms are good for the local economy. The statement with the least acceptance was that fisheries and fish farms are more sustainable than wild caught, with a score of 3.7. Based on previous data, nearly half (46%) indicated they would pay more for products that benefit the state’s economy, therefore leading to the conclusion that the belief these farms are good for the economy will increase market demand.
Food Fish Consumer Survey Findings 29
11%
35%
22%
31%
How interested would you be in learning more about fish that are commercially raised in
Minnesota?
Very interestedSomewhat interested
Not very interested
Not at all interested
44%
49%
43%
30%
36%39%
43%45%
Less than$32,000
$32,000 to$49,999
$50,000 to$74,999
$75,000 to$99,999
$100,000 to$149,999
$150,000+ Refused
Interest in learning more about fish that is commercially raised in Minnesota
Very interested Somewhat interested Not very interested Not at all interested
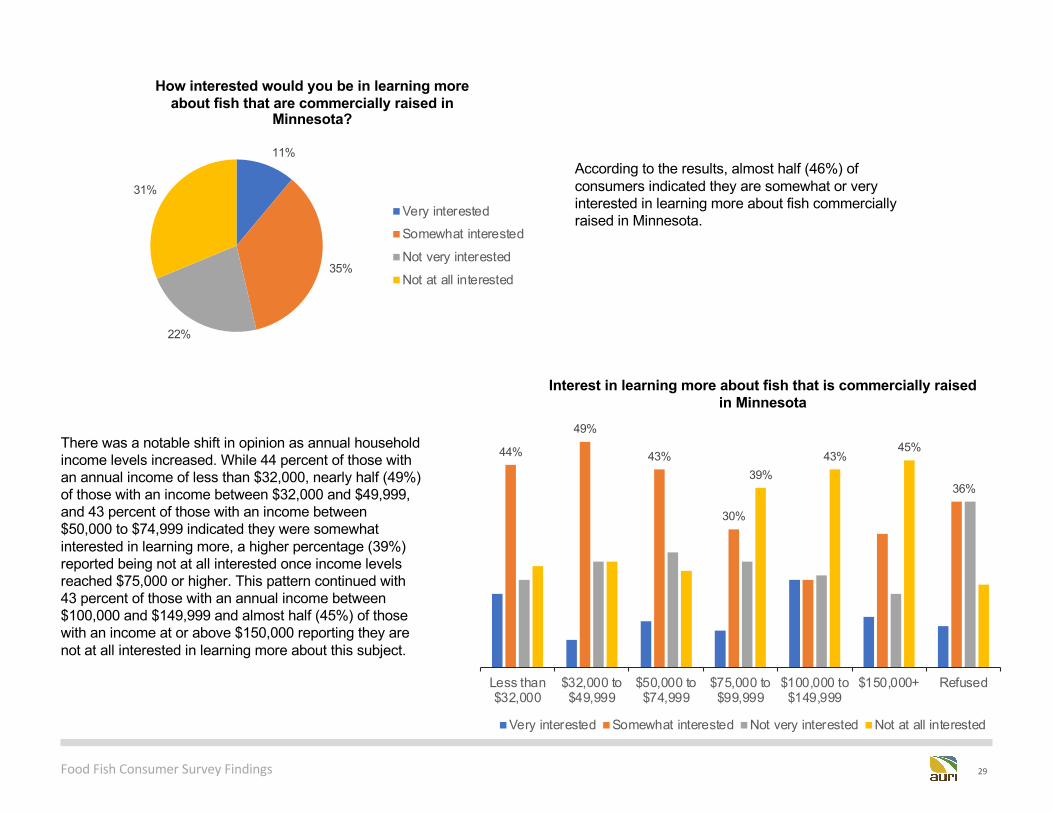
There was a notable shift in opinion as annual household income levels increased. While 44 percent of those with an annual income of less than $32,000, nearly half (49%) of those with an income between $32,000 and $49,999, and 43 percent of those with an income between $50,000 to $74,999 indicated they were somewhat interested in learning more, a higher percentage (39%) reported being not at all interested once income levels reached $75,000 or higher. This pattern continued with 43 percent of those with an annual income between $100,000 and $149,999 and almost half (45%) of those with an income at or above $150,000 reporting they are not at all interested in learning more about this subject.
According to the results, almost half (46%) of consumers indicated they are somewhat or very interested in learning more about fish commercially raised in Minnesota.
Food Fish Consumer Survey Findings 30
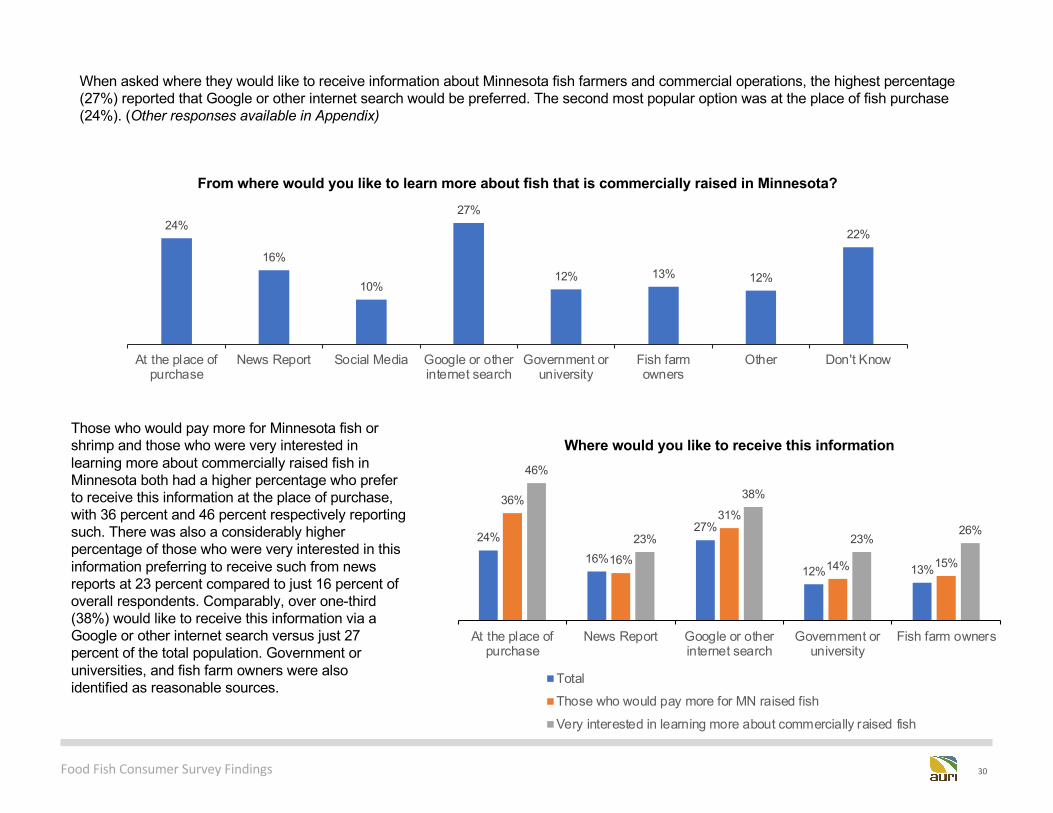
When asked where they would like to receive information about Minnesota fish farmers and commercial operations, the highest percentage (27%) reported that Google or other internet search would be preferred. The second most popular option was at the place of fish purchase (24%). (Other responses available in Appendix)
24%
16%
10%
27%
12% 13% 12%
22%
At the place ofpurchase
News Report Social Media Google or otherinternet search
Government oruniversity
Fish farmowners
Other Don't Know
From where would you like to learn more about fish that is commercially raised in Minnesota?
Those who would pay more for Minnesota fish or shrimp and those who were very interested in learning more about commercially raised fish in Minnesota both had a higher percentage who prefer to receive this information at the place of purchase, with 36 percent and 46 percent respectively reporting such. There was also a considerably higher percentage of those who were very interested in this information preferring to receive such from news reports at 23 percent compared to just 16 percent of overall respondents. Comparably, over one-third (38%) would like to receive this information via a Google or other internet search versus just 27 percent of the total population. Government or universities, and fish farm owners were also identified as reasonable sources.
24%
16%
27%
12% 13%
36%
16%
31%
14% 15%
46%
23%
38%
23%26%
At the place ofpurchase
News Report Google or otherinternet search
Government oruniversity
Fish farm owners
Where would you like to receive this information
TotalThose who would pay more for MN raised fish
Very interested in learning more about commercially raised fish
Food Fish Consumer Survey Findings 31
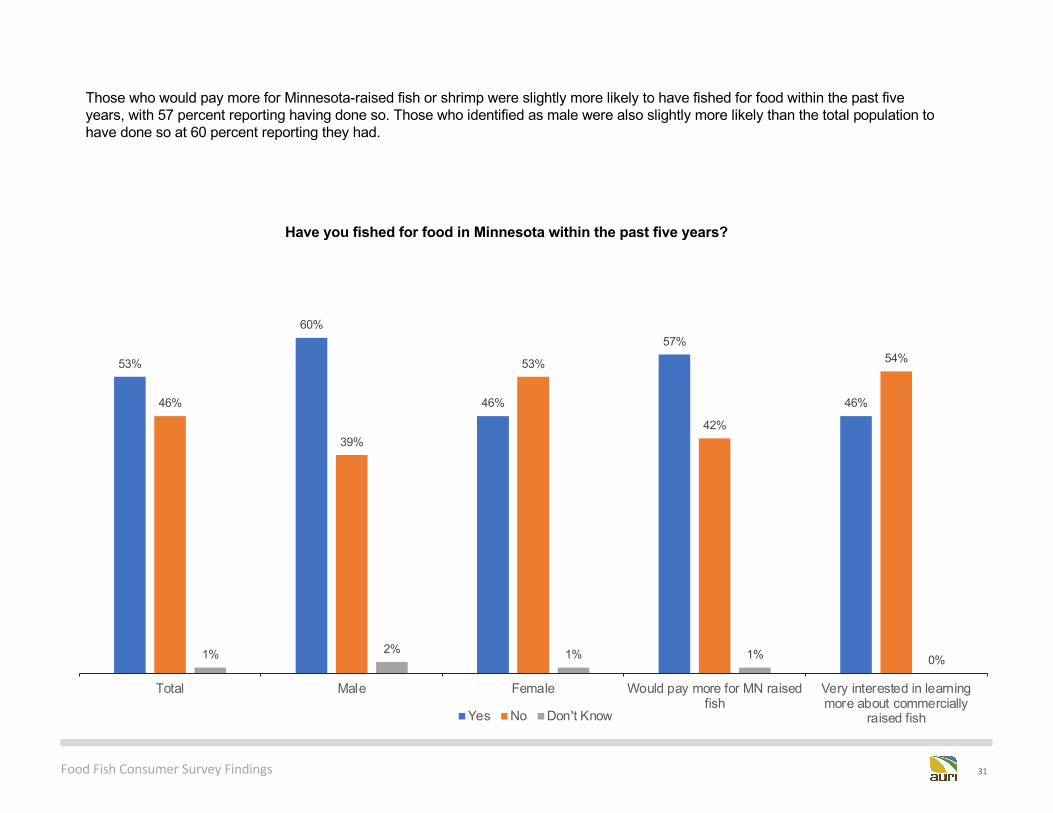
Those who would pay more for Minnesota-raised fish or shrimp were slightly more likely to have fished for food within the past five years, with 57 percent reporting having done so. Those who identified as male were also slightly more likely than the total population to have done so at 60 percent reporting they had.
53%
60%
46%
57%
46%46%
39%
53%
42%
54%
1% 2% 1% 1% 0%
Total Male Female Would pay more for MN raisedfish
Very interested in learningmore about commercially
raised fish
Have you fished for food in Minnesota within the past five years?
Yes No Don't Know
Food Fish Consumer Survey Findings 32
Recommendations• • • •
Food Fish Consumer Survey Findings 33
Findings from this study shed new light on consumer opinions about food fish purchasing and preferences – information that should serve to provide guidance to the aquaculture industry in Minnesota. More in-depth recommendations will be included in the upcoming, more extensive AURI food fish report; however, the following are offered as considerations based upon consumer study research results.
EDUCATEProactively advance awareness and understanding of the availability of Minnesota farm-raised fish and shrimp, and the inherent benefits for consumers, retailers/restaurants, and the financial and agricultural communities by undertaking a public education and outreach campaign.
Accurately position aquaculture operations and products in Minnesota, whenever feasible, as being environmentally friendly, a good source of protein, sustainable and energy efficient.
Emphasize the economic advantages of expanding the aquaculture industry within Minnesota across all educational touchpoints.
COMMUNICATEEnsure clear point-of-purchase information through accurate nutritional and source labeling. To reassure consumers of the safety of the product, indicate such on the labels and emphasize the local aspect to increase credibility and trust.
Establish a centralized online destination that provides clear information about food fish aquaculture products available in Minnesota and how to cook them, among other information.
Highlight the health benefits of food fish products on labels, advertising, the aquaculture website, and point-of-purchase materials to remind consumers of this healthy alternative to other meat products.
PROMOTEAggressively raise the industry’s profile about Minnesota aquaculture developments and the economic potential of success.
Position Minnesota aquaculture products as environmentally friendly, sustainable and healthy as compared to imported, competitive products, and promote fish raised locally in an environmentally sustainable way.
Food Fish Consumer Survey Findings 34
Appendix• • • •
Food Fish Consumer Survey Findings 35
Northwest Northeast West Central Central Urban Southwest SoutheastBeltrami Aitkin Becker Benton Anoka Big Stone Blue Earth
Clearwater Carlton Clay Cass Carver Chippewa Brown
Hubbard Cook Douglas Chisago Dakota Cottonwood Dodge
Kittson Itasca Grant Cow Wing Hennepin Jackson Faribault
Lake of the Woods Koochiching Otter Tail Isanti Ramsey Kandiyohi Filmore
Mahnomen Lake Pope Kanabec Scott Lac Qui Parie Freeborn
Marshall St. Louis Stevens Mille Lacs Washington Lincoln Goodhue
Norman Traverse Morrison Lyon Houston
Pennington Wilkin Pine McLeod Le Suer
Polk Sherburne Meeker Martin
Red Lake Stearns Murray Mower
Roseau Todd Nobles Nicollet
Wadena Pipestone Olmstead
Wright Redwood Rice
Renville Sibley
Rock Steele
Swift Wabasha
Yellow Medicine Waseca
Watonwan
Winona
Breakdown of region by Minnesota county [page 7]• • • •
Food Fish Consumer Survey Findings 36
Are you… [Other responses, page 8]• • • •
- Other- Pali Pali- Italian- Native American- Something else
Food Fish Consumer Survey Findings 37
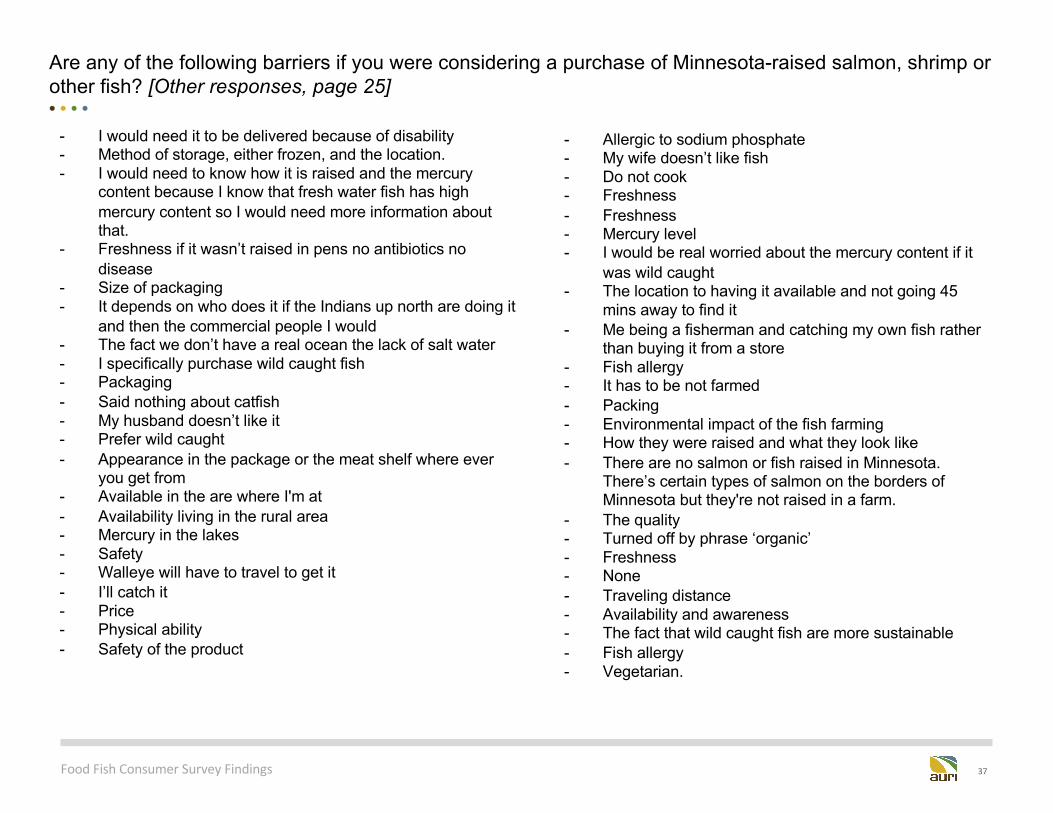
Are any of the following barriers if you were considering a purchase of Minnesota-raised salmon, shrimp or other fish? [Other responses, page 25]• • • •
- I would need it to be delivered because of disability- Method of storage, either frozen, and the location.- I would need to know how it is raised and the mercury
content because I know that fresh water fish has high mercury content so I would need more information about that.
- Freshness if it wasn’t raised in pens no antibiotics no disease
- Size of packaging- It depends on who does it if the Indians up north are doing it
and then the commercial people I would- The fact we don’t have a real ocean the lack of salt water- I specifically purchase wild caught fish- Packaging- Said nothing about catfish- My husband doesn’t like it- Prefer wild caught- Appearance in the package or the meat shelf where ever
you get from- Available in the are where I'm at- Availability living in the rural area- Mercury in the lakes- Safety- Walleye will have to travel to get it- I’ll catch it- Price- Physical ability- Safety of the product
- Allergic to sodium phosphate- My wife doesn’t like fish- Do not cook- Freshness- Freshness- Mercury level- I would be real worried about the mercury content if it
was wild caught- The location to having it available and not going 45
mins away to find it- Me being a fisherman and catching my own fish rather
than buying it from a store- Fish allergy- It has to be not farmed- Packing- Environmental impact of the fish farming- How they were raised and what they look like- There are no salmon or fish raised in Minnesota.
There’s certain types of salmon on the borders of Minnesota but they're not raised in a farm.
- The quality- Turned off by phrase ‘organic’- Freshness- None- Traveling distance- Availability and awareness- The fact that wild caught fish are more sustainable- Fish allergy- Vegetarian.
Food Fish Consumer Survey Findings 38
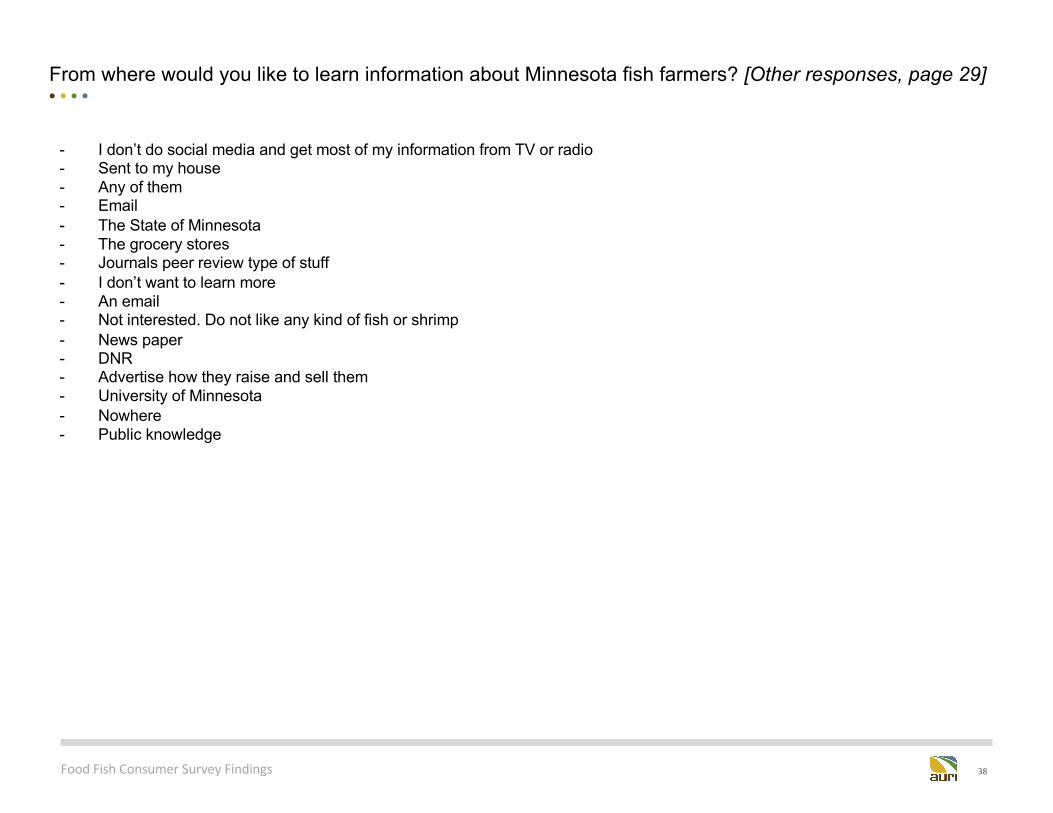
From where would you like to learn information about Minnesota fish farmers? [Other responses, page 29]• • • •
- I don’t do social media and get most of my information from TV or radio- Sent to my house- Any of them- Email- The State of Minnesota- The grocery stores- Journals peer review type of stuff- I don’t want to learn more- An email- Not interested. Do not like any kind of fish or shrimp- News paper- DNR- Advertise how they raise and sell them- University of Minnesota- Nowhere- Public knowledge

Food Fish Consumer Survey Findings 39