food, income, and health
TRANSCRIPT

Class and Social Gradient: Income, Food, and Health
Adam Sheingate, KSAS
Lindsay Thompson, CBS
Sara Bleich, BSPH

Sources: www.cdc.gov/obesity/data/trends.html#County www.ers.usda.gov/publications/ap/ap036 labs.slate.com/articles/food-deserts-in-america
Counties in the top and bottom two quintiles for both diabetes and obesity
Low Income Areas of the United States
40% Below 200 FPL
Income, Health, and Food Access in the United States

Income and Food Access in Baltimore
Source: http://foodsystemmap.cgis.us/
“Six Miles – 20 Years”

0
5
10
15
20
25
30
35
40
Less than $15,000
$15,000- 24,999
$25,000- 34,999
$35,000- 49,999
$50,000+
Perc
ent
Obesity and Food Insecurity by Household Income
Obese
Food Insecure
Source: Behavioral Risk Factor Surveillance System and Current Population Survey

Political Participation by Income Quintile
0.0
0.1
0.2
0.3
0.4
0.5
0.6
0.7
0.8
0.9
Voted in primary
Attended meeting
Gave Money Voted '08
lowest
second
third
fourth
fifth
Source: 2008 National Election Study
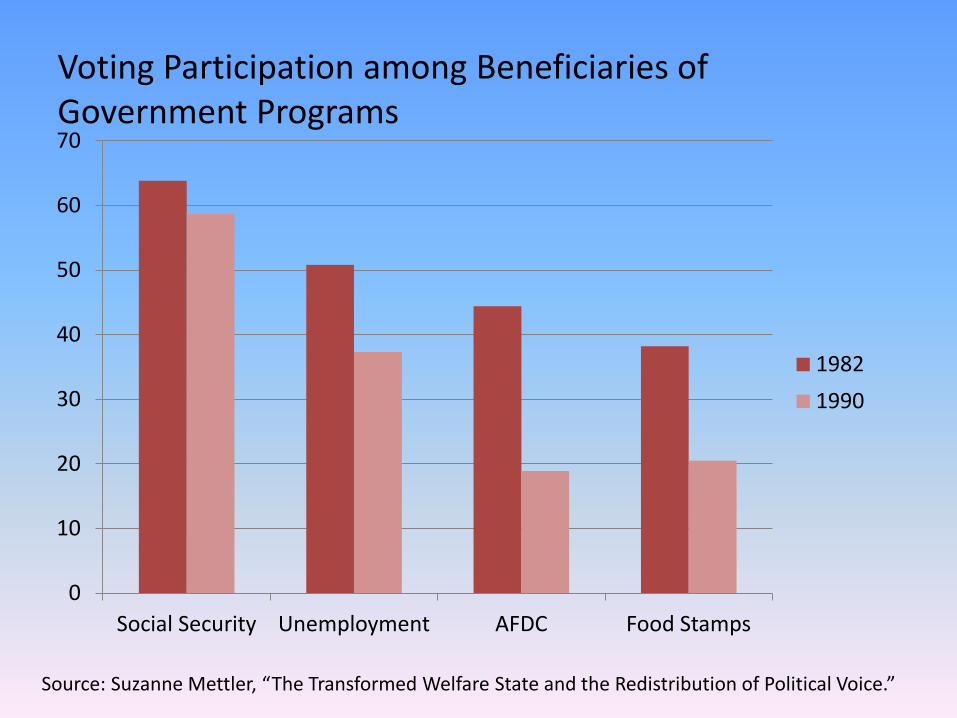
Voting Participation among Beneficiaries of Government Programs
0
10
20
30
40
50
60
70
Social Security Unemployment AFDC Food Stamps
1982
1990
Source: Suzanne Mettler, “The Transformed Welfare State and the Redistribution of Political Voice.”

Jo
hn
s H
op
kin
s C
ar
ey
Bu
sin
es
s S
ch
oo
l
Jo
hn
s H
op
kin
s C
ar
ey
Bu
sin
es
s S
ch
oo
l
Lindsay Thompson, Ph.D.
Carey Business School

Jo
hn
s H
op
kin
s C
ar
ey
Bu
sin
es
s S
ch
oo
l

Jo
hn
s H
op
kin
s C
ar
ey
Bu
sin
es
s S
ch
oo
l
THE
LIVA
BLE
CITY
MAT
RIX Human
Capabilities Sustainability
Social Environmental Economic
Som
atic
• Life • Bodily Health • Bodily Integrity • Sense
Noe
tic
• Senses • Imagination • Thought • Emotions • Practical Reason
Rela
tion
al
• Affiliation • Other Species
Age
ncy
• Play
Jo
hn
s H
op
kin
s C
ar
ey
Bu
sin
es
s S
ch
oo
l
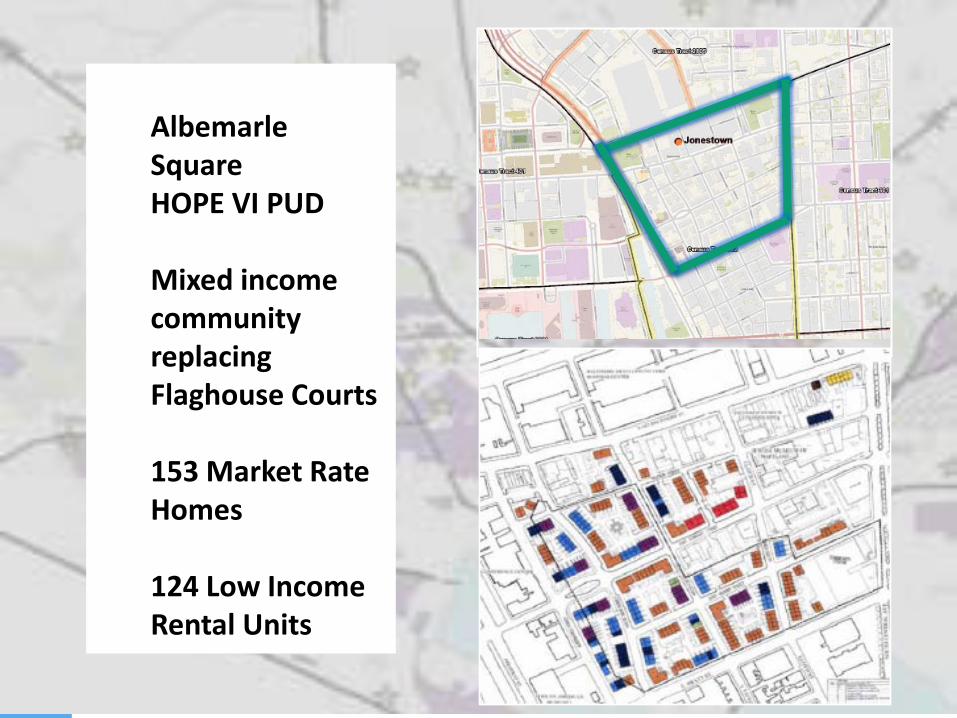
Albemarle Square HOPE VI PUD Mixed income community replacing Flaghouse Courts 153 Market Rate Homes 124 Low Income Rental Units

Jo
hn
s H
op
kin
s C
ar
ey
Bu
sin
es
s S
ch
oo
l
EXETER GARDENS
Re-growing ethnic food cultures in historic Jonestown Village

Jo
hn
s H
op
kin
s C
ar
ey
Bu
sin
es
s S
ch
oo
l

Jo
hn
s H
op
kin
s C
ar
ey
Bu
sin
es
s S
ch
oo
l
Jonestown Village challenges and assets
Challenges • 40+% Section VIII renters,
transients • High proportion of poor,
elderly, very young • 50+ vacant, abandoned,
derelict properties • Minimal green space and
tree canopy • Severe rat infestation • Negligent, indifferent
property management
Assets • Nucleus of community
leaders • Low crime / violence • Influx of engaged, affluent
homeowners • Proximity to high value
neighborhoods, employment, anchor institutions
• Affordable, convenient public transit

Jo
hn
s H
op
kin
s C
ar
ey
Bu
sin
es
s S
ch
oo
l Exeter Gardens includes all WHO
intervention strategies to influence social determinants of health
• Improve daily living conditions
• Tackle the inequitable distribution of power, money, and resources
• Measure and understand the problem to assess the impact of action
WHO Commission on Social Determinants of Health Report (2008)

© 2008, Johns Hopkins University. All rights reserved.
Sara Bleich, Ph.D. Health Policy and Management, Bloomberg School of Public Health

© 2008, Johns Hopkins University. All rights reserved.
Why do we care about the food environment • Physical and financial access greatly shapes
our choices and obesity risk • Local food environments differ considerably by
the racial and economic composition of a community
• Differences in the food environment may contribute to inequities in obesity risk and risk from obesity-related conditions
• Indirect costs (money and time) of preparing healthy foods are additional barriers to good nutrition for low-income groups

© 2008, Johns Hopkins University. All rights reserved.
All food environments are not equal

© 2008, Johns Hopkins University. All rights reserved.
National data may not be ideal for understanding disparities in obesity National data show a persistent racial
disparity in obesity among women National data do not account for race
differences in health risks resulting from racial segregation → different environmental exposures
National data do not account for the correlation between race and socioeconomic status → minorities more likely to be poor

© 2008, Johns Hopkins University. All rights reserved.
Exploring Health Disparities in Integrated Communities (EHDIC) EHDIC is a multi-site study designed to
assess the nature of health disparities where African Americans and Whites live under similar and environmental conditions
Nation-wide assessment of census tracts 35% African Americans AND 35% white b/w median income ratio 0.85-1.15 b/w percent high school grad 0.85-1.15
Of 66438, 425 census tracts met the criteria
© 2008, Johns Hopkins University. All rights reserved.
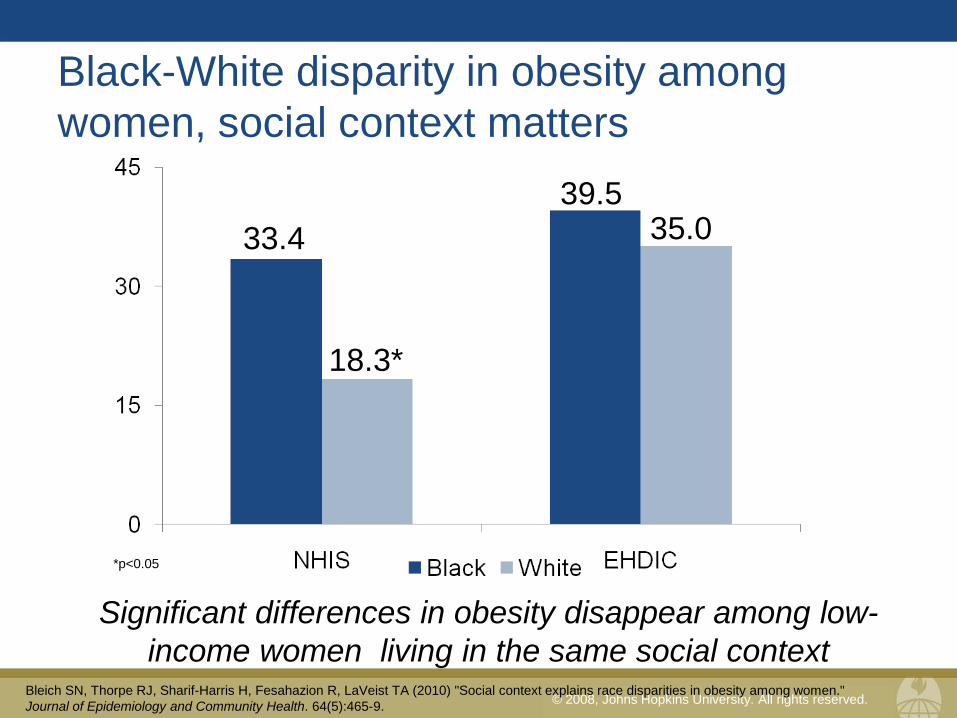
Black-White disparity in obesity among women, social context matters
Significant differences in obesity disappear among low-income women living in the same social context
18.3*
33.4 35.0 39.5
*p<0.05
Bleich SN, Thorpe RJ, Sharif-Harris H, Fesahazion R, LaVeist TA (2010) "Social context explains race disparities in obesity among women." Journal of Epidemiology and Community Health. 64(5):465-9.

© 2008, Johns Hopkins University. All rights reserved.
Important caveat In the EHDIC data, race disparities among
black and white women were eliminated because of higher prevalence of obesity among white women as a result of challenging social conditions
Policies are needed that will help obesity decline among both white and black women

© 2008, Johns Hopkins University. All rights reserved.
Who does the public blame for obesity?
Public Attitudes on Responsibility for Obesity (in percent) Great deal Good
amount Just some Hardly any
Individual Americans in their choice of diet and lack of exercise
67 20 7 4
Fast-food restaurants 43 21 19 13 Schools that allow high-calorie snacks
and sweets 40 24 20 12
Manufacturers of high-calorie packaged and processed foods
36 25 22 12
Marketers and advertisers of high-calorie packaged and processed foods
35 25 24 12
Government policies and laws on food content and marketing
20 21 28 24
Note: "Don't know" responses not shown. Sources: ABC News/Time Poll (Storrs, Conn.: Roper Center for Public Opinion Research, May 10-16, 2004). Questions: Whatever the causes of obesity, I'd like to ask you about groups that may or may not be responsible for creating the problem. For each, please tell me if you think it bears a great deal of responsibility for the nation's obesity problem, a good amount, just some or hardly any.
Bleich SN, Blendon RJ, "Public opinion and obesity," in Robert J. Blendon, Drew E. Altman, Mollyann Brodie, and John M. Benson eds., American Public Opinion and Health Care Policy (Washington: CQ Press, September 2010), Chapter 17.

© 2008, Johns Hopkins University. All rights reserved.
How to move the agenda forward • Improve public awareness of the food
environment
• Identify ways to reducing disparities by eliminating challenging social conditions
• Develop synergies between public health and industry, government and communities
• Appropriately align incentives to “nudge” people in the right direction and encourage community investment in increased access to healthy foods