food policy and applied nutrition program · 67 bb. commercial preferences 67 b. water iodination...
TRANSCRIPT

The Gerald J. and Dorothy R. Friedman School of Nutrition Science and PolicyFOOD POLICY AND APPLIED NUTRITION PROGRAM
DISCUSSION PAPER NO. 23
Indonesian Micronutrient Reference ReportA Report to the Micronutrient Initiative and the World Bank
Soekirman, Atmarita, Jennifer Lynn Olsen,Sanjaya, Nada Elhusseiny, F. James Levinson
March 2003
Discussion papers provide a means for researchers, students and professionals to sharethoughts and findings on a wide range of topics relating to food, hunger, agricultureand nutrition. They contain preliminary material and are circulated prior to a formalpeer review in order to stimulate discussion and critical comment. Some workingpapers will eventually be published and their content may be revised based onfeedback received.
The views presented in these papers do not represent official views of the School.The discussion paper series is available online athttp://nutrition.tufts.edu/publications/fpan/. Please submit drafts for consideration asFPAN Discussion Papers to [email protected].

Indonesian Micronutrient Reference Report
1
Contents
Page 3 Introduction
4 Indicators for Indonesia
4 1. General Indicators for Indonesia5 2. Health and Nutrition Indicators
8 Vitamin A
8 A. Vitamin A Deficiencies in Vulnerable Groups9 B. Interventions Addressing Vitamin A Deficiencies9 1. Vitamin A Capsule Coverage11 2. Vitamin A Fortification11 a. Vitamin A Fortified Complementary Foods12 b. Vitamin A Fortification of MSG14 c. Vitamin A Fortification of Sugar14 d. Vitamin A Fortification of Noodles15 3. Food Based Interventions
17 Iron
17 A. Iron Deficiency in Vulnerable Groups26 B. Interventions Addressing Iron Deficiency26 1. Iron Supplementation Coverage of Vulnerable Groups28 a. Constraints and Opportunities Relating to Iron Supplementation for Children
32 b. Constraints and Opportunities Relating to Iron Supplementation for Adolescents35 c. Constraints and Opportunities Relating to Iron Supplementation for Women45 d. Potential for Commercialization of Iron Supplements45 2. Iron Fortification45 a. Iron Fortified Noodles48 b. Iron Fortified MSG48 c. Iron Fortified Candy50 d. Iron Fortified Soy Sauce and Wheat Flour50 e. Iron Fortified Bread52 3. Dietary Strategies to Increase Iron Intake54 4. Other Food Based Interventions
54 Iodine
55 A. Iodine Deficiency among Vulnerable Groups59 B. Interventions addressing Iodine Deficiency

Indonesian Micronutrient Reference Report
2
59 1. Iodine Supplementation62 2. Iodine Fortification62 a. Salt Iodination Coverage and Adequacy65 aa. Retention of Iodine in Storage and Cooking67 bb. Commercial Preferences67 b. Water Iodination68 c. Chips Fortification68 3. Iodine From Foods
70 Other Micronutrients
70 A. Zinc Deficiency in Vulnerable Persons70 B. Thiamine Deficiency in Vulnerable Persons
72 Effects of Economic Crisis on Micronutrient Status
74 Costs of Micronutrient Interventions
74 1. Cost per Beneficiary per Year of Selected Micronutrient and Other Nutrition Interventions:74 2. Cost Per Beneficiary Per Year of Food Fortificant to Meet One Third of RDA.
76 Appendix Tables and FiguresTables:
76 1. Selected Educational Indicators76 2. Accessibility to Mass-Media76 3. Selected Health Care Indicators77 4. Average Daily Per capita Calorie Consumption77 5. Prevalence of Anemia in Pregnant Women77 6. Prevalence of Anemia in Preschool Children78 7. Prevalence of Anemia in Pregnant Women by Area78 8. Iron Supplementation Coverage in Selected Districts79 9. Characteristics Associated with Iron Supplement Consumption During
Pregnancy80 10. Prices for Selected Foods, January 1997 to October 199881 11. Distribution and Capacity of Salt Producers by Region
Figures:82 1. Effect of Economic Crisis on Consumption Patterns of Eggs, Oil and Dark Green Leafy Vegetables83 2. Goals for the Reduction of Iron Deficiency in Indonesia
84 Works Cited

Indonesian Micronutrient Reference Report
3
Introduction
This report has been designed as a user-friendly reference source for the Government ofIndonesia and for organizations and individuals involved in activities designed to reducemicronutrient deficiencies in the country. Indonesia has been home to majormicronutrient research and programmatic activity going back to the 1980s. Indonesianand international nutrition experts have devoted major attention to an examination ofmicronutrient deficiencies and to the design of interventions addressing them. Indeedmicronutrient research and programmatic activity in Indonesia have had adisproportionate influence on micronutrient decision making worldwide.
The plethora of Indonesian micronutrient studies and reports can at times beoverwhelming. Accordingly an effort was made recently in Indonesia to summarize suchstudies and reports of the past decade into a comprehensive document. This present reportseeks to take that document a step further for nutrition practitioners by deleting thosestudies with less programmatic relevance, adding others with more relevance, andorganizing the material tightly not simply by micronutrient but by intervention category.The report also provides capsule summaries at the end of each section as well as on thespecific deficiencies in bold italics.
Additionally the report provides useful figures on a set of general indicators for Indonesiaplus broad health and nutrition indicators, a summary of existing cost data, andinformation on the effects of the economic crisis on micronutrient intakes anddeficiencies. Appendix tables, referenced in relevant sections of the text, are added at theend of the report.
The result is an easy access reference report providing both overviews and more detailedinformation where desired.

Indonesian Micronutrient Reference Report
4
Indicators for Indonesia
1. General Indicators for Indonesia Findings
1. Statistical Data for Indonesia. UNICEFhttp://www.unicef.org/statis/Country_1Page78.html
Total population (2000):212,092,000
Population under 5:21,782,000
Population under 18:78,233,000
Annual number of births(2000): 4,497,000
GNI per Capita (2000):570 (USD)
Adult Literacy rate(2000): - Male: 92%
- Female: 82%
Percent of population withaccess to safe water:
- Total: 79- Urban: 90- Rural: 69
Percent of population withaccess to adequatesanitation:
- total: 55- Urban: 69
- Rural: 462. BPS Statistics Indonesia (Badan Pusat Statistik-
Indonesia)http://www2.bps.go.id/index.shtml
Percentage of populationaged 10 years and overwho:
- listen to radio(2000) 43.72%
- watch television(2000) 87.97%
See Appendix Table 2for annual figures.

Indonesian Micronutrient Reference Report
5
2. Health and Nutrition Indicators Findings
1. Statistical Data for Indonesia. UNICEFhttp://www.unicef.org/statis/Country_1Page78.html
Infant mortality rate per1000 live births (2000): 35
Under 5 mortality rate per1000 live births (2000):48
Maternal Mortality Ratio(1985-1999): 380 (per100,000 live births)
Total Fertility Rate(2000): 2.5
Percent of infants withlow birth weight (1995-2000): 9%
Percent of children whoare exclusively breastfed(0-3 months) (1995-2000):52%
Percent of infantsbreastfed withcomplimentary food (6-9months) (1995-2000):81%
Percent of children stillbreastfeeding at 20-23months: 65%
Percent underweight inunder- fives (1995-2000): - moderate and severe:26% - severe: 8%
Percent under-fives (1995-2000): - severe andmoderate stunting:4
Percent of immunized 1-year old children (1999):

Indonesian Micronutrient Reference Report
6
- TB: 85 - DPT: 72 - Polio: 83 - Measles: 71
2. Nutrient intakes of school children in Bogor district.(1994). Sukati, Saidin, and Muhilal
1. The sample consistedof school children in grade4, 5, and 6 between 9-14years old.2. Intake of energy,vitamin C, protein, andiron were 73.5%, 84.0%,63.0% and 50.8%respectively.
3. BPS Statistics Indonesia (Badan Pusat Statistik-Indonesia)http://www2.bps.go.id/index.shtml
Percent of well-nourishedwomen of child bearingage (1995) - Urban: 78.98 - Rural: 74.21
- Urban and Rural: 76.04
Percentage of well-nourished children underfive (1992): 55.53%
Percentage of well-nourished children underfive (1995): - Female: 66.7 - Male: 61.0
- Female and Male: 63.86
Percentage of birthdeliveries assisted bydoctor/ midwife/ otherparamedic (2000): 63.50See Appendix table 3 forannual figures.
5. % children immunized(1999): 89.91See Appendix Table 3for annual figures
6. Months ofbreastfeeding for childrenaged 2-4 years:

Indonesian Micronutrient Reference Report
7
aged 2-4 years:- without
supplementaryfoods (2000): 3.76
- withsupplementaryfoods (2000):17.64%

Indonesian Micronutrient Reference Report
8
Vitamin A:
A. Vitamin A Deficiency Among Vulnerable Groups
Vitamin A Deficiencies AmongVulnerable Groups: (Study/ Survey Year and Author Purpose)
Findings
1. To investigate the extent of coexistence ofdeficiencies of vitamin A, iron and zinc, and also thenutritional relationship between lactating mothersand their infants. (2001). Dijkhuizen M.A. et. al.
1. In a cross-sectionalsurvey in West Java, 155lactating mothers and theirhealth infants were assessedanthropometrically, andblood, urine and breast milksamples were collected.2. Marginal VAD wasfound in 54% of the infantsand 18% of the mothers.3. VAD in infants led to anincreased risk for anemiaand zinc deficiency (oddsratios: 2.5 and 2.9,respectively), whereas inmothers the risk for anemiaand iron deficiency (oddsratios: 3.8 and 4.8,respectively) increased.
2. To assess current prevalence of xerophthalmia infour eastern provinces of Indonesia based on ocularsign and the magnitude of VAD based on marginalstatus of vitamin A (serum vitamin A level.) (1991)Muhilal, et al.
1.Survey was conducted inMaluku, Papua, East NusaTenggara and former EastTimor provinces covering21,00 children 0-60 monthsold.2.The prevalence of Bitot’sspots (X1B) in the fourprovinces was below 0.5%.The case of X2X3, a severeform of xeropthalmia, wasfound only in East Timor(0.14%). VAD isconsidered a health problemin East Timor, (cut off pointis 0.5% for X1B and 0.01%for X2X3.)

Indonesian Micronutrient Reference Report
9
These studies indicate that Marginal VAD has been found in 54% of theinfants and 18% of mothers. Severe Xeropthalmia (0.14% of children 0-60 months) was found only in the former East Timor.
B: Interventions Addressing Vitamin A Deficiency
1. Vitamin A Capsule Coverage(Study/ Survey Year and Author Purpose) Findings
1. To Review the effectiveness of Indonesia’s nutritionstrategy through Posyandu revitalization. (2002).Latief, D. et al.
1. Efforts to revitalize thePosyandu includedexpanding the target age forvitamin A capsuledistribution to includeinfants 6-12 months of age.Results of Hadju’s studyrevealed that coverage ofvitamin A supplementationfor infants doubled betweenthe February and Augustrounds, but remains low,indicating an urgent needfor efforts to increasecoverage.
2. Increasing coverage of high-dose vitamin A capsulesto prevent crisis-induced re-emergence of vitamin Adeficiency. (1999). HKI
1. In children, aged 12-59months, the coverage ofvitamin A capsules inAugust 1998/ February 1999was 39% (Jakarta), 40%(Lombok), Ujungpandang(56%) and 64-81% in mostareas.2. The coverage for post-partum women (within 30days of delivery) rangesfrom 15-25% in most urbanand rural areas, to 35-45%in Central Java andSemarang.
3. To improve coverage of vitamin A capsules anddeworming tablets for women after giving birth, andincrease vitamin A intake of children, pregnant andlactating mothers. (1997). HKI
1. Coverage of vitamin Acapsule distributionincreased from 9.7% twoyears before the campaignto 18.8% after thecampaign.

Indonesian Micronutrient Reference Report
10
4. To review the current status of VAD. (2002) Latief,D. et. al.
1.Vitamin A capsulesupplementation coveragerates among children <5years old were low,especially in the urban areas(<40%).2. A multi-agency teamcomposed of the IndonesianMinistry of Health, HKI, thenational pharmaceuticalindustry, UNICEF,international donors andother organizations isworking to support vitaminA program activities.3. The strategies includespecial IEC activities for thenationwide vitamin Acampaign months (Februaryand August), an emphasison the new target group(children 6-11 mo old),integrating vitamin Asupplementation intonational immunization days,and an analysis of the newlydecentralized vitamin Acapsule procurement,distribution, and monitoringand evaluation system.
5. UNICEF. The state of the world’s children 2002http://www.unicef.org
Vitamin A supplementation(6-59 months) (1999): 64%
These surveys/ studies indicate that without an intensified campaign,coverage of Vitamin A Capsule programs for postpartum women rangesfrom 9.7%, to 35-45% in Central Java and Semarang. In most urban andrural areas coverage for postpartum women was found to be 15-25%.Vitamin A capsule coverage for children under five has been reported tobe from “less than 40%” to 81%. In children, aged 12-59 months, thecoverage of vitamin A capsules from August 1998 to February 1999 was39% (Jakarta), 40% (Lombok), Ujungpandang (56%).

Indonesian Micronutrient Reference Report
11
2. Fortification
a. Vitamin A Fortified ComplementaryFood (Study/ Survey Year and Author Purpose)
Findings:
1. To collect baseline information characterizingPosyandu and to provide insights to steer theirrevitalization. (2002) Hadju, V. et al.
1. In 1999, data werecollected from 327 Posyanduand 2,866 households from120 villages in 30 sub-districts.2. Cadre’s and mother’sknowledge aboutcomplementary feeding wasinferior compared withbreastfeeding: mothers needto be counseled about thetimely introduction between6 to 12 months of age, oflocal, affordable andacceptable sources ofmicronutrients, particularlyfrom animal sources.3. Industrially-producedfortified complementary foodis well-liked and feasible todistribute through Posyandu,adding to the potentialeffectiveness of Posyandu.
2. To Review the effectiveness of Indonesia’s nutritionstrategy through Posyandu revitalization. (2002).Latief, D. et. al.
Several measures were takento revitalize Posyanduincluding; providing fortifiedcomplementary food tochildren 6-24 months of agein addition to promotingbreastfeeding and optimizingthe use of local foods.
Distributing vitamin A fortified complementary food through the posyandusystem adds effectiveness to the Posyandu as these foods are well-liked andfeasible to distribute. At the same time, there is inadequate understandingamong mothers about the timely introduction of such foods.

Indonesian Micronutrient Reference Report
12
b. Vitamin A Fortification of MSG (Study/ Survey Year and Author Purpose) Findings:
1. To determine the accurate dose of vitamin A to beadded to mono-sodium-glutamate (MSG). (1990).Saidin, M. et al.
1. The mean of MSGconsumption in children underfive years old was 0.26 g/day,meaning that fortified MSGwould provide these childrenwith 225 RE vitamin A/day2. The mean MSGconsumption in pregnant andlactating mothers was .42g/day and .46 g/dayrespectively, meaning thatfortified MSG would providethese mothers with 400 REvitamin A/day3. The mean MSGconsumption in 67 babies (3-12 months) was 1.14 g/day,meaning that fortified MSGwould provide these infantswith 126 RE vitamin A /day.
2. To examine fortification of MSG with vitamin A.Permeisih, D, et al.
1. A controlled trial ofcommercially marketedmonosodium glutamate(MSG) fortified with vitaminA showed improved serumvitamin A levels in youngchildren and higher vitamin Acontent of breast milk oflactating women.2. During the course of thestudy, the prevalence of Bitot'sspots among children inprogram villages fellprogressively from 1.2% atbase line to 0.2% 11 mo afterintroduction of the fortifiedproduct (p less than 0.001);xerophthalmia rates in controlvillages remained essentiallyunchanged.3. Hemoglobin levels amongprogram children rose byapproximately 10 g, from 113+/- 16 g/L at base line to 123+/- 16 by 5 mo (p less than0.001); they remainedessentially unchanged amongchildren of control villages.Linear growth was alsogreater among programchildren.

Indonesian Micronutrient Reference Report
13
0.001); they remainedessentially unchanged amongchildren of control villages.Linear growth was alsogreater among programchildren.4. Preschool children incontrol villages died at 1.8times the rate of children inprogram villages.
3. To look at the effects of fortification of crystallinemonosodium glutamate (MSG) with vitamin AMuhilial, et al. 1988.
1. A controlled trial tested thefortification of MSG with 810RE vitamin A/g in an area ofendemic vitamin A deficiencyin Indonesia.2.Fortified MSG wasmarketed through ordinarychannels in 5 villages in theprogram area; 5 nearbyvillages served as the controlarea.3.The product retained 84% ofits potency after 4 mo and57% after 11 mo in themarketplace.4. Follow-up serum levelsincreased dramatically in theprogram villages, 0.67 +/-0.33 at pre-fortification baseline to 0.92 +/- 0.33 mumol/ L(p<.001) at 11 mo afterproduct introduction.5.Breast-milk levels also rose,from 0.60 +/- 0.29 at base lineto 0.67 to +/- -.30 mumol/L at11 mo (p<.05) Serum andbreast milk levels, which wereslightly higher in the controlareas pre-fortification, did notchange.
Fortification of monosodium glutamate (MSG) with vitamin A resulted inimproved serum vitamin A levels, reduced prevalence of Bitot’s spots, andhigher vitamin A content of breast milk of lactating women. MSG

Indonesian Micronutrient Reference Report
14
fortified with Vitamin A has been shown to retain 84% of its potency after4 months and 57% after 11 months in the marketplace.
c. Vitamin A Fortification of Sugar (Study/ Survey Year and Author Purpose) Findings:
1. To study refined sugar consumption nationwide as aprospective vehicle for vitamin A fortification. (2002)Amalia L, Hardinsyah.
1. Using data from theNational SocioeconomicSurveys in 1993, 1996, and1999; the study showed thatrefined sugar was aprospective vehicle forvitamin A fortification.2. Per capita sugarconsumption in 1993, 1996,1999 was 22.4, 24.2 and22.6 grams/cap/day.3. 1999 data showed thatthere was no significantdifference in the proportionof households consumingsugar in urban (93.6%) andrural (91.3%) areas.4. Average consumption ofsugar in urban and ruralareas was 23.7 and 21.9grams/cap/day respectively.5. Sugar consumption ofpoor households (lowest 40percentile) was 15.5g/cap/day) or about twothirds of average.
The consumption pattern of refined sugar indicates that it is a potentialvehicle for vitamin A fortification. Per capita sugar consumption in 1999was about 22.6 grams/cap/day, with approximately the same percentage ofurban and rural households consuming sugar, 93.6% and 91.3%respectively. Sugar consumption of poor households (lowest 40 percentile)is about two thirds of the average.
d. Vitamin A Fortification of Noodles (Study/ Survey Year and Author Purpose) Findings
1. To study the impact of vitamin A and ironfortification in noodles on vitamin A and iron statusin children under five years old. (1995). Sukati, et al.
1. Quasi experimental studywas done in 199 children 1-4 years old divided intointervention and controlgroups.

Indonesian Micronutrient Reference Report
15
fortification in noodles on vitamin A and iron statusin children under five years old. (1995). Sukati, et al.
was done in 199 children 1-4 years old divided intointervention and controlgroups.2. Intervention groupreceived fortified noodlescontaining 10 mg iron and2,500 IU vitamin A per 100gm, while control groupreceived non-fortifiednoodles containing 3 mgiron and 1,500 IU vitamin Aper 100 gm for 14 weeks.3.Consumption of noodleswas 30 grams per day with750 IU vitamin A and 3 mgiron in the interventiongroup, 450 IU vitamin Aand 0.9 mg iron in thecontrol group.4. There was a significant(p<0.05) increase of vitaminA status in the interventiongroup compared to thecontrol group.5. Children with lowvitamin A status decreasedfrom 44.9% to 22.1% in theintervention group and from43.1% to 34.8% in thecontrol group.
These studies show that consumption of vitamin A fortified noodlesresulted in significantly increased vitamin A status in children aged 1-4compared to a control group (p<0.05). Consumption of 30 grams ofnoodles/ day containing 10 mg iron and 2,500 IU vitamin A per 100 gm,resulted in the a 49.2% decrease in the percentage of children who hadlow vitamin A status as compared to a 19.3% decrease in the controlgroup.
3. Food Based Interventions
Food Based Interventions Relating toVAD

Indonesian Micronutrient Reference Report
16
VAD
(Study/ Survey Year and Author Purpose)
Findings
1. To improve coverage of vitamin A capsules anddeworming tablets for women after giving birth,increase vitamin A intake of children, pregnant andlactating mothers. (1997). HKI
1. Vitamin A intake fromanimal foods was 8 timeshigher than from non-animal foods.2. People with homegardens had higher intake ofvegetables and fruits.3. Social marketing ofvitamin A increasedconsumption of eggs inmothers and children.
Garden ownership increases vegetable and fruit consumption, but vitaminA intake from foods is primarily from animal sources. Vitamin A intakefrom animal foods has been shown to be 8 times higher than from non-animal foods. Social marketing has been found effective in increasingconsumption of eggs by mothers and children.

Indonesian Micronutrient Reference Report
17
Iron:
A. Iron Deficiency Among Vulnerable Groups
Iron Deficiency Among VulnerableGroups (Study/ Survey Year and Author Purpose)
Findings
1. To investigate the extent of coexistence ofdeficiencies of vitamin A, iron and zinc, and alsothe nutritional relationship between lactatingmothers and their infants. (2001). Dijkhuizen M.A.et. al.
1. In a cross-sectional surveyin West Java, 155 lactatingmothers and their healthinfants were assessedanthropometrically, andblood, urine and breast milksamples were collected.2. More than 50% of mothersand infants were anemic.
2. To review the magnitude of IDA and programs tocontrol it. (2002). Sunarko.
1. The prevalence of IDA inthe population as a whole isaround 40-58% (SKRT 1995,NHS-HKI 2001.)2. In 1992 the prevalenceamong pregnant women andchildren below five was63.5% and 55.5%respectively.3. In 1995 the prevalenceamong pregnant women,children below five, womenof reproductive age (15-44yrs.), and adolescent girlswas 50.9%, 40.5%, 39.5%,and 57.1% respectively.4. Targets to be achieved in2010: the prevalence amongpregnant women/ womengiving birth 35%, childrenunder five 30%, femaleworkers 20%, and adolescentgirls 40%.5. Strategies to achieve thesetargets in the short-, medium,and long-term are (a) ironsupplementation, (b) controlof diseases associated withanemia, (c) dietarymodification- diversification,(d) food fortification, (e)CIE/ social marketing innutrition and health, (f)improving food intake highin iron content.

Indonesian Micronutrient Reference Report
18
modification- diversification,(d) food fortification, (e)CIE/ social marketing innutrition and health, (f)improving food intake highin iron content.
3. The Prevalence and risk factors of anemia.To study the prevalence and risk factors for IDA.(2001). Atiek W. and Endy Paryanto P.
1. The prevalence of IDAduring the first trimester was67.7%, compared to 49.7% inthe 28th week of gestation;therefore there was an 18.0%decrease in prevalence ofanemia during the lasttrimester.2. The significant riskfactors related to anemiaduring the 28th week ofgestation were low maternaleducation level, chronicenergy deficiency, lowweight gain (less than 10 kg)during pregnancy, and lowconsumption of iron tablets(less than 90 tablets.)
4. To document the prevalence of anemia amongyoung children in urban and rural areas.(2000). HKI
1.The study was conducted in8 different cities/ provincesamong children aged 12-23months and non-pregnantwomen.2. The prevalence of IDA inchildren aged 12-23 monthsranged from 65-85%, exceptin Central Java where it wasbetween 50-62%.3. The prevalence of IDA innon-pregnant women rangedfrom 22-47%, compared to20-30% before the crisis in1995.
5. To determine if the decreasing prevalence ofanemia among urban children indicates increasedaccess to micronutrient rich food. (2000). HKI
1. The prevalence of anemiaamong children aged 12-23months in urban slum areashad decreased from 55-85%in January 1999 to 45-70% inJanuary 2000; indicating thatthe nutrition situation isimproving.

Indonesian Micronutrient Reference Report
19
2. The prevalence of anemiain non-pregnant women was20-30%, similar to the ratebefore the onset of the crisis.
6. To assess the willingness of pregnant women to payfor iron tablets. (2000). Fitrah Ernawati, et. al.
1. An observational cohortstudy was conducted among76 pregnant women living in4 Community Health Centerareas, Bogor. The sampleswere divided into two groups(1) receiving nutritioneducation from midwives and(2) not receiving nutritioneducation.2. The prevalence of anemiain group 1 and 2 was 46.0%and 54.0% respectively.
7. Crisis Bulletin 1: Summary of preliminary dataanalysis and recommendations. (1998). HKI
1. There was an increase ofmaternal anemia in CentralJava from 7-27% before thecrisis (June 1996) to 29-31%during the crisis (June 1998).2. There was an increase ofchildhood anemia in CentralJava from 39-41% before thecrisis (June 1996) to 59-73%during the crisis (June 1998).
8. To study the impact of iron, vitamin A, or vitamin Csupplementation on Hb and ferritin concentrationamong adolescent girls. (1997). M. Saidin danSukati.
1. The prevalence of IDA inhigh school girls was around23.0%-34.7% in Bogor(1991) and around 41.0% inBandung (1996).
9. To improve coverage of vitamin A capsules anddeworming tablets for women after giving birth, andto increase vitamin A intake of children, pregnantand lactating mothers. (1997). HKI
1. Prevalence of anemiaamong children aged 0-5months, 6-11 months, 12-23months, 24-35 months, andnon pregnant women was46.5%, 50.5%, 48.0%,36.4%, and 22.4%respectively.
10. To study the prevalence of iron deficiency (IDA)anemia and nutritional status of people livingnearby a cement factory in Citeureup, Bogordistrict. (1994). Y. Krisdinamurtirin et al.
1. The prevalence of IDA inPuspanegara village was11.3% in adult males; 30.0%in non-pregnant non-lactatingwomen, 50.0% in pregnantmothers, 30.0% in lactatingmothers, 44.0% in schoolchildren, 30.0% in childrenunder five years old.

Indonesian Micronutrient Reference Report
20
mothers, 44.0% in schoolchildren, 30.0% in childrenunder five years old.2. The prevalence of IDA inCitereup village was 9.0% inadult males; 26.0% in non-pregnant non-lactatingwomen, 55.0% in pregnantmothers, 29.0% in lactatingmothers, 57.0% in schoolchildren, 41.0% in childrenunder five years old.3. The prevalence of IDA inTarikolot village was 14.0%in adult males; 14.0% in non-pregnant non-lactatingwomen, 27.0% in pregnantmothers, 28.0% in lactatingmothers, 36.5% in schoolchildren, 32.0% in childrenunder five years old.
11. To study the magnitude of IDA in four easternprovinces of Indonesia. (1991). Ance MurdianaDahro, et al.
1. The study was conductedin Maluku, Papua, East NusaTenggara and former EastTimor provinces covering1,869 preschool children and1,506 pregnant women.2. The prevalence of IDAwas 49% in boys, 48.6% ingirls, and 50.1% in pregnantwomen.3. IDA can be controlled bydistribution of iron tablets/syrup through Posyandu ormaternal and child healthactivities, nutritioneducation, improvedenvironmental sanitation andmalaria control programs.
12. To provide an overview of Studies On IronDeficiency in Indonesia. (1998). Kusin et al. CitingSchultink W, Gross R.
1. Smaller studies haveindicated that the anemiaprevalence among urbanelderly is between 10-20%.(Schultink W, Gross R.)
13. To examine iron deficiency in Indonesia. (1998).Kodyat et al.
1. In 1960, a study among apopulation living in a poorhill area in West-Irianreported very low meanhemoglobin concentrationsamong non-pregant non-lactating women (90 g/L),pregnant women (78 g/L),and children aged 1-2 years(81 g/L). (Jansen et al.)

Indonesian Micronutrient Reference Report
21
reported very low meanhemoglobin concentrationsamong non-pregant non-lactating women (90 g/L),pregnant women (78 g/L),and children aged 1-2 years(81 g/L). (Jansen et al.)2. In 1975-76, surveys ineast-Java found meanconcentrations among non-pregnant non-lactating,lactating, and pregnantwomen of 124-132, 121-131,and 110-118 g/L,respectively (Kusin, et al.).3. The nationwide householdsurvey of 1992 found that63.5% of pregnant womenand 55.5% of underfivessuffered from anemia (18).4. The 1995 householdsurvey found that 50.9% ofpregnant women and 40.5%of underfives were anemic.Approximately 30% offemale workers and 24-35%of school children wereanemic. (Department ofHealth, Republic ofIndonesia 1995).5. From the above figures itwas estimated that in 1998,as many as 50-70 million ofthe 200 million Indonesianssuffer from IDA.6. The target for the end ofthe second Long TermDevelopment Plan (PJP II,1993-2018) is that theprevalence of anemia bereduced to 9% in pregnantwomen and to 10% in bothunderfives as well as femaleworkers. See Appendix Figure 2 forlong term goals.
14. To examine iron deficiency in Indonesia. (1998).Kodyat et al. 1998. Citing Angeles-Agdeppa I, et al(1997) and Soekarjo D, et al. (1998)
1.Studies among femaleadolescents in schools inJakarta, Surabaya, andMandura showed theprevalence of IDA amongfemale adolescents to beapproximately 15-30%.(Angeles-Agdeppa et al and

Indonesian Micronutrient Reference Report
22
Kodyat et al. 1998. Citing Angeles-Agdeppa I, et al(1997) and Soekarjo D, et al. (1998)
adolescents in schools inJakarta, Surabaya, andMandura showed theprevalence of IDA amongfemale adolescents to beapproximately 15-30%.(Angeles-Agdeppa et al andSoekarjo D, et al.)2. Improving the iron statusof adolescents would be agood start toward decreasinganemia during pregnancy, asmany women are enteringpregnancy deficient in iron.3. Female Adolescents aged12-15 could be reachedthrough schools as theIndonesian governmentintroduced 9 years ofcompulsory educationcovering students 6-15 yearsof age.
15. Review of Surveys and Supplementation Studies ofAnemia in Indonesia. Sumarno, Muhilal, et al.(1996). Citing Nutrition Research and DevelopmentCentre and Directorate of Community Nutrition(1991, 1996), Institute for Health Research andDevelopment and Central Bureau of Statistics(1996), Martoatmodjo S, et al. (1973).
1. A review of studies of theprevalence of anemia inpregnant women in variousparts of the country showedthat the prevalence rangedfrom 38.0% and 71.5%, withthe average prevalence for allof Indonesia being about63.5%2. Java, the most developedpart of Indonesia, is amongthe areas with the highestprevalence 57.8% to 71.5%.Irian Jaya, one of the leastdeveloped areas, has thelowest prevalence (38%)3.The prevalence of anemiain pre-school children inIndonesia is between 35.8%and 60.6%, depending on thearea. The lowest prevalencein preschool children is inIrian Jaya (35.8%). Incentral Java the prevalence inschool children (44.9%) isamong the lowest, whereasthat in pregnant women(62.5%) is among thehighest.

Indonesian Micronutrient Reference Report
23
among the lowest, whereasthat in pregnant women(62.5%) is among thehighest.4. See Appendix Table 5for prevalence of anemia inpregnant women and Table6 for prevalence of anemiain pre-school children.
16. World Bank Country (Indonesia) Profile. TheWorld Bank Group.http://devdata.worldbank.org/
1. Prevalence of anemiaamong pregnant women (%)(2000): 64
17. Review of Surveys and Supplementation Studies ofAnemia in Indonesia. (1996).Sumarno, Muhilal, etal.
1. Comparisons of anemiaprevalence in different areaswith different staple foodsshows prevalence to behighest in Indramayu andPurwakarta (West Java)where rice is the staple food(77%). Prevalence was 57%,56% and 46% inBogor(Rice), Bali (Rice andSweet Potato), andYogyakarta (Cassava andRice) respectively.See Appendix Table 7
18. To find the association between anemia and malariainfection and other determinant factors amongschool children 6-10 years in Alor District. (2001)Faraja Paul C (SEAMEO)
1. A cross sectional studywas done with 455 childrenaged 6-10 y from fivedifferent elementary schoolin Abad Sub-District2. Venous blood wascollected to measure anemiastatus (hb<12.0g/dl), as wellas other variables: weightand height, spleen palpation,tuberculin skin test, analysisof malaria parasites, stoolcollection for helminthesanalysis, and interview ondietary intake (semiquantitative FFQ).3. Malaria parasitemia andspleen enlargement werefound to be the predictors ofanemia in this area, withmalaria being the majorcause of anemia amongschool children in AlorDistrict. Other determinantsfactors were not significantlyassociated with anemia.

Indonesian Micronutrient Reference Report
24
cause of anemia amongschool children in AlorDistrict. Other determinantsfactors were not significantlyassociated with anemia.4. 69.4% of cases of anemiain this group were associatedwith malaria (p<0.01) .Spleen enlargement was alsoassociated with anemia(p<0.0001).
19. To investigate the relationship of nutritional statusand work productivity among female workers whoengaged in light activity. (1994). Juliawati.(SEAMEO)
1.A cross-sectional study wasdone with 230 femalecigarette industrial workers.2. Nutritional status wasassessed based on BMI, andHb level. 41.3% of theworkers were undernourished(BMI <18.5 kg/m2), 40.4%were anemic, 13.9% wereundernourished and anemic.3. Female workers who hadBMI<18.5 had 4% lowerwork productivity comparedto female workers who hadBMI >18.5 (p< 0.05).4. Analysis of varianceshowed that anemic workershad significantly lower workproductivity than the non-anemic workers (p<0.01).The anemic workersproduced about 5% lessoutput than non-anemicworkers.
20 To compare the efficacy of daily ironsupplementation and weekly multi-micronutrientsupplementation on increasing iron status. (2001).Maria Wijaya (SEAMEO)
1. A randomized double-blind controlled trial wasdone with 284 healthyIndonesian infants aged 6-12months.2. At base line 51.8% ofsubject anemic, 28.2% wereiron deficient and 11.2%were Zinc deficient.(See Constraints andOpportunities Relating toIron Supplementation forChildren.)

Indonesian Micronutrient Reference Report
25
Children.)21. To investigate the efficacy of combination and
weekly iron supplementation among female factoryworkers. (2000)Titin Hartini (SEAMEO)
1. A community interventionstudy was done with femalefactory workers aged 15-45who were divided into 3groups.2. At baseline the prevalenceof anemia in the groupsranged from 25% to 33%.(See Constraints andOpportunities Related to IronSupplement for Adolescents)
22. To investigate the factors influencing the iron statusof pregnant women taking iron pills. (1999) SriRahayuningsih (SEAMEO)
1. A two phase descriptivestudy was done with 456pregnant women in thesecond trimester who wereparticipating in the nationalanemia control program inthree sub-districts of Bogor.2. The first phase found theprevalence of anemia(Hb<11g/dl) was 57.7%while iron deficiency (serumferritin <12ug ug/l) was38.6%.
In one study 28.2% of infants 6-12 months old were found to be irondeficient. Other studies indicate that the prevalence of iron deficiencyanemia (IDA) in pre-school children ranges from 35.8% in Irian Jaya, to85% in other areas. In one area, 69.4% of anemia cases in schoolchildren were associated with malaria. The prevalence of anemia inadolescent girls ranges from 15% to 57.1%. The prevalence of IDA inhigh school girls ranges from 23.0%-34.7% in Bogor (1991) and wasestimated at 41.0% in Bandung (1996). The percentage of non-pregnantnon-lactating women with IDA ranged from 22% to 39.5%. 50.9% to 64%of pregnant women were reported to be anemic, with the rate 8 percentagepoints lower among women receiving nutrition education from midwivescompared with those who did not. The rates of anemia also varied amongregions (from 77% to 46%) depending on the staple food consumed.The economic crisis which peaked in mid 1998 resulted in sharp increasesin IDA. IDA increased among children, mothers, and non pregnant urbanwomen by 65%, 76% and 36% respectively. There is some evidence thatIDA has returned/is returning to pre-crisis levels.

Indonesian Micronutrient Reference Report
26
B: Interventions Addressing Iron Deficiency
1. Iron Supplementation Coverage forVulnerable Groups (Study/ Survey Year and Author Purpose)
Findings
1. To review the magnitude of IDA and programs tocontrol it. (2002). Sunarko.
1. Coverage of ironsupplement distribution forpregnant women in 1996,97, 98, 99, and 2000 was61%, 60%, 25%, 28%, and61%.
2. To evaluate the distribution system of iron tablets.(1993). Hidayat W.
1.The study was conductedin Timor; the sampleconsisted of healthpersonnel in 3 Puskesmasand village cadres in 9villages.2. The District HealthOffice distributes iron pillsin April and October.3. In March 42.5%-72.7%of iron pills in thePuskesmas were not yetdistributed.4. At the village level, alliron pills were distributed topregnant women.5. Only 38.4% of Fe3 (ironpills distributed for 3months) were distributed.6. There was no specialplace for iron pill storage.7. Training and monitoringwere not effective.8. No other NGOs or keypersons were concernedabout anemia.
3. To examine iron deficiency in Indonesia. (1998).Kodyat et al.
1. Since 1996 the primaryhealth care system hasdelivered iron rich syrup toapproximately 30% ofunderfives in deprived areasin Eastern Indonesia.2. The dose of elementaliron currently recommendedin Indonesia is 15 mg/d for60 days for infants and 30mg/d for 60 days forchildren aged 1-5 years.

Indonesian Micronutrient Reference Report
27
in Indonesia is 15 mg/d for60 days for infants and 30mg/d for 60 days forchildren aged 1-5 years.
4. Review of Surveys and Supplementation Studies ofAnemia in Indonesia. Sumarno, Muhilal, et al.(1996).
1. A review of studies ofiron supplementation invarious areas of Indonesiafound that coverage rangedfrom 30.8% in Muna, to78.6% in Soppeng. Theauthors also note, that,unfortunately, these studiesdo not contain informationon compliance. SeeAppendix Table 8.
5. To collect data on health indicators. (1997)Indonesian Demographic and Health Survey.
Percentages of women whotook specified number ofiron tablets based on theDemographic and HealthSurvey (1997):1.Mothers who were over 35years old at the time of thebirth were the age groupmost likely not to consumeiron tablets duringpregnancy. 24.3% of thesemothers consumed notablets during pregnancy.2. Mothers aged 25-29 werethe group most likely toconsume 90+ iron tabletsduring pregnancy. 28.0% ofthese mothers did so.3. As the number ofprevious births increased,the percentage of womenwho consumed 90+ irontablets decreased. For 1st
pregnancies 28.7%consumed 90+ iron tablets.For those with 6+ previousdeliveries, 15.0% consumed90+ tablets.4. Urban mothers were morelikely to consume irontablets than rural mothers.5. Mothers with noeducation were theeducation level group mostlikely to consume no ironsupplements (37.1%). Bycontrast, only 7.4% ofmothers with somesecondary education did not

Indonesian Micronutrient Reference Report
28
education were theeducation level group mostlikely to consume no ironsupplements (37.1%). Bycontrast, only 7.4% ofmothers with somesecondary education did notconsume any iron tabletsduring pregnancy.6. By place of antenatalcare, those who did notreceive antenatal care weremost likely not to consumetablets (95.3%), followed bythose who received suchcare from a TBA (91.3%).By contrast, 11.1% ofpregnant women receivingante-natal care at healthposts consumed at leastsome iron tablets duringpregnancy.See Appendix Table 9
These surveys/ studies indicate that coverage of iron supplementation forpregnant women ranges from 30.8% to 78.6%. Compliance data, however,indicate that a much smaller number of tablets are actually consumed.Overall only 24.4% of pregnant mothers consumed the number of irontablets recommended. Lowest compliance was found among older andhigher parity women, by those with less education, and by those notreceiving ante natal care or receiving it only from a TBA. Compliance inrural areas is lower than in urban areas. Overall, distribution, trainingand monitoring relating to iron supplementation programs are found to beinadequate.Since 1996, when the primary health care system began delivering ironrich syrup to under-fives in deprived areas, approximately 30% of targetedchildren in Eastern Indonesia received this syrup.
a. Constraints and OpportunitiesRelating to Iron Supplementation forChildren (Study/ Survey Year and Author Purpose)
Findings

Indonesian Micronutrient Reference Report
29
1. To report suggested actions for Iron deficiencycontrol in Indonesia. (1998). Gross, Ranier, PhD
1. Indonesia supports anationwide school feedingprogram in deprivedvillages (IDA) which isorganized and administeredby local authorities and wasprojected to cover 7.2million children in 1997.2. The program iscoordinated by the nationalplanning board(BAPPENAS) and is part ofthe poverty alleviation plan.The children receive threesnacks per week at schooland are dewormed twice peryear (B. Kodyat et al.)3. The authors suggestutilizing the program for thereduction of iron deficiencyby selecting appropriatefoods and integrating ironsupplementation.4. The additional cost ofone weekly supplementwould be Rp 10 (US 4cents) which is 1% of thebudget available for 3snacks per week.
2. To examine supplementation strategies utilized inIndonesia to alleviate iron deficiency. Schultink andD. Dillon. 1998. Citing Palupi, L, et al. (SEAMEO)1997.
1. The involvement ofhealth personnel in irontablet distribution may be alimiting factor in expandingsupplementation programsto other segments of thepopulation.2. Provided compliance ishigh enough, enough tabletsfor a 2-3 month period maybe provided at once totarget groups, so that healthcare provider involvementcan be reduced.3. In a study among 289preschool children in West-Java, mothers wereinstructed to supplementtheir children once per week(Palupi L, et al. 1997)

Indonesian Micronutrient Reference Report
30
their children once per week(Palupi L, et al. 1997)4. After a 9 week period,without further health staffintervention, anemia wasreduced from 37% to 16%of children, and 72% of asubgroup of children provedsupplement intake at the 6th
week of supplementation.3. To compare the efficacy of daily iron
supplementation and weekly multi-micronutrientsupplementation on increasing iron status. (2001).Maria Wijaya (SEAMEO)
1. A randomized double-blind controlled trial wasdone with 284 healthyIndonesian infants aged 6-12 months. Infants wererandomly assigned toreceive daily 1 RDA multimicronutrient supplement(group I, n=72); group II (n=70) received 2 RDAmulti micronutrientsupplements weekly; groupIII (n=72) received dailyferro-sulphate 10 mg, andgroup IV placebo ( n=70),for 23 weeks.2. At base line 51.8% ofsubject anemic, 28.2% wereiron deficient and 11.2 wereZinc deficient.3. After 23 week ofsupplementation, both daily1 RDA multi-micronutrientand daily iron supplementedgroups had significantlyincreased blood Hb andplasma ferririnconcentration.4. The study concludeddaily 1 RDA multimicronutrient and daily ironsupplementation areefficacious in improving theconcentration of Hb andferritin level and reducingthe percentage of infantswith anemia and irondeficiency of the Indonesianinfant aged 6-12 mo in arural community. However,there was an increasingproportion of infants withZinc deficiency in daily ironsupplementation

Indonesian Micronutrient Reference Report
31
deficiency of the Indonesianinfant aged 6-12 mo in arural community. However,there was an increasingproportion of infants withZinc deficiency in daily ironsupplementation5. The efficacy of daily 1RDA multi micronutrientsupplementation was higheramong the children withblood Hb<11.0g/L. Weekly2 RDA multi micronutrientsupplementation was onlyfound to affect childrenwith low Hb or ferritinlevels.
4. To investigate the effect of iron supplementationprogram among under-five children in North CentralTimor, East Nusa Tenggara, Indonesia. (1998). AsihSetiarini (SEAMEO)
1. A cross sectional studywas done with 148 under-five children from 4 healthcenters where ironsupplementation programhas been implemented. Theprevalence of anemia was81.5%, although 75.6% ofthe subjects claimed to takethe iron syrup.2. The samples divided into2 groups: 75 childrenreceived a daily supplementof 30 mg Fe for 10 weeks(Group A), and 73 childrenreceived weekly supplementof 30 mg Fe (Group B).3. It was significantincrease of Hb level forboth groups (p<0.001)which reduced theprevalence of anemia from42.3% to 7% (group A), andfrom 55.9% to 27.9%(group B).4. The compliance washigher in the weekly group;42.1% in group A and100% in group B.5. The study concluded thatdaily group resulted in abetter effect in reducinganemia prevalence forpreschool children; thoughboth weekly and dailysupplementationsignificantly increased Hb.

Indonesian Micronutrient Reference Report
32
daily group resulted in abetter effect in reducinganemia prevalence forpreschool children; thoughboth weekly and dailysupplementationsignificantly increased Hb.
These studies suggest two potential opportunities to overcome limited ironsupplementation in children. It has been proposed that Indonesia’snationwide school feeding program in deprived villages, (which isorganized and administered by local authorities and projected to cover 7.2million children in 1997), could be utilized. The program could offer ironsupplements with snacks that are already provided three times per week.The additional cost for one weekly supplement would be equal to 1% of thebudget for the snacks (US 4 cents.)A second proposal is to give parents enough iron tablets to cover a 2-3month period (1 tablet per week). Provided compliance is high enough,this may compensate for the limited number of health care personnelavailable. This approach has been found effective in reducing anemiaafter 9 weeks.
b. Constraints and Opportunities Relatedto Iron Supplement for Adolescents: (Study/ Survey Year and Author Purpose)
Findings
1. To study the impact of iron, vitamin A, or vitamin Csupplementation on Hb and ferritin concentrationamong adolescent girls. (1997). M. Saidin danSukati
1. 175 high school studentswere divided into fourgroups: (1) iron tablet only(49), (2) iron tablet +12,000 IU vitamin A (46),(3) iron tablet + 150 mg/week vitamin C (40), and(4) control (40). Before thestart of the study allsubjects were given a 500mg deworming tablet.2. There was a significant(p <0.05) increase of Hb ingroup 1, 2, 3, by 0.39 g/dl,0.45 g/dl and 0.68 g/ dlrespectively, and a 0.26decrease in the controlgroup.

Indonesian Micronutrient Reference Report
33
3. There was also a slight,non- significant increase inferritin concentration in allfour groups (p>0.05)4. Iron tablet and vitamin C(group 3) had greatestincrease in Hb, but it didnot improve iron stores.
2. To investigate the efficacy of two different ironsupplement administration on weekly basis versusduring menstruation. (1999).Judhiastuti F (SEAMEO)
1. A 16-week communityexperimental study wasdone with menstruatingfemale adolescent students.2. 48 students received aplacebo tablet weekly, 48students got an iron tabletweekly and 41 students tookan iron tablet only duringtheir menstruation cycle for4 consecutive days. Allsubjects were givendeworming tablet beforesupplementation.3.The supplementationcontributed to a significantimprovement (p<0.05) foriron status of theintervention groupscompared to the placebogroup.4. In menstruation group,the Hb concentration of theanemic subject improvedsignificantly from 11.0±0.9g/dl to 11.6±0.6 g/dl(p<0.05), while for the non-anemic subject, their serumferritin concentrationsincreased significantly from23.4±19.1 ug/L to46.6±33.9 ug/L (p<0.05).5. In weekly group foranemic and non-anemicsubjects, there was asignificant increase(p<0.05) in Hb from10.8±1.1 g/dl to 12.4±1.5g/dl and from 12.7±0.4 g/dlto 13.3±0.7 g/dlrespectively and serumferritin concentrations from25.2±17.1 ug/L to39.1±32.2 ug/L and from28.0±25.2 ug/L to45.4±30.9 ug/L

Indonesian Micronutrient Reference Report
34
to 13.3±0.7 g/dlrespectively and serumferritin concentrations from25.2±17.1 ug/L to39.1±32.2 ug/L and from28.0±25.2 ug/L to45.4±30.9 ug/Lrespectively).6.This study revealed thatsupplementing 4 iron tabletsconsecutively duringmenstruation for as much asfour menstrual cycles hascontributed a smallerimprovement to Hbconcentration as comparedwith weekly basis.
3. To investigate the efficacy of combination andweekly iron supplementation among female factoryworkers. (2000)Titin Hartini (SEAMEO)
1. A communityintervention study was donewith female factory workersaged 15-45 yrs, and dividedinto 3 groups.2. Group I (weekly) n=35,received iron (60 mgelemental iron+250 mcgfolic acid) 1 tablet per weekfor 16 weeks. Group II(combination) n=36,received 1 iron tablet perweek and duringmenstruation received 1tablet per day for 10 daysfor 16 weeks. Group III(placebo) n=35, received 1tablet per week for 16weeks.3. All subjects weredeworming using 500 mgMebendazol tablet 3 daysbefore supplementation4. Group II had a largerreduction in the prevalenceof anemia and iron statusthan Group I. In group II,the prevalence of anemiareduced from 33.3% to11.1% (P<0.01). Prevalenceof low iron status reducedfrom 25% to 2.8%. Therewas increasing prevalenceof anemia for group IIIfrom 25.7% to 51.4%.

Indonesian Micronutrient Reference Report
35
of low iron status reducedfrom 25% to 2.8%. Therewas increasing prevalenceof anemia for group IIIfrom 25.7% to 51.4%.5. When compared toweekly supplementation for16 weeks, distribute of irontablets once a week and onetablet per day for 10 daysduring menstruation for 16weeks gave better results.
This study suggests that when iron supplementation is given withvitamin C to adolescent girls, it has a greater impact on hemoglobin (butnot on iron stores) than when iron is given alone or with vitamin A. Providing Iron Supplementation during menstruation may be analternative to daily iron supplementation. In one study, supplementing 4iron tablets consecutively during menstruation for four menstrual cyclessignificantly increased Hemoglobin levels, thought to a lesser degree thandaily supplementation. In another study, daily iron supplementation plusone tablet per day for 10 days during menstruation reduced the prevalenceof anemia to a greater extent than weekly supplementation.
c. Constraints and OpportunitiesRelating to Iron Supplementation forWomen: (Study/ Survey Year and Author Purpose)
Findings
1. To report suggested actions for Iron deficiencycontrol in Indonesia. (1998). Gross, Ranier, PhD
1.Since 1996, companies inIndonesia are obligated tosupply female employees aniron-folate supplement oncea week for 16 weeks peryear (Dee Pee, Saskia, etal).2. When menstruating,workers should receive onetablet per day for 10 days(De Pee, Saskia, et al.)3. Employers must coverthe cost of supplementation.

Indonesian Micronutrient Reference Report
36
4. While the provision ofiron supplements is anactivity conducted by theprivate sector, it is regulatedby law and under thesupervisory guidance of theMinistry of Manpower.(De Pee et al.)5. Compliance with thisregulation should bemonitored.
2. To investigate religious leaders or togas asdistribution channels of iron tablets for women ofchild-bearing age. (1997) Umi Fahmida
1. A community trial wascarried out from October-December 1996 with 187women: 94 received twomonths of iron tabletsthrough religious leaders(toga group) and 93 fromhealth cadres.2. The women received 8tablets of 60 mg elementaliron combined with 250micrograms folic acid, 2500IU vitamin A and 60 mgvitamin C to taken onceweekly for 2 months.3. Compliance was assessedby interview and stool testand personal interview withtoga and cadre using semi-structured interviews.4. Distribution through togaand cadre covered 87.1%and 86.2% of the womenrespectively.5. Compliance was betteramong women in the togagroup who, on average,consumed 6.8 tabletscompared to 5.9 amongwomen in cadre group(p<0.10).6. Hb increased by 0.14 g/dland 0.30 g/dl and anemiaprevalence decreased by13.9 % and 16.2% in thetoga and cadre groupsrespectively.

Indonesian Micronutrient Reference Report
37
respectively.7. In the cadre group,predictors of less than fullcompliance were socialfactors (ie. age, familyincome, education level)and frequency of contactwith the cadre. Whereas intoga group only side effectswere predictive of non-fullcompliance.8. Results suggest that thetoga is a potential channelof iron tablet for women inchildbearing age.
3. To examine the importance of husbands in increasingcompliance of iron supplementation and itssubsequent effect on pregnancy outcomes. (2002).Hadi, H. Jamil M.D., Susetyo D., Wahyuni
1. The study looked atpregnant women withgestational age 16-20 weeksliving in Yogyakarta whoreceived daily ironsupplementation under theirhusbands observation wherehusbands were instructed tomonitor and remind theirwives to consume the pill.These women were 8.5times more likely to havecompliance > 80% thanthose from the controlgroup who consumed thedaily iron pill without sucha role for husbands.2. Increase of Hemoglobinin the group observed bytheir husbands was 0.46gm/ dl higher than in thecontrol group.3. Such a role for husbandshas considerable potentialin improving compliance ofiron supplementation and inimproving pregnancyoutcomes.4.The risk of delivering apremature baby was 3.7times (OR=0.27, 95%CI=0.11 to 0.68) lower thanthe control group. The riskof having a low birthweight baby was 3.1 times(OR=0.32, 95% CI=0.11-0.98) lower than the controlgroup.

Indonesian Micronutrient Reference Report
38
the control group. The riskof having a low birthweight baby was 3.1 times(OR=0.32, 95% CI=0.11-0.98) lower than the controlgroup.
4. To measure the impact of midwife supervision on thecompliance of iron supplementation, Hbconcentration, and birth weight. (2002). Wahyuni T.
1. The study wasconducted in Bantul Districtamong 121 pregnantwomen 20-28 weeksgestation. The sample wasdivided into 2 groups,supervised by midwife andunsupervised.2. There was a significantincrease in compliance andHB concentration in thesupervised group comparedto the non-supervisedgroup, but no difference inbirth weight.3. Supervision by midwifewas effective in improvingcompliance and Hb level.
5. To examine the role of nutrition education on anemiafor husbands on compliance of iron supplementation.(2002). Jamil M.D. et. al.
1. Husbands of pregnantwomen (20-28 weeksgestation) in theintervention group gotnutrition education everytwo weeks.2. Knowledge Attitude andPractice (KAP) increasedsignificantly after theintervention.3. Compliance wassignificantly higher by15.93 % in the interventionthan the control group.Multivariate analysisconfirmed the importanceof nutrition education inimproving compliance.4. Nutrition education forhusbands increased HBlevel by 1.3%.
6. To examine the role of KAP in compliance of ironsupplementation in pregnant women. (2002).Widiyanto SYD et al.
1. The study wasconducted in 6 sub-districtsin Bantul among 240pregnant women of 20-28weeks gestation.

Indonesian Micronutrient Reference Report
39
Widiyanto SYD et al. in Bantul among 240pregnant women of 20-28weeks gestation.2. Compliance was notassociated with knowledge,but was associated withattitude.
7. To compare the effectiveness of twice a week anddaily supplementation of iron in improving Hb andferritin concentration in pregnant women. (1997).M. Saidin, et al.
1. Intervention groupconsisted of 129 pregnantwomen of 3-6 monthsgestation who were giveniron tablets containing 60mg iron and 0.25 mg folicacid for 3 months. Thecontrol group consisted of132 pregnant women.2. Iron supplementationtwice a week increased Hblevel by 0.4 + 0.628 g/dl.The increase was greater inanemic pregnant women by0.5 + 0.80 g/dl.3. Daily ironsupplementation increasedHb by 0.5 + 0.561 g/dl.The increase was greater inanemic women, 0.6 + 0.541g/dl.4. The results showed thattwice a weeksupplementation was alsoeffective in improving Hblevel compared with dailysupplementation
8. To study the impact of iron, folic acid, and vitamin Con Hb level of pregnant women. (1996). ImanSumarno, et al.
1. 451 pregnant womenwith Hb levels <11% weredivided into three groups:(1) control group receiving60 mg iron tablet + 2 mgfolic acid daily for 4months, (2) receiving ironand folic acid weekly, and(3) receiving iron, folic acidand 100 mg vitamin Cweekly.2. Hb was determined threetimes by using Hbcyanmethemoglobin(baseline, 2 months, and 4months after intervention.)

Indonesian Micronutrient Reference Report
40
cyanmethemoglobin(baseline, 2 months, and 4months after intervention.)3. There was no differencein the effectiveness ofadministering daily orweekly supplementation inimproving Hb level ofpregnant women.4. Increase of Hb after twomonths was highest ingroup (3).
9. To examine supplementation strategies to alleviateiron deficiency in Indonesia. (1998). W. Schultinkand D. Dillon. Citing study done by Mothercare.
1. It was found that whentraditional birth attendants(TBA) distributed irontablets to pregnant women,92% of the targeted womenwere reached comparedwith 52% under the existinghealth care system(Mothercare).2. Under the TBA systemthe average number oftablets consumed duringpregnancy was 62, whereasit was reported to be 24under the existing healthcare system.3. The study concluded thatcoverage and compliancewere significantlyinfluenced by the TBAdistribution system.
10. To examine supplementation strategies utilized inIndonesia to alleviate iron deficiency. (1998).Schultink and D. Dillon. Citing Thorand et al (1994),
1. 107 pregnant womenfrom several villages inSouth Sulawesi wereselected by house-to-housevisits to participate in across-sectional study(Thorand et al. 1994).2. Only 64% of women intheir second or thirdtrimester had been checkedby health staff.3. Of those women whovisited the health center,only about two thirdsreceived iron tablets, and ofthose only about two-thirdsstated they took the tablets.

Indonesian Micronutrient Reference Report
41
received iron tablets, and ofthose only about two-thirdsstated they took the tablets.4. About 30% of the wholegroup studied stated theyhad taken the supplementsas prescribed.
11. To examine supplementation strategies utilized inIndonesia to alleviate iron deficiency. Schultink andD. Dillon. (1998.) Citing ACC/SCN (1998) andGross R, et al (1998).
1. Availability of tabletsfrom the supplier side hasinfluenced the effectivenessof iron supplementation.2. The available number ofiron tablets was reported tobe insufficient to cover theneeds of all pregnantwomen in Indonesia(ACC/SCN. 1991)3. According to 1996population data, about 472million tablets (4.5 months1tablet/day) are needed forthe number of women whoare pregnant each year(Gross R, et al. 1997).4. The large number oftablets required for pregnantwomen, compounded by thenecessity to providesupplements to othersegments of the population,highlights the importance ofinvestigating whether asupplementation schedulethat is less frequent thanonce-a-day would bepossible.
12. To investigate the effect of daily versus weekly ironsupplementation among pregnant women. (1995).Endi Ridwan (SEAMEO)
1. Non-randomizedexperimental communitytrial was done with 139pregnant women whoattended the selected HealthCenters for the first time intheir current pregnancy.2. 3 Health Centersmatched for socioeconomicconditions were allocatedfor control group (dailysupplementation) andtreatment group (weeklysupplementation).

Indonesian Micronutrient Reference Report
42
supplementation) andtreatment group (weeklysupplementation).3. Control group received60 mg Fe+0.25 mg folicacid (n=68) daily, treatmentgroup received 120 mgFe+0.50 mg folic acidweekly (n=71). Theduration of supplementationwas 8-20 weeks.4. Hb level in both groupsincreased significantly aftersupplementation (p<0.001).Improvement of Hb wasinfluenced by initial Hblevel (p<0.001) andhookworm infestation(p<0.05).5. Serum ferritin leveldecreased in both groups(P>0.05). Serum ferritinchanges was not influencedby initial Hb level (p>0.05),however was influenced byhookworm infestation(p<0.05).6. The duration ofsupplementation had noeffect on Hb changes(p>0.05), but it influencedserum ferritin changes(p<0.05).7. It was concluded thatsupplementation with 120mg Fe on weekly basis hadsimilar effects as daily doseof 60 mg Fe on Hb status,but was not enough toimprove iron stores inpregnant women.
13. To investigate the factors influencing the iron statusof pregnant women taking iron pills. (1999) SriRahayuningsih (SEAMEO)
1. A two phase descriptivestudy was done with 456pregnant women in thesecond trimester who wereparticipating in the nationalanemia control program inthree sub-districts of Bogor.

Indonesian Micronutrient Reference Report
43
three sub-districts of Bogor.2. The first phase wasconducted for 4 weeks toobtain information on Hband serum ferritin,socioeconomic condition,daily diet and nutrientsintake, knowledge onanemia, on iron pills and onPuskesmas services, healthbehavior, ante natal careattendance and number ofiron pills intake.3. The second phase wasconducted for 8 weeks tostudy the effect of nutritioneducation and supervisionon the number of iron pillsintake. 320 from 456pregnant women completedthe second phase of thestudy. The pregnant womenwere divided into 3 groupsbased on the sites of study:group I received antenatalcare once a month, 30 ironpills to be taken one pill aday (copying what isactually done in thepuskesmas); group IIreceived antenatal care, ironpills and intensive nutritioneducation; and group IIIreceived more frequentpersonal contact.4. The first phase found theprevalence of anemia(Hb<11g/dl) was 57.7%while iron deficiency(serum ferritin <12ug ug/l)was 38.6%. The women hadlimited knowledge onanemia, on iron pills and onPuskesmas services. Theattitude of antenatal careattendance was positive.Nutrients intakes weremostly below IndonesiaRDA for pregnancy and itis one of the cause of highprevalence of anemiaamong pregnancy.Frequencies of foodsconsumption showed that

Indonesian Micronutrient Reference Report
44
mostly below IndonesiaRDA for pregnancy and itis one of the cause of highprevalence of anemiaamong pregnancy.Frequencies of foodsconsumption showed thatthe daily diet contain lowbioavailable iron.5. The nutrition educationand frequent contactincreased the number ofpills intake. However, thedifference in number of ironpills intake did not causesignificant difference in Hblevel, although the groupthat received personalcontact had better changesof Hb level.7. The finding of this studysuggest the importance ofintensification of nutritioneducation in increasing thenumber of pills intake andthe needs of improving thedaily diet; that can beachieved through nutritioneducation and improvedfamily income, tostrengthen the anemiacontrol program.
14. To investigate the efficacy of combination andweekly iron supplementation among female factoryworkers. (2000)Titin Hartini (SEAMEO)
(See Constraints andOpportunities Related toIron Supplement forAdolescents)
These studies suggest that compliance in iron supplementation programsfor pregnant women can be improved by utilizing alternative channels todistribute iron supplements and to encourage their use. Women receivingiron tablets from traditional birth attendants (TBA’s) and religious leadersconsume a greater number of the prescribed tablets than those who receivethem through the existing health system. Women also consume moretablets when their husbands have received nutrition education and havebeen instructed to monitor and remind. Compliance was found to beassociated with attitude rather than with knowledge.

Indonesian Micronutrient Reference Report
45
Iron supplementation in private sector work places, required by law since1996, should be actively monitored.As is the case with adolescent girls, the addition of vitamin A to iron/folatesupplements improves Hb. Twice weekly supplementation increases Hbalmost as much as daily, and may offer a practical solution to the problemof tablet shortage.
d. Potential for Commercialization ofIron Tablets (Study/ Survey Year and Authors Purpose)
Findings
1. To assess the willingness of pregnant women to payfor iron tablets. (2000). Fitrah Ernawati, et. al.
1. An observational cohortstudy was conducted among76 pregnant women livingin 4 Community HealthCenter areas, Bogor. Thesamples were divided intotwo groups (1) receivingnutrition education frommidwives and (2) notreceiving nutritioneducation.2. Proportion of pregnantwomen willing to pay foriron tablet was around 20-30%.
Approximately 20-30% of women living in the coverage areas of 4community health center areas in Bogor indicated a willingness to pay foriron tablets.
2. Iron Fortification
a. Iron Fortified Noodles: (Study/ Survey Year and Authors Purpose) Findings
1. To study the impact of vitamin A and ironfortification in noodles on vitamin A and iron statusin children under five years old. (1995). Sukati, etal.
1. A quasi experimentalstudy was done in which 199children, aged 1-4 years old,were divided intointervention and controlgroups.

Indonesian Micronutrient Reference Report
46
2. Intervention groupreceived fortified noodlescontaining 10 mg iron and2,50 IU vitamin A per 100gm, while control groupreceived non-fortifiednoodles containing 3 mg ironand 1,500 IU vitamin A per100 gm for 14 weeks.3. Consumption of noodleswas 30 gm per day, whichprovided 750 IU vitamin Aand 3 mg iron in theintervention group; 450 IUvitamin A and 0.9 mg iron inthe control group.3. There was significant(p<0.05) increase of Hb levelof 0.31g/dl (from 11.3 + 1.05g/dl to 11.6 + 0.95 g/dl) inintervention group, a slightincrease (0.10 g/dl) in controlgroup.4. The prevalence of IDAdecreased by 10.9% in theintervention group butincreased by 1.0% in thecontrol group.
2. To study the impact of double fortification of ironand vitamin A in noodles on Hb and serum feritin inpregnant women. (1995). M. Saidin, et al.
1. Quasi experimental designwas used with 185 pregnantwomen (3-6 monthspregnant) divided intointervention (95) and controlgroup (90). The interventiongroup received fortifiednoodles containing 10 mgiron and 2500 IU vitamin per100 grams. The controlgroup received non-fortifiednoodles containing 3 mg ironand 1500 IU vitamin A per100 grams, as usually sold inthe market. Both groupsreceived noodles 3 times aweek for 14 weeks.2. The mean consumption ofnoodles was 35 gm/daywhich provided 3.5mg ironand 875 IU vitamin A in theintervention group.

Indonesian Micronutrient Reference Report
47
which provided 3.5mg ironand 875 IU vitamin A in theintervention group.3. There was a significant(p<.05) increase of Hb level0.47 g/dl (from 11.3 + 1.14g/dl to 11.8 + 1.04 g/dl) in theintervention group. Thechange (0.07 g/ dl) was notsignificant in the controlgroup.4. The prevalence of IDA inpregnant women decreasedfrom 48.5% to 43.3% in theintervention group, butincreased from 46.7% to56.8% in the control group.The intervention had asignificant impact (p<0.05).5. The intervention alsoproduced a significant impact(p<0.05) on serum ferritinconcentration in theintervention group comparedwith the control group.
3. To study the effectiveness of iron fortification innoodles. (1991). Uken S. Soetrisno, D.S. Slamet,dan Hermana.
1. 100 mg of ferro fumaratewas added per kilogram ofnoodle flour.2. Organoleptic tests wereperformed three times at two-month intervals.3. Double radioisotope testwas conducted to measureiron absorption in samples ofadult men aged 25-40 yearsold.4. Fortified noodles storedfor six months performed aswell as non-fortified noodlesin organoleptic test.5. Iron absorption varieddepending on Hb level.Subjects with Hb level > 14gr% absorbed 3.62% ofavailable iron from non-fortified noodles and 11.79%from fortified noodles:Subjects with Hb < 14 gr%absorbed 5.60% and 12.35%respectively.

Indonesian Micronutrient Reference Report
48
Subjects with Hb < 14 gr%absorbed 5.60% and 12.35%respectively.6. Fortified noodles provide70% RDA per day of iron foran adult man.
Iron fortified noodles were found to be as acceptable as non-fortifiednoodles in organoleptic tests. Consumption of noodles fortified withvitamin A and iron resulted in significant increases (p<0.05) inhemoglobin levels compared to a control group.
b. Fortification of MSG (Study/ Survey Year and Author Purpose) Findings
1. To look at the effects of fortification of crystallinemonosodium glutamate (MSG) with vitamin AMuhilial, et al. 1988.
1. A controlled trial testedthe fortification of MSGwith 810 RE vitamin A/g inan area of endemic vitaminA deficiency in Indonesia.2.Fortified MSG wasmarketed through ordinarychannels in 5 villages in theprogram area; 5 nearbyvillages served as thecontrol area.3. mono-sodium-glutamatefortified with vitamin Aimproved vitamin A status,as well an hemoglobinconcentration of the targetpopulation.
MSG fortified with vitamin A not only reduced vitamin A deficiency, butalso increased the hemoglobin concentration of those living in an areawith endemic vitamin A deficiency (see also Vitamin A Fortification).
c. Iron Fortification of Candy (Study/ Survey Year and Author Purpose) Findings
1. To look at the effect of iron-fortified candies onthe iron status of children 4-6 years old. Sari, M.,et al. 2001.
1.A double-blind, placebo-controlled interventionstudy was conducted inJakarta, Indonesia to assesswhether iron-fortifiedcandies can improve ironstatus and are acceptable tochildren aged 4–6 y.

Indonesian Micronutrient Reference Report
49
et al. 2001. study was conducted inJakarta, Indonesia to assesswhether iron-fortifiedcandies can improve ironstatus and are acceptable tochildren aged 4–6 y.2.). 30 g (10 pieces)/ weekof candy were given to thechildren. The candy givento the fortified groupcontained 1 mg elementalFe/g and very smallamounts of other vitaminsand minerals. Fortifiedgroup (n = 57); placebogroup (n = 60).3. The hemoglobinconcentration of thefortified group increased by10.2 g/L (95% CI: 8.3, 12g/L) whereas that of theplacebo group increased by4.0 g/L (2.0, 6.0 g/L; P <0.001). Anemia prevalencedecreased from 50.9% atthe start of the interventionto 8.8% after 12 wk ofintervention in the fortifiedgroup (P < 0.001) and from43.3% to 26.7% in theplacebo group (P < 0.05).After 12 wk of intervention,the serum ferritinconcentration was 71%higher than at baseline inthe fortified group and 28%higher in the placebo group(P < 0.001). Acceptabilityof the iron-fortified candieswas good. The per capitacost of the supplement wasapproximatelyUS$0.96–1.20 for the 12 wkof intervention.4. The study concluded thatiron-fortified candies wereeffective in improving theiron status of youngchildren and might be anaffordable way to combatiron deficiency in childrenof low-to-middle incomegroups.

Indonesian Micronutrient Reference Report
50
iron status of youngchildren and might be anaffordable way to combatiron deficiency in childrenof low-to-middle incomegroups.
Iron fortified candies were acceptable to children, increased hemoglobinlevels and had a per capita cost of approximately $US 0.96-1.20 for the 12week intervention (or just under 1 cent per piece of candy.)
d. Iron Fortification of Soy Sauce: (Study/ Survey Year and Author Purpose) Findings
1. To study iron fortification of wheat flour and soysauce. (1993). Komari dan Hermana
1. Ferrous sulfate was usedto fortify wheat flour andsoy sauce that was stored incolored and glass jars fortwo months. Iron contentand biological availabilitywere determined by using invitro method.2. The amount of ironduring two months storagewas improved to almost100% due to equilibriumprocess during the storage.3. Biological availabilitywas around 10%-12%.There was no change ofcolor or odor duringstorage.
When analyzing soy sauce and wheat flour fortified with ferrous sulfate, itwas found that, after two months of storage, iron content improved almost100% due to an equilibrium process with no change in color or smellduring storage. Biological availability was 10-12%.
e. Iron Fortification of Bread: (Study/ Survey Year and Author Purpose) Findings
1. To investigate the efficacy of iron supplementationusing bread as vehicle in improving iron status ofpreschoolers. (2000) Sri Wigati (SEAMEO)
1. 46 preschoolers receivedbread containing 2.4 mg ofelemental iron/bread tomeet 25% of RDA daily; 30others received breadwithout additional irondaily for 12 weeks.

Indonesian Micronutrient Reference Report
51
preschoolers. (2000) Sri Wigati (SEAMEO) elemental iron/bread tomeet 25% of RDA daily; 30others received breadwithout additional irondaily for 12 weeks.(Note: This study recruited140 children, but only 76children had completeinformation for 67 daysintervention)2.All subjects were givendeworming syrup beforeintervention. H eight,weight, dietary intake, Hb,serum ferritin level wereassessed before and afterintervention.3.The mean age of subjectswas 65.86±6.32 m with6.5% anemia prevalence.4.The mean consumption ofbread during interventionwas 25 g and 32 g fortreatment and controlgroups, respectively. Thisdifference was significant.5.The reduction of anemiaprevalence did not differsignificantly between thetwo groups.6.There were aninsignificant increase in Hband serum ferritin levels inboth groups. It wasconcluded that using breadthat provided 25% of ironrequirement did notincrease iron status ofpreschoolers with normalHAZ, WAZ and lowanemia prevalence.
Bread that provided 25% of the iron requirement did not increase ironstatus of preschoolers with normal HAZ, WAZ and low anemiaprevalence.

Indonesian Micronutrient Reference Report
52
3. Dietary Strategies
Dietary Strategies to Increase IronIntake (Study/ Survey Year and Author Purpose)
Findings
1. To determine biological availability of iron in foodsconsumed daily by pregnant women, in thepresence of substances that enhance and prohibitit’s absorption. (1998). M. Saidin, et. al.
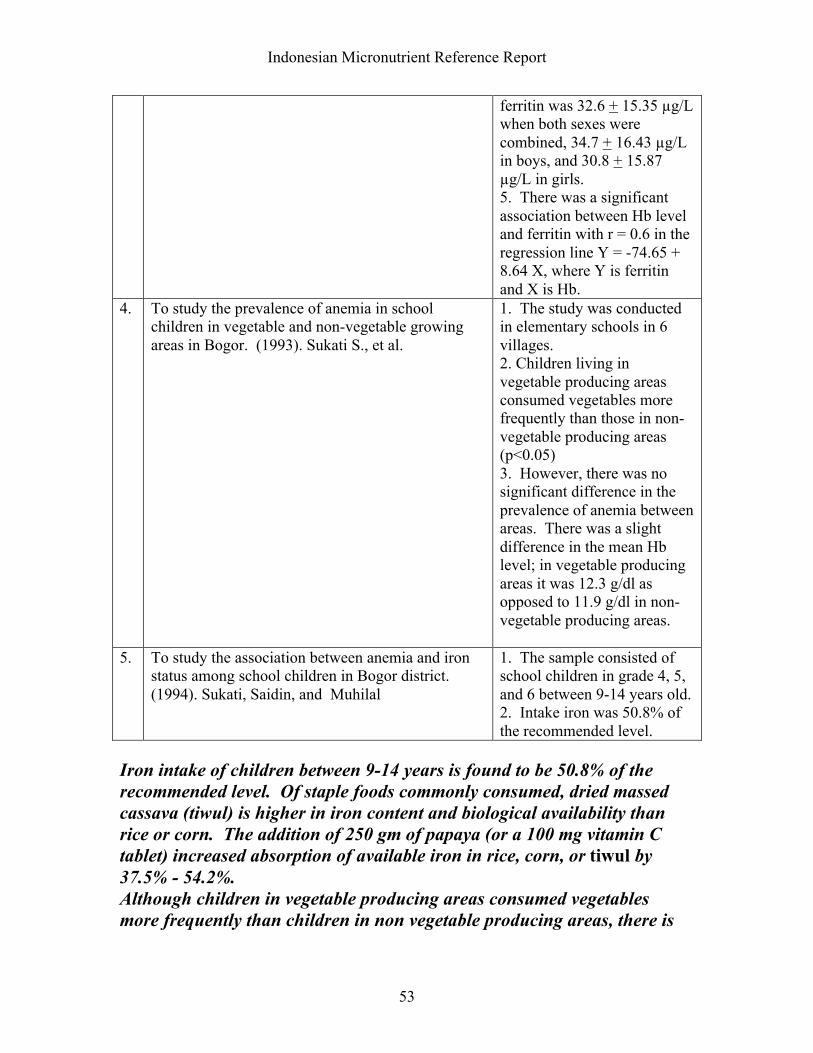
1. Among staple foods, driedmassed cassava (tiwul) washigher in iron content andbiological availability thanrice or corn.2. 100 mg of vitamin Cadded in tablet form, or 250grams of papaya, increasedabsorption of available iron inrice, corn, or dried massedcassava (tiwul) by 37.5% -54.2%.
2. To study in-vitro iron absorption of ferrous sulfatetablets consumed with rice, corn, and cassava, andwith vitamin C from a tablet or papaya. (1998).Almasyhuri, M. Saidin, dan Sukati.
1. Iron absorption of ferroussulphate increased in thepresence a vitamin C tabletfrom 37.3% to 47.7%, andfrom 37.3% to 43.8% withpapaya.2. Taking iron tablet beforemeals increased ironabsorption but also increasedthe possibility of side effects.
3. To study the association between anemia and ironstatus among school children in Bogor district.(1994). Sukati, Saidin, and Muhilal
1. The sample consisted ofschool children in grade 4, 5,and 6 between 9-14 years old.2. Intake of energy, vitaminC, protein, and iron were73.5%, 84.0%, 63.0% and50.8% respectively.3. There was no significantdifference between boys andgirls in food intake, Hb, orferritin.4. The mean Hb level was12.3 + 0.98 g/dl when bothsexes were combined, 12.4 +0.91 g/dl in boys and 12.1 +1.05 g/dl in girls. The meanferritin was 32.6 + 15.35 µg/Lwhen both sexes werecombined, 34.7 + 16.43 µg/Lin boys, and 30.8 + 15.87µg/L in girls.
Indonesian Micronutrient Reference Report
53
ferritin was 32.6 + 15.35 µg/Lwhen both sexes werecombined, 34.7 + 16.43 µg/Lin boys, and 30.8 + 15.87µg/L in girls.5. There was a significantassociation between Hb leveland ferritin with r = 0.6 in theregression line Y = -74.65 +8.64 X, where Y is ferritinand X is Hb.
4. To study the prevalence of anemia in schoolchildren in vegetable and non-vegetable growingareas in Bogor. (1993). Sukati S., et al.
1. The study was conductedin elementary schools in 6villages.2. Children living invegetable producing areasconsumed vegetables morefrequently than those in non-vegetable producing areas(p<0.05)3. However, there was nosignificant difference in theprevalence of anemia betweenareas. There was a slightdifference in the mean Hblevel; in vegetable producingareas it was 12.3 g/dl asopposed to 11.9 g/dl in non-vegetable producing areas.
5. To study the association between anemia and ironstatus among school children in Bogor district.(1994). Sukati, Saidin, and Muhilal
1. The sample consisted ofschool children in grade 4, 5,and 6 between 9-14 years old.2. Intake iron was 50.8% ofthe recommended level.
Iron intake of children between 9-14 years is found to be 50.8% of therecommended level. Of staple foods commonly consumed, dried massedcassava (tiwul) is higher in iron content and biological availability thanrice or corn. The addition of 250 gm of papaya (or a 100 mg vitamin Ctablet) increased absorption of available iron in rice, corn, or tiwul by37.5% - 54.2%.Although children in vegetable producing areas consumed vegetablesmore frequently than children in non vegetable producing areas, there is

Indonesian Micronutrient Reference Report
54
little difference in the prevalence of anemia in children between theseareas.
4. Other Food Based Interventions
Other Food Based Interventions for IronDeficiency (Study/ Survey Year and Author Purpose)
Findings:
1. An Overview Of Studies On Iron Deficiency inIndonesia. (1998) Kodyat, et al. Citing Saidin M,Alamsjhuri, Muhilal. 1991.
1. As “jamu” (traditionalherb drinks) reach a largeproportion of thepopulation (particularlywomen) that is vulnerableto IDA, they are regardedas a good ‘vehicle’ fordelivery of iron.2. ‘Jamu” is produced athome as well ascommercially.3. The iron content of‘jamu’ is high, but it has ahigh content of inhibitors(Saidin M, et al. 1991).4. Traditional recipes for‘jamu’ do not allow theaddition of non-naturalsubstances. Therefore,commercial producers areconsidering the possibilityof adding natural enhancersor iron absorption, such astamarind. Tamarind is highin vitamin C.
“Jamu” is a traditional herbal drink that reaches a large proportion of thepopulation (particularly women) vulnerable to IDA. Jamu is produced athome as well as commercially. While the iron content is high it has a highcontent of inhibitors. Commercial producers are considering addingnatural enhancers for iron absorption, such as tamarind which is high invitamin C.
Iodine:

Indonesian Micronutrient Reference Report
55
A. Iodine Deficiency Among Vulnerable Groups
Iodine Deficiencies Among VulnerableGroups: (Study/ Survey Year and Author Purpose)
Findings:
1. To identify the prevalence of goiter and possiblefactors influencing goiter among pregnant women inlow land and coastal areas. (2002) Wirjatmadi, B.
Data collected from 108pregnant women (trimester Iand II) showed that thyroidpalpation (TGR) in a coastalarea (Tuban) and in a non-coastal low land area (Ngawi)were 5.6% and 59.3%respectively.
2. To examine IDD problems in low land areas inGresik District, East Java. (2002). Gunanti I.R., etal.
1. The study was conductedin an elementary schoolamong 50 children, mostlyaged 10-11 years.2. IDD problem as assessedby TGR and VGR was26.8%, 0.72% respectively.Grade IA was 86.2% in girlsand 52.4% in boys.3. UIE was 43-422 µg/L(median 267.5 µg/L).
3. To obtain the latest map of TGR among schoolchildren at sub-district level, the latest IDD problemamong pregnant women at district level, and otherinformation related to the IDD control program(National Survey on IDD)1996-1998) (2000).Muhilal, et. al.
1. From 27 provincesapproximately 1,200,000school children and 90,000pregnant women werestudied. Causal urinesamples from about 40,000pregnant women werecollected.2. Based on the analysis ofschool children data, 7% ofsub-districts were categorizedas severe endemic areas, 5%as moderate endemic areas,21% as mild endemic areasand 67% as non endemicareas. The national TGR was9.8%.
4. To obtain the latest picture of the IDD problemamong pregnant women at the district level. (2000).Djoko Kartono, et al.
1. TGR among pregnantwomen was 16.0%, sevenprovinces were categorized atmoderate/ severe endemicareas, 34.5% districts werecategorized as mild endemicareas.

Indonesian Micronutrient Reference Report
56
moderate/ severe endemicareas, 34.5% districts werecategorized as mild endemicareas.2. Median value of UIC atprovince level was 12.6µg/dl; 21.5% of districts hadmedian value of UIC amongpregnant women less than10.0 µg/dl or characterized asiodine deficient areas. 18.7%of pregnant women had UIClevel less than 5 µg/dl and61.5% had UIC greater orequal to 10.0 µg/dl.
5. To measure the change of national IDD prevalencefrom 1980 to 1998. (1999). Muhilal, et al.
1. The results showed thatthe mean TGR in 1980, 1988and 1998 were 33.1%,30.3%, and 17.7%respectively. Overallpercentages of sub-districtwith TGR less than 5% in the3 surveys was 0%, 13.6% and32.2% respectively.2. For Java and Bali regionsthat represent betterdevelopment incommunicationinfrastructure, the mean TGRin the 3 surveys were 33.7%,32.3% and 21.1%respectively. Percentages ofsub-district with TGR lessthan 5%, for Java-Baliregion, was 0%, 16.7%, and44%.3. Outside the Java-Baliregion, the mean TGR was33.7%, 32.3% and 21.1%respectively. Percentage ofsub-districts outside the Java-Bali region with TGR lessthan 5%, was 0%, 12.2% and26.8%.
6. To study iodine status at district level in West Java.(1998). Iman Sumarno
1. Based on earlier criteriaWest Java was not classifiedan endemic area of IDD;based on UIE it wasclassified a mildly endemicarea; and based on TSH levelamong pregnant women, 15%had a TSH level of more than15% classifying this area ashigh risk. Iodine intake was

Indonesian Micronutrient Reference Report
57
based on UIE it wasclassified a mildly endemicarea; and based on TSH levelamong pregnant women, 15%had a TSH level of more than15% classifying this area ashigh risk. Iodine intake wasfound to be similar or lowerthan previous surveys asindicated by TGR prevalence.
7. To study the magnitude of IDD in four easternprovinces of Indonesia. (1991). Endi Ridwan, et al.
1. The study was conductedin Maluku, Papua, East NusaTenggara and former EastTimor provinces covering29,200 elementary schoolchildren and 1,749 pregnantwomen.2. The prevalence of IDDamong school children byusing TGR in former EastTimor, East Nusa Tenggara,Maluku, and Papua was26.1%, 12.5%, 7.6%, and6.7% respectively.3. The prevalence of IDDamong pregnant women byusing TGR in Maluku, Papua,former East Timor, and EastNusa Tenggara was 38.6%,30.5%, 23.4%, and 16.4%respectively. The prevalencewas highest among pregnantwomen aged 30 years orolder in the third trimester.
8. UNICEF. The state of the world’s children 2002http://www.unicef.org
Total goiter rate (6-11 yrs) %(1995-94): 28
9. To investigate of IDD and intellectual performanceof schoolchildren aged 8-10 years old. (1995). LuciaPardede (SEAMEO)
1. A cross sectional studywas done on 544 schoolchildren aged 8-10 y from 22public primary schools at 11villages within 5 sub-districts.2. Villages’ selection wasdone with the aim to describethe overall extent andseverity of IDD amongschool children by usingdifferent methods ofassessment. The methods ofassessment were palpation,ultrasonography (USG),urinary iodine excretion(UIE) and the serum thyroid-

Indonesian Micronutrient Reference Report
58
school children by usingdifferent methods ofassessment. The methods ofassessment were palpation,ultrasonography (USG),urinary iodine excretion(UIE) and the serum thyroid-stimulating hormone (TSH).Culture Fair Intelligence Testwas used to assess theintelligence quotient (IQ)points.3.The total goiter rate (TGR)for the whole survey area asindicated both by palpationand ultrasound measurementwere 35.7% and 54.8%respectively. According toWHO criteria, the survey areacategorized as ‘severe’ (TGR>30%) as indicated by eitherpalpation or USGmeasurement.4. In contrast, the survey areacategorized as “mild” basedon both UIE and TSH level(median UIE=6.50 ug/dl,TSH >5 mU/l=3.4%).5. Goiter, either determinedby palpation or USG, wassignificantly associated withIQ points of the subjects(p<0.001 and p <0.01respectively). TSH level wasnot associated with IQ pointsand also with other IDDindicators.6. The study concluded twoof the IDD indicators (goiterand UIE) were significantlyassociated with the level ofintelligence of the schoolchildren, which reflected thequality of life of the people.Therefore, the intervention isurgently needed.
10.
To assess the effect of Selenium and Vitamin Asupplementation on the goiter size among schoolchildren. (1998). Widardo (SEAMEO)
1. A case control study wasconducted in Cimanggu Sub-District, Cilacap, CentralJava, from November 1997-January 1998.

Indonesian Micronutrient Reference Report
59
. supplementation on the goiter size among schoolchildren. (1998). Widardo (SEAMEO)
conducted in Cimanggu Sub-District, Cilacap, CentralJava, from November 1997-January 1998.2. The prevalence of goiterbased on palpation was40.5%.
Overall rates of IDD are decreasing with the mean TGR rate in1980, 1988 and 1998 were 33.1%, 30.3%, and 17.7% respectively. These surveys/studies indicate that iodine deficiency (based on TGR)among school children range from 6.7 % in Papua to 26.1% in formerEast Timor. In other studies based on palpation, the goiter rate of schoolchildren has been found to range from 35.7% to 40.5%. Analysis of datafrom 1,200,000 school children characterized 7% of sub districts as severeendemic areas. A small study of school aged children showed that girlshave a higher rate of IDD than boys.The prevalence of IDD (using TGR) in pregnant women varied from 5.6%in a coastal area (Tuban) to 59.3% in an inland low land area (Ngawi);with TGR in Maluku, Papua, former East Timor and East Nusa Tenggarabeing 38.6%, 30.5%, 23.4%, and 16.4% respectively.
B. Interventions for Iodine Deficiency:
1. Iodine Supplementation. (Study/ Survey Year and Author Purpose)
Findings
1. To investigate the relationship between iodinesupplementation and IDD status among school agechildren in endemic goiter area. (1996)Siti Muslimatun (SEAMEO)
1.A cross sectional studywas conducted in 8 villagesof Peninggahan Puskesmascatchment’s area in SolokDistrict, West Sumatraduring March 1996. Thesamples were 238 childrenage 8-10 years from 8public elementary schools.2.Methods of assessmentwere palpation thyroidgland, measuring of UIElevel, determination ofiodine level in salt anddrinking water, Weight,Height and interviews todetermine the actual iodizedoil capsule coverage. Inaddition, sample ofenvironmental water wascollected to assess its iodinecontent.

Indonesian Micronutrient Reference Report
60
oil capsule coverage. Inaddition, sample ofenvironmental water wascollected to assess its iodinecontent.3.The survey area wascategorized as mild IDDarea based on goiter rate(19% all were in grade 1).4. Median UIE levelindicated that the subjectshad been in iodine repletecondition (13.1 ug/dl).5. Iodized oil capsulecoverage was 61%, with55% of those childrenreceiving their latestcapsule less than 1 yearprior to the at the time ofstudy.8.The surveyed children hadlow nutritional status basedon anthropometricmeasurements. There wasno association betweenanthropometric indices andgoiter.9.The three types of iodinesupplementation ie. iodizedoil capsule, iodized salt andiodized water were notassociated with goiter rate;while iodine level in salt-although below therecommended level-wassignificantly associated withUIE level, suggesting thatefforts to attain theuniversal salt iodinationshould be encouraged.10.The relatively highiodine level inenvironmental waterimplied sufficient iodinesource in the area, thereforefactors other than iodinedeficiency might play animportant role in the IDDstatus of the surveyedpopulation.

Indonesian Micronutrient Reference Report
61
important role in the IDDstatus of the surveyedpopulation.
2. To assess the effect of Selenium and Vitamin Asupplementation on the goiter size among schoolchildren (1998). Widardo (SEAMEO)
1. A case control study wasconducted in CimangguSub-District, Cilacap,Central Java, fromNovember 1997-January1998. School children age8-12 years with palpablegoiter was allocatedrandomly into 2 groups,treatment and control.2.Treatment received once400 mg iodine capsule,vitamin A (200.000 IU) andSe (200 ug) twice a weekfor 8 weeks. Controlreceived once 400 mgiodine capsule and vitaminA (200.000 IU).3.Both groups showedsevere selenium deficiency,median of UIE wassignificantly differentbetween treatment andcontrol.4. 2 months afterintervention, mean of serumSe level increasedsignificantly in treatmentgroup (29.1 to 40.1 ug/L)and in control group serumSe level decreasedsignificantly into moresevere condition (30.1 to23.2 ug/L). The mean ofUIE in both groupsincreased significantly. Themean of thyroid volume inboth groups was decreasedsignificantly but was higherin the treatment group thanin control group (0.441 mland 0.296 ml).5.After Se supplementation,there was no significantdifference of goiterprevalence in both groups(p=0.075). However, theprevalence of goitersignificantly decreased from57.3% to 30% in thetreatment group. While

Indonesian Micronutrient Reference Report
62
difference of goiterprevalence in both groups(p=0.075). However, theprevalence of goitersignificantly decreased from57.3% to 30% in thetreatment group. Whilebased on palpation theprevalence of goiterdecreased 40% in treatmentand 30.6% in control, butthis prevalence was also notsignificant betweentreatment and control.
A study conducted in 8 villages in West Sumatra found that Iodized oilcapsule coverage for children 8-10 years old in public school was 61%,with 55% of these children receiving their latest capsule less than 1 yearprior to the beginning of the study. In another study, treatment withSelenium did not produce a significant difference in reduction ofprevalence of goiter based on the comparison of the treatment and controlgroup.
2. Iodine Fortification
a. Salt Iodization. Coverage andAdequacy of Iodine Content: (Study/ Survey Year and Author Purpose)
Findings
1. To examine IDD problems in low land areas inGresik District, East Java. (2002). Gunanti I.R., etal.
1. The study was conductedin an elementary schoolamong 50 children, mostlyaged 10-11 years.2. 38% of households usediodized salt where 48%contained iodine of > 30ppm.3. The reasons for not usingiodized salt were expense(5.2%) and taste (21.2%).
2. To analyze the role of increasing communityawareness and participation in the attainment ofIDD elimination in Indonesia. (2000). Sunawang,et al.
1. The results indicated thatincrease in awarenessbetween 1995-1999 does notcorrelate with the increase ofiodized salt coverage for theperiod.

Indonesian Micronutrient Reference Report
63
iodized salt coverage for theperiod.2. However, analysis of crosssectional data both for 1995or1999 show that awarenesssignificantly correlates withparticipation to buy iodizedsalt; the awareness alsocorrelates well with coverageof iodized salt consumption.
3. To compare IDD Mapping Survey and CBS Surveydata on the use of iodized salt. (2000). DewiPermaesih, et al.
1. The results indicated that77.2% of householdsconsumed good qualityiodized salt (> 30 ppm) andonly 15.2% consumed non-iodized salt.2. There were 5 provinceswhere the population on thedistrict level had fulfilled thecriteria for the “sustainableelimination of IDD” (>90%of households consumeiodized salt), while a CBSSurvey in 1998 found 7provinces fulfilling thesecriteria.
4. To examine the association between iodized saltconsumption and SES-KAP on IDD. (2002).Djamaludin M.D. et. al.
1. The study was conductedamong 124 households livingin a village in SE Sulawesi.2. 67.5% of householdsconsumed iodized salt, butonly 43.0% consumed saltwith sufficient iodine content.3. Consumption of iodizedsalt was significantlyassociated with SES andKAP on IDD.
5. To measure the change of national IDD prevalencefrom 1980 to 1998. (1999). Muhilal, et al.
1. In 1998, about two-thirdsof salt consumed byhouseholds containedadequate iodine (30 ppm).The relationship betweenTGR and the percentage ofsalt with >30 ppm of iodinewas fairly high.

Indonesian Micronutrient Reference Report
64
6. UNICEF. The state of the world’s children 2002http://www.unicef.org
% of households consumingiodized salt: (64)
7. To determine iodine content of salt sold in themarket by using simple method of available sourceof carbohydrate and reduction compound incommunity. (1991). Yuniar Rosmalina, FaisalAnwar, and Muhilal.
1. Iodine content of salt frommarkets around Bogor foundthat only 11.1% contain > 30ppm and 88.9% < 30 ppm.
8. www2.bps.go.id 1. Percentage of householdthat consumed iodized salt:1996: 58.011997: 62.11998: 65.18
9. To do an appraisal of the Intensified IndonesiaDeficiency Control Project. (1996). East Asia andPacific Regional Office Country Department III
See Appendix Table 11 fordistribution and capacity ofsalt producers by region
10.
To determine salt consumption at House Hold (HH)level and knowledge of mothers about IDD andiodized salt. (1996).Cornelia (SEAMEO)
1.A cross sectional study, thesample was 200 HH withchildren 1-5 years wereselected randomly. This studyconsisted of interviews ofmothers, observation ofiodized salt usage andanalysis of the iodine contentin iodized salt.2.All HH in the study areahave used iodized salt butthey were not aware that theyused iodized salt.3.The average saltconsumption at HH level was4.8g per day per capita. 71%of people have iodine intakesless than 100 micrograms.4.Using iodometry test HHsalt, 47% had iodine contentin iodized salt was less than30 ppm. All cooked foodexcept for rice was preparedwith salt. However, children1-5 years old do not consumeall foods that are preparedwith salt.5.Mothers with high level ofeducation usually had betterknowledge of, and were morelikely to use, iodized salt.

Indonesian Micronutrient Reference Report
65
6.These findings showed thatthe recommended iodineintake by WHO of 100-300ugper day per capita was notfulfilled, mainly because ofthe low quality of iodizedsalt, as well as improper waysof salt storage and foodpreparation.
11.
To investigate the relationship between iodinesupplementation and IDD status among school agechildren in endemic goiter area. (1996)Siti Muslimatun (SEAMEO)
1.A cross sectional study wasconducted in 8 villages ofPeninggahan Puskesmascatchment’s area in SolokDistrict, West Sumatra duringMarch 1996.2.Iodine level of salt wasfound to be 14.4 ±9 ppm.(See IodineSupplementation.)
These surveys/ studies indicate that the use of iodized salt ranges from77% of households in some areas to 38% in East Java; on average roughlytwo thirds of households use iodized salt. Of this iodized salt, however,between 88.9% (in Bogor) and 23% is not adequately iodized (< 30 ppm).In one study, the average salt consumption at HH level was 4.8g per dayper capita with 71% of people have iodine intakes less than 100micrograms
aa. Retention of Iodine in Storage andCooking: (Study/ Survey Year and Author Purpose)
Findings
1. To determine the impact of cooking of vegetableson iodine content in iodized salt. (2002). AritonangI., et. al.
1. Five recipes with differentways of adding salt weretried. The highest retentionof iodine occurred when saltand spices were added at theend of cooking, followed byadding spices at thebeginning and salt at the endof cooking.
2. To study the decrease of iodine content in saltbought, stored, and used daily for cooking byhouseholds. (1997). Uken SS. Soetrisno.
1. Two samples of iodizedsalt packed in 250g and 500gcontainers were stored atroom temperature for 4weeks. TookPak-Kit wasused to analyze iodinecontent.

Indonesian Micronutrient Reference Report
66
weeks. TookPak-Kit wasused to analyze iodinecontent.2. The decrease of iodinecontent in 500 g and 250 gpackets were 44% and 42%respectively.3. After the salt package wasopened, the iodine contentcontinued to decrease, butmore slowly.4. The decrease was slowerwhen salt remained in closedpackages.
3. To look at fortification of salt with Iodine.(1997). Iman Sumarno, et al.
1. From 5,143 salt sampleslabeled as iodized, it wasfound that iodine content of >30 ppm, < 30 ppm, and nonewas 27.1%, 70%, and 2.9%respectively.
4. To measure iodine (KIO3) loss in iodized saltduring packing, storing, and handling in thehousehold. (1993). Anies Irawati.
1. Iodized salt was stored inclear plastics, dark plastics,clear glass jar, and dark redglass jar. Each was storedand analyzed for iodine(KIO3) at 0, 2, 4, 6, and 8weeks.2. Iodine retention washighest when stored in darkred glass jar (39.43 ppm)compared to the three otherpackages (between 31.40ppm and 33.53 ppm). Thegreatest reduction of iodine(KIO3) content in saltoccurred in the first twoweeks (2.3%-14.4%), withiodine still declining to alesser degree thereafter.
These studies indicate that most salt labeled as iodized is not adequatelyiodized; out of 5,143 salt samples, 70% contained < 30 ppm of iodine. Theretention of iodine in salt is affected by both storage and cooking methods.

Indonesian Micronutrient Reference Report
67
Iodine retention was found to be highest in dark red glass jars ascompared to the three other packages that were used.Iodized salt stored in 250 and 500 gram packets was found to lose 42-44%of their iodine when stored for two weeks, with iodine content continuingto decrease, but more slowly beyond this point. Iodine retention was betterin closed packets compared to open packages. In cooking, the highestretention of iodine occurs when salt and spices are added at the end ofcooking.
bb. Commercial Preference: (Study/ Survey Year and Author Purpose) Findings
1. To study the quality of salt, preference of pregnantwomen on type of salt, and the association withurinary iodine level. (1997). Iman Sumarno, et al.
1. The proportion ofpregnant women who preferto buy iodized salt, non-iodized salt, or do not carewas 57.0%, 8.7%, and34.3% respectively (n=i45,928).
This study indicates that 57% of women prefer to buy iodized salt,compared with 8.7% who prefer non-iodized salt. About one third (34.3%)of women do not care whether their salt is iodized.
b. Water Iodination (Study/ Survey Year and Author Purpose) Findings
1. To measure the use of “Slow-Released Rhodifused-Iod” for water iodization and its impact on urinaryiodine of school children and pregnant women.(1994). Yuniar Rosmalina, et al.
1. Subjects were 100school children and 30pregnant women in theintervention group, 100school children and 16pregnant women in controlgroup.2. Compound used foriodization was PolymerSilikon Rhodifuse Iod put inthe water source to bedistributed to the household.3. Iodine content in thewater increased from 4-5µg/L to 17.6-34.6 µg/L inthe first five months anddecreased afterwards.
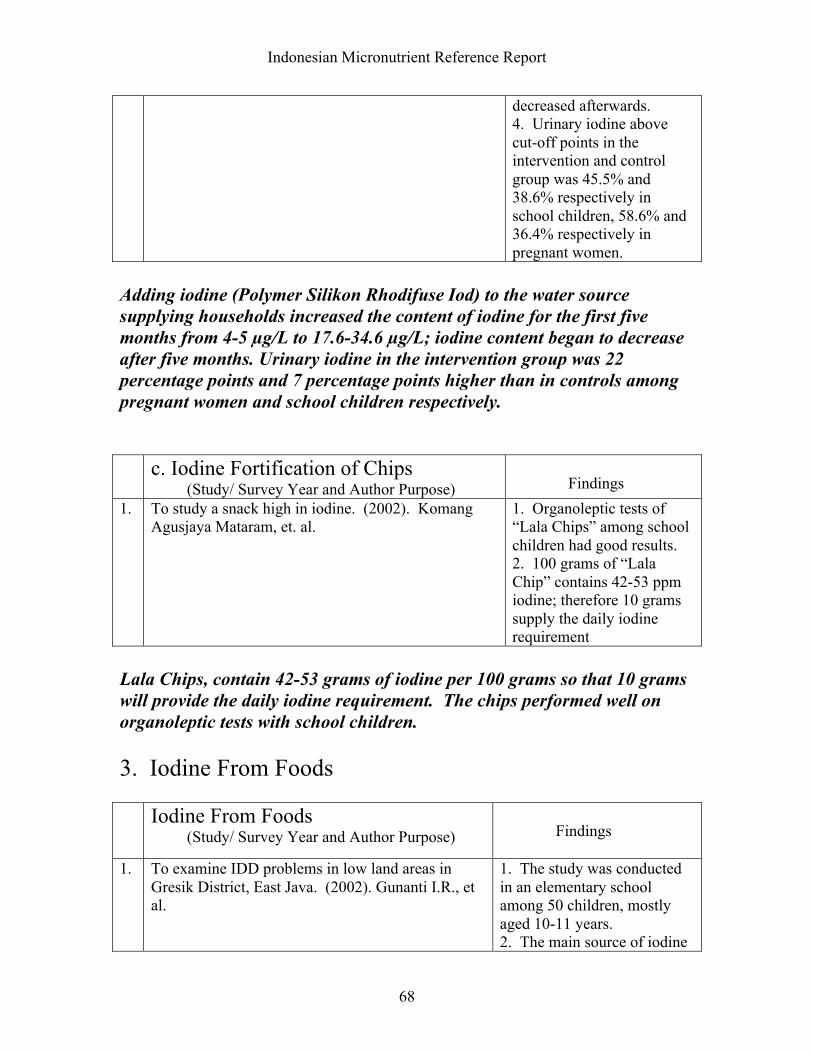
Indonesian Micronutrient Reference Report
68
decreased afterwards.4. Urinary iodine abovecut-off points in theintervention and controlgroup was 45.5% and38.6% respectively inschool children, 58.6% and36.4% respectively inpregnant women.
Adding iodine (Polymer Silikon Rhodifuse Iod) to the water sourcesupplying households increased the content of iodine for the first fivemonths from 4-5 µg/L to 17.6-34.6 µg/L; iodine content began to decreaseafter five months. Urinary iodine in the intervention group was 22percentage points and 7 percentage points higher than in controls amongpregnant women and school children respectively.
c. Iodine Fortification of Chips (Study/ Survey Year and Author Purpose) Findings
1. To study a snack high in iodine. (2002). KomangAgusjaya Mataram, et. al.
1. Organoleptic tests of“Lala Chips” among schoolchildren had good results.2. 100 grams of “LalaChip” contains 42-53 ppmiodine; therefore 10 gramssupply the daily iodinerequirement
Lala Chips, contain 42-53 grams of iodine per 100 grams so that 10 gramswill provide the daily iodine requirement. The chips performed well onorganoleptic tests with school children.
3. Iodine From Foods
Iodine From Foods (Study/ Survey Year and Author Purpose) Findings
1. To examine IDD problems in low land areas inGresik District, East Java. (2002). Gunanti I.R., etal.
1. The study was conductedin an elementary schoolamong 50 children, mostlyaged 10-11 years.2. The main source of iodinewas fresh sea fish consumedfewer than 3 times/week.

Indonesian Micronutrient Reference Report
69
was fresh sea fish consumedfewer than 3 times/week.
A small study of school children found that the main source of dietaryiodine was from fresh sea fish which was consumed fewer than 3 times perweek.
Other Micronutrients
A. Zinc Deficiency Among Vulnerable Groups

Indonesian Micronutrient Reference Report
70
Zinc Deficiency Among VulnerableGroups (Study/ Survey Year and Authors Purpose)
Findings
1. To investigate the extent of coexistence ofdeficiencies of vitamin A, iron and zinc, and also thenutritional relationship between lactating mothers andtheir infants. (2001). Dijkhuizen M.A. et. al.
1. In a cross-sectionalsurvey in West Java, 155lactating mothers and theirhealth infants were assessedanthropometrically, andblood, urine and breast milksamples were analyzed.2. 17% of infants and 25% ofmothers were zinc deficient.
2. To compare the efficacy of daily iron supplementationand weekly multi-micronutrient supplementation onincreasing iron status. (2001). Maria Wijaya(SEAMEO)
1. A randomized double-blind controlled trial wasdone with 284 healthyIndonesian infants aged 6-12months.2. At base line 51.8% ofsubject anemic, 28.2% wereiron deficient and 11.2%were Zinc deficient.3. There was an increasingproportion of infants withZinc deficiency in daily ironsupplementation(See Constraints andOpportunities Relating toIron Supplementation forChildren.)
In West Java, 17% of infants and 25% of lactating mothers were found tobe zinc deficient. Another study found 11.2% of healthy Indonesianinfants to be zinc deficient, with the proportion of zinc deficient infantsincreasing with iron supplementation.
B. Thiamine Deficiency
Thiamine Deficiency (Study/ Survey Year and Authors Purpose) Findings
1. To Propose strategies for controlling IDA. (2002).Lukito W.
1. Thiamine deficiency isprevalent in the Indonesianelderly population. Dietaryintake of thiamine 0.4-0.5mg compared to RDA of1.2 mg (Juguan et. al., J.Nutr. 1999). Low ETK wasalso found in 31.7-42.4% ofthose studied.

Indonesian Micronutrient Reference Report
71
1.2 mg (Juguan et. al., J.Nutr. 1999). Low ETK wasalso found in 31.7-42.4% ofthose studied.
This study found that thiamine deficiency is prevalent in elderly persons inIndonesia; with sub-optimal intake of Thiamine (0.4-0.5 mg compared toRDA of 1.2 mg); 31.7-42.4% of elderly also had low ETK.
Effects of the Economic Crisis on Micronutrient Status:
A: Effects of Indonesian Crisis onMicronutrient Status Findings

Indonesian Micronutrient Reference Report
72
(Study/ Survey Year and Authors Purpose)1. To evaluate the nutritional impact of Indonesia’s
drought and financial crisis of 1997/98. 2002.Block, Steven, et al.
1.The nutritional impact ofIndonesia’s drought andfinancial crisis of 1997/98 wasassessed using a survey ofhouseholds in rural CentralJava. An econometricapproach that distinguishedbetween time, age, and cohorteffects to a data set withfrequent time observations,was used.2. The price of food, includingthose high in micronutrients,increased dramatically. Onaverage households reducedconsumption of meat, eggs,dairy, fruits and vegetables.3. Blood hemoglobinconcentrations were used tolook at the quality of the dietduring the crisis.4. Hemoglobin concentrationsdeclined sharply during thecrisis. In absolute terms thedecline corresponds to a fallof .68g/dl over the entireperiod, which is greater thanone standard deviation for thefull sample. The time effectsand the levels betweenDecember 1996 and July 1998were statistically significant.5. While improving duringlate 1998; hemoglobin levelstended to stabilize at a post-April 1999 average that was.5g/dl lower than the level inthe initial round. By January2001, hemoglobin levels hadnot recovered to its pre-crisislevel.6. The crisis reversed whathad previously been a ten-yearof improving nutritional statusin Indonesia.See Appendix Table 10 andFigure 1

Indonesian Micronutrient Reference Report
73
Figure 12. To document the prevalence of anemia.
(2000). HKI1.The study was conducted in8 different cities/ provincesamong children aged 12-23months and non-pregnantwomen.2. The prevalence of IDA innon-pregnant women rangedfrom 22-47%, compared to20-30% before the crisis in1995.
3. To determine if the decreasing prevalence ofanemia among urban children indicates increasedaccess to micronutrient rich food. (2000). HKI
1. The prevalence of anemiaamong children aged 12-23months in urban slum areasdecreased from 55-85% inJanuary 1999 to 45-70% inJanuary 2000; indicating thatthe nutrition situation isimproving.2. The prevalence of anemiain non-pregnant women was20-30%, similar to the ratebefore the onset of the crisis.
Most of these studies indicate that Indonesia’s economic crisis of 1997/98had a negative impact on nutritional status, reversing 10 years ofimproving nutritional status in the country. One study indicates that ratesof anemia in urban slum children (from 1999 to 2000) have improvedsince the crisis. (See also summary conclusions on Iron Deficiency AmongVulnerable Groups)
Costs Relating to Micronutrient Supplementation1:
1 These tables are not Indonesia specific.

Indonesian Micronutrient Reference Report
74
1. Cost per Beneficiary per Year of Selected Micronutrient and OtherNutrition Interventions:Approximate Unit Costs of Interventions with Effects on Malnutrition
Intervention Cost/Beneficiary/Year (US$)Micronutrient fortification Iodine 0.05 Iron 0.09 Vitamin A 0.05-0.15Micronutrient supplementation Iodine 0.50 Iron (per pregnancy) 1.70 Vitamin A 0.20 Vitamin A (<5 yrs old)* 0.20Mass media education programs 0.20-2.00Breastfeeding promotion 2.00-3.00Education programs (home gardening, 5.00-10.00 growth monitoring, etc.)Community-based nutrition programs Less intensive 2.00-5.00 More intensive 5.00-10.00+Various Sources as cited in: Asian Development Bank. Asian Development BankNutrition and Development Series No. 1. Investing in Child Nutrition in Asia.1999.*Source: Institute of Medicine (1998) Prevention of Micronutrient Deficiencies.Washington DC: National Academy PressAs cited in Asian Development Bank. Asian Development Bank Nutrition andDevelopment Series No. 5. What Works? A Review of the Efficacy andEffectiveness of Nutrition Interventions. 2001. (ACC/SCN Nutrition Policy PaperNo. 19)
2. Cost Per Beneficiary Per Year of Food Fortificant to Meet One Thirdof RDA:
Cost of Food Fortification with Micronutrients(additive cost only)
Vitamin 1/3 RDA Cost/Person/Year ($)A (250 CWS) 1111 IU 0.073D (100 CWS) 133 IU 0.016E (50% CWS) 5 IU 0.139B1 0.47 mg 0.004B2 0.57 mg 0.013B6 0.73 mg 0.006Niacin 6.3 mg 0.019Folic Acid 66.7 mcg 0.001

Indonesian Micronutrient Reference Report
75
B12 1 mcg 0.014C 20 mg 0.055Note: Hoffman Laroche prices in November 1997As cited in:Asian Development Bank. Asian Development Bank Nutrition and Development SeriesNo. 1. Investing in Child Nutrition in Asia. 1999.
Appendix
Table 1: Selected Educational Indicators*:

Indonesian Micronutrient Reference Report
76
Selected Indicators 2000School Enrolment (%) Population aged 7-12 years 95.5Population aged 13-15 years 78.7Population aged 16-18 years 49.1Educational attainment of population aged 10 yearsand over (%) No schooling 9.66Some Elementary School 24.29Elementary School 32.45Junior High School 15.28Senior High School 18.32*Source: http://www2.bps.go.id/index.shtml
Table 2: Accessibility to Mass-Media*
Selected Indicators 1993 1994 1996 1997 1998 2000Percentage of population aged 10years and over who listen to radio
63.59 63.91 50.46 59.1764.5243.72
Percentage of population aged 10years and over who watch television
64.77 69.43 69.31 78.2288.7287.97
*Source: http://www2.bps.go.id/index.shtml
Table 3: Selected Health Care Indicators*Selected Indicators 1994 1995 1996 1997 1998 1999 2000
% birth delivery assisted bydoctor/midwife/other paramedic
43.61 46.13 50.01 53.87 51.81 63.00 63.50
% infants immunized
Percentage of population using traditionalmedicine
78.68
n.a
77.34
27.57
88.16
n.a
91.01
n.a
92.81
n.a
89.91
15.04
n.a
15.59
*Source: http://www2.bps.go.id/index.shtml**There are some changes in definitions and questionnaire contents, so that the 1995 figures are notcomparable with the previous
Table 4: Average Daily Per Capita Calorie Consumption*
Selected Indicators Unit 1990 1993 1996

Indonesian Micronutrient Reference Report
77
Average of daily per-capita calorie consumption(including rough estimation of calorie consumptionfrom prepared food)
Kcal 1983.23 2018.97 2019.79
Source: http://www2.bps.go.id/index.shtml
Table 5: Prevalence of Anemia in Pregnant Women*Province
No.
of
subjects
Prevalence
(%)
Ref.
West
Java
221
71.5
1
Central
Java
224
62.5
1
East
Java
176
57.8
1

Indonesian Micronutrient Reference Report
78
vaNorth
Sulawesi
115
48.7
1
Southeast
Sulawesi
867
67.4
2
East
Nusa
Tenggara
441
51.0
3

Indonesian Micronutrient Reference Report
79
aEast
Timor
382
64.7
3
Maluku
457
48.4
3
Irian
Jaya
426
38.0
3
National
63.5
1

Indonesian Micronutrient Reference Report
80
*SourceMuhilal,ImanSumarno,andKomari(1996)citing(1)InstituteforHealthRes

Indonesian Micronutrient Reference Report
81
Table 6: Prevalence of Anemia in Preschool Children*Province
No.ofsubjects
Prevalence(%)
Ref.
CentralJava
224
44.9
1
WestNusaTenggara
167
51.9
1
EastNusaTenggara
493
48.9
3
EastTimor
444
60.6
3
Maluku
443
48.8
3

Indonesian Micronutrient Reference Report
82
aluku
43
8.8
IrianJaya
399
35.8
3
National
55.5
1
*SourceMuhilal, ImanSumarno,andKomari(1996)citing(1)Institute forHealthResearch andDevelopmentandCentalBureauofStatistics(1992),(3)NutritionResearch andDevelopmentCentreandDirectorate ofNutrition(1991)

Indonesian Micronutrient Reference Report
83
Table 7: Prevalence of Anemia in Pregnant Women ByArea*Area
Staple
foods
Prevalence
(%)
Tanggerang
Rice
77
Serang
Rice
+
sweet
potato
56
Pinrang
Cassava
+
r
46

Indonesian Micronutrient Reference Report
84
ang
ava
+
rice
Soppeng
Rice
57
*Source:Sumarno,Muhilal,etal.(1996)

Indonesian Micronutrient Reference Report
85
Table 8: Iron Supplementation Coverage in SelectedDistricts*District
%coverage
Tanggerang
70.9
Serang
61.8
Pinrang
70.8
Soppeng
78.6
Kendari
54.6
Kolaka
46.7

Indonesian Micronutrient Reference Report
86
akaButon
46.5
Muna
30.8
*Source:Sumarno,Muhilal,etal.(1996).CitingNutritionResearchan

Indonesian Micronutrient Reference Report
87
searchandDevelopmentCentreandDirectorateofCommunityNutrition(1993)andDepart
Indonesian Micronutrient Reference Report
88
andDepartmentofHealth,ProvincialOfficeofSouth-EastSulawesiandNutritionResearch

Indonesian Micronutrient Reference Report
89
ResearchandDevelopmentCentre(1994).

Indonesian Micronutrient Reference Report
90
Table 9: Characteristics Relating to Number of Iron TabletsConsumed During Pregnancy (Table 10.5 from Indonesian DHS, 1997)

Indonesian Micronutrient Reference Report
91
Table 10: Price Changes for Selected Foods, January 1997to October 1998 as reported in Block et al. 2002

Indonesian Micronutrient Reference Report
92
Table 11: Distribution and Capacity of Salt Producers byRegion*
*Source: East Asia and Pacific Regional Office Country Department III. (1996).

Indonesian Micronutrient Reference Report
93
Figure 1: Effect of Economic Crisis on Consumption Patternsof Eggs, Oil and Dark Green Leafy Vegetables*
*Figure 1: As reported in Block et al. 2002.

Indonesian Micronutrient Reference Report
94
Figure 2: Goals for the Reduction of Iron Deficiency inIndonesia*
(Prevalence of iron deficiency anemia among pregnant women, under-fivechildren, and female workers in Indonesia in 1993 and aims for reduction of
prevalence of iron deficiency until2018)
* Source: Kodyat et al. 1998.

Indonesian Micronutrient Reference Report
95
Works Cited:
ACC/SCN. Controlling iron deficiency. ACC/SCN state-of-the art series. Geneva:ACC/SCN, 1991. (Nutrition policy discussion paper no. 9). As cited by W. Schultinkand D. Dillon. 1998.
Almasyhuri, M. Saidin, dan Sukati. Penyerapan ferro sulfas yang diminum bersamaandengan menu makanan pokok beras, jagung serta singkong dengan vitamin C ataupepaya: Suatu uji penyerapan secara in- vitro. PGM 21: 99-103, 1998.
Amalia L, Hardinsyah. Konsumsi Gula Penduduk Indonesia dan peluangnya. Paperpresented in Kongres Nasional dan Temu Ilmiah Persagi XII, Jakarta, 8-10 Juli 2002.
Ance Murdiana Dahro, et al. Masalah Anemia di empat Provinsi wilayah IndonesiaBagain Timur. Gizindo Vol. XVI No. 1 / 2: 09-14, 1991.
Angeles-Agdeppa I, et al. Weekly supplementation to build iron stores in femaleIndonesian adolescents. Am J. Clin Nutr 1997; 66: 177-83. As cited in De Pee, Saskia,et al. 1998.
Anies Irawati. Kadar zat iodium dari garam beriodium selama proses pengemasanpenyimpanan dan penanganan di rumah tangga di wilayah Bogor. PGM 16: 38-44, 1993.
Aritonang I., et. al. Perlakuan Dalam Proses Pemasakan Sayuran UntukMempertahankan Stabilitas Iodium dalam Garam Beriodium Rumahtangga Pada DaerahEndemik Gondok di Yogyakarta. Paper presented in Kongres Nasional dan Temu IlmiahPersagi XII, Jakarta, 8-10 Juli, 2002.
Atiek W. and Endy Paryanto P. The Prevalence and risk factors of anemia. Gizindo Vol.XXV 20-29. 2001
Block, Steven, et al. Did Indonesia’s Crisis of 1997/ 98 affect child nutrition? A cohortdecomposition analysis of national nutrition surveillance data. Tufts Nutrition FoodPolicy and Applied Nutrition Program. Discussion Paper No. 5http://nutrition.tufts.edu/pdf/publications/fpan/wp05-indonesia_crises.pdf. 2002.
Cornelia The study on salt consumption at HH level and knowledge of mothers aboutIDD and iodized salt in Sukabumi District, West Java. (SEAMEO). 1996
Department of Health, Provincial Office of South-East Sulawesi and Nutrition Researchand Development Centre. Study of anemia in pregnant women and underfives forplanning program for combating anemia in the second step of long term development.Bogor: Nutrition Research and Development Centre, 1994. As cited by Muhilal, ImanSumarno, and Komari

Indonesian Micronutrient Reference Report
96
Department of Health, Republic of Indonesia. Survei kesehatan rumah tangga (SKRT)1995, survei morbiditas maternal (household survey, survey of maternal morbidity).Jakarta: National Institute for Health Research and Development, Ministry of HealthRepublic of Indonesia, 1995. As cited in De Pee, et al 1998.
Dewi Permaesih, et al. The Profile of Iodized Salt Use in The District Level inIndonesia. Gizindo Vol. XXIV 25-31, 2000.
Dijkhuizen M.A. et. al. Concurrent Micronutrient Deficiencies in Lactating Mothers andTheir Infants in Indonesia. Dissertation, University of Wageningen, the Netherlands,2001.
Djamaludin M.D. et. al. Hubungan Antara Tingkat Pendapatan Keluarga dan perilakuKonsumsi Garam Beriodium Dengan Mutu Konsumsi di Tingkat Rumahtangga. MediaGizi & Keluarga 26 (1): 114-125, 2002.
Djoko Kartono, et al. Urinary Iodine Concentration and Iodized Oil Capsule DistributionAmongst Pregnant Women. Gizindo Vol XXIV 17-23, 2000.
East Asia and Pacific Regional Office Country Department III Population and HumanResources Division. Staff Appraisal Report: Indonesia Intensified Iodine DeficiencyControl Project (Document of the World Bank Report No. 15639-IND). 1996
Endi Ridwan, et al. Prevalensi gondok endemik pada anak sekolah dan ibu hamil diwilayah Indonesia Bagian Timur. Gizindo Vol. XVI No. 1 /2: 21-27, 1991.
Endi Ridwan. Effect of weekly iron supplementation in pregnant women. (SEAMEO).1995
Fahmida U. Comparison of compliance with iron tablet ingestion among fertile agewomen when distributed through health workers or religious leaders. Thesis,SEAMEOTROPMED Center Indonesia, Jakarta, 1997. As cited in W. Schultink and D.Dillon,1998.
Faraja Paul C. Anemia and its determinant factors among school children 6-10 years inAlor District, East Nusa Tenggara Province, Indonesia. (SEAMEO). 2001
Fitrah Ernawati, et al. Kebutuhan ibu hamil akan tablet besi untuk pencegahan anemia.PGM 23: 92-98, 2002.
Food and Nutrition Bulletin 1997; 18: 64-70. As cited by W. Schultink and D. Dillon.1998.
Gross R, Angeles-Agdeppa I, Schultink JW, Dillon D, Sastroamidjojo S. Daily versesweekly iron supplementation, programmatical and economic implication for Indonesia.

Indonesian Micronutrient Reference Report
97
Gross, Ranier, PhD; et al. Suggested Actions For Iron Deficiency Control in Indonesia.Nutrition Research, Vol 18, No. 12, pp 1965-1971, 1998.
Gunanti I.R., et al. Idnetifikasi Masalah Gangguan Akibat Kekurangan Yodium (GAKY)di daerah dataran Rendah. Paper presented in Kongres Nasional dan Temu IlmiahPersagi XII, Jakarta, 8-10 Juli 2002.
Hadi, H. Jamil M.D., Susetyo D., Wahyuni. Improving Compliance of Iron Pill ofPregnant Women: The Importance of Husband Role. Paper Presented in KongresNasional dan Temu Ilmiah Persiagi XII, Jakarta, 8-10 Juli, 2002.
Hadju, V. et al. Opportunites to Improve the Effectiveness of Posyandu in Indonesia toDeliver Vitamin A Supplementation, Counsel Mother and Provide Basic Health Services.J. Nutrition 132 (9S): 2977S, September 2002.
Hartini, Titin. The efficacy of different regimens of iron supplementation among femalefactory workers in West Java, Indonesia. (SEAMEO) 2000
Hidayat W. Pengembangan Program Penanggulangan Anemia Pada Ibu Hamil MlaluiSuplementasi Besi di TTS. Laporan Penelitian Puslitabang Yantekkes, 1993.
HKI. Indonesia Crisis Bulletin 1 (3): 4-16, October. 1998.
HKI Indonesia Crisis Bulletin 1(8): 37-40, December 1999.
HKI. Indonesia Crisis Bulletin 2 (1): 41-44, January 2000.
HKI. Indonesia Crisis bulletin 2 (3): 49-52, March 2000.
HKI. Maternal Postpartum Vitamin A Supplementation, Increased Intake of Vitamin A-Rich Foods and early Childhood Survival in Central Java. The Central Java Project, HKISpecial Report, 1997.
Indonesia Demographic and Health Survey. Indonesia Central Bureau of Statistics (CBS)and State Ministry of Population/ National Family Planning Coordinating Board andMinistry of Health and Macro International Inc (MI). Calverton, Maryland: CBS and MI1997.
Iman Sumarno, et al. Dampak suplementasi pil besi + folat dan vitamin C terhadappeningkatan kadar Hb pada ibu hamil anemia. PGM 19: 12-19, 1996.
Iman Sumarno, et al. Kwalitas garam, perilaku pembelian garam, serta kadar yodiumdalam urin ibu hamil di Jawa Barat. PGM 20: 79-90, 1997
Iman Sumarno. Status yodium tubuh anak Sekolah Dasar dan ibu hamil di 25 Dati II diProvinsi Jawa Barat. PGM 21: 66-77, 1998.

Indonesian Micronutrient Reference Report
98
Institute for Health Research and Development and Central Bureau of Statistics. Nationalhousehold health survey. Bogor: Institute for Health Research and Development, 1992.As cited in Sumarno, Muhilal, et al. 1996.
Jamil M.D. et. al. Pengaruh Pendidikan Gizi pada Suami Terhadap Kepatuhan MinumPil Besi dan kadar Hb Ibu Hamil di Wilayah Kabupaten Bantul, D.I. Yogyakarta Tahun2000. Paper presented in Kongres Nasional dan Temu Ilmiah Persagi XII, Jakarta, 8-10Juli. 2002.
Jansen AAW, Luyken R. Anemia in poor hill West Irian. Trop Geogr Med 1960; 12:145.
Judhiastuti F. The efficacy of weekly versus menstrual period iron supplementationamong female adolescent students in Kupang Indonesia. SEAMEO. 1999
Juliawati. Nutritional status and work productivity of female cigarette industrial workersin Kudus District, Central Java Province. (SEAMEO). 1994
Kodyat B, et al. Iron Deficiency in Indonesia: Current Situation And Intervention.Nutrition Research, Vol. 18, No. 12, pp. 1953-1963, 1998.
Komang Agusjaya Mataram, et. al. Studi pembuatan “Lala Chip” Camilan TinggiYodium. Paper presented in Kongres Nasional dan Temu Ilmiah Persagi XII, Jakarta, 8-10 Juli 2002.
Krisdinamurtirin Y, et al. Prevalensi anemi dan keadaan gizi penduduk sekitarlingkungan pabrik semen di Citeureup Kabupaten Bogor. PGM 17: 40-51, 1994.
Kusin JA, Kardjati S, Suryohudoyo P. Anemia and hypovitaminosis A among ruralwomen in East Java, Indonesia. Trop Geogr Med 1980; 32:30-39.
Latief, D. et al. Up-scaling the Effectiveness of Indonesia’s Nutrition Strategy throughPosyandu Revitalization Including the Expansion of Vitamin A Supplementation andProvision of Fortified Complementary Food. J. Nutrition (9S): 2978 S, September 2002.
Latief, D. et al. Vitamin A Program in Indonesia: Acceleration Activities During theEconomic Crisis Period and the Move Towards Decentralization. J Nutrition 132 (9S):2978S, September 2002.
Lukito, W. Anemia Gizi dan Strategi Penanggulangannya. Paper presented in KongresNasional dan Temu Ilmiah Persagi XII, Jakarta, 8-10 Juli 2002.
Martoatmodjo S, Abunain D, Muhilal, Enoch M, Husaini MA, Sastroamidjoyo S.Nutritional anemia among pregnant women and food consumption pattern. PenelitianGizi den Makanan 1973;3:22-é41. As cited in Sumarno, Muhilal, et al.

Indonesian Micronutrient Reference Report
99
Mothercare. The alleviation of maternal anemia in Indramayu regency, Indonesia: resultsfrom the Mothercare project. Mothercare Matters. Newsletter and literature review onmaternal and neonatal health and nutrition 1994; 4: 2-4
Muhilal, et al. Masalah Kekurangan Vitamin A dan Xeroftalmia di Empat Provinsiwilayah Indonesia Bagain Timur. Guizindo Vol XVI No. 1/ 2 01-08, 1991.
Muhilal, Permaeshi D, Idjradinata YR, Muherdiyantinigslh, Karyadi D. Vitamin Afortified MSG and health, growth, and survival of children: A controlled field trial. Am JClin Nutr 1988; 48: 1271-1276
Muhilal, et al. Perubahan prevalensi gondok dari tahun 1980 sampai tahun 1998. PGM22: 1-4, 1999.
Muhilal, et. al. National Survey on Iodine Deficiency Disorders (IDD) 1996-1998.Gizindo Vol. XXIV 01-08, 2000.
Muslimatun, Siti. IDD status of school age children (8-10 years) after introduction ofiodine supplementation program in Solok District West Sumatera. (SEAMEO).1996
National Household Survey 1993. Health Research and Development Centre, Ministry ofHealth and Bureau of Statistics, Jakarta, 1994. “Survei Kesehatan Rumah Tangga
Nutrition Research and Development Centre and Directorate of Community Nutrition.Study on the assessment of nutritional anaemia. Bogor: Nutrition Research andDevelopment Centre, 1993. As cited in Sumarno, Muhilal, et al. 1996
Nutrition Research and Development Centre and Directorate of Nutrition. Eastern islandnutrition status prevalence study. In-country report. Bogor: Nutrition Research andDevelopment Centre, 1991. As cited in Sumarno, Muhilal, et al.
Nutrition Research and Development Centre and Directorate of Community Nutrition.Study on the assessment of nutritional anaemia. Bogor: Nutrition Research andDevelopment Centre, 1993. As cited by Source Muhilal, Iman Sumarno, and Komari
Palupi L, Schultink W, Achadi E, Gross R. Effective community intervention to improvehemoglobin status in preschoolers using once-weekly iron supplementation. American JClin Nutr 1997; 65: 1057-1061.
Permeisih D, Idjradinata YR, and Karyadi D. Vitamin A-fortified monosodium glutamateand health, growth, and survival of children: a controlled field trial. American Journal ofClinical Nutrition, Vol 48, 1271-1276
Rahayuningsih, Sri. Factors influencing the iron status of pregnant women taking ironpills. (SEAMEO). 1999
Saidin, M, et al. Konsumsi Bumbu Penyedap Masakan di Pedesaan: Suatu Studi untukDasar Penetapan Fortifikasi Vitamin A. Gizindo Vol. XV No. 1: 14-22. 1990.

Indonesian Micronutrient Reference Report
100
Saidin M, Alamsjhuri, Muhilal. Potential of jamu/ramunan (traditional medicine) forpreventing and tackling anemia. Penelitian Gizi dan Makanan 1991; 14: 79-85. As citedin De Pee, et al. 1998.
M. Saidin, et al. Efektivitas fortifikasi mie instan dengan zat besi dan vitamin A terhadappeningkatan kadar Hb dan feritin serum ibu hamil. PGM 18: 17-28, 1995.
M. Saidin, et. al. Efekifitas suplementasi pil besi dua kali seminggu dan satu kali seharipada ibu hamil. PGM 20: 102-109. 1997.
Saidin, dan Sukati. Pengaruh pemberian pil besi dengan penambahan vitamin terhadapperubahan kadar Hb dan feritin serum pada wantia remaja. PGM 20: 91-101, 1997.
M. Saidin, et. al. Ketersediaan hayati zat besi, kandungan zat pemacu dan penghambatpenyerapan zat besi dalam makanan ibu hamil. PGM 21: 109-115, 1998.
Sari, M., Bloem, M. W., de Pee, S., Schultink, W. J., & Sastroamidjojo, S. Effect of Iron-Fortified Candies on the Iron Status of Children Aged 4-6 in East Jakarta, Indonesia. AmJ Clin Nutr 2001;73 (6): 1034-9. IDPAS# 677
Schultink and D. Dillon. Supplementation strategies to alleviate iron deficiency:experiences from Indonesia. Nutrition Research, Vol 18. No. 12, pp 1943-1952, 1998.
Schultink W, Gross, R. Iron deficiency alleviation in developing countries. NutritionResearch Reviews. 9:281-293. 1996.
(SKRT) 1993. Bandan Penelitian dan Pengembangan Kesehatan, Departemen Kesehatandan Biro Pusat Statistik, Jakarta, April 1994. As cited in De Pee, et al, 1998.
Setiarini, Asih. Evaluation of iron supplementation program among under five children(UC) in East Nusa Tenggara, Indonesia. (SEAMEO). 1998
Soekarjo D, Bloem MW, dee Pee S, Muhilal, Schreurs W. Prevalence of anemia amongfemale adolescents, aged 12-16 yrs old, in East-Java, Indonesia. In preparation.As cited in De Pee, Saskia, et al. 1998.
Sukati S., et al. Prevalensi anemia anak sekolah dasar di daerah penghasil dan bukanpenghasil sayuran hijau di Kabupaten Bogor. PGM 16: 81-93, 1993.
Sukati, Saidin, and Muhilal. Status anemia dan status besi anak sekolah dasar diKabupaten Bogor. PGM 17: 52-58, 1994.
Sukati, et al. Dampak fortifikasi mie instan dengan vit. A dan zat besi terhadap status vit.A dan status besi anak Balita. PGM 18: 38-49. 1995.
Sumarno, Muhilal, et al. Review of Surveys and Supplementation Studies of Anemia inIndonesia.. (1996). FNB 17: 3-10. IDPAS# 326

Indonesian Micronutrient Reference Report
101
Sunarko. Anemia Gizi: Status Kini dan Harapan di Masa Datang. Paper presented inKongres Nasional dan Temu Ilmiah Persagi XII, Jakarta, 8-10 Juli 2002.
Sunawang, et al. Public Awareness and Participation in the IDD Elimination Program inIndonesia. Gizindo Vol. XXIV 09-16, 2000.
Thorand B, Schultink W, Gross R, Sastroamidjojo S, Wentzel S. Efficacy of the ironsupplementation program for pregnant women in Jeneponto, South Sulawesi, Indonesia.Asia Pacific Journal of Clinical Nutrition 1994; 3:211-215.
Uken S. Soetrisno, D.S. Slamet, dan Hermana. Fortifikasi mi dengan zat besi. PGM 14:116-120, 1991.
Uken SS. Soetrisno. Kandungan Yodium Tersisa dalam garam Konsumsi Selamapenyimpanan di Rumah Tangga. Gizindo Vol. XXII 93-100, 1997.
Umi Fahmida. Compliance with iron tablet intake of women in child-bearing age: Theinfluence of distribution channels. (SEAMEO).1997
Wahyuni T. Pengaruh Supervisi Bidan Pada Ibu Hamil terhadap Kepatuhan MinumTablet Besi, Kadar Hemoglobin, dan Bert Lahir di Kabupaten bantul, Yogyakarta.Pengaruh Supervisi Bidan Pada Ibu Hamil terhadap Kepatuhan Minum Tablet Besi,Kadar Hemoglobin, dan Bert Lahir di Kabupaten bantul, Yogyakarta. Paper presented inKongres Nasional dan Temu Ilmiah Persagi XII, Jakarta, 8-10 Juli, 2002.
Widardo. Effect of Selenium in addition to Vitamin A and iodine supplementation on thegoiter size in school children in Central Java. (SEAMEO). 1998
Widiyanto SYD et. al. Hubungan Pengetahuan, Sikap, dan Praktek Ibu Hamil DenganKepatuhan Minum Tablet Besi di kabupaten Bantul, Yogyakarta. Paper presented inKongres Nasional dan Temu Ilmiah Persagi XII, Jakarta, 8-10 Juli, 2002.
Wigati, Sri. The efficacy of iron supplementation using bread as vehicle on iron status ofpreschoolers in Surabaya, East Java. (SEAMEO). 2000
Wijaya, Maria. Efficacy of multi micronutrient and single iron supplementation on ironstatus of Indonesian infants aged 6-12 months old. (SEAMEO. 2001
Wirjatmadi, B. Goiter in Low Land and Coastal Areas in East Java: Is it IodineDeficiency Disorder? Paper presented in Kongres Nasional dan Temu Ilmiah PersagiXII, Jakarta, 8-10 Juli, 2002.
Yuniar Rosmalina, Faisal Anwar, and Muhilal. Alternatif cara deteksi kandungan iodiumpada garam beriodium di pasar. PGM 14: 87-98, 1991.

Indonesian Micronutrient Reference Report
102
Yuniar Rosmalina, et al. Dampak penggunaan “Slow Released Rhodifused-Iod” untukiodisasi air terhadap kandungan iodium air minum, urine anak sekolah dan ibu hamil.PGM 17: 1-11, 1994.