food prices and marketing intermediaries: evidence from...
TRANSCRIPT
Food Prices and Marketing Intermediaries: Evidence from a PolicyExperiment in Edible Oils Market in Bangladesh
M. Shahe Emran1
IPD, Columbia University
Dilip MookherjeeBoston University
Forhad ShilpiDECRG, World Bank
M. Helal UddinUniversity of Dhaka
Preliminary Draft: March 29, 2013
Comments Welcome
1We would like to thank Wahiduddin Mahmud for helpful discussions at various stages of this project.The project was financed by IGC Bangladesh country program.
ABSTRACT
The dramatic increase in food prices in the international market in 2007-2008 attracted alot of attention. It is a widely held belief among politicians, bureaucrats and general popu-lation in developing countries that collusion especially among the traders and the resultingmarket power are largely responsible for such price spirals in the food markets. Manygovernments are thus considering interventions in the food markets. In 2011, Bangladeshgovernment implemented a policy that banned the so-called Delivery Order (DO) layer ofthe edible oil market, arguing that market power due to collusion and harmful speculationat this layer of the market was responsible for the price spiral observed in the market.The DO layer of the market is similar to a forward market with flexibility in executing thetransactions. The DO system was replaced by a system called Sales Order (SO), wheredealers directly appointed by the refiners would get the oil to the other wholesalers andretailers bypassing the DO layer. The policy reform aimed to reduce the perceived marketpower of marketing intermediaries and curb price speculation. We provide evidence on theeffects of the policy reform on the marketing margin of traders at two interfaces in themarketing chain: between the world market and wholesalers, and between the wholesalersand retailers. If the reform were successful in reducing the market power of the tradingintermediaries, we would expect lower marketing margins following the reform. To identifythe effects of the policy reform, we develop a difference-in-difference (DID) strategy, usingwheat as the comparison commodity. Wheat shares some important features with edibleoil that are relevant for our analysis; both are primarily imported commodities, involvesubstantial transport costs, and are non-perishable and thus easy to store. We provide evi-dence on the validity of the parallel trend assumption underlying the DID design using longtime series data available before the policy intervention for both edible oil and wheat mar-keting margins. Additional evidence supporting the DID design is reported from a placebotest. The results from the empirical analysis show that (i) counter to the expectations ofthe policy makers, the marketing margins increased in the first six months following thepolicy reform; and (ii) in the longer term, the marketing margins reverted back towards thelevel observed before the policy reform. We provide some tentative explanations for thisunexpected behavior of the marketing margins in edible oils market following the policyreform.
Introduction
Price behavior of essential food items in a developing country such as Bangladesh has im-
portant economic and political implications. Most of the households in developing countries
have limited risk coping mechanisms, and their budgets are dominated by food expenditure.
An increase in the level and volatility of food prices may thus cause substantial welfare loss
for a large segment of the consumers, evoking strong reactions, including protests and food
riots. Price trends of essential commodities, as a result, are both important in political
discourse and high in policy agenda in developing countries.
Naturally, the dramatic increase in food prices in the international market in 2007-2008
attracted a lot of attention all over the world from the press and policy makers alike. It is
a widely held belief among politicians, bureaucrats and general population in developing
countries that collusion especially among the traders and the resulting market power are
largely responsible for such price spirals in the food markets. For example, in a seminar or-
ganized by Bangladesh Institute of Development Studies in February 2010, both the finance
minister and commerce minister of Bangladesh Government identified monopoly power and
price fixing by cartels (called “syndicate”) as the salient factors behind the observed rise
in prices of food essentials such as edible oil, sugar and onion (”Minister Blames Price
Hike on Syndicates”, Daily Star, February 24, 2010). Similarly, Kaushik Basu, the then
chief economic advisor to Government of India, pointed out monopolistic practices (car-
tels) and speculative storage (hoarding) as drivers of the recent dramatic increase in onion
price (Reuters, January 5, 2011). The distrust of marketing intermediaries is, however,
not new, or idiosyncratic to developing countries. Throughout the history, the monopoly
power of marketing intermediaries has been identified as one of the most important sources
of high food prices, and the speculators as the evil agents who add no value to the society,
3
but destroy the stability of the market.2 The governments have implemented measures to
rein in the speculators and curb the market power of the traders. For example, in USA,
the Hatch bill imposed a 10 percent tax on all futures market transactions in 1892, and
Chicago onions futures was banned in 1958, which remains in place to date, and Berlin
wheat futures in Germany was prohibited in 1897. In the more recent past, the distrust of
the private traders and speculators led to the establishment of marketing boards in most
of the developing countries in 1950s and 1960s. However, disappointing results with the
marketing boards and other parastatals in commodity markets led to agricultural mar-
ket liberalization starting from late seventies. Interestingly, the lack of trust in the role
of traders and speculators in the commodity markets remains widespread and deeply in-
grained, and the recent price spiral in international markets has brought the focus back on
the role of traders and speculators in developing countries.
Like in many other developing countries, the 2008 food price shock reignited the popular
resentment against the traders and speculators in Bangladesh, and the government initiated
policy measures to restraint the perceived monopoly power of traders and to reduce or
eliminate ‘destabilizing’ speculation. The government identified the middlemen in the edible
oil market called DO traders (Delivery Order traders) as the locus of market power and
destabilizing speculation.3 In a policy move in March 2011, the DO trading was prohibited
by the Bangladesh Government, and it was replaced by a Sale Order (SO) system, where
the edible oil refiners would bypass the speculators in the DO layer, and directly deal with
2The sentiments were shared by most, from Aristotle to Lincoln to Lenin. For example, AbrahamLincoln said “For my part, I wish every one of them (speculators) had his devilish head shot off.” (asquoted in Carpenter (1866, p. 84)), and Lenin concluded: “For as long as we fail to treat speculators theway they deserve—with a bullet in the head—we will not get anywhere at all.” ((Lenin, 1964, p. 311).)
3A DO is a sales receipt issued by the refiner with the quantity of oil specified on it (30-45 drums ofoil, each drum containing 150 maunds), to be deliverable after a specified time period (usually 2 weeks).However, most of the DOs in recent years did not have a specified delivery date, only the quantity wasspecified.
4
the wholesale traders. The refiners were asked to appoint the dealers (wholesalers) in each
marketing area. The existing DOs were to be phased out in 90 days, and replaced by the
SO system with its network of appointed dealers. The SO system came into effect in June
21 2011.
This paper provides an analysis of the effects of the policy change from DO to SO
system on the marketing margins at two different segments of the edible oil marketing
chain: (i) from world market to wholesale, and (ii) from wholesale to retail. The first
segment includes the oil refiners and the DO traders (henceforth DOTs), and thus was
the focus of government policy interventions in 2011. If the policy reform was successful
in reducing the market power of the refiners and DO traders, one would expect lower
marketing margin at this level, i.e, the margin between world price and wholesale price
should decline after the policy reform. The wholesale to retail margin can be viewed as
an indicator of market power at the wholesale level, and the relevant question is: did
the network of appointed dealers reduce the marketing margin for the wholesalers? Our
analysis is focused on the marketing margins in Palm oil which accounts for about 70-75
percent of the domestic consumption of edible oil in Bangladesh in an average year. While
a higher marketing margin is usually taken as an indicator of increased market power, we
discuss a number of alternative explanations for the observed changes in the marketing
margins after the announcement and implementation of the SO system in place of the DO
system.
Although there has been a renewed interest in the domestic food markets in developing
countries in response to the price shocks in the international market, most of the studies
have focused on the effects of higher international prices on domestic prices (pass-through)
and the implications of higher consumer prices on poverty.4 To the best of our knowledge,
4See, for example, Ivanic et al. (2012), Wodon and Zaman (2010), and Minot and Dewina (2013).
5
none of the recent studies spurred by the international price rise in 2007-2008 have examined
rigorously the impacts of policy interventions by the government in the marketing chain
on the marketing margins. As these types of policy interventions are being considered or
implemented by other developing countries, a careful study of the Bangladesh case will be
useful to the policy makers and analysts in other similar developing countries.
To estimate the effects of the policy change on the marketing margins in palm oil
market, we develop a difference-in-difference (DID) approach, with wheat as the comparison
commodity. Wheat is an excellent choice for a comparison commodity in our application for
at least two reasons. First, both wheat and palm oil are primarily imported in Bangladesh
with little or no domestic production; thus international market plays an important role
in both. Second, both palm oil and wheat are easily storable, because they do not need
cold storage. Third, they are bulky, necessitating substantial transport charges. Hence
fluctuations in transport or storage costs would apply in a broadly similar way to the
distribution costs of oil and wheat.5 We provide formal evidence on the credibility of our
DID approach using a test of the parallel trend assumption, and a falsification exercise.
The availability of long time series data before the policy intervention allows us to test
the validity of the parallel trend assumption by using fictitious policy reform date. Taking
advantage of the rich time series data from the pre-intervention period, we take into account
the implications of the world market cycle for our difference-in-difference design, because
the marketing margins seem to depend critically on the phase of the international market
(upswing vs. downswing) in a way consistent with imperfect pass-through into the domestic
prices. The falsification exercise is based on a difference-in-difference estimate for lentil
as the “placebo treatment” commodity in place of palm oil. Lentil is appropriate as a
5One might argue that wheat is more transport and storage ‘intensive’ in the sense that storage andtransport costs constitute a larger fraction of the price for wheat. We discuss the implications of this laterin the paper.
6
placebo commodity, because (i) like palm oil, the domestic demand is met primarily by
imports (more than half), and (ii) the policy change did not affect its marketing chain,
from importers to wholesalers to retailers, in a significant way.6 Also, similar to oil and
wheat, lentil is easily storable (not perishable), and bulky requiring substantial transport
charges. For a fuller discussion of the empirical approach, please see section 2 below.
The empirical results from the difference-in-difference approach show that, contrary to
the expectations of the government and general people, the policy reform failed to reduce
the marketing margins at both the world-wholesale and wholesale-retail segments of the
marketing chain of palm oil; marketing margins actually increased after the announcement
and implementation of the reform. However, the evidence also indicates that the mar-
keting margins started to decline after the first six months of the policy implementation,
suggesting a reversion back to the pre-intervention levels. The paper concludes with some
preliminary explanations for the observed behavior of marketing margins in the short and
long terms following the policy reform. However, a proper analysis of the the causes un-
derlying the apparently perverse response (opposite to that intended by the policy reform)
of the marketing margins is beyond the scope of this paper, and requires a separate study.
(2) Related Literature
As noted in the introduction, to the best of our knowledge, there is no empirical study
in the context of Bangladesh or other developing countries that analyzes the effects of gov-
ernment intervention that bans the middlemen and speculators on the marketing margins.
However, there is a substantial literature on the functioning of commodity markets in de-
veloping countries in general, and also in the specific context of Bangladesh. The literature
on food markets in developing countries has traditionally focused on the spatial integration
6For example, the Government did not establish a distribution system based on appointed dealers forimported lentil.
7
(see, for example, Ravallion (1986), Baulch (1997)), and on the effects of government stabi-
lization policy such as procurement, and price and non-price interventions at the domestic
and international levels (see, for example, Newbery and Stiglitz (1981), Islam, and Thomas
(1996), Byerlee et al. (2006)).
In the context of Bangladesh, the focus of the research and policy analysis has been
on the functioning of the rice market and price stabilization (see, for example, Ahmed and
Bernard (1989), Goletti et al. (1995), and Chowdhury (1992), Murshid (2011)). Mahmud
et al. (1994) analyze constraints on crop diversification in Bangladesh agriculture. Among
the available studies, Chowdhury (1992) and Farid and Rahman (2002) discuss the mar-
keting chain in the rice market, and indicate the presence of market power on the basis of
descriptive statistics. Rahman et al. (2008) and CPD (2007) provide descriptive analysis of
the food price inflation and suggest possible market power exerted by the miller, refiner and
large wholesalers. However, they do not provide any formal analysis of the market structure
and do not present any rigorous test for the existence of market power or collusion.
The evidence on the functioning of the edible oils market in Bangladesh is extremely
limited; we are aware of only one study that focuses on the role of marketing intermedi-
aries in the edible oils market in Bangladesh (Uddin and Taslim (2010)). They discuss the
operation of the different layers of the edible oil market, and attempt to provide evidence
on collusion using cointegration and a equality of variance of prices test between world
and domestic prices. However, they are aware of the limitations of such tests for identi-
fying market power and collusion. They characterize the refiner layer of the market as an
oligopoly with potential for anti-competitive practices.
8
(2) The Marketing Chain in the Palm Oil Market and the Policy
Change
(2.1) Marketing Chain of Palm Oil Before the Policy Reform
Here we provide a brief description of the marketing chain in the palm oil market in
Bangladesh before the policy intervention in June 2011(for a more detailed discussion, see
Uddin and Taslim (2010)). The palm oil market consists of four layers: the refiners, the
delivery order traders (henceforth DOTs), the wholesalers, and retailers. The refining seg-
ment is highly concentrated, there are only nine refinery groups, and observers believe that
there is excess capacity (Uddin and Taslim (2010)). The refiners import crude palm oil
from Malaysia and Indonesia and refine it. Most of the refined palm oil goes through the
DOTs, although some wholesalers can buy directly from the refiners with cash payments.7
It is attractive for the wholesalers to buy oil from the DOTs for two reasons: (i) DOTs
buy in bulk and get price discounts from the refiners, part of which they can share with
the wholesalers, and (ii) a significant proportion of sales by DOTs to the wholesalers are
on credit. The DOTs buy the oil deliverable by the refiner after a stipulated period of time
(usually 2 weeks). It is important to appreciate that the DOTs do not own any storage
and thus do not take delivery of the oil. The DO layer of the market interacts both verti-
cally with the wholesalers downstream, and also horizontally with other DOTs (relatively
smaller DOTs buy from the large DOTs). The horizontal transactions among the DOTs
have evolved into something like an organized commodity exchange in Moulovibazar in
Dhaka and Khatunganj in Chittagong where speculators operate with the help of brokers.
However, note that the DO system is not a futures market, because there is no ”settlement
7A small proportion of palm oil (super palm) is bottled and sold through a separate network of agenciesprimarily used for soybean oil distribution. Our focus is on the loose palm oil that consists of about 95percent of the palm oil market.
9
at the end of the day” (it is not marked to market). Also, unlike a futures contract, the
payment is made at the time of the contract, not at the delivery date. The fact that
the DOTs pay ahead of the physical delivery implies that the refiners effectively get zero
interest short-term loans. It is common for a refiner to sell DOs as soon as the letter of
credit for import of the palm oil is opened, although it takes 4-6 weeks to get the crude
oil from Malaysia and Indonesia. The DO is also not a standard forward contract, because
the stipulated delivery date is almost never enforced. Thus the DO contract resembles
something like an American call option, but it is more flexible because there is no fixed
date for execution of the contract. In some cases, a DO may not be executed for more than
a year. This implies that the DOTs or other DO holders bear less price risk compared to a
standard forward contract.8 Also the refiner can sell more DOs than they have inventory
for, given the fact that there will always be a certain fraction of DOs held by the DOTs
or others for speculative purpose. However, note that it increases the uncertainty in their
storage decisions, a refiner might face stock-outs when the demand for physical delivery
increases in response to a decline in the world market price. The informal discussions with
the DOTs reveal that some large refiners such as City group are better able to meet such
surge in demand for delivery because of their large refining and storage capacity. The oil
prices for different refiners seem to reflect this uncertainty in physical delivery during peak
demand.
(2.2) The Policy Reform
The policy reform focused on the DO layer of the market. The law banning DO trans-
actions and instituting SO dealers in its place was passed in March 23 2011, and 90 days
were allowed to implement the policy change, implying that the Standard Rules of Origin
8Large wholesalers also hold DOs for price speculation.
10
(SRO) implementing the law came into effect on June 21, 2011.
It was argued by the government and popular media that in the DO system a few big
players manipulate the market by strategically buying, holding and selling DOs. Under the
SO system, there are dealers for each “marketing area” selected by the refiners, and a dealer
is allowed to buy oil commensurate with the size of the market. This is expected to break
the “large player” problem. In total, 7388 dealers for edible oil were appointed by different
refiners; City group playing a dominant role with 3796 dealers. A refiner was allowed to
demand 200,000 taka as security money for accepting a trader for the dealership, but the
City Group which appointed more than half of all dealers did not require any such security
deposit.9 To reduce the scope for speculation, government mandated that unlike DO, the
new SO would have to take physical delivery in 15 days. This, if enforced, would make
the SO work more like a standard forward contract, and thus the SO holders (the dealers)
would bear more price risk compared to the DOTs under the old DO system. However to
the extent that a dealer can take delivery within fifteen days and then store the oil, it would
be similar to a DO except for the storage costs that would have to be incurred. If these
storage costs are significant it would impose more risk on the dealer. The law also made the
SO non-transferable, in an attempt to stop the development of lateral transactions which
may become something like an embryonic organized commodity exchange similar to the
DO system. The dealer (SO holder) is supposed to take delivery of oil from refiner within
15 days and sell it to other wholesalers or retailers who are not appointed as dealers.
Another component of the reform was a system of indicative pricing where the refiners
are supposed to set “fair prices” for the SO dealers and also set maximum retail prices. A
government committee was formed to monitor the prices. The committee was entrusted
with setting the maximum mill gate and retail prices from time to time (usually for 15
9This can be interpreted as City Groups belief that the policy reform is not likely to be permanent.
11
days). The different refiners were supposed to follow a uniform pricing rule. However, in
practice, the price caps were rarely enforced. Note that it is almost impossible to enforce
any price cap at the retail level with millions of small retailers spread all over the country;
the government could only enforce the price caps at the refiner level if it wanted to. The
inflexibility of prices set by the government (especially when the world prices were falling)
led the dealers to not take the regular delivery of oil from the refiners. As a result the
refiners began to accumulate stock beyond the optimal level of inventory. This prompted
the refiners to look for alternative distribution channels, and naturally, they went back to
some of the large DOTs to sell the oil. The govt did not take any action against it, and it
might have set into motion forces to push back the marketing system towards the old DO
system after the first six months of the policy implementation.
To capture the policy reform we define two dummies:
Sat =
1 if t ≥ March 23, 2011
0 otherwise(Announcement Effect)
Sft =
1 if t ≥ June 21, 2011
0 otherwise(Implementation Effect)
As discussed above, the government seems to have allowed the refiners to go back to
their large DOTs to off-load accumulating stocks after approximately six months of policy
implementation. We also report estimated effects of the policy reform in the short-term
(up to six months after policy implementation) and long-term (after six months of policy
implementation).
We analyze the effects of the policy change on the marketing margins at two different
interfaces of the marketing chain: the world market to whole sale, and from whole sale to
12
retail. This choice is partly dictated by the data availability, because the time series data
are not available at the other layers, for example, for the transactions between the refiners
and the DO layer of the market. However, the behavior of the marketing margin between
the whole sale and the world market can reveal useful information about the behavior of
the DO layer of the market that has been the focus of the popular discontent with the
marketing intermediaries in Bangladesh. If the policy reform is successful in reducing the
perceived market power, we should expect a negative effect of the reform on the marketing
margins (especially the margin between world market and whole sale).
(3) Empirical Strategy
(3.1) Before-After
A simple way to estimate the effects of the policy reform is a before-after approach that
estimates the following equation:
M et = β0 + β1Sat + β2Sft + εt (1)
where M et is the marketing margin at the appropriate level of the marketing chain, and
the policy dummies Sat (announcement), and Sft (actual policy effect) were defined above.
However, a before-after approach is likely to yield a biased estimate of the effects of the
policy reform, because it does not take into account time varying common factors that
can influence the price of palm oil in the domestic market. For example, we would expect
the price to go up if there is significant inflation in the country with all commodity prices
rising because of macroeconomic factors. If the exchange rate adjustments do not reflect
the rising prices adequately, one might find that the marketing margin of palm oil defined
as the difference between the world price and wholesale price has gone up. Other factors
13
common across different commodities that can affect the marketing margin of different food
commodities include transport costs, changes in taxes etc. For example, if the transport
costs decline due to better transport infrastructure, the wholesale price of palm oil is also
expected to decline if there is reasonable degree of competition at the wholesale level. On
the other hand, a higher marketing margin observed in the data may reflect higher fuel
costs. If we look at the margin between the world price and wholesale price of palm, it may
become higher over time simply because fuel cost has increased. Changes in ad valorem
import tariff rate or value-added tax may also be incorrectly be attributed as changes in
marketing margins. To address such omitted common factors, we develop a difference-in-
difference approach using a comparison commodity to net out the effects of the common
time varying factors.
(3.2) Difference-in-Difference Approach
Choice of the Comparison Commodity and Control Variables
As noted before, the comparison commodity chosen for our DID strategy is wheat.
This choice is based on the following considerations. First, almost all Palm oil consumed
in Bangladesh is imported from Malaysia and Indonesia; the domestic supply is virtually
non-existent.10 Similarly, wheat is also primarily imported into Bangladesh, with about 80
percent of domestic consumption met from imported wheat. Thus both palm oil and wheat
are highly dependent on international markets, and respond to the price fluctuations there.
Second, palm oil and wheat are easily storable. Note that both the storage and transport
cost of wheat is likely to be higher for the same value. In other words, the proportion
of transport and storage cost in the price of wheat is higher when compared to palm oil.
10According to one estimate, there is only 500000 oil palm trees in Bangladesh in 2011, with most ofthem concentrated in hill tracts of Chittagong (Rahman, 2012).
14
This implies that if we find that the marketing margin for palm oil has increased compared
to that for wheat, it cannot be because the fuel price has gone up, or storage space has
become more scarce. In the empirical analysis, we are able to control for the variations in
the fuel price in the DID specification. A potentially relevant issue in understanding if any
observed changes in the marketing margins are due to policy changes in the organization of
the market especially at the world to wholesale segment of the marketing chain is that the
producers (refiners) may be facing increasing marginal costs when expanding production.
If the marginal cost curve slopes sharply upward, a higher marketing margin between the
world market and wholesale levels may be partly due to higher marginal cost of refining
when there is a demand shift. It is, however, extremely difficult to get the required data
for estimating the marginal cost curves faced by different refiners (it is likely to depend
on their scale and the type of machines used).11 In the absence of reliable estimate of
the marginal cost curve faced by the refiners, we look for proxies that would capture the
movements along the marginal cost curve of the refiners. To this end, we use the relative
international price of palm compared to soybean as a control in the DID specification. This
is motivated by the fact that the import volumes of palm and soybean respond quickly to
the changes in relative prices in the international market. When the relative price of palm
increases in international market, the refiners import less palm and more soybean, thus the
refiner climbs down the marginal cost curve for the production of palm. However, note
that the most important component of the variable cost for the refiner is the price of crude
palm in the international market; when the taxes are added to the import price, the price
of crude palm constitutes about 85 to 90 percent of the variable production costs. The
11The Chinese made machines are relatively small scale and incur higher variable costs due to highconsumption of Hexane.
15
above discussion leads to a DID specification of the following form:
M eit = θ0 + θ1Sat + θ2Sft + θ3T + θ4 (T ∗ Sat) + θ5 (T ∗ Sft) + Γ
′Xt + ξit (2)
where T is a dummy that equals 1 for palm and zero for wheat, andXt is a vector of time
varying controls such as transport fuel price and relative price of crude palm compared to
soybean in the international market. The focus of this paper is on estimating parameters
θ4 and θ5, which are the DID estimates of the announcement and implementation of the
policy reform.
Issues Related to Time Series Data
Our data are different from the panel data-sets used in many studies with DID designs.
While most of the data-sets have large cross-section with groups affected by treatment, and
only a few time series observations (usually only 2, baseline and post-treatment surveys),
our main variations in the data come from time series dimension. We thus need to carefully
understand the time series behavior of the prices, and more importantly, of marketing
margins and their implications for the DID design. As we discuss in more detail below, we
do not need to worry about non-stationarity in our analysis, because our focus is on the
marketing margins, which are defined as the difference of two price series. Thus the price
data may be I(1), the marketing margins are I(0) by construction.
Even though unit roots are not a problem in our analysis of marketing margins, a close
inspection of the data shows that the time series behavior of the prices require careful
considerations for a credible DID design in our application. The reason is that the total
marketing margin in palm oil defined as the difference between the world market price
and retail price in the domestic market depends on the price trend in the international
16
market. Figure 1 plots the world market and domestic retail prices in our sample. It
is clear that the gap between the retail and world prices moves counter-cyclically; the
marketing margin tends to decline when the international market price is on an increasing
trend, and the margin increases when the international price is on a declining path. This
can be seen clearly by comparing the price trends and the margin before and after July
2009 in figure 1. The behavior of domestic retail price is consistent with widely discussed
incomplete pass-through of international prices in the literature; the domestic prices do
not transmit the full extent of the changes in the international market prices, both at the
upswing and downswing of the international market. Thus a straight-forward implication
of incomplete pass-through is that the margin declines when international market price
goes up, and it increases when international market price goes down. This dependence of
the margins on the phase of the international market makes the standard DID specification
as in equation (2) above potentially misleading. For example, it is likely that a sustained
increase in international price will strengthen the political resolve for a policy reform,
and we are more likely to see a policy reform to be implemented after such a period of
persistent price increase in the international market. This also implies that it is more likely
to observe a declining international price following the policy intervention, for example,
when policy is implemented at the height of the international market cycle. Since the
marketing margins seem to increase during the downturn irrespective of the policy regime,
one might incorrectly attribute this increase in the margins to the policy reform.
We address the issue of the dependence of the marketing margin on the price trend in
the international market in multiple ways. First, we thus take out the nonlinear (cubic
polynomial) effect of the international market price on the marketing margin and use the
de-trended margins data for our DID analysis. Second, we include a dummy that takes
17
on 1 when the international price is increasing. One might, however, worry that the two-
step cleaning up of the effects of international market trend described above may not be
adequate. To allay such concerns, we provide additional evidence on this issue by taking
advantage of the long time series data available before the policy intervention. For the
“before sample”, we identify a time period that matches the international market phase
observed after the policy intervention closely, and exclude the observations from the other
pre-intervention periods. This strategy uses a subset of the pre-intervention sample, but
may be more satisfactory in dealing with the counter-cyclical margins issue.
We provide formal evidence on the validity of the DID design. First, we present evidence
from a placebo treatment commodity lentil which was not affected by the policy reform
in any significant way. Lentil is a major item in household food budget in Bangladesh,
and more than half of the domestic demand is satisfied by imports, with Nepal being the
single most important source for the importers. The policy change in 2011 did not affect
the lentil trade in any significant way, because there is no . Also, the interventions on
price setting by the government in 2011 were targeted to the edible oils and sugar markets,
lentil traders were spared most of it. If the estimated effects of the policy reform from a
DID design for palm oil with wheat as the comparison are spurious, driven by some other
omitted factors that affected wheat marketing differentially in the post reform period, then
the policy effects for lentil with wheat as the comparison should be similar to that for palm
oil. Second, we provide evidence on the validity of the parallel trend assumption between
palm and wheat markets in two ways. First, we look at trends graphically (see Figures 1
and 2) and present nonlinear nonparametric estimates of the trends in marketing margins
for these two commodities before the policy reform in March 23 2011(see Figures 3 and
4). Figure 2 plots the total marketing margin (world to retail) for palm and wheat for the
18
pre-intervention sample; the marketing margin for wheat seems to track the changes in the
marketing margin for palm reasonably well. Figures 3 and 4 present the nonparametric
estimates of the evolution of marketing margins for palm oil and wheat over the pre-reform
sample period. It is reassuring that the shapes of the both curves are broadly similar. As a
more formal test of the parallel trend assumption we use a fictitious policy implementation
date that bisects the pre-reform sample (before the enactment of the law in March 23 2011).
If the DID identifying assumption is incorrect, we should find significant DID effect for the
fictitious policy reform date.
(4) Data
Several data sets were utilized in the empirical analysis. The daily price data came
from the Department of Agricultural Marketing (DAM) unit of Ministry of Agriculture.
The Trading Corporation of Bangladesh (TCB) also reports daily price data from major
urban centers. We compared daily price data from both sources. The price trends in both
data sets are nearly indistinguishable. The price data from DAM however are available for
one additional year (2008) compared with the TCB data. Moreover DAM reports price
data for a wider range of commodities compared to TCB. We thus use the DAM data for
our empirical analysis. The daily international prices of all commodities except for crude
palm oil and lentil are derived from the data stream of Chicago Board of Trading.12 Crude
palm oil price data are taken from the Malaysian Palm oil Board. Lentil import unit values
are taken from the National Bureau of Revenue daily import data. Our sample extends
from January 24, 2008 to October 4, 2012. There are however some data gaps due to lack of
price data during weekends and holidays as well as some missing data in the DAM original
data set. Our total sample sizes for most commodities (palm oil and wheat) are 966 days
12Crude palm oil was listed in the CBT in January 2009. We compared CBT data with MPB data ondaily palm oil prices, there are again nearly identical.
19
spread over 57 months.
To provide a feel of data used in the analysis, Table 1 reports summary statistics for key
prices and margins for palm oil, wheat and lentil during pre and post-intervention periods.
For palm oil, all three margins (world-retail, world-wholesale, and wholesale-retail) have
increased in the post-reform period, with the increase in the total margin roughly equally
shared by the world-wholesale and wholesale-retail margins. In contrast, all three margins
have declined for wheat marketing in the post-reform period, with most of decline registered
at the world to wholesale margin. The lentil margins represent an intermediate case. The
total margin (world-retail) has increased only slightly. Interestingly, while world-wholesale
margin has declined somewhat, the wholesale-retail margin has experienced moderate in-
crease. Note that the world to wholesale value chain includes not only transport and storage
costs but also milling costs.13 None of the data sources reported mill gate prices so as to
examine the world to mill gate, and mill gate to wholesale price margins separately. In
the following, we present the estimates of the policy effect on the marketing margins from
formal econometric analysis.
(5) Empirical Results
Since our data-set consists mainly of time series data for each commodity, we start
by checking the time series properties of dependent variables which are the marketing
margins at different layers of the market. While both international and domestic prices
are all I(1) variables, the null hypothesis of unit root can be rejected resoundingly at 1
percent significance level or less for all three margins and for all three commodities. For
each regression, we also checked the presence of serial correlations in the residuals using
correlogram analysis. The correlogram analyses indicated the presence of an AR(1) process
13The milling loss for palm oil is about 4-6% whereas for wheat (to flour) it is much larger: 10-15%weight loss due to impurity and moisture and 20-22% bran.
20
in the residuals. All regressions in this paper thus correct standard errors for the presence
of AR(1) in residuals as well as heteroskedasticity using the Newey-West (1987) procedure.
The results presented in the following used one-lag as indicated by correlogram analysis
but the central conclusions of this paper are robust to inclusion of higher order lags.
(5.1) Preliminary Results: Before-After Comparison
We start by presenting the simple before-after results for policy intervention in the palm
oil market. The first three columns in Table 2 present results from our simplest specification
which control for only year and quarter fixed effects. The results indicate that both the
world-retail and world-wholesale margins increased significantly after the announcement
and policy implementation. The coefficients of policy announcement and implementation
dummies are both positive and large in magnitudes and statistically significant. Curiously,
the results imply no significant change in wholesale to retail margins due to policy imple-
mentation while announcement seems to have resulted in a decrease in the wholesale-retail
margin. The final three columns present the regression results when we added a number of
control variables in addition to year and quarter fixed effects. The observed tendency for
price of palm oil to rise during ramadan period is controlled for by introducing dummies
that take the value of unity during ramadan month and zero otherwise. We also add diesel
price to control for possible changes in the transportation and processing costs. Note that
the fuel prices in Bangladesh are controlled by government and changes infrequently over
time. Thus it is appropriate to treat the fuel price as exogenous in the marketing margins
regressions. Since the margins tend to vary over world price cycles, and an upward cycle
of palm price is contained in the pre-intervention sample of our data-set, we add a dummy
indicating the upswing phase of palm price in the international market as a regressor. As
discussed before in the empirical strategy section above, the volume of crude palm imported
21
by the refiners depends on its international price relative to the international price of soy-
bean oil. 14 We include the relative international price of palm compared to soybean as a
proxy for possible changes in the costs as the refiners move along the marginal cost curve.
Note that the relative price of palm also captures the consumer substitutions in so far as
it reflects the movements in the relative prices faced by the consumers at the retail level.
It is thus used as a control for demand shifts in the wholesale-retail marketing margin,
although the refiners marginal cost curve is not relevant for the marketing margin at this
segment. It is important to appreciate that, for a small country such as Bangladesh, the
international prices are parametrically given from the world market, and thus the relative
international price is exogenous for the determination of the marketing margins at different
interfaces of the domestic marketing chain.15 Once the possible sources of demand and
marginal cost changes as well as the phase of the world market price are controlled for,
the results show much smaller magnitudes of change in margins between before and after
the policy implementation. While much of the upward shift in world-retail margin can be
accounted for by the rise in world-wholesale margin, the results imply a statistically signif-
icant increase in the wholesale–retail margins as well. In the case of policy announcement,
the results suggest a slight decline in margins particularly for the wholesale-retail margin.
While the preliminary before-after results discussed above provide a first impression, they
can be misleading as the estimates of the effects of the policy reform, as discussed in detail
above in the empirical strategy section.
To emphasize the importance of pre-intervention sample period, we present results from
14Between 2007 and 2008, prices of crude palm oil increased substantially. Import of crude palm oil alsoincreased substantially between these two years because rise in crude soybean oil price was much sharpercompared with crude palm oil. To the extent such substitution affects marginal costs of palm production,it will also affect the world-retail and world-wholesale margins.
15In contrast, relative consumer prices would be better control for demand shifts, but they are clearlyendogeneous,
22
the estimation based on a sample that compares post-intervention with the immediate
preceding year. In a standard before-after design, it is usually argued that one should
select a comparison period closer to the intervention date to avoid confounding by long-run
structural changes in the economy. In this sense the one year pre-intervention sample seems
more appropriate for a before-after design instead of the full sample covering a much longer
time period.16 We also exclude relative prices from the regressions. The results in Table
3 indicate that if anything, the magnitudes of increase in margins following announcement
and implementations are much larger in this case compared with those in Table 2. This
underscores the need for paying attention to both price cycles and changes in marginal
costs and demand shifts as captured by the relative international price of palm compared
to soybean.
Note also that the coefficients on policy dummies (announcement dummy and implemen-
tation dummy) satisfy an adding up restriction: the marketing margin for the wholesale-
retail margin is the difference between the coefficients for world-retail and world-wholesale
margins. To reduce clutter, in the following analysis, we focus on the world-retail (i.e,
total) and world-wholesale margins.
(5.2) Difference-in-Difference (DID) Approach
In this sub-section, we present DID results from alternative specifications and samples.
As discussed in the empirical strategy section, wheat is our comparison commodity for the
DID design. We discussed a set of a priori reasons to expect that the marketing margin for
wheat provides us with a credible comparison commodity. We also provide visual evidence
supporting our DID design in section (3) above. Later in the paper, we will report formal
results on the validity of the DID design with wheat as the comparison commodity.
16One can argue that the same argument is valid for the DID design later.
23
Basic DID Estimates
Table 4 presents the results from the DID estimation. As before, we present results from
two specifications of the regressions; the first specification only controls for year and quarter
dummies, and the second adds the set of controls used in the second specification in Table
2 above. Regardless of the set of controls used, the results suggest statistically and numer-
ically significant and positive effects of both the policy announcement and implementation
on the world-retail and world-wholesale margins. The magnitudes of the policy effects,
however, depend on the specification used; we find policy effects on margins to be larger
when the full set of controls are used along with the year and quarter dummies. The results
taken together suggest a larger effect of announcement (90 days period between the passing
of the law banning DO and introducing SO and the actual implementation) compared with
the effect of implementation for both marketing margins. This can be interpreted as the
outcome of the adjustments by the market players in anticipation of the implementation of
the law in June 21 2011, leading to possibly something like a overshooting. Much of the an-
nouncement effects of world-retail margin can be explained by its effect on world-wholesale
margin. In contrast, the estimates imply a substantial increase in wholesale-retail margins
after implementation of the law.
As with before-after analysis, we check the estimated policy effects when we restrict our
pre-intervention sample only to 2010 -the year immediately before policy intervention. The
results in Table 5 indicate that the magnitudes of policy effects are larger in this restricted
sample particularly when we use the parsimonious specification. For instance, results in
column (1) of Table 5 imply an increase of world-retail margin by 10 taka right after the
announcement and by 9.2 taka after implementation. The corresponding increases in Table
4 are Taka 4.57 after announcement and TK 3.72 after implementation. When the set of
24
additional controls are included, the estimated effects of announcement and implementation
on margins decline in Table 5, and become broadly similar to those in Table 4 (see column
(2) for each margin). It is interesting that the effects of additional controls are opposite in
Table 5 when compared to the results in Table 4.
DID Estimates with De-trended Margins
As discussed in some detail in the empirical strategy section above, the margins in the
case of palm oil depend on the crude price cycle in the world market: both world-retail
and world-wholesale margins become smaller during the upswing in international crude
oil price and vice versa. The crude oil prices were rising sharply right before the policy
announcement while it started to come down before policy went into effect. To take out
the cyclical effect of world price on margins, we regress the margins on cubic polynomials
of world price of crude palm oil. The de-trended margins are thus defined as actual margin
minus the cubic effect of the world price variations. These de-trended margins are the
dependent variables in Table 6. As before, two different specifications are estimated for
each margins. Consistent with the earlier results, the estimates suggest statistically signif-
icant and positive effect of policy announcement and implementation on the margins. The
magnitudes of the policy effects are now comparable across specifications. The coefficients
of announcement and implementation dummies interacted with palm dummy are slightly
larger in magnitudes compared with estimates in columns denoted as ‘2’ in Tables 4 and 5.
The results in Table 6 thus confirm our conjecture that the effects of policy interventions
can be biased if international price cycles are not adequately controlled for.
25
DID Estimates from the Matched Sample
As a final robustness check of our findings that policy interventions may have the
unintended consequence of increasing margins in place of its purported goal of reducing
margins, we match the phase of international price movement during post-intervention
period to a similar phase in pre-intervention period. A close inspection of crude palm prices
identify one such sample period during the pre-intervention period. Consistent with post
intervention price trends, prices in 2008 and the first half of 2009 continued to decline from
a high in early 2008. We restrict our pre-intervention sample to this matching period. We
repeat the DID estimation for this matched sample which essentially takes out the period
of palm price rise in the international market from the pre-intervention sample. Since
the margins become smaller in the upswing phase of the international market reflecting
imperfect pass-through, a point discussed earlier, a pre-intervention sample that includes
such a phase can bias the estimated policy effects upward, especially because there is no
similar sustained increase in international price in the post-intervention sample. The results
using the de-trended margins are shown in Table 7. The effects of policy announcement
and implementation on the total marketing margin (i.e., between world market and retail)
are all positive and statistically significant at the 1 percent level. This provides strong
support for the conclusion that the total marketing margin in palm oil has in fact gone
up following the policy reform, a perverse outcome from the view point of the goals of
the policy reform. However, consistent with the a priori expectation discussed above, the
magnitudes of effects are much smaller now, nearly half of what are reported in Table 6.
For the world-wholesale margins, the effect of policy implementation is not statistically
significant if palm/soy substitution induced by relative price changes is not accounted for.
More than half of the effect of policy implementation on wholesale-retail margin is still
26
due to changes in world-wholesale margin (columns 2s) which include the traditional DO
layer of the market before policy intervention along with the refiners. Though magnitudes
of effects are smaller in this matched sample, the qualitative conclusions arrived in earlier
analysis remain intact in this sample as well.
DID: Short-run vs. Long-run Effects
The empirical analysis so far provides robust evidence in favor of a positive effect of
policy change on marketing margins of palm oil. In this sub-section, we examine if the
effects of policy intervention changes overtime. To distinguish the short-term effects from
the long-term effects, we divide the post implementation sample into two parts: short-term
sample consists of the first six months period after the policy implementation and the
long-term is the rest of the post-intervention sample. We define a dummy which takes the
value of unity during the first 6 months following implementation date (June 21, 2011).
Coefficient of this dummy (interacted with palm dummy) captures the immediate effects
of implementation when traders were trying to comply with the policy change. To capture
the long term effect, we define another dummy which takes the value of unity for the rest
of the period after first 6 months and zero otherwise. We repeat our estimation with these
new policy variables using the matched sample, as this gives us the most conservative
estimates of the policy effect on the marketing margins. The results are reported in Table
8. Columns denoted as ‘1’ include all regressors except the relative international prices. For
both world-retail and world-wholesale margins, the largest effects of policy on the margins
are found during the first six months of the implementation of the reform. After six months,
the effects decline substantially. Indeed for the world-wholesale margin, the effects become
statistically insignificant after six months. This result holds regardless of the regression
specification. For the total marketing margin (world-retail), the effect, though diminished,
27
stays statistically significant when we control for relative world prices of palm and soybean
oils. The results in Table 8 suggest that the effects of policy interventions were concentrated
mostly during the first six months of implementation when traders and refiners were trying
to figure out the degree of political commitment to the enforcement of the law passed in
March 23 2011.
(6) Validity of the DID Design: Formal Evidence
(6.1) Falsification Exercise with Lentil as the Treatment
One might worry that the results we discussed so far may be at least partly driven by
some idiosyncratic developments in the wheat marketing chain that reduced its marketing
margin compared to other commodities during the post-reform period. To understand if our
results are due to factors specific to the wheat market, we use lentil as a “placebo treatment
commodity”. Similar to Palm and Wheat, lentil is also a major imported commodity in
Bangladesh, as domestic production can meet less than half of the local demand. The
trend in international price of lentil over the five years in our sample is broadly comparable
to that in palm during both pre and post intervention periods (see Figure 5). Given the
similar trend, we can perform a falsification test by ‘pretending’ lentil to be our treatment
commodity. As noted before, the policy reform in June 2011 targeted the edible oils and
sugar markets, and lentil marketing chain remained unaffected. If our policy dummies are
picking up the effects of idiosyncratic changes in the marketing of wheat, then the policy
dummies should have similar coefficients in the regressions where lentil is taken as the
‘treated commodity’ in place of palm and wheat is the comparison. We report the results
from this exercise in Table 9. The regression specification use the full set of controls used in
earlier analysis. The results show that neither announcement nor implementation affected
world-retail or world-wholesale margins for lentil in any significant way. The estimated
28
coefficients are small in magnitude and statistically not significant at the 10 percent level.
(6.2) Test for the Validity of Parallel Trend Assumption with
Fictitious Policy Date
We also perform a placebo policy test to check if the parallel trend assumption between
palm and wheat is valid in the pre-intervention sample. We implement this test by defining
a fictitious policy intervention during pre-intervention period. For this exercise, we take the
matched pre-intervention sample. We divide this sample roughly into two halves. We then
define a policy intervention dummy which takes a value of unity during the first half of the
sample and zero otherwise. We then estimate the effect of this fictitious policy intervention
on palm trading margins. The results are reported in Table 10. The interaction of policy
and palm dummies have positive coefficients in regressions for both world-retail and world-
wholesale margins, but they are small in magnitude and are not statistically significant at
the conventional levels.
(7) Discussion: Towards an Understanding of the Behavior of the
Marketing Margins After the Reform
A central objective of the policy reform implemented in June 2011 was to reduce the
market power of the DO layer, which is expected to bring down the world-wholesale margins,
and thus ultimately reduce the prices faced by the consumer. The empirical results reported
above suggest that the policy reform had exactly the opposite effect: the margins between
wholesale and world prices increased significantly instead of decreasing following the reform.
The average world-retail and world-wholesale margins in pre-intervention period were Tk
13.81 and Tk 10.54 respectively. The conservative estimates of the policy effect in Table
8 imply increases in the total marketing margin (i.e., world-retail margin) by 28 percent
during the first 3 months after the law was passed, and 40 percent during 6 months after the
29
implementation respectively. The increases in world-wholesale margins during the same two
periods are 37 and 32 percents respectively. By conservative estimates, after 9 months of
the announcement of policy reform, the effects of policy change on margins mostly petered
off.
What explains the contrasting effects of policy change in the short-term (upto 9 months)
and longer term (after 9 months)? A plausible conjecture is that the policy change created
uncertainty about the operation of the market, especially for the refiners, the old DOTs
most of whom became dealers under the new system, and the wholesalers. If so, then one
would expect transactions to decline as well as become more volatile during this period.
None of the official sources monitor the volume of transactions. Since all of the crude
palm are imported, one can check import volumes during pre- and post-intervention peri-
ods. We use data from National Bureau of Revenue (NBR) to compute import volumes.
Import volumes display great volatility across months due to the lumpiness of imports.
We compute average monthly imports using data from 2009 and 2010 for pre-intervention,
and 2011 and 2012 for post intervention periods. Figure 6 plots monthly import during
pre- and post intervention years. The evidence in Figure 6 suggests a decline in imports
particularly after the month of July during the post intervention period compared with the
pre-intervention period. The overall import of palm oil during 2009-2010 amounted to 136
million metric ton which fell to 120 million metric ton during 2011-12. This decline in palm
oil imports happened despite a decrease in palm oil world price. Post-intervention years
experienced substantial rise in volatility in monthly import: the coefficient variation of
import volume increased from 0.295 during 2009-2010 to 0.547 during 2011-12. The import
data thus provide some suggestive evidence that supports the conjecture that increased
uncertainty created by policy reform may be partly responsible for the observed increase
30
in the marketing margin through its negative effects on the import volume.
As discussed before in the policy reform section, informal discussions with DOTs and
refiners lend some support to this hypothesis. In order to comply with policy change,
refiners invited applications from traders to become distributors. The responses to these
invitations were poor, implying lack of credibility among the wholesale traders about the
new SO system. Refiners saddled with un-sold inventory informally went back to DOTs
with whom they had long term relationship, effectively undermining the policy change.
A second possible factor that might explain part of the increase in the marketing margin
between wholesale and retail is changes in credit availability. Traditionally, the DOTs
holding the DOs issued by the large refiners such as City Group, T.K. Group and Meghna
Group could use the DO as collateral to get credit from the banks. This injected additional
liquidity at the DO layer, and increased the volume of transactions and credit advanced
to the wholesalers by the DOTs. However, even before the policy reform was enacted,
the Central Bank of Bangladesh (Bangladesh Bank) clamped down on the banks in an
attempt to reduce this practice. This was motivated by the policy goal of constraining the
activities of the speculators. The Bangladesh Bank seems to have enforced this ‘policy’
more vigorously after the DO layer was banned in June 2011. This reduction in credit
to DOTs in turn led to reduction in credit advanced to the wholesalers. The price of oil
is, however, higher when it is sold on credit. As the proportion of sales on credit went
down, the average prices in the wholesale layer also declined. This decline in wholesale
prices may show up as an increase in the wholesale-retail margin, because the retail prices
are still determined by the final consumer demand, and it is unlikely that the proportion
of credit transactions between retailers and consumers was affected in any significant way.
However, note that in so far as the credit availability at the DO layer is a factor, this
31
reduces the margin between world market and wholesale prices. Thus a reduction in the
credit availability due to the policy of Bangladesh Bank against the use of DO as collateral
cannot explain the fact that marketing margins seem to have increased in both segments
of the marketing chain.
Note also that changes in two important components of marketing costs: transport and
storage cannot explain our results for two reasons. First, wheat price depends much more on
the changes in transport and storage costs than palm oil, a point noted earlier. Thus wheat
price at the wholesale and retail levels increases much more when transport and storage
costs go up. Thus our DID design would give us lower bound estimates if both transport
charges and storage costs were increasing during the sample period.17 The available evi-
dence shows that the fuel price, although controlled by the government, has increased over
time in discrete fashion, and the price of storage space has increased significantly over time,
as to be expected in a high population density country such as Bangladesh. Second, even if
the traders face increasing marginal cost (for example, when they have to rent in additional
space) of storage, our results showing an increase in the margins cannot be explained by
such rising marginal cost faced by traders. Because, as discussed above, the total import
of palm oil declined in the post-intervention period, thus the traders did not need to rent
in new spaces during this time period.
Drawing on the above discussion, we describe below a plausible sequence of events
depicting the responses of the market agents at different layers to the policy reform. As
noted above, we observe an increase in the marketing margins in the short-term, but a
reversion back to the defacto DO system after approximately six months of the policy
reform.18 The refiners, who are also the importers of crude palm oil, placed limited import
17This also implies that our estimates may overestimate the margin between palm and wheat if transportand storage costs decline significantly over time.
18The delivery receipts issued by the refiners are still called Sales Order (SO) by many, but a Sales Order
32
orders upon announcement of the policy, owing to the uncertainty about their ability to
distribute the refined oil once the DOs were banned (recall that there were poor response to
the invitation to apply for dealership). The initial attempts by the government to fix prices
at the mill gate exacerbated the uncertainty and reduced the scope for price adjustments
in response to world market price changes. The domestic wholesale/retail prices held up,
supported by the prices fixed by the government earlier, while the world price of the crude
started to decline. As a result, the marketing margins widened. However, the higher
margins did not create any immediate incentives among refiners to under-cut each other,
given the limited quantity of imports. This may have also helped in tacit collusion among
the refiners to maintain higher prices in the short term. Then as time went by, the SOs
were not being picked up by the newly appointed dealers, because they were aware of the
declining prices in the international market (recall that more than half the dealers did not
incur any fixed costs in becoming a dealer, as city group did not require the 200,000 taka
deposit for its dealership). Even though the total imports were lower, the refiners could
not distribute their inventory, so they went back to some of their long-term reliable DOTs
(the largest ones), and the domestic price started to adjust to the declining world market
prices. The government did not make any effort to enforce the ban on the DOTs, and
attempts to fix prices at the mill gate were abandoned in favor of periodically announced
indicative price guides which had very little effects on the price setting behavior of the
market intermediaries. Thus the plam oil distribution reverted back essentially to the old
marketing chain where DOTs play an important role.
Conclusions
The empirical analysis presented in this paper provides robust evidence of an increase
now works exactly like the old Delivery Order (DO).
33
in the marketing margins in palm oil market in Bangladesh after the announcement and
implementation of the policy reform in June 2011 that banned the DO system and intro-
duced a distribution system based on appointed dealers, called the SO system. The results
establish clearly that both the world-retail and world-wholesale margins have increased sig-
nificantly between the announcement and implementation dates, and also during the first
six months following the implementation. The results also suggest that the increase in the
total marketing margin (world-retail) during the first 3 months of the announcement of the
policy reform was almost entirely due to an increase in the world-wholesale margin. The
increase in the world-wholesale margin also accounts for much of the increase in overall
marketing margin (world-retail) during the first 6 months after the implementation of the
SO system. The falsification and placebo policy reform tests provide strong support for
our DID design for estimation of the policy effects. We discuss a number of alternative
explanations for the observed behavior of the marketing margins. We also outline a plau-
sible scenario depicting the response of the refiners and marketing intermediaries to the
policy reform that resulted in an increase in the marketing margins in the short-term, but
the changes in the market organization dictated by the policy proved to be shortlived: the
market essentially went back to the old DO system after approximately six months of the
implementation of the reform. However, a full understanding of the observed behavior of
the marketing margins after the policy reform will require a separate in-depth study in the
future.
References
Ahmed, R., and Bernard, A. 1989. Rice Price Fluctuations and an Approach to Price
Stabilizations in Bangladesh, Research Report 72 (Washington, D.C.: International Food
34
Policy Research Institute).
Ali, Shawkat, A.M.M. 2010. Strengthening the Government’s Institutional Capacity for
Improving Food Security, Final Consultancy Report to ADB and the Ministry of Food and
Disaster Management, Dhaka, Bangladesh.
Aristotle, S., 1988. The Politics. Cambridge University Press, Cambridge, MA.
Baulch, B. 1997.Transfer costs, spatial arbitrage, and testing for food market integra-
tion. American Journal of Agricultural Economics 79, 47787
Byerlee, D., T. S. Jayne, and R. J. Myers. 2006. Managing food price risks and
instability in a liberalizing market environment: Overview and policy options. Food Policy
31 (4): 275285.
Carpenter, F., 1866. Six Months at the White House with Abraham Lincoln. Hurd,
New York.
Centre for Policy Dialogue (CPD). 2007. Price of essential commodities: A diagnostic
study of recent trends, Working Paper, CPD, Dhaka, Bangladesh.
Chowdhury, N. 1992. Rice Markets in Bangladesh: A Study in Structure, Conduct, and
Performance (Washington, D.C.: International Food Policy Research Institute)
Farid, N and M. Sayedur Rahman. 2002. Market structure and price determination of
food grains in Bangladesh. NFPCSP Technical Report, Dhaka, Bangladesh.
Goletti, Francesco, Raisuddin Ahmed, and Naser Farid. 1995. Structural determinants
of market integration: The case of rice markets in Bangladesh. The Developing Economies.
XXXIII-2 (June)
Islam, Nurul and Thomas, Saji 1996. Food grain price stabilization in developing
countries issues and experiences in Asia, IFPRI.
Ivanic, M. and W. Martin, and H. Zaman, 2012. ”Estimating the Short-Run Poverty
35
Impacts of the 201011 Surge in Food Prices,” World Development, Elsevier, vol. 40(11),
pages 2302-2317.
Lenin, V.I., 1964. Complete Collected Works, vol. 35. Moscow.
Mahmud, W, S. H. Rahman, and S. Zohir (1994), Agricultural Growth Through Crop
Diversification in Bangladesh, Working Papers on Food Policy in Bangladesh, No.7, IFPRI,
Washington DC.
Minot, N, and R. Dewina, 2013, Impact of Food Price Changes on Household Welfare
in Ghana, Working Paper, IFPRI, Washington DC.
Murshid, K. A. S, 2011, Traditional Market Institutions and Complex Exchange: Ex-
ploring Transition and Change in the Bangladesh Rice MarketA NIE-Based Perspective.
Occasional Paper. Dhaka, Bangladesh: Centre for Policy Dialogue.
Rahman, M. Bhattacharya, D. Wasel B S and Deb U. 2008. Recent Inflation in
Bangladesh: Trends, Determinants and Impact on Poverty. Centre for Policy Dialogue,
Dhaka, Bangladesh.
Ravallion, M (1986), “Testing Market Integration”, American Journal of Agricultural
Economics, (1986) 68(1): 102-109
Uddin, H and M. Taslim (2010), An Assessment of Competition in the Edible Oil Market
of Bangladesh, Bureau of Economic Research, University of Dhaka, Bangladesh.
Wodon,Q and H. Zaman, 2010. “Higher Food Prices in Sub-Saharan Africa: Poverty
Impact and Policy Responses,” World Bank Research Observer, World Bank Group, vol.
25(1), pages 157-176, February.
36
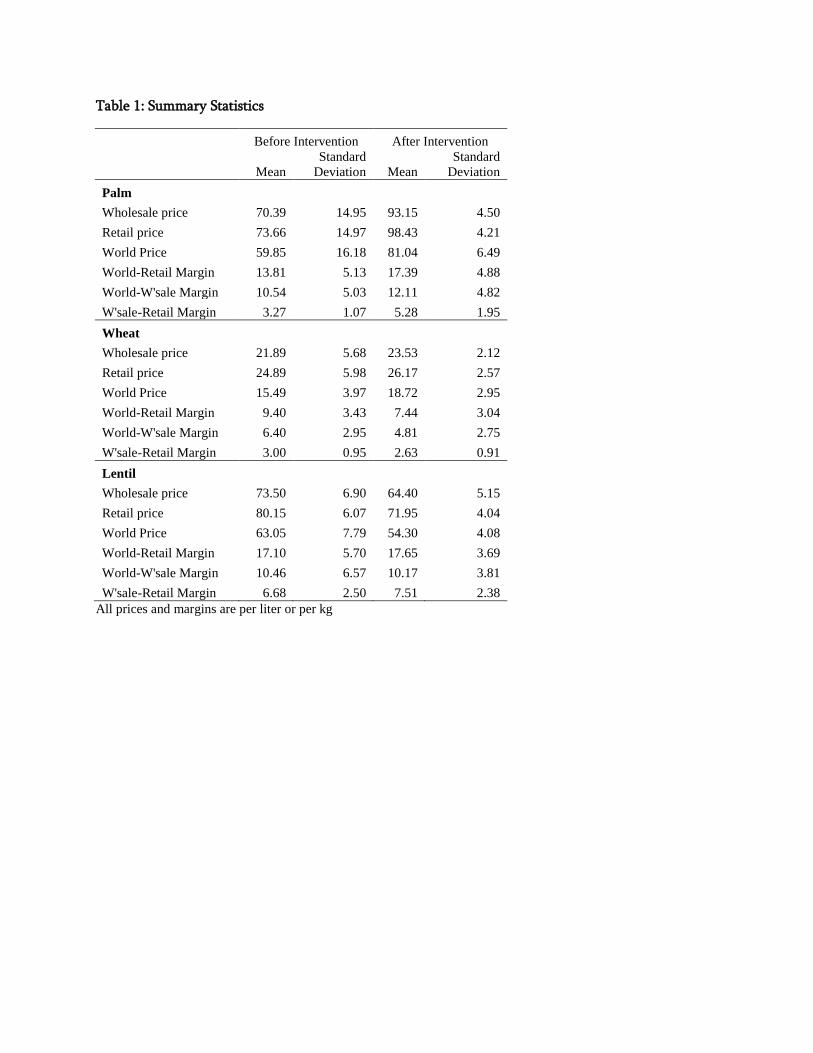
Table 1: Summary Statistics
Before Intervention After Intervention
Mean
Standard
Deviation Mean
Standard
Deviation
Palm
Wholesale price 70.39 14.95 93.15 4.50
Retail price 73.66 14.97 98.43 4.21
World Price 59.85 16.18 81.04 6.49
World-Retail Margin 13.81 5.13 17.39 4.88
World-W'sale Margin 10.54 5.03 12.11 4.82
W'sale-Retail Margin 3.27 1.07 5.28 1.95
Wheat
Wholesale price 21.89 5.68 23.53 2.12
Retail price 24.89 5.98 26.17 2.57
World Price 15.49 3.97 18.72 2.95
World-Retail Margin 9.40 3.43 7.44 3.04
World-W'sale Margin 6.40 2.95 4.81 2.75
W'sale-Retail Margin 3.00 0.95 2.63 0.91
Lentil
Wholesale price 73.50 6.90 64.40 5.15
Retail price 80.15 6.07 71.95 4.04
World Price 63.05 7.79 54.30 4.08
World-Retail Margin 17.10 5.70 17.65 3.69
World-W'sale Margin 10.46 6.57 10.17 3.81
W'sale-Retail Margin 6.68 2.50 7.51 2.38
All prices and margins are per liter or per kg
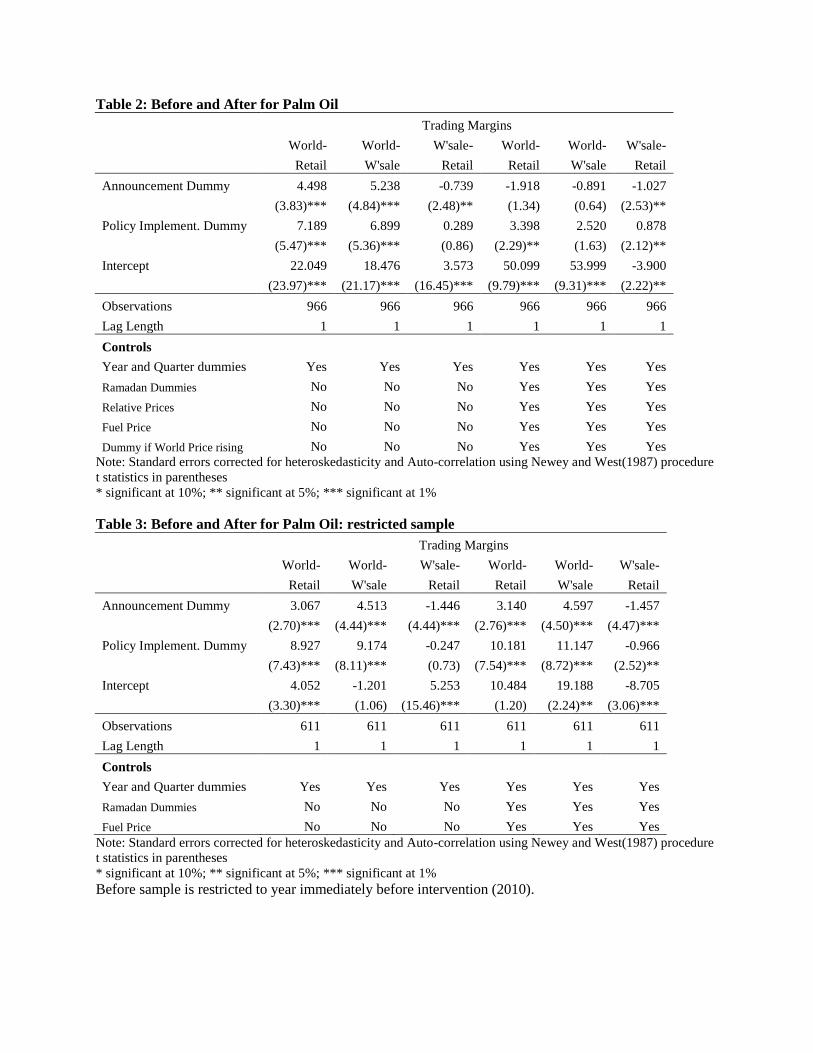
Table 2: Before and After for Palm Oil
Trading Margins
World- World- W'sale- World- World- W'sale-
Retail W'sale Retail Retail W'sale Retail
Announcement Dummy 4.498 5.238 -0.739 -1.918 -0.891 -1.027
(3.83)*** (4.84)*** (2.48)** (1.34) (0.64) (2.53)**
Policy Implement. Dummy 7.189 6.899 0.289 3.398 2.520 0.878
(5.47)*** (5.36)*** (0.86) (2.29)** (1.63) (2.12)**
Intercept 22.049 18.476 3.573 50.099 53.999 -3.900
(23.97)*** (21.17)*** (16.45)*** (9.79)*** (9.31)*** (2.22)**
Observations 966 966 966 966 966 966
Lag Length 1 1 1 1 1 1
Controls
Year and Quarter dummies Yes Yes Yes Yes Yes Yes
Ramadan Dummies No No No Yes Yes Yes
Relative Prices No No No Yes Yes Yes
Fuel Price No No No Yes Yes Yes
Dummy if World Price rising No No No Yes Yes Yes
Note: Standard errors corrected for heteroskedasticity and Auto-correlation using Newey and West(1987) procedure
t statistics in parentheses
* significant at 10%; ** significant at 5%; *** significant at 1%
Table 3: Before and After for Palm Oil: restricted sample
Trading Margins
World- World- W'sale- World- World- W'sale-
Retail W'sale Retail Retail W'sale Retail
Announcement Dummy 3.067 4.513 -1.446 3.140 4.597 -1.457
(2.70)*** (4.44)*** (4.44)*** (2.76)*** (4.50)*** (4.47)***
Policy Implement. Dummy 8.927 9.174 -0.247 10.181 11.147 -0.966
(7.43)*** (8.11)*** (0.73) (7.54)*** (8.72)*** (2.52)**
Intercept 4.052 -1.201 5.253 10.484 19.188 -8.705
(3.30)*** (1.06) (15.46)*** (1.20) (2.24)** (3.06)***
Observations 611 611 611 611 611 611
Lag Length 1 1 1 1 1 1
Controls
Year and Quarter dummies Yes Yes Yes Yes Yes Yes
Ramadan Dummies No No No Yes Yes Yes
Fuel Price No No No Yes Yes Yes
Note: Standard errors corrected for heteroskedasticity and Auto-correlation using Newey and West(1987) procedure
t statistics in parentheses
* significant at 10%; ** significant at 5%; *** significant at 1%
Before sample is restricted to year immediately before intervention (2010).

Table 4: Difference in Difference Results (control: wheat)
Trading Margins
Retail-World Price Wholesale-World Price
Effect of Announcement (1) (2) (1) (2)
Announcement Dummy -1.932 -6.882 -1.457 -6.019
(2.34)** (10.23)*** (1.79)* (9.45)***
Announcement*Palm 4.586 7.111 4.456 6.626
(6.90)*** (9.94)*** (7.55)*** (10.34)***
Effect of Implementation Policy Implement. Dummy 1.495 -3.174 2.644 -1.492
(1.78)* (4.66)*** (3.22)*** (2.25)**
Policy Implement.*Palm 3.721 6.132 1.524 3.473
(5.99)*** (10.09)*** (2.64)*** (6.03)***
Diesel Price 0.249
0.154
(6.91)***
(4.09)***
Dummy if World Price was rising (DW) -1.272
-0.951
(2.06)**
(1.50)
DW*palm
1.293
0.750
(2.23)**
(1.35)
Relative world prices of palm/soy -59.409
-56.601
(20.79)***
(18.36)***
Relative world prices of wheat/rice -5.326
-4.141
(5.55)***
(4.46)***
Intercept 14.006 3.518 10.633 3.799
(29.52)*** (1.92)* (24.65)*** (2.01)**
Observations 1932 1932 1932 1932
Lag Length 1 1 1 1
Controls
Year and Quarter Fixed
effect Yes Yes Yes Yes
Ramadan Dummies No Yes No Yes
Note: Standard errors corrected for heteroskedasticity and Auto-correlation using Newey and West(1987) procedure
t statistics in parentheses
* significant at 10%; ** significant at 5%; *** significant at 1%
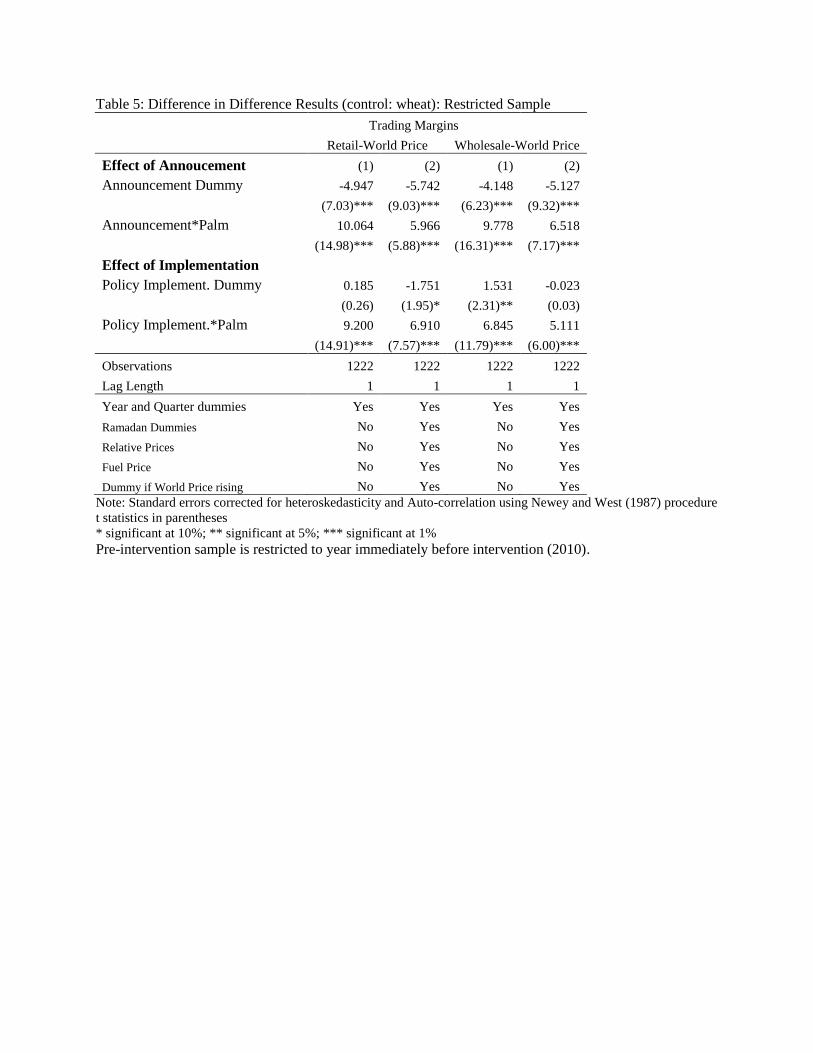
Table 5: Difference in Difference Results (control: wheat): Restricted Sample
Trading Margins
Retail-World Price Wholesale-World Price
Effect of Annoucement (1) (2) (1) (2)
Announcement Dummy -4.947 -5.742 -4.148 -5.127
(7.03)*** (9.03)*** (6.23)*** (9.32)***
Announcement*Palm 10.064 5.966 9.778 6.518
(14.98)*** (5.88)*** (16.31)*** (7.17)***
Effect of Implementation Policy Implement. Dummy 0.185 -1.751 1.531 -0.023
(0.26) (1.95)* (2.31)** (0.03)
Policy Implement.*Palm 9.200 6.910 6.845 5.111
(14.91)*** (7.57)*** (11.79)*** (6.00)***
Observations 1222 1222 1222 1222
Lag Length 1 1 1 1
Year and Quarter dummies Yes Yes Yes Yes
Ramadan Dummies No Yes No Yes
Relative Prices No Yes No Yes
Fuel Price No Yes No Yes
Dummy if World Price rising No Yes No Yes
Note: Standard errors corrected for heteroskedasticity and Auto-correlation using Newey and West (1987) procedure
t statistics in parentheses
* significant at 10%; ** significant at 5%; *** significant at 1%
Pre-intervention sample is restricted to year immediately before intervention (2010).
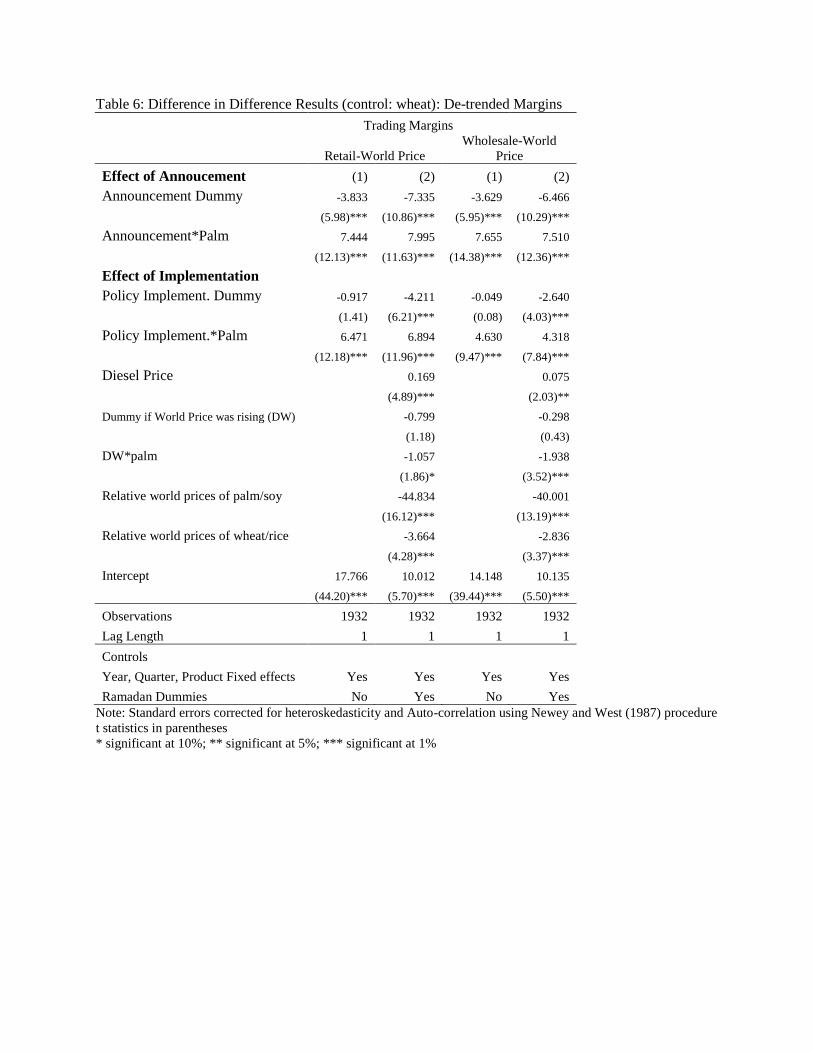
Table 6: Difference in Difference Results (control: wheat): De-trended Margins
Trading Margins
Retail-World Price
Wholesale-World
Price
Effect of Annoucement (1) (2) (1) (2)
Announcement Dummy -3.833 -7.335 -3.629 -6.466
(5.98)*** (10.86)*** (5.95)*** (10.29)***
Announcement*Palm 7.444 7.995 7.655 7.510
(12.13)*** (11.63)*** (14.38)*** (12.36)***
Effect of Implementation Policy Implement. Dummy -0.917 -4.211 -0.049 -2.640
(1.41) (6.21)*** (0.08) (4.03)***
Policy Implement.*Palm 6.471 6.894 4.630 4.318
(12.18)*** (11.96)*** (9.47)*** (7.84)***
Diesel Price
0.169
0.075
(4.89)***
(2.03)**
Dummy if World Price was rising (DW)
-0.799
-0.298
(1.18)
(0.43)
DW*palm
-1.057
-1.938
(1.86)*
(3.52)***
Relative world prices of palm/soy
-44.834
-40.001
(16.12)***
(13.19)***
Relative world prices of wheat/rice
-3.664
-2.836
(4.28)***
(3.37)***
Intercept 17.766 10.012 14.148 10.135
(44.20)*** (5.70)*** (39.44)*** (5.50)***
Observations 1932 1932 1932 1932
Lag Length 1 1 1 1
Controls
Year, Quarter, Product Fixed effects Yes Yes Yes Yes
Ramadan Dummies No Yes No Yes
Note: Standard errors corrected for heteroskedasticity and Auto-correlation using Newey and West (1987) procedure
t statistics in parentheses
* significant at 10%; ** significant at 5%; *** significant at 1%
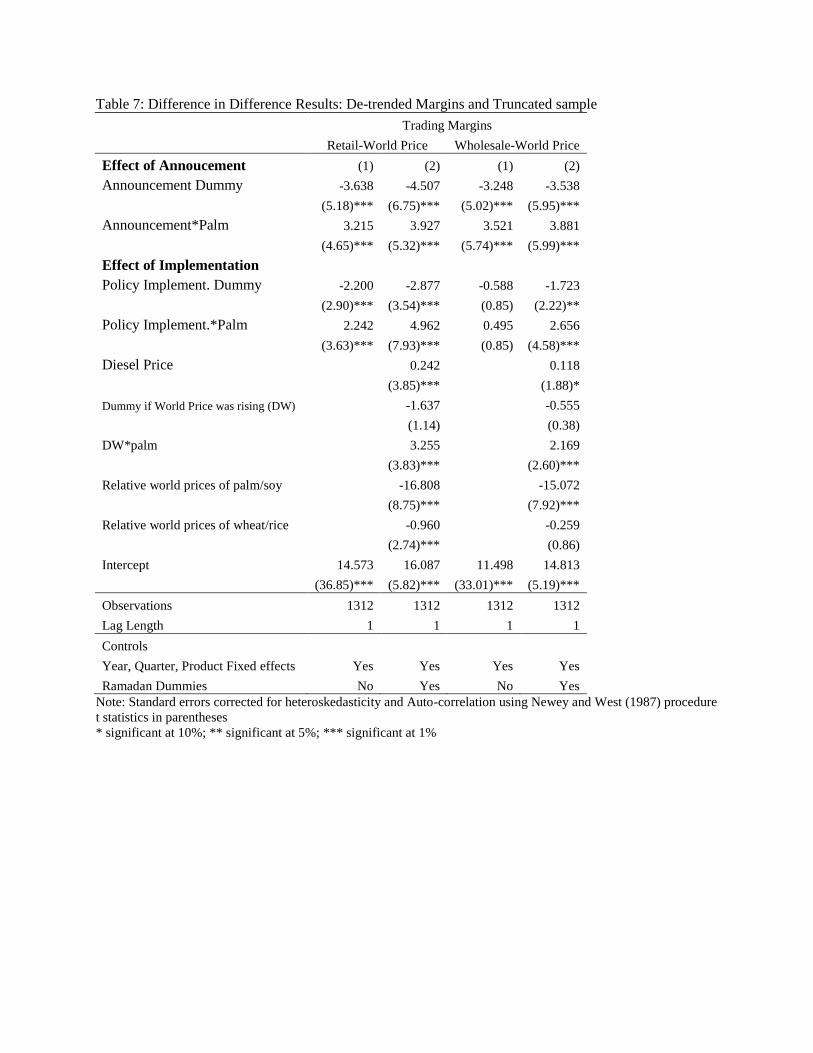
Table 7: Difference in Difference Results: De-trended Margins and Truncated sample
Trading Margins
Retail-World Price Wholesale-World Price
Effect of Annoucement (1) (2) (1) (2)
Announcement Dummy -3.638 -4.507 -3.248 -3.538
(5.18)*** (6.75)*** (5.02)*** (5.95)***
Announcement*Palm 3.215 3.927 3.521 3.881
(4.65)*** (5.32)*** (5.74)*** (5.99)***
Effect of Implementation Policy Implement. Dummy -2.200 -2.877 -0.588 -1.723
(2.90)*** (3.54)*** (0.85) (2.22)**
Policy Implement.*Palm 2.242 4.962 0.495 2.656
(3.63)*** (7.93)*** (0.85) (4.58)***
Diesel Price
0.242
0.118
(3.85)***
(1.88)*
Dummy if World Price was rising (DW)
-1.637
-0.555
(1.14)
(0.38)
DW*palm
3.255
2.169
(3.83)***
(2.60)***
Relative world prices of palm/soy
-16.808
-15.072
(8.75)***
(7.92)***
Relative world prices of wheat/rice
-0.960
-0.259
(2.74)***
(0.86)
Intercept 14.573 16.087 11.498 14.813
(36.85)*** (5.82)*** (33.01)*** (5.19)***
Observations 1312 1312 1312 1312
Lag Length 1 1 1 1
Controls
Year, Quarter, Product Fixed effects Yes Yes Yes Yes
Ramadan Dummies No Yes No Yes
Note: Standard errors corrected for heteroskedasticity and Auto-correlation using Newey and West (1987) procedure
t statistics in parentheses
* significant at 10%; ** significant at 5%; *** significant at 1%
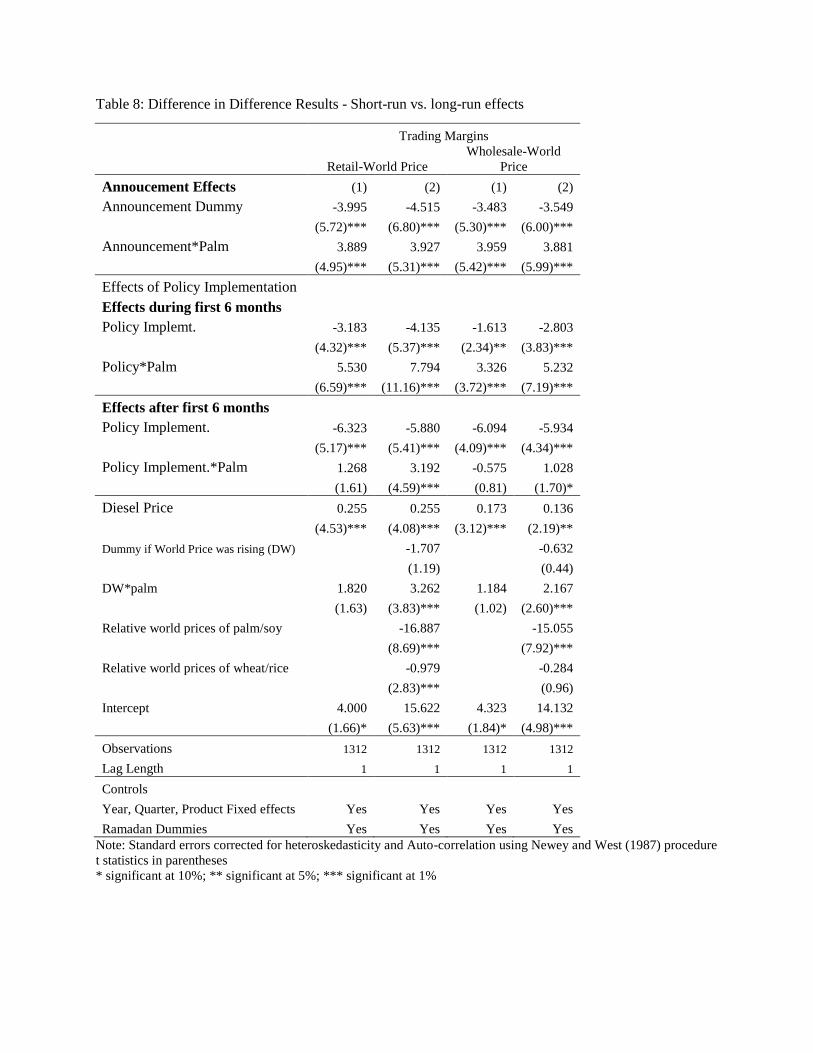
Table 8: Difference in Difference Results - Short-run vs. long-run effects
Trading Margins
Retail-World Price
Wholesale-World
Price
Annoucement Effects (1) (2) (1) (2)
Announcement Dummy -3.995 -4.515 -3.483 -3.549
(5.72)*** (6.80)*** (5.30)*** (6.00)***
Announcement*Palm 3.889 3.927 3.959 3.881
(4.95)*** (5.31)*** (5.42)*** (5.99)***
Effects of Policy Implementation Effects during first 6 months Policy Implemt. -3.183 -4.135 -1.613 -2.803
(4.32)*** (5.37)*** (2.34)** (3.83)***
Policy*Palm 5.530 7.794 3.326 5.232
(6.59)*** (11.16)*** (3.72)*** (7.19)***
Effects after first 6 months Policy Implement. -6.323 -5.880 -6.094 -5.934
(5.17)*** (5.41)*** (4.09)*** (4.34)***
Policy Implement.*Palm 1.268 3.192 -0.575 1.028
(1.61) (4.59)*** (0.81) (1.70)*
Diesel Price 0.255 0.255 0.173 0.136
(4.53)*** (4.08)*** (3.12)*** (2.19)**
Dummy if World Price was rising (DW)
-1.707
-0.632
(1.19)
(0.44)
DW*palm 1.820 3.262 1.184 2.167
(1.63) (3.83)*** (1.02) (2.60)***
Relative world prices of palm/soy
-16.887
-15.055
(8.69)***
(7.92)***
Relative world prices of wheat/rice
-0.979
-0.284
(2.83)***
(0.96)
Intercept 4.000 15.622 4.323 14.132
(1.66)* (5.63)*** (1.84)* (4.98)***
Observations 1312 1312 1312 1312
Lag Length 1 1 1 1
Controls Year, Quarter, Product Fixed effects Yes Yes Yes Yes
Ramadan Dummies Yes Yes Yes Yes
Note: Standard errors corrected for heteroskedasticity and Auto-correlation using Newey and West (1987) procedure
t statistics in parentheses
* significant at 10%; ** significant at 5%; *** significant at 1%
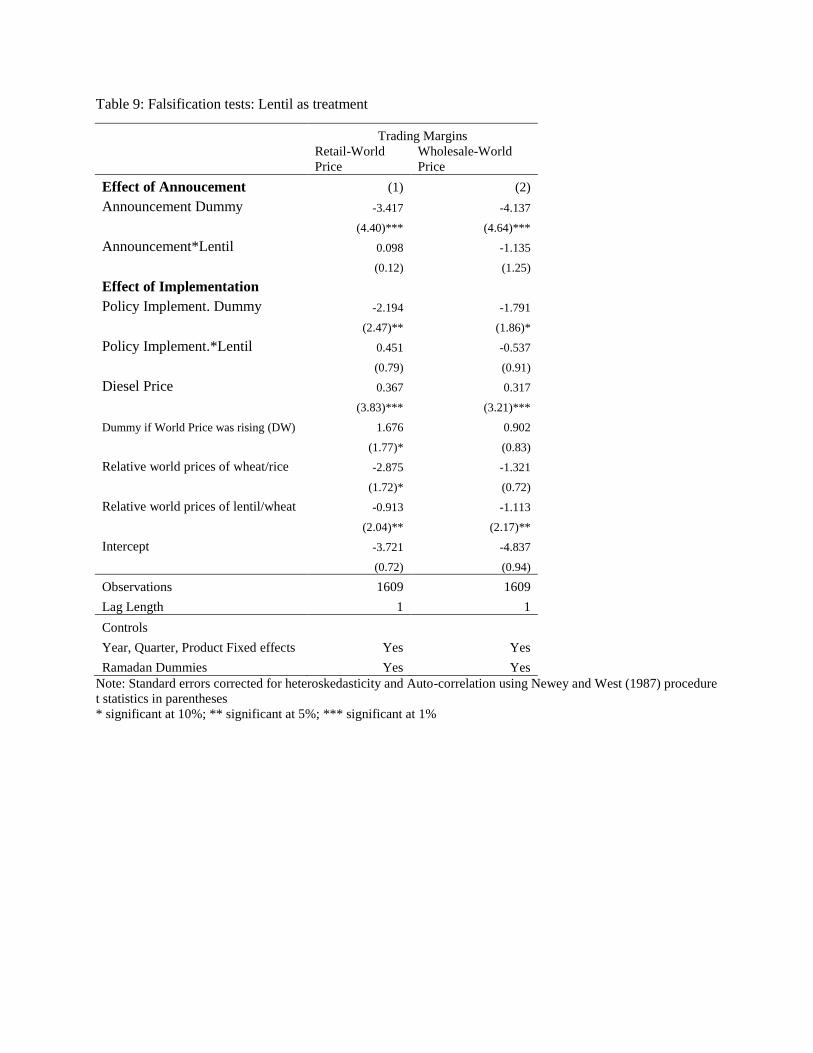
Table 9: Falsification tests: Lentil as treatment
Trading Margins
Retail-World
Price
Wholesale-World
Price
Effect of Annoucement (1) (2)
Announcement Dummy -3.417 -4.137
(4.40)*** (4.64)***
Announcement*Lentil 0.098 -1.135
(0.12) (1.25)
Effect of Implementation Policy Implement. Dummy -2.194 -1.791
(2.47)** (1.86)*
Policy Implement.*Lentil 0.451 -0.537
(0.79) (0.91)
Diesel Price 0.367 0.317
(3.83)*** (3.21)***
Dummy if World Price was rising (DW) 1.676 0.902
(1.77)* (0.83)
Relative world prices of wheat/rice -2.875 -1.321
(1.72)* (0.72)
Relative world prices of lentil/wheat -0.913 -1.113
(2.04)** (2.17)**
Intercept -3.721 -4.837
(0.72) (0.94)
Observations 1609 1609
Lag Length 1 1
Controls
Year, Quarter, Product Fixed effects Yes Yes
Ramadan Dummies Yes Yes
Note: Standard errors corrected for heteroskedasticity and Auto-correlation using Newey and West (1987) procedure
t statistics in parentheses
* significant at 10%; ** significant at 5%; *** significant at 1%
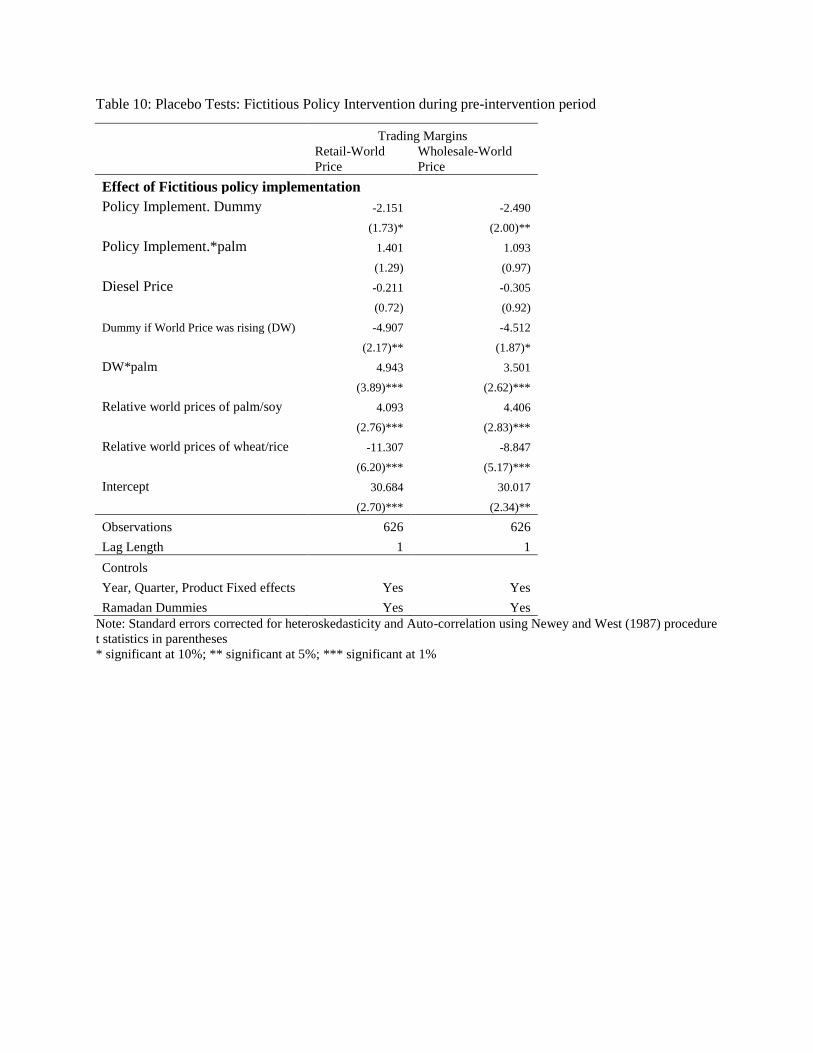
Table 10: Placebo Tests: Fictitious Policy Intervention during pre-intervention period
Trading Margins
Retail-World
Price
Wholesale-World
Price
Effect of Fictitious policy implementation Policy Implement. Dummy -2.151 -2.490
(1.73)* (2.00)**
Policy Implement.*palm 1.401 1.093
(1.29) (0.97)
Diesel Price -0.211 -0.305
(0.72) (0.92)
Dummy if World Price was rising (DW) -4.907 -4.512
(2.17)** (1.87)*
DW*palm 4.943 3.501
(3.89)*** (2.62)***
Relative world prices of palm/soy 4.093 4.406
(2.76)*** (2.83)***
Relative world prices of wheat/rice -11.307 -8.847
(6.20)*** (5.17)***
Intercept 30.684 30.017
(2.70)*** (2.34)**
Observations 626 626
Lag Length 1 1
Controls
Year, Quarter, Product Fixed effects Yes Yes
Ramadan Dummies Yes Yes
Note: Standard errors corrected for heteroskedasticity and Auto-correlation using Newey and West (1987) procedure
t statistics in parentheses
* significant at 10%; ** significant at 5%; *** significant at 1%
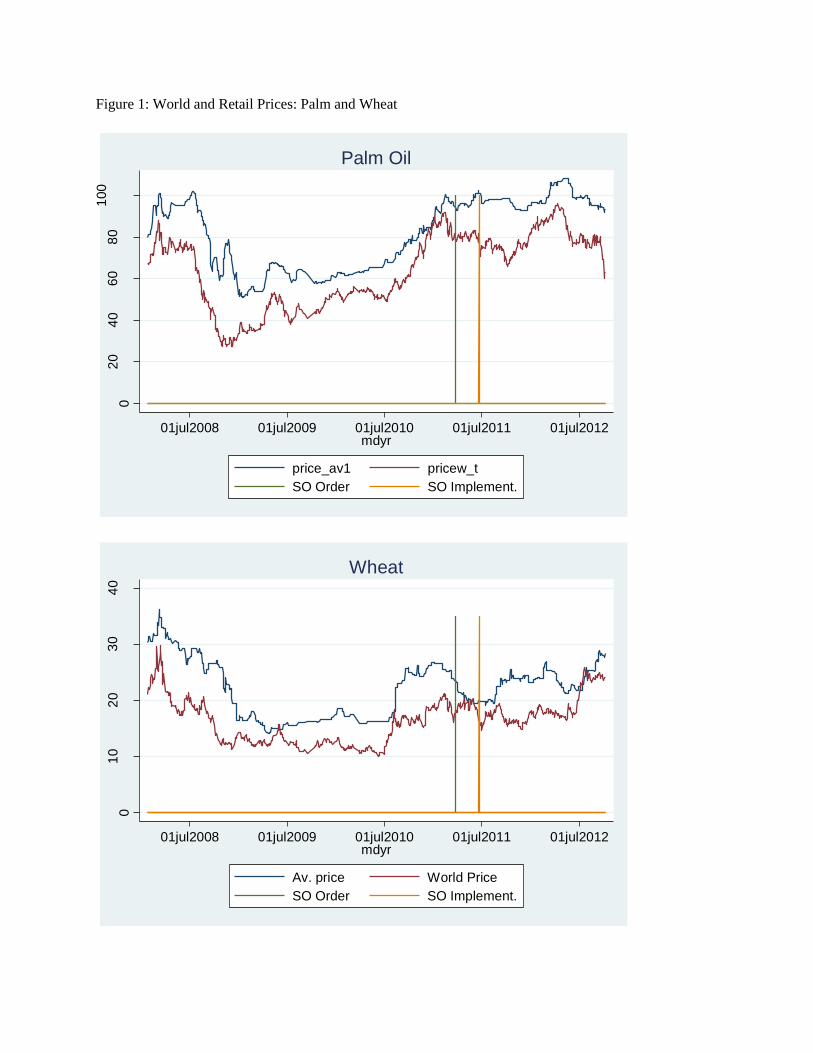
Figure 1: World and Retail Prices: Palm and Wheat
02
04
06
08
01
00
01jul2008 01jul2009 01jul2010 01jul2011 01jul2012mdyr
price_av1 pricew_t
SO Order SO Implement.
Palm Oil
01
02
03
04
0
01jul2008 01jul2009 01jul2010 01jul2011 01jul2012mdyr
Av. price World Price
SO Order SO Implement.
Wheat
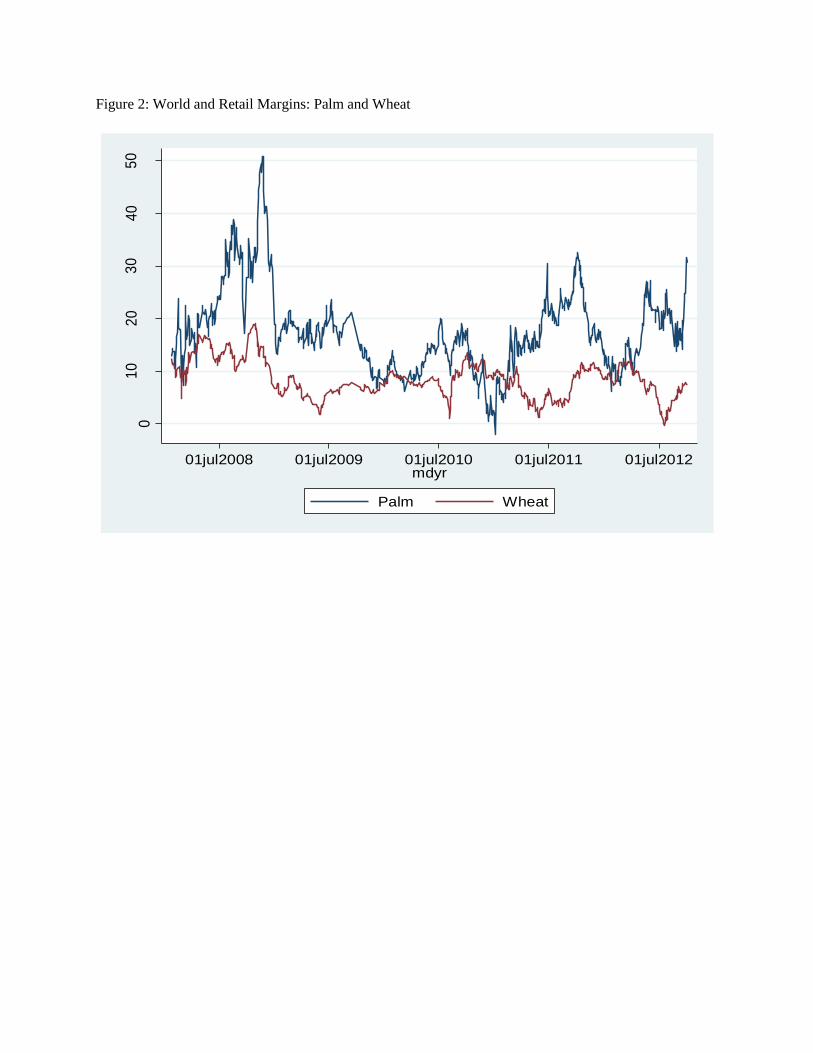
Figure 2: World and Retail Margins: Palm and Wheat
01
02
03
04
05
0
Ma
rgin
be
twee
n D
om
est
ic R
eta
il a
nd
worl
d P
rice
01jul2008 01jul2009 01jul2010 01jul2011 01jul2012mdyr
Palm Wheat

Figure 3: Palm Oil World-Retail Margins during pre-intervention
Figure 4: Wheat World-Retail Margins during pre-intervention
010
20
30
40
50
Marg
in b
etw
een
Dom
estic R
eta
il a
nd
worl
d P
rice
100 200 300 400 500 600timet
bandwidth = .8
Lowess smoother
05
10
15
20
Marg
in b
etw
een
Dom
est
ic R
eta
il a
nd
worl
d P
rice
100 200 300 400 500 600timet
bandwidth = .8
Lowess smoother
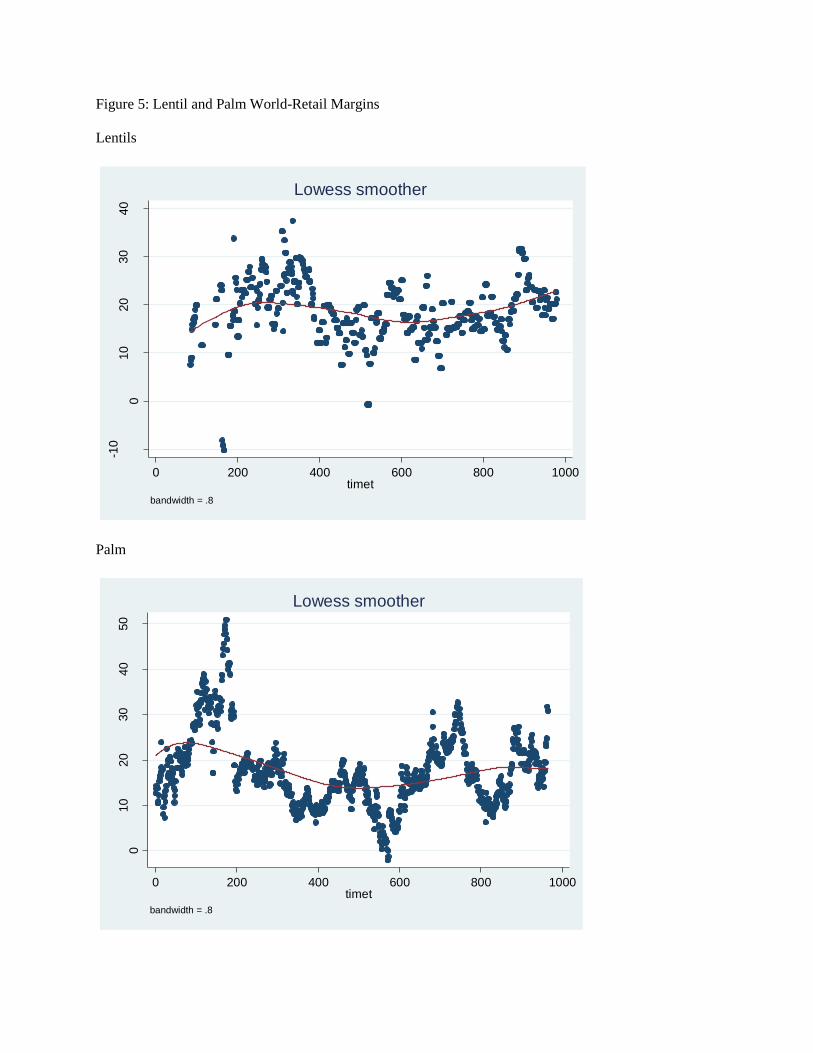
Figure 5: Lentil and Palm World-Retail Margins
Lentils
Palm
-10
010
20
30
40
Marg
in b
etw
een
Dom
estic R
eta
il a
nd
worl
d P
rice
0 200 400 600 800 1000timet
bandwidth = .8
Lowess smoother
010
20
30
40
50
Marg
in b
etw
een
Dom
estic R
eta
il a
nd
worl
d P
rice
0 200 400 600 800 1000timet
bandwidth = .8
Lowess smoother
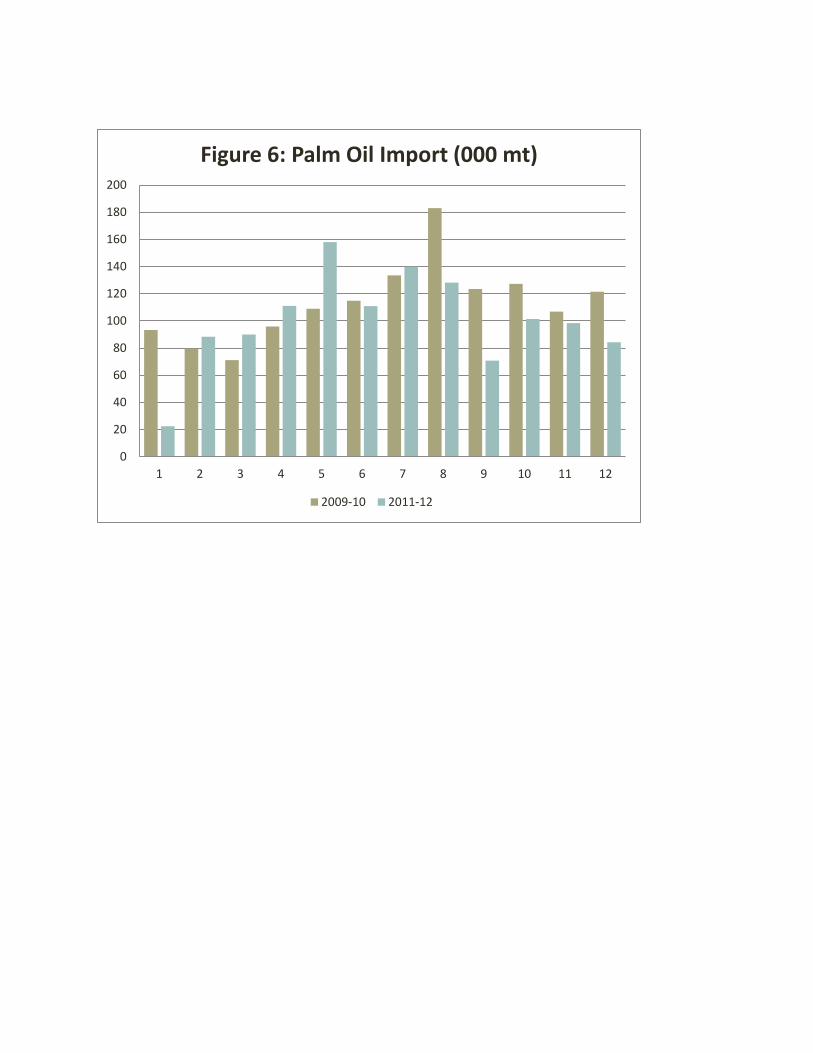
0
20
40
60
80
100
120
140
160
180
200
1 2 3 4 5 6 7 8 9 10 11 12
Figure 6: Palm Oil Import (000 mt)
2009-10 2011-12