food product environmental footprint literature … product environmental footprint literature...
TRANSCRIPT

Food Product Environmental Footprint Literature Summary:
Packaging and Wasted Food
with support from
The Oregon Sustainability Board
A report by: Center for Sustainable Systems, University of Michigan
Martin Heller September 2017

This page is intentionally left blank.

1
Executive Summary:
Packaging and Wasted Food An estimated 30-40% of the edible food available in the U.S. is wasted. The environmental
burden – energy use, water use, greenhouse gas emissions, and other emissions – associated
with producing all of that wasted food adds up. One study found that food losses increased the carbon footprint of the
average American diet by 39%; across the entire U.S. population, the emissions associated just with producing that
wasted food annually is equivalent to the emissions from 33 million average passenger vehicles driven for a full year. In
response to growing awareness of the severity of food waste, in 2015, the USDA and the US EPA announced the first
U.S. food waste reduction goal, calling for a 50% reduction by 2030.
Packaging plays an important role in protecting food from damage and contamination, and extends the useful life of food
items on the retail shelf and at home, thus potentially reducing wasted food and its environmental impacts. In short,
because of the large amount of resources that go in to producing food, efforts to reduce food waste by increasing
packaging can sometimes lead to significant reductions in environmental impact, even when the environmental impact of
additional packaging is taken into account. Reduction of food waste means avoiding the environmental impacts of
producing, processing and distributing the wasted food.
Key Findings Food Products and Packaging Whether “better” packaging that increases shelf life or makes it easier to get the last bit of content out of the container
results in a net environmental benefit can be very case specific. When evaluating environmental impacts, packaging
should be evaluated along with the product chain where it provides the service of delivering safe and nutritious food to the
consumer. Customer interest in “green” packaging options such as recyclability often encourages a focus on design for
recyclability rather than sustainability writ large.
“The whole value chain has a responsibility to explain that sustainability is not synonymous with recycling, recyclability,
recycled content, biodegradability and other popular buzz words, but that it is the overall resource efficiency of the
supply chain that should be the main priority.” (Russell, 2014)
Average carbon footprint of food product production, processing and packaging

2
An important parameter that emerges in these evaluations is the ratio between the environmental impact of producing the
food (agricultural production plus processing) and the impact of producing and disposing of the packaging. If the impact,
for example greenhouse gas emissions (GHGE), of producing the food is very large relative to the GHGE of producing the
packaging, then changes in packaging that lead to food waste reductions will likely result in a net decrease in total system
GHGE, even if the impacts from packaging increase. On the other hand, if the impacts of packaging are similar or greater
than the impacts of producing the food, it is far less likely that more packaging will have a net benefit.
One observation from the figure above is that the average GHGE per kilogram of food associated with the manufacturing
of packaging materials is low for most food groups. Foods with relatively large GHGE from production such as meats, fish,
and dairy therefore have a propensity for large differences between food production and packaging production. This
means that packaging leading to reductions in food waste may likely result in net system reductions in GHGE, although
ultimately this is dependent on the specifics of each case.
Packaging can affect food waste in a variety of ways. Perhaps the most obvious is by extending shelf life, delaying the
spoilage processes brought on by microorganisms, exposure to oxygen, or loss of moisture. Translating shelf life into food
waste rates – either at the retail level or in people’s homes – is extremely complex and depends on numerous factors, but
it is reasonable to assume that increasing shelf life decreases the likelihood that food will be wasted. Packaging also
protects food from physical damage (bruises, crushing) and contamination throughout the product chain, and can
influence food waste in many other ways.
Establishing food waste rates is challenging and makes it difficult to establish absolute standards to balance between food
waste and food packaging. Awareness of the balance, however, can lead to important perception shifts by packaging
designers, food system stakeholders, and consumers alike.
Conclusions This summary of the environmental interplay between food packaging and food waste offers a number of valuable
conclusions:
In general, the GHGE associated with manufacturing food packaging is typically small relative to the emissions associated with producing and processing the food itself.
Packaging can influence food waste in a variety of ways. Often, changes in packaging can lead to reductions in food waste, even though these changes, such as increases in packaging weight or a shift to a non-recyclable material, may be perceived as undesirable.
The literature demonstrates that changes in food packaging that lead to food waste reductions can result in net reductions in environmental impacts, even if the impacts of the packaging itself increases.
Future research and abatement strategies are likely best focused on foods with high environmental impacts (e.g., meats) and those with high loss rates (e.g., fresh fruits and vegetables).

3
Introduction Nearly everyone who has encountered a shrink-wrapped cucumber or a pre-cut and packaged
avocado has an understandable initial reaction: “Why? Nature has given these foods their own
compostable package. Why add plastic?” Beyond such extreme examples, grocery shoppers
today are faced with aisles of packaged goods – fresh, prepared and processed food items.
Once in the home, the bulk of the packaging ends up in the recycling bin – or trash because it’s
not recyclable – so it’s hard not to feel like food packaging is just a big waste of resources.
But the 1.5 grams of plastic wrapped around the cucumber can extend its shelf life from 3 days
to over 2 weeks (naked cucumbers lose a lot of moisture, making them less appealing) (Russell,
2014). The refrigerated and packaged avocado halves have a shelf life that is simply not
possible with whole avocados. Often, this extended shelf life can result in reduced food waste in
stores and in our homes. Food items packaged in single servings can seem like a big waste of
packaging, but for individuals or small families, they may lead to less food spoiling before it can
be consumed. Other packages designed to reduce food residue remaining in the package or to
aid in proper portioning can also potentially cut food waste. In addition, the packaging used in
shipping and handling of food reduces damage that would otherwise lead to environmentally
costly food from being sold and consumed. In short, because of the large amount of resources
that go in to producing food, efforts to reduce food waste can sometimes lead to significant
savings in environmental impact, even when the environmental impact of, in these instances,
additional packaging is taken into account.
An estimated 30-40% of the edible food available in the U.S. is wasted. The environmental
burden – energy use, water use, greenhouse gas emissions, eutrophying emissions –
associated with producing all of that wasted food adds up. One study found that food losses
increased the carbon footprint of the average American diet by 39%; across the entire U.S.
population, the emissions associated just with producing that wasted food annually is equivalent
to the emissions from 33 million average passenger vehicles driving 11,346 miles each (Heller
and Keoleian, 2015). Estimates by the Food and Agriculture Organization of the UN (FAO) show
that globally, food produced and not eaten has an annual carbon footprint of 3.3 gigatonnes
CO2 equivalents and production of that food uses 30% of the world’s agricultural land area. If
this food waste were a country, it would be the 3rd top greenhouse gas emitter after the U.S. and
China (FAO, 2013). In this global estimate, 20% of the carbon footprint of the wasted food
comes from disposal in landfills, whereas 63% is due to its agricultural production. In the U.S.,
an even smaller percentage of the food waste carbon footprint is due to disposal. In response to
growing awareness of the severity of food waste, on September 16, 2015, USDA and US EPA
announced the first U.S. food waste reduction goal, calling for a 50% reduction by 20301.
1 EPA’s goal is to halve food waste going to landfills from retail, food service, and households from 218.9
pounds/person/year to 109.4 pounds/person/year in 2030. USDA’s goal is to halve food loss at retail and
consumer level (in home and out of home consumption) from 133 billion pounds to 66.5 billion pounds in
2030.

4
Of course, packaging also carries its own environmental burden. It takes energy and resources
to produce it as well as dispose of it. According to the US EPA, containers and packaging, many
of which are used for food, make up the largest portion (30%) of the generated U.S. municipal
solid waste (MSW). Only about half of the containers and packaging are currently recycled. Yet,
an additional 15% of the MSW is food, and 76% of that food ends up in a landfill (US EPA,
2016). A recent meta-analysis of waste characterization studies in the U.S. found that the
proportion of food waste in MSW has increased with statistical significance from 1995 to 2013,
and is significantly higher in the West region than in the East or Central region. This study also
found the average per-capita food waste rate to be 0.615 pounds per person per day (Thyberg
et al., 2015).
When we look at the environmental impact across the whole product chain of producing and
consuming food, there can be a trade-off between the contribution from food packaging and the
contributions from food waste. Sometimes, increases in the amount of packaging or the use of
packaging with a greater environmental impact (for example, more resource intensive materials)
can lead to reductions in food waste across the product chain. This food waste reduction means
avoiding the environmental impact of producing, processing and distributing the wasted food.
Life cycle assessment (LCA) can be a valuable tool in evaluating these trade-offs and helping
us understand the role that food packaging plays in controlling, and potentially reducing, food
waste.
FIGURE 1. Potential occurrences of food waste along the life cycle of food products and some packaging used.
This literature summary is one of a series commissioned by the Oregon Department of Environmental
Quality. For additional information on the background and objectives of these summaries, as well as on
LCA methods and definitions of terms, please refer to the Food Product Environmental Footprint Foreword.

5
The Concept When evaluating environmental impacts, packaging should be evaluated along with the product
chain where it provides the service of delivering safe and nutritious food to the consumer. Yet, it
is common for the impacts of packaging to be evaluated independently from the product.
Customer interest in “green” packaging options such as recyclability often encourages a focus
on design for recyclability rather than sustainability writ large. “The whole value chain has a
responsibility to explain that sustainability is not synonymous with recycling, recyclability,
recycled content, biodegradability and other popular buzz words, but that it is the overall
resource efficiency of the supply chain that should be the main priority” (Russell, 2014). While
all of these “green” packaging concepts are popular endeavors, they don’t necessarily translate
into the lowest environmental footprint for the product/package system. Similarly, evaluation of
the food life cycle should include the impacts of food waste generated throughout the product
chain, especially if the evaluation involves comparisons of alternative packaging/delivery
options. A recent collaborative effort in the U.S. between leaders in business, non-profit,
foundations and government reports that packaging adjustments alone have the potential to
prevent 189,000 metric tonnes of food waste annually in the U.S., with an economic value of
$715 million; active intelligent packaging aimed at slowing spoilage offers an additional potential
65,000 metric tonnes of food waste avoided (ReFED, 2016).
While perhaps not commonplace, there have been a number of LCA studies in the literature that
consider the environmental trade-off between food waste and food packaging. An important
parameter that emerges in these evaluations is the ratio between the environmental impact of
producing the food (agricultural production + processing) and the impact of producing and
disposing of the packaging (Wikstrom and Williams, 2010). If the impact, for example
greenhouse gas emissions (GHGE), of producing the food is very large relative to the GHGE of
producing the packaging, then changes in packaging that lead to food waste reductions will
likely result in a net decrease in total system GHGE, even if the impacts from packaging
increase. On the other hand, if the impacts of packaging are similar or greater than the impacts
of producing the food, it is far less likely that reducing food waste at the expense of more
packaging will have a net benefit.
Figure 2 shows the GHGE from agricultural production plus processing for a large number of
food LCAs, alongside the GHGE from packaging production. These studies include, but are not
limited to, the food commodities covered in the companion Product Environmental Footprint
Summaries, and represent a wide range of specific foods and packaging and delivery options.
Foods have been aggregated into broad food type categories in order to demonstrate some
very generic trends. It is important to note that the GHGEs in Figure 2 are presented per
kilogram of food – not per unit of packaged food. This is important because lightweight foods
like lettuce may require more packaging per kilogram of food delivered than dense foods.
One observation from Figure 2 is that the average GHGE per kilogram of food associated with
the manufacturing of packaging materials is low for all foods. Foods with relatively large GHGE
from production such as meats, fish, and dairy therefore have a propensity for large differences
between food production and packaging production. This means that packaging leading to
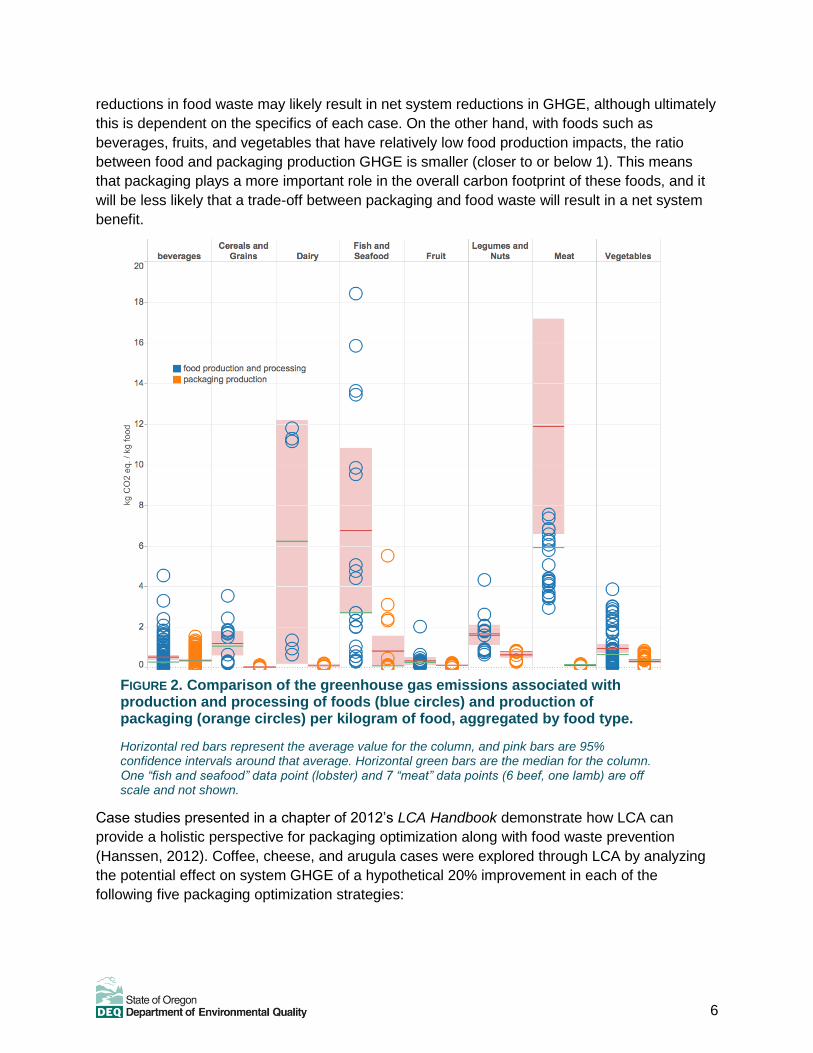
6
reductions in food waste may likely result in net system reductions in GHGE, although ultimately
this is dependent on the specifics of each case. On the other hand, with foods such as
beverages, fruits, and vegetables that have relatively low food production impacts, the ratio
between food and packaging production GHGE is smaller (closer to or below 1). This means
that packaging plays a more important role in the overall carbon footprint of these foods, and it
will be less likely that a trade-off between packaging and food waste will result in a net system
benefit.
Case studies presented in a chapter of 2012’s LCA Handbook demonstrate how LCA can
provide a holistic perspective for packaging optimization along with food waste prevention
(Hanssen, 2012). Coffee, cheese, and arugula cases were explored through LCA by analyzing
the potential effect on system GHGE of a hypothetical 20% improvement in each of the
following five packaging optimization strategies:
FIGURE 2. Comparison of the greenhouse gas emissions associated with production and processing of foods (blue circles) and production of packaging (orange circles) per kilogram of food, aggregated by food type.
Horizontal red bars represent the average value for the column, and pink bars are 95% confidence intervals around that average. Horizontal green bars are the median for the column. One “fish and seafood” data point (lobster) and 7 “meat” data points (6 beef, one lamb) are off scale and not shown.

7
Reduce food waste in the total value chain
Increase transport efficiency by improving the degree of filling or packing of product in
primary, secondary and tertiary packaging2
Increase use of recycled materials in the packaging (within restrictions defined by food safety regulations) and increase recycling of materials after use
Reduce amount of materials in primary, secondary and tertiary packaging
Select low-impact materials and suppliers with low-impact production
Results are summarized in Table 1. In most cases, food waste reduction had the largest impact
on overall product/packaging system GHGE. However, with arugula salad in a plastic
(polyethylene terephthalate, PET) tray and wrapped in a plastic (polypropylene, PP) film, a
hypothetical 20% reduction in food waste led to only 5% reduction in system GHGE, whereas
improvements in packaging had significant effects. Again, these results can be broadly
explained by the ratio in impact between producing the food and its packaging. In other words,
when the impacts of food production outweigh those of packaging production, the influences of
food waste become more relevant. When the ratio is small (as with the arugula example), efforts
to reduce system environmental impact may be better directed at reducing the impacts of
packaging.
TABLE 1. Demonstration of the influence of a number of hypothetical improvement scenarios on food life cycle GHGE. Data from (Hanssen, 2012).
A 20% improvement in…
Food waste reduction
Degree of product packing
Use of recycled materials
Reduced material
consumption or use of
low-impact materials
…leads to the following GHGE reduction over the product/package life cycle
Coffee 19% 0.7% 0.5% 0.7%
Whole cheese 17% 2% 0.5% 1%
Sliced cheese 11% 2% 4% 5%
Arugula salad 5% 2% 12% 17%
2 Primary packaging is in contact with the product and goes home with the consumer. Secondary
packaging typically encloses the primary package (e.g., a box around wrapped cheese). Tertiary
packaging is used for distribution (pallets, cardboard boxes, shrink wrap) and is typically not seen by
consumers.

8
Packaging’s Influence on Food Waste Packaging can affect food waste in a variety of ways. Perhaps the most obvious is by extending
shelf life, delaying the spoilage processes brought on by microorganisms, exposure to oxygen,
or loss of moisture. While consumers may prefer to eat food as fresh as possible, we don’t all
live on farms, so processing and distribution of our food is a necessary reality. Extending the
shelf life increases the likelihood that a food will be purchased and eaten before it becomes
unsafe or undesirable. It is a primary reason why a food manufacturer would choose a non-
recyclable material, like a multilayer plastic film that provides a superior barrier to oxygen and/or
moisture. Translating shelf life into food waste rates – either at the retail level or in people’s
homes – is extremely complex and depends on numerous factors, but it is reasonable to
assume that increasing shelf life decreases the likelihood that food will be wasted. Packaging
also protects food from physical damage (bruises, crushing) and contamination throughout the
product chain, and can influence food waste in a variety of other ways. Wikstrom et al. (2014)
offer a list of packaging attributes that can “script” individual behavior and experiences by
enabling or restricting consumers to act in a particular way, creating the potential to reduce
(primarily consumer-level) food waste. These attributes include: mechanical protection;
physical-chemical protection; resealability; easy to: open, grip, dose and empty; contains the
correct quantity; supplies food safety/freshness information; and facilitates sorting of household
waste. Whether “better” packaging that increases shelf life or makes it easier to get the last bit
of mayonnaise out of the container results in a net environmental benefit, is, unfortunately,
rather case specific. Answering such questions requires good data on food waste rates, which is
very challenging to generate, especially at the household level. Still, a number of case studies,
exemplified below, demonstrate that more or better packaging sometimes can improve overall
environmental performance.
Research Examples The following examples showcase the trade-off between food waste and food packaging as
elucidated by LCA. In many of the examples, however, food waste rates have been assumed in
order to demonstrate the impact of food waste. This reflects the challenge in getting good
empirical data on food waste and the need for additional research in this area.
The Austrian environmental consulting firm, Denkstatt GmbH (2014), offers a demonstration of
the food packaging/waste balance using empirical waste rate data. An online slide presentation
summarizes six case studies developed in partnership with retailers, packaging producers,
polymer producers, industry organizations and research institutes. The cases show reduced
retail-level food waste due to changes in packaging for: sirloin steak, “Bergbaron” cheese,

9
plaited yeast bun, garden cress, and cucumber. In all cases except the cucumber, the studies
show reduced overall GHGE as a result of reduced food waste (that is, the GHGE savings from
reduced food waste were greater than the increases in GHGE due to improved packaging). In
case of the cucumber, shrink-wrapping reduced the retail waste rate from 9.4% to 4.6%, but this
food waste reduction was not sufficient to balance the increased GHGE of the packaging.
However, the researchers demonstrate a number of reasonable parameter changes that would
shift the calculation to a net benefit for the packaged option, including: reducing food waste rate
below 3.7% (household food waste was not included in the baseline), reducing the thickness of
the film by 22% (films of varied thickness are used and the baseline calculation used an
average value), increasing transport distance by 60% (baseline calculation assumes local
production)3, growing the cucumber in a greenhouse (baseline calculation used open-field
growing)3, or if the film packaging is separated and recycled 66% of the time (baseline
calculation assumed 33%). This clearly demonstrates that in these cases, the balance between
food waste and food packaging can be very sensitive to even minor system changes.
In a consumer-waste oriented case study, Wikstrom et al. (2014), use LCA to consider the
packaging attributes “contains the correct quantity” and “easy to dose” to determine the overall
impact on GHGE. Yogurt and rice packaging options of different size, material composition, and
convenience features (e.g., par-boiled rice or a rice container with measuring cup to assist with
portion control) were first compared on the basis of the environmental impact of the packaging
system itself. This showed that the packages with the lowest material weight per unit of food
had the lowest environmental impact. When food waste was added into the analysis (based on
assumed rates of 5, 12 and 20% food waste at the consumer level), differences in packaging
material production became negligible. The results of this study provide a compelling case for
why food waste reductions are important to incorporate into LCA analyses because it can
drastically change what system improvements are recommended from the study. Here,
incorporation of food losses showed that an increase in packaging that reduces food waste
could help achieve a net positive environmental outcome for the system.
Another study aimed to demonstrate the influence of packaging attributes on user behavior with
regard to food waste, recycling and cleaning of packaging after use (Wikström et al., 2016). A
comparison was made between ground beef delivered in a plastic tray with film overwrap and in
a plastic tube (chub package that looks like a sausage). When only the packaging materials
(production and disposal) are considered, the tube represents the lower GHGE scenario,
primarily because it involves less material. The story changes when indirect effects of the
package are considered; GHGE associated with residue beef sticking to the tube (measured at
1% of package contents, compared to no residue for the tray) outcompete the differences in
packaging material. The authors further argue that because the tube is less easy to clean and
3 Increasing both transport distance as well as growing the cucumber in a greenhouse will effectively
increase the GHGE associated with production (and distribution) of the cucumber. This increases the
ratio of food production impacts to packaging production impacts, and increases the effect of food waste
on the overall carbon footprint. Hence, there is a “tipping point” where added impact from transportation
makes the benefit of the cucumber packaging in reducing food waste outweigh the addition of the
packaging itself.

10
separate into different material fractions, and is perceived by the end user as having a low value
compared to the tray, it is less likely to be recycled, further adding to its environmental impact.
An acknowledged omission from this study, due to lack of data, was food waste due to spoilage.
The tube packaging actually offers better shelf life, and a reduction in wastage of 2% across
other stages (retail and consumer) would again shift the environmentally preferred option back
to the tube. This example speaks to the importance of including indirect effects in making
environmental assessments and the sometimes delicate balance between food packaging and
food waste.
A different perspective on the relationship between packaging and food waste comes from a
recent study based in Norway that compares the waste generation, energy use and GHGE from
the whole product chain of three meals (Hanssen et al., 2017). The meals were composed of
nearly identical food composition (red meat with sauce, peas, and potatoes), but prepared in
different ways: 1) from fresh ingredients at home, 2) based on semi-prepared ingredients4, and
3) ready-to-eat meals. Supply chain waste was based on data from the manufacturing and retail
sector, whereas consumer food preparation behavior and waste (both from preparing and plate
left-overs) were derived from a “test kitchen” experiment with 17 individuals. The results from
this study indicate that the ready-to-eat meal had higher energy use, higher GHGE and
generated more waste, except for food waste in the consumer stage (see Figure 3 for a detailed
distribution of GHGE, and Table 2 for ranking of the three meals).
TABLE 2. Ranking of three different meals according to a variety of characteristics. 1=best performing (least impactful). Adapted from (Hanssen et al., 2017).
Ready-to-
eat meal
Semi-
prepared meal
Home made from
fresh ingredients
Packaging material use 3 1 2
Edible food waste 2 3 1
Total waste generation 2 3 1
Energy use in whole life cycle 3 1 2
Energy use in packaging, distribution and usage 3 1 2
GHGE in whole life cycle 3 1 2
GHGE from packaging, distribution and usage 3 1 2
4 The study does not define specifically what “semi-prepared ingredients” are but presumably this refers
to, for example, a purchased ready-made sauce, perhaps peas that are shelled and frozen, etc.

11
The main reasons for these results were that the ready-to-eat packaging used more materials
than the two other meal types, making distribution less efficient. In addition, a higher percentage
of ready-to-eat product was wasted in retail than for the separate ingredients from other meal
types, which also contributed to higher environmental burdens, as more ingredients had to be
produced to get a full portion. Preventing food waste from retail and use stages would lead to a
13% reduction in GHGE. In truth, this study is evaluating the effects of products aimed at
convenience, which in turn often require additional packaging, and it provides an additional
perspective on the balance between food packaging, food waste, and in this case, consumer
convenience. Here, the product with the greatest packaging impacts (ready-to-eat meal) also
demonstrated the largest food waste at retail, but demonstrated lower consumer food waste.
Research Gaps While the hypothetical case for a trade-off in environmental impact between food waste and
food packaging is well demonstrated, showing the net result of this trade-off for real cases is
0
0.1
0.2
0.3
0.4
0.5
0.6
0.7
0.8
0.9
1
ready to eat meal semi-prepared meal fresh ingredients at home
kilo
gra
m C
O2
eq
. p
er
po
rtio
nwaste treatment
consumer-level food waste
home preparation
wholesale/retail level food waste
transport
packaging
processing/preparation
FIGURE 3. Greenhouse gas emission from the life cycle of three meals, excluding production of consumed ingredients, which dominate other stages.
Emissions due to food waste throughout the product life cycle are reported in the stage where it is wasted. Thus, impacts from producing, packaging and transporting food wasted at retail are included in the retail stage, and impacts of producing, packaging, transporting and retailing food wasted at the consumer level are included in the use stage. This allows for a better understanding of the importance of wasting food and allows for easier detection of the effects of waste reduction. Taken from (Hanssen et al., 2017)

12
hindered by the difficulty in getting good data on food waste rates. Often, retail-level food waste
rate data are available via inventory tracking systems, but those data are rarely, if ever,
analyzed for the purpose of demonstrating the influence of packaging. Food waste rates at the
household level are even more difficult to gather, and to our knowledge, virtually no empirical
data at the specific product level are available. There is also a strong need for research and
method development about how user behavior is influenced by packaging attributes, as well as
how these behavioral factors can best be considered in the environmental assessment.
The examples identified in the literature focus almost exclusively on retail (primary) packaging
and food waste at the retail and consumer stages of the supply chain, which is where most food
waste in the U.S. actually occurs. However, waste does occur earlier in the supply chain (see
Figure 1), and the additional packaging used during distribution (tertiary packaging) can also
influence retail-level food waste. Further research and case studies are needed to understand
packaging/food waste interactions on-farm, during processing, and throughout distribution, as
demonstrated in Figure 1.
The studies summarized here primarily focus on greenhouse gas emissions. While the general
concept of a potential trade-off between food waste and food packaging certainly holds for other
environmental impacts, the balance may be different. Based on a general understanding of
these systems, we can expect the balance in energy use (relative to GHGE) to lean toward
packaging as more impactful because of the embodied energy in packaging and the direct
GHGE (methane and nitrous oxide) from agricultural production. On the other hand, water use
and water quality issues (eutrophication) are typically dominated by agricultural production.
Additional environmental concerns such as human- and eco-toxicity would require specific case
studies.
Conclusions This summary of the environmental interplay between food packaging and food waste offers a
number of valuable conclusions:
In general, the greenhouse gas emissions associated with manufacturing food packaging are small relative to the emissions connected with producing and processing the food itself.
Packaging can influence food waste in a variety of ways. Often, changes in packaging can lead to reductions in food waste, although these changes, such as increases in packaging weight or a shift to a non-recyclable material, may be perceived as undesirable.
Repeated case studies have demonstrated that changes in food packaging that lead to food waste reductions can result in net benefits in environmental impacts, even if the impacts of the packaging itself increases. The likelihood of a net benefit increases as the environmental impact of food production increases.
Establishing food waste rates is challenging and may present a barrier to establishing absolute answers to balance between food waste and food packaging. Awareness of the balance, however, can lead to important perception shifts by packaging designers, food system stakeholders, and consumers alike.
Future research and abatement strategies are likely best focused on foods with high environmental impacts (e.g., meats) and those with high loss rates (e.g., fresh fruits and vegetables).

13
References Conte, A., G. M. Cappelletti, G. M. Nicoletti, C. Russo and M. A. Del Nobile. 2015. Environmental
implications of food loss probability in packaging design. Food Research International 78: 11-17.
Denkstatt GmbH. 2014. How Packaging Contributes to Food Waste Prevention. [Online], Available from
http://denkstatt.at/files/How_Packaging_Contributes_to_Food_Waste_Prevention_V1.2.pdf
Accessed October 28, 2015.
FAO. 2013. Food wastage footprint: Impacts on natural resources Summary Report. Natural Resources
Management and Environment Department, Food and Agriculture Organization of the United
Nations. Available from http://www.fao.org/nr/sustainability/food-loss-and-waste/en/.
Hanssen, M., H., Svanes, E., Schakenda, V., O J. 2012. Life Cycle Assesment as a tool in Food Waste
Reduction and Packaging Optimization - Packaging Innovation and Optimimization in a life cycle
perspective. M. A. Curran (Eds.). Life Cycle Assessment Handbook. A Guide for Environmental
Sustainable Products. Scrivener Publishing LLC: 345-368.
Hanssen, O. J., M. Vold, V. Schakenda, P.-A. Tufte, H. Møller, N. V. Olsen and J. Skaret. 2017.
Environmental profile, packaging intensity and food waste generation for three types of dinner
meals. Journal of Cleaner Production 142, Part 1: 395-402.
Heller, M. C. and G. A. Keoleian. 2015. Greenhouse Gas Emission Estimates of U.S. Dietary Choices and
Food Loss. Journal of Industrial Ecology 19(3): 391-401.
ReFED. 2016. A Roadmap to Reduce U.S, Food Waste by 20 Percent. Available from
http://www.refed.com.
Russell, D. A. 2014. Sustainable (food) packaging–an overview. Food additives & contaminants: Part A
31(3): 396-401.
Silvenius, F., K. Grönman, J. M. Katajajuuri, R. Soukka, H. K. Koivupuro and Y. Virtanen. 2013. The role
of household food waste in comparing environmental impacts of packaging alternatives.
Packaging Technology and Science.
Silvenius, F., J.-M. Katajajuuri, K. Grönman, R. Soukka, H.-K. Koivupuro and Y. Virtanen. 2011. Role of
packaging in LCA of food products (Eds.). Towards Life Cycle Sustainability Management.
Springer: 359-370.
Svanes, E., M. Vold, H. Moller, M. K. Pettersen, H. Larsen and O. J. Hanssen. 2010. Sustainable
Packaging Design: a Holistic Methodology for Packaging Design. Packaging and Technology and
Science 23: 161-175.
Thyberg, K. L., D. J. Tonjes and J. Gurevitch. 2015. Quantification of Food Waste Disposal in the United
States: A Meta-Analysis. Environmental Science & Technology 49(24): 13946-13953.
US EPA. 2016. Advancing Sustainable Materials Management: 2014 Fact Sheet. Available from
https://www.epa.gov/sites/production/files/2016-11/documents/2014_smmfactsheet_508.pdf.
Verghese, K., H. Lewis, S. Lockrey and H. Williams. 2015. Packaging's role in minimizing food loss and
waste across the supply chain. Packaging Technology and Science 28(7): 603-620.

14
Vignali, G. 2016. Life-Cycle Assessment of Food-Packaging Systems. S. S. Muthu (Eds.). Environmental
Footprints of Packaging. Springer Science+Business Media, Singapore.
Wikstrom, F. and H. Williams. 2010. Potential Environmental Gains from Reducing Food Losses Through
Development of New Packaging – A Life-Cycle Model. Packaging Technology and Science 23:
403-411.
Wikström, F., H. Williams and G. Venkatesh. 2016. The influence of packaging attributes on recycling and
food waste behaviour–An environmental comparison of two packaging alternatives. Journal of
Cleaner Production 137: 895-902.
Wikstrom, F., H. Williams, K. Verghese and S. Clune. 2014. The influence of packaging attributes on
consumer behaviour in food-packaging life cycle assessment studies - a neglected topic. Journal
of Cleaner Production 73: 100-108.
Williams, H. and F. Wikström. 2011. Environmental impact of packaging and food losses in a life cycle
perspective: A comparative analysis of five food items. Journal of Cleaner Production 19: 43-48.
Williams, H., F. Wikström and M. Löfgren. 2008. A life cycle perspective on environmental effects of
customer focused packaging development. Journal of Cleaner Production 16: 853-859.
Williams, H., F. Wikström, T. Otterbring, M. Löfgren and A. Gustafsson. 2012. Reasons for household
food waste with special attention to packaging. Journal of Cleaner Production 24: 141-148.
Zhang, H., M. Hortal, A. Dobon, J. M. Bermudez and M. Lara-Lledo. 2015. The Effect of Active Packaging
on Minimizing Food Losses: Life Cycle Assessment (LCA) of Essential Oil Component-enabled
Packaging for Fresh Beef. Packaging Technology and Science 28(9): 761-774.