food safety and environmental services annual report
TRANSCRIPT

FOOD SAFETY AND ENVIRONMENTAL SERVICES
BUREAU OF EPIDEMIOLOGY AND DISEASE CONTROL OFFICE OF ENVIRONMENTAL HEALTH
Annual Report
FY20
16

This page has intentionally been left blank.

Douglas A. Ducey, GovernorState of Arizona
Cara M. Christ, DirectorArizona Department of Health Services
ARIZONA DEPARTMENT OF HEALTH SERVICESBureau of Epidemiology and Disease Control
Office of Environmental HealthFood Safety and Environmental Services Section
150 N. 18th Avenue, Suite 140Phoenix, Arizona 85007-3245
(602) 364-3122
This publication can be made available in alternative format.Please contact the number listed above.
Permission to quote from or reproduce materials from this publication is granted when due acknowledgment is made.
“Equal Opportunity/Reasonable Accommodation Employer”

CONTENTS
Executive Summary 11.0 Introduction 22.0 FY2016 Activities 3
2.1 Food Safety 52.1.1 Inspection Programs 62.1.2 Enforcement 7
2.2 FDA Voluntary National Retail Food Regulatory Program Standards 82.2.1 FDA Cooperate Agreement 92.2.2 Implementing the Program Standards 10
2.3 Conference for Food Protection 122.4 Food Safety Regulation Update 132.5 Foodborne Illness 142.6 Nationwide Outbreaks and Food Recalls 172.7 Bottled Water 202.8 Swimming Pools and Spas 212.9 Public Accommodations 222.10 Trailer Coach Parks 232.11 School Grounds 242.12 Children’s Camps 252.13 Camp Grounds 26
3.0 Home Baked & Confectionery Goods Program 274.0 School & Community Gardens 285.0 Registration and Training of Sanitarians 31
5.1 Trainings Offered for Registered Sanitarians 326.0 Brownfield 337.0 Summary 36
Appendix A 38Appendix B 40Appendix C 41Appendix D 42Appendix E 43

1ANNUAL REPORT 2016
The Arizona Department of Health Services (ADHS) administers a statewide food safety and environmental health public health sanitation program that oversees retail food, bottled water facilities, public accommodations (i.e. hotels and motels), trailer coach parks, children’s camps, campgrounds, public schools, public and semi-public bathing places, and public nuisances. ADHS has delegated most of these public health sanitation program responsibilities to each of the 15 Arizona county health departments, through delegation agreements, in order to most effectively accomplish its mission objectives.
Individuals that carry out the provisions of the program must be licensed as a Registered Sanitarian in the State of Arizona or, under specific conditions, a Sanitarian Aide as specified in A.A.C. R9-16-408. A total of 174.5 Registered Sanitarians and 22 Sanitarian Aides among the 15 County health departments, Arizona State University (ASU), and ADHS were engaged in a public health sanitation program during FY2016.
The following are highlights of FY2016 activities.
• A total of 82,986 food safety related inspections (routine and re-inspections) wereconducted at 31,987 food establishments.
• A total of 7,373 pre-operational inspections at food establishments and 8,731inspections at temporary food establishments were conducted.
• A total of 30,633 routine inspections were conducted at 17,688 regulated facilities thatinclude public accommodations, trailer coach parks, children’s camps, campgrounds,public schools, and public and semi-public bathing places.
• Twelve (12) Arizona counties, one tribal health department, and ADHS are participatingin the U.S. Food and Drug Administration’s (FDA) Voluntary National Retail FoodRegulatory Program Standards. The program is designed to foster national uniformityamong retail food regulatory programs.
• A total of 1,425 foodborne illness complaints were received by county healthdepartments. This represents an increase of 30% from FY2015.
• A total of 8,103 complaints (including foodborne illness) were investigated.
• The FDA issued 445 recalls associated with FDA-regulated products that may pose asignificant risk to the public.
• The United States Department of Agriculture (USDA) issued 150 recall notices over2015. Approximately 21,104,848 pounds of meat, poultry, and certain egg productswere recalled nationwide.
EXECUTIVE SUMMARY

2ANNUAL REPORT 2016
The Food Safety and Environmental Services (FS&ES) Program in the Office of Environmental Health at ADHS is responsible for the administration and oversight of food safety and environmental sanitation in the State of Arizona in accordance with State law. The mission of the Food Safety and Environmental Services Program is:
To prevent and control human illness related to the transmission of infectious agents or toxic substances in food and water, and to prevent disease transmission due to insanitary conditions.
The FS&ES Program administers a statewide public health sanitation program that includes oversight of retail food safety, bottled water facilities, public accommodations (i.e. hotels and motels), trailer coach parks, children’s camps, campgrounds, public schools, public and semi-public bathing places, and public nuisances. In addition, the FS&ES Program assists with epidemiological investigations; assists with the interpretation of public health sanitation laws and rules for Arizona county health departments; establishes and maintains liaisons with federal, state, tribal, and local agencies; provides in-person and online training opportunities; and organizes and coordinates activities that improve statewide retail food programs and further progress towards further conformance with the FDA's Voluntary National Retail Food Regulatory Program Standards (FDA Program Standards).
Arizona Department of Health Services – Phoenix, Arizona
1.0 INTRODUCTION

3ANNUAL REPORT 2016
Figure 1: Summary of Delegated Activities Statewide
ADHS has delegated several public health sanitation program responsibilities to each of the 15 Arizona county health departments in order to most effectively and efficiently accomplish its mission objectives. The delegation of responsibilities provides local oversight and allows local governments to maximize the level of services they chose to provide, taking into consideration the services most needed in their communities. Local control encourages community interaction in program design and operation to meet local needs.
Counties accepting delegated responsibilities are required to perform duties in accordance with the conditions outlined in their individual delegation agreement with ADHS. See Figure 1 for a summary of delegated activities. Annual reports are submitted by each county health department summarizing their program activities over the fiscal year, which is a requirement of each delegation agreement.
2.0 FY2016 ACTIVITIES

4ANNUAL REPORT 2016
Facilities regulated and inspected by ADHS, ASU and the counties include retail food establishments, bottled water facilities, public accommodations (i.e. hotels and motels), trailer coach parks, children’s camps, campgrounds, public school grounds, and public and semi-public bathing places. Individuals that carry out the provisions of the program must be licensed as a Registered Sanitarian in the State of Arizona or, under specific conditions, be a Sanitarian Aide as prescribed by A.A.C. R9-16-408. One hundred seventy four and one-half (174.5) Registered Sanitarian FTEs and 22 Sanitarian Aide FTEs at ADHS, ASU, and the 15 Arizona county health departments conducted a total of 108,610 routine inspections at 49,675 regulated facilities in Arizona during FY2016.
Figure 2: Number and Type of Facilities and Number of Routine Inspections in Arizona FY2016
ROUTINE INSPECTIONS FACILITIES
BOTTLED WATER 69 43PUBLIC ACCOMMODATIONS 1,278 1,262CHILDREN'S CAMPS 51 51CAMPGROUNDS 25 22PUBLIC SCHOOL GROUNDS 1,557 1,642TRAILER COACH PARKS 2,059 1,851PUBLIC & SEMI-PUBLIC BATHING PLACES 25,594 12,817FOOD ESTABLISHMENTS 77,977 31,987TOTALS: 108,610 49,675

5ANNUAL REPORT 2016
ADHS, ASU and the county health departments’ food safety inspection programs are focused on preventing foodborne illness. The Centers for Disease Control and Prevention (CDC) estimate that 1 out of 6 Americans will become ill with foodborne illness everyyear that will result in 48 million illnesses, 128,000 hospitalizations, and 3,000 deathsin the United States with an estimated cost between $10-83 billion resulting from pain,suffering, medical costs, and reduced productivity. The county health departments haveexperienced challenges in recent years towards maintaining their capacity to conduct therequired inspections and respond to incidents of foodborne illness. In response to thesechallenges, several counties have joined the nationwide trend towards conducting riskbased inspections and placing greater emphasis in promoting active managerial control inretail food establishments. This approach ensures that inspections are conducted in anefficient manner, focusing on prevention of foodborne illness through the evaluation ofrisk factors that include the following:
• Improper holding temperatures,• Inadequate cooking,• Contaminated equipment,• Food from unsafe sources, and• Poor personal hygiene.
In addition to risk based inspections, county health departments are providing educational materials and information to operators to assist them in developing proactive food safety systems instead of resorting to a reactive approach to violations identified during an inspection. This approach to food safety is one that has been welcomed by industry and regulators as a proactive approach towards preventing foodborne illness and protecting the public’s health.
2.1 FOOD SAFETY

6ANNUAL REPORT 2016
Retail food establishments that include restaurants, grocery stores, mobile food units, micro markets, food processors, correctional food service facilities, food warehouses, bakeries, instructional facilities, and school cafeterias are routinely inspected to evaluate food safety practices. There were 31,987 regulated food establishments in Arizona during FY2016, a decrease of 3.7% from the previous year. State and county Registered Sanitarians and Sanitarian Aides conducted 82,986 food safety inspections (routine and re-inspections) at these establishments.
A classification system categorizes food establishments by the complexity of the food service operation, which includes factors such as the types of food served, the preparation processes used, and potential food safety risks. The inspection frequency of establishments is then determined by the assigned category. Food service facilities engaging in complex food preparation methods and activities may require more frequent comprehensive inspections in order to evaluate the level of compliance with applicable food safety regulations. Using a classification system allocates resources, including inspection staff, primarily to high risk establishments that pose the greatest risk for foodborne illnesses. The classification categories used are:
COMPLEX FACILITY• Prepares and holds hot or cold food for more than 12 hours before serving; and/or • Cooks and cools a significant number of foods during the food handling process; and/or • Prepares food for off-site service; and/or • Vacuum packs food; and/or • Serves a highly susceptible population.
2.1.1 INSPECTION PROGRAM

7ANNUAL REPORT 2016
MODERATE FACILITY• Food prepared in the facility from raw ingredients requires minimal assembly; and/or • Hot or cold food preparation in the facility is restricted to same day service; and/or • Foods requiring preparation in the facility are from approved processing facilities.
LIMITED FACILITY• Only pre-packaged potentially hazardous foods are available or sold; and/or • Potentially hazardous foods served are commercially pre-packaged in an approved food
processing facility; and/or • Only conducts limited preparation of potentially hazardous foods and beverages; and/or • Only serves beverages.
Food establishments in Arizona classified as complex and moderately complex are generally inspected more frequently than limited facilities. On average, there were 3.1 inspections per complex facility, 2.3 inspections per moderate facility, and 1.9 inspections per limited facility statewide. More frequent inspection of complex food service operations are recommended due to several factors including 1) overall complexity of operations, 2) increased planning and monitoring of operational policies, and 3) increased training needs of food handling employees. Challenges to meeting inspection frequency expectations can include staffing shortages, inadequate numbers of Registered Sanitarians on staff, a high rate of staff attrition, the time and resource investment required to train field staff to conduct all categories of food inspections, and travel time between facilities in rural parts of the state.
The goal of the food safety inspection program is to achieve compliance with state food safety requirements without resorting to compliance proceedings and enforcement actions. Unfortunately, these regulatory actions are sometimes necessary to achieve compliance. During FY2016, 1,134 enforcement actions or compliance proceedings, were taken at food establishments in Arizona that include notices of violation, cease and desist orders, permit suspensions, and citations.
Figure 3: Number of Food Establishments and Routine Inspections by Food Service Complexity FY2016
2.1.2 ENFORCEMENT
Complex facilities received an average of 3.1 routine inspections in FY2016
COMPLEX MODERATE LIMITED
FOOD ESTABLISHMENT 10,730 10,321 10,937
ROUTINE INSPECTIONS 33,637 24,033 20,294

8ANNUAL REPORT 2016
2.2 FDA VOLUNTARY NATIONAL RETAIL FOOD REGULATORY PROGRAM STANDARDS
The FDA Voluntary National Retail Food Regulatory Program Standards are designed to foster national uniformity among regulatory programs responsible for retail food protection. In 2012, ADHS was awarded a 5-year FDA Cooperative Agreement that provides funding to assist ADHS and the local health departments in assessing their current food safety systems and engaging in strategic planning that will ultimately improve their food safety systems, which align with FDA Program Standards’ requirements. Along with ADHS, 12 Arizona counties and one tribal health department are participating in the FDA’s Program Standards. ADHS self-reported meeting Standard 7 in FY2016, which was verified by Maricopa County Environmental Services. Figure 4 outlines the current status of ADHS’ progress towards meeting the FDA Program Standards.
Date:Program Standards Version:
Ver 1.0
Met Progress
1 REGULATORY FOUNDATION 57.1% met 1a 1b 1c 2a 2b 3a 4a
2 TRAINED REGULATORY STAFF 11.1% met 1a 1b 2a 2b 3a 3b 4a 4b 5a
3 INSPECTION PROGRAM BASED ON HACCP PRINCIPLES 50.0% met 1a 1b 1c 2a 3a 4a 4b 4c 5a 6a
4 UNIFORM INSPECTION PROGRAM No elements met 1a 1b 1c 2 2i 2ii 2iii 2iv 2v 2vi 2vii 2viii 2ix 2x 3a 3b
1a 1b 1c 1d 1e 1f 1g 1h 1i 2a 2b 3a 3b 4a 5a 5b
5c 6a 7a 7b1 7b2 7b3 7b4 7b5 7b6 7b7 7b8 7b9 7c
6 COMPLIANCE AND ENFORCEMENT 25.0% met 1a 1b 2a 2b
7 INDUSTRY AND COMMUNITY RELATIONS Fully Met 1a 1b
8 PROGRAM SUPPORT AND RESOURCES 84.6% met 1a 2a 2b 3a 3b 4a 4b 4c 4d 4e 4f 4g 4h
9 PROGRAM ASSESSMENT 28.6% met 1a 1b 1c 2a 2b 3a 3b
Report completed by:
FOODBORNE ILLNESS AND FOOD DEFENSE PREPAREDNESS AND RESPONSE 37.9% met5
Self-Assessment / Audit Verification Summary & Gap Analysis
Standard Elements (Incomplete elements identified in red and completed elements identified in strikethrough text )
Standard
Arizona Department of Health ServicesFood Safety & Environmental Services Program Manager6/31/2016
Jurisdiction:
2015
Click here for additional Program Standards guidance, instructions and PDF files located the FDA Retail Food website
Figure 4: FDA Program Standards Summary for ADHS’ Retail Food Regulatory Program

9ANNUAL REPORT 2016
FY2016 cooperative agreement funds were used to organize workshops, provide travel reimbursements to attend training opportunities, purchase food inspection equipment, and develop printed educational materials for ADHS and the local health departments.
STRATEGIC PLANNING WORKSHOP
The first workshop took place in Pima County, on August 18-20, 2015. The purpose of the workshop was to allow participants an opportunity to explore methods for establishing a well-defined project management process for planning and tracking continuous improvement within a retail food protection program using the FDA’s Program Standards. Travel stipends, using cooperative agreement funds, were provided to attendees from Arizona counties.
SELF-ASSESSMENT AND VERIFICATION AUDIT WORKSHOP
The second workshop, entitled the Self-Assessment and Verification Audit Workshop, took place in Maricopa County on January 19-21, 2016. The purpose of the workshop was to provide participants with an overview of the FDA Program Standards criteria and an in-depth understanding of the self-assessment and verification audit process, worksheets, and forms. The workshop was well attended by staff from almost half of the Arizona counties and by public health professionals representing multiple out-of-state health agencies. Cooperative agreement funds were used to provide travel stipends to attendees from Arizona counties and for the printing of the workshop materials.
RETAIL FOOD RISK FACTOR STUDY AND RISK BASED INSPECTIONS AT RETAIL
Pima County worked with the FDA Pacific Region Retail Food Specialist to provide a workshop entitled Considerations for Conducting a Retail Food Risk Factor Study and a Risk Based Inspections at Retail Course for their staff on May 2-4, 2016. ADHS worked with Pima County to open attendance to the course to other Arizona counties and agencies. ADHS distributed the course announcement and registration information throughout the state, resulting in the registration of twenty-five individuals from six other counties, Indian Health Service (IHS), ADHS, and Davis-Monthan Air Force Base Public Health Division. ADHS used cooperative agreement funds to provide travel reimbursements to Arizona counties that attended the course.
2.2.1 FDA COOPERATIVE AGREEMENT

10ANNUAL REPORT 2016
Figure 5: Food Storage Chart
Proper Food Storage in Cold Holding UnitsAn approved walk-in or ice bath method must be used when cooling foods.
Foods must be cooled from 130°F to 70°F within 2 hours and from 70°F to 41°F within 4 hours, for a total time of 6 hours.
Foods Being Cooled, Reduced to 4 Inches or Less & Uncovered
Ready-to-Eat Potentially Hazardous Foods, Date Marked & Covered
Washed Fruits & Vegetables
Raw Pork, Beef, Seafood & Whole Eggs—Cook Temp: 145°F
Raw Ground Meats & Pooled Eggs—Cook Temp: 155°F
Raw Chicken/Poultry—Cook Temp: 165°F
Arizona Department of Health ServicesFood Safety & Environmental Services ProgramPhone 602-364-3118www.azdhs.gov/foodsafety
ARIZONA DEPARTMENTOF HEALTH SERVICES

11ANNUAL REPORT 2016
Cooperative agreement funds have been utilized to implement the strategies developed during the Strategic Planning workshop. After the workshop was completed, ADHS selected Standard 5, Standard 7, and Standard 8 as top priorities for the ADHS strategic plan.
STANDARD 5: FOODBORNE ILLNESS AND FOOD PREPAREDNESS AND RESPONSE
For Standard 5, ADHS worked with the ADHS Public Health Laboratory to create a letter of understanding that outlined the laboratory’s ability to provide analytical support to the FS&ES Program and Arizona counties. The letter of understanding includes references to the types of biological and chemical testing available for food, environmental, and clinical samples. Lastly, the letter included information regarding alternative laboratory contacts in the event a food-related emergency exceeds the capacity of the Public Health Laboratory. The letter meets all of the requirements of elements 3a and 3b of Standard 5.
STANDARD 7: INDUSTRY AND COMMUNITY RELATIONS
Additional Standard 7 educational materials were requested by the Arizona counties in FY2016 and included Norovirus prevention, employee illness reporting, and proper food storage signs, as shown in Figure 5.
STANDARD 8: PROGRAM SUPPORT AND RESOURCES
For Standard 8, ADHS completed the distribution of all foodborne illness kits to each county in Arizona. The foodborne illness kits were showcased in the February 16, 2016 ADHS Director’s blog and were evaluated for use in the agency’s accreditation initiatives. In addition, ADHS provided equipment to counties that requested items for meeting elements 2a and 2b. ADHS demonstrated the kit and went over its contents at an IHS food safety training session for Environmental Health Specialists in FY2016.
2.2.2 IMPLEMENTING THE PROGRAM STANDARDS

12ANNUAL REPORT 2016
2.3 CONFERENCE FOR FOOD PROTECTION
One ongoing food safety initiative that began over FY2016 is the state and local agency participation in the Conference for Food Protection (CFP). The Conference for Food Protection brings together representatives from the food industry, government, academia, and consumer organizations to identify and address emerging problems of food safety to formulate recommendations. Maricopa County, Coconino County, and ADHS attended the 2016 Conference for Food Protection’s Biannual Meeting, held in Boise, Idaho, as local and state representatives. The ADHS FS&ES Program Manager represented the State of Arizona as a voting delegate. Since the last biannual meeting, at least four representatives from ADHS and the local environmental health agencies have joined CFP committees, whose work will be presented at the 2018 CFP Biannual Meeting, and ADHS has organized quarterly conference calls to discuss potential issues and their impact before they are submitted.
Figure 6: Arizona State and Local Agency Representatives at the 2016 Conference for Food Protection Biannual Meeting

13ANNUAL REPORT 2016
2.4 FOOD SAFETY REGULATION UPDATE
The current Arizona Administrative Code rules for food safety are based on the 1999 FDA Model Food Code with modifications to meet Arizona’s needs. Mohave County and Yavapai County have adopted the 2009 FDA Food Code. Maricopa County, Pinal County, Gila County, Cochise County, and Pima County have adopted the 2013 FDA Food Code (see Figure 7).
Figure 7: Newer Versions of the FDA Food Code have been adopted by Seven Arizona Counties
Adopted 2009 FDA Food Code
Adopted 2013 FDA Food Code
State Food Safety Rules (1999 FDA Food Code)
14ANNUAL REPORT 2016
Table 1: Rate of Reported Cases of Enteric Diseases in Arizona
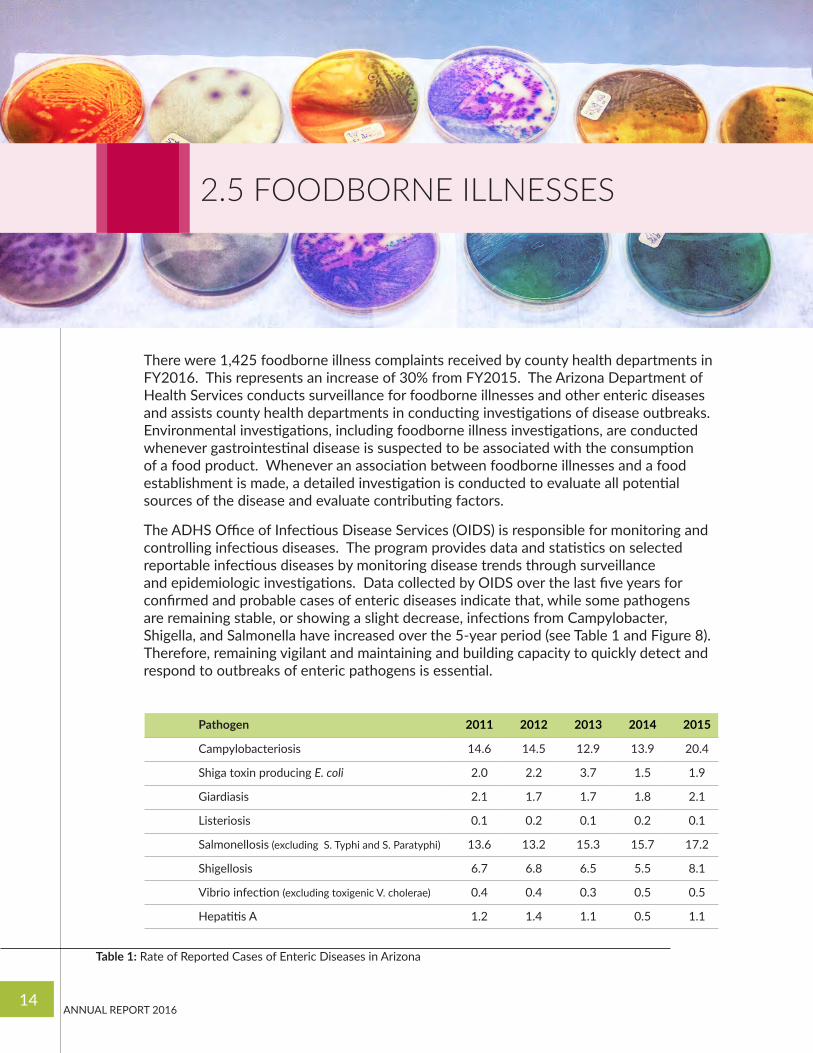
2.5 FOODBORNE ILLNESSES
There were 1,425 foodborne illness complaints received by county health departments in FY2016. This represents an increase of 30% from FY2015. The Arizona Department of Health Services conducts surveillance for foodborne illnesses and other enteric diseases and assists county health departments in conducting investigations of disease outbreaks. Environmental investigations, including foodborne illness investigations, are conducted whenever gastrointestinal disease is suspected to be associated with the consumption of a food product. Whenever an association between foodborne illnesses and a food establishment is made, a detailed investigation is conducted to evaluate all potential sources of the disease and evaluate contributing factors.
The ADHS Office of Infectious Disease Services (OIDS) is responsible for monitoring and controlling infectious diseases. The program provides data and statistics on selected reportable infectious diseases by monitoring disease trends through surveillance and epidemiologic investigations. Data collected by OIDS over the last five years for confirmed and probable cases of enteric diseases indicate that, while some pathogens are remaining stable, or showing a slight decrease, infections from Campylobacter, Shigella, and Salmonella have increased over the 5-year period (see Table 1 and Figure 8). Therefore, remaining vigilant and maintaining and building capacity to quickly detect and respond to outbreaks of enteric pathogens is essential.
Pathogen 2011 2012 2013 2014 2015
Campylobacteriosis 14.6 14.5 12.9 13.9 20.4
Shiga toxin producing E. coli 2.0 2.2 3.7 1.5 1.9
Giardiasis 2.1 1.7 1.7 1.8 2.1
Listeriosis 0.1 0.2 0.1 0.2 0.1
Salmonellosis (excluding S. Typhi and S. Paratyphi) 13.6 13.2 15.3 15.7 17.2
Shigellosis 6.7 6.8 6.5 5.5 8.1
Vibrio infection (excluding toxigenic V. cholerae) 0.4 0.4 0.3 0.5 0.5
Hepatitis A 1.2 1.4 1.1 0.5 1.1

15ANNUAL REPORT 2016
Each year, CDC FoodNet reports on the number of foodborne illnesses from laboratory confirmed cases and the progress made in reaching national goals for reducing foodborne illness. FoodNet also issues an annual Food Safety Progress Report. OIDS created a similar Foodborne Illness Progress Report to compare that State’s performance to national trends (Figure 9). In addition to reporting the 2014 and 2015 state rate for enteric pathogens, the report card provides the change in rate for each selected pathogen, compares the State rate to the US rate, and provides CDC target rate to strive towards. Lastly, the report card includes important information regarding the number of cases that are estimated to go unreported for each case reported.
Figure 8: Rate of reported cases of enteric disease in Arizona by year, 2011-2015
Rate of reported cases of enteric diseases in Arizona by year2011-2015** Rate Calculated per 100,000 Population
PathogenCampylobacteriosis
Salmonellosis (excluding S. Typhi and S. Paratyphi)
Shigellosis
Shiga toxin producing E. coli
Giardiasis
Hepatitis A
Vibrio infection (excluding toxigenic V. cholerae)
Listeriosis
2011
5
0
10
15
20
25
2012 2013 2014 2015
Inci
denc
e Ra
te p
er 1
00,0
00 p
opul
atio
n
Year

16ANNUAL REPORT 2016
Figure 9: ADHS Foodborne Illness Report Card
FOODBORNEILLNESSREPORT
CARD 2015AZRATE*
2014AZRATE*
2015USRATE*†
2020 CDCTARGETRATE‡
PERCENTAGEOF AZ RATECHANGE
CAMPYLOBACTERIOSIS
FOREVERY CASEREPORTED§
SHIGA TOXIN PRODUCING E. COLI
LISTERIOSIS
SHIGELLOSIS
VIBRIO INFECTION(EXCLUDING TOXIGENIC V. CHOLERAE)
45% INCREASE
27% INCREASE
35% DECREASE
45% INCREASE
0% NO CHANGE
10% INCREASE
12.97
0.95
0.24
5.53
0.39
15.89
8.5
N/A
0.2
N/A
0.2
11.4
14.15
1.5
0.2
5.6
0.5
15.6
20.4
1.9
0.07
8.1
0.5
17.2
30 GO UNDIAGNOSED
26 GO UNDIAGNOSED
2 GO UNDIAGNOSED
8 GO UNDIAGNOSED
142 GO UNDIAGNOSED
29 GO UNDIAGNOSEDSALMONELLOSIS(EXCLUDING S. TYPHI AND S. PARATYPHI)
*Rate calculated per 100,000 population †http://www.cdc.gov/mmwr/preview/mmwrhtml/mm6418a4.htm ‡based on Healthy People 2020 target rates https://www.healthpeople.gov/2020/topic/food-safety/objectives§Estimates of foodborne illness burden in the United States from 2011 CDC data http://wwwnc.cdc.gov/eid/article/17/1/p1-1101-t2

17ANNUAL REPORT 2016
2.6 NATIONWIDE OUTBREAKS AND FOOD RECALLS
Over FY2016, ADHS completed investigations for 22 foodborne illness outbreaks in Arizona and participated in outbreak investigations throughout the state that included two correctional facility outbreaks and two multi-state outbreaks.
Figure 10: Correctional Institution Outbreak Samples
MULTISTATE OUTBREAK OF SALMONELLA POONA INFECTIONS LINKED TO IMPORTED CUCUMBERS
On August 10, 2015, ADHS was notified of a cluster of two cases of Salmonella serotype Poona infection with the same PFGE pattern (JL6X01.0018). Other cases had also recently been identified in Montana, Colorado, and Utah. ADHS investigators reached out to CDC to begin a multistate collaboration. During the same time, Maricopa County Department of Public Health (MCDPH) was investigating a cluster of Salmonella cases that were linked to a restaurant. As the investigation progressed, some of these cases had PFGE pattern results match the ongoing multistate outbreak.
By August 18, 14 Salmonella isolates had been serotyped at the Arizona State Public Health Laboratory as Poona and had PFGE patterns matching the outbreak. The majority of cases were from Maricopa County. Both MCDPH and ADHS activated their Health Emergency Operations Center (HEOC). Case counts rose daily, and by August 31, there were 59 lab-confirmed cases in Arizona,
Early in the multistate investigation, demographics indicated that those ill were primarily from the southwest (Arizona, California, Colorado, New Mexico, and Utah) and had a young median age of about 7 years (Arizona cases). The epidemic curve indicated a large peak during summer months. Because of these epidemiologic clues, and because of previous outbreaks caused by Salmonella Poona, early hypotheses included turtles, produce, and restaurant exposures.

18ANNUAL REPORT 2016
Investigators in Arizona and other states began to administer to cases the national hypothesis-generating questionnaire, a tool commonly used during investigation of PFGE-matched clusters in which the source is unknown. Results from questionnaire were compared to background rates of the same exposures to determine if cases’ exposures varied from what would be expected from the general population. Using this information, investigators were able to determine that primarily two exposures, cucumbers and watermelons, were reported more often by cases. Additional interviews with cases and data analysis determined that garden-variety cucumbers were epidemiologically linked to illness.
Investigators in Arizona and other states were able to collect product information from cases’ grocery store frequent shopper cards. Investigators also responded to clusters of cases from different households who had eaten cucumbers at the same restaurant. Additionally, samples of epidemiologically implicated cucumbers were collected, including one sample collected by ADHS, and Salmonella matching the outbreak strain was recovered from multiple food samples. Traceback of cucumbers from shopper card records, restaurant clusters, and lab-tested contaminated cucumbers identified a common supplier of the cucumbers. Recalls were issued for cucumbers distributed by Andrew & Williamson Fresh Produce on September 4 and September 11.
After the recalls were announced, case counts dropped off dramatically, yet investigators continued to receive reports of Salmonella infections matching the outbreak strain, most of which reported exposure to recalled product. By March 18, 2016, the outbreak appeared to be over. A total of 907 lab-confirmed cases were identified from 40 states, including 140 cases in Arizona. Six deaths were reported, including one in Arizona.
Figure 11: ADHS Sample Go-Kit
FOOD RECALLS
The FDA issued 445 food recalls of FDA-regulated food products in FY2016. The FDA works with industry and state partners to conduct traceback investigations and to issue press releases and public notices about recalls that may pose a significant risk to the public. The FDA regulates all other food products except those under USDA regulation.
The USDA issued 150 recall notices over 2015. The USDA regulates meat, poultry, and certain egg products. Approximately 21,104,848 pounds of food, associated with these recalls, were recovered nationwide. A USDA recall summary for calendar year 2015 is provided in Table 2 and includes information regarding the type, reason, and product associated with recalls.

19ANNUAL REPORT 2016
Table 2: USDA Recall Summary for Calendar Year 2015
ADHS FS&ES Program started a food recall notification process to the County Food Safety Programs in FY 2015. Recall notifications received from the USDA and FDA are reviewed for information pertaining to Arizona. The table below illustrates how the weekly updates are organized. Class I Recalls effecting Arizona are sent out to the counties immediately. Class II, Class III, and Allergy Alerts are sent out as a group at the end of the week. There has been an increase in undeclared allergens in food products over the last year. This approach was implemented in order to assist the counties in prioritizing recall information, as multiple recalls can be issued during a one week period.
Weekly Recall Summary
Distribution Recall Info and Link
Nationwide or AZ specific CLASS I
CLASS II or CLASS III
Allergy Alerts
USDA Recall Summary for Calendar Year 2015
Total Number of Recalls
Number of Pounds Recalled
150 21,104,848
Recalls by Class (N=150)Class I 99 16,623,878
II 39 3,176,212
III 12 1,304,758
Recalls by Reason (N=150)Reason For Recall STEC* 8 215,593
Listeria monocytogenes 6 82,547
Salmonella 3 4,828,874
Undeclared Allergen 58 10,268,457
Extraneous Material 11 1,104,790
Processing Defect 4 5,259
Undeclared Substance 5 1,176,731
Other** 55 3,422,597
Recall by Species/Product (N=150)Species Beef 41 1,345,842
Mixed 38 10,238,498
Pork 37 1,480,768
Poultry*** 33 8,004,465
Ovine 1 35,275*STEC includes recalls due to Shiga toxin-producing E. coli (STEC). STEC organisms include E. coli O157:H7, E. coli O45, E. coli O103, E. coli O111, E. coli O121, E. coli O145. **"Other" includes producing without inspection, failure to present for import inspection, and labeling issues, among others.***Poultry includes egg products.

20ANNUAL REPORT 2016
Bottled Water rules are outlined in 9 A.A.C. Article 2 Bottled Water. Facilities that bottle water for distribution in Arizona are routinely inspected to evaluate sanitation practices and approval of a source. There were 43 bottled water facilities in Arizona and inspection staff conducted 69 inspections in these facilities during FY2016. There were no enforcement actions reported at bottled water facilities for FY2016.
2.7 BOTTLED WATER
2015 2016BOTTLE WATER FACILITIES 43 43
ROUTINE INSPECTIONS 67 69
Figure 12: Bottled Water Facilities in Arizona
NO CHANGE in number of bottled water facilities in FY2016

21ANNUAL REPORT 2016
2.8 SWIMMING POOLS AND SPAS
Public and semi-public swimming pools rules are outlined in 9 A.A.C. Article 8 Public and Semipublic Swimming Pools and Bathing Places. Public and semi-public swimming pools and spas are routinely inspected to evaluate compliance with applicable regulations, particularly those associated with the prevention of waterborne illnesses.
ADHS rules apply to the sanitary conditions of public and semi-public swimming pools and bathing places. A swimming pool or bathing place is “public” if it is open to members of the general public, regardless of whether a fee is charged for admission. A swimming pool or bathing place is “semi-public” if it is operated in conjunction with lodging such as a hotel, motel, resort, apartment, townhouse or condominium complex, trailer court, mobile home park, recreational vehicle park, or community pool facilities operated by, and exclusively for, a residential development.
There were 12,817 public and semi-public swimming pools and spas in Arizona in FY2016. State and county inspection staff conducted 25,594 swimming pool and spa inspections. State and county health departments reported initiating 1,850 enforcement actions associated with these facilities in FY2016.
Figure 13: Swimming Pools and Spas in Arizona
2015 2016SWIMMING POOLS & SPAS 12,911 12,817
ROUTINE INSPECTIONS 23,613 25,594
An average of 2 routine inspections were conducted at swimming pools and spas in FY2016

22ANNUAL REPORT 2016
Public accommodations such as hotels, motels, and boarding houses are routinely inspected to evaluate compliance with 9 A.A.C. Article 13 Hotels, Motels, and Tourist Courts. There were 1,262 public accommodation facilities in Arizona in FY2016. State and county inspection staff conducted 1,412 inspections in these facilities. County health departments reported initiating 19 enforcement actions associated with public accommodation facilities in FY2016.
Figure 14: Public Accommodations in Arizona
2.9 PUBLIC ACCOMMODATIONS
2015 2016HOTELS & MOTELS 1,309 1,262
ROUTINE INSPECTIONS 1,412 1,278
The number of public accommodations facilities decreased by 4% in FY2016

23ANNUAL REPORT 2016
2.10 TRAILER COACH PARKS
Trailer coach park requirements are outlined in 9 A.A.C. Article 5 Trailer Coach Parks. Inspections include the evaluation of the water supply, sewage disposal system, sanitation facilities, service buildings, toilet facilities, and waste disposal. There were 1,851 trailer parks in Arizona in FY2016. State and county inspection staff conducted 2,059 inspections at trailer coach parks across the state. County health departments reported initiating 42 enforcement actions associated with trailer coach parks in FY2016.
Figure 15: Trailer Coach Parks in Arizona
2015 2016TRAILER COACH PARKS 1,677 1,851ROUTINE INSPECTIONS 2,002 2,059
The number of trailer coach parks increased by
10% in FY2016

24ANNUAL REPORT 2016
2.11 PUBLIC SCHOOL GROUNDS
Public school grounds requirements are outlined in 9 A.A.C. Article 7 Public Schools. Public schools, including charter schools, are inspected to evaluate compliance with water supply, indoor areas, restroom, bathroom, shower room, sewage disposal, refuse management, pest control, and animal standards requirements. Food operations at public and charter school grounds are permitted or licensed and evaluated as food establishments under the requirements in 9 A.A.C. Article 1 Food and Drink (see Section 2.1).
There were 1,642 permitted public and charter schools in Arizona in FY2016. State and county inspection staff conducted 1,557 inspections at these permitted schools. State and county health departments reported initiating 43 enforcement actions associated with public and charter schools in FY2016.
Figure 16: Public School Grounds in Arizona
2015 2016PUBLIC SCHOOLS 1,722 1,642
ROUTINE INSPECTIONS 1,832 1,557
The number of public school grounds decreased by 5% in FY2016

25ANNUAL REPORT 2016
2.12 CHILDREN’S CAMPS
Children’s camps inspection requirements are outlined in A.R.S. § 36-3901 and 9 A.A.C. Article 4. Children’s camp inspections evaluate the location, layout, water supply, toilets and disposal systems, and drainage of a children’s camp. Food operations at children’s camps are permitted or licensed and evaluated as food establishments under the requirements in 9 A.A.C. Article 1 Food and Drink (see Section 2.1).
Children’s camps are sometimes associated with day camps; however, the children’s camp regulations only apply to camps operated continuously for a period of five days or more each year for religious, recreational, or vacation purposes. Children’s camps do not include camps used by individual or family use, penal or correctional camps, or camps operated solely for the education, care, or treatment of children. Day camps, which operate similarly to daycares, do not fall within the definition of a children’s camp and are therefore not licensed as such.
There were 51 children’s camps that applied for an annual permit in FY2016. The dates of operation for these camps were varying, with some operating only during the summer months and others only operating a few days per year. State and county inspectors conducted 51 inspections at children’s camps during FY2016. There were no enforcement actions reported at children’s camps for FY2016.
2015 2016CHILDREN'S CAMPS 51 51
ROUTINE INSPECTIONS 49 51
Figure 17: Public School Grounds in Arizona
NO CHANGE innumber of children's camps in FY2016

26ANNUAL REPORT 2016
2015 2016CAMP GROUNDS 35 22
ROUTINE INSPECTIONS 32 25
2.13 CAMP GROUNDS
Camp grounds requirements are outlined in 9 A.A.C. Article 6 Camp Grounds. Camp ground regulations apply to any city, county, county, village, community, institution, person, firm, or corporation operating, maintaining, or offering for public use any tract of land on which person may camp or picnic either free or by payment of a fee. Camp grounds are evaluated for compliance with supervision, water supply, protection against fires, sewage and refuse, toilet, and construction and maintenance of building requirements.
There were 22 camp grounds in Arizona in FY2016. County inspection staff conducted 25 inspections at these camp grounds. There were no enforcement actions reported at camp grounds for FY2016.
Figure 18: Public School Grounds in Arizona
The number of camp grounds decreased by
37% in FY2016

27ANNUAL REPORT 2016
The Home Baked & Confectionery Goods Program continues to grow, with 5,191 individuals registered at the end of FY2016. Approved food products continue to be limited to non-potentially hazardous foods made in the registrant’s home and must be labeled with the address and contact information of the registrant, a list of ingredients, and a statement notifying the consumer that the product was made in a private home. If applicable, the label must also include a statement that the product was prepared in a facility for individuals with developmental disabilities. All packaging must be done in the home kitchen.
The program allows for the sale of these products at locations that include permitted food establishments, farmers' markets, and special events. There are no limits to the revenue or quantity of products sold by a registrant under the program. Popular items over the past year include dry spice mixes and rubs, dry baking mixes including waffle and pancake mixes, and dry roasted coffee beans. The eNewsletter for the Home Baked & Confectionery Goods Program is sent to program registrants and local county partners on a quarterly basis and includes program information, features a registered home baker of the month, and shares information that would be of interest to home bakers. The eNewsletter has been a huge success, as evidenced by the feedback received from both registrants and the Arizona Counties.
Over FY2016, ADHS was requested to present about the cottage food program, or Home Baked & Confectionery Goods Program, at the November 2015 Integrated Foodborne Outbreak Response and Management Conference and on a National Association of County and City Health Officials sharing session in April 2016.
Apache
Cochise
Coconino
La PazMaricopa
Mohave
Pima
Navajo
Pinal
Santa Cruz
Yavapai
Yuma
Greenlee
Graham
Gila
40
196
110
123,145
155
630
83
332
22
313
59
2151
22
3.0 HOME BAKED & CONFECTIONERY GOODS PROGRAM
Figure 19: Home Baked & Confectionery Goods Program Registrants, by County FY2016

28ANNUAL REPORT 2016
Establishing and sustaining school and community gardens is an evidence-based strategy to augment local food systems and increase access to healthy foods. Many Arizonans have limited opportunities to make healthy food choices, contributing to the burdens of overweight and obesity, type 2 diabetes, and other threats to health and wellbeing. The Arizona Health Improvement Plan outlined a goal to increase the proportion of adults and children at a healthy weight in Arizona by 5 percent by 2020. Supporting school and community gardens, and consequently the food systems they are part of, contributes to this goal by expanding the menu of options available to Arizonans in making healthy food choices.
Underlying these systems and their contributors, including school and community gardens, is food safety. Consumers must feel assured of the safety of locally grown food in order to confidently purchase and prepare it for friends and family. In the United States, 46% of foodborne illness outbreaks with an implicated food vehicle from 1998-2008 were attributed to produce commodities¹. In addition to the significant human costs of these outbreaks, research has shown that customers adjust their shopping choices, at least in the short term, in response to outbreaks attributed to a particular food². The prevention of outbreaks through safe food production and handling, then, protects both human health and consumer confidence in local food systems.
Arizona Department of Health Services’ School and Community Garden Program certifies school and community gardens that demonstrate they are following food safety practices known to prevent foodborne illness and incorporate elements of good handling and good agricultural practices. In FY2016, the School and Community Garden Program certified 13 gardens, giving a total of 31 certified gardens in 6 counties statewide, up from 19 gardens in 7 counties in FY2015. This represents a 63 percent increase in certified gardens statewide year over year.
Figure 20: School Harvested Produce
4.0 SCHOOL & COMMUNITYGARDENS

29ANNUAL REPORT 2016
The School and Community Garden Program Coordinator participated in numerous events throughout the year to present information about the certification offered through the Program and provide education and guidance on gardening and food safety. Finally, in the last two months of FY2016, the School and Community Garden Program Coordinator began the process of redesigning and further streamlining the application for certification, which is scheduled to be completed in FY2017.
Figure 21: School Meals Prepared with ADHS Certified School Garden Grown Produce
Figure 22: ADHS Certified School Garden Grown Produce
Figure 23: ADHS Certified School Garden Program Materials

30ANNUAL REPORT 2016
¹Painter JA, Hoekstra RM, Ayers T, Tauxe RV, Braden CR, Angulo FJ, et al. Attribution of foodborne illnesses, hospitalizations, and deaths to food commodities by using outbreak data, United States, 1998–2008. Emerg Infect Dis [Internet]. 2013 Mar [August 03, 2016].
²Carlos Arnade, Linda Calvin, Fred Kuchler. Consumers’ Response to the 2006 Foodborne Illness Outbreak Linked to Spinach. Amber Waves magazine, USDA [Internet]. 2010 Mar [August 03, 2016].
Figure 24: ADHS Certified Garden
Coconino
Maricopa
Pima
Pinal
Yavapai
Greenlee
Gila
2
7
15
1
3
31
Figure 25: ADHS Certified School and Community Gardens by County

31ANNUAL REPORT 2016
ARIZONA SANITARIANS' COUNCILBlanca Caballero, R.S. Arizona Sanitarians' Council Chairperson
George Amaya, R.S. Represents: Smaller Counties
David Morales, R.S. Represents: Large Counties
Harlan D. Lee, Owner Represents: Lay Persons
Roberto Angel, Jr., R.S. Represents: Industry
In January 2013, the Arizona Sanitarians' Council began administering the National Environmental Health Association’s (NEHA) Registered Environmental Health Specialist/Registered Sanitarian (REHS/RS) Environmental Health Proficiency Exam. This exam is a two-booklet examination containing 250 objective, multiple choice questions developed by NEHA. In July 2014, NEHA began providing an updated REHS/RS Exam that includes new content areas. These main content areas, with percentages allotted to each area, are included below:• Conducting facility inspections (35%),• Conducting system inspections (20%),• Conducting investigations (14%),• Ensuring compliance (13%),• Promoting environmental public health awareness (10%), and• Responding to emergencies (8%).
During FY2016, fifty-four (54) applicants sat for the registration exam. Thirty-one (31) applicants (57%) passed the examination and became registered as sanitarians. In FY2016, five hundred twenty two (522) individuals maintained Arizona sanitarian registrations in good standing.
Individuals responsible for carrying out the provisions in the ADHS delegation agreement must be registered as a sanitarian in the State of Arizona or, under specific conditions, a Sanitarian Aide under the direct supervision of an Arizona Registered Sanitarian. There were 174.5 Registered Sanitarian FTEs employed at the 15 Arizona county health departments, ASU, and ADHS. Several county environmental health departments have Registered Sanitarians that have been standardized in the new FDA program to promote nationwide uniformity of Food Safety Programs. Standardization is a process by which experienced sanitarians can be trained to focus on critical food safety factors and to maintain consistency among sanitarians. The updated standardization procedure is more complex and is more time intensive than previous standardization requirements, reflecting the increased professional nature of the work involved.
5.0 REGISTRATION & TRAINING OF SANITARIANS
57% of candidates passed the Arizona Registered Sanitarians’ Exam in FY2016

32ANNUAL REPORT 2016
5.1 TRAININGS OFFERED FOR REGISTERED SANITARIANS
Continuing education is a requirement for annual sanitarian registration renewal. This requirement reflects the importance of providing training opportunities to Registered Sanitarians that are relevant to the environmental health profession. Registered Sanitarians must stay abreast of advances in environmental health science, technology, regulations, policies, procedures, and a vast array of industry advances. Meeting this requirement is can be challenging due to limited training opportunities and resources to fund time and travel to attend training events.
During FY2016, training opportunities were provided by agencies that include the ADHS Office of Environmental Health, the ADHS Office of Infectious Disease Services, the Arizona Environmental Health Association (AZEHA), and the Arizona County Directors of Environmental Health Services Association. Trainings provided over the fiscal year included the AZEHA Annual Conference, the Annual Arizona Infectious Disease Training and Exercise, a Risk Based Inspections at Retail Course, two FDA workshops, the 2015 Integrated Outbreak Response Management Conference held in Phoenix, the 2016 NACCHO Conference held in Phoenix, and the 2016 FDA PacRim Shellfish Sanitation Conference held in Phoenix. In addition, the Federal Emergency Management Administration, FDA, CDC and several university programs offered on-line training options for Registered Sanitarians that were unable to travel to the aforementioned training opportunities.

33ANNUAL REPORT 2016
6.0 BROWNFIELDS
Brownfields and land reuse sites are properties that are abandoned, underused, or not considered for redevelopment because of the real or perceived risk of their contamination. These sites, while not quantified in Arizona, are a familiar sight to many throughout the state. As part of a grant from the Agency for Toxic Substances and Disease Registry, the ADHS Office of Environmental Health has launched an effort to increase statewide knowledge and capacity to redevelop brownfields into healthy, useful places that contribute positively to the quality of life in their communities, with an emphasis on community gardening.
The Arizona Health Improvement Plan aims to increase the proportion of adults and children in Arizona who are at a healthy weight by five percent by the year 2020. A primary strategy identified in the Plan to support this goal is to increase availability of affordable, healthy food in communities. The Plan also identified tactics to effect this change – namely, by establishing more grocery stores where they are most needed and by supporting farm-to-table efforts, including farmers’ markets and community gardens. The redevelopment of brownfield/land reuse sites represents an incredible opportunity to increase Arizonans’ access to healthy foods – whether those sites are redeveloped into community gardens, used for grocery stores, or used as farmers’ markets – while at the same time reducing potential exposure of community members to environmental contaminants that may be present on the sites.
Figure 26: ADHS Certified Garden

34ANNUAL REPORT 2016
Figure 27: ADHS Garden Start Kits
Figure 28: Brownfield / Land Reuse Workshop and Agenda

35ANNUAL REPORT 2016
Figure 29: ADHS Brownfields Brochure
In FY2016, in Phoenix, OEH held the first of three regional workshops to bring together representatives from non-profit organizations; local, county, and state planning and development staff; city planners; local, county and state health agencies; and others to discuss how to successfully redevelop brownfields/land reuse sites in partnership with their communities. More than 50 individuals registered for the event, and 45 attended. An attendee evaluation showed that most attendees felt that they developed a better understanding of how to identify, manage and mitigate any environmental health risks associated with redeveloping a brownfield/land reuse site; how to engage with communities to ensure the outcome of a brownfield/land reuse project was successful and sustainable; and how to evaluate the impact of these projects on our communities’ health.
In preparation for this and other events in the future, ADHS developed a wealth of new program materials in FY2016 to help educate Arizonans about brownfields/land reuse sites and introduce to them the potential these sites offer for redevelopment. These materials included a program brochure; a vertical banner display; an educational model showing how sites may become contaminated and demonstrating how they can be remediated if they do have contamination; garden starter kits; a customized USB with program information pre-loaded; reusable bags; and an expanded website.

36ANNUAL REPORT 2016
ALL INSPECTIONS
Representatives from the 15 Arizona county health departments and ADHS and ASU conducted a total of 108,610 inspections for all categories at 49,675 regulated facilities during FY2016. A total of 174.5 Registered Sanitarians FTEs and 22 Sanitarian Aide FTEs were involved in food safety and sanitation programs at State and local agencies
FOOD INSPECTIONS
There were 40,718 (including temporary) food establishments in Arizona and 99,090 food safety related inspections (i.e. pre-operational, routine, re-inspection, or follow-up inspections) were conducted at these establishments.
FOODBORNE OUTBREAKS
Four large outbreaks were investigated in FY2016 that included two multi-state outbreaks and two large prison outbreaks. The demand on resources resulting from these investigations underscores the importance of preparedness to respond quickly and effectively.
FDA VOLUNTARY NATIONAL RETAIL FOOD REGULATORY PROGRAM STANDARDS
ADHS and the Arizona counties have made significant progress towards conformance with the Program Standards. ADHS fully meets the requirements of Standard 7.
FOOD REGULATIONS
Inconsistencies in food regulations continue to be a challenge for ADHS and the Arizona counties, as demonstrated by the variability in model year food codes adopted across the state at the local level.
7.0 SUMMARY
37ANNUAL REPORT 2016
APPENDIX

38ANNUAL REPORT 2016
Jurisdiction activity by type Apache Cochise Coconino Gila Graham Greenlee La Paz MaricopaFood Establishments
Current number of food establishments 160 795 1,025 388 170 52 276 19,046 Limited 18 260 274 132 63 7 122 7,632 Moderate 46 361 223 114 35 2 67 5,219 Complex 96 174 529 142 72 43 87 6,195 Number of routine inspections 194 1,169 2,497 417 350 307 591 55,355 Number of re-inspections 6 38 568 62 20 30 10 2,846 Number of pre-operational inspections 7 19 244 29 4 3 6 5,868 Number of foodborne illness complaints - 6 29 11 - 6 9 936 Number of non-foodborne illness complaints 9 27 77 24 3 44 30 5,099 Number of compliance proceedings - - 1 - - - - 1,094 Number of food items detained/embargoed - - 12 - 270 1 - 175,707 Number of temporary food establishment inspections 46 78 244 92 35 125 172 3,579
OutreachNumber of presentations 37 - 59 - 7 24 80 120 Number of participants/audience 510 - 4,739 - 1,561 135 2,528 2,800 Number of consultations/counseling provided 1 - - - 92 - 2,500 4,100 Number of media contacts - - 4 - - - 10 130
Non-food Related ActivitiesPublic & semi-public bathing places 2 127 181 12 20 3 20 8,879 Routine inspections 2 209 695 25 38 18 20 17,995 Complaint inspections - 2 4 3 - - - 387 Enforcement actions - - - - - - - 1,425 Trailer coach parks - 117 75 - 11 1 158 471 Routine inspections - 93 113 - 11 2 41 449 Complaint inspections - 1 1 - - - 4 76 Enforcement actions - - - - - - - 4 Public school grounds 11 53 43 - - 7 11 953 Routine inspections - 34 43 - - 20 11 846 Complaint inspections - - 9 - - 6 - 6 Enforcement actions - - - - - - - 7 Camp grounds - - 8 - - 2 - 5 Routine inspections - - 8 - - 4 - 5 Complaint inspections - - - - - - - - Enforcement actions - - - - - - - - Children’s camps 4 - 9 - - - Routine inspections 4 - - 10 - - - - Complaint inspections - - - - - - - - Enforcement actions - - - - - - - -Public accommodations 21 96 128 40 12 6 25 418 Routine inspections 26 77 188 33 13 12 25 401 Complaint inspections 2 - 40 2 - - 2 156 Enforcement actions - - - - - - - 12 Bottled water - - 1 - - 1 27 Routine inspections - - 1 - - - 2 42 Complaint inspections - - - - - - - 3 Enforcement actions - - - - - - - - Body Art Parlors - - 10 - - - - - Routine Inspections - - 37 - - - - - Complaint inspections - - 10 - - - - -
APPENDIX APERMITTED ESTABLISHMENTS AND RELATED ACTIVITY TOTALS
39ANNUAL REPORT 2016
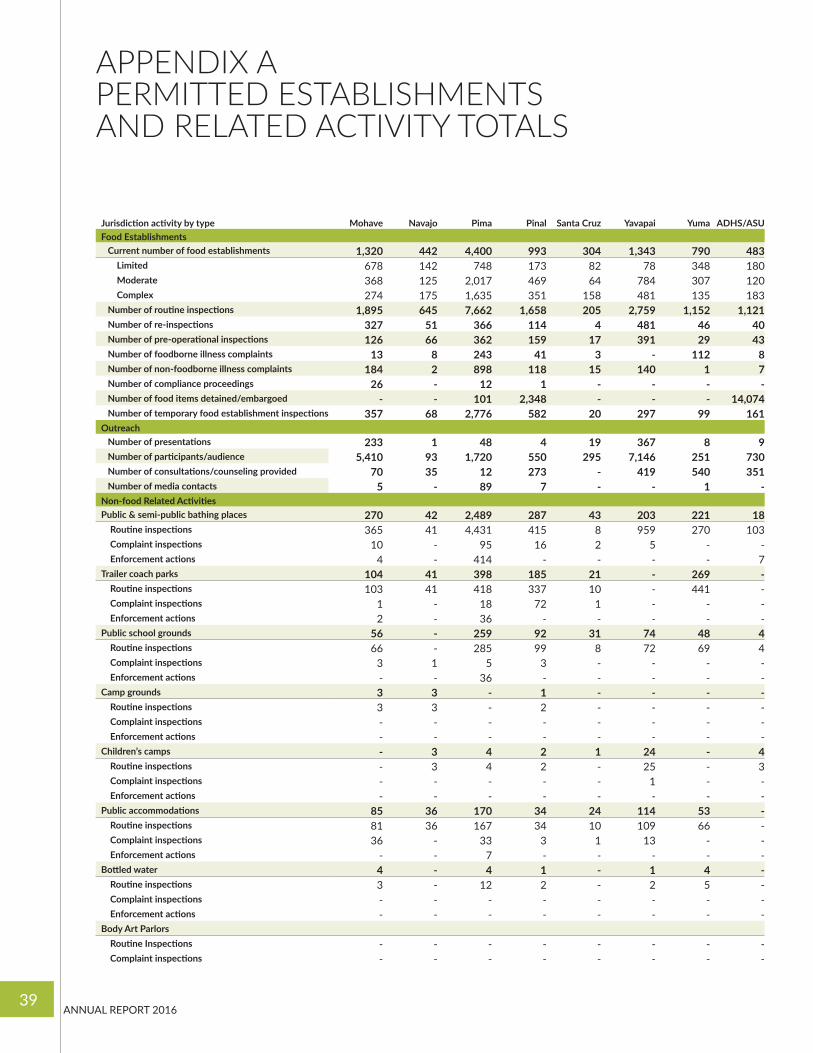
Jurisdiction activity by type Mohave Navajo Pima Pinal Santa Cruz Yavapai Yuma ADHS/ASUFood Establishments
Current number of food establishments 1,320 442 4,400 993 304 1,343 790 483 Limited 678 142 748 173 82 78 348 180 Moderate 368 125 2,017 469 64 784 307 120 Complex 274 175 1,635 351 158 481 135 183 Number of routine inspections 1,895 645 7,662 1,658 205 2,759 1,152 1,121 Number of re-inspections 327 51 366 114 4 481 46 40 Number of pre-operational inspections 126 66 362 159 17 391 29 43 Number of foodborne illness complaints 13 8 243 41 3 - 112 8 Number of non-foodborne illness complaints 184 2 898 118 15 140 1 7 Number of compliance proceedings 26 - 12 1 - - - - Number of food items detained/embargoed - - 101 2,348 - - - 14,074 Number of temporary food establishment inspections 357 68 2,776 582 20 297 99 161
OutreachNumber of presentations 233 1 48 4 19 367 8 9 Number of participants/audience 5,410 93 1,720 550 295 7,146 251 730 Number of consultations/counseling provided 70 35 12 273 - 419 540 351 Number of media contacts 5 - 89 7 - - 1 -
Non-food Related ActivitiesPublic & semi-public bathing places 270 42 2,489 287 43 203 221 18 Routine inspections 365 41 4,431 415 8 959 270 103 Complaint inspections 10 - 95 16 2 5 - - Enforcement actions 4 - 414 - - - - 7 Trailer coach parks 104 41 398 185 21 - 269 - Routine inspections 103 41 418 337 10 - 441 - Complaint inspections 1 - 18 72 1 - - - Enforcement actions 2 - 36 - - - - - Public school grounds 56 - 259 92 31 74 48 4 Routine inspections 66 - 285 99 8 72 69 4 Complaint inspections 3 1 5 3 - - - - Enforcement actions - - 36 - - - - - Camp grounds 3 3 - 1 - - - - Routine inspections 3 3 - 2 - - - - Complaint inspections - - - - - - - - Enforcement actions - - - - - - - - Children’s camps - 3 4 2 1 24 - 4 Routine inspections - 3 4 2 - 25 - 3 Complaint inspections - - - - - 1 - - Enforcement actions - - - - - - - - Public accommodations 85 36 170 34 24 114 53 - Routine inspections 81 36 167 34 10 109 66 - Complaint inspections 36 - 33 3 1 13 - - Enforcement actions - - 7 - - - - - Bottled water 4 - 4 1 - 1 4 - Routine inspections 3 - 12 2 - 2 5 - Complaint inspections - - - - - - - - Enforcement actions - - - - - - - - Body Art Parlors Routine Inspections - - - - - - - - Complaint inspections - - - - - - - -
APPENDIX APERMITTED ESTABLISHMENTS AND RELATED ACTIVITY TOTALS

40ANNUAL REPORT 2016
APPENDIX BAVERAGE NUMBER OF INSPECTIONS PER FACILITY TYPE
JURISDICTION ACTIVITY BY TYPECOMPLEX MODERATE LIMITED
APACHE 96 114 1.19 46 55 1.20 18 25 1.39
COCHISE 174 434 2.49 361 524 1.45 260 211 0.81
COCONINO 529 1,455 2.75 223 461 2.07 274 581 2.12
GILA 142 151 1.06 114 114 1.00 132 139 1.05
GRAHAM 72 149 2.07 35 75 2.14 63 126 2.00
GREENLEE 43 240 5.58 2 4 2.00 7 63 9.00
LA PAZ 87 199 2.29 67 145 2.16 122 247 2.02
MARICOPA 6,195 23,894 3.86 5,219 15,505 2.97 7,632 15,956 2.09
MOHAVE 274 444 1.62 368 591 1.61 678 860 1.27
NAVAJO 175 272 1.55 125 208 1.66 142 165 1.16
PIMA 1,635 3,637 2.22 2,017 3,302 1.64 748 723 0.97
PINAL 351 632 1.80 469 812 1.73 173 214 1.24
SANTA CRUZ 158 106 0.67 64 44 0.69 82 55 0.67
YAVAPAI 481 1,215 2.53 784 1,392 1.78 78 152 1.95
YUMA 135 240 2.49 307 454 2.89 348 458 1.77
ADHS / ASU 183 455 2.49 120 347 2.89 180 319 1.77
NUMBER OF FOOD ESTABLISHMENTSFOOD ESTABLISHMENT INSPECTIONSRATIO OF FOOD ESTABLISHMENT INSPECTIONS TO ESTABLISHMENT BY COMPLEXITY

41ANNUAL REPORT 2016
APPENDIX CREGISTERED SANITARIANS AND SANITARIAN AIDE TOTALS BY JURISDICTION IN FY2016
JURISDICTIONAPACHE 1.5 0
COCHISE 3 2
COCONINO 8 1
GILA 1 1
GRAHAM 2 0
GREENLEE 1 1
LA PAZ 1.5 0.5
MARICOPA 104 0
MOHAVE 2 4
NAVAJO 2 0
PIMA 23 3
PINAL 7 0
SANTA CRUZ 2 1
YAVAPAI 6 2
YUMA 4 0
ADHS / ASU 6.5 6.5
TOTALS 174.5 22
REGISTERED SANITARIANSSANITARIANS AIDES

42ANNUAL REPORT 2016
APPENDIX DARIZONA FOODBORNE ILLNESS REPORT CARDFO
OD
BORN
EIL
LNES
SRE
PORT
CAR
D20
15A
ZRA
TE*
2014
AZ
RATE
*
2015
US
RATE
*†
2020
CD
CTA
RGET
RATE
‡
PERC
ENTA
GE
OF
AZ
RATE
CHA
NG
E
CAM
PYLO
BACT
ERIO
SIS
FOR
EVER
Y CA
SERE
PORT
ED§
SHIG
A TO
XIN
PRO
DU
CIN
G E
. CO
LI
LIST
ERIO
SIS
SHIG
ELLO
SIS
VIB
RIO
INFE
CTIO
N(E
XCLU
DIN
G T
OXI
GEN
IC V
. CH
OLE
RAE)
45%
INCR
EASE
27%
INCR
EASE
35%
DEC
REAS
E
45%
INCR
EASE
0% N
O C
HAN
GE
10%
INCR
EASE
12.9
7
0.95
0.24
5.53
0.39
15.8
9
8.5
N/A
0.2
N/A
0.2
11.4
14.1
5
1.5
0.2
5.6
0.5
15.6
20.4
1.9
0.07
8.1
0.5
17.2
30 G
O U
ND
IAG
NO
SED
26 G
O U
ND
IAG
NO
SED
2 G
O U
ND
IAG
NO
SED
8 G
O U
ND
IAG
NO
SED
142
GO
UN
DIA
GN
OSE
D
29 G
O U
ND
IAG
NO
SED
SALM
ON
ELLO
SIS
(EXC
LUD
ING
S. T
YPH
I AN
D S
. PA
RATY
PHI)
* Rat
e ca
lcul
ated
per
100
,000
pop
ulati
on
† htt
p://
ww
w.c
dc.g
ov/m
mw
r/pr
evie
w/m
mw
rhtm
l/mm
6418
a4.h
tm
‡ bas
ed o
n H
ealth
y Pe
ople
202
0 ta
rget
rate
s htt
ps://
ww
w.h
ealth
peop
le.g
ov/2
020/
topi
c/fo
od-s
afet
y/ob
jecti
ves
§ Estim
ates
of f
oodb
orne
illn
ess
burd
en in
the
Uni
ted
Stat
es fr
om 2
011
CDC
data
htt
p://
ww
wnc
.cdc
.gov
/eid
/arti
cle/
17/1
/p1-
1101
-t2

43ANNUAL REPORT 2016
APACHE COUNTY
County Seat St. Johns
Population 73,195
Size 11,197 sq. miles
Number of Sanitarians 1.5
Sanitarian Aides 0
Food Establishments 160
Bathing Places 2
Trailer Coach Parks 0
School Grounds 11
Public Accommodations 21
Total Complaints 9
APPENDIX E
44ANNUAL REPORT 2016
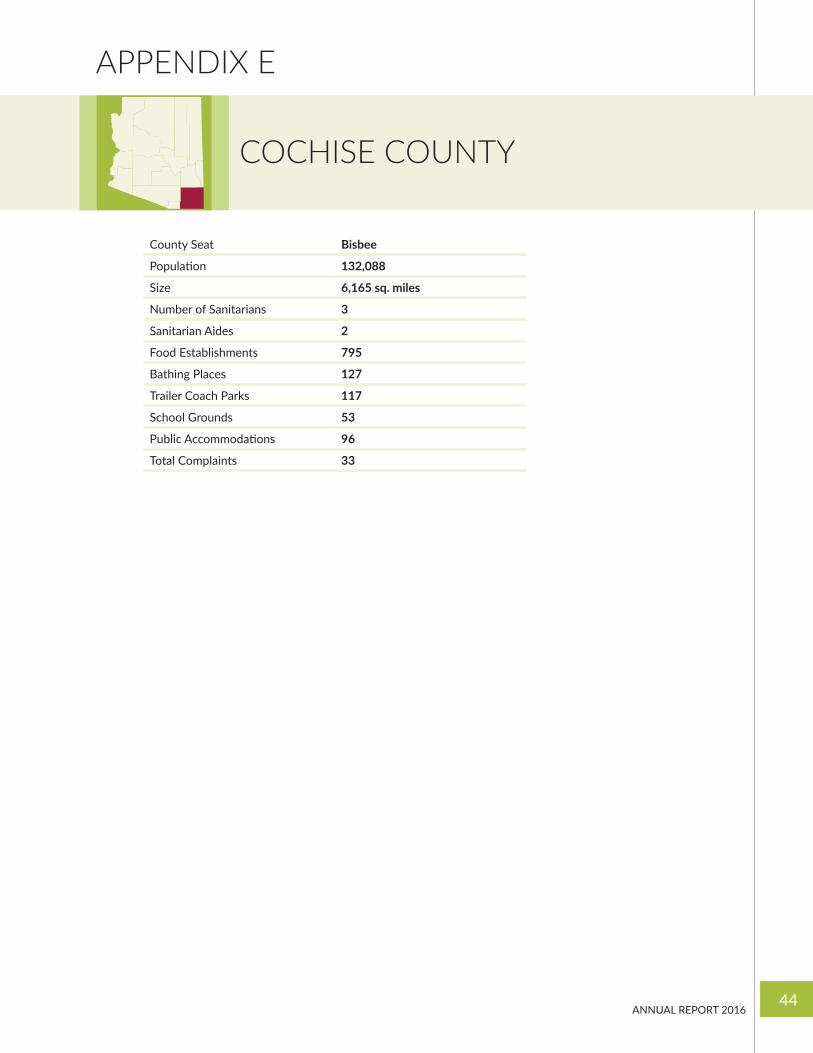
COCHISE COUNTY
County Seat Bisbee
Population 132,088
Size 6,165 sq. miles
Number of Sanitarians 3
Sanitarian Aides 2
Food Establishments 795
Bathing Places 127
Trailer Coach Parks 117
School Grounds 53
Public Accommodations 96
Total Complaints 33
APPENDIX E

45ANNUAL REPORT 2016
COCONINO COUNTY
COUNTY REPORTED HIGHLIGHTS:
Medical Marijuana Intergovernmental agreement: The Environmental Health Program completed the deliverables for the medical marijuana grant with the Arizona Department of Health Services.
Tickborne Relapsing Fever Outbreak: The Environmental Health Program had an article featured in the April 2015 issue of the Journal of Environmental Health.
Food Inspection Website: The Environmental Health Program is currently working on a website for the public to view food inspections.
Best Practices Guide for Farmer's Market Coordinators: The Environmental Health Program developed a Best Practices Guide for Farmer's Market (FM) Coordinators and is waiting to receive comments from FM Coordinators.
Coconino County worked with the CDC providing data for the Morbidity and Mortality Weekly Report title: Immediate Closures and Violation Identified During Routine Inspections of Public Aquatic Facilities - Network for Aquatic Facility Inspection Surveillance, Five State, 2013.
County Seat Flagstaff
Population 136,011
Size 18,618 sq. miles
Number of Sanitarians 8
Sanitarian Aides 1
Food Establishments 1,025
Bathing Places 181
Trailer Coach Parks 75
School Grounds 43
Public Accommodations 128
Total Complaints 106
APPENDIX E

46ANNUAL REPORT 2016
GILA COUNTY
County Seat Globe
Population 53,144
Size 4,757 sq. miles
Number of Sanitarians 1
Sanitarian Aides (1)
Food Establishments 388
Bathing Places 12
Trailer Coach Parks 0
School Grounds 0
Public Accommodations 40
Total Complaints 35
APPENDIX E

47ANNUAL REPORT 2016
GRAHAM COUNTY
COUNTY REPORTED HIGHLIGHTS:
Graham County Health Department has launched a Facebook page, with the main content from Environmental Health and food safety. The page is administered by a sanitarian on staff that also monitors unpermitted food offered for sale on social media and updates food recall information.
The Graham County Health Department webpage has been updated. All forms and applications are now available online along with other supporting links and documentation.
County Seat Safford
Population 37,416
Size 4,622 sq. miles
Number of Sanitarians 2
Sanitarian Aides (0)
Food Establishments 170
Bathing Places 20
Trailer Coach Parks 11
School Grounds 0
Public Accommodations 12
Total Complaints 3
APPENDIX E

48ANNUAL REPORT 2016
GREENLEE COUNTY
COUNTY REPORTED HIGHLIGHTS:
Service to the community is the reason for our existence. If we are responsible for insuring a safe food supply in the community, we operate on the idea that everyone who touches food for public consumption should be trained in food safety. Another angle to insure food safety is frequent inspections. This allows the inspector to correct any flaws in the operator’s food prep system.
County Seat Clifton
Population 8,802
Size 1,843 sq. miles
Number of Sanitarians 1
Sanitarian Aides (1)
Food Establishments 52
Bathing Places 3
Trailer Coach Parks 1
School Grounds 7
Public Accommodations 6
Total Complaints 50
APPENDIX E

49ANNUAL REPORT 2016
LA PAZ COUNTY
COUNTY REPORTED HIGHLIGHTS:
La Paz has hired a sanitarian half-time who is responsible for half of the permanent food establishment inspections. As a result, the County was able to complete the required number of inspections for the food establishments in the county.
County Seat Parker
Population 20,281
Size 4,499 sq. miles
Number of Sanitarians 1.5
Sanitarian Aides (1.5)
Food Establishments 276
Bathing Places 20
Trailer Coach Parks 158
School Grounds 11
Public Accommodations 25
Total Complaints 39
APPENDIX E

50ANNUAL REPORT 2016
MARICOPA COUNTY
COUNTY REPORTED HIGHLIGHTS:
ACTIVE MANAGERIAL CONTROL (AMC) TRAINING
Maricopa County Environmental Services Department (MCESD) continues to offer AMC classes to help food facility managers gain better food protection control at their establishments. In FY16, MCESD held 42 classes and trained 611 attendees. This is a 31% increase from FY15’s 32 classes and a 62% increase from FY15’s 377 attendees. A measured and sustained reduction in priority violations was seen by establishments after attending the AMC class:
Center for Disease Control and Prevention – MMWR May 20, 2016
MCESD worked with the CDC providing data for the Morbidity and Mortality Weekly Report titled: Immediate Closures and Violations Identified During Routine Inspections of Public Aquatic Facilities — Network for Aquatic Facility Inspection Surveillance, Five States, 2013
2016 NACo Awarded for “Mobile Restaurant Ratings Tool”
MCESD maintains inspection results from food establishments such as restaurants, retail stores, school cafeterias, and mobile food trucks. In August 2015, these inspection results were made available to the public through a new Mobile Restaurant Ratings tool. In addition to being mobile-friendly, this tool provides users with the ability to search geospatial enriched data, file a citizen complaint, and learn more about the ESD’s Cutting
County Seat Phoenix
Population 3,942,169
Size 9,200 sq. miles
Number of Sanitarians 104
Sanitarian Aides 0
Food Establishments 19,046
Bathing Places 8,879
Trailer Coach Parks 471
School Grounds 953
Public Accommodations 418
Total Complaints 6,035
APPENDIX E

51ANNUAL REPORT 2016
Edge Food Safety Partnership program. Since launching the Mobile Restaurant Ratings tool, there has been a 17% increase in the number of hits related to inspection results and the enrollment rate for the Cutting Edge program has doubled. Facilitating access to inspection results has increased the public’s ability to make informed choices, and encouraged businesses to work towards reducing the risk of foodborne illness.
THE CUTTING EDGE PROGRAM – FOOD SAFETY PARTNERSHIP
This innovative program rewards and promotes food establishments with food safety systems and active managerial control. During FY16, participation in the program grew from 1734 to 2076 participants (a 16% increase). More importantly, participants demonstrated greater long-term control over foodborne illness risk factor violations by achieving almost three times fewer foodborne illness risk factor violations per inspection.
FDA COOPERATIVE AGREEMENT
MCESD was awarded a 5 year cooperative agreement from the Department of Health and Human Services Public Health Services to support a project entitled, “Active Managerial Control Educational Strategies for Reducing the Occurrence of Foodborne Illness.”
Maricopa County Environmental Health Code Adoptions by the Maricopa County Board of Supervisors:
30 DAY TRANSITION - MCEHC CHAPTERS I AND VIII
Allows new owners of existing food establishments to remain in business for up to 30 days while permit application review is in progress. Approved at the 7/22/2015 BOS meeting for immediate effect.
MICRO MARKET FEES - MCEHC CHAPTER I
Adds a Micro Market Operating Permit and three fees associated with the permit to the MCEHC. This revision reduces Micro Market Environmental Health fees pursuant to Arizona Revised Statute § 11-251.08. New fees include: Micro Market Operating Permit ($155), Micro Market Reference Plan ($270) and Micro Market Permit Processing Fee ($20). Approved at the 7/22/2015 BOS meeting for immediate effect.
MARICOPA COUNTY
APPENDIX E

52ANNUAL REPORT 2016
MOHAVE COUNTY
COUNTY REPORTED HIGHLIGHTS:
The Mohave County Environmental Health Division developed a quality improvement plan to improve the inspection reports completed by food safety inspectors. In order to clearly communicate risk factors with operators, reports must include:
1. Specific Violations marked and noted in the correct item number 2. Corrective Actions 3. Compliance Dates for Corrective Actions 4. Clear and Concise Writing
MCEHD developed new inspection report forms to include columns for items 1-3 so inspectors would be less likely to forget to include the required information. Additionally, inspectors were trained on how to properly complete the forms. The baseline data showed 94% of reports were out of compliance. After implementing the new forms and training, we reviewed the reports and found 30% of the reports not completed to our standards. After further training, a second review of reports showed only 21% of reports were out of compliance. After seeing such great improvement, MCEHD revised all annual permit inspection forms to reflect the food safety program forms.
Mohave County worked with the CDC providing data for the Morbidity and Mortality Weekly Report title: Immediate Closures and Violation Identified During Routine Inspections of Public Aquatic Facilities - Network for Aquatic Facility Inspection Surveillance, Five State, 2013.
County Seat Kingman
Population 203,334
Size 13,311 sq. miles
Number of Sanitarians 2
Sanitarian Aides 4
Food Establishments 1,320
Bathing Places 270
Trailer Coach Parks 104
School Grounds 56
Public Accommodations 85
Total Complaints 197
APPENDIX E
53ANNUAL REPORT 2016
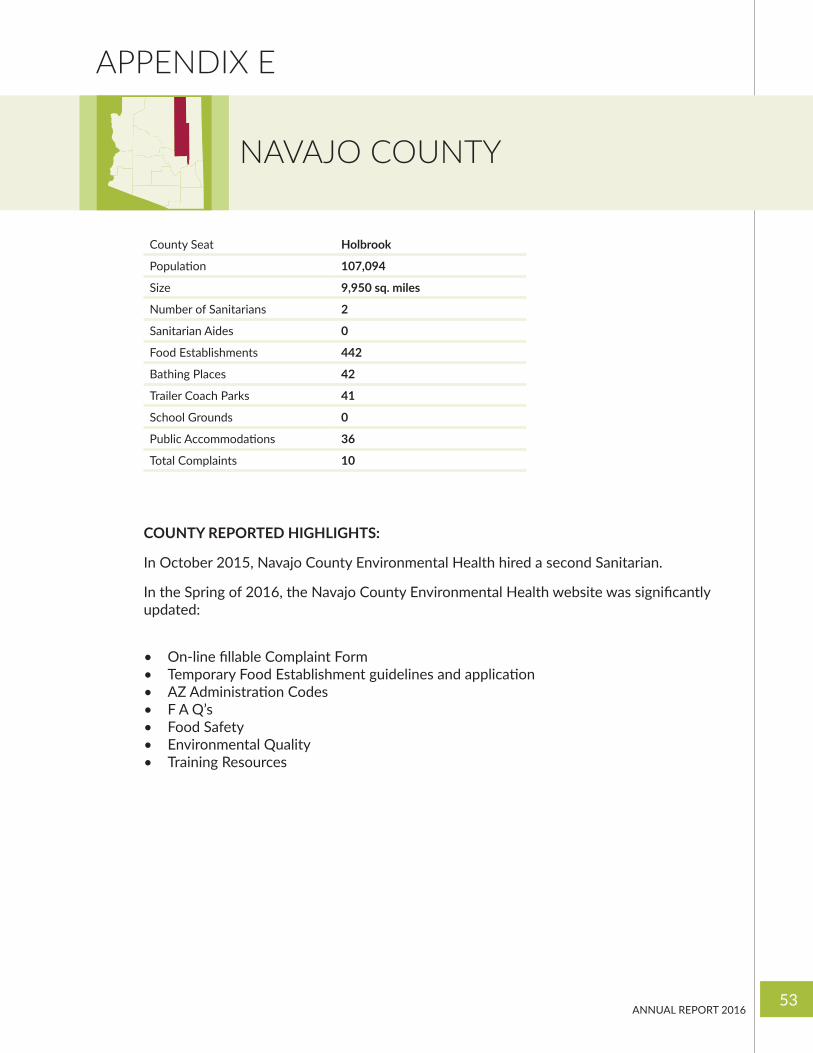
NAVAJO COUNTY
COUNTY REPORTED HIGHLIGHTS:
In October 2015, Navajo County Environmental Health hired a second Sanitarian.
In the Spring of 2016, the Navajo County Environmental Health website was significantly updated:
• On-line fillable Complaint Form• Temporary Food Establishment guidelines and application• AZ Administration Codes• F A Q’s• Food Safety• Environmental Quality• Training Resources
County Seat Holbrook
Population 107,094
Size 9,950 sq. miles
Number of Sanitarians 2
Sanitarian Aides 0
Food Establishments 442
Bathing Places 42
Trailer Coach Parks 41
School Grounds 0
Public Accommodations 36
Total Complaints 10
APPENDIX E

54ANNUAL REPORT 2016
PIMA COUNTY
COUNTY REPORTED HIGHLIGHTS:
The Board of Supervisors adopted a New Food and General Provisions Ordinance which included incorporating the FDA 2013 Model Food Code and Inspection form, enforcement actions, specifications for mobile and temporary food service and micro-markets. A five year phase in for a total cost recovery system was also adopted. Seven Public Hearings, three Board of Public Health and various meeting were conducted to introduce the proposed code to the regulated community and the public.
Risk Based Food Inspection training was hosted by Pima County and the entire food protection staff participated.
Staff training on the 2013 Food Code was provided to all staff and the Food Service Operator/Worker training program was modified to reflect the new changes.
Three new EHS positions were created and filled to assist in our risk based inspection frequency goal (when totally funded – 2020, an additional 20 staff have been budgeted for being implemented as the fee increase is realized).
The FDA Food Grant was awarded which is a $70,000/year grant for a period of 5 years.
The FDA Voluntary Retail Food Standards program accomplishments were assessed and two Standards were met and submitted for Audit (Standard #1 – Regulatory Foundation and Standard #7 – Industry and Community Relations.
County Seat Tucson
Population 992,394
Size 9,187 sq. miles
Number of Sanitarians 23
Sanitarian Aides 3
Food Establishments 4,400
Bathing Places 2,489
Trailer Coach Parks 398
School Grounds 259
Public Accommodations 170
Total Complaints 1,141
APPENDIX E

55ANNUAL REPORT 2016
PIMA COUNTY
The program is in the process of evaluating hand held field inspection platform for conducting all environmental health inspections.
Pima County worked with the CDC providing data for the Morbidity and Mortality Weekly Report title: Immediate Closures and Violation Identified During Routine Inspections of Public Aquatic Facilities - Network for Aquatic Facility Inspection Surveillance, Five State, 2013.
APPENDIX E

56ANNUAL REPORT 2016
PINAL COUNTY
COUNTY REPORTED HIGHLIGHTS:
In June of 2016, Pinal County Environmental Health Services completed a current self-assessment of our program with respect to the FDA Voluntary National Retail Food Program Standards.
Since 2014 Pinal County Environmental Health had investigated six citizen’s complaints regarding a salsa vendor selling food along the side of the road in San Tan Valley. Eventually, our Sanitarians were able to catch up with this vendor and inform her that making and selling salsa required a food establishment permit. In late 2015, this operator obtained a permit for a retail location where she makes, packages, and sells salsa and guacamole. Interestingly, after becoming permitted, the vendor informed her inspector that the business had grown significantly. Numerous individuals, who had been apprehensive and unwilling to purchase her product when she was a roadside vendor, were now confident in the safety of her foods since she obtained her permit for her food establishment from our department. Her business has grown so much that she now has plans to expand to a full service restaurant. This is just one example of how appropriate food safety regulation can help ensure the health of the community and also provide positive outcomes for business owners.
County Seat Florence
Population 387,365
Size 5,365 sq. miles
Number of Sanitarians 7
Sanitarian Aides 0
Food Establishments 993
Bathing Places 287
Trailer Coach Parks 185
School Grounds 92
Public Accommodations 34
Total Complaints 159
APPENDIX E

57ANNUAL REPORT 2016
SANTA CRUZ COUNTY
County Seat Nogales
Population 47,303
Size 1,236 sq. miles
Number of Sanitarians 2
Sanitarian Aides 1
Food Establishments 304
Bathing Places 43
Trailer Coach Parks 21
School Grounds 31
Public Accommodations 24
Total Complaints 18
APPENDIX E

58ANNUAL REPORT 2016
YAVAPAI COUNTY
COUNTY REPORTED HIGHLIGHTS:
Presented “Locally Grown Produce as an Approved Source” at July NEHA Conference. Two staff members attended conference. Implemented guidelines for restaurants to use regarding “locally grown produce as an approved source”.
Attended 2016 Public Health Preparedness Summit.
Two staff members attended the FDA Voluntary National Retail Food Regulatory Program Standards “Self-Assessment and Verification Audit Workshop”.
Two staff members attended Reduced Oxygen Packaging training in Phoenix.
Six staff members attended the 49th Annual Vector Control Workshop.
Reviewed and revised 15 Environmental Health policies.
Became the 1st Accredited Health Department in Arizona.
Developed a “No Pets Allowed/Service Animals Only” poster for use by food facilities in conjunction with the Yavapai County Food Safety Industry Council and U of A Cooperative Extension.
Utilized State provided food safety sticker templates to develop a variety of customized educational handout stickers for restaurants and food service facilities.
County Seat Prescott
Population 212,637
Size 8.123 sq. miles
Number of Sanitarians 6
Sanitarian Aides 2
Food Establishments 1,343
Pools 203
Trailer Coach Parks 0
School Grounds 74
Public Accommodations 114
Total Complaints 140
APPENDIX E
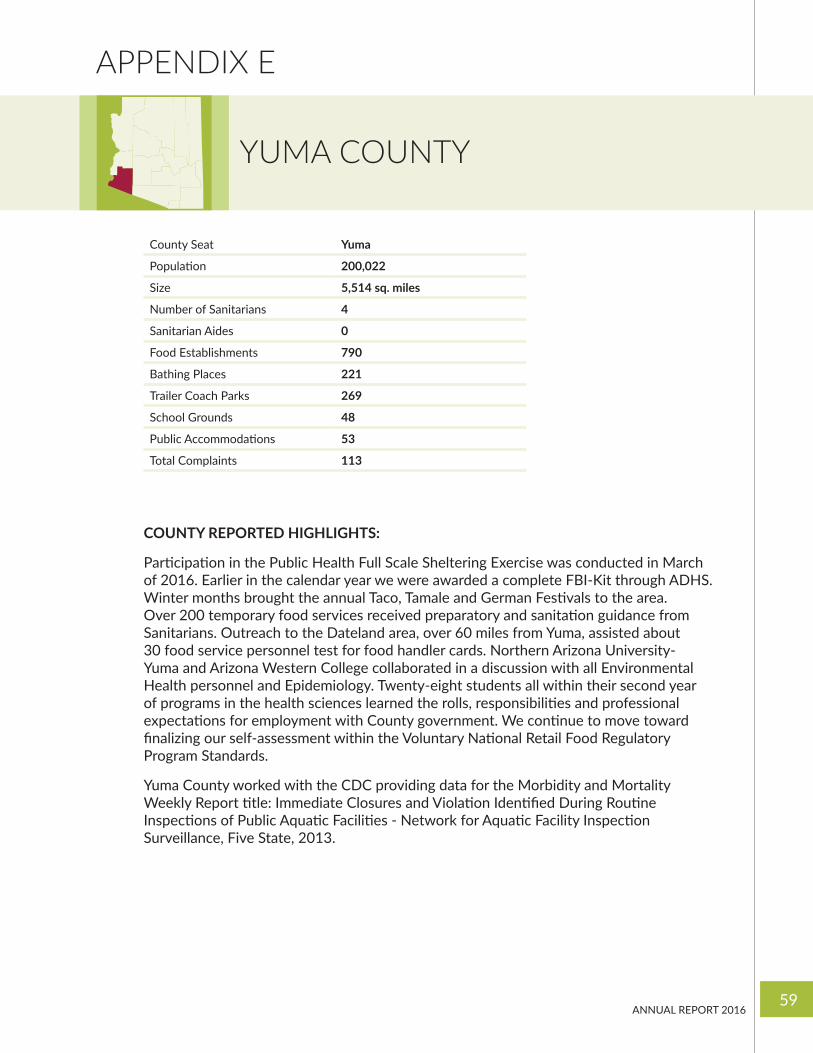
59ANNUAL REPORT 2016
YUMA COUNTY
County Seat Yuma
Population 200,022
Size 5,514 sq. miles
Number of Sanitarians 4
Sanitarian Aides 0
Food Establishments 790
Bathing Places 221
Trailer Coach Parks 269
School Grounds 48
Public Accommodations 53
Total Complaints 113
COUNTY REPORTED HIGHLIGHTS:
Participation in the Public Health Full Scale Sheltering Exercise was conducted in March of 2016. Earlier in the calendar year we were awarded a complete FBI-Kit through ADHS. Winter months brought the annual Taco, Tamale and German Festivals to the area. Over 200 temporary food services received preparatory and sanitation guidance from Sanitarians. Outreach to the Dateland area, over 60 miles from Yuma, assisted about 30 food service personnel test for food handler cards. Northern Arizona University-Yuma and Arizona Western College collaborated in a discussion with all Environmental Health personnel and Epidemiology. Twenty-eight students all within their second year of programs in the health sciences learned the rolls, responsibilities and professional expectations for employment with County government. We continue to move toward finalizing our self-assessment within the Voluntary National Retail Food Regulatory Program Standards.
Yuma County worked with the CDC providing data for the Morbidity and Mortality Weekly Report title: Immediate Closures and Violation Identified During Routine Inspections of Public Aquatic Facilities - Network for Aquatic Facility Inspection Surveillance, Five State, 2013.
APPENDIX E

60ANNUAL REPORT 2016
ARIZONA STATE UNIVERSITY
ASU REPORTED HIGHLIGHTS:
The past year at Arizona State University has been a year of plan review and construction inspections. The football stadium is being remodeled over a three year period. The second phase is to be completed prior to this football season.
Our main dining destination has been totally remodeled with an emphasis on “Cooking to Order.” The food operator has almost eliminated the cooling of foods that require reheating at a later time. This process helps in minimizing the cooling/reheating danger zones that frequently cause food safety issues.
Population 83,301
Four Campuses
Number of Sanitarians 1.5
Sanitarian Aides 0
Food Establishments 169
Bathing Places 18
Trailer Coach Parks NA
School Grounds 4
Public Accommodations NA
Total Complaints 4
APPENDIX E

61ANNUAL REPORT 2016
ARIZONA DEPARTMENT OF HEALTH SERVICES
Population 6.7 Million
Number of Sanitarians 5
Sanitarian Aides 6.5
Food Establishments 324
Pools NA
Trailer Coach Parks NA
School Grounds 0
Public Accommodations NA
Total Complaints 11
APPENDIX E