food security and nutrition assessment (fsna) in...
TRANSCRIPT

1
Food Security and Nutrition
Assessment (FSNA) in Karamoja
December 2014
Report
By Dr Henry Wamani, UNICEF Nutrition Unit and WFP AME Unit

2
TABLE OF CONTENTS
EXECUTIVE SUMMARY ........................................................................................................................................... 6
BACKGROUND ..................................................................................................................................................... 18
METHODS ............................................................................................................................................................ 19
SURVEY FINDINGS ................................................................................................................................................ 19
DEMOGRAPHY ..................................................................................................................................................... 19
FOOD AVAILABILITY ............................................................................................................................................. 21
ACCESS TO LAND ................................................................................................................................................... 21 LIVESTOCK PRODUCTION ......................................................................................................................................... 23 CROP PRODUCTION ............................................................................................................................................... 24
FOOD ACCESS ...................................................................................................................................................... 26
HOUSEHOLD ASSET OWNERSHIP ................................................................................................................................ 26 HOUSEHOLD INCOME ............................................................................................................................................. 27 HOUSEHOLD EXPENDITURE ...................................................................................................................................... 29 HOUSEHOLD DEBT ................................................................................................................................................. 30
FOOD UTILIZATION .............................................................................................................................................. 32
FOOD CONSUMPTION............................................................................................................................................. 32 SUMMARY OF FACTORS AFFECTING FOOD CONSUMPTION ................................................................................................ 33
SHOCKS & COPING ............................................................................................................................................... 34
WFP ASSISTANCE ................................................................................................................................................. 38
VULNERABILITY TO FOOD INSECURITY ................................................................................................................. 39
EXTREMELY VULNERABLE HOUSEHOLDS (EVH) ............................................................................................................ 39 FEMALE HEADED HOUSEHOLDS ................................................................................................................................. 40
NUTRITION .......................................................................................................................................................... 42
EDUCATION STATUS OF MOTHERS/CAREGIVERS ............................................................................................................. 42 REPRODUCTIVE HEALTH STATUS OF MOTHERS ............................................................................................................... 42 AGE AND SEX DISTRIBUTION OF SAMPLED CHILDREN ....................................................................................................... 43 PREVALENCE OF WASTING, STUNTING AND UNDERWEIGHT .............................................................................................. 43 TREND OF GAM AND PROJECTIONS SINCE MAY 2011 ................................................................................................... 44 PREVALENCE OF STUNTING ACCORDING TO SEX IN CHILDREN 6-59 MONTHS ......................................................................... 45 MEAN Z-SCORES ................................................................................................................................................... 46 PREVALENCE OF ANEMIA IN CHILDREN AND MOTHERS ..................................................................................................... 46 PREVALENCE OF UNDERWEIGHT AMONG WOMEN 15 – 49 YEARS ..................................................................................... 47
INFANT AND YOUNG CHILD FEEDING PRACTICES ................................................................................................. 48
BREASTFEEDING PRACTICES ..................................................................................................................................... 48 TIMING OF INTRODUCTION OF COMPLEMENTARY FEEDING ............................................................................................... 48 MINIMUM MEAL FREQUENCY OF COMPLEMENTARY FOOD ............................................................................................... 49 MINIMUM DIETARY DIVERSITY .................................................................................................................................. 49 MINIMUM ACCEPTABLE DIET .................................................................................................................................... 50

3
ENROLLMENT IN MCHN PROGRAM ........................................................................................................................... 51
MORBIDITY AND PRIMARY HEALTH CARE SERVICES ............................................................................................ 52
IMMUNIZATION, VITAMIN A SUPPLEMENTATION AND DEWORMING COVERAGE ..................................................................... 52 PREVALENCE OF COMMON CHILDHOOD ILLNESSES AND BED NET USE .................................................................................. 53 MOSQUITO NET COVERAGE ..................................................................................................................................... 54
WATER AND SANITATION .................................................................................................................................... 55
WATER SOURCES .................................................................................................................................................. 55 LATRINE COVERAGE ............................................................................................................................................... 55
ANALYSIS OF FACTORS ASSOCIATED WITH MALNUTRITION ................................................................................ 57
ASSOCIATION OF MALNUTRITION WITH HOUSEHOLD SOCIOECONOMIC STATUS ...................................................................... 57 ASSOCIATION OF MALNUTRITION WITH HOUSEHOLD EVH STATUS ..................................................................................... 59 ASSOCIATION OF IYCF INDICATORS WITH HOUSEHOLD FOOD SECURITY STATUS ..................................................................... 60 ASSOCIATION OF MALNUTRITION WITH IYCF INDICATORS ................................................................................................ 61 ASSOCIATION OF MALNUTRITION WITH MOTHERS’ NUTRITION STATUS ................................................................................ 61 ASSOCIATION OF MALNUTRITION WITH MOTHERS’ EDUCATION STATUS ............................................................................... 62 ASSOCIATION OF MALNUTRITION WITH MOTHERS’ REPRODUCTIVE STATUS ........................................................................... 62 ASSOCIATION OF MALNUTRITION WITH HOUSEHOLD LATRINE OWNERSHIP ........................................................................... 63 OTHER FACTORS THAT WERE OR WERE NOT ASSOCIATED WITH MALNUTRITION ..................................................................... 63
CONCLUSIONS ..................................................................................................................................................... 64
FOOD AVAILABILITY ............................................................................................................................................... 64 FOOD ACCESS....................................................................................................................................................... 64 FOOD UTILIZATION ................................................................................................................................................ 65 STABILITY ............................................................................................................................................................ 65 NUTRITION STATUS ............................................................................................................................................... 65 INFANT AND YOUNG CHILD FEEDING PRACTICES ............................................................................................................. 65 MORBIDITY AND PRIMARY HEALTH CARE SERVICES ......................................................................................................... 66 FACTORS ASSOCIATED WITH MALNUTRITION ................................................................................................................ 66
RECOMMENDATIONS .......................................................................................................................................... 67
FOOD SECURITY .................................................................................................................................................... 67
ANNEX ................................................................................................................................................................. 70
ANNEX 1: FCS BY SUB-COUNTY ................................................................................................................................ 70 ANNEX 2: QUESTIONNAIRE ..................................................................................................................................... 71 ANNEX 3: ENA REPORTS AND PLAUSIBILITY CHECKS....................................................................................................... 92

4
LIST OF FIGURES
FIGURE 1: PROPORTION OF FEMALE AND MALE HEADED HOUSEHOLDS ..................................................................................... 20 FIGURE 2: EDUCATION LEVEL OF HOUSEHOLD HEADS........................................................................................................... 21 FIGURE 3: ACCESS TO LAND .......................................................................................................................................... 22 FIGURE 4: TYPE OF LAND ACCESSED BY HOUSEHOLDS .......................................................................................................... 23 FIGURE 5: LIVESTOCK OWNERSHIP AMONG HOUSEHOLDS ..................................................................................................... 24 FIGURE 6: COMPARISON BETWEEN THIS SEASON AND LAST YEAR'S HARVEST, AND DURATION STOCKS EXPECTED TO LAST IN HOUSEHOLD .... 25 FIGURE 7: OWNERSHIP OF FOOD AND SEED STORES ............................................................................................................ 27 FIGURE 8: PROPORTION OF HOUSEHOLDS WITH AT LEAST ONE INCOME EARNER ......................................................................... 28 FIGURE 9: PERCENTAGE OF HOUSEHOLDS THAT ACCESSED DEBT THROUGH INFORMAL SOURCES ...................................................... 32 FIGURE 10: FOOD CONSUMPTION AMONG HOUSEHOLDS ..................................................................................................... 33 FIGURE 11: FOOD CONSUMPTION COPING STRATEGY INDEX (RCSI) ........................................................................................ 36 FIGURE 12: APPLICATION OF LIVELIHOOD COPING STRATEGIES ............................................................................................... 37 FIGURE 13: PERCENTAGE OF HOUSEHOLDS WHOSE MEMBERS EXPERIENCED SAFETY PROBLEMS WHILE GOING TO THE FDP .................... 39 FIGURE 14: EDUCATION STATUS OF WOMEN AGED 15-49 YEARS ACCORDING TO DISTRICT (N=3998) ............................................. 42 FIGURE 15: REPRODUCTIVE HEALTH STATUS AMONG WOMEN 15-45 YEARS ACCORDING TO DISTRICT (N=4002) ............................... 43 FIGURE 16: TREND AND LINEAR PROJECTIONS OF GAM FOR ABIM, AMUDAT AND KAABONG DISTRICTS ............................................ 45 FIGURE 17: TREND AND LINEAR PROJECTIONS OF GAM FOR KOTIDO, MOROTO, NAKAPIRIPIRIT AND NAPAK DISTRICTS ........................ 45 FIGURE 18: PREVALENCE OF STUNTING ACCORDING TO SEX AND DISTRICT ................................................................................. 46 FIGURE 19: EXCLUSIVE BREASTFEEDING RATES AMONG CHILDREN 0-5 MONTHS ACCORDING TO DISTRICTS ........................................ 48 FIGURE 20: PROPORTION OF CHILDREN 6-8 MONTHS WHO DID RECEIVE COMPLEMENTARY THE DAY BEFORE THE SURVEY, ACCORDING TO
DISTRICT ......................................................................................................................................................... 49 FIGURE 21: MEAL FREQUENCY AMONG CHILDREN 9-23 ACCORDING TO DISTRICT ....................................................................... 49 FIGURE 22: MILK CONSUMPTION AND USE OF INFANT FORMULA AMONG CHILDREN 6-23 MONTHS ACCORDING TO DISTRICT ................. 50 FIGURE 23: PROPORTION OF CHILDREN 6-23 MONTHS WHO HAD MINIMUM MEAL FREQUENCY (MMF), MINIMUM DIETARY DIVERSITY
(MDD) AND MINIMUM ACCEPTABLE DIET (MAD) ..................................................................................................... 51 FIGURE 24: PROPORTION OF CHILDREN ENROLLED IN MCHN PROGRAM .................................................................................. 51 FIGURE 25: TWO-WEEK PREVALENCE OF COMMON CHILDHOOD ILLNESS ACCORDING TO DISTRICT ................................................... 54 FIGURE 26: PROPORTION OF CHILDREN WHO SLEPT UNDER A BED NET DURING THE NIGHT PRECEDING THE SURVEY ACCORDING TO DISTRICT
.................................................................................................................................................................... 54 FIGURE 27: LATRINE COVERAGE ACCORDING TO DISTRICT ..................................................................................................... 56 FIGURE 28: HOUSEHOLD SOCIOECONOMIC STATUS ACCORDING DISTRICT ................................................................................. 57 FIGURE 29: ASSOCIATION BETWEEN HOUSEHOLD SOCIOECONOMIC STATUS AND MALNUTRITION .................................................... 58 FIGURE 30: ASSOCIATION BETWEEN HOUSEHOLD SOCIOECONOMIC STATUS AND HOUSEHOLD FOOD SECURITY STATUS .......................... 58 FIGURE 31: ASSOCIATION OF HOUSEHOLD SOCIOECONOMIC STATUS WITH IYCF PRACTICES........................................................... 59 FIGURE 32: ASSOCIATION OF MALNUTRITION WITH EVH STATUS ........................................................................................... 60 FIGURE 33: ASSOCIATION BETWEEN HOUSEHOLD SOCIOECONOMIC STATUS AND EVH STATUS ....................................................... 60 FIGURE 34: ASSOCIATION OF IYCF PRACTICES WITH HOUSEHOLD FOOD SECURITY STATUS ............................................................. 61 FIGURE 35: ASSOCIATION OF GAM WITH BMI STATUS OF MOTHERS ...................................................................................... 61 FIGURE 36: ASSOCIATION BETWEEN MOTHERS’ EDUCATION AND INDICATORS OF MALNUTRITION .................................................... 62 FIGURE 37: ASSOCIATION OF MALNUTRITION WITH MATERNAL FERTILITY STATUS ....................................................................... 62 FIGURE 38: ASSOCIATION BETWEEN MALNUTRITION AND PREGNANT OR BREASTFEEDING STATUS ................................................... 63

5
LIST OF TABLES
TABLE 1: SUMMARY ON GENDER ANALYSIS FOR KEY FOOD SECURITY INDICATORS ...................................................................... 8 TABLE 2: DISTRICTS RELATIVE RANKING (FOR SELECTED FOOD SECURITY INDICATORS) AND PERFORMANCE AGAINST WHO THRESHOLDS
(FOR NUTRITION INDICATORS) . ........................................................................................................................... 15 TABLE 3: THREE MOST COMMONLY CULTIVATED CROPS ..................................................................................................... 24 TABLE 4: LEADING CONSTRAINTS TO AGRICULTURAL PRODUCTION ....................................................................................... 26 TABLE 5: MOST IMPORTANT INCOME SOURCES FOR HOUSEHOLDS........................................................................................ 28 TABLE 6: MAIN HOUSEHOLD EXPENDITURES ................................................................................................................... 29 TABLE 7: PREVALENCE AND LEVEL OF DEBT ..................................................................................................................... 30 TABLE 8: FACTORS INFLUENCING HOUSEHOLD FOOD CONSUMPTION ..................................................................................... 34 TABLE 9: MAIN DIFFICULTIES/SHOCKS FACED BY HOUSEHOLDS ............................................................................................ 34 TABLE 10: MOST COMMON STRESS, CRISIS AND EMERGENCY COPING STRATEGIES ................................................................... 37 TABLE 11: COMPARISON OF KEY FINDINGS BETWEEN EVH AND NON EVH GROUPS ................................................................. 39 TABLE 12: COMPARISON OF KEY FINDINGS BETWEEN MALE AND FEMALE HEADED HOUSEHOLDS .................................................. 41 TABLE 13: MOTHERS AGE AND PARITY .......................................................................................................................... 42 TABLE 14: SEX DISTRIBUTION OF SAMPLED CHILDREN ACCORDING TO DISTRICT ....................................................................... 43 TABLE 15: PREVALENCE OF GAM, SAM, STUNTING AND UNDERWEIGHT ACCORDING TO DISTRICT, DECEMBER 2014 ..................... 44 TABLE 16: A DIAGRAMMATIC VIEW OF MALNUTRITION EXPRESSED ACCORDING TO THE WHO CLASSIFICATION OF PREVALENCE OF
MALNUTRITION, BY DISTRICT ............................................................................................................................... 44 TABLE 17: MEAN Z-SCORES FOR WEIGHT-FOR-HEIGHT, WEIGHT-FOR-AGE AND HEIGHT-FOR-AGE ACCORDING TO DISTRICT ................ 46 TABLE 18: PREVALENCE OF ANEMIA IN CHILDREN 6-59 MONTHS ACCORDING TO DISTRICT ......................................................... 47 TABLE 19: PREVALENCE OF ANEMIA IN WOMEN 15 – 49 YEARS ACCORDING TO DISTRICT .......................................................... 47 TABLE 20: BMI OF NON-PREGNANT MOTHERS 15-49 YEARS OF AGE ACCORDING TO DISTRICT ................................................... 47 TABLE 21: MEASLES IMMUNIZATION COVERAGE AMONG CHILDREN 12-23 MONTHS ACCORDING TO DISTRICT ............................... 52 TABLE 22: DPT3 IMMUNIZATION COVERAGE AMONG CHILDREN 12-23 MONTHS ACCORDING TO DISTRICT ................................... 52 TABLE 23: DEWORMING COVERAGE IN CHILDREN 12-23 MONTHS ACCORDING TO DISTRICT ....................................................... 52 TABLE 24: VITAMIN A SUPPLEMENTATION COVERAGE AMONG CHILDREN 12-23 MONTHS ........................................................ 53 TABLE 25: HOUSEHOLD WATER SOURCES ACCORDING TO DISTRICT ...................................................................................... 55 TABLE 26: PER CAPITA WATER USE ACCORDING TO DISTRICT ............................................................................................... 55

6
Executive summary Key findings
Demography
Approximately one-third (32%) of households in Karamoja are female headed, of which the
highest percentage of 42% was found in Napak district. About 10% of household heads were
either disabled or chronically ill, the highest of which was in Kotido (15%). Also, considerably
more female household heads have never been to school compared to male household heads
(81% of female heads as compared to 68% of male heads of household). Female headed
households are therefore deemed to be highly vulnerable to food insecurity.
Food availability
Livestock production: Forty three per cent (43%) of households own no livestock, and,
furthermore, the level of livestock holding is low (<1 Total livestock unit/TLU) among the 57%
that own livestock. Poultry, goats, and cattle are the most commonly owned among 45%, 36%,
and 32% of households respectively. Livestock parasites/diseases are the major constraints
affecting livestock production.
Crop production: Approximately 80% of households have access to agricultural land. Maize,
sorghum and beans are the most commonly cultivated crops. However, when asked about their
perceptions on the quantity of food harvested this year compared to last year, two-thirds (67%)
of the households reported having harvested less food. The lean season is therefore projected to
start earlier as findings further suggest that stocks will be depleted from many households in
early February and from all households by end of March. Due consideration should be given in
the timing of food assistance. The single most important constraint to agriculture was noted as
drought/low rainfall.
Food access
Household assets: Approximately 96% of households owned at least one asset; the most
commonly owned assets are; an axe (50%), a panga (71%) and a hoe (86%). This analysis suggests
reliance on traditional, non-lucrative livelihoods. Furthermore, only 44% own a food store while
only 24% own a seed store. This points to limitations in agricultural production and adequate
post-harvest handling.
Household income: About three-quarters (75%) of households have at least one income earner.
This is a significant finding as it implies that for the majority of the households, food access is not

7
an obstacle. The high percentage of income earners is due to income derived from food crop
production/sales following the harvest season.
Household expenditure: Food, health, clothes and shelter were the main expenditures for
households. Food as a percentage of all household expenses accounts for 65%. This is an
improvement as compared to data collected in June 2014 when it accounted for 70%. This is
mainly due to the just concluded harvests which has resulted in an overall improvement in food
access and availability. However, it should be noted that majority of the households reported
education and health as their main nonfood expenditure items.
Household debt: About 40% of households reported being in debt and therefore with need to
repay the loans. The highest percentage of households with debt was found in Abim (58%) and
the lowest in Amudat (16%). The average amount of debt per household was UgX 71,000. Of the
households that had debt, 76% borrowed primarily to buy food or cover health expenses. Most
common sources of credit for households were informal e.g. through relatives and traders.
Food utilization
Food consumption: Food consumption scores are better as compared to June 2014 as a result of
the harvest; about 45% of the population had acceptable Food Consumption Score (FCS), 32%
borderline FCS, and 24% poor FCS. The highest percentage of food insecure households
(borderline and poor FCS) was found in Moroto district (67%). The most important food sources
were cited as own production and market purchases. Key factors affecting FCS at household level
include gender and education level of the household head, livestock ownership, and the presence
of an income earner in the household.
Stability
Shocks and Coping: Up to 80% of households suffered at least one shock in the 30 days preceding
the survey. However the majority of households had a low food consumption coping strategy
index (RCSI) with an average of 12.78. This is attributed to relatively higher food availability at
the time of the survey, following the harvest. On the other hand, application of livelihoods coping
strategies was common among households across the region. The most commonly used
livelihoods coping strategies by households were borrowing of money (41%) and consumption of
seed stock (26%). This is a manifestation of the chronic food insecurity that has characterized the
region over time.
Safety and Security
Whereas 89% of household members that went to WFP Final Distribution Points (FDP) did not
experience a safety problem, findings show that a higher percentage of households in Kaabong
(32%), and among EVH households (27%) experienced safety problems. This necessitates a
8
comprehensive review of security threats faced by these households and implementation of
measures to reduce safety and security incidents. This is especially required in Kaabong district.
Extremely Vulnerable households
On several measures, the Extremely Vulnerable Household (EVH) group was worse off compared
to non EVHs, for example with a higher prevalence of disability/chronic illness, poorer harvests,
and higher application of food consumption, stress and crisis coping strategies. However, EVHs
were better off with regard to certain criteria such as ownership of livestock and food
consumption scores (which in part could be a function of the assistance they receive).
Nevertheless, the data strongly suggests that some EVH households might be better off, and calls
for an urgent review of the classification criteria to ensure appropriate targeting of food
assistance.
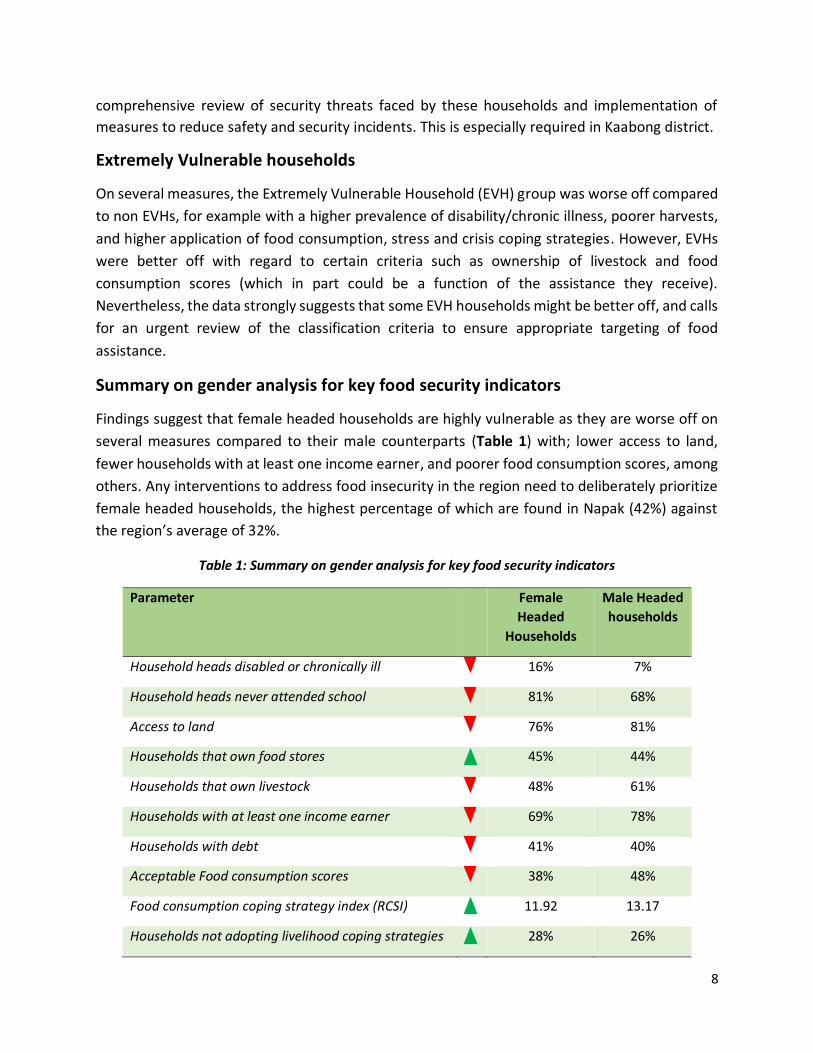
Summary on gender analysis for key food security indicators
Findings suggest that female headed households are highly vulnerable as they are worse off on
several measures compared to their male counterparts (Table 1) with; lower access to land,
fewer households with at least one income earner, and poorer food consumption scores, among
others. Any interventions to address food insecurity in the region need to deliberately prioritize
female headed households, the highest percentage of which are found in Napak (42%) against
the region’s average of 32%.
Table 1: Summary on gender analysis for key food security indicators
Parameter Female
Headed
Households
Male Headed
households
Household heads disabled or chronically ill 16% 7%
Household heads never attended school 81% 68%
Access to land 76% 81%
Households that own food stores 45% 44%
Households that own livestock 48% 61%
Households with at least one income earner 69% 78%
Households with debt 41% 40%
Acceptable Food consumption scores 38% 48%
Food consumption coping strategy index (RCSI) 11.92 13.17
Households not adopting livelihood coping strategies 28% 26%

9
Female headed households worse off; Female headed households better off
Nutrition status
Prevalence of malnutrition in Karamoja has not improved for many years and Global Acute
Malnutrition (GAM) was at serious level (12.8%) in the current assessment. Notably, Moroto and
Kaabong had prevalence of GAM at critical level, a cause for real concern in the two districts.
District GAM % (95%CI)
SAM % (95%CI)
Stunting % (95%CI)
Underweight % (95%CI)
Abim (N=559) 6.2 (4.5 - 8.6) 1.5 (0.7 - 2.9) 31.8 (28.0 - 35.8) 17.1 (14.2 - 20.4) Nakapirit (N=399) 11.6 (8.8 - 15.1) 5.5 (3.7 - 8.2) 43.0 (38.2 - 48.0) 30.3 (26.0 - 35.1) Napak (N=410) 11.8 (9.0 - 15.3) 2.5 (1.3 - 4.5) 36.1 (31.6 - 40.9) 27.4 (23.3 - 31.9) Kotido (N=460) 11.4 (8.8 - 14.6) 2.9 (1.7 - 4.8) 37.1 (32.8 - 41.6) 24.8 (21.1 - 29.0) Amudat (N=432) 12.2 (9.4 - 15.7) 3.8 (2.3 - 6.0) 27.8 (23.8 - 32.3) 21.8 (18.2 - 25.9) Moroto (N=448) 18.5 (15.1 - 22.3) 2.7 (1.6 - 4.7) 47.4 (42.7 - 52.1) 42.0 (37.5 - 46.7) Kaabong (N=526) 20.2 (16.9 - 23.9) 6.1 (4.3 - 8.5) 37.0 (32.9 - 41.2) 34.7 (30.8 - 38.9) Combined (N=3234) 12.8 (11.7 - 14.0) 3.2 (2.7 - 3.9) 36.9 (35.2 - 38.6) 28.0 (26.5 - 29.6)
Analysis of trend of GAM since May 2011 depicted a decline in only two districts. That is, Abim
and Nakapiripirit; a relatively constant prevalence in Kotido; and an upward trend in the rest of
the districts. Maternal underweight and education status were significantly associated with all
indicators of malnutrition while ownership of cows and latrines were significantly associated with
reduced stunting.
Anemia prevalence in both children 6-59 months and mothers 15-49 years has persistently
remained at critical/severe levels in Karamoja sub-region. Overall prevalence of anemia in
children was 58.9% and was above 55% in all districts except Kaabong 42.9% and Moroto 48.4%.
In districts like Amudat, Nakapiripirit and Napak, anemia levels in children were as high as 70%.
Among mothers, prevalence of anemia was above 40% in most districts except Kotido 30.1%,
Kaabong 36.1% and Moroto 37.5%. There is no change in the prevalence of anemia over several
studies done in the region over the past few years.
Likewise, the proportion of underweight mothers in Karamoja has constantly remained high.
Prevalence of underweight mothers in Karamoja was 24.7%, which was similar to findings in
many other previous assessments.
Further analysis of the explanatory factors for malnutrition in children indicated that household
socioeconomic status, food security, maternal nutrition, education and fertility status, household
ownership of cattle and latrines were some of the factors that influenced nutrition status.
Malnutrition prevalence in EVH households was also significantly lower than in non-EVH
households.

10
Infant and young child feeding practices
A high proportion of mothers initiated breastfeeding within the first hour of birth; Abim (76.4%),
Amudat (86.2%), Kaabong (83.6%), Kotido (67.6%), Moroto (75.2%), Nakapiripirit (83.7%) and
Napak 75.1%). Besides the high timely initiation of breastfeeding, exclusive breastfeeding rate
among children <6 months was above 80% in the majority of the districts except Amudat (69.1%)
and Nakapiripirit (72.7%). Exclusive breastfeeding rates among infants <6 months were therefore
above nation average of about 60%.
However, complementary feeding practices were poorly implemented. Over 45% of children 6-8
months in Kaabong, and over 20% in the rest of the districts except Moroto (5.4%) and Kotido
(6.8%) had no complementary foods provided to them the day before the assessment as
required. Mothers were therefore not introducing complementary foods in a timely manner.
Among children 6-23 months who had received complementary food, the meals provided were
inadequate, failing to meet the Minimum Meal Frequency (MMF) requirement in 63.5% of cases.
Minimum Dietary Diversity (MDD) was even worse. Only 3.1% of the children 6-23 months
received MDD. In summary only 2.2% of the children in Karamoja received the Minimum
Acceptable Diet (MAD) the day before the survey. That is, 4.9% for Kaabong, 3.6% for Abim, 2.3%
for Amudat, 1.0% for Kotido, 0.4% for Moroto and 0% for Napak.
Morbidity and primary health care services
Immunization coverage, deworming and vitamin A supplementation was above 90% considering
child health card and mothers’ recall in all the districts. The coverage and presence of child health
cards were particularly commendable in the districts of Kotido and Nakapiripirit where cards
were available in over 95% of the cases.
The most prevalent common childhood illness was malaria/fever (37.1%) followed by ARI
(29.0%). Prevalence was lower than in many previous assessments where malaria/fever often
exceeded 50%. Children in Kaabong and Nakapiripirit particularly had a relatively higher burden
of common childhood illnesses with diarrhea prevalence exceeding 30% in both districts.
Mosquito net use by children was high and above 90% in all districts except Amudat (78.8%). This
level of coverage is good and recommended practice.
The main water source in Karamoja, as in previous assessment, was boreholes (86.4%). For the
first time the proportion of piped water was observed especially in the districts of Kotido (11.1%)
and Kaabong (10.9%). However use of ponds/dams or unprotected sources to fetch domestic
11
water was still high in Amudat (30.7%) and Nakapiripirit (14.0%). Unfortunately, the total amount
of water available per household was below recommendation. Only Abim district met the WHO
recommendation of 15 liters per person per day while in the rest of the districts it was 12.7, 11.8,
10.5, 9.2, 9.0 and 8.5 liters for Moroto, Nakapiripirit, Kaabong, Amudat, Kotido and Napak,
respectively.
As has been previously observed, latrine coverage in Karamoja remains a persistent problem with
over 75% of the households in the district of Amudat, Nakapiripirit, Moroto, Kotido and Napak
having no latrines. Latrine coverage was highest in Abim (69.9%) and Kaabong (68.8%), but even
in these two districts it was only Abim, which had up to 74.9% of the latrines having a slab and
structure, while in Kaabong, 59.3% of the latrines had no superstructure.
Summary by district
A highlight of findings per district level is presented below and summarized in Table 2.
Abim
District had a higher than average percentage of households with poor FCS (28%) while 36%
had borderline FCS and 36% had acceptable FCS. This is despite the fact that a relatively high
percentage of households have access to land (84%), harvested similar or more quantities
compared to last year (37%), or have at least one income earner (86%).
The highest percentage of household heads that attended school was observed. The district
also had highest percentage - 11% - of households depending on salary/wages against a
Karamoja average of 4%.
However, the highest percentage of households that had incurred debt (58%), and of
households that had applied stress coping mechanisms (26%), especially borrowing money,
was found.
Inadequate Food access therefore seems to be the key factor affecting food security in Abim
with many households borrowing to buy food. It is therefore important to monitor food prices
and wage levels in this district.
Abim had the highest proportion of households with latrine coverage (69.9%) and was the
only district meeting the WHO per capita water use.
Abim has traditionally had the lowest proportion of children with GAM (6.2%) and SAM (1.5%)
in the sub-region.
Amudat

12
This district had the highest percentage of households with acceptable food consumption
score (81%), while 13% have borderline FCS and 6% poor FCS. This is probably linked to the
finding that the highest percentage of households owned some livestock (92%) and the
second highest percentage of households have at least one income earner (86%).
However, the average level of debt per household was high at UgX. 71,000 and all households
(100%) that incurred debt in the district obtained it from informal sources, suggesting the
absence of any formal financial systems.
The main food security issue in Amudat is sustainability of the food consumption patterns
observed given the threat of livestock parasites/diseases (mentioned by 88% of households),
high levels of informal debt and limited crop production.
Amudat had the lowest coverage of mosquito nets (78.8%), the highest proportion of children
with anemia (70.5%) and mothers with anemia (62.8%), and the highest proportion of
households using water from pond/dams (30.7%).
The highest proportion of children who consumed milk and dairy products, and highest
children that met the minimum meal frequency (57.0%).
GAM was at serious level (12.2%) with SAM at critical level (3.8%).
Amudat district had the lowest prevalence of stunting (27.8%) which could be due to the milk
consumption reported in children in the district.
Kaabong
Kaabong had lower than average percentage of households with acceptable FCS (39%),
despite the fact that the highest percentage of households had access to agricultural land
(95%) and, the second highest percentage of households harvested similar or higher
quantities of food this year (39%).
This might be attributable to the much higher percentage of female headed households (40%)
in this district and relatively low percentage of households with at least one income earner
(70%). Also, a high percentage of households incurred debt (55%).
Therefore, the main food security issue in Kaabong is inadequate access to food by
households. In addition, there might be a security issue in the district as more household
members faced security threats while going to the WFP FDP, and 15% reported theft as a
constraint to livestock production.
Although the district reported the lowest proportion of children and mothers with anemia,
42.9% and 36.1%, respectively, the GAM (20.2%) and SAM (6.1%) were the highest observed
in the sub-region.
Although the district had the highest proportion of exclusive breastfeeding among children
<6 months (94.7%), it also had 45.7% of the children 6-8 months receiving no complementary
food.

13
The district had the lowest proportion of children who fed on milk or dairy products (5.9%)
and had the highest disease burden with a diarrhea prevalence of 32.0%.
Kotido
Relatively high percentage of households had acceptable FCS (42%) while 27% had borderline
FCS and 31% had poor FCS. This is attributable to the harvest as the district had the highest
percentage of households that reported harvesting similar or more quantities than last year
(47%).
However, Kotido also had highest percentage of household heads that had never been to
school (87%); or that were disabled or chronically ill (15%). These factors are believed to have
a negative drag on potentially better food security outcomes.
Nevertheless, the key factor limiting food security seems to be access to food with only 56%
of households having an income earner.
Although the district had the highest proportion of piped water (11.1%), the total water per
capita use was one of the lowest in the sub-region (9.0 liters per person).
The district had the highest number of children with child health cards (99%), and the lowest
proportion of mothers who were underweight (13.8%).
Although the district had the lowest rates of anemia in mothers (30.1%), GAM rate in children
was serious (11.4%).
Moroto
While Moroto had the highest percentage of households with at least one income earner
(96%), about two-thirds (67%) of households are food insecure with 36% having borderline
FCS and 31% poor FCS. This is partly explained by the finding that there is limited access to
agricultural land and low livestock ownership among households (by 68% and 59% of
households respectively).
Furthermore, a relatively high percentage of households had incurred debt (55%), and the
use of food consumption coping strategies was highest (RCSI = 21.11) in this district. In
addition, the highest percentage of households (76%) borrowed to buy food, and food is the
main expenditure for 97% of households.
Findings therefore suggest that current income levels are insufficient to meet food and other
basic needs; inadequate access to food is therefore the key limiting factor for food security.
The highest proportion of mothers underweight (31.4%) was observed in the district. The
proportion of households without latrines (88.2%) and infant and young child complementary
feeding practices were the worst observed in the sub-region.
GAM (18.5%) was at critical levels.

14
Nakapiripirit
The highest percentage of households with poor FCS (31%) was observed while 23% had
borderline FCS and 46% acceptable FCS. Households therefore seem to be maintaining food
consumption through the use of detrimental coping strategies.
There may be a sickness/health issue in the district as 63% of households reported health as
the second most common expense
Findings indicate that the limitations to food security are twofold: i) inadequate access to
food with the lowest percentage of households having at least one income earner (58%) and;
ii) low food availability given that the second highest percentage of households (77%)
harvested less food this year, the highest percentage of households own no livestock (65%),
and the lowest proportion of households have access to agricultural land (67%).
The district had the highest proportion of mothers who were either pregnant or
breastfeeding (78.2%) and a high proportion of anemic children (69.8%).
The disease burden in children was high, second to Kaabong with a diarrhea prevalence of
30.8%. Latrine coverage was low with 85.1% of the households lacking latrines.
GAM (11.6%) was serious and SAM (5.5%) was at critical level.
Napak
Approximately 65% of households in Napak are food insecure with 24% having poor FCS while
41% had borderline FCS. This might be linked to the finding that the highest percentage of
households (79%) harvested less food this year than the previous and a relatively high
percentage (48%) of households had no livestock.
Furthermore, the highest percentage of female headed households (42%) was observed, a
high percentage of household heads never having been to school (81%) - both factors found
to be positively correlated with low food consumption – was observed.
Food availability seems to be the key limiting factor for food security in the district
Anemia in children (69.8%) and maternal underweight (31.6%) were among the highest in the
sub-region.
Infant and young child complementary feeding practices were the worst in the region. No
single child in the district had the minimum acceptable diet.
Per capita water use was the lowest in the region (8.5 liters per person per day)
GAM (11.8%) was at serious level

15
Table 2: Districts relative ranking (for selected food security indicators) and performance against WHO thresholds (for nutrition indicators) .
Variable Abim Amudat Kaabong Kotido Moroto Nakap
-iripirit Napak
% female headed households 27.6 17.1 39.5 33.1 31.6 31.7 41.9
% never attended school 28.7 85.3 69.8 86.7 79.0 79.8 80.7
% disabled or chronically ill 14.6 8.2 14.1 15.4 5.2 5.3 6.9
% that own no assets 2.2 3.8 1.8 2.9 4.6 14.4 1.4
% that own a seed store 7.2 6.0 34.6 54.4 20.3 17.8 28.6
% that own a food store 49.3 61.7 48.7 58.9 31.3 28.9 30.2
% that own no livestock 44.0 7.9 33.4 44.4 59.4 64.6 48.2
% with access to agricultural land 84.4 79.6 94.7 78.5 67.9 66.6 84.6
% that harvested less than last year 63.3 72.3 60.9 53.0 68.5 76.6 78.9
% with at least one income earner 86.2 86.3 69.9 55.8 95.9 58.4 73.1
% that incurred debt 57.8 16.1 55.3 25.4 55.1 29.0 38.7
% obtaining debt through informal sources 27.5 100 88.6 92.6 92.3 67.2 57.5
% acceptable food consumption score 36.1 80.7 39.2 41.6 33.3 46.2 35.2
Reduced coping strategy index (RCSI) 12.4 12.7 19.4 6.2 21.1 13.1 3.7
% not adopting coping strategies 25.5 29.4 8.1 38.9 22.1 26.8 34.8
% Stress coping 26.0 19.3 5.0 6.3 9.7 6.3 23.0
% Crisis coping 18.9 15.5 17.4 25.9 30.3 36.8 6.4
% Emergency coping 29.5 35.8 69.4 28.8 37.9 30.1 35.9
% GAM 6.2 12.2 20.2 11.4 18.5 11.6 11.8
% Stunting 31.8 27.8 37.0 37.1 47.4 43.0 36.1
% Underweight 17.1 21.8 34.7 24.8 42.0 30.3 27.4
Key:
Recommendations on food security related findings
1. Approximately 16% of female household heads are either disabled or chronically ill. These
households are extremely vulnerable and need to be urgently mapped and provided
appropriate support to ensure their food security.
2. While many households owned at least one of the enumerated assets, a high percentage
lacked seed stores (76%) and food stores (56%). These are key limiting factors for household

16
food availability. It is therefore recommended to scale up household storage initiatives and
improve post-harvest management in the region with the view to: i) ensure availability of
good quality planting materials and thus facilitate timeliness of planting; ii) reduce post-
harvest losses; iii) encourage longer periods of household food availability and; iv) reduce the
need to sell produce at low prices during harvest periods so that they can store and sell when
prices are slightly higher.
3. It is recommended that any such interventions be initiated first in Abim (seed stores) and
Nakapiripirit (food stores).
4. The most commonly mentioned constraint to livestock production was livestock
parasites/diseases. Given the importance of livestock to food security in the region, it is
recommended to first, institute a study aimed at further understanding the epidemiology of
livestock diseases in the region and providing appropriate courses of action and, second,
implement measures to reduce the incidence of livestock diseases as per the study findings.
Implementation of this recommendation should necessarily begin in Amudat district.
5. About two-thirds of the households harvested less food this year compared to last year.
Household stocks are expected to run up to March at the latest. Food security situation
should be monitored closely to prevent deterioration of food security/nutrition outcomes,
especially among women and children. Priority should be given to Nakapiripirit and Napak
districts where the highest percentage of households reported having harvested less food.
6. While about 40% of households had incurred debt, the majority received the facility through
informal sources. It is recommended to further understand the credit access conditions for
households from these informal sources to facilitate appropriate solutions in the event that
loan conditions perpetrate a debt trap among households. Furthermore, there is a need to
explore options for more formalized access to credit among stakeholders. This is especially
the case for Amudat, Kotido and Moroto districts where the highest percentage of
households accessed debt through informal sources.
7. There was high application of livelihoods coping strategies that are detrimental and
continually diminish households’ ability to with stand subsequent shocks. This was especially
so in Kaabong and Moroto districts. There needs to be a combined effort to promote
alternative livelihoods for the Karamoja population and also to ensure availability of social
services including education and health care that were among leading expenditures for
households.
8. The fact that 63% of households in Nakapiripirit report health to be their second most
common expense points towards sickness/health being an issue in the district. It is
recommended to further investigate this problem and to formulate appropriate responses.
9. While some households are currently categorized as Extremely Vulnerable Households
(EVHs), findings show that some of these might be better off than other parts of the
17
population. It is recommended to urgently review classification criteria to ensure appropriate
targeting of food assistance, and to phase out those that no longer meet this criteria.
10. In Kaabong district, and among EVH households, a higher percentage of household members
experienced safety problems while going to the FDP. A Security review is recommended in
order to identify solutions to the threats identified.
Recommendations on findings of nutrition and related key indicators
1) Livestock is a key livelihood in the region, restocking, disease control, pasture and water
management are critical for Nutrition. Households with cattle were less likely to have
malnourished children.
2) Education of the girl child should be emphasized since the higher the level of maternal
education the better was the nutrition status of children. Need for UNICEF and the DLGs to
rejuvenate the GO back to School, stay in School campaign for karamoja region. Where is
The Girl’s Education Movement (GEM)?
3) Reproductive health services to ensure good birth spacing for women should be strengthened
since malnutrition correlated positively with fertility. Need for UNICEF and WFP to work
closely with sister agencies such as UNFPA and DLGs on this issue. Cognizant of the challenges
family planning has faced in the region.
4) Need to Strengthen the VHT referral system for active case finding, referral and follow up of
children for both SAM and MAM. This is key to improve coverage and performance of the
treatment.
5) The status of GAM prevalence in Kaabong and Moroto should receive special attention.
Detailed investigation to better understand why these 2 districts have persistently had high
GAM over the years is key.
6) Given the high rates of anemia in the under five children and women of reproductive age,
there is need to explore the use and promotion of multiple micronutrient powder/sprinkles
for children in the short to medium term. Emphasis on Iron and Folate supplementation or
use of multiple micronutrient tablets for mothers also key while discussions continue on how
to promote dietary diversity in the region
7) Promotion of optimal maternal nutrition practices is key for the region. Relatedly is need to
reduce maternal/women’s workload as this compromises child caring practices as well
nutrition/health status of the women. Can water points be made gender sensitive? How
about promotion of energy saving technologies? Can public works programs that are largely
dominated by women be made nutrition sensitive?
8) The issue Of Male involvement in key for nutrition. How can stakeholders rally behind this for
the region?

18
9) The quality of complementary feeding remains a big challenge in the region largely due to
limited food varieties especially protein sources and vegetables. There is need to promote
consumption milk for children, address the barriers to access to milk and ensure milk is made
available during the lean season.
10) Promotion of proper sanitation and hygiene practices can’t be over emphasized. There is a
need to ensure that households construct and use latrines. There was a strong correlation
between latrine ownership and stunting. How do players in Nutrition and WASH work
together in the region to promote CLTS (community Led Total Sanitation)?
11) By comparison, Amudat district has over the years demonstrated better nutrition outcomes
than the other 6 districts in the region i.e. better IYCF practices, lower stunting rates and
GAM. What can the other districts learn from Amudat? Need for a more in-depth case study
to document some of the good practices in Amudat.
12) While Immunization, vitamin A, deworming, mosquito net use were found not be positively
related with nutrition, there is need to commend the district local governments and sustain
the good coverages of these interventions
Background Karamoja sub-region is known to suffer from recurrent food insecurity and high levels of
malnutrition influenced by several factors including unpredictable climatic conditions, insecurity,
crop and livestock pest, parasite and disease incidences, poor sanitation and feeding practices
and poor social and economic capital among others. This has resulted into the need for frequent
surveys and studies by government, UNWFP, UNICEF and other stakeholders in order to
understand the situation, and make appropriate and timely interventions.
Recent Food Security and Nutrition assessments in Karamoja indicate a rather stagnant
prevalence of malnutrition above alert level and high levels of food insecurity with households

19
employing the entire spectrum of coping strategies. Crop performance has continued to be poor
and therefore unable to provide sufficient food stocks for the households. The May 2014
assessment indicated insufficient household stocks similar to other previous assessment.
In addition, morbidity levels have also remained high across the region with more than half of
the children having suffered at least one illness in the two weeks prior to the assessment. Also,
non-optimal Infant and Young Child Feeding Practices as well as appalling water and sanitation
conditions continue to be recurrent problems in Karamoja.
These factors negatively impact the food security and nutrition situation in Karamoja. Despite
the various interventions in place to counter the deteriorating food security situation and
nutrition, Karamoja still remains vulnerable to food insecurity and malnutrition. With the
reported high levels of malnutrition, it is critical to assess the food security and nutrition status
and the possible causal factors on a regular basis.
In addition to understanding the general food security status of the entire population it was
deemed necessary to incorporate a special analysis for the Extremely Vulnerable Households
(EVH) in Karamoja sub-region. The food security and nutrition situation of the EVH households in
Karamoja is fragile owing to their lack of productivity. EVH households have low ability to cope
and lack resilience to recurrent shock and are generally worse off than the general population
and thus the need to monitor them closely.
The current assessment was therefore part of the routine monitoring strategy normally done
semi-annually to provide critical information on key performance indicators to enable effective
planning for the sub-region.
Methods The sampling methodology was a two-stage cluster survey that enabled independent as well as
combined reporting of results for the seven districts of Karamoja (Abim, Kotido, Kaabong,
Moroto, Napak, Amudat and Nakapiripirit). A highly representative sample of approximately
4,105 households were sampled.
Survey findings
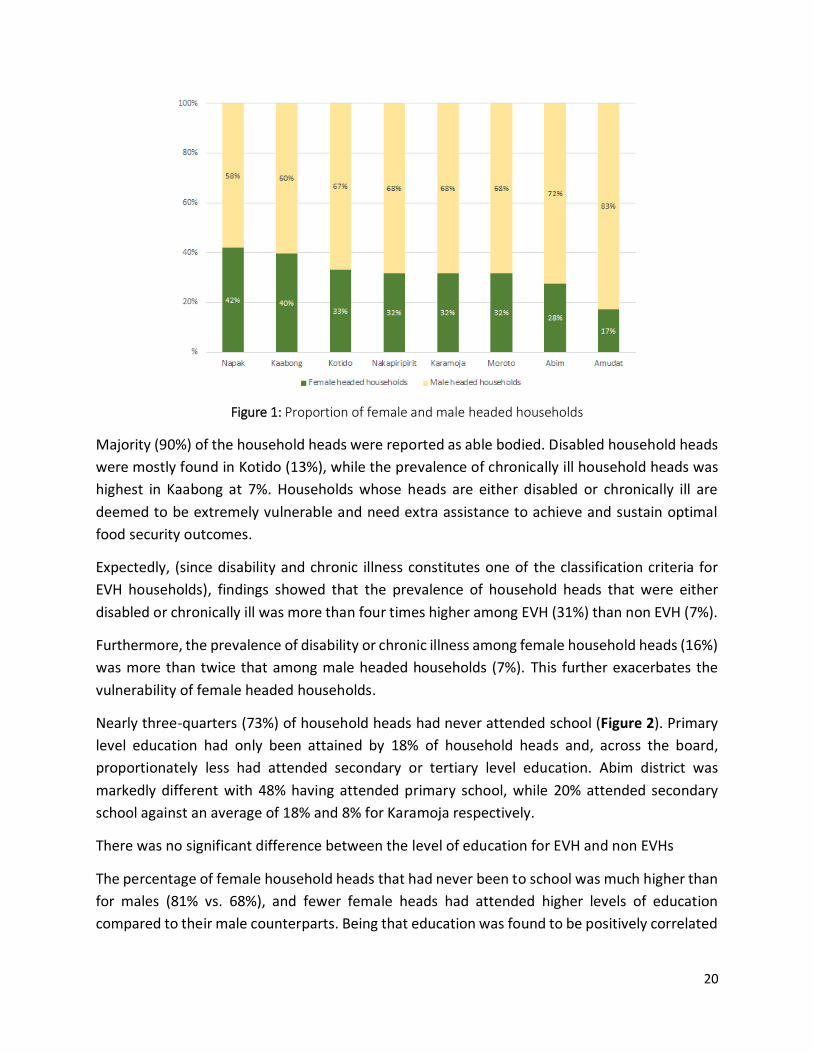
Demography Approximately one third (32%) of households in Karamoja are female headed (Figure 1), the
highest of which are in Napak (42%) and the lowest in Amudat at (17%). This is significant given
that female headed households are frequently more vulnerable to food insecurity.
20
Figure 1: Proportion of female and male headed households
Majority (90%) of the household heads were reported as able bodied. Disabled household heads
were mostly found in Kotido (13%), while the prevalence of chronically ill household heads was
highest in Kaabong at 7%. Households whose heads are either disabled or chronically ill are
deemed to be extremely vulnerable and need extra assistance to achieve and sustain optimal
food security outcomes.
Expectedly, (since disability and chronic illness constitutes one of the classification criteria for
EVH households), findings showed that the prevalence of household heads that were either
disabled or chronically ill was more than four times higher among EVH (31%) than non EVH (7%).
Furthermore, the prevalence of disability or chronic illness among female household heads (16%)
was more than twice that among male headed households (7%). This further exacerbates the
vulnerability of female headed households.
Nearly three-quarters (73%) of household heads had never attended school (Figure 2). Primary
level education had only been attained by 18% of household heads and, across the board,
proportionately less had attended secondary or tertiary level education. Abim district was
markedly different with 48% having attended primary school, while 20% attended secondary
school against an average of 18% and 8% for Karamoja respectively.
There was no significant difference between the level of education for EVH and non EVHs
The percentage of female household heads that had never been to school was much higher than
for males (81% vs. 68%), and fewer female heads had attended higher levels of education
compared to their male counterparts. Being that education was found to be positively correlated

21
with FCS (see Table 8), the findings suggest greater vulnerability of female headed households to
food insecurity.
Figure 2: Education level of household heads
Food availability
Access to land
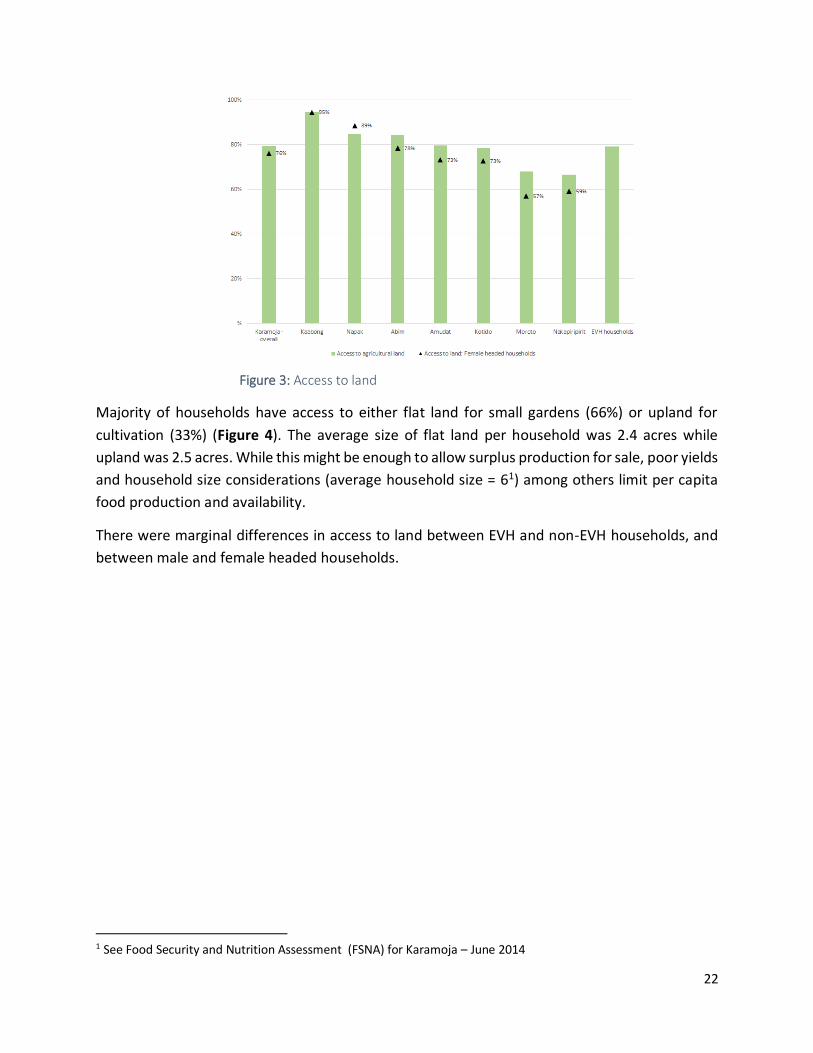
Approximately 80% of households reported access to agricultural land (Figure 3). The highest
percentages were in Kaabong (95%) while the lowest was in Nakapiripirit (67%). Land is a critical
factor of production directly affecting households’ ability to produce food for own consumption.
It is therefore anticipated household food availability in Nakapiripirit is relatively low due to
limited access to land.
22
Figure 3: Access to land
Majority of households have access to either flat land for small gardens (66%) or upland for
cultivation (33%) (Figure 4). The average size of flat land per household was 2.4 acres while
upland was 2.5 acres. While this might be enough to allow surplus production for sale, poor yields
and household size considerations (average household size = 61) among others limit per capita
food production and availability.
There were marginal differences in access to land between EVH and non-EVH households, and
between male and female headed households.
1 See Food Security and Nutrition Assessment (FSNA) for Karamoja – June 2014

23
Figure 4: Type of land accessed by households
Livestock production
About 43% of households own no livestock in Karamoja; the highest percentage without livestock
is in Nakapiripirit (65%) and the lowest in Amudat (8%). As shown in Figure 5, the most commonly
owned livestock were poultry (45%), goats (36%) and cattle (32%). However, it was observed that
livestock ownership2 is generally low across Karamoja with most households that owned livestock
having low holding (i.e. < 1 TLU) even in predominantly pastoral Amudat.
Slightly more EVH households owned some livestock (62%) compared to 56% for non-EVH,
suggesting that that some EVHs are better off and need to be phased out. Generally more male
headed households had livestock (61%) than female headed households (48.2%).
As seen in Table 8, households that owned livestock were found to have better food consumption
scores. This is probably because they have greater access to protein-rich foods which could in
turn lead to better maternal and child health/nutrition outcomes. It is therefore postulated that
43% of households, more so in Nakapiripirit, are vulnerable to food insecurity, and are
susceptible to economic shocks as they lack the cushion/ protective effect conferred by livestock.
Re-stocking and /or alternative livelihoods programs (e.g. cash for work, crop farming, etc.) that
are nutrition-sensitive are recommended for such households.
2 Livestock ownership was measured through a calculation of Total Livestock units (TLU) at household level. The TLU is a weighted sum of different livestock (cattle, sheep, goats etc.) available in a household. Households are then classified into groups depending on the sum.

24
Figure 5: Livestock ownership among households
The main constraint to livestock production across Karamoja was parasites/diseases (83%).
Almost all households owning livestock in Abim (91%), Amudat (88%) and Napak (90%) reported
this as the only constraint. However, in Kaabong and Kotido, about 15% households identified
theft as a constraint, while poor breeds were an issue for 38% of households.
This implies that any re-stocking programmes would require, as a pre-requisite, a livestock
epidemiology study and/or implementation of measures to reduce incidence of livestock
diseases and thus create an enabling environment for herders.
Crop production
Maize, sorghum and beans were the most commonly cultivated crops across Karamoja (by 44%,
26% and 72% of households respectively). As shown in Table 3, Abim had unique patterns with
households growing seemingly more diverse crops, including potatoes (45%), millet (43%) and
cassava (28%).
Table 3: Three most commonly cultivated crops
Main second Third
Karamoja - overall Sorghum (72%) Maize (44%) Beans (26%)
Abim Sorghum (69%) Potato (45%) Millet (43%)
Amudat Maize (95%) Beans (24%) Sorghum (3%)
Kaabong Sorghum (94%) Maize (65%) Beans (23%)
Kotido Sorghum (93%) Maize (14%) Beans (13%)
Moroto Sorghum (74%) Maize (44%) Beans (27%)
Nakapiripirit Sorghum (78%) Maize (25%) Beans (9.8%)
Napak Sorghum (92%) Beans (43%) Maize (36%)

25
EVH households Sorghum (75%) Maize (42%) Beans (32%)
Female headed households Sorghum (77%) Maize (41%) Beans (29%)
When asked about their perception on the quantities of food harvested, two-thirds (67%) of the
households across Karamoja indicated having harvested less compared to last year’s season,
while 17% harvested the same amount and only 15% harvested more (Figure 6).
Consequently, majority of households expected their stocks to last a short period - an average of
7 weeks. Considering that the survey was conducted mid-December, findings suggest that stocks
will be depleted from many households in early February and from all households by end of
March. Due consideration should thus be given in the timing of food assistance.
Given that the majority of households do not own either food or seed stores, it is recommended
to implement measures that promote household food and/or seed storage with the view to: i)
ensure availability of good quality planting materials and thus facilitate timeliness of planting; ii)
reduce post-harvest losses; iii) encourage longer periods of household food availability and; iv)
reduce the need to sell produce at low prices during harvest periods.
Figure 6: Comparison between this season and last year's harvest, and duration stocks expected to last in household
The single most important constraint to agriculture was noted as drought /low rainfall (69%), and
highest in Amudat (95%) and Moroto (87%) but lowest in Kotido (45%). Other constraints
identified, albeit to a limited extent, and especially in Kotido, were lack of adequate seeds /tools
(18%) and insufficient family/household labour (17%) (Table 4). This trend was the same
regardless of whether households were EVHs or not, and female headed or not.

26
Table 4: Leading constraints to agricultural production
First constraint Second constraint
Abim
Harsh weather
(drought/low
rainfall) - 45 -
95% of
households
Lack of adequate seeds/tools (9%)
Amudat Lack of adequate seeds/tools (2%)
Kaabong Lack of adequate seeds/tools (13%)
Kotido Lack of adequate seeds/tools (18%)
Moroto Physical inability (4%)
Nakapiripirit Infertile land/unproductive farming (11%)
Napak Insufficient family/household labour (7%)
EVH households Sickness or physical inability (14%)
Female Headed Households Insufficient family/household labour (8%)
Karamoja Lack of adequate seeds/tools (7%)
It is recommended to implement climate smart agricultural technologies3 that could support
increased yields for households.
Food access Household asset ownership
Household asset ownership is used here as proxy to poverty/wealth status of households; the
higher the number of assets owned, the more likely that households can afford food through
markets.
The survey enumerated ownership of household assets such as bed, cellphones, axe, hoe etc.
Findings were used to compute the Household Asset Score (HAS) as a composite sum of the
different assets owned.
Approximately 96% of households owned at least one asset4 across Karamoja; about 19% of
households owned 2-4 assets, while fairly equal proportions were found to own 3-4 assets and
more than 4 assets (38% and 39% respectively). Asset ownership was highest in Abim with 62%
3 The Food and Agriculture Organization defines Climate Smart Agriculture as agriculture that sustainably increases productivity, resilience (adaptation), reduces/removes GHGs (mitigation), and enhances achievement of national food security and development goals. 4 The survey enumerated a broader set of assets compared to the one used in by WFP’s “A Feasibility Study of Cash Transfer Programmes in Karamoja (Kaabong, Kotido, Moroto, Napak) – November 2014”. Therefore the two are not directly comparable.

27
of the population owning more than 4 assets. The most commonly owned assets were the axe
(50%), the panga (71%) and the hoe (86%) – the most basic assets on the list – suggesting reliance
on traditional, non-lucrative livelihoods. Furthermore, only 44% of households owned a food
store, while only 24% owned a seed store (Figure 7). This points to limitations in agricultural
production and adequate post-harvest handling.
More EVH households had no assets (9%) compared to non EVH (4%), but the difference at other
levels of asset ownership was negligible. Asset ownership patterns suggest the lower likelihood
of EVH households to engage in agricultural activities.
Figure 7: Ownership of food and seed stores
Household income
Three quarters (75%) of households in Karamoja have at least one income earner in the
household. The highest percentage is observed in Moroto (96%) and the lowest in Kotido (56%)
(Figure 8).
The proportion of households with at least one income earner was higher among male headed
households (78%) compared to female headed households (69%), further illustration of the
vulnerability of female headed households.
As shown in Table 8, having an income earner was found to be positively correlated with food
consumption scores. Thus for 75% of households, access to food is expectedly good.

28
Figure 8: Proportion of households with at least one income earner
The most important income sources in the region were food crop production/sales (31%) and
petty trade (25%) with limited variations in some districts as per Table 5. These sources
accounted for nearly 75% of total household income. The relatively high number of income
earners is expected because the survey was conducted during the harvest season.
Table 5: Most important income sources for households
Most important income sources
First Second Third
Karamoja Food crop production/sales Petty trade Non-agricultural wage labour
Abim Food crop production/sales Petty trade Agricultural wage labour
Amudat Sale of animals or animal
products
Petty trade Food crop production/sales
Kaabong Food crop production/sales Petty trade Small business/self-employed
Kotido Food crop production/sales Petty trade Borrowing
Moroto Petty trade Food crop
production/sales
Borrowing
Nakapiripirit Food crop production/sales Petty trade Non-agricultural wage labour
Napak Food crop production/sales Petty trade Non-agricultural wage labour
EVH households Food crop production/sales Petty trade Borrowing

29
Female headed
households
Food crop production/sales Petty trade Borrowing
Besides the fact that majority of households were found to have harvested less food this year,
field reports indicate that some households sold their food at very low prices at the peak of the
harvest season to raise money for other household necessities and presumably due to insufficient
household storage facilities. The implication is twofold;
I. Household stocks will run out very fast exposing these households to hunger during the leans
season
II. It will become increasingly difficult to buy food as household income is low, while food prices
are expected to increase.
Close monitoring of markets and the overall food security situation is recommended.
Household expenditure
As expected, the main expenditure for 91% of households was on food, highest in Moroto (97%)
and lowest in Abim (79%) (Table 6); the second main expense was health mentioned by 45% of
households, highest in Nakapiripirit (63%) and lowest in Abim (21%). Findings showed that the
main expenditure accounts for an average of 65% of total expenditure for households. However
in Napak, this was higher (81%) and lower in Nakapiripirit (51%). The fact that 63% of households
in Nakapiripirit report health to be their second most common expense points towards
sickness/health being an issue in the district with potential impact on other food
security/nutrition outcomes. It is therefore recommended to further study this issue and design
appropriate health interventions.
There were no significant differences in expenditure patterns between;
EVH and non EVH,
Female and male headed households.
The top three expenditures among households reflect prevalent deprivation of basic needs and
services that seem to crowd out expenditures that would otherwise be empowering such as on
education. Effective public service delivery remains a prerequisite for broader development in
Karamoja.
Table 6: Main household expenditures
Main household expenditures
1st 2nd 3rd 4th
Karamoja Food Health Clothes/shelter Utilities

30
Abim Clothes/shelter Utilities Farm input/investment
Amudat Health Clothes/shelter Transport
Kaabong Clothes/shelter Health Education
Kotido Health Clothes/shelter Utilities
Moroto Health Clothes/shelter Utilities
Nakapiripirit Health Clothes/shelter Utilities
Napak Health Clothes/shelter Transport
EVH households Health Clothes/shelter Utilities
Female headed households Health Clothes/shelter Utilities
Household debt
About 40% percent of households reported being in debt with need to repay their loans. The
highest percentage of households with debt was found in Abim (58%) and Kaabong (55%) while
the lowest was in Amudat (16%) (Table 7). The average amount of debt per household was UgX
71,000, but highest was observed in Abim (UgX. 153,000) and lowest in Moroto (UgX. 35,000).
Amount of debt owed was classified into four groups based on consideration of how long it would
take one to clear a debt with a week (7 days) of labour5 at the prevailing wage rate6 of UgX 3,600
per day (Table 7). It is seen that:
Half of the households (50%) that had incurred debt owed less than UgX 25,000 – thus
had low debt;
Approximately 22% owed between UgX. 25,000 and 50,000 and;
Another 22% owed more than UgX. 75,000.
Abim had the highest percentage of households with debt > UgX. 75,000 (46%) while Moroto had
the highest percentage of households with debt < UgX. 25,000 (73%).
Table 7: Prevalence and level of debt
Level of debt (% households)
5 With a week (7 days) of labour, a person could clear a debt of UgX. 25,000. Similarly, 2 weeks are equivalent to UgX 50,000; and 3 weeks of labour equivalent to UgX 75,000. 6 See WFP Uganda’s monthly market monitor available at http://www.wfp.org/content/uganda-monthly-market-monitor-2014

31
%
households
with debt
Amount
of current
debt*
< UgX
25,000
UgX
25,000 -
50,000
UgX
50,000 -
75,000
> UgX
75,000
Abim 58% 153,000 18% 28% 8% 46%
Kaabong 55% 56,000 54% 23% 5% 17%
Moroto 55% 35,000 73% 13% 3% 11%
EVH households 43% 106,000 39% 26% 5% 30%
Female headed households 41% 64,000 52% 23% 6% 19%
Karamoja - overall 40% 71,000 50% 22% 5% 22%
Napak 39% 45,000 60% 26% 4% 11%
Nakapiripirit 29% 45,000 47% 29% 5% 19%
Kotido 25% 55,000 58% 18% 4% 20%
Amudat 16% 71,000 46% 21% 12% 22%
*Figures rounded-off to the nearest ‘000.
The main reasons for debt, advanced by 75% of the households were to buy food and cover
health expenses. To a negligible extent (7%), households borrowed to pay school fees. Findings
showed that majority of households that borrowed money primarily to buy food borrowed small
amounts – 65% had borrowed less than UgX 25,000. Approximately half of households that
borrowed to cover health expenses also borrowed less than UgX 25,000.
More EVH had incurred debt (43%) than non EVH (40%). The average amount of debt for EVH
was much higher (UgX. 106,000) compared to non-EVH (UgX. 66,000).
Male headed households had slightly higher debt (74,000) compared to female headed
households (64,000). Also Female headed households borrowed more to buy food (63%) than
their male counterparts (54%).
The main sources of credit for households were mainly informal (i.e. from relatives, traders etc.)
especially in Amudat, but less so in Abim where banks were widely used (73%) (Figure 9).

32
Figure 9: Percentage of households that accessed debt through informal sources
Clearly, such informal sources of credit are not sustainable and may carry high interest rates that
effectively reduce net incomes for households. Broader, systemic interventions that stimulate
markets and formal banking systems should be explored.
Food utilization Food consumption
Information was collected on the dietary diversity of households with respondents being asked
to list the number of days a particular food item was consumed by the household in the seven
days prior to the interview. A ‘0’ for fruits would indicate that a household did not consume any
fruit in the previous seven days while a ‘4’ would indicate consumption four days out of seven
etc. The mean Food Consumption Score (FCS) for a seven day period for the sample was then
calculated and three Food Consumption Groups (Acceptable, Borderline, and Poor) were
formulated.
At least 45% of the population had acceptable FCS while 32% had borderline FCS, and 24% had
poor FCS (Figure 10). Hence, more than half (56%) of households in the sample had inadequate
food consumption. The highest percentage of households with inadequate food consumption
was observed in Moroto (67%) and the lowest in Amudat (19%) (See Annex 1 for detail).
There was no significant difference in FCS between EVH and non-EVH
Male headed households had better FCS than female headed households

33
Figure 10: Food Consumption among households
Note that while Amudat had the best Food Consumption Scores, it had a relatively high GAM rate (12%)
but the lowest stunting rate (28%). This suggests that while the diets in Amudat might be rich in protein,
they are likely deficient of carbohydrate/energy sources and that the quantities consumed per serving
might be lower than the recommended daily allowance (RDA).
The most important food sources across the board were market purchases and own production
for each of the commodity groups.
Summary of factors affecting food consumption
Analyses showed that food consumption patterns among households were influenced by the
following factors as summarized in Table 8:
Gender of the household head: Except in Abim, male headed households had better food
consumption scores compared to female headed households
Education level of the household head: Across Karamoja, food consumption scores increase
with the level of education (years of schooling).
Access to land: Households with access to land generally had better Food Consumption
Scores. This was true in all districts except Kaabong and Moroto.
Asset ownership: Food consumption score was found to increase with the number of assets
at household level – as measured by the Household Asset Score. This relationship was true in
all districts except Kotido.
Livestock ownership: Food consumption score increases with the level of livestock holding –
as measured by the Total Livestock Units (TLU). Expectedly therefore, Amudat had the highest
food consumption scores. This relationship was however not true for Kotido.
Debt: Higher debt, while improving FCS, masks underlying problems and such improvements
will be temporary.

34
Income earners in household: Having at least one income earner in a household significantly
improves food consumption scores. However, this relationship did not hold in Moroto and
Napak.
Table 8: Factors influencing household food consumption
Karamoja
– overall
Abim Amudat Kaabong Kotido Moroto Nakapiripirit Napak
Gender of the
household head √ -- √ √ √ √ √ √
Level of education √ √ √ √ √ √ √ √
Access to land √ √ √ -- √ -- √ √
Asset ownership √ √ √ √ -- √ √ √
Livestock
ownership √ √ √ √ -- √ √ √
Debt** √ √ √ √ √ -- √ √
Income earners in
household √ √ √ √ √ -- √ --
√ FCS improves with the presence of these factors; -- no relationship found. Increases in FCS due to debt are unsustainable and
therefore temporary since higher debt masks underlying problems.
Shocks & coping Approximately 88% of households had experienced at least one shock in the 30 days preceding
the survey. The most common difficulties/shocks mentioned by at least 65% of households were
high food prices (37%), crop loss due to rodents (11%), and adverse weather - floods/heavy
rains/drought/ landslides (15%) (Table 9). High food prices were particularly felt in Abim (48%)
and Amudat (59%); crop loss in Kaabong (27%) and Nakapiripirit (30%); and floods/drought in
Amudat (24%) and Napak (31%).
Table 9: Main difficulties/shocks faced by households
Main difficulties faced by households
1st 2nd
Karamoja High food prices Floods, heavy rains, drought,
landslides
Abim High food prices Debt to reimburse

35
Amudat High food prices Floods, heavy rains, drought,
landslides
Kaabong Crop loss due to rodents High food prices
Kotido High food prices Crop loss due to rodents
Moroto High food prices Floods, heavy rains, drought,
landslides
Nakapiripirit High food prices Crop loss due to rodents
Napak Floods, heavy rains, drought,
landslides
High food prices
EVH households High food prices Crop loss due to rodents
Female headed households High food prices Floods, heavy rains, drought,
landslides
The reduced coping strategy index (RCSI)7 was highest in Moroto (21.11) and Kaabong (19.38)
against an average of 12.78. The lowest RCSI was found in Napak and Kotido (3.74 and 6.18
respectively) (Figure 11). Majority of households were therefore characterized as having low RCSI
(74%) especially in Kotido (90%) and Napak (99.6%).
RCSI value was higher among EVH households (14.41) compared to non EVH households (12.57).
RCSI value was higher among male headed households (13.17) compared to female headed
households.
7 Reduced Coping Strategy Index (RCSI) measures the behaviours adopted by households when they have difficulties covering their food needs. It is calculated using standard food consumption-based strategies (reliance on less preferred, less expensive food; borrowing food or relying on help from friends/relatives; reduction in the number of meals eaten per day; reduction in portion size of meals; and reduction in the quantities of food consumed by adults/mothers for young children) and severity weighting.
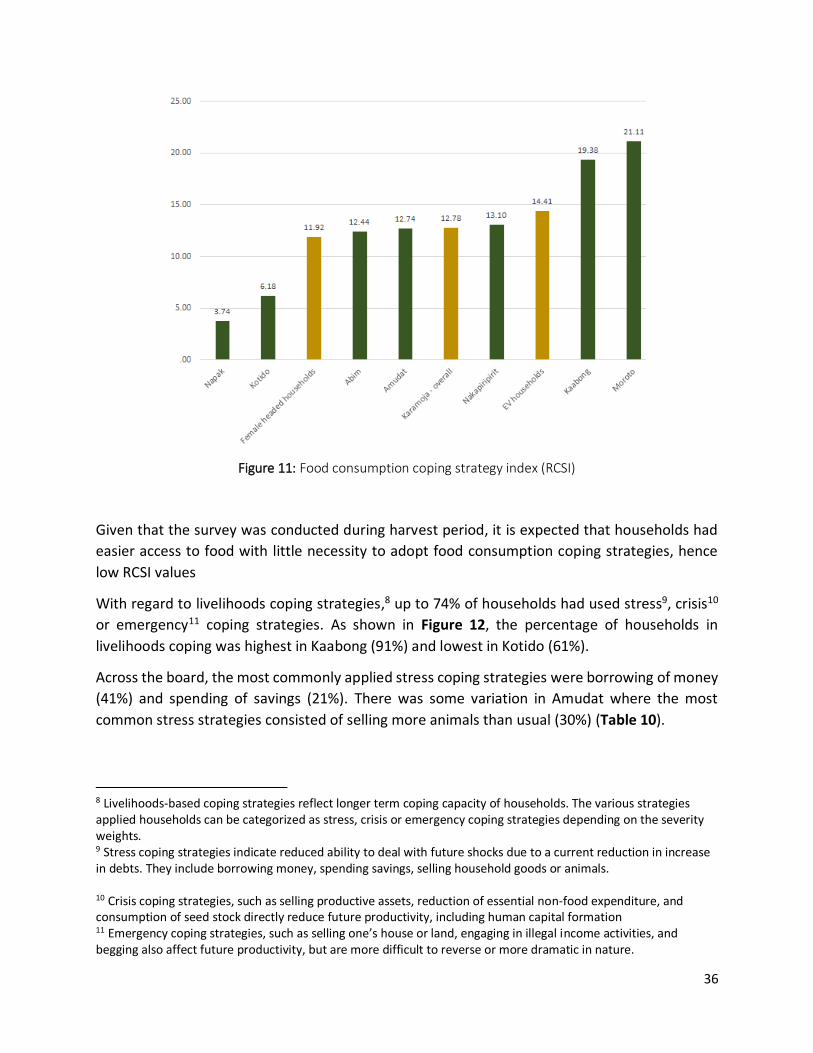
36
Figure 11: Food consumption coping strategy index (RCSI)
Given that the survey was conducted during harvest period, it is expected that households had
easier access to food with little necessity to adopt food consumption coping strategies, hence
low RCSI values
With regard to livelihoods coping strategies,8 up to 74% of households had used stress9, crisis10
or emergency11 coping strategies. As shown in Figure 12, the percentage of households in
livelihoods coping was highest in Kaabong (91%) and lowest in Kotido (61%).
Across the board, the most commonly applied stress coping strategies were borrowing of money
(41%) and spending of savings (21%). There was some variation in Amudat where the most
common stress strategies consisted of selling more animals than usual (30%) (Table 10).
8 Livelihoods-based coping strategies reflect longer term coping capacity of households. The various strategies applied households can be categorized as stress, crisis or emergency coping strategies depending on the severity weights. 9 Stress coping strategies indicate reduced ability to deal with future shocks due to a current reduction in increase in debts. They include borrowing money, spending savings, selling household goods or animals. 10 Crisis coping strategies, such as selling productive assets, reduction of essential non-food expenditure, and consumption of seed stock directly reduce future productivity, including human capital formation 11 Emergency coping strategies, such as selling one’s house or land, engaging in illegal income activities, and begging also affect future productivity, but are more difficult to reverse or more dramatic in nature.

37
Figure 12: Application of livelihood coping strategies
The pattern of application of stress coping strategies was the same between EVH and non EVH
households, as well as between male and female headed households
Among households that used crisis coping strategies, consumption of seed stock was the most
common form of application by 26% of households, highest in Kaabong (55%). However, the
common crisis strategy in Amudat was selling of productive assets (32%) while in Moroto was
reduction of essential non-food expenditure (20%).
Table 10: Most common stress, crisis and emergency coping strategies
Livelihoods coping strategies
Stress Crisis
Karamoja Borrowed money (41%) Consumed seed stock (26%)
Abim Borrowed money (50%) Consumed seed stock (24%)
Amudat Sold more animals than usual (30%) Sold productive assets (24%)
Kaabong Borrowed money (70%) Consumed seed stock (55%)
Kotido Borrowed money (30%) Consumed seed stock (24%)
Moroto Borrowed money (44%) Reduced essential non-food
expenditure (20%)
Nakapiripirit Borrowed money (32%) Consumed seed stock (22%)
Napak Borrowed money (42%) Consumed seed stock (29%)

38
EVH households Borrowed money (52%) Consumed seed stock (20%)
Female headed households Borrowed money (41%) Consumed seed stock (25%)
Whereas RCSI was low, the extent of application of livelihoods coping strategies is a manifestation of chronic food insecurity that has characterized the region. It suggests increasing asset depletion, high levels of vulnerability, and inability to withstand future shocks. Comprehensive solutions are required to systematically address food insecurity in the region.
WFP assistance
Overall, the sample of the survey comprised of only 22% of WFP beneficiaries – higher in
Nakapiripirit at 38%. In majority of cases, the decision on what to do with the food assistance
received is made by women alone (62%) even higher in Kotido (71%), Nakapiripirit (77%) and
Napak (80%). The trend was the same among EVH and non EVH households.
In 92% of households visited, it was reported that at least one member of the household had
gone to the FDP in the last two months. Of those that went to the FDP, 89% did not experience
safety problems, highest In Napak & Moroto (96%) but low in Kaabong (68%) (Figure 13). For 66%
of those that experienced safety problems, it was while going to the WFP programme site.
A less percentage of EVH households did not experience safety problems (73%) compared to non
EVH (92%)
Findings therefore suggest that a higher percentage of households in Kaabong (32%), and among
EVH households (27%) experienced safety problems. This necessitates a comprehensive review
of security threats faced by these households and implementation of measures to reduce safety
incidents.

39
Figure 13: Percentage of households whose members experienced safety problems while going to the FDP
Vulnerability to food insecurity Extremely Vulnerable Households (EVH)
A summary comparison of the EVH12 and non EVH groups is presented in Table 11. It is seen that
on several measures, EVH group was worse off for example with higher prevalence of
disability/chronic illness, poorer harvests, and higher application of food consumption, stress and
crisis coping strategies.
However, EVHs were better off with regard to certain criteria such as ownership of livestock and
food consumption scores (which in part could be a function of the assistance they receive).
Nevertheless, the data strongly suggests that some EVH households might be better off, and calls
for an urgent review of the classification criteria to ensure appropriate targeting of food
assistance.
Table 11: Comparison of key findings between EVH and Non EVH groups
Parameter EVH Non EVH
Household heads disabled or chronically ill 31% 7%
12 Up to 473 EVH households were visited in the survey, representing 11% of the total sample

40
Household heads never attended school 71% 73%
Households without assets 8% 4%
Access to land 79% 80%
Households that own seed stores 17% 25%
Households that own food stores 58% 42%
Households that own livestock 62% 56%
Households that harvested less this year compared to last year 71% 67%
Households with at least one income earner 77% 75%
Households with debt 43% 40%
Acceptable Food consumption scores 51% 44%
Food consumption coping strategy index (RCSI) 14.41 12.57
Households not adopting livelihood coping strategies 17% 28%
Households stress coping 17% 13%
Households crisis coping 31% 21%
Households emergency coping 35% 39%
EVH worse off; EVH better off
Female headed households
Findings suggest that female headed households13 are highly vulnerable as they are worse off on
several measures compared to their male counterparts. Female headed households were worse
off on key indicators such as access to land, the presence of income earners in the household,
food consumption scores, and others (Table 12).
It is however interesting to note that there was rather limited use of food consumption, stress
and emergency coping strategies despite not being well resourced in comparison to male headed
households. Further investigation on coping mechanisms among female headed households may
be useful; to further understand this behavior.
13 Up to 1324 female headed households were reached, comprising approximately 32% of the total sample

41
Table 12: Comparison of key findings between male and female headed households
Parameter Female
Headed
Households
Male Headed
households
Household heads disabled or chronically ill 16% 7%
Household heads never attended school 81% 68%
Households without assets 7% 3%
Access to land 76% 81%
Households that own seed stores 25% 24%
Households that own food stores 45% 44%
Households that own livestock 48% 61%
Households that harvested less this year compared to last year 69% 66%
Households with at least one income earner 69% 78%
Households with debt 41% 40%
Acceptable Food consumption scores 38% 48%
Food consumption coping strategy index (RCSI) 11.92 13.17
Households not adopting livelihood coping strategies 28% 26%
Households stress coping 12% 14%
Households crisis coping 25% 20%
Households emergency coping 35% 40%
Female headed households worse off; Female headed households better off

42
Nutrition
Education status of mothers/caregivers
As observed in previous surveys in Karamoja, the majority of the mothers 15-49 years still have
zero years of formal education (Figure 14). The edge in maternal education Abim district has had
over other districts is constant in surveys, and correlates with the relatively better nutrition status
of children in the district compared to other districts in the region. Any level of maternal formal
education is therefore important. Both girl and boy children should be kept in School.
Figure 14: Education status of women aged 15-49 years according to district (N=3998)
Reproductive health status of mothers
The mean age of mothers was 34.1 years and mean number of birth was 4.1 (Table 13). There
was no significant variation between districts.
Table 13: Mothers age and parity
District Mean age of mothers
Mean number of live birth
Abim 33.0 4.4 Amudat 34.8 4.1
Kaabong 32.5 4.0
Kotido 37.9 4.6
Moroto 28.9 3.4 Nakapiripirit 33.5 3.9
Napak 38.5 4.1
Total 34.1 4.1
The majority of the mothers 15-49 years were either pregnant or breastfeeding (Figure 15).
Fertility in Karamoja region is still high and partners should intensify reproductive health services.
90
%
86
%
85
%
85
%
83
%
80
%
45
%
78
%
8%
12
%
13
%
13
%
13%
13
%
45
%
17
%
3%
2%
2%
2% 4% 7%
10
% 4%
0%
10%
20%
30%
40%
50%
60%
70%
80%
90%
100%
Tertiary
Secondary
Prmary
Zero

43
Figure 15: Reproductive health status among women 15-45 years according to district (N=4002)
Age and sex distribution of sampled children
Up to 3234 children 6-59 months were sampled across districts of Karamoja (Table 14). Overall
the sex ratio of the sampled children was 1.0 although sampling in Nakapiripirit was skewed
toward boys depicting possible challenges of sampling in the district.
Table 14: Sex distribution of sampled children according to district
District Sex ratio of sampled children Distribution of sampled children
by age
Total
Boys Girls Boys:Girls 6-17 18-
29
30-
41
42-
53
54-
59
Abim 264 295 0.9 180 152 114 80 33 559 Amudat 216 216 1.0 150 122 83 57 20 432
Kaabong 276 250 1.1 194 156 96 60 20 526
Kotido 211 249 0.8 152 123 106 60 19 460
Moroto 214 234 0.9 175 138 86 38 11 448
Nakapiripirit 223 176 1.3 163 134 65 33 4 399
Napak 192 218 0.9 150 125 76 43 16 410
Total 1596 1638 1.0 1164 950 626 371 123 3234
Prevalence of wasting, stunting and underweight
The overall prevalence of GAM among children 6-59 months in Karamoja region was 12.8%, 95%
CI (11.7 – 14.0) (Table 15). This was similar to the May 2014 survey where prevalence of GAM
was 13.4%, 95% CI (12.1 – 14.7). Kaabong district however, had a marked increase of GAM from
12.5%14.9%
17.3%
12.5% 11.5%13.7%
11.6%13.4%
46.5%43.4%
60.3%
46.5%
56.2%
63.1%
46.5%
51.7%
0.8% 1.1% 0.2% 1.0% 2.0% 1.4% 1.2% 1.1%
40.2% 40.6%
22.2%
40.0%
30.3%
21.8%
40.7%
33.8%
0.0%
10.0%
20.0%
30.0%
40.0%
50.0%
60.0%
70.0%
Abim Amudat Kaabong Kotido Moroto Nakapirit Napak Combined
Pregnant Breasteeding Preg & b/feeding Neither preg nor b/feeding

44
13.5% in May 2014 to current 20.2% (although not statistically significant). This increase should
be investigated further.
Table 15: Prevalence of GAM, SAM, Stunting and Underweight according to district, December 2014
District GAM % (95% CI)
SAM % (95% CI)
Stunting % (95% CI)
Underweight % (95% CI)
Abim (N=559) 6.2 (4.5 - 8.6) 1.5 (0.7 - 2.9) 31.8 (28.0 - 35.8) 17.1 (14.2 - 20.4)
Nakapiripirit (N=399)
11.6 (8.8 - 15.1) 5.5 (3.7 - 8.2) 43.0 (38.2 - 48.0) 30.3 (26.0 - 35.1)
Napak (N=410) 11.8 (9.0 - 15.3) 2.5 (1.3 - 4.5) 36.1 (31.6 - 40.9) 27.4 (23.3 - 31.9)
Kotido (N=460) 11.4 (8.8 - 14.6) 2.9 (1.7 - 4.8) 37.1 (32.8 - 41.6) 24.8 (21.1 - 29.0)
Amudat (N=432) 12.2 (9.4 - 15.7) 3.8 (2.3 - 6.0) 27.8 (23.8 - 32.3) 21.8 (18.2 - 25.9)
Moroto (N=448) 18.5 (15.1 - 22.3) 2.7 (1.6 - 4.7) 47.4 (42.7 - 52.1) 42.0 (37.5 - 46.7)
Kaabong (N=526) 20.2 (16.9 - 23.9) 6.1 (4.3 - 8.5) 37.0 (32.9 - 41.2) 34.7 (30.8 - 38.9)
Combined (N=3234) 12.8 (11.7 - 14.0) 3.2 (2.7 - 3.9) 36.9 (35.2 - 38.6) 28.0 (26.5 - 29.6)
Based on WHO classification for trigger points based on prevalence of malnutrition, that is:
Wasting: acceptable (0-5%), poor (5%-10%), serious (10%-15%), critical (greater than 15%)
Stunting: acceptable (less than 20%), poor (20%-30%), serious (30%-40%), critical (greater
than 40%);
Underweight: acceptable (less than 10%), poor (10%-20%), serious (20%-30%), critical
(greater than 30%);
GAM was at critical level in Moroto and Kaabong, serious in the rest of the districts except Abim
where it was poor (Table 16).
Table 16: A diagrammatic view of malnutrition expressed according to the WHO classification of prevalence of malnutrition, by district
District GAM
Stunting
Underweight
Abim Poor Serious Poor
Nakapiripirit Serious Critical Critical
Napak Serious Serious Serious Kotido Serious Serious Serious
Amudat Serious Poor Serious
Moroto Critical Critical Critical
Kaabong Critical Serious Serious
Combined Serious Serious Serious
Trend of GAM and projections since May 2011
According to trends and projections of GAM, only Abim and Nakapiripirit districts have
experienced declining GAM and are thus projected to continue improving if the status quo is
sustained (Figures 16 and 17).

45
Figure 16: Trend and linear projections of GAM for Abim, Amudat and Kaabong districts
Figure 17: Trend and linear projections of GAM for Kotido, Moroto, Nakapiripirit and Napak districts
Prevalence of stunting according to sex in children 6-59 months
For all indicators of malnutrition, prevalence was higher in boys than in girls. This was exemplified
by stunting (Figure 18) where both stunting and severe stunting was higher in boys than in girls
except in Amudat where severe stunting was higher in girls. In Moroto one it two boys was
stunted.
May 11 Sept 11 Dec 11 May 12 Dec 12 May 13 Dec 13 Jun 14 Dec 14
Abim 8.6 6.9 6.3 9.5 8.8 6.3 5.5 8.4 6.2
Amudat 8.8 9.2 11.9 16.2 10.1 9.2 11.2 12.2
Kaabong 8.5 8.6 8.4 11.5 13.5 11.4 14.2 13.5 20.2
0
5
10
15
20
25
Abim
Amudat
Kaabong
Linear (Abim)
Linear (Amudat)
Linear (Kaabong)
May 11Sept11
Dec 11 May 12 Dec 12 May 13 Dec 13 Jun 14 Dec 14
Kotido 14.1 6.7 6.8 14.1 10.5 10.5 10.2 11.9 11.4
Moroto 13.3 12.5 10.9 10.8 11.7 20.2 16 22.2 18.5
Nakapirit 20.4 11.2 9.2 13.1 14.1 14.5 10.3 14.6 11.6
Napak 8.2 13.3 13.2 11.8
0
5
10
15
20
25
Per
cen
tage
Kotido
Moroto
Nakapirit
Napak
Linear (Kotido)
Linear (Moroto)
Linear (Nakapirit)
Linear (Napak)

46
Figure 18: Prevalence of stunting according to sex and district
Mean z-scores
The mean z-scores for weight-for-height (WFH), weight-for-age (WFA) and height-for-age (HFA)
were all shifted to the left. The population of children in districts of Karamoja was generally over
-1 SD below the median reference for underweight and stunting, which is pathetic (Table 17).
This highlight the magnitude of work needed to improve nutrition in the region.
Table 17: Mean z-scores for weight-for-height, weight-for-age and height-for-age according to district
Mean z-scores ± SD
WFH WFA HFA
Abim -0.17±1.23 -0.92±1.27 -1.34±1.70
Amudat -0.70±1.21 -1.16±1.24 -1.13±1.75
Kaabong -1.01±1.33 -1.44±1.39 -1.31±1.92 Kotido -0.55±1.25 -1.29±1.26 -1.56±1.66
Moroto -0.87±1.23 -1.64±1.47 -1.74±1.99 Nakapirit -0.58±1.15 -1.37±1.30 -1.76±1.54
Napak -0.70±1.12 -1.39±1.20 -1.58±1.47
Prevalence of anemia in children and mothers
Anemia in Karamoja is not reducing. Overall prevalence in the current survey was 58.9% (Table
18) similar to about 60% reported in December 2013. In some districts like Amudat, Nakapiripirit
and Napak, anemia levels in children 6-59 months were as high as 70%, suggesting a need for
blanket supplementation with micronutrient powder.
35.1
30.2
38.5
44.7
51.4
46.8
38.7
28.7
25.5
35.2
30.6
43.6
38.3
33.6
18.5
11.3
18.9
25
31.3
22.3
18.3
10
15.6
14.8
13.7
21.6
12.6
12
0 10 20 30 40 50 60
Abim
Amudat
Kaabong
Kotido
Moroto
Nakapirit
Napak
Severe stunting Girls Severe stunting Boys Stunting Girls Stunting Boys

47
Table 18: Prevalence of anemia in children 6-59 months according to district
District Severely Anemic
Moderately Anemic
Mildly Anemic
Total Anemic
Not Anemic
% % % % %
Abim (N=522) 2.3 31.4 25.1 58.8 41.2
Amudat (N=430) 3.5 37.7 29.3 70.5 29.5
Kaabong (N=524) 2.1 20.8 20.0 42.9 57.1
Kotido (N=458) 3.5 27.3 26.6 57.4 42.6
Moroto (N=442) 2.3 22.6 23.5 48.4 51.6
Nakapiripirit (N=384) 2.3 33.6 33.9 69.8 30.2
Napak (N=401) 3.0 41.9 24.9 69.8 30.2
Total (N=3161) 2.7 30.3 25.9 58.9 41.2
Likewise as in previous surveys more than 40% of the women 15 -49 years in all districts were
anemic (Table 19).
Table 19: Prevalence of anemia in women 15 – 49 years according to district
District Severely Anemic
Moderately Anemic
Mildly Anemic
Total Anemic
Not Anemic
% % % % %
Abim (N=470) 0.6 15.3 23.2 39.1 60.9
Amudat (N=407) 3.9 34.2 24.8 62.9 37.1
Kaabong (N=513) 0.8 14.2 21.1 36.1 63.9
Kotido (N=395) 1.8 13.9 14.4 30.1 69.9
Moroto (N=546) 0.5 14.3 22.7 37.5 62.5
Nakapiripirit (N=424) 2.4 18.9 23.8 45.1 55.0
Napak (N=391) 1.0 23.0 22.8 46.8 53.2
Total (N=3146) 1.5 18.7 21.9 42.1 57.9
Prevalence of underweight among women 15 – 49 years
Mothers’ nutrition status assessed by BMI was poor. The proportion of underweight mothers in
Karamoja has remained constantly high. Prevalence of underweight mothers was in Karamoja
has been about 25% for the past few years; it was 28% in May 2014; and was 24.7% in the current
survey (Table 20). This level of adult malnutrition is not observed elsewhere in Uganda even
among refugee populations.
Table 20: BMI of non-pregnant mothers 15-49 years of age according to district
District Severely underweight
%
Moderately underweight
%
Normal
%
Overweight
%
Obese
%

48
Abim (N=412) 2.7 15.8 75.0 4.9 1.7
Amudat (N=328) 3.4 24.4 65.9 4.3 2.1
Kaabong (N=401) 3.2 22.4 70.1 2.7 1.5
Kotido (N=342) 0.6 13.2 82.2 4.1 0.0
Moroto (N=471) 4.9 26.5 65.2 2.5 0.8
Nakapiripirit (N=362)
2.5 21.3 74.3 1.4 0.6
Napak (N=320) 4.7 26.9 67.5 0.9 0.0
Total (N=2636) 3.2 21.5 71.3 3.0 1.0
Infant and young child feeding practices Breastfeeding practices
A high proportion of mothers initiated breastfeeding within the first hour of birth, Abim (76.4%),
Amudat (86.2%), Kaabong (83.6%), Kotido (67.6%), Moroto (75.2%), Nakapiripirit (83.7%) and
Napak 75.1%). Exclusive breastfeeding rates among infants less than 6 months were high (Figure
19) above nation average of about 60%.
Figure 19: Exclusive breastfeeding rates among children 0-5 months according to districts
Timing of introduction of complementary feeding
Introduction of complementary feeding was not timely in 22.6% of the children 6-8 months
overall. Some districts like Kaabong (45.7%), Nakapiripirit (23.7%), Napak (22.0%) and Amudat
(20.5%) had high proportions of children 6-8 months exclusively breastfed when they should have
been given complementary food the day before the survey (Figure 20). The situation in Kaabong
warrants urgent investigation.
69.1%72.7%
82.2% 83.6% 85.2% 87.5%94.7%
73.1%
0.0%
10.0%
20.0%
30.0%
40.0%
50.0%
60.0%
70.0%
80.0%
90.0%
100.0%
Amudat(N=68)
Nakapirit(N=33)
Moroto(N=45)
Napak(N=55)
Kotido(N=61)
Abim(N=72)
Kaabong(N=94)
Total(N=428)

49
Figure 20: Proportion of children 6-8 months who did receive complementary the day before the survey, according to district
Minimum meal frequency of complementary food
Among children 6-23 months there were many who had receive zero meals or had only been
exclusively breastfed in the 24-hour preceding the assessment (Figure 21). On average up to
63.5% of the children received less than the minimum meal frequency (three meals), which was
worse than 58% reported in May 2014 and that of the UDHS 2011 (44%).
Figure 21: Meal frequency among children 9-23 according to district
Minimum dietary diversity
Minimum dietary diversity (MDD), i.e. diversity of food groups contained in the diet consumed
by children 6-23 months was low (not acceptable). MDD was assessed based on a modified WHO
seven food groups categorization namely: cereals, pulses and oils, meats, eggs, milk, vitamin A
rich fruits and vegetables, other fruits and vegetables, and for this survey fortified foods (WFP
Abim (N=44), 17.1%
Amudat (N=42), 20.5%
Kaabong (N=70), 45.7%
Kotido (N=47), 6.8%
Moroto (N=39), 5.4%
Nakapirit (N=39), 23.7%
Napak (43), 22.0%
Total (N=324), 22.6%
3.211
17.7
3.67.6 7.4 6.8 8.5
12.44.1
9.1
13.4
21.914.3 18.5 13.5
48.6
27.9
40.4
42.8
51.3
28.3
49.841.5
23.4
32
29.4 40.2
18.3
44.3
2229.8
12.524.9
3.4 0 0.8 5.6 2.9 6.6
0%
10%
20%
30%
40%
50%
60%
70%
80%
90%
100%
Four or more
Three
Two
One
Zero

50
fortified products).14 Minimum dietary diversity was defined as the proportion of children who
received at least four food groups the previous day15.
In the current assessment only 3.1% of the children were having acceptable MDD (refer to Figure
21 below). Children in Karamoja were below national average of 11% and were much worse off
than the refugee children in Uganda where 74.1% had acceptable MDD in the November 2014.
Nutrient diversity consumed by children at household level is key for sustainability of good
nutrition status of children.
However, it is unfortunate to note that even milk, supposed to be traditional food in Karamoja
was no longer widely available to children. In many districts including Abim, Napak, Moroto and
Kaabong less than 30% of children 6-23 months accessed milk (Figure 22). Of surprise however,
was the high use of infant formula observed in certain districts.
Figure 22: Milk consumption and use of infant formula among children 6-23 months according to district
Minimum acceptable diet
Minimum Acceptable Diet (MAD), the combination of children who had minimum/ acceptable
diet diversity and those who had minimum meal frequency were only 2.2% among children 6-23
months (Figure 23). This was lower than nation average of 5.7% (UDHS 2011) but better than
findings in May 2014 (0.7%). Some districts such as Moroto and Napak had almost no child
receiving the minimum acceptable diet. The situation of complementary feeding in Karamoja is
14 WHO Indicators for assessing infant and young child feeding practices part 2: measurements. 15 Low≤3 acceptable > 4
24.620.4 20.1
12.8 11.3 12.2
42.5
78.0
35.5
14.1 12.6 27.9
5.9
28.8
9.2
12.4
1.3
2.1 4.30.5
0
3.9
0.0
20.0
40.0
60.0
80.0
100.0
120.0
Yogurt
Milk
Infant formular

51
unacceptable and calls for institution of blanket supplementary feeding programs and nutrition
education for mothers.
Figure 23: Proportion of children 6-23 months who had minimum meal frequency (MMF), minimum dietary diversity (MDD) and minimum acceptable diet (MAD)
Enrollment in MCHN program
Overall 37.5% of the children 6-23 months were enrolled in the MCHN program (Figure 24). Like
in the May 2014 survey, the highest proportion of enrolled children was in Amudat and
Nakapiripirit districts.
Figure 24: Proportion of children enrolled in MCHN program
Of the enrolled children, a small proportion (6.7%) did not have cards and sighted reasons of not
having cards as: lost card, and did not received card.
57.0
50.0
40.235.8
32.8
24.919.2
36.5
4.6 3.0 1.06.9 5.3
0.0 0.43.1
2.3 2.6 1.0 3.6 4.9 0.4 2.20.0%
10.0%
20.0%
30.0%
40.0%
50.0%
60.0%
Amudat(N=174)
Nakapirit(N=230)
Kotido(N=195)
Abim(N=220)
Kaabong(N=264)
Napak(N=205)
Moroto(N=224)
Total(N=1512)
MMF MDD MAD
75.7 73.8
33 31.726.8
21.18.7
37.5
0
10
20
30
40
50
60
70
80
Nakapirit(N=230)
Amudat(N=172)
Kotido(N=194)
Napak(N=205)
Moroto(N=224)
Kaabong(N=265)
Abim(N=218)
Total(N=1508)

52
Morbidity and primary health care services
Immunization, vitamin A supplementation and deworming coverage
Immunization, supplementation and deworming were above 90% among children in the second
year of life when mothers’ reports were considered (Tables 21-24). The coverage and presence
of child health cards were particularly commendable in the districts of Kotido and Nakapiripirit.
Immunization, deworming and vitamin A supplementation in Karamoja has been above national
target in recent surveys. This achievement should be sustained.
Table 21: Measles immunization coverage among children 12-23 months according to district
DPT 3 and measles coverage were similar in almost all districts.
Table 22: DPT3 immunization coverage among children 12-23 months according to district
District Yes with card Yes without card No with card No without card
% % % %
Abim (N=161) 62.1 34.8 1.9 1.2
Amudat (N=103) 59.2 39.8 1.0 0.0
Kaabong (N=160) 75.6 20.0 4.4 0.0
Kotido (N=124) 99.2 0.8 0.0 0.0
Moroto (N=166) 64.5 33.1 1.2 1.2
Nakapiripirit (N=163) 96.3 3.7 0.0 0.0
Napak (151) 74.2 21.9 4.0 0.0
Total (N=1028) 76.0 21.8 1.8 0.4
Table 23: Deworming coverage in children 12-23 months according to district
District Yes with card Yes without card No with card No without card
District Yes with card Yes without card No with card No without card
% % % %
Abim (N=161) 60.9 34.2 1.9 3.1
Amudat (N=103) 54.4 36.9 6.8 1.9
Kaabong (N=160) 73.8 18.8 6.3 1.3
Kotido (N=124) 98.4 0.8 0.0 0.8
Moroto (N=166) 64.5 33.1 1.2 1.2
Nakapiripirit (N=163)
94.5 3.1 2.5 0.0
Napak (151) 71.5 21.2 7.3 0.0
Total (N=1028) 74.2 21.0 3.6 1.2

53
% % % %
Abim (N=152) 60.5 34.9 2.6 2.0
Amudat (N=103) 56.3 37.9 3.9 1.9
Kaabong (N=152) 75.0 21.1 3.3 0.7
Kotido (N=124) 99.2 0.8 0.0 0.0
Moroto (N=164) 65.2 33.5 0.6 0.6
Nakapiripirit (N=155) 96.1 3.9 0.0 0.0
Napak (150) 65.3 13.3 15.3 6.0
Total (N=1000) 74.1 20.6 3.7 1.6
Table 24: Vitamin A supplementation coverage among children 12-23 months
District Yes with card Yes without card No with card No without card
% % % %
Abim (N=161) 62.3 35.2 1.3 1.3
Amudat (N=103) 56.3 38.8 4.9 0.0
Kaabong (N=160) 76.1 20.8 2.5 0.6
Kotido (N=124) 99.2 0.8 0.0 0.0
Moroto (N=166) 64.8 33.9 0.6 0.6
Nakapiripirit (N=163) 96.9 3.1 0.0 0.0
Napak (151) 66.2 13.2 14.6 6.0
Total (N=1028) 74.8 20.6 3.3 1.3
Prevalence of common childhood illnesses and bed net use
The most prevalent common childhood illness was malaria/fever (37.1%) followed by ARI
(29.0%). Prevalence was lower than in many previous assessments where malaria/fever often
exceeds 50%. Children in Kaabong and Nakapiripirit had the highest burden of common
childhood illnesses (Figure 25). The burden of common childhood illnesses correlates well with
prevalence of GAM in districts such as Kaabong and Moroto.

54
Figure 25: Two-week prevalence of common childhood illness according to district
Mosquito net coverage
Mosquito net use by children was high and above national target in many districts except Amudat
(Figure 26). Overall 93.1% of the children slept under a bed net the night preceding the
assessment, which is good and recommended practice.
Figure 26: Proportion of children who slept under a bed net during the night preceding the survey according to district
42.947.7
40.1 42.338.2
26.922.7
37.1
3230.8
18.822.1
20.9
8.8 10.9
20.4
36.4 34.3
43.232.8
20.1
22.5 14.5
29
11.8 8.4
5.82.2
5.8
4.6
2.1
5.7
4.3 4.9
3.8
1
5.6
3.8
1.3
3.4
0
20
40
60
80
100
120
140P
ece
nta
ge
Other
Eye disease
Skin disease
ARI
Diarrhoea
Measles
Fever/malaria
78.8%
91.0% 92.7% 93.5% 95.9% 97.4% 100.0%93.1%
0.0%
20.0%
40.0%
60.0%
80.0%
100.0%
120.0%
Amudat(N=500)
Napak(N=465)
Moroto(N=493)
Nakapirit(N=432)
Abim(N=631)
Kaabong(N=620)
Kotido(N=521)
Total(N=3662)

55
Water and Sanitation
Water sources
The main water sources in Karamoja remain as boreholes (86.4%). However for the first time the
proportion of piped water has increased especially in the districts of Kotido and Kaabong (Table
25).
Table 25: Household water sources according to district
District Piped Protected well
Borehole Open well Pond/dam Rain water
Abim (N=617) 1.1% 1.9% 96.1% 0.8% 0.0% 0.0%
Amudat (N=553) 0.2% 0.0% 68.9% 0.2% 30.7% 0.0%
Kaabong (N=596) 10.9% 0.3% 82.4% 0.5% 5.4% 0.5%
Kotido (N=585) 11.1% 0.0% 88.9% 0.0% 0.0% 0.0%
Moroto (N=601) 0.0% 0.2% 90.3% 2.7% 6.8% 0.0%
Nakapiripirit (N=568) 2.7% 0.2% 83.0% 2.4% 11.6% 0.0%
Napak (N=568) 0.2% 0.0% 93.8% 1.6% 4.4% 0.0%
Total (N=4104) 3.8% 0.4% 86.4% 1.2% 8.2% 0.1%
However the total amount of water available per household was still below recommendation.
Only Abim district met the WHO recommendation of 15 liters per person per day while the rest
of the districts were far below standard (Table 26).
Table 26: Per capita water use according to district
District (N) Average household population size
Average household water (liters)
Per capita water (liters)
Abim (N=617) 5.9 89.0 15.0
Amudat (N=553) 5.9 53.8 9.2
Kaabong (N=596) 6.2 64.7 10.5
Kotido (N=585) 5.9 53.2 9.0
Moroto (N=601) 5.0 63.6 12.7
Nakapiripirit (N=584) 5.7 67.1 11.8
Napak (N=568) 5.8 48.7 8.5
Total (N=4104) 5.8 63.1 10.9
Latrine coverage
The challenge of latrine coverage in Karamoja is persistent with the majority of the household
living without any (Figure 27). In the two districts with high latrine coverage, its only Abim, which

56
had up to 74.9% of the latrines having a slab and structure, but Kaabong has 59.3% of the latrines
with no superstructure. Despite the challenges, the two districts of Abim and Kaabong could be
used as case studies to try and improve the situation in the rest of the districts.
Figure 27: Latrine coverage according to district
89.3
%
88.2
%
85.1
%
77
.9%
74.8
%
31.2
%
30.1
%
67.6
%
7.6
%
9.7%
14.7
%
16.9
%
23.9
%
60.2
%
62.9
%
28.5
%
3.1%
2.2%
0.2%
5.1%
1.2%
8.6%
7.0%
3.9%
0%
10%
20%
30%
40%
50%
60%
70%
80%
90%
100%
Shared latrine
Latrine not shared
No Latrine

57
Analysis of factors associated with malnutrition
Association of malnutrition with household socioeconomic status
A household socioeconomic index that was developed through principal components analysis
using fifteen variables namely household ownership of bed, table, chairs, mattress, radio,
cellphone, bicycle, motor cycle, car, television, cattle, sheep, goat, pig, poultry and donkey; and
was categorized into quintiles with categories ranging from poorest to richest.
Abim (50%) and Amudat (19.8%) had the highest households in the wealthiest socioeconomic
quintile while Nakapiripirit (42.3%), Moroto (35.1%) and Napak (26.8%) had the highest
proportion of households in the poorest wealth quintile (Figure 28). This might explain the
relatively better nutrition indicators observed in Abim and Amudat districts especially with
stunting which co-varies with socioeconomic status.
Figure 28: Household socioeconomic status according district
Household socioeconomic status had a clear dose-effect relationship with all indicators of
malnutrition and the relationship were statistically significant (Figure 29). Households in the
poorest socioeconomic quintile were disproportionately more affected with malnutrition
compared to those in the wealthiest quintile.
10.1%
2.5%
16.0%
24.7%
35.1%
42.3%
26.8%
5.2%
19.5%
18.9%
23.1%
27.1%
17.9%
21.5%
7.6%
30.7%
22.9%
25.5%
16.1%
11.3%
16.9%
26.9%
27.5%
23.1%
13.7%
10.5%
13.2%
25.2%
50.2%
19.8%
19.1%
13.0%
11.1%
15.3%
9.5%
0% 20% 40% 60% 80% 100%
Abim
Amudat
Kaabong
Kotido
Moroto
Nakapirit
Napak
Poorest Poor Middle Rich Richest

58
Figure 29: Association between household socioeconomic status and malnutrition
Likewise, food insecurity was more prevalent in the socioeconomically poorer households (Figure
30), compared to wealthy households. Nearly 80% of the households in the richest
socioeconomic quintile were having acceptable food consumption scores as compared to 30% in
the poorest quintile.
Figure 30: Association between household socioeconomic status and household food security status
Household socioeconomic status also had a statistically significant relationship between quality
of infant and young child feeding (IYCF) practices. The socioeconomically poorer the household
was the less likely it was to have children with minimum dietary diversity (MDD), minimum meal
9.7%11.4%
14.9%17.7% 16.8%
18.1%
23.8%
30.5% 29.9%
33.9%
27.6%
34.1%36.2% 37.0%
43.0%
0.0%
5.0%
10.0%
15.0%
20.0%
25.0%
30.0%
35.0%
40.0%
45.0%
50.0%
Richest Rich Middle Poor Poorest
Wasting
Underweight
Stunting
29.5%
16.8%10.2%
6.3% 4.4%
40.3%
34.7%
26.4% 27.5%
16.7%
30.2% 48.5% 63.5% 66.3% 78.9%
0%
10%
20%
30%
40%
50%
60%
70%
80%
90%
100%
Poorest Poor Middle Rich Richest
Acceptable
Borderline
Poor

59
frequency (MMF) and minimum acceptable diet (MAD), (Figure 31). However, even among the
richest households only 4.3% of their children 6-23 months could afford having the minimum
acceptable diet.
Figure 31: Association of household socioeconomic status with IYCF practices
Association of malnutrition with household EVH status
There were significant associations between stunting and underweight, and whether the
household was EVH or not. EVH households were having significantly lower prevalence of stunted
and underweight children compared to non-EVH households (Figure 32). It was not possible to
establish why EVH households were performing better than non-EVH households. However, it is
possible that children in EVH households are being effectively accessed with services and have
therefore significantly improved. Another possibility would be to establish if the criteria for
selection of EVH households was being adequately adhered to. It is well known that public
interventions are oftentimes accessed first by populations not in dire need of the particular
service. Although analysis of findings of this survey based on household socioeconomic status
seemed to suggest the latter challenge when using regional data (Figure 33), stratified analysis
by districts depicted that EVH households were actually socioeconomically poorer than non-EVH
households in the majority of the districts except Abim (data not presented). These findings
therefore are more biased by Abim district, which could review effectiveness of adherence to
EHV selection criteria.
5.3%
3.0%
3.2%
1.2%
0.3%
40.7%
33.3%
32.1%
29.6%
18.5%
4.3%
1.5%
2.1%
1.2%
0.0%
0.0% 10.0% 20.0% 30.0% 40.0% 50.0% 60.0%
Richest
Rich
Middle
Poor
Poorest
MDD MMF MAD

60
Figure 32: Association of malnutrition with EVH status
Figure 33: Association between household socioeconomic status and EVH status
Association of IYCF indicators with household food security status There was a statistically significant relationship between quality of IYCF practices and household
food security status. Food insecure and borderline households were less likely to have children
with minimum dietary diversity (MDD), minimum meal frequency (MMF) and minimum
acceptable diet (MAD), (Figure 34).
35.5%
26.6%28.0%
20.1%
0.0%
5.0%
10.0%
15.0%
20.0%
25.0%
30.0%
35.0%
40.0%
Stunting Underweight
Non-EVH
EVH
22.3%
19.0% 18.7%20.6%
19.3%
24.4%
18.4% 17.1% 15.0%
25.2%
0.0%
5.0%
10.0%
15.0%
20.0%
25.0%
30.0%
Poorest Poor Middle Rich Richest
Non-EVH
EVH

61
Figure 34: Association of IYCF practices with household food security status
Association of malnutrition with IYCF indicators
Infant and young child feeding practices – were all not significantly associated with malnutrition
but GAM rate among those who did not meet the minimum meal frequency (16.7%) was higher
than those who had had the minimum meal frequency (13.7%), (p-value =0.077).
Association of malnutrition with mothers’ nutrition status
BMI status of mothers – were significantly associated with GAM (Figure 35), stunting and
underweight. Mothers’ who were wasted were more likely to have wasted children.
Figure 35: Association of GAM with BMI status of mothers
2.0%
25.5%
72.5%
8.6%
22.2%
69.2%
2.8%16.7%
80.6%
0.0%
10.0%
20.0%
30.0%
40.0%
50.0%
60.0%
70.0%
80.0%
90.0%
Poor Borderline Acceptable
MDD
MMF
MAD
31.3%
22.1%
12.1%9.7%
4.8%0.0%
5.0%
10.0%
15.0%
20.0%
25.0%
30.0%
35.0%
Severelywasted
Moderatelywasted
Normal Overweight Obese

62
Association of malnutrition with mothers’ education status
Mothers’ education – exhibited a significant dose-effect relationship with all indicators of
malnutrition (Figure 36). Education of the girl child has previously been emphasized and more
effort is needed to implement the girl child education strategy.
Figure 36: Association between mothers’ education and indicators of malnutrition
Association of malnutrition with mothers’ reproductive status There was a statistically significant trend of malnutrition with the number of live birth a mother
had had (Figure 37).
Figure 37: Association of malnutrition with maternal fertility status
36.6%
33.2%
25.9%
8.3%
28.7%
22.3%
19.6%
0.0%
14.8%
11.2%10.1%
0.0%0.0%
5.0%
10.0%
15.0%
20.0%
25.0%
30.0%
35.0%
40.0%
Zero Prmary Secondary Tertiary
Stunting
Underweight
GAM
12.2%
23.3%
32.9%
13.9%
27.0%
35.8%
15.4%
30.4%
37.5%
0.0%
5.0%
10.0%
15.0%
20.0%
25.0%
30.0%
35.0%
40.0%
Wasting Underweight Stunting
1-2 children
3-4 children
5 or more children

63
Mothers with one or two children were less likely to have malnourished children than those with
two or three children, who were also less likely to have malnourished children than those who
had had five or more children. Reproductive health programs geared toward promoting family
planning should be supported.
Likewise, mothers who were neither pregnant nor breastfeeding were more likely to have wasted
children than those who were pregnant or breastfeeding (Figure 38). However children of
mothers who were not pregnant and not breastfeeding were more likely to have been stunted,
although not statistically significant, compared to children of pregnant or breastfeeding mothers.
That could have been due to the fact that mothers who were not pregnant and not breastfeeding
could have had older children who were more likely to have been stunted since stunting
prevalence increases with age.
Figure 38: Association between malnutrition and pregnant or breastfeeding status
Association of malnutrition with household latrine ownership
Ownership of latrine was significantly associated with stunting but not GAM. Household without
latrines (37.5%) were more likely to have stunted children compared to those with latrines
(31.0%), (p-value <0.001).
Other factors that were or were not associated with malnutrition
Ownership of cattle – was significantly associated with less stunting (p-value=0.009), but was
neither associated with GAM nor underweight.
14.6%
27.5%
34.8%
11.3%
24.8%
37.6%
0.0%
5.0%
10.0%
15.0%
20.0%
25.0%
30.0%
35.0%
40.0%
Wasting Underweight Stunting
Breastfeeding or pregnant
Not breastfeeding and notpregnant

64
Measles, DPT 3 immunization, deworming and vitamin supplementation were all not
significantly associated with indicators of malnutrition.
Bed net use was not associated with any indicator of malnutrition.
Food crop production had mixed findings. Households that reported to have produced
sorghum or maize had a significantly higher prevalence of malnutrition. However, having or
not having any arable land did not provide any advantage as far as the prevalence of
malnutrition was concerned.
Conclusions
Food availability
Livestock production: Forty three per cent (43%) of households owned no livestock. The level of
livestock holding was low (<1 TLU) among the 57% that owned livestock. Poultry, goats, and cattle
were the most commonly owned among 45%, 36%, and 32% of households respectively.
Livestock parasites/diseases are the major constraints affecting livestock production.
Crop production: Approximately 80% of households had access to agricultural land. Maize,
sorghum and beans were the most commonly cultivated crops. Two-thirds (67%) of the
households reported having harvested less food compared to the previous season. The lean
season is therefore projected to start early as findings suggest that stocks will be depleted from
many households in early February 2015 and from all households by end of March 2015.
Food access
Household assets: Approximately 96% of households owned at least one asset; the most
commonly owned assets were the axe (50%), the panga (71%) and the hoe (86%). This suggests
reliance on traditional, non-lucrative livelihoods. Furthermore, only 44% owned a food store
while 24% owned a seed store. This points to limitations in agricultural production and adequate
post-harvest handling.
Household income: About three-quarters (75%) of households had at least one income earner.
This was a significant finding as it implied that for the majority of the households, food access
could not have been an obstacle. However, the high percentage of income earners was due to
income derived from food crop production/sales owing to the harvest season.
Household expenditure: Food, health and clothes/shelter were the main expenditures for
households. Food as a percentage of all household expenses accounted for 65%. This was an
improvement as compared to data collected in June 2014 when it accounted for 70%.
Household debt: About 40% of households reported being in debt and therefore with need to
repay the loans. The highest percentage of households with debt was found in Abim (58%) and

65
the lowest in Amudat (16%). The average amount of debt per household was UgX 71,000. Of the
households that had debt, 76% borrowed primarily to buy food or cover health expenses. Most
common sources of credit for households were informal e.g. through relatives and traders.
Food utilization
Food consumption: Food consumption scores were better as compared to June 2014. About 45%
of the population had acceptable Food Consumption Score (FCS), 32% borderline FCS, and 24%
poor FCS. The highest percentage of food insecure households (borderline and poor FCS) was
found in Moroto district (67%). The most important food sources were cited as own production
and market purchases.
Stability
Shocks and Coping: Up to 80% of households suffered at least one shock in the 30 days preceding
the survey. However, majority of households had a low food consumption coping strategy index
(RCSI) with an average of 12.8. This was attributed to relatively higher food availability at the
time of the survey, following the harvest. On the other hand, application of livelihoods coping
strategies was common among households across the region. The most commonly used
livelihoods coping strategies by households were borrowing of money (41%) and consumption of
seed stock (26%). This was a manifestation of the chronic food insecurity that has characterized
the region over time.
Safety and Security: Whereas 89% of household members that went to WFP Final Distribution
Points (FDP) did not experience a safety problem, findings show that a higher percentage of
households in Kaabong (32%), and among EVH households (27%) experienced safety problems.
Nutrition status Prevalence of malnutrition in Karamoja has not improved for many years and was at serious level
(12.8%) in the current assessment. Maternal underweight and education status were significantly
associated with all indicators of malnutrition while ownership of cows and latrine were
significantly associated with stunting status.
Overall prevalence of anemia in children was 58.9% and was above 55% in all districts except
Kaabong 42.9% and Moroto 48.4%. In districts like Amudat, Nakapiripirit and Napak, anemia
levels in children were as high as 70%. Among mothers, prevalence of anemia was above 40% in
most districts except Kotido 30.1%, Kaabong 36.1% and Moroto 37.5%. Underweight among
mothers in Karamoja was also high (24.7%).
Infant and young child feeding practices
A high proportion of mothers initiated breastfeeding within the first hour of birth, Abim (76.4%),
Amudat (86.2%), Kaabong (83.6%), Kotido (67.6%), Moroto (75.2%), Nakapiripirit (83.7%) and
Napak 75.1%). Besides the high timely initiation of breastfeeding, exclusive breastfeeding rate

66
among children 0-5 months was above 80% in the majority of the districts except Amudat (69.1%)
and Nakapiripirit (72.7%). Exclusive breastfeeding rates among infants less than 6 months were
therefore above nation average of about 60%.
Over 45% of children 6-8 months in Kaabong, and over 20% in the rest of the districts except
Moroto (5.4%) and Kotido (6.8%) had no complementary foods provided to them the day before
the assessment, when they should have got it, suggesting bad timing for introduction of
complementary foods.
Among children 6-23 months who had received complementary food, meals provided to them
were inadequate, failing to meet the minimum frequency requirement in 63.5% of cases.
Additionally, only 3.1% of the children 6-23 months received minimum dietary diversity. In
summary only 2.2% of the children in Karamoja did receive the minimum acceptable diet the day
before the survey. That is, 4.9% for Kaabong, 3.6% for Abim, 2.3% for Amudat, 1.0% for Kotido,
0.4% for Moroto and 0% for Napak.
Morbidity and primary health care services
Immunization coverage, deworming and vitamin A supplementation was above 90% when child
health card and mothers’ recall were considered in all the districts. The coverage and presence
of child health cards were particularly commendable in the districts of Kotido and Nakapiripirit
where cards were available in over 95% of the cases.
The most prevalent common childhood illness was malaria/fever (37.1%) followed by ARI
(29.0%). Prevalence was lower than in many previous assessments where malaria/fever often
exceeded 50%. Children in Kaabong and Nakapiripirit particularly had a relatively higher burden
of common childhood illnesses with diarrhea prevalence exceeding 30% in both districts.
Mosquito net use by children was high and above 90% in all districts except Amudat (78.8%); the
main water source was boreholes (86.4%); however only Abim district met the WHO
recommendation of 15 liters per person per day while the rest of the districts it was 12.7, 11.8,
10.5, 9.2, 9.0 and 8.5 for Moroto, Nakapiripirit, Kaabong, Amudat, Kotido and Napak,
respectively; latrine coverage was low with over 75% of the households in the district of Amudat,
Nakapiripirit, Moroto, Kotido and Napak having no latrines.
Factors associated with malnutrition
Further analysis of the explanatory factors for malnutrition indicated that household
socioeconomic status, food security, maternal nutrition, education and fertility status, household
ownership of cattle and latrines were some of the factors that influenced nutrition status.
Malnutrition prevalence in EVH households was also significantly lower than in non-EVH
households.

67
Recommendations
Food security
Approximately 16% of female household heads are either disabled or chronically ill. These
households are extremely vulnerable and need to be urgently mapped and provided
appropriate support to ensure their food security.
While many households owned at least one of the enumerated assets, a high percentage
lacked seed stores (76%) and food stores (56%). These are key limiting factors for household
food availability. It is therefore recommended to scale up household storage initiatives such
as WFP’s pilot special operation on post-harvest management in the region with the view to:
i) ensure availability of good quality planting materials and thus facilitate timeliness of
planting; ii) reduce post-harvest losses; iii) encourage longer periods of household food
availability and; iv) reduce the need to sell produce at low prices during harvest periods. It is
recommended that any such interventions be initiated first in Abim (seed stores) and
Nakapiripirit (food stores).
The most commonly mentioned constraint to livestock production was livestock
parasites/diseases. Given the importance of livestock to food security in the region, it is
recommended to first, institute a study aimed at further understanding the epidemiology of
livestock diseases in the region and providing appropriate courses of action and, second,
implement measures to reduce the incidence of livestock diseases as per the study findings.
Implementation of this recommendation should necessarily begin in Amudat district.
About two-thirds of the households harvested less food this year compared to last year.
Household stocks are expected to run up to March at the latest. Food security situation
should be monitored closely to prevent deterioration of food security/nutrition outcomes,
especially among women and children. Priority should be given to Nakapiripirit and Napak
districts where the highest percentage of households reported having harvested less food.
While about 40% of households had incurred debt, majority got the facility through informal
sources. It is recommended to further understand the credit access conditions for households
from these informal sources to facilitate appropriate solutions in the event that loan
conditions perpetrate a debt trap among households. Furthermore, there is need to explore
options for more formalized access to credit among stakeholders. This is especially the case
for Amudat, Kotido and Moroto districts where the highest percentage of households
accessed debt through informal sources.
There was high application of livelihoods coping strategies that are detrimental and
continually diminish households’ ability to with stand subsequent shocks. This was especially
so in Kaabong and Moroto districts. There needs to be a combined effort to promote
alternative livelihoods for the Karamoja population and also to ensure availability of social

68
services including education and health care that were among leading expenditures for
households.
The fact that 63% of households in Nakapiripirit report health to be their second most
common expense points towards sickness/health being an issue in the district. It is
recommended to further investigate this problem and to formulate appropriate responses.
While some households are currently categorized as Extremely Vulnerable Households
(EVHs), findings show that some of these might be better off. It is recommended to urgently
review the classification criteria to ensure appropriate targeting of food assistance, and to
phase out those that no longer meet the criteria.
In Kaabong district, and among EVH households, a higher percentage of household members
experienced safety problems while going to the FDP. A Security review is recommended in
order to identify solutions to the threats identified.
Income generating strategies to improve household socioeconomic status are key if
improvements in child malnutrition are to be seen in the region.
Nutrition Livestock is a key livelihood in the region, restocking, disease control, pasture and water
management are critical for Nutrition. Households with cattle were less likely to have
malnourished children.
Education of the girl child should be emphasized since the higher the level of maternal
education the better was the nutrition status of children. Need for UNICEF and the DLGs to
rejuvenate the GO back to School, stay in School campaign for karamoja region. Where is
The Girl’s Education Movement (GEM)?
Reproductive health services to ensure good birth spacing for women should be strengthened
since malnutrition correlated positively with fertility. Need for UNICEF and WFP to work
closely with sister agencies such as UNFPA and DLGs on this issue. Cognizant of the challenges
family planning has faced in the region.
Need to Strengthen the VHT referral system for active case finding, referral and follow up of
children for both SAM and MAM. This is key to improve coverage and performance of the
treatment.
The status of GAM prevalence in Kaabong and Moroto should receive special attention.
Detailed investigation to better understand why these 2 districts have persistently had high
GAM over the years is key.
Given the high rates of anemia in the under five children and women of reproductive age,
there is need to explore the use and promotion of multiple micronutrient powder/sprinkles
for children in the short to medium term. Emphasis on Iron and Folate supplementation or
use of multiple micronutrient tablets for mothers also key while discussions continue on how
to promote dietary diversity in the region

69
Promotion of optimal maternal nutrition practices is key for the region. Relatedly is need to
reduce maternal/women’s workload as this compromises child caring practices as well
nutrition/health status of the women. Can water points be made gender sensitive? How
about promotion of energy saving technologies? Can public works programs that are largely
dominated by women be made nutrition sensitive?
The issue Of Male involvement in key for nutrition. How can stakeholders rally behind this for
the region?
The quality of complementary feeding remains a big challenge in the region largely due to
limited food varieties especially protein sources and vegetables. There is need to promote
consumption milk for children, address the barriers to access to milk and ensure milk is made
available during the lean season.
Promotion of proper sanitation and hygiene practices can’t be over emphasized. There is a
need to ensure that households construct and use latrines. There was a strong correlation
between latrine ownership and stunting. How do players in Nutrition and WASH work
together in the region to promote CLTS (community Led Total Sanitation)?
By comparison, Amudat district has over the years demonstrated better nutrition outcomes
than the other 6 districts in the region i.e. better IYCF practices, lower stunting rates and
GAM. What can the other districts learn from Amudat? Need for a more in-depth case study
to document some of the good practices in Amudat.
While Immunization, vitamin A, deworming, mosquito net use were found not be positively
related with nutrition, there is need to commend the district local governments and sustain
the good coverages of these interventions

70
Annex
Annex 1: FCS by sub-county

71
Annex 2: Questionnaire
Food Security and Nutrition Assessment in Karamoja, December 2014
0.1 Date |__|__|/|__|__|/2014
0.2 Interviewer Name: ________________________ Signature: ______________
0.3 Supervisor Name:_______________________________ Signature:___________________
0.4 District: ………………….1-Abim 2–Amudat 3–Kaabong 4–Kotido 5–Moroto 6–Nakapiripirit 7–Napak
0.5 Sub-county…………………… 0.6 Parish……………………….. 0.7 Village………………………..…
0.8 Cluster ID |__|__| 0.9 HH No: |__|__|
0.10. Is this household on the Extremely Vulnerable Households’ (EVH) Programme? (Circle one)
1= Yes 0=No (If No, skip to 0.11)
0.10b. If Yes, do you have a card for the EVH Programme 1= Yes 0=No
0.11 Is any member of the household currently receiving assistance from the NUSAF programme?
(Circle one) 1 = Yes 0=No
SECTION 1 – HOUSEHOLD AND MOTHER/CAREGIVER INFORMATION
A1. What is the sex of the household head? Male = 1 Female = 2
A2. What is the age of the household head? |__|__| Years
A3. Is the head of household disabled, chronically ill or able bodied?
1 = Disabled 2 = Chronically ill 3 = Able bodied
A4. Household head number of completed years of formal education |__|__|
A5. Does your household have toilet facilities?
1= Yes 2= Yes but shared with other households 0= No (If NO go to A16)
A6. What kind of toilet facilities do you use or, rather, have within the household and use?
1= Flush toilet 2= Pit Latrine with slab/VIP 3= Open pit (no super structure) 4= bucket latrine
World Food Programme
Household ID: |__|__|__|__|__|
(Check and complete during data entry)
(First digit for District; second and third digit
for Cluster ID; fourth and fifth digit for
household #)

72
A7. How many households share this toilet?
1= Not shared 2= Two HH 3= 3 HH or more 4 = Public Toilet
A8. Where do you usually get the water which people drink?
1=Piped water 2= Protected Well or Spring 3= Bore hole 4= Open Spring or well
5= Surface water (pond, stream, river, lake, dam, swamp) 6= Rain water
A9. Before drinking this water do you do anything to make it safer to drink?
1= Yes 2= No (If No go to A19)
A10. What do you commonly do to make your water safer to drink?
1= Boil 2= Add bleach or chlorine 3= Straining through a cloth
4= Use water filter (ceramic/sand/composite, etc) 5= Let it stand and settle
6= Other (Specify) __________________________
No OBSERVATION / QUESTION ANSWER
A11.
CALCULATE THE TOTAL
AMOUNT OF WATER USED BY THE HOUSEHOLD PER DAY
THIS RELATES TO ALL
SOURCES OF WATER (DRINKING WATER AND NON-
DRINKING WATER SOURCES)
Please show me the
containers you used
yesterday for
collecting water
ASSIGN A NUMBER
TO EACH CONTAINER
Capacity
in litres
Number
of
journeys
made
with each
container
Total litres
SUPERVISOR
TO COMPLETE
HAND
CALCULATION
1 E.g. jerry can 20 L
2 E.g. jerry can 10 L
3 E.g. jerry can 5 L
4 E.g. bucket 20 L
5 E.g. bucket 10 L
6
7
Total litres used by household
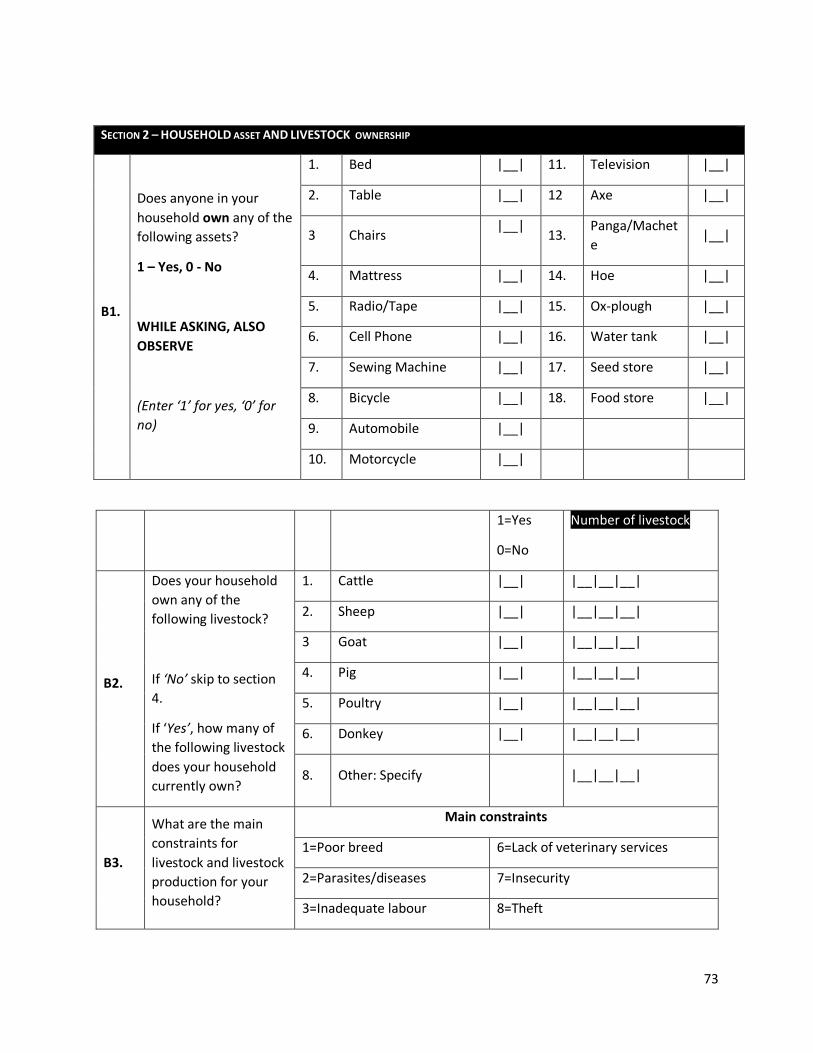
73
SECTION 2 – HOUSEHOLD ASSET AND LIVESTOCK OWNERSHIP
B1.
Does anyone in your
household own any of the
following assets?
1 – Yes, 0 - No
WHILE ASKING, ALSO
OBSERVE
(Enter ‘1’ for yes, ‘0’ for
no)
1. Bed |__| 11. Television |__|
2. Table |__| 12 Axe |__|
3 Chairs |__|
13. Panga/Machet
e |__|
4. Mattress |__| 14. Hoe |__|
5. Radio/Tape |__| 15. Ox-plough |__|
6. Cell Phone |__| 16. Water tank |__|
7. Sewing Machine |__| 17. Seed store |__|
8. Bicycle |__| 18. Food store |__|
9. Automobile |__|
10. Motorcycle |__|
1=Yes
0=No
Number of livestock
B2.
Does your household
own any of the
following livestock?
If ‘No’ skip to section
4.
If ‘Yes’, how many of
the following livestock
does your household
currently own?
1. Cattle |__| |__|__|__|
2. Sheep |__| |__|__|__|
3 Goat |__| |__|__|__|
4. Pig |__| |__|__|__|
5. Poultry |__| |__|__|__|
6. Donkey |__| |__|__|__|
8. Other: Specify |__|__|__|
B3.
What are the main
constraints for
livestock and livestock
production for your
household?
Main constraints
1=Poor breed 6=Lack of veterinary services
2=Parasites/diseases 7=Insecurity
3=Inadequate labour 8=Theft

74
Circle all that apply
4=Shortage of pasture/feed 9=Lack of market for livestock
5=Shortage of water 10=Other (specify):
SECTION 3 – FOOD AVAILABILITY
C1. Do you have access to agricultural land (arable land for cultivation)?
1=Yes
0= No (Go to section
4)
C2. What type and how big is the
land do you have access to?
1= Flatland for small garden acres
2= Up land for cultivation acres
3= Swamp acres
4= Other (specify): acres
C3. What type of crops did you
cultivate last season and how
much land each occupy?
Maize acres
Bean acres
Cassava acres
Millet acres
Sorghum acres
Potato acres
Banana acres
Rice acres
Other (specify)
C4. If household cultivated food in last season, fill in the table below. For harvested crops, ask the
quantity of output; Leave a blank space if crop was not planted
Crop Harvested Number of Units (threshed)
Name of Unit Kilogram per one Unit 1. Maize |__|__|__|__|__| |__|__|__| 2. Millet |__|__|__|__|__| |__|__|__| 3. Sorghum |__|__|__|__|__| |__|__|__| 4. Potato |__|__|__|__|__| |__|__|__| 5. Rice |__|__|__|__|__| |__|__|__| 6. Beans |__|__|__|__|__| |__|__|__| 7. Cassava |__|__|__|__|__| |__|__|__|
C5. How much crop is in your current stock? |__|__||__| kg

75
SECTION 4 – MAIN INCOME SOURCE
D1. - How many members of the household earn an income? |____|
Please complete the table, one
activity at a time (use income source
codes, up to 3 activities)
During the past 30 days, what
were your household’s most
important livelihood sources?
(use income source codes, up
to 3 activities)
Using proportional piling or ‘divide
the pie’ methods, please estimate
the relative contribution to total
income of each source (%)
D2. Most important |__|__| |__|__|__|
D3. Second (leave blank if none) |__|__| |__|__|
D4. Third (leave blank if none) |__|__| |__|__|
Income source codes:
1 = Food crop production/sales
2 = Cash crop production/sale (e.g. coffee)
3 = Sale of animals or animal products
4 = Livestock production (Animal Husbandry)
7 = Small business/self-employed
8 = Petty trade (firewood sales, etc.)
9 = Pension, allowances
10 = Salary/wages
11 = Fishing
14 = Borrowing
15 = Food assistance
16 = Skilled Trade
17 = Sale of food assistance
19=Government allowance
C6. How long will your food stock last? |__|__|.|__| months
C7. How does this years (last season) harvest compare with the last year’s harvest? (circle)
1 = lower 2 = similar 3 = higher
C8. What was the BIGGEST constraint to agriculture in the past
six months? (Circle one response)
1=Insecurity
2=I have been prohibited by the clan/my husband
3=The land is infertile/farming is unproductive
4=I have been prohibited by the government
5=Sickness or physical inability
6=I did not have adequate seeds and tools
7=I do not have sufficient family/household
labour
8= Land conflicts
9= Drought/Low rainfall
10= Lack of household storage facility
11=Other (Specify)

76
5 = Agricultural wage labor
6 = Non-agricultural wage labor
12 = Handicrafts
13 = Gifts/begging
20=Remittances
18 = Other
SECTION 5 – CREDIT/DEBT
What were your household’s main
expenses in the past 30 days?
(Rank up to 4 expenditures.Use
expenses codes)
Using proportional piling
method, estimate the
relative contribution to
total expenditure of each
activity (%)
E1. Main |____|____| E1.1.
|____|____|____|%
E2. Second |____|____| E2.1. |____|____|%
E3. Third |____|____| E3.1. |____|____|%
E4. Fourth |____|____| E4.1 |____|____|%
Expenses
codes
1 = Food
2 = Education
3 = Health
4 = Clothes/ Shelter
5 = Farm input/investment
6 = Utilities
7= Transport
8= Others
E5. Do you have any debt or credit to
repay at the moment?
1= YES
0= N
│___│
If ‘No’, go to section 6
E6. If yes, approximate the amount of current debt in Uganda
shillings
………………………..UGX
E7. Main reason

77
What was the MAIN reason for new debts or credit? (CHOOSE
ONLY ONE)
1= To buy food
2= To cover health expenses
3= To pay school, education costs
4= To buy agricultural inputs (seed, tools...)
5= To buy animal feed, fodder, veterinary
6= To buy or rent land
7= To buy or rent animals
8= To buy or rent or renovate a flat/ house
9= To pay for social events / ceremonies
10= To invest for other business
11= Other reason(specify)________________
│____│
E8.
Who is the MAIN source of credit for all debts and loans?
(CHOOSE ONLY ONE)
1= Relatives
2= Traders/shop-keeper
3= Bank/ Credit institution/Micro-credit project
4= Money lender
5= Other (specify)
Main source
│____│
SECTION 6– FOOD SOURCES AND CONSUMPTION
Read: I would now like to ask you a few questions about food consumption in your household (Ask all the three
questions for each row)
Food Item
a. Number of days
food item was eaten
during last 7 days
(0-7 Days)
b. Main Source
(use codes at
bottom of table)
c. Was food
item eaten in
last 24 hours?
1= Yes 0= No

78
F1.
Cereals and grain: Rice, bread / cake and
/ or donuts, sorghum, millet, maize,
chapatti. |__| |__|
F2. Roots and tubers: potato, yam, cassava,
sweet potato, and / or other tubers |__| |__|
F3. Pulses: beans, cowpeas, lentils, soy,
pigeon pea |__| |__|
F4. Nuts: ground nuts, peanuts, sim sim,
coconuts or other nuts |__| |__|
F5.
Orange vegetables (vegetables rich in
Vitamin A): carrot, red pepper, pumpkin,
orange sweet potatoes, |__| |__|
F6.
Green leafy vegetables:, spinach, broccoli, amaranth and / or other dark green leaves, cassava leaves, bean leaves, pea leaves.
|__| |__|
F7.
Other vegetables: onion, tomatoes,
cucumber, radishes, green beans, peas,
lettuce, cabbage, etc. |__| |__|
F8. Orange fruits (Fruits rich in Vitamin A):
mango, papaya, apricot, peach |__| |__|
F9. Other Fruits (Fruits rich in Vitamin A) :
banana, apple, lemon, tangerine |__| |__|
F10.
Meat: goat, beef, chicken, pork
(report only meat consumed in large
quantities and not as a condiment) |__| |__|
F11. Liver, kidney, heart and / or other organ
meats and blood |__| |__|
F12.
Fish / Shellfish: fish, including canned
tuna, and/or other seafood
(report only fish consumed in large
quantities and not as a condiment) |__| |__|
F13. Eggs
|__| |__|

79
WHAT HAVE BEEN YOUR MAIN DIFFICULTIES OR SHOCKS IN THE
PAST 30 DAYS
DO NOT LIST, LEAVE THE HOUSEHOLD ANSWER
SPONTANEOUSLY
ONCE DONE, ASK THE HOUSEHOLD TO RANK THE 3 MOST IMPORTANT
ONES
1ST DIFFICULTY 2nd Difficulty
1 = Loss employment/reduced salary/wages
2 = Crop Loss due to Rodents
3 = Death household member/funerals
4 = High food prices
G1. │___│ G2. │___│
F14.
Milk and other dairy products: fresh milk
/ sour, yogurt, cheese, other dairy
products
(Exclude margarine / butter or small
amounts of milk for tea / coffee) |__| |__|
F15. Oil / fat / butter: vegetable oil, palm oil,
shea butter, margarine, other fats / oil |__| |__|
F16.
Sugar, or sweet: sugar, honey, jam,
cakes, candy, cookies, pastries, cakes and
other sweet (sugary drinks) |__| |__|
F17.
Condiments / Spices: tea, coffee / cocoa,
salt, garlic, spices, yeast / baking powder,
lanwin, tomato / sauce, meat or fish as a
condiment, condiments including small
amount of milk / tea coffee. |__| |__|
Food source codes
0 = Not eaten food group
1 = Own production (crops, animal)
2 = Fishing / Hunting
3 = Gathering
4 = Borrowed
5 = Market (purchase
with cash)
6 = Market (purchase
on credit)
7 = Beg for food
8 = Exchange labor
or items for food
9 = Gift (food)
from family
relatives or
friends
10 = Food aid
from civil society,
NGOs,
government, WFP
etc
SECTION 7– SHOCKS AND COPING

80
5 = High fuel/transportation prices
6= Debt to reimburse
7 = Floods, heavy rains, drought, land slides
8= Other shock (Specify)
99= No difficulty mentioned
Reduced Coping Strategies Index
During the last 7 days, how many times (in days) did your
household have to employ one of the following strategies to
cope with a lack of food or money to buy it?
READ OUT STRATEGIES
Frequency (number of days from 0 to 7)
G3. Relied on less preferred, less expensive food | __ |
G4. Borrowed food or relied on help from friends or
relatives | __ |
G5. Reduced the number of meals eaten per day | __ |
G6. Reduced portion size of meals | __ |
G7. Reduction in the quantities consumed by
adults/mothers for young children | __ |
Livelihood Coping Strategies Index
During the last 30 days, did anyone in your household have to
engage in any of the following activities because there was not
enough food or money to buy food
1. Yes, 2. No, because it wasn’t
necessary; 3. No, because I already sold
those assets or did this activity and cannot continue and;
4. No, because I never had the possibility to do so.
G8.
STR
ESS
Sold more animals (non-productive) than usual | __ |
G9. Sold household goods (radio, furniture, refrigerator, television, jewelry
etc..) | __ |
G10. Spent savings | __ |
G11. Borrowed money | __ |

81
G12.
EMER
GEN
CIE
S
Sold productive assets or means of transport (sewing machine,
wheelbarrow, bicycle, car, goats, cows, etc.)
| __ |
G13.
Reduced essential non-food expenditures such as education, health,
etc.
| __ |
G14. Consume seed stock held for next season | __ |
G15.
CR
ISIS
Sold house or land | __ |
G16. Illegal income activities (theft, smuggling, prostitution) | __ |
G17. Begged | __ |
SECTION 8 A: MOTHER / CAREGIVER 1 (WITH CHILDREN 0-59 MONTHS OLD)
8a.1 Respondent relationship to children
Circle one
1=Mother 2= Care giver
8a.2 Age of mother/caregiver |__|__| years
8a.3 Educational level of mother/caregiver
CIRCLE
1. No formal education 2. Primary 3. Secondary 4. Tertiary
8a.4 Number of live births by this mother/Care
giver |__|__|
8a.5 Is mother/caretaker pregnant or breast
feeding?
1. Pregnant 2. Breastfeeding (lactating) 3. Pregnant and breastfeeding 4. None of the above
8a.6 Weight (kg)
|__|__|__|.|__|kg
(Only for non-pregnant women with children 0
to 59 months)
8a.7 Height (cm)
|__|__|__|.|__|cm
(Only for non-pregnant women with children 0
to 59 months)
8a.8 MUAC (cm) |__|__|__|.|__|cm (For ALL women with children 0 to 59 months)
8a.9 Hemocue test |__|__|.|__|g/dl (For ALL women with children 0 to 59 months)
SECTION 8 A: CHILD HEALTH AND NUTRITION (CHILDREN 0-59 MONTHS OLD): MOTHER / CAREGIVER 1

82
Please ask Mother/Caregiver 1 all questions about Child 1 and write the answers before moving to Child 2, 3, etc.
Child 1 Child 2 Child 3
8a.9
Sex of the
child? Circle
one
1=Male 2=Female 1=Male 2=Female 1=Male 2=Female
8a.1
0
Date of birth
(Day/month/
year)
|__|__|/|__|__|/|__|__| |__|__|/|__|__|/|__|__| |__|__|/|__|__|/|__|__|
8a.1
1
Age of the
child? (in
months)
|__|__| |__|__| |__|__|
8a.1
2
Has(mention
child’s name)
been taken
for
immunizatio
n,de-
worming or
supplementa
tion?
Use the
following
codes
1= Yes with
card
2= Yes
without card
3= No with
card
4= No
without card
Mea
sles
DP
T3
De-
wo
rmin
g
(>1
2 m
on
ths)
Vit
amin
A
(6 m
onth
s)
Mea
sles
DP
T3
De-
wo
rmin
g
(>1
2 m
on
ths)
Vit
amin
A
(6 m
onth
s)
Mea
sles
DP
T3
De-
wo
rmin
g
(>1
2 m
on
ths)
Vit
amin
A
(6 m
onth
s)
8a.1
3
What did the
child aged 0-
6 months
feed on in
your
household in
the last 24
hours?
(Circle all
that apply)
1= Breast milk only
2= Breast milk and other foods or fluids
3= Bottled or milk in cup (cow or formula)
4= Other foods only
5= No children aged below 6 months
8a.1
4
How long
after birth
1. Within first 1 hour 2. After 1 hour 3. Did not breast fed at all
1. Within first 1 hour 2. After 1 hour 3. Did not breast fed at all
1. Within first 1 hour 2. After 1 hour 3. Did not breast fed at all
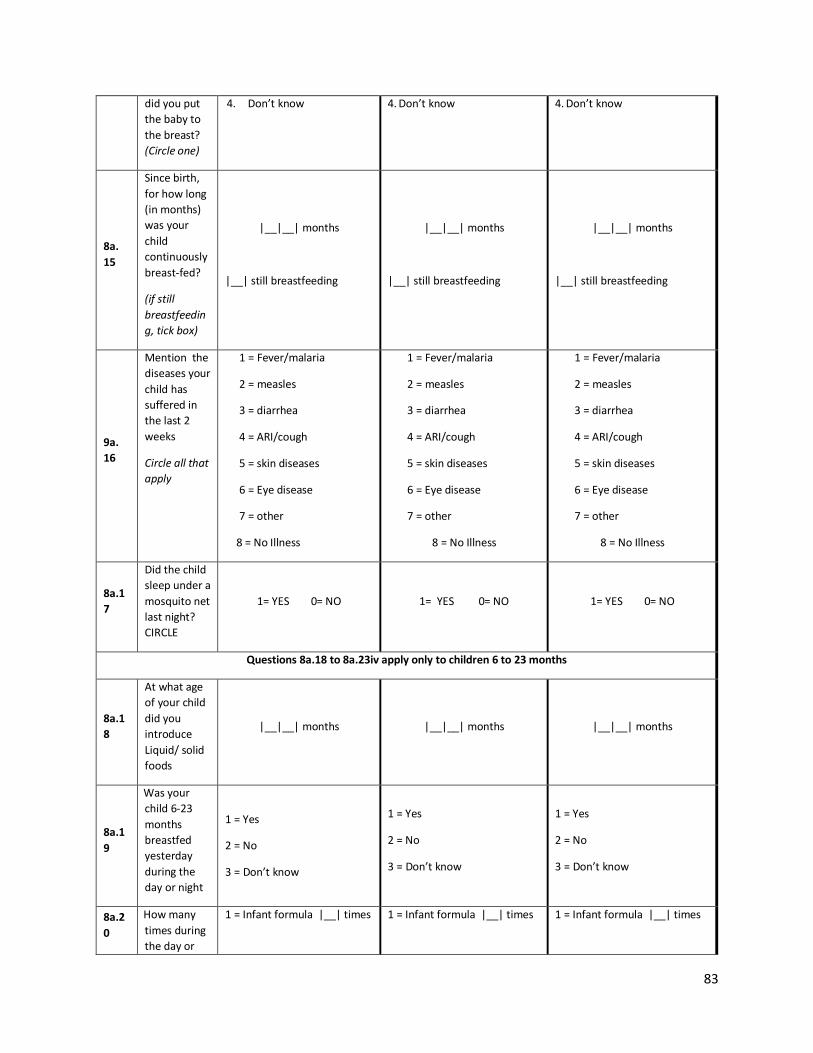
83
did you put
the baby to
the breast?
(Circle one)
4. Don’t know 4. Don’t know 4. Don’t know
8a.
15
Since birth,
for how long
(in months)
was your
child
continuously
breast-fed?
(if still
breastfeedin
g, tick box)
|__|__| months
|__| still breastfeeding
|__|__| months
|__| still breastfeeding
|__|__| months
|__| still breastfeeding
9a.
16
Mention the
diseases your
child has
suffered in
the last 2
weeks
Circle all that
apply
1 = Fever/malaria
2 = measles
3 = diarrhea
4 = ARI/cough
5 = skin diseases
6 = Eye disease
7 = other
8 = No Illness
1 = Fever/malaria
2 = measles
3 = diarrhea
4 = ARI/cough
5 = skin diseases
6 = Eye disease
7 = other
8 = No Illness
1 = Fever/malaria
2 = measles
3 = diarrhea
4 = ARI/cough
5 = skin diseases
6 = Eye disease
7 = other
8 = No Illness
8a.1
7
Did the child
sleep under a
mosquito net
last night?
CIRCLE
1= YES 0= NO 1= YES 0= NO 1= YES 0= NO
Questions 8a.18 to 8a.23iv apply only to children 6 to 23 months
8a.1
8
At what age
of your child
did you
introduce
Liquid/ solid
foods
|__|__| months |__|__| months |__|__| months
8a.1
9
Was your
child 6-23
months
breastfed
yesterday
during the
day or night
1 = Yes
2 = No
3 = Don’t know
1 = Yes
2 = No
3 = Don’t know
1 = Yes
2 = No
3 = Don’t know
8a.2
0
How many
times during
the day or
1 = Infant formula |__| times 1 = Infant formula |__| times 1 = Infant formula |__| times

84
night did
your child 6-
23 months
consume any
of….
2 = Milk such as
tinned, powdered,
or fresh animal
milk |__|.times
3 = Yogurt |__| times
4=Thin porridge |__|times
2 = Milk such as
tinned, powdered,
or fresh animal
milk |__|.times
3 = Yogurt |__| times
4=Thin porridge |__|times
2 = Milk such as
tinned, powdered,
or fresh animal
milk |__|.times
3 = Yogurt |__| times
4=Thin porridge |__|times
8a.2
1
What foods
did your
child 6-23
months eat
in the last 24
hours? Circle
all that apply
1 = Grains, roots, and tubers
eg porridge, bread, rice,
posho, potatoes, cassava, etc
2 = Legumes and nuts eg
beans, peas, ground nuts. etc
3 = Dairy products eg milk
yoghurt, cheese
4 = Flesh foods eg meat, fish,
poultry, liver, organ meats
5 = Eggs
6 = Vitamin A rich fruits and
vegetables eg carrots, ripe
mangoes, papaya, etc
7 = Other fruits and
vegetables
8 = Fortified foods (WFP
fortified products)
1 = Grains, roots, and tubers eg
porridge, bread, rice, posho,
potatoes, cassava, etc
2 = Legumes and nuts eg
beans, peas, ground nuts. etc
3 = Dairy products eg milk
yoghurt, cheese
4 = Flesh foods eg meat, fish,
poultry, liver, organ meats
5 = Eggs
6 = Vitamin A rich fruits and
vegetables eg carrots, ripe
mangoes, papaya, etc
7 = Other fruits and vegetables
8 = Fortified foods (WFP
fortified products)
1 = Grains, roots, and tubers eg
porridge, bread, rice, posho,
potatoes, cassava, etc
2 = Legumes and nuts eg beans,
peas, ground nuts. etc
3 = Dairy products eg milk
yoghurt, cheese
4 = Flesh foods eg meat, fish,
poultry, liver, organ meats
5 = Eggs
6 = Vitamin A rich fruits and
vegetables eg carrots, ripe
mangoes, papaya, etc
7 = Other fruits and vegetables
8 = Fortified foods (WFP
fortified products)
8a.2
2
How many
times did
your child 6-
23 months
eat solid,
semi-solid or
soft foods
during the
previous
day?
|__| times |__| times |__| times
8a.2
3i
Is this child
6-23 months
enrolled in
the MCHN
Programme
(Note:
MCHN
beneficiaries
receive
1= YES
0= NO (Skip to 9a.20iv)
1= YES
0= NO(Skip to 9a.20iv)
1= YES
0= NO(Skip to 9a.20iv)

85
Premix of
CSB, Oil and
Sugar at
health
facilities)
8a.2
3ii
May I see
your
programme
participation
card ? Tick
the response
provided
1 = Card present
2 = Card absent
1 = Card present
2 = Card absent
1 = Card present
2 = Card absent
8a.2
3iii
Why do you
not have a
programme
participation
card?
1 = I was not given one
2= Did not know I needed one
3 = I lost/misplaced my card
4 = Other
1 = I was not given one
2= Did not know I needed one
3 = I lost/misplaced my card
4 = Other
1 = I was not given one
2= Did not know I needed one
3 = I lost/misplaced my card
4 = Other
8a.2
3iv
If child 6-23
months is
not enrolled,
what is the
main reason
for not
enrolling the
child?
1 = I don’t know about the
programme
2 = Too much time required
to participate= The
distribution site was too far
4 = No transportation to reach
the distribution site
5 = I had other commitments
that prevented enrolling the
child
6 = Other –
Specify…………………………………
….
……………………………………………
…
1 = I don’t know about the
programme
2 = Too much time required to
participate= The distribution
site was too far
4 = No transportation to reach
the distribution site
5 = I had other commitments
that prevented enrolling the
child
6 = Other –
Specify……………………………………
.
………………………………………………
1 = I don’t know about the
programme
2 = Too much time required to
participate= The distribution
site was too far
4 = No transportation to reach
the distribution site
5 = I had other commitments
that prevented enrolling the
child
6 = Other –
Specify…………………………………….
………………………………………………
Questions 8a.24 to 8a.27 apply only to all children 6 to 59 months
8a.2
4
Does the
child have
oedema?
(If yes, skip
9a.25-9a.27)
1 = YES 0 = NO 1 = YES 0 = NO 1 = YES 0 = NO

86
8a.2
5
Weight (Kg)
of the child |__|__|.|__|kg |__|__|.|__|kg |__|__|.|__|kg
8a.2
6
Height (cm)
of the child |__|__|__|.|__|cm |__|__|__|.|__|cm |__|__|__|.|__|cm
8a.2
7
MUAC (cm)
of the child |__|__|__|.|__|cm |__|__|__|.|__|cm |__|__|__|.|__|cm
8a.2
8
Hemocue
test |__|__|.|__|g/dl |__|__|.|__|g/dl |__|__|.|__|g/dl
SECTION 8 B: MOTHER / CAREGIVER 2 (WITH CHILDREN 0-59 MONTHS OLD)
8b.1 Respondent relationship to children
Circle one
1=Mother 2= Care giver
8b.2 Age of mother/caregiver |__|__| years
8b.3 Educational level of mother/caregiver CIRCLE 5. No formal education 6. Primary 7. Secondary 8. Tertiary
8b.4 Number of live births by this mother/Care
giver |__|__|
8b.5 Is mother/caretaker pregnant or breast
feeding?
5. Pregnant 6. Breastfeeding (lactating) 7. Pregnant and breastfeeding 8. None of the above
8b.6 Weight (kg)
|__|__|__|.|__|kg
(Only for non-pregnant women with children 0
to 59 months)
8b.7 Height (cm)
|__|__|__|.|__|cm
(Only for non-pregnant women with children 0
to 59 months)
8b.8 MUAC (cm) |__|__|__|.|__|cm (For ALL women with children 0 to 59 months)
8b.9 Hemocue test |__|__|.|__|g/dl (For ALL women with children 0 to 59 months)
SECTION 8 B: CHILD HEALTH AND NUTRITION (CHILDREN 0-59 MONTHS OLD): MOTHER / CAREGIVER 2
Please ask Mother/Caregiver 1 all questions about Child 1 and write the answers before moving to Child 2, 3, etc.
Child 1 Child 2 Child 3

87
8b.9
Sex of the
child? Circle
one
1=Male 2=Female 1=Male 2=Female 1=Male 2=Female
8b.10
Date of birth
(Day/month/
year)
|__|__|/|__|__|/|__|__| |__|__|/|__|__|/|__|__| |__|__|/|__|__|/|__|__|
8b.11
Age of the
child? (in
months)
|__|__| |__|__| |__|__|
8b.12
Has (mention
child’s name)
been taken
for
immunization
,de-worming
or
supplementat
ion?
Use the
following
codes
1= Yes with
card
2= Yes
without card
3= No with
card
4= No
without card
Mea
sles
DP
T3
De-
wo
rmin
g
(>1
2 m
on
ths)
Vit
amin
A
(6 m
onth
s)
Mea
sles
DP
T3
De-
wo
rmin
g
(>1
2 m
on
ths)
Vit
amin
A
(6 m
onth
s)
Mea
sles
DP
T3
De-
wo
rmin
g
(>1
2 m
on
ths)
Vit
amin
A
(6 m
onth
s)
8b.13
What did the
child aged 0-
6 months
feed on in
your
household in
the last 24
hours?
(Circle all that
apply)
1= Breast milk only
2= Breast milk and other foods or fluids
3= Bottled or milk in cup (cow or formula)
4= Other foods only
5= No children aged below 6 months
8b.14
How long
after birth did
you put the
baby to the
breast?
(Circle one)
5. Within first 1 hour 6. After 1 hour 7. Did not breast fed at all 8. Don’t know
5. Within first 1 hour 6. After 1 hour 7. Did not breast fed at all 8. Don’t know
5. Within first 1 hour 6. After 1 hour 7. Did not breast fed at all 8. Don’t know

88
8b.
15
Since birth,
for how long
(in months)
was your
child
continuously
breast-fed?
(if still
breastfeeding
, tick box)
|__|__| months
|__| still breastfeeding
|__|__| months
|__| still breastfeeding
|__|__| months
|__| still breastfeeding
8b.
16
Mention the
diseases your
child has
suffered in
the last 2
weeks
Circle all that
apply
1 = Fever/malaria
2 = measles
3 = diarrhea
4 = ARI/cough
5 = skin diseases
6 = Eye disease
7 = other
8 = No Illness
1 = Fever/malaria
2 = measles
3 = diarrhea
4 = ARI/cough
5 = skin diseases
6 = Eye disease
7 = other
8 = No Illness
1 = Fever/malaria
2 = measles
3 = diarrhea
4 = ARI/cough
5 = skin diseases
6 = Eye disease
7 = other
8 = No Illness
8b.17
Did the child
sleep under a
mosquito net
last night?
CIRCLE
1= YES 0= NO 1= YES 0= NO 1= YES 0= NO
Questions 8b.18 to 8b.23iv apply only to children 6 to 23 months
8b.18
At what age
of your child
did you
introduce
Liquid/ solid
foods
|__|__| months |__|__| months |__|__| months
8b.19
Was your
child 6-23
months
breastfed
yesterday
during the
day or night
1 = Yes
2 = No
3 = Don’t know
1 = Yes
2 = No
3 = Don’t know
1 = Yes
2 = No
3 = Don’t know
8b.20
How many
times during
the day or
night did
your child 6-
23 months
1 = Infant formula |__| times
2 = Milk such as
tinned, powdered,
or fresh animal
1 = Infant formula |__| times
2 = Milk such as
tinned, powdered,
or fresh animal
1 = Infant formula |__| times
2 = Milk such as
tinned, powdered,
or fresh animal

89
consume any
of….
milk |__|.times
3 = Yogurt |__| times
4=Thin porridge |__|times
milk |__|.times
3 = Yogurt |__| times
4=Thin porridge |__|times
milk |__|.times
3 = Yogurt |__| times
4=Thin porridge |__|times
8b.21
What foods
did your child
6-23 months
eat in the last
24 hours?
Circle all that
apply
1 = Grains, roots, and tubers
eg porridge, bread, rice,
posho, potatoes, cassava, etc
2 = Legumes and nuts eg
beans, peas, ground nuts. etc
3 = Dairy products eg milk
yoghurt, cheese
4 = Flesh foods eg meat, fish,
poultry, liver, organ meats
5 = Eggs
6 = Vitamin A rich fruits and
vegetables eg carrots, ripe
mangoes, papaya, etc
7 = Other fruits and vegetables
8 = Fortified foods (WFP
fortified products)
1 = Grains, roots, and tubers eg
porridge, bread, rice, posho,
potatoes, cassava, etc
2 = Legumes and nuts eg beans,
peas, ground nuts. etc
3 = Dairy products eg milk
yoghurt, cheese
4 = Flesh foods eg meat, fish,
poultry, liver, organ meats
5 = Eggs
6 = Vitamin A rich fruits and
vegetables eg carrots, ripe
mangoes, papaya, etc
7 = Other fruits and vegetables
8 = Fortified foods (WFP fortified
products)
1 = Grains, roots, and tubers
eg porridge, bread, rice,
posho, potatoes, cassava, etc
2 = Legumes and nuts eg
beans, peas, ground nuts. etc
3 = Dairy products eg milk
yoghurt, cheese
4 = Flesh foods eg meat, fish,
poultry, liver, organ meats
5 = Eggs
6 = Vitamin A rich fruits and
vegetables eg carrots, ripe
mangoes, papaya, etc
7 = Other fruits and
vegetables
8 = Fortified foods (WFP
fortified products)
8b.22
How many
times did
your child 6-
23 months
eat solid,
semi-solid or
soft foods
during the
previous day?
|__| times |__| times |__| times
8b.23
i
Is this child 6-
23 months
enrolled in
the MCHN
Programme
(Note: MCHN
beneficiaries
receive
Premix of
CSB, Oil and
Sugar at
health
facilities)
1= YES
0= NO (Skip to 9b.20iv)
1= YES
0= NO(Skip to 9b.20iv)
1= YES
0= NO(Skip to 9b.20iv)

90
8b.23
ii
May I see
your
programme
participation
card ? Tick
the response
provided
1 = Card present
2 = Card absent
1 = Card present
2 = Card absent
1 = Card present
2 = Card absent
8b.23
iii
Why do you
not have a
programme
participation
card?
1 = I was not given one
2= Did not know I needed one
3 = I lost/misplaced my card
4 = Other
1 = I was not given one
2= Did not know I needed one
3 = I lost/misplaced my card
4 = Other
1 = I was not given one
2= Did not know I needed one
3 = I lost/misplaced my card
4 = Other
8b.23
iv
If child 6-23
months is not
enrolled,
what is the
main reason
for not
enrolling the
child?
1 = I don’t know about the
programme
2 = Too much time required to
participate= The distribution
site was too far
4 = No transportation to reach
the distribution site
5 = I had other commitments
that prevented enrolling the
child
6 = Other –
Specify……………………………………
.
………………………………………………
1 = I don’t know about the
programme
2 = Too much time required to
participate= The distribution site
was too far
4 = No transportation to reach
the distribution site
5 = I had other commitments that
prevented enrolling the child
6 = Other –
Specify…………………………………….
………………………………………………
1 = I don’t know about the
programme
2 = Too much time required
to participate= The
distribution site was too far
4 = No transportation to reach
the distribution site
5 = I had other commitments
that prevented enrolling the
child
6 = Other –
Specify…………………………………
….
……………………………………………
…
Questions 8b.24 to 8b.27 apply only to all children 6 to 59 months
8b.24
Does the
child have
oedema?
(If yes, skip
9b.25-9b.27)
1 = YES 0 = NO 1 = YES 0 = NO 1 = YES 0 = NO
8b.25 Weight (Kg)
of the child |__|__|.|__|kg |__|__|.|__|kg |__|__|.|__|kg
8b.26 Height (cm)
of the child |__|__|__|.|__|cm |__|__|__|.|__|cm |__|__|__|.|__|cm
8b.27 MUAC (cm)
of the child |__|__|__|.|__|cm |__|__|__|.|__|cm |__|__|__|.|__|cm

91
8b.28 Hemocue
test |__|__|.|__|g/dl |__|__|.|__|g/dl |__|__|.|__|g/dl
SECTION 9 : CROSS CUTTING INDICATORS
9.1 In the last 6 months, did this household
receive the following from WFP – circle
all that apply
1. Food aid 2. Cash 3. No assistance from WFP (If “No
Assistance”, STOP here)
9.2 Regarding the last WFP distribution,
Who (men, women or both) decides
what to do with the cash/voucher given
by WFP, such as when, where and what
to buy?
1. Women
2. Men
3. Women and Men Together
9.3 Regarding the last WFP distribution,
Who (men, women or both) decides
what to do with the food given by WFP,
such as whether to sell, trade, lend or
share a portion of it?
1. Women
2. Men
3. Women and Men Together
9.4 How many HH members went (or tried to
go) to the WFP programme site during
the last 2 months?
|__|
9.5 Have any of these HH member(s)
experienced safety problems 1) going
to WFP programme sites, 2) at WFP
programme sites, and/or 3) going from
WFP programme sites during the last 2
months?
1=Yes 0= No (If no, skip question 10.6)
9.6 If yes, could you let me know where the
problem occurred (select all that are
relevant):
a) Going to the WFP programme site |__|
b) At the WFP programme site |__|
c) Going from the WFP programme site |__|
SECTION 10: MORTALITY ASSESSMENT IN THE PAST 90 DAYS

92
L1. Current HH members – total
L2. Current HH members - < 5
L3. Current HH members who arrived during recall (exclude births)
L4. Current HH members who arrived during recall - <5
L5. Past HH members who left during recall (exclude deaths)
L6. Past HH members who left during recall - < 5
L7. Births during recall
L8. Total deaths
L9. Deaths < 5
L10. Assumed cause of death for under five 1
L11. Assumed caused of death for under five 2
L12. Assumed cause of death for adult
1= Diarrhea, 2= Bloody diarrhea, 3= Measles, 4= Malaria (fever of 2-3days standing),
5= Lower respiratory tract infection, 6= Gun shot, 7= Accident, 8= Other (specify),
9= Unknown
Annex 3: ENA Reports and plausibility checks
Abim
Model nutrition assessment report - Abim (based on the Save the Children Fund emergency nutrition assessment handbook)
Executive summary (one to two pages only)
GAM: 6.2 % (4.5 - 8.6 95% C.I.)
SAM : 1.5 % (0.7 - 2.9 95% C.I.)
3. Results 3.1 Anthropometric results (based on WHO standards 2006):
Definitions of acute malnutrition should be given (for example, global acute malnutrition is defined as <-2 z scores weight-for-height and/or oedema, severe acute malnutrition is defined as <-3z scores weight-for-height and/or oedema)

93
Exclusion of z-scores from Zero (reference mean) WHO flags: WHZ -5 to 5; HAZ -6 to 6; WAZ -6 to 5 Table 3.1: Distribution of age and sex of sample
Boys Girls Total Ratio
AGE (mo) no. % no. % no. % Boy:girl
6-17 90 50.0 90 50.0 180 32.2 1.0
18-29 73 48.0 79 52.0 152 27.2 0.9
30-41 54 47.4 60 52.6 114 20.4 0.9
42-53 35 43.8 45 56.3 80 14.3 0.8
54-59 12 36.4 21 63.6 33 5.9 0.6
Total 264 47.2 295 52.8 559 100.0 0.9
Table 3.2: Prevalence of acute malnutrition based on weight-for-height z-scores (and/or oedema) and by sex
All
n = 547
Boys
n = 257
Girls
n = 290
Prevalence of global
malnutrition
(<-2 z-score and/or oedema)
(34) 6.2 %
(4.5 - 8.6
95% C.I.)
(17) 6.6 %
(4.2 - 10.3
95% C.I.)
(17) 5.9 %
(3.7 - 9.2
95% C.I.)
Prevalence of moderate
malnutrition
(<-2 z-score and >=-3 z-score, no
oedema)
(26) 4.8 %
(3.3 - 6.9
95% C.I.)
(14) 5.4 %
(3.3 - 8.9
95% C.I.)
(12) 4.1 %
(2.4 - 7.1
95% C.I.)
Prevalence of severe
malnutrition
(<-3 z-score and/or oedema)
(8) 1.5 %
(0.7 - 2.9
95% C.I.)
(3) 1.2 %
(0.4 - 3.4
95% C.I.)
(5) 1.7 %
(0.7 - 4.0
95% C.I.)
The prevalence of oedema is 0.2 %
Table 3.3: Prevalence of acute malnutrition by age, based on weight-for-height z-scores and/or oedema
Severe wasting
(<-3 z-score)
Moderate
wasting
(>= -3 and <-2
z-score )
Normal
(> = -2 z score)
Oedema
Age
(mo)
Total
no.
No. % No. % No. % No. %
6-17 176 3 1.7 16 9.1 157 89.2 0 0.0

94
18-29 148 0 0.0 4 2.7 144 97.3 0 0.0
30-41 114 0 0.0 4 3.5 110 96.5 0 0.0
42-53 76 3 3.9 1 1.3 71 93.4 1 1.3
54-59 33 1 3.0 1 3.0 31 93.9 0 0.0
Total 547 7 1.3 26 4.8 513 93.8 1 0.2
Table 3.4: Distribution of acute malnutrition and oedema based on weight-for-height z-scores
<-3 z-score >=-3 z-score
Oedema present Marasmic kwashiorkor
No. 0
(0.0 %)
Kwashiorkor
No. 1
(0.2 %)
Oedema absent Marasmic
No. 11
(2.0 %)
Not severely malnourished
No. 544
(97.8 %)
Table 3.7: Prevalence of underweight based on weight-for-age z-scores by sex
All
n = 556
Boys
n = 263
Girls
n = 293
Prevalence of underweight
(<-2 z-score)
(95) 17.1 %
(14.2 - 20.4
95% C.I.)
(54) 20.5 %
(16.1 - 25.8
95% C.I.)
(41) 14.0 %
(10.5 - 18.4
95% C.I.)
Prevalence of moderate
underweight
(<-2 z-score and >=-3 z-score)
(68) 12.2 %
(9.8 - 15.2
95% C.I.)
(35) 13.3 %
(9.7 - 17.9
95% C.I.)
(33) 11.3 %
(8.1 - 15.4
95% C.I.)
Prevalence of severe
underweight
(<-3 z-score)
(27) 4.9 %
(3.4 - 7.0
95% C.I.)
(19) 7.2 %
(4.7 - 11.0
95% C.I.)
(8) 2.7 %
(1.4 - 5.3
95% C.I.)
Table 3.8: Prevalence of underweight by age, based on weight-for-age z-scores
Severe
underweight
(<-3 z-score)
Moderate
underweight
(>= -3 and <-2
z-score )
Normal
(> = -2 z score)
Oedema
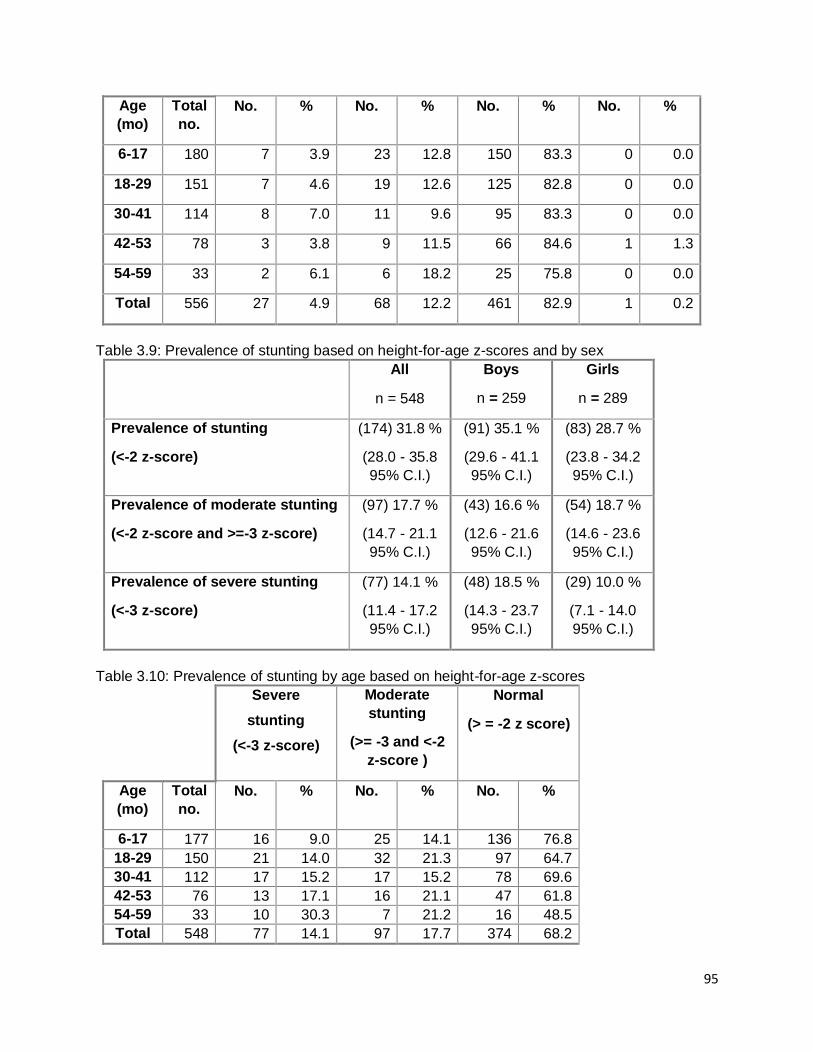
95
Age
(mo)
Total
no.
No. % No. % No. % No. %
6-17 180 7 3.9 23 12.8 150 83.3 0 0.0
18-29 151 7 4.6 19 12.6 125 82.8 0 0.0
30-41 114 8 7.0 11 9.6 95 83.3 0 0.0
42-53 78 3 3.8 9 11.5 66 84.6 1 1.3
54-59 33 2 6.1 6 18.2 25 75.8 0 0.0
Total 556 27 4.9 68 12.2 461 82.9 1 0.2
Table 3.9: Prevalence of stunting based on height-for-age z-scores and by sex
All
n = 548
Boys
n = 259
Girls
n = 289
Prevalence of stunting
(<-2 z-score)
(174) 31.8 %
(28.0 - 35.8
95% C.I.)
(91) 35.1 %
(29.6 - 41.1
95% C.I.)
(83) 28.7 %
(23.8 - 34.2
95% C.I.)
Prevalence of moderate stunting
(<-2 z-score and >=-3 z-score)
(97) 17.7 %
(14.7 - 21.1
95% C.I.)
(43) 16.6 %
(12.6 - 21.6
95% C.I.)
(54) 18.7 %
(14.6 - 23.6
95% C.I.)
Prevalence of severe stunting
(<-3 z-score)
(77) 14.1 %
(11.4 - 17.2
95% C.I.)
(48) 18.5 %
(14.3 - 23.7
95% C.I.)
(29) 10.0 %
(7.1 - 14.0
95% C.I.)
Table 3.10: Prevalence of stunting by age based on height-for-age z-scores
Severe
stunting
(<-3 z-score)
Moderate
stunting
(>= -3 and <-2
z-score )
Normal
(> = -2 z score)
Age
(mo)
Total
no.
No. % No. % No. %
6-17 177 16 9.0 25 14.1 136 76.8
18-29 150 21 14.0 32 21.3 97 64.7
30-41 112 17 15.2 17 15.2 78 69.6
42-53 76 13 17.1 16 21.1 47 61.8
54-59 33 10 30.3 7 21.2 16 48.5
Total 548 77 14.1 97 17.7 374 68.2

96
Table 3.11: Prevalence of overweight based on weight for height cut off's and by sex (no oedema)
All
n = 547
Boys
n = 257
Girls
n = 290
Prevalence of overweight (WHZ
> 2)
(23) 4.2 %
(2.8 - 6.2
95% C.I.)
(10) 3.9 %
(2.1 - 7.0
95% C.I.)
(13) 4.5 %
(2.6 - 7.5
95% C.I.)
Prevalence of severe overweight
(WHZ > 3)
(9) 1.6 %
(0.9 - 3.1
95% C.I.)
(1) 0.4 %
(0.1 - 2.2
95% C.I.)
(8) 2.8 %
(1.4 - 5.3
95% C.I.)
Table 3.12: Prevalence of overweight by age, based on weight for height (no oedema)
Overweight
(WHZ > 2)
Severe
Overweight
(WHZ > 3)
Age
(mo)
Total
no.
No. % No. %
6-17 176 7 4.0 1 0.6
18-29 148 6 4.1 2 1.4
30-41 114 5 4.4 2 1.8
42-53 76 2 2.6 2 2.6
54-59 33 3 9.1 2 6.1
Total 547 23 4.2 9 1.6
Table 3.13: Mean z-scores, Design Effects and excluded subjects
Indicator n Mean z-scores ±
SD
Design Effect (z-
score < -2)
z-scores not
available*
z-scores out of range
Weight-for-Height
546 -0.17±1.23 1.00 4 9
Weight-for-Age 556 -0.92±1.27 1.00 1 2
Height-for-Age 548 -1.34±1.70 1.00 0 11 * contains for WHZ and WAZ the children with edema.
Appendix 4
Result Tables for NCHS growth reference 1977
Table 3.2: Prevalence of acute malnutrition based on weight-for-height z-scores (and/or
oedema) and by sex
All Boys Girls
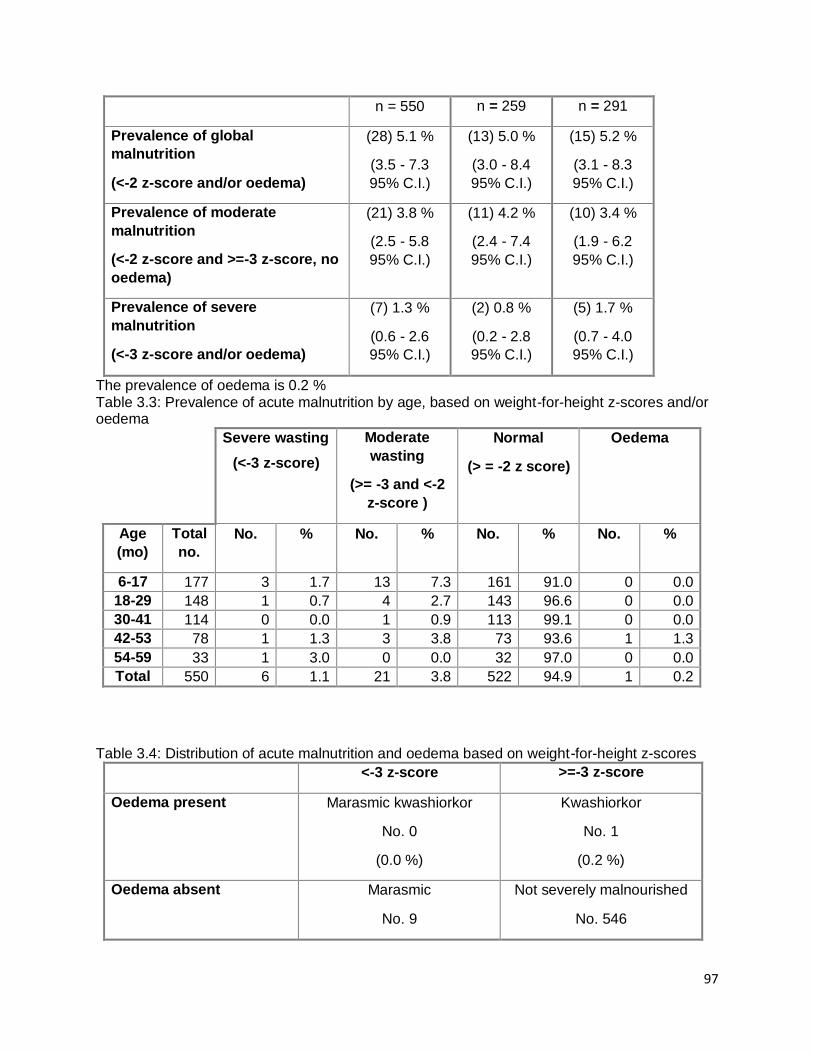
97
n = 550 n = 259 n = 291
Prevalence of global
malnutrition
(<-2 z-score and/or oedema)
(28) 5.1 %
(3.5 - 7.3
95% C.I.)
(13) 5.0 %
(3.0 - 8.4
95% C.I.)
(15) 5.2 %
(3.1 - 8.3
95% C.I.)
Prevalence of moderate
malnutrition
(<-2 z-score and >=-3 z-score, no
oedema)
(21) 3.8 %
(2.5 - 5.8
95% C.I.)
(11) 4.2 %
(2.4 - 7.4
95% C.I.)
(10) 3.4 %
(1.9 - 6.2
95% C.I.)
Prevalence of severe
malnutrition
(<-3 z-score and/or oedema)
(7) 1.3 %
(0.6 - 2.6
95% C.I.)
(2) 0.8 %
(0.2 - 2.8
95% C.I.)
(5) 1.7 %
(0.7 - 4.0
95% C.I.)
The prevalence of oedema is 0.2 % Table 3.3: Prevalence of acute malnutrition by age, based on weight-for-height z-scores and/or oedema
Severe wasting
(<-3 z-score)
Moderate
wasting
(>= -3 and <-2
z-score )
Normal
(> = -2 z score)
Oedema
Age
(mo)
Total
no.
No. % No. % No. % No. %
6-17 177 3 1.7 13 7.3 161 91.0 0 0.0
18-29 148 1 0.7 4 2.7 143 96.6 0 0.0
30-41 114 0 0.0 1 0.9 113 99.1 0 0.0
42-53 78 1 1.3 3 3.8 73 93.6 1 1.3
54-59 33 1 3.0 0 0.0 32 97.0 0 0.0
Total 550 6 1.1 21 3.8 522 94.9 1 0.2
Table 3.4: Distribution of acute malnutrition and oedema based on weight-for-height z-scores
<-3 z-score >=-3 z-score
Oedema present Marasmic kwashiorkor
No. 0
(0.0 %)
Kwashiorkor
No. 1
(0.2 %)
Oedema absent Marasmic
No. 9
Not severely malnourished
No. 546

98
(1.6 %) (98.2 %)
Table 3.5: Prevalence of acute malnutrition based on MUAC cut off's (and/or oedema) and by sex
All
n = 1
Boys
n = 0
Girls
n = 1
Prevalence of global
malnutrition
(< 125 mm and/or oedema)
(1) 100.0 %
(20.7 - 100.0
95% C.I.)
(0) %
( - 95% C.I.)
(1) 100.0 %
(20.7 - 100.0
95% C.I.)
Prevalence of moderate
malnutrition
(< 125 mm and >= 115 mm, no
oedema)
(0) 0.0 %
(0.0 - 79.3
95% C.I.)
(0) %
( - 95% C.I.)
(0) 0.0 %
(0.0 - 79.3
95% C.I.)
Prevalence of severe
malnutrition
(< 115 mm and/or oedema)
(1) 100.0 %
(20.7 - 100.0
95% C.I.)
(0) %
( - 95% C.I.)
(1) 100.0 %
(20.7 - 100.0
95% C.I.)
Table 3.5: Prevalence of acute malnutrition based on the percentage of the median and/or oedema
n = 550
Prevalence of global acute
malnutrition
(<80% and/or oedema)
(17) 3.1 %
(1.9 - 4.9 95% C.I.)
Prevalence of moderate acute
malnutrition
(<80% and >= 70%, no oedema)
(15) 2.7 %
(1.7 - 4.5 95% C.I.)
Prevalence of severe acute
malnutrition
(<70% and/or oedema)
(2) 0.4 %
(0.1 - 1.3 95% C.I.)
Table 3.6: Prevalence of malnutrition by age, based on weight-for-height percentage of the median and oedema
Severe
wasting
(<70% median)
Moderate
wasting
Normal
(> =80%
median)
Oedema

99
(>=70% and
<80% median)
Age
(mo)
Total
no.
No. % No. % No. % No. %
6-17 177 1 0.6 9 5.1 167 94.4 0 0.0
18-29 148 0 0.0 2 1.4 146 98.6 0 0.0
30-41 114 0 0.0 0 0.0 114 100.0 0 0.0
42-53 78 0 0.0 3 3.8 74 94.9 1 1.3
54-59 33 0 0.0 1 3.0 32 97.0 0 0.0
Total 550 1 0.2 15 2.7 533 96.9 1 0.2
Table 3.7: Prevalence of underweight based on weight-for-age z-scores by sex
All
n = 555
Boys
n = 263
Girls
n = 292
Prevalence of underweight
(<-2 z-score)
(121) 21.8 %
(18.6 - 25.4
95% C.I.)
(62) 23.6 %
(18.8 - 29.1
95% C.I.)
(59) 20.2 %
(16.0 - 25.2
95% C.I.)
Prevalence of moderate
underweight
(<-2 z-score and >=-3 z-score)
(91) 16.4 %
(13.5 - 19.7
95% C.I.)
(41) 15.6 %
(11.7 - 20.5
95% C.I.)
(50) 17.1 %
(13.2 - 21.9
95% C.I.)
Prevalence of severe
underweight
(<-3 z-score)
(30) 5.4 %
(3.8 - 7.6
95% C.I.)
(21) 8.0 %
(5.3 - 11.9
95% C.I.)
(9) 3.1 %
(1.6 - 5.8
95% C.I.)
Table 3.8: Prevalence of underweight by age, based on weight-for-age z-scores
Severe
underweight
(<-3 z-score)
Moderate
underweight
(>= -3 and <-2
z-score )
Normal
(> = -2 z score)
Oedema
Age
(mo)
Total
no.
No. % No. % No. % No. %
6-17 180 9 5.0 29 16.1 142 78.9 0 0.0
18-29 150 8 5.3 29 19.3 113 75.3 0 0.0
30-41 114 8 7.0 17 14.9 89 78.1 0 0.0
42-53 78 3 3.8 10 12.8 65 83.3 1 1.3
54-59 33 2 6.1 6 18.2 25 75.8 0 0.0
Total 555 30 5.4 91 16.4 434 78.2 1 0.2

100
Table 3.9: Prevalence of stunting based on height-for-age z-scores and by sex
All
n = 550
Boys
n = 261
Girls
n = 289
Prevalence of stunting
(<-2 z-score)
(148) 26.9 %
(23.4 - 30.8
95% C.I.)
(79) 30.3 %
(25.0 - 36.1
95% C.I.)
(69) 23.9 %
(19.3 - 29.1
95% C.I.)
Prevalence of moderate stunting
(<-2 z-score and >=-3 z-score)
(86) 15.6 %
(12.8 - 18.9
95% C.I.)
(42) 16.1 %
(12.1 - 21.0
95% C.I.)
(44) 15.2 %
(11.5 - 19.8
95% C.I.)
Prevalence of severe stunting
(<-3 z-score)
(62) 11.3 %
(8.9 - 14.2
95% C.I.)
(37) 14.2 %
(10.5 - 18.9
95% C.I.)
(25) 8.7 %
(5.9 - 12.5
95% C.I.)
Table 3.10: Prevalence of stunting by age based on height-for-age z-scores
Severe
stunting
(<-3 z-score)
Moderate
stunting
(>= -3 and <-2
z-score )
Normal
(> = -2 z score)
Age
(mo)
Total
no.
No. % No. % No. %
6-17 178 9 5.1 27 15.2 142 79.8
18-29 150 14 9.3 29 19.3 107 71.3
30-41 112 15 13.4 12 10.7 85 75.9
42-53 77 14 18.2 12 15.6 51 66.2
54-59 33 10 30.3 6 18.2 17 51.5
Total 550 62 11.3 86 15.6 402 73.1
Table 3.11: Prevalence of overweight based on weight for height cut off's and by sex (no oedema)
All
n = 550
Boys
n = 259
Girls
n = 291
Prevalence of overweight (WHZ
> 2)
(17) 3.1 %
(1.9 - 4.9
95% C.I.)
(4) 1.5 %
(0.6 - 3.9
95% C.I.)
(13) 4.5 %
(2.6 - 7.5
95% C.I.)

101
Prevalence of severe overweight
(WHZ > 3)
(8) 1.5 %
(0.7 - 2.8
95% C.I.)
(2) 0.8 %
(0.2 - 2.8
95% C.I.)
(6) 2.1 %
(0.9 - 4.4
95% C.I.)
Table 3.12: Prevalence of overweight by age, based on weight for height (no oedema)
Overweight
(WHZ > 2)
Severe
Overweight
(WHZ > 3)
Age
(mo)
Total
no.
No. % No. %
6-17 177 6 3.4 2 1.1
18-29 148 2 1.4 2 1.4
30-41 114 3 2.6 1 0.9
42-53 78 4 5.1 3 3.8
54-59 33 2 6.1 0 0.0
Total 550 17 3.1 8 1.5
Table 3.13: Mean z-scores, Design Effects and excluded subjects
Indicator n Mean z-scores ±
SD
Design Effect (z-
score < -2)
z-scores not
available*
z-scores out of range
Weight-for-Height
549 -0.42±1.15 1.00 4 6
Weight-for-Age 555 -1.14±1.22 1.00 1 3
Height-for-Age 550 -1.17±1.64 1.00 0 9 * contains for WHZ and WAZ the children with edema.
Plausibility check for: Abim14_above6.as
Standard/Reference used for z-score calculation: WHO standards 2006
(If it is not mentioned, flagged data is included in the evaluation. Some parts of this plausibility report are
more for advanced users and can be skipped for a standard evaluation)
Overall data quality
Criteria Flags* Unit Excel. Good Accept Problematic Score
Flagged data Incl % 0-2.5 >2.5-5.0 >5.0-7.5 >7.5
(% of in-range subjects) 0 5 10 20 5 (4.4 %)

102
Overall Sex ratio Incl p >0.1 >0.05 >0.001 <=0.001
(Significant chi square) 0 2 4 10 0 (p=0.190)
Overall Age distrib Incl p >0.1 >0.05 >0.001 <=0.001
(Significant chi square) 0 2 4 10 10 (p=0.000)
Dig pref score - weight Incl # 0-7 8-12 13-20 > 20
0 2 4 10 0 (3)
Dig pref score - height Incl # 0-7 8-12 13-20 > 20
0 2 4 10 2 (10)
Dig pref score - MUAC Incl # 0-7 8-12 13-20 > 20
0 2 4 10 0 (0)
Standard Dev WHZ Excl SD <1.1 <1.15 <1.20 >=1.20
. and and and or
. Excl SD >0.9 >0.85 >0.80 <=0.80
0 2 6 20 2 (1.10)
Skewness WHZ Excl # <±0.2 <±0.4 <±0.6 >=±0.6
0 1 3 5 0 (0.06)
Kurtosis WHZ Excl # <±0.2 <±0.4 <±0.6 >=±0.6
0 1 3 5 0 (-0.19)
Poisson dist WHZ-2 Excl p >0.05 >0.01 >0.001 <=0.001
0 1 3 5 0 (p=)
OVERALL SCORE WHZ = 0-9 10-14 15-24 >25 19 %
The overall score of this survey is 19 %, this is acceptable.
There were no duplicate entries detected.
Percentage of children with no exact birthday: 100 %
Age/Height out of range for WHZ:
HEIGHT:
Line=518/ID=10316: 36.00 cm
Anthropometric Indices likely to be in error (-3 to 3 for WHZ, -3 to 3 for HAZ, -3 to 3 for WAZ,
from observed mean - chosen in Options panel - these values will be flagged and should be excluded
from analysis for a nutrition survey in emergencies. For other surveys this might not be the best
procedure e.g. when the percentage of overweight children has to be calculated):
Line=4/ID=12018: HAZ (1.918), Height may be incorrect
Line=10/ID=12313: HAZ (2.404), Age may be incorrect

103
Line=13/ID=12405: HAZ (4.651), WAZ (2.416), Age may be incorrect
Line=19/ID=10317: HAZ (3.203), Age may be incorrect
Line=31/ID=12404: HAZ (2.987), Age may be incorrect
Line=36/ID=12620: HAZ (2.483), Age may be incorrect
Line=45/ID=10321: WHZ (-5.759), HAZ (5.808), Height may be incorrect
Line=49/ID=10609: WHZ (-5.142), HAZ (6.967), Height may be incorrect
Line=52/ID=10417: HAZ (1.930), Age may be incorrect
Line=55/ID=12812: WHZ (9.262), HAZ (-8.256), Height may be incorrect
Line=56/ID=10617: HAZ (1.719), Height may be incorrect
Line=64/ID=12216: WHZ (2.912), Weight may be incorrect
Line=86/ID=10511: WHZ (-3.450), Height may be incorrect
Line=92/ID=10301: HAZ (18.630), Height may be incorrect
Line=95/ID=12203: WHZ (3.471), HAZ (-5.151), Height may be incorrect
Line=102/ID=12205: HAZ (3.645), Height may be incorrect
Line=103/ID=10404: HAZ (2.846), Age may be incorrect
Line=106/ID=11112: HAZ (1.776), Age may be incorrect
Line=114/ID=11620: HAZ (4.109), Height may be incorrect
Line=115/ID=11216: HAZ (2.802), WAZ (2.377), Age may be incorrect
Line=119/ID=12719: HAZ (4.705), Age may be incorrect
Line=128/ID=11604: HAZ (4.517), WAZ (3.119), Age may be incorrect
Line=135/ID=12707: HAZ (2.108), Age may be incorrect
Line=138/ID=12512: HAZ (2.702), WAZ (2.183), Age may be incorrect
Line=158/ID=11418: HAZ (1.608), Age may be incorrect
Line=166/ID=11613: HAZ (-5.035), Age may be incorrect
Line=178/ID=12807: WHZ (-3.660), WAZ (-3.974), Weight may be incorrect
Line=194/ID=11320: WHZ (8.890), WAZ (7.240), Weight may be incorrect
Line=198/ID=11314: WHZ (4.483), HAZ (-7.643), Height may be incorrect
Line=213/ID=11404: HAZ (-5.120), Age may be incorrect
Line=215/ID=11404: HAZ (-4.693), Age may be incorrect
Line=220/ID=10402: WHZ (-5.804), WAZ (-3.952), Weight may be incorrect

104
Line=227/ID=12406: HAZ (-7.702), WAZ (-5.784), Age may be incorrect
Line=230/ID=12903: WHZ (-5.615), HAZ (3.177), Height may be incorrect
Line=247/ID=11310: HAZ (2.767), Age may be incorrect
Line=259/ID=10208: HAZ (-5.604), Height may be incorrect
Line=262/ID=10203: HAZ (1.726), Age may be incorrect
Line=264/ID=12103: HAZ (2.005), Age may be incorrect
Line=275/ID=12116: HAZ (1.833), Age may be incorrect
Line=278/ID=10906: HAZ (1.838), Age may be incorrect
Line=292/ID=11319: WHZ (3.644), WAZ (2.282), Weight may be incorrect
Line=300/ID=10212: WHZ (6.691), WAZ (4.029), Weight may be incorrect
Line=313/ID=10818: HAZ (-4.953), Age may be incorrect
Line=317/ID=12415: HAZ (1.608), Age may be incorrect
Line=327/ID=12005: HAZ (-5.459), WAZ (-4.012), Age may be incorrect
Line=333/ID=10717: HAZ (1.905), Height may be incorrect
Line=343/ID=11702: HAZ (1.791), Age may be incorrect
Line=347/ID=10215: HAZ (-6.498), WAZ (-5.200), Age may be incorrect
Line=352/ID=12506: HAZ (-4.989), WAZ (-4.017), Age may be incorrect
Line=355/ID=10215: HAZ (-6.861), WAZ (-5.200), Age may be incorrect
Line=371/ID=12303: WHZ (3.135), Height may be incorrect
Line=380/ID=12901: HAZ (3.916), Age may be incorrect
Line=396/ID=12313: HAZ (-5.095), WAZ (-4.044), Age may be incorrect
Line=405/ID=11211: HAZ (1.902), WAZ (2.682), Age may be incorrect
Line=408/ID=11604: HAZ (-5.631), Age may be incorrect
Line=410/ID=11020: WHZ (3.633), Weight may be incorrect
Line=423/ID=12108: HAZ (-4.421), Age may be incorrect
Line=457/ID=10617: WHZ (3.427), Weight may be incorrect
Line=461/ID=12811: HAZ (-5.425), Age may be incorrect
Line=466/ID=12919: HAZ (-4.930), Age may be incorrect
Line=469/ID=11816: WHZ (-3.264), Weight may be incorrect
Line=473/ID=12809: HAZ (-4.416), WAZ (-3.934), Age may be incorrect

105
Line=486/ID=12310: WHZ (3.631), HAZ (-5.680), Height may be incorrect
Line=492/ID=10913: HAZ (-11.580), WAZ (-7.502), Age may be incorrect
Line=503/ID=12617: WHZ (5.142), HAZ (-6.524), Height may be incorrect
Line=509/ID=11017: WHZ (5.082), HAZ (-6.039), Height may be incorrect
Line=518/ID=10316: HAZ (-16.010), Height may be incorrect
Line=520/ID=11717: WHZ (-3.557), Weight may be incorrect
Line=527/ID=10616: WHZ (-3.691), Weight may be incorrect
Line=549/ID=12420: HAZ (-5.115), Age may be incorrect
Line=550/ID=12420: HAZ (-5.795), WAZ (-4.520), Age may be incorrect
Line=551/ID=12616: WHZ (3.160), Height may be incorrect
Line=557/ID=11713: WHZ (3.109), Height may be incorrect
Percentage of values flagged with SMART flags:WHZ: 4.4 %, HAZ: 10.4 %, WAZ: 3.4 %
Age distribution:
Month 6 : ####################
Month 7 : ############
Month 8 : ############
Month 9 : ###############
Month 10 : ################
Month 11 : #############
Month 12 : ###############
Month 13 : ############
Month 14 : ###############
Month 15 : ##########################
Month 16 : ##########
Month 17 : ##############
Month 18 : ############
Month 19 : ##############
Month 20 : #############
Month 21 : #############

106
Month 22 : #######
Month 23 : ##########
Month 24 : ######################
Month 25 : #########
Month 26 : ####################
Month 27 : ############
Month 28 : #########
Month 29 : ###########
Month 30 : ##############
Month 31 : ##########
Month 32 : #############
Month 33 : #########
Month 34 : ########
Month 35 : #########
Month 36 : ##########
Month 37 : ##########
Month 38 : ##########
Month 39 : #######
Month 40 : #######
Month 41 : #######
Month 42 : ########
Month 43 : #####
Month 44 : ####
Month 45 : #########
Month 46 : ######
Month 47 : ########
Month 48 : #####
Month 49 : ######
Month 50 : ########
Month 51 : ########

107
Month 52 : ###
Month 53 : ##########
Month 54 : ###########
Month 55 : ######
Month 56 : ######
Month 57 : #
Month 58 : ##
Month 59 : #######
Age ratio of 6-29 months to 30-59 months: 1.46 (The value should be around 0.85).
Statistical evaluation of sex and age ratios (using Chi squared statistic):
Age cat. mo. boys girls total ratio boys/girls
-------------------------------------------------------------------------------------
6 to 17 12 90/61.3 (1.5) 90/68.4 (1.3) 180/129.7 (1.4) 1.00
18 to 29 12 73/59.7 (1.2) 79/66.7 (1.2) 152/126.5 (1.2) 0.92
30 to 41 12 54/57.9 (0.9) 60/64.7 (0.9) 114/122.6 (0.9) 0.90
42 to 53 12 35/57.0 (0.6) 45/63.7 (0.7) 80/120.6 (0.7) 0.78
54 to 59 6 12/28.2 (0.4) 21/31.5 (0.7) 33/59.7 (0.6) 0.57
-------------------------------------------------------------------------------------
6 to 59 54 264/279.5 (0.9) 295/279.5 (1.1) 0.89
The data are expressed as observed number/expected number (ratio of obs/expect)
Overall sex ratio: p-value = 0.190 (boys and girls equally represented)
Overall age distribution: p-value = 0.000 (significant difference)
Overall age distribution for boys: p-value = 0.000 (significant difference)
Overall age distribution for girls: p-value = 0.001 (significant difference)
Overall sex/age distribution: p-value = 0.000 (significant difference)
Digit preference Weight:
Digit .0 : ###################################

108
Digit .1 : ########################
Digit .2 : ###########################
Digit .3 : ##########################
Digit .4 : ##########################
Digit .5 : ############################
Digit .6 : ##############################
Digit .7 : ############################
Digit .8 : ############################
Digit .9 : ###########################
Digit preference score: 3 (0-7 excellent, 8-12 good, 13-20 acceptable and > 20 problematic)
p-value for chi2: 0.737
Digit preference Height:
Digit .0 : ################################################
Digit .1 : ######################
Digit .2 : ######################################
Digit .3 : ##############################
Digit .4 : ########################
Digit .5 : ###########################
Digit .6 : ############################
Digit .7 : ########################
Digit .8 : ######################
Digit .9 : ###################
Digit preference score: 10 (0-7 excellent, 8-12 good, 13-20 acceptable and > 20 problematic)
p-value for chi2: 0.000 (significant difference)
Evaluation of Standard deviation, Normal distribution, Skewness and Kurtosis using the 3
exclusion (Flag) procedures
. no exclusion exclusion from exclusion from
. reference mean observed mean

109
. (WHO flags) (SMART flags)
WHZ
Standard Deviation SD: 1.49 1.23 1.10
(The SD should be between 0.8 and 1.2)
Prevalence (< -2)
observed: 6.7% 6.1% 5.3%
calculated with current SD: 10.7% 7.0% 5.2%
calculated with a SD of 1: 3.2% 3.4% 3.7%
HAZ
Standard Deviation SD: 2.16 1.70 1.25
(The SD should be between 0.8 and 1.2)
Prevalence (< -2)
observed: 32.7% 31.8% 31.3%
calculated with current SD: 39.1% 34.9% 33.2%
calculated with a SD of 1: 27.6% 25.4% 29.3%
WAZ
Standard Deviation SD: 1.35 1.27 1.12
(The SD should be between 0.8 and 1.2)
Prevalence (< -2)
observed: 17.4% 17.3% 15.9%
calculated with current SD: 21.2% 19.9% 16.4%
calculated with a SD of 1: 14.1% 14.1% 13.7%
Results for Shapiro-Wilk test for normally (Gaussian) distributed data:
WHZ p= 0.000 p= 0.001 p= 0.374
HAZ p= 0.000 p= 0.000 p= 0.009
WAZ p= 0.000 p= 0.002 p= 0.202
(If p < 0.05 then the data are not normally distributed. If p > 0.05 you can consider the data
normally distributed)
Skewness
WHZ 0.98 0.28 0.06
HAZ 0.83 0.46 -0.07
WAZ 0.08 -0.12 -0.08
If the value is:
-below minus 0.4 there is a relative excess of wasted/stunted/underweight subjects in the sample
-between minus 0.4 and minus 0.2, there may be a relative excess of wasted/stunted/underweight
subjects in the sample.
-between minus 0.2 and plus 0.2, the distribution can be considered as symmetrical.

110
-between 0.2 and 0.4, there may be an excess of obese/tall/overweight subjects in the sample.
-above 0.4, there is an excess of obese/tall/overweight subjects in the sample
Kurtosis
WHZ 6.93 0.74 -0.19
HAZ 17.90 1.41 -0.38
WAZ 3.71 1.01 -0.17
Kurtosis characterizes the relative size of the body versus the tails of the distribution.
Positive kurtosis indicates relatively large tails and small body. Negative kurtosis indicates
relatively large body and small tails.
If the absolute value is:
-above 0.4 it indicates a problem. There might have been a problem with data collection or
sampling.
-between 0.2 and 0.4, the data may be affected with a problem.
-less than an absolute value of 0.2 the distribution can be considered as normal.
Are the data of the same quality at the beginning and the end of the clusters?
Evaluation of the SD for WHZ depending upon the order the cases are measured within each cluster (if
one cluster per day is measured then this will be related to the time of the day the measurement is made).
Time SD for WHZ
point 0.8 0.9 1.0 1.1 1.2 1.3 1.4 1.5 1.6 1.7 1.8 1.9 2.0 2.1 2.2 2.3
(when n is much less than the average number of subjects per cluster different symbols are used:
0 for n < 80% and ~ for n < 40%; The numbers marked "f" are the numbers of SMART flags found in
the different time points)
Analysis by Team
Team 1 999
n = 1 558
Percentage of values flagged with SMART flags:
WHZ: 0.0 6.2
HAZ: 0.0 10.4
WAZ: 0.0 4.7
Age ratio of 6-29 months to 30-59 months:
1.46
Sex ratio (male/female):

111
0.89
Digit preference Weight (%):
.0 : 0 13
.1 : 0 9
.2 : 0 10
.3 : 0 9
.4 : 0 9
.5 : 0 10
.6 : 0 11
.7 : 100 10
.8 : 0 10
.9 : 0 10
DPS: 100 3
Digit preference score (0-7 excellent, 8-12 good, 13-20 acceptable and > 20 problematic)
Digit preference Height (%):
.0 : 0 17
.1 : 0 8
.2 : 0 14
.3 : 0 11
.4 : 0 8
.5 : 0 10
.6 : 0 10
.7 : 100 8
.8 : 0 8
.9 : 0 7
DPS: 100 10
Digit preference score (0-7 excellent, 8-12 good, 13-20 acceptable and > 20 problematic)
Standard deviation of WHZ:
SD 0.00
Prevalence (< -2) observed: %

112
Prevalence (< -2) calculated with current SD: %
Prevalence (< -2) calculated with a SD of 1: %
Standard deviation of HAZ:
SD 0.00
observed: %
calculated with current SD: %
calculated with a SD of 1: %
Statistical evaluation of sex and age ratios (using Chi squared statistic) for:
Team 1:
Age cat. mo. boys girls total ratio boys/girls
-------------------------------------------------------------------------------------
6 to 17 12 1/0.2 (4.3) 0/0.0 1/0.2
18 to 29 12 0/0.2 (0.0) 0/0.0 0/0.2
30 to 41 12 0/0.2 (0.0) 0/0.0 0/0.2
42 to 53 12 0/0.2 (0.0) 0/0.0 0/0.2
54 to 59 6 0/0.1 (0.0) 0/0.0 0/0.1
-------------------------------------------------------------------------------------
6 to 59 54 1/0.5 (2.0) 0/0.5 (0.0)
The data are expressed as observed number/expected number (ratio of obs/expect)
Overall sex ratio: p-value = 0.317 (boys and girls equally represented)
Overall age distribution: p-value = 0.507 (as expected)
Overall age distribution for boys: p-value = 0.507 (as expected)
Overall sex/age distribution: p-value = 0.107 (as expected)
Team 2:
Age cat. mo. boys girls total ratio boys/girls
-------------------------------------------------------------------------------------
6 to 17 12 0/0.0 0/0.0 0/0.0
18 to 29 12 0/0.0 0/0.0 0/0.0
30 to 41 12 0/0.0 0/0.0 0/0.0
42 to 53 12 0/0.0 0/0.0 0/0.0
54 to 59 6 0/0.0 0/0.0 0/0.0
-------------------------------------------------------------------------------------

113
6 to 59 54 0/0.0 0/0.0
The data are expressed as observed number/expected number (ratio of obs/expect)
Evaluation of the SD for WHZ depending upon the order the cases are measured within each
cluster (if one cluster per day is measured then this will be related to the time of the day the
measurement is made).
Team: 1
Time SD for WHZ
point 0.8 0.9 1.0 1.1 1.2 1.3 1.4 1.5 1.6 1.7 1.8 1.9 2.0 2.1 2.2 2.3
(when n is much less than the average number of subjects per cluster different symbols are used:
0 for n < 80% and ~ for n < 40%; The numbers marked "f" are the numbers of SMART flags found in
the different time points)
Team: 2
(for better comparison it can be helpful to copy/paste part of this report into Excel)
Amudat
Model nutrition assessment report - Amudat (based on the Save the Children Fund emergency nutrition assessment handbook)
Executive summary (one to two pages only)
GAM: 12.2 % (9.4 - 15.7 95% C.I.)
SAM : 3.8 % (2.3 - 6.0 95% C.I.)
3. Results 3.1 Anthropometric results (based on WHO standards 2006):
Definitions of acute malnutrition should be given (for example, global acute malnutrition is defined as <-2 z scores weight-for-height and/or oedema, severe acute malnutrition is defined as <-3z scores weight-for-height and/or oedema) Exclusion of z-scores from Zero (reference mean) WHO flags: WHZ -5 to 5; HAZ -6 to 6; WAZ -6 to 5 Table 3.1: Distribution of age and sex of sample
Boys Girls Total Ratio

114
AGE (mo) no. % no. % no. % Boy:girl
6-17 73 48.7 77 51.3 150 34.7 0.9
18-29 63 51.6 59 48.4 122 28.2 1.1
30-41 41 49.4 42 50.6 83 19.2 1.0
42-53 30 52.6 27 47.4 57 13.2 1.1
54-59 9 45.0 11 55.0 20 4.6 0.8
Total 216 50.0 216 50.0 432 100.0 1.0
Table 3.2: Prevalence of acute malnutrition based on weight-for-height z-scores (and/or oedema) and by sex
All
n = 426
Boys
n = 213
Girls
n = 213
Prevalence of global
malnutrition
(<-2 z-score and/or oedema)
(52) 12.2 %
(9.4 - 15.7
95% C.I.)
(35) 16.4 %
(12.1 - 22.0
95% C.I.)
(17) 8.0 %
(5.0 - 12.4
95% C.I.)
Prevalence of moderate
malnutrition
(<-2 z-score and >=-3 z-score, no
oedema)
(36) 8.5 %
(6.2 - 11.5
95% C.I.)
(24) 11.3 %
(7.7 - 16.2
95% C.I.)
(12) 5.6 %
(3.3 - 9.6
95% C.I.)
Prevalence of severe
malnutrition
(<-3 z-score and/or oedema)
(16) 3.8 %
(2.3 - 6.0
95% C.I.)
(11) 5.2 %
(2.9 - 9.0
95% C.I.)
(5) 2.3 %
(1.0 - 5.4
95% C.I.)
The prevalence of oedema is 0.2 %
Table 3.3: Prevalence of acute malnutrition by age, based on weight-for-height z-scores and/or oedema
Severe wasting
(<-3 z-score)
Moderate
wasting
(>= -3 and <-2
z-score )
Normal
(> = -2 z score)
Oedema
Age
(mo)
Total
no.
No. % No. % No. % No. %
6-17 150 7 4.7 14 9.3 129 86.0 0 0.0
18-29 119 3 2.5 5 4.2 110 92.4 1 0.8
30-41 82 3 3.7 11 13.4 68 82.9 0 0.0
42-53 55 1 1.8 4 7.3 50 90.9 0 0.0
54-59 20 1 5.0 2 10.0 17 85.0 0 0.0
Total 426 15 3.5 36 8.5 374 87.8 1 0.2

115
Table 3.4: Distribution of acute malnutrition and oedema based on weight-for-height z-scores
<-3 z-score >=-3 z-score
Oedema present Marasmic kwashiorkor
No. 0
(0.0 %)
Kwashiorkor
No. 1
(0.2 %)
Oedema absent Marasmic
No. 17
(4.0 %)
Not severely malnourished
No. 412
(95.8 %)
Table 3.7: Prevalence of underweight based on weight-for-age z-scores by sex
All
n = 431
Boys
n = 216
Girls
n = 215
Prevalence of underweight
(<-2 z-score)
(94) 21.8 %
(18.2 - 25.9
95% C.I.)
(50) 23.1 %
(18.0 - 29.2
95% C.I.)
(44) 20.5 %
(15.6 - 26.4
95% C.I.)
Prevalence of moderate
underweight
(<-2 z-score and >=-3 z-score)
(56) 13.0 %
(10.1 - 16.5
95% C.I.)
(27) 12.5 %
(8.7 - 17.6
95% C.I.)
(29) 13.5 %
(9.6 - 18.7
95% C.I.)
Prevalence of severe
underweight
(<-3 z-score)
(38) 8.8 %
(6.5 - 11.9
95% C.I.)
(23) 10.6 %
(7.2 - 15.5
95% C.I.)
(15) 7.0 %
(4.3 - 11.2
95% C.I.)
Table 3.8: Prevalence of underweight by age, based on weight-for-age z-scores
Severe
underweight
(<-3 z-score)
Moderate
underweight
(>= -3 and <-2
z-score )
Normal
(> = -2 z score)
Oedema
Age
(mo)
Total
no.
No. % No. % No. % No. %
6-17 150 11 7.3 12 8.0 127 84.7 0 0.0
18-29 121 7 5.8 18 14.9 96 79.3 1 0.8
30-41 83 10 12.0 12 14.5 61 73.5 0 0.0
42-53 57 5 8.8 10 17.5 42 73.7 0 0.0
54-59 20 5 25.0 4 20.0 11 55.0 0 0.0

116
Total 431 38 8.8 56 13.0 337 78.2 1 0.2
Table 3.9: Prevalence of stunting based on height-for-age z-scores and by sex
All
n = 424
Boys
n = 212
Girls
n = 212
Prevalence of stunting
(<-2 z-score)
(118) 27.8 %
(23.8 - 32.3
95% C.I.)
(64) 30.2 %
(24.4 - 36.7
95% C.I.)
(54) 25.5 %
(20.1 - 31.7
95% C.I.)
Prevalence of moderate stunting
(<-2 z-score and >=-3 z-score)
(61) 14.4 %
(11.4 - 18.0
95% C.I.)
(40) 18.9 %
(14.2 - 24.7
95% C.I.)
(21) 9.9 %
(6.6 - 14.7
95% C.I.)
Prevalence of severe stunting
(<-3 z-score)
(57) 13.4 %
(10.5 - 17.0
95% C.I.)
(24) 11.3 %
(7.7 - 16.3
95% C.I.)
(33) 15.6 %
(11.3 - 21.1
95% C.I.)
Table 3.10: Prevalence of stunting by age based on height-for-age z-scores
Severe
stunting
(<-3 z-score)
Moderate
stunting
(>= -3 and <-2
z-score )
Normal
(> = -2 z score)
Age
(mo)
Total
no.
No. % No. % No. %
6-17 147 15 10.2 11 7.5 121 82.3
18-29 121 17 14.0 26 21.5 78 64.5
30-41 80 12 15.0 10 12.5 58 72.5
42-53 56 8 14.3 9 16.1 39 69.6
54-59 20 5 25.0 5 25.0 10 50.0
Total 424 57 13.4 61 14.4 306 72.2
Table 3.11: Prevalence of overweight based on weight for height cut off's and by sex (no oedema)
All
n = 426
Boys
n = 213
Girls
n = 213
Prevalence of overweight (WHZ
> 2)
(8) 1.9 % (3) 1.4 % (5) 2.3 %

117
(1.0 - 3.7
95% C.I.)
(0.5 - 4.1
95% C.I.)
(1.0 - 5.4
95% C.I.)
Prevalence of severe overweight
(WHZ > 3)
(4) 0.9 %
(0.4 - 2.4
95% C.I.)
(0) 0.0 %
(0.0 - 1.8
95% C.I.)
(4) 1.9 %
(0.7 - 4.7
95% C.I.)
Table 3.12: Prevalence of overweight by age, based on weight for height (no oedema)
Overweight
(WHZ > 2)
Severe
Overweight
(WHZ > 3)
Age
(mo)
Total
no.
No. % No. %
6-17 150 2 1.3 1 0.7
18-29 119 3 2.5 2 1.7
30-41 82 2 2.4 1 1.2
42-53 55 1 1.8 0 0.0
54-59 20 0 0.0 0 0.0
Total 426 8 1.9 4 0.9
Table 3.13: Mean z-scores, Design Effects and excluded subjects
Indicator n Mean z-scores ±
SD
Design Effect (z-
score < -2)
z-scores not
available*
z-scores out of range
Weight-for-Height
425 -0.70±1.21 1.00 3 4
Weight-for-Age 431 -1.16±1.24 1.00 1 0
Height-for-Age 424 -1.13±1.75 1.00 2 6 * contains for WHZ and WAZ the children with edema.
Appendix 4
Result Tables for NCHS growth reference 1977
Table 3.2: Prevalence of acute malnutrition based on weight-for-height z-scores (and/or
oedema) and by sex
All
n = 427
Boys
n = 214
Girls
n = 213

118
Prevalence of global
malnutrition
(<-2 z-score and/or oedema)
(55) 12.9 %
(10.0 - 16.4
95% C.I.)
(37) 17.3 %
(12.8 - 22.9
95% C.I.)
(18) 8.5 %
(5.4 - 13.0
95% C.I.)
Prevalence of moderate
malnutrition
(<-2 z-score and >=-3 z-score, no
oedema)
(48) 11.2 %
(8.6 - 14.6
95% C.I.)
(32) 15.0 %
(10.8 - 20.3
95% C.I.)
(16) 7.5 %
(4.7 - 11.9
95% C.I.)
Prevalence of severe
malnutrition
(<-3 z-score and/or oedema)
(7) 1.6 %
(0.8 - 3.3
95% C.I.)
(5) 2.3 %
(1.0 - 5.4
95% C.I.)
(2) 0.9 %
(0.3 - 3.4
95% C.I.)
The prevalence of oedema is 0.2 %
Table 3.3: Prevalence of acute malnutrition by age, based on weight-for-height z-scores and/or oedema
Severe wasting
(<-3 z-score)
Moderate
wasting
(>= -3 and <-2
z-score )
Normal
(> = -2 z score)
Oedema
Age
(mo)
Total
no.
No. % No. % No. % No. %
6-17 149 3 2.0 18 12.1 128 85.9 0 0.0
18-29 120 1 0.8 11 9.2 107 89.2 1 0.8
30-41 83 1 1.2 12 14.5 70 84.3 0 0.0
42-53 55 0 0.0 5 9.1 50 90.9 0 0.0
54-59 20 1 5.0 2 10.0 17 85.0 0 0.0
Total 427 6 1.4 48 11.2 372 87.1 1 0.2
Table 3.4: Distribution of acute malnutrition and oedema based on weight-for-height z-scores
<-3 z-score >=-3 z-score
Oedema present Marasmic kwashiorkor
No. 0
(0.0 %)
Kwashiorkor
No. 1
(0.2 %)
Oedema absent Marasmic
No. 7
Not severely malnourished
No. 422

119
(1.6 %) (98.1 %)
Table 3.5: Prevalence of acute malnutrition based on the percentage of the median and/or oedema
n = 427
Prevalence of global acute
malnutrition
(<80% and/or oedema)
(30) 7.0 %
(5.0 - 9.9 95%
C.I.)
Prevalence of moderate acute
malnutrition
(<80% and >= 70%, no oedema)
(26) 6.1 %
(4.2 - 8.8 95%
C.I.)
Prevalence of severe acute
malnutrition
(<70% and/or oedema)
(4) 0.9 %
(0.4 - 2.4 95%
C.I.)
Table 3.6: Prevalence of malnutrition by age, based on weight-for-height percentage of the median and oedema
Severe
wasting
(<70% median)
Moderate
wasting
(>=70% and
<80% median)
Normal
(> =80%
median)
Oedema
Age
(mo)
Total
no.
No. % No. % No. % No. %
6-17 149 0 0.0 10 6.7 139 93.3 0 0.0
18-29 120 1 0.8 5 4.2 113 94.2 1 0.8
30-41 83 1 1.2 8 9.6 74 89.2 0 0.0
42-53 55 0 0.0 2 3.6 53 96.4 0 0.0
54-59 20 1 5.0 1 5.0 18 90.0 0 0.0
Total 427 3 0.7 26 6.1 397 93.0 1 0.2
Table 3.7: Prevalence of underweight based on weight-for-age z-scores by sex
All
n = 431
Boys
n = 216
Girls
n = 215
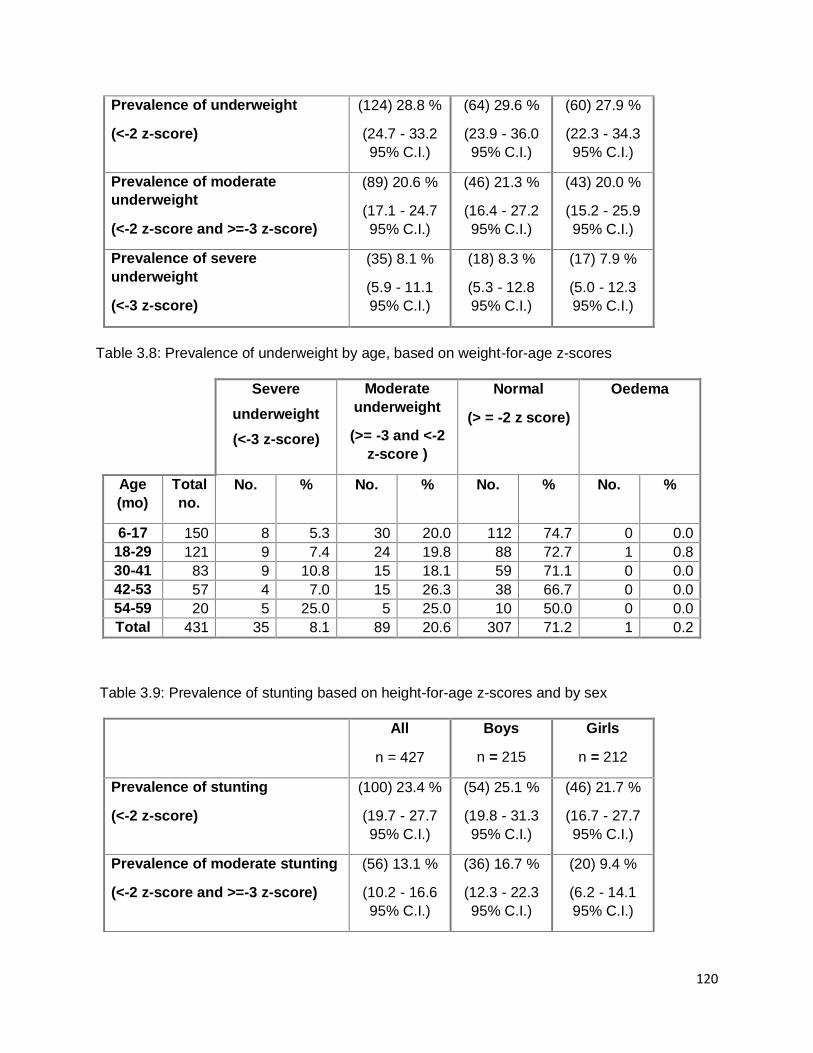
120
Prevalence of underweight
(<-2 z-score)
(124) 28.8 %
(24.7 - 33.2
95% C.I.)
(64) 29.6 %
(23.9 - 36.0
95% C.I.)
(60) 27.9 %
(22.3 - 34.3
95% C.I.)
Prevalence of moderate
underweight
(<-2 z-score and >=-3 z-score)
(89) 20.6 %
(17.1 - 24.7
95% C.I.)
(46) 21.3 %
(16.4 - 27.2
95% C.I.)
(43) 20.0 %
(15.2 - 25.9
95% C.I.)
Prevalence of severe
underweight
(<-3 z-score)
(35) 8.1 %
(5.9 - 11.1
95% C.I.)
(18) 8.3 %
(5.3 - 12.8
95% C.I.)
(17) 7.9 %
(5.0 - 12.3
95% C.I.)
Table 3.8: Prevalence of underweight by age, based on weight-for-age z-scores
Severe
underweight
(<-3 z-score)
Moderate
underweight
(>= -3 and <-2
z-score )
Normal
(> = -2 z score)
Oedema
Age
(mo)
Total
no.
No. % No. % No. % No. %
6-17 150 8 5.3 30 20.0 112 74.7 0 0.0
18-29 121 9 7.4 24 19.8 88 72.7 1 0.8
30-41 83 9 10.8 15 18.1 59 71.1 0 0.0
42-53 57 4 7.0 15 26.3 38 66.7 0 0.0
54-59 20 5 25.0 5 25.0 10 50.0 0 0.0
Total 431 35 8.1 89 20.6 307 71.2 1 0.2
Table 3.9: Prevalence of stunting based on height-for-age z-scores and by sex
All
n = 427
Boys
n = 215
Girls
n = 212
Prevalence of stunting
(<-2 z-score)
(100) 23.4 %
(19.7 - 27.7
95% C.I.)
(54) 25.1 %
(19.8 - 31.3
95% C.I.)
(46) 21.7 %
(16.7 - 27.7
95% C.I.)
Prevalence of moderate stunting
(<-2 z-score and >=-3 z-score)
(56) 13.1 %
(10.2 - 16.6
95% C.I.)
(36) 16.7 %
(12.3 - 22.3
95% C.I.)
(20) 9.4 %
(6.2 - 14.1
95% C.I.)

121
Prevalence of severe stunting
(<-3 z-score)
(44) 10.3 %
(7.8 - 13.6
95% C.I.)
(18) 8.4 %
(5.4 - 12.8
95% C.I.)
(26) 12.3 %
(8.5 - 17.4
95% C.I.)
Table 3.10: Prevalence of stunting by age based on height-for-age z-scores
Severe
stunting
(<-3 z-score)
Moderate
stunting
(>= -3 and <-2
z-score )
Normal
(> = -2 z score)
Age
(mo)
Total
no.
No. % No. % No. %
6-17 150 11 7.3 14 9.3 125 83.3
18-29 121 9 7.4 23 19.0 89 73.6
30-41 81 13 16.0 6 7.4 62 76.5
42-53 55 6 10.9 8 14.5 41 74.5
54-59 20 5 25.0 5 25.0 10 50.0
Total 427 44 10.3 56 13.1 327 76.6
Table 3.11: Prevalence of overweight based on weight for height cut off's and by sex (no oedema)
All
n = 427
Boys
n = 214
Girls
n = 213
Prevalence of overweight (WHZ
> 2)
(5) 1.2 %
(0.5 - 2.7
95% C.I.)
(1) 0.5 %
(0.1 - 2.6
95% C.I.)
(4) 1.9 %
(0.7 - 4.7
95% C.I.)
Prevalence of severe overweight
(WHZ > 3)
(1) 0.2 %
(0.0 - 1.3
95% C.I.)
(0) 0.0 %
(0.0 - 1.8
95% C.I.)
(1) 0.5 %
(0.1 - 2.6
95% C.I.)
Table 3.12: Prevalence of overweight by age, based on weight for height (no oedema)
Overweight
(WHZ > 2)
Severe
Overweight
(WHZ > 3)

122
Age
(mo)
Total
no.
No. % No. %
6-17 149 1 0.7 0 0.0
18-29 120 2 1.7 0 0.0
30-41 83 2 2.4 1 1.2
42-53 55 0 0.0 0 0.0
54-59 20 0 0.0 0 0.0
Total 427 5 1.2 1 0.2
Table 3.13: Mean z-scores, Design Effects and excluded subjects
Indicator n Mean z-scores ±
SD
Design Effect (z-
score < -2)
z-scores not
available*
z-scores out of range
Weight-for-Height
426 -0.89±1.04 1.00 3 3
Weight-for-Age 431 -1.37±1.16 1.00 1 0
Height-for-Age 427 -0.97±1.73 1.00 2 3 * contains for WHZ and WAZ the children with edema.
Plausibility check for: noname.as
Standard/Reference used for z-score calculation: WHO standards 2006
(If it is not mentioned, flagged data is included in the evaluation. Some parts of this plausibility report are
more for advanced users and can be skipped for a standard evaluation)
Overall data quality
Criteria Flags* Unit Excel. Good Accept Problematic Score
Flagged data Incl % 0-2.5 >2.5-5.0 >5.0-7.5 >7.5
(% of in-range subjects) 0 5 10 20 5 (3.1 %)
Overall Sex ratio Incl p >0.1 >0.05 >0.001 <=0.001
(Significant chi square) 0 2 4 10 0 (p=1.000)
Overall Age distrib Incl p >0.1 >0.05 >0.001 <=0.001
(Significant chi square) 0 2 4 10 10 (p=0.000)
Dig pref score - weight Incl # 0-7 8-12 13-20 > 20
0 2 4 10 0 (6)
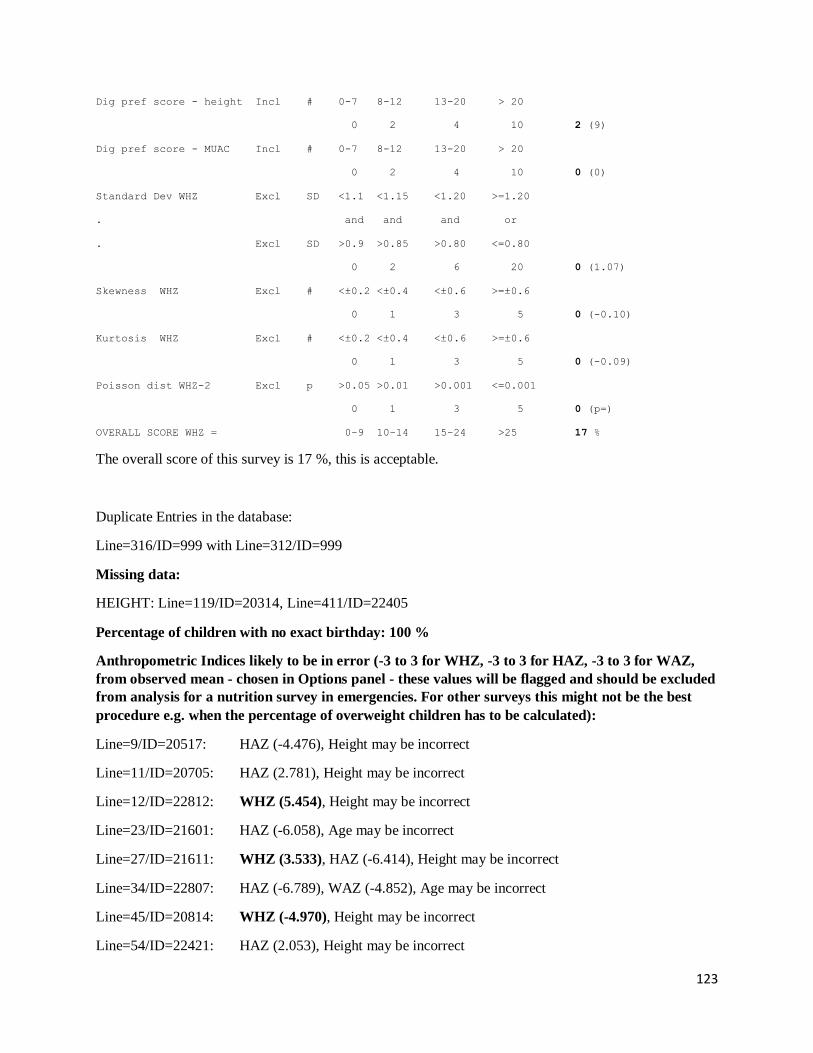
123
Dig pref score - height Incl # 0-7 8-12 13-20 > 20
0 2 4 10 2 (9)
Dig pref score - MUAC Incl # 0-7 8-12 13-20 > 20
0 2 4 10 0 (0)
Standard Dev WHZ Excl SD <1.1 <1.15 <1.20 >=1.20
. and and and or
. Excl SD >0.9 >0.85 >0.80 <=0.80
0 2 6 20 0 (1.07)
Skewness WHZ Excl # <±0.2 <±0.4 <±0.6 >=±0.6
0 1 3 5 0 (-0.10)
Kurtosis WHZ Excl # <±0.2 <±0.4 <±0.6 >=±0.6
0 1 3 5 0 (-0.09)
Poisson dist WHZ-2 Excl p >0.05 >0.01 >0.001 <=0.001
0 1 3 5 0 (p=)
OVERALL SCORE WHZ = 0-9 10-14 15-24 >25 17 %
The overall score of this survey is 17 %, this is acceptable.
Duplicate Entries in the database:
Line=316/ID=999 with Line=312/ID=999
Missing data:
HEIGHT: Line=119/ID=20314, Line=411/ID=22405
Percentage of children with no exact birthday: 100 %
Anthropometric Indices likely to be in error (-3 to 3 for WHZ, -3 to 3 for HAZ, -3 to 3 for WAZ,
from observed mean - chosen in Options panel - these values will be flagged and should be excluded
from analysis for a nutrition survey in emergencies. For other surveys this might not be the best
procedure e.g. when the percentage of overweight children has to be calculated):
Line=9/ID=20517: HAZ (-4.476), Height may be incorrect
Line=11/ID=20705: HAZ (2.781), Height may be incorrect
Line=12/ID=22812: WHZ (5.454), Height may be incorrect
Line=23/ID=21601: HAZ (-6.058), Age may be incorrect
Line=27/ID=21611: WHZ (3.533), HAZ (-6.414), Height may be incorrect
Line=34/ID=22807: HAZ (-6.789), WAZ (-4.852), Age may be incorrect
Line=45/ID=20814: WHZ (-4.970), Height may be incorrect
Line=54/ID=22421: HAZ (2.053), Height may be incorrect

124
Line=61/ID=21713: HAZ (5.143), Height may be incorrect
Line=62/ID=22625: HAZ (3.663), Age may be incorrect
Line=71/ID=22524: WHZ (-5.304), Weight may be incorrect
Line=78/ID=23007: HAZ (4.570), Age may be incorrect
Line=81/ID=23012: HAZ (3.121), Age may be incorrect
Line=86/ID=21410: HAZ (3.611), Age may be incorrect
Line=94/ID=22717: HAZ (2.210), Age may be incorrect
Line=97/ID=22605: WHZ (3.647), Weight may be incorrect
Line=114/ID=21409: WHZ (2.675), HAZ (-4.581), Height may be incorrect
Line=125/ID=21618: HAZ (-5.393), Age may be incorrect
Line=130/ID=23012: HAZ (-5.416), WAZ (-4.167), Age may be incorrect
Line=141/ID=22616: WHZ (-4.077), HAZ (-5.166), WAZ (-5.220)
Line=143/ID=20218: HAZ (-5.465), Age may be incorrect
Line=149/ID=20217: HAZ (-4.653), Age may be incorrect
Line=156/ID=22812: WHZ (7.286), HAZ (-5.872), Height may be incorrect
Line=166/ID=21024: HAZ (2.200), Height may be incorrect
Line=170/ID=22018: HAZ (-4.183), Age may be incorrect
Line=172/ID=21910: WHZ (2.429), HAZ (-4.726), Height may be incorrect
Line=175/ID=20808: HAZ (-4.388), Age may be incorrect
Line=186/ID=20712: HAZ (-4.474), Age may be incorrect
Line=188/ID=22010: HAZ (-4.811), Height may be incorrect
Line=192/ID=20318: HAZ (-4.275), Age may be incorrect
Line=204/ID=20210: HAZ (1.913), Age may be incorrect
Line=207/ID=22802: HAZ (-5.695), WAZ (-4.881), Age may be incorrect
Line=243/ID=21008: HAZ (2.547), Height may be incorrect
Line=250/ID=20203: HAZ (3.222), Age may be incorrect
Line=266/ID=21001: HAZ (2.088), Age may be incorrect
Line=267/ID=21619: HAZ (-4.520), WAZ (-4.505), Age may be incorrect
Line=288/ID=20811: HAZ (-4.271), Age may be incorrect
Line=292/ID=21816: HAZ (-4.504), Age may be incorrect
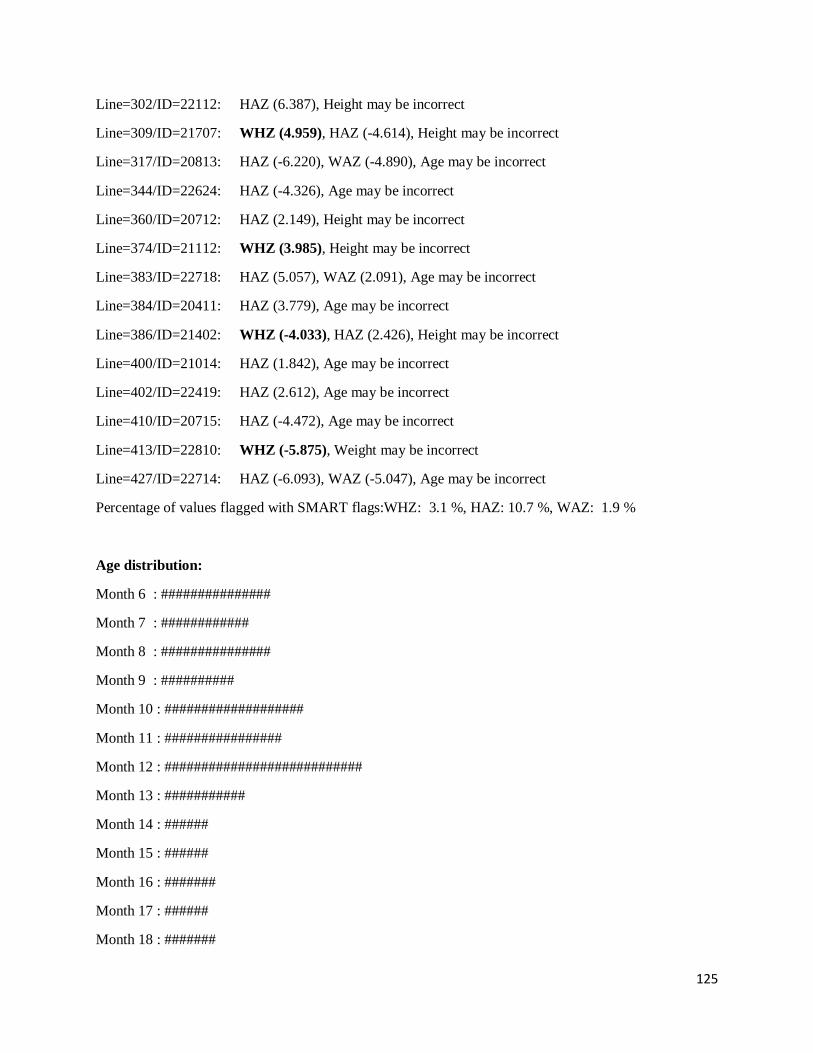
125
Line=302/ID=22112: HAZ (6.387), Height may be incorrect
Line=309/ID=21707: WHZ (4.959), HAZ (-4.614), Height may be incorrect
Line=317/ID=20813: HAZ (-6.220), WAZ (-4.890), Age may be incorrect
Line=344/ID=22624: HAZ (-4.326), Age may be incorrect
Line=360/ID=20712: HAZ (2.149), Height may be incorrect
Line=374/ID=21112: WHZ (3.985), Height may be incorrect
Line=383/ID=22718: HAZ (5.057), WAZ (2.091), Age may be incorrect
Line=384/ID=20411: HAZ (3.779), Age may be incorrect
Line=386/ID=21402: WHZ (-4.033), HAZ (2.426), Height may be incorrect
Line=400/ID=21014: HAZ (1.842), Age may be incorrect
Line=402/ID=22419: HAZ (2.612), Age may be incorrect
Line=410/ID=20715: HAZ (-4.472), Age may be incorrect
Line=413/ID=22810: WHZ (-5.875), Weight may be incorrect
Line=427/ID=22714: HAZ (-6.093), WAZ (-5.047), Age may be incorrect
Percentage of values flagged with SMART flags:WHZ: 3.1 %, HAZ: 10.7 %, WAZ: 1.9 %
Age distribution:
Month 6 : ###############
Month 7 : ############
Month 8 : ###############
Month 9 : ##########
Month 10 : ###################
Month 11 : ################
Month 12 : ###########################
Month 13 : ###########
Month 14 : ######
Month 15 : ######
Month 16 : #######
Month 17 : ######
Month 18 : #######
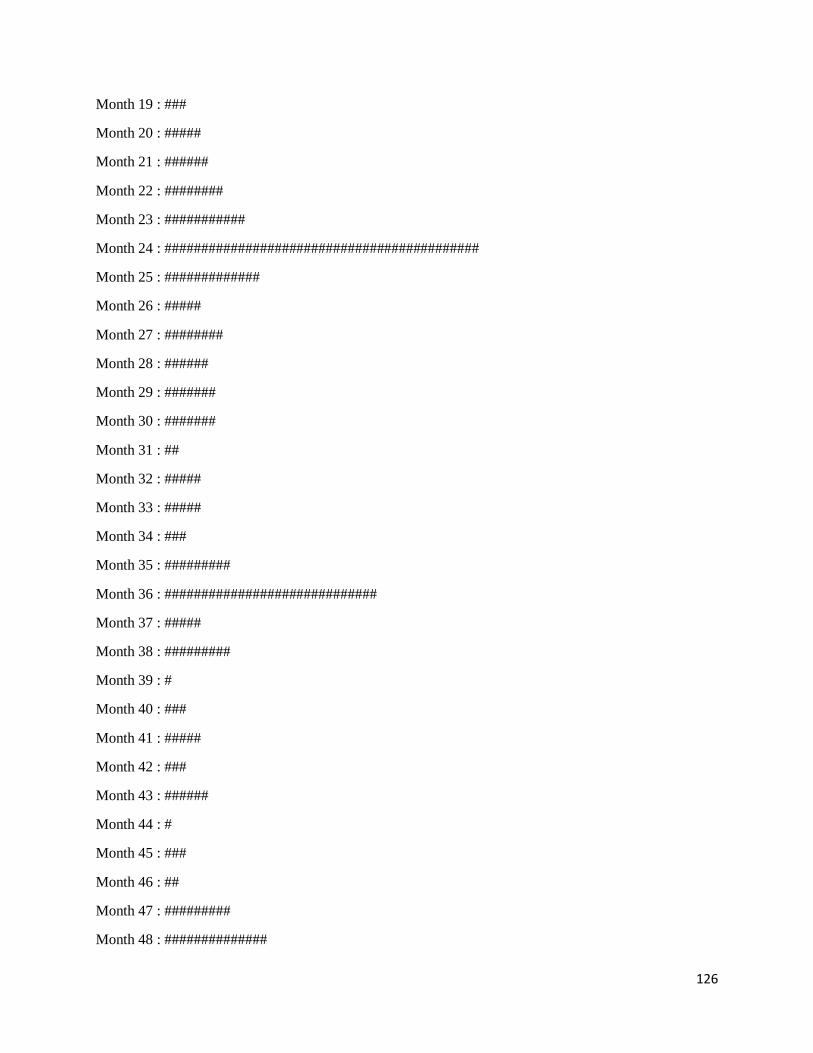
126
Month 19 : ###
Month 20 : #####
Month 21 : ######
Month 22 : ########
Month 23 : ###########
Month 24 : ###########################################
Month 25 : #############
Month 26 : #####
Month 27 : ########
Month 28 : ######
Month 29 : #######
Month 30 : #######
Month 31 : ##
Month 32 : #####
Month 33 : #####
Month 34 : ###
Month 35 : #########
Month 36 : #############################
Month 37 : #####
Month 38 : #########
Month 39 : #
Month 40 : ###
Month 41 : #####
Month 42 : ###
Month 43 : ######
Month 44 : #
Month 45 : ###
Month 46 : ##
Month 47 : #########
Month 48 : ##############

127
Month 49 : ########
Month 50 : ##
Month 51 : ###
Month 52 : #
Month 53 : #####
Month 54 : ##
Month 55 : #
Month 56 : ###
Month 57 : #
Month 58 : ######
Month 59 : #######
Age ratio of 6-29 months to 30-59 months: 1.70 (The value should be around 0.85).
Statistical evaluation of sex and age ratios (using Chi squared statistic):
Age cat. mo. boys girls total ratio boys/girls
-------------------------------------------------------------------------------------
6 to 17 12 73/50.1 (1.5) 77/50.1 (1.5) 150/100.2 (1.5) 0.95
18 to 29 12 63/48.9 (1.3) 59/48.9 (1.2) 122/97.7 (1.2) 1.07
30 to 41 12 41/47.4 (0.9) 42/47.4 (0.9) 83/94.7 (0.9) 0.98
42 to 53 12 30/46.6 (0.6) 27/46.6 (0.6) 57/93.2 (0.6) 1.11
54 to 59 6 9/23.1 (0.4) 11/23.1 (0.5) 20/46.1 (0.4) 0.82
-------------------------------------------------------------------------------------
6 to 59 54 216/216.0 (1.0) 216/216.0 (1.0) 1.00
The data are expressed as observed number/expected number (ratio of obs/expect)
Overall sex ratio: p-value = 1.000 (boys and girls equally represented)
Overall age distribution: p-value = 0.000 (significant difference)
Overall age distribution for boys: p-value = 0.000 (significant difference)
Overall age distribution for girls: p-value = 0.000 (significant difference)
Overall sex/age distribution: p-value = 0.000 (significant difference)
Digit preference Weight:
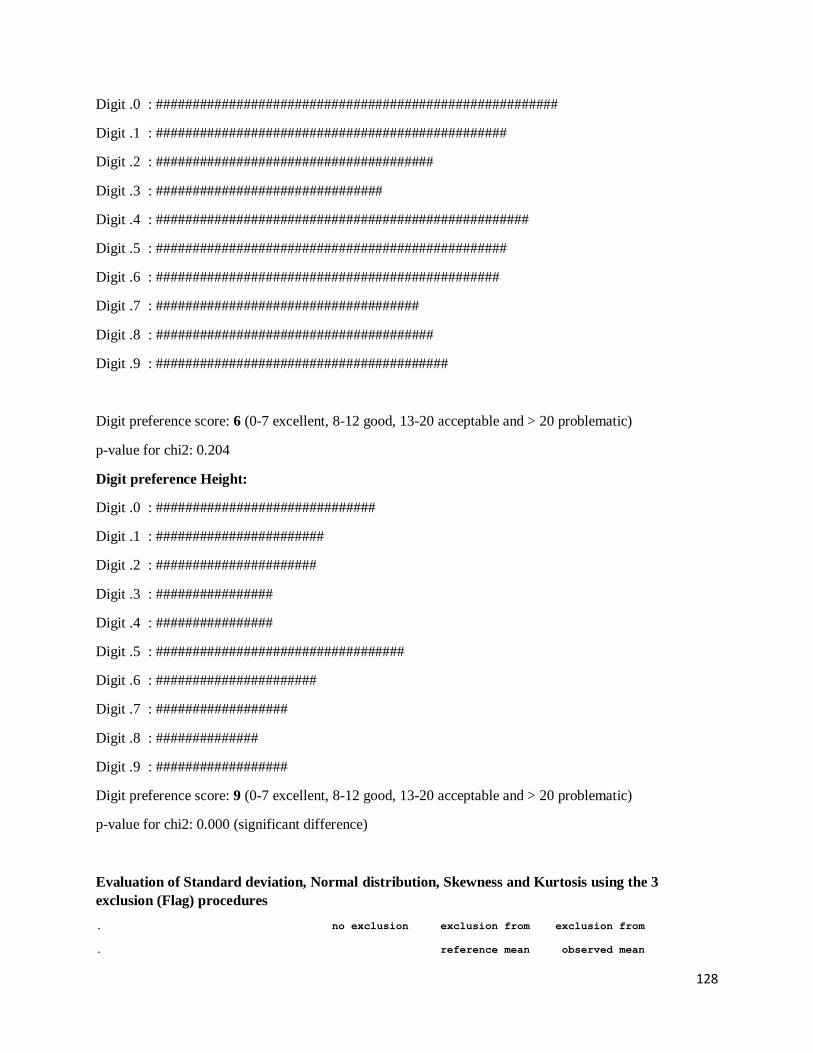
128
Digit .0 : #######################################################
Digit .1 : ################################################
Digit .2 : ######################################
Digit .3 : ###############################
Digit .4 : ###################################################
Digit .5 : ################################################
Digit .6 : ###############################################
Digit .7 : ####################################
Digit .8 : ######################################
Digit .9 : ########################################
Digit preference score: 6 (0-7 excellent, 8-12 good, 13-20 acceptable and > 20 problematic)
p-value for chi2: 0.204
Digit preference Height:
Digit .0 : ##############################
Digit .1 : #######################
Digit .2 : ######################
Digit .3 : ################
Digit .4 : ################
Digit .5 : ##################################
Digit .6 : ######################
Digit .7 : ##################
Digit .8 : ##############
Digit .9 : ##################
Digit preference score: 9 (0-7 excellent, 8-12 good, 13-20 acceptable and > 20 problematic)
p-value for chi2: 0.000 (significant difference)
Evaluation of Standard deviation, Normal distribution, Skewness and Kurtosis using the 3
exclusion (Flag) procedures
. no exclusion exclusion from exclusion from
. reference mean observed mean

129
. (WHO flags) (SMART flags)
WHZ
Standard Deviation SD: 1.35 1.22 1.07
(The SD should be between 0.8 and 1.2)
Prevalence (< -2)
observed: 12.3% 11.9% 11.5%
calculated with current SD: 16.5% 14.1% 11.7%
calculated with a SD of 1: 9.4% 9.6% 10.2%
HAZ
Standard Deviation SD: 1.86 1.75 1.31
(The SD should be between 0.8 and 1.2)
Prevalence (< -2)
observed: 28.6% 27.8% 25.3%
calculated with current SD: 32.9% 31.0% 25.6%
calculated with a SD of 1: 20.5% 19.3% 19.5%
WAZ
Standard Deviation SD: 1.24 1.24 1.15
(The SD should be between 0.8 and 1.2)
Prevalence (< -2)
observed: 21.6% 21.6% 20.4%
calculated with current SD: 25.0% 25.0% 21.9%
calculated with a SD of 1: 20.1% 20.1% 18.6%
Results for Shapiro-Wilk test for normally (Gaussian) distributed data:
WHZ p= 0.000 p= 0.000 p= 0.256
HAZ p= 0.000 p= 0.003 p= 0.031
WAZ p= 0.000 p= 0.000 p= 0.013
(If p < 0.05 then the data are not normally distributed. If p > 0.05 you can consider the data
normally distributed)
Skewness
WHZ 0.71 0.34 -0.10
HAZ 0.16 0.23 0.00
WAZ -0.44 -0.44 -0.22
If the value is:
-below minus 0.4 there is a relative excess of wasted/stunted/underweight subjects in the sample
-between minus 0.4 and minus 0.2, there may be a relative excess of wasted/stunted/underweight

130
subjects in the sample.
-between minus 0.2 and plus 0.2, the distribution can be considered as symmetrical.
-between 0.2 and 0.4, there may be an excess of obese/tall/overweight subjects in the sample.
-above 0.4, there is an excess of obese/tall/overweight subjects in the sample
Kurtosis
WHZ 5.08 2.00 -0.09
HAZ 1.32 0.83 -0.48
WAZ 0.33 0.33 -0.27
Kurtosis characterizes the relative size of the body versus the tails of the distribution.
Positive kurtosis indicates relatively large tails and small body. Negative kurtosis indicates
relatively large body and small tails.
If the absolute value is:
-above 0.4 it indicates a problem. There might have been a problem with data collection or
sampling.
-between 0.2 and 0.4, the data may be affected with a problem.
-less than an absolute value of 0.2 the distribution can be considered as normal.
Are the data of the same quality at the beginning and the end of the clusters?
Evaluation of the SD for WHZ depending upon the order the cases are measured within each cluster (if
one cluster per day is measured then this will be related to the time of the day the measurement is made).
Time SD for WHZ
point 0.8 0.9 1.0 1.1 1.2 1.3 1.4 1.5 1.6 1.7 1.8 1.9 2.0 2.1 2.2 2.3
(when n is much less than the average number of subjects per cluster different symbols are used:
0 for n < 80% and ~ for n < 40%; The numbers marked "f" are the numbers of SMART flags found in
the different time points)
Analysis by Team
Team 1 999
n = 1 431
Percentage of values flagged with SMART flags:
WHZ: 0.0 5.2
HAZ: 0.0 11.2
WAZ: 0.0 3.5
Age ratio of 6-29 months to 30-59 months:

131
1.69
Sex ratio (male/female):
0.00 1.00
Digit preference Weight (%):
.0 : 0 13
.1 : 0 11
.2 : 0 9
.3 : 0 7
.4 : 100 12
.5 : 0 11
.6 : 0 11
.7 : 0 8
.8 : 0 9
.9 : 0 9
DPS: 100 6
Digit preference score (0-7 excellent, 8-12 good, 13-20 acceptable and > 20 problematic)
Digit preference Height (%):
.0 : 0 14
.1 : 0 11
.2 : 0 10
.3 : 100 7
.4 : 0 7
.5 : 0 16
.6 : 0 10
.7 : 0 9
.8 : 0 7
.9 : 0 8
DPS: 100 10
Digit preference score (0-7 excellent, 8-12 good, 13-20 acceptable and > 20 problematic)
Standard deviation of WHZ:

132
SD 0.00
Prevalence (< -2) observed: %
Prevalence (< -2) calculated with current SD: %
Prevalence (< -2) calculated with a SD of 1: %
Standard deviation of HAZ:
SD 0.00
observed: %
calculated with current SD: %
calculated with a SD of 1: %
Statistical evaluation of sex and age ratios (using Chi squared statistic) for:
Team 1:
Age cat. mo. boys girls total ratio boys/girls
-------------------------------------------------------------------------------------
6 to 17 12 0/0.0 1/0.2 (4.3) 1/0.2 (4.3) 0.00
18 to 29 12 0/0.0 0/0.2 (0.0) 0/0.2 (0.0)
30 to 41 12 0/0.0 0/0.2 (0.0) 0/0.2 (0.0)
42 to 53 12 0/0.0 0/0.2 (0.0) 0/0.2 (0.0)
54 to 59 6 0/0.0 0/0.1 (0.0) 0/0.1 (0.0)
-------------------------------------------------------------------------------------
6 to 59 54 0/0.5 (0.0) 1/0.5 (2.0) 0.00
The data are expressed as observed number/expected number (ratio of obs/expect)
Overall sex ratio: p-value = 0.317 (boys and girls equally represented)
Overall age distribution: p-value = 0.507 (as expected)
Overall age distribution for girls: p-value = 0.507 (as expected)
Overall sex/age distribution: p-value = 0.107 (as expected)
Team 2:
Age cat. mo. boys girls total ratio boys/girls
-------------------------------------------------------------------------------------
6 to 17 12 0/0.0 0/0.0 0/0.0
18 to 29 12 0/0.0 0/0.0 0/0.0

133
30 to 41 12 0/0.0 0/0.0 0/0.0
42 to 53 12 0/0.0 0/0.0 0/0.0
54 to 59 6 0/0.0 0/0.0 0/0.0
-------------------------------------------------------------------------------------
6 to 59 54 0/0.0 0/0.0
The data are expressed as observed number/expected number (ratio of obs/expect)
Evaluation of the SD for WHZ depending upon the order the cases are measured within each
cluster (if one cluster per day is measured then this will be related to the time of the day the
measurement is made).
Team: 1
Time SD for WHZ
point 0.8 0.9 1.0 1.1 1.2 1.3 1.4 1.5 1.6 1.7 1.8 1.9 2.0 2.1 2.2 2.3
(when n is much less than the average number of subjects per cluster different symbols are used:
0 for n < 80% and ~ for n < 40%; The numbers marked "f" are the numbers of SMART flags found in
the different time points)
Team: 2
(for better comparison it can be helpful to copy/paste part of this report into Excel)
Kaabong
Model nutrition assessment report - Kaabong (based on the Save the Children Fund emergency nutrition assessment handbook)
GAM: 20.2 % (16.9 - 23.9 95% C.I.)
SAM : 6.1 % (4.3 - 8.5 95% C.I.)
3. Results 3.1 Anthropometric results (based on WHO standards 2006):
Definitions of acute malnutrition should be given (for example, global acute malnutrition is defined as <-2 z scores weight-for-height and/or oedema, severe acute malnutrition is defined as <-3z scores weight-for-height and/or oedema) Exclusion of z-scores from Zero (reference mean) WHO flags: WHZ -5 to 5; HAZ -6 to 6; WAZ -6 to 5 Table 3.1: Distribution of age and sex of sample
Boys Girls Total Ratio

134
AGE (mo) no. % no. % no. % Boy:girl
6-17 101 52.1 93 47.9 194 36.9 1.1
18-29 78 50.0 78 50.0 156 29.7 1.0
30-41 54 56.3 42 43.8 96 18.3 1.3
42-53 32 53.3 28 46.7 60 11.4 1.1
54-59 11 55.0 9 45.0 20 3.8 1.2
Total 276 52.5 250 47.5 526 100.0 1.1
Table 3.2: Prevalence of acute malnutrition based on weight-for-height z-scores (and/or oedema) and by sex
All
n = 511
Boys
n = 268
Girls
n = 243
Prevalence of global
malnutrition
(<-2 z-score and/or oedema)
(103) 20.2 %
(16.9 - 23.9
95% C.I.)
(49) 18.3 %
(14.1 - 23.3
95% C.I.)
(54) 22.2 %
(17.5 - 27.9
95% C.I.)
Prevalence of moderate
malnutrition
(<-2 z-score and >=-3 z-score, no
oedema)
(72) 14.1 %
(11.3 - 17.4
95% C.I.)
(35) 13.1 %
(9.5 - 17.6
95% C.I.)
(37) 15.2 %
(11.3 - 20.3
95% C.I.)
Prevalence of severe
malnutrition
(<-3 z-score and/or oedema)
(31) 6.1 %
(4.3 - 8.5
95% C.I.)
(14) 5.2 %
(3.1 - 8.6
95% C.I.)
(17) 7.0 %
(4.4 - 10.9
95% C.I.)
The prevalence of oedema is 0.0 % Table 3.3: Prevalence of acute malnutrition by age, based on weight-for-height z-scores and/or oedema
Severe wasting
(<-3 z-score)
Moderate
wasting
(>= -3 and <-2
z-score )
Normal
(> = -2 z score)
Oedema
Age
(mo)
Total
no.
No. % No. % No. % No. %
6-17 189 18 9.5 38 20.1 133 70.4 0 0.0
18-29 152 6 3.9 19 12.5 127 83.6 0 0.0
30-41 92 1 1.1 8 8.7 83 90.2 0 0.0
42-53 59 2 3.4 7 11.9 50 84.7 0 0.0
54-59 19 4 21.1 0 0.0 15 78.9 0 0.0

135
Total 511 31 6.1 72 14.1 408 79.8 0 0.0
Table 3.4: Distribution of acute malnutrition and oedema based on weight-for-height z-scores
<-3 z-score >=-3 z-score
Oedema present Marasmic kwashiorkor
No. 0
(0.0 %)
Kwashiorkor
No. 0
(0.0 %)
Oedema absent Marasmic
No. 36
(6.9 %)
Not severely malnourished
No. 485
(93.1 %)
Table 3.7: Prevalence of underweight based on weight-for-age z-scores by sex
All
n = 524
Boys
n = 276
Girls
n = 248
Prevalence of underweight
(<-2 z-score)
(182) 34.7 %
(30.8 - 38.9
95% C.I.)
(100) 36.2 %
(30.8 - 42.1
95% C.I.)
(82) 33.1 %
(27.5 - 39.1
95% C.I.)
Prevalence of moderate
underweight
(<-2 z-score and >=-3 z-score)
(116) 22.1 %
(18.8 - 25.9
95% C.I.)
(66) 23.9 %
(19.3 - 29.3
95% C.I.)
(50) 20.2 %
(15.6 - 25.6
95% C.I.)
Prevalence of severe
underweight
(<-3 z-score)
(66) 12.6 %
(10.0 - 15.7
95% C.I.)
(34) 12.3 %
(9.0 - 16.7
95% C.I.)
(32) 12.9 %
(9.3 - 17.6
95% C.I.)
Table 3.8: Prevalence of underweight by age, based on weight-for-age z-scores
Severe
underweight
(<-3 z-score)
Moderate
underweight
(>= -3 and <-2
z-score )
Normal
(> = -2 z score)
Oedema
Age
(mo)
Total
no.
No. % No. % No. % No. %

136
6-17 193 25 13.0 41 21.2 127 65.8 0 0.0
18-29 155 20 12.9 35 22.6 100 64.5 0 0.0
30-41 96 13 13.5 18 18.8 65 67.7 0 0.0
42-53 60 5 8.3 16 26.7 39 65.0 0 0.0
54-59 20 3 15.0 6 30.0 11 55.0 0 0.0
Total 524 66 12.6 116 22.1 342 65.3 0 0.0
Table 3.9: Prevalence of stunting based on height-for-age z-scores and by sex
All
n = 514
Boys
n = 270
Girls
n = 244
Prevalence of stunting
(<-2 z-score)
(190) 37.0 %
(32.9 - 41.2
95% C.I.)
(104) 38.5 %
(32.9 - 44.4
95% C.I.)
(86) 35.2 %
(29.5 - 41.4
95% C.I.)
Prevalence of moderate stunting
(<-2 z-score and >=-3 z-score)
(103) 20.0 %
(16.8 - 23.7
95% C.I.)
(53) 19.6 %
(15.3 - 24.8
95% C.I.)
(50) 20.5 %
(15.9 - 26.0
95% C.I.)
Prevalence of severe stunting
(<-3 z-score)
(87) 16.9 %
(13.9 - 20.4
95% C.I.)
(51) 18.9 %
(14.7 - 24.0
95% C.I.)
(36) 14.8 %
(10.9 - 19.7
95% C.I.)
Table 3.10: Prevalence of stunting by age based on height-for-age z-scores
Severe
stunting
(<-3 z-score)
Moderate
stunting
(>= -3 and <-2
z-score )
Normal
(> = -2 z score)
Age
(mo)
Total
no.
No. % No. % No. %
6-17 191 28 14.7 23 12.0 140 73.3
18-29 155 21 13.5 48 31.0 86 55.5
30-41 92 26 28.3 22 23.9 44 47.8
42-53 58 8 13.8 8 13.8 42 72.4
54-59 18 4 22.2 2 11.1 12 66.7
Total 514 87 16.9 103 20.0 324 63.0
Table 3.11: Prevalence of overweight based on weight for height cut off's and by sex (no oedema)
All Boys Girls

137
n = 511 n = 268 n = 243
Prevalence of overweight (WHZ
> 2)
(9) 1.8 %
(0.9 - 3.3
95% C.I.)
(2) 0.7 %
(0.2 - 2.7
95% C.I.)
(7) 2.9 %
(1.4 - 5.8
95% C.I.)
Prevalence of severe overweight
(WHZ > 3)
(5) 1.0 %
(0.4 - 2.3
95% C.I.)
(2) 0.7 %
(0.2 - 2.7
95% C.I.)
(3) 1.2 %
(0.4 - 3.6
95% C.I.)
Table 3.12: Prevalence of overweight by age, based on weight for height (no oedema)
Overweight
(WHZ > 2)
Severe
Overweight
(WHZ > 3)
Age
(mo)
Total
no.
No. % No. %
6-17 189 4 2.1 2 1.1
18-29 152 2 1.3 2 1.3
30-41 92 3 3.3 1 1.1
42-53 59 0 0.0 0 0.0
54-59 19 0 0.0 0 0.0
Total 511 9 1.8 5 1.0
Table 3.13: Mean z-scores, Design Effects and excluded subjects
Indicator n Mean z-scores ±
SD
Design Effect (z-
score < -2)
z-scores not
available*
z-scores out of range
Weight-for-Height
511 -1.01±1.33 1.00 5 10
Weight-for-Age 524 -1.44±1.39 1.00 0 2
Height-for-Age 514 -1.31±1.92 1.00 3 9 * contains for WHZ and WAZ the children with edema.
Appendix 4
Result Tables for NCHS growth reference 1977
Table 3.2: Prevalence of acute malnutrition based on weight-for-height z-scores (and/or
oedema) and by sex
All Boys Girls

138
n = 518 n = 272 n = 246
Prevalence of global
malnutrition
(<-2 z-score and/or oedema)
(109) 21.0 %
(17.8 - 24.8
95% C.I.)
(49) 18.0 %
(13.9 - 23.0
95% C.I.)
(60) 24.4 %
(19.4 - 30.1
95% C.I.)
Prevalence of moderate
malnutrition
(<-2 z-score and >=-3 z-score, no
oedema)
(84) 16.2 %
(13.3 - 19.6
95% C.I.)
(39) 14.3 %
(10.7 - 19.0
95% C.I.)
(45) 18.3 %
(14.0 - 23.6
95% C.I.)
Prevalence of severe
malnutrition
(<-3 z-score and/or oedema)
(25) 4.8 %
(3.3 - 7.0
95% C.I.)
(10) 3.7 %
(2.0 - 6.6
95% C.I.)
(15) 6.1 %
(3.7 - 9.8
95% C.I.)
The prevalence of oedema is 0.0 %
Table 3.3: Prevalence of acute malnutrition by age, based on weight-for-height z-scores and/or oedema
Severe wasting
(<-3 z-score)
Moderate
wasting
(>= -3 and <-2
z-score )
Normal
(> = -2 z score)
Oedema
Age
(mo)
Total
no.
No. % No. % No. % No. %
6-17 192 15 7.8 36 18.8 141 73.4 0 0.0
18-29 154 8 5.2 28 18.2 118 76.6 0 0.0
30-41 94 0 0.0 10 10.6 84 89.4 0 0.0
42-53 59 2 3.4 6 10.2 51 86.4 0 0.0
54-59 19 0 0.0 4 21.1 15 78.9 0 0.0
Total 518 25 4.8 84 16.2 409 79.0 0 0.0
Table 3.4: Distribution of acute malnutrition and oedema based on weight-for-height z-scores
<-3 z-score >=-3 z-score
Oedema present Marasmic kwashiorkor
No. 0
(0.0 %)
Kwashiorkor
No. 0
(0.0 %)
Oedema absent Marasmic
No. 25
Not severely malnourished
No. 497

139
(4.8 %) (95.2 %)
Table 3.5: Prevalence of acute malnutrition based on the percentage of the median and/or oedema
n = 518
Prevalence of global acute
malnutrition
(<80% and/or oedema)
(78) 15.1 %
(12.2 - 18.4 95%
C.I.)
Prevalence of moderate acute
malnutrition
(<80% and >= 70%, no oedema)
(63) 12.2 %
(9.6 - 15.3 95%
C.I.)
Prevalence of severe acute
malnutrition
(<70% and/or oedema)
(15) 2.9 %
(1.8 - 4.7 95%
C.I.)
Table 3.6: Prevalence of malnutrition by age, based on weight-for-height percentage of the median and oedema
Severe
wasting
(<70% median)
Moderate
wasting
(>=70% and
<80% median)
Normal
(> =80%
median)
Oedema
Age
(mo)
Total
no.
No. % No. % No. % No. %
6-17 192 10 5.2 29 15.1 153 79.7 0 0.0
18-29 154 4 2.6 18 11.7 132 85.7 0 0.0
30-41 94 0 0.0 6 6.4 88 93.6 0 0.0
42-53 59 1 1.7 6 10.2 52 88.1 0 0.0
54-59 19 0 0.0 4 21.1 15 78.9 0 0.0
Total 518 15 2.9 63 12.2 440 84.9 0 0.0
Table 3.7: Prevalence of underweight based on weight-for-age z-scores by sex
All
n = 525
Boys
n = 276
Girls
n = 249
Prevalence of underweight
(<-2 z-score)
(211) 40.2 %
(36.1 - 44.4
95% C.I.)
(112) 40.6 %
(35.0 - 46.5
95% C.I.)
(99) 39.8 %
(33.9 - 45.9
95% C.I.)

140
Prevalence of moderate
underweight
(<-2 z-score and >=-3 z-score)
(144) 27.4 %
(23.8 - 31.4
95% C.I.)
(77) 27.9 %
(22.9 - 33.5
95% C.I.)
(67) 26.9 %
(21.8 - 32.7
95% C.I.)
Prevalence of severe
underweight
(<-3 z-score)
(67) 12.8 %
(10.2 - 15.9
95% C.I.)
(35) 12.7 %
(9.3 - 17.1
95% C.I.)
(32) 12.9 %
(9.3 - 17.6
95% C.I.)
Table 3.8: Prevalence of underweight by age, based on weight-for-age z-scores
Severe
underweight
(<-3 z-score)
Moderate
underweight
(>= -3 and <-2
z-score )
Normal
(> = -2 z score)
Oedema
Age
(mo)
Total
no.
No. % No. % No. % No. %
6-17 193 25 13.0 48 24.9 120 62.2 0 0.0
18-29 156 22 14.1 48 30.8 86 55.1 0 0.0
30-41 96 13 13.5 22 22.9 61 63.5 0 0.0
42-53 60 4 6.7 20 33.3 36 60.0 0 0.0
54-59 20 3 15.0 6 30.0 11 55.0 0 0.0
Total 525 67 12.8 144 27.4 314 59.8 0 0.0
Table 3.9: Prevalence of stunting based on height-for-age z-scores and by sex
All
n = 516
Boys
n = 271
Girls
n = 245
Prevalence of stunting
(<-2 z-score)
(162) 31.4 %
(27.5 - 35.5
95% C.I.)
(87) 32.1 %
(26.8 - 37.9
95% C.I.)
(75) 30.6 %
(25.2 - 36.6
95% C.I.)
Prevalence of moderate stunting
(<-2 z-score and >=-3 z-score)
(95) 18.4 %
(15.3 - 22.0
95% C.I.)
(52) 19.2 %
(14.9 - 24.3
95% C.I.)
(43) 17.6 %
(13.3 - 22.8
95% C.I.)
Prevalence of severe stunting
(<-3 z-score)
(67) 13.0 %
(10.4 - 16.2
95% C.I.)
(35) 12.9 %
(9.4 - 17.4
95% C.I.)
(32) 13.1 %
(9.4 - 17.9
95% C.I.)
Table 3.10: Prevalence of stunting by age based on height-for-age z-scores

141
Severe
stunting
(<-3 z-score)
Moderate
stunting
(>= -3 and <-2
z-score )
Normal
(> = -2 z score)
Age
(mo)
Total
no.
No. % No. % No. %
6-17 192 19 9.9 31 16.1 142 74.0
18-29 155 13 8.4 45 29.0 97 62.6
30-41 94 25 26.6 11 11.7 58 61.7
42-53 58 7 12.1 6 10.3 45 77.6
54-59 17 3 17.6 2 11.8 12 70.6
Total 516 67 13.0 95 18.4 354 68.6
Table 3.11: Prevalence of overweight based on weight for height cut off's and by sex (no oedema)
All
n = 518
Boys
n = 272
Girls
n = 246
Prevalence of overweight (WHZ
> 2)
(9) 1.7 %
(0.9 - 3.3
95% C.I.)
(4) 1.5 %
(0.6 - 3.7
95% C.I.)
(5) 2.0 %
(0.9 - 4.7
95% C.I.)
Prevalence of severe overweight
(WHZ > 3)
(5) 1.0 %
(0.4 - 2.2
95% C.I.)
(3) 1.1 %
(0.4 - 3.2
95% C.I.)
(2) 0.8 %
(0.2 - 2.9
95% C.I.)
Table 3.12: Prevalence of overweight by age, based on weight for height (no oedema)
Overweight
(WHZ > 2)
Severe
Overweight
(WHZ > 3)
Age
(mo)
Total
no.
No. % No. %
6-17 192 4 2.1 2 1.0
18-29 154 2 1.3 1 0.6
30-41 94 3 3.2 2 2.1
42-53 59 0 0.0 0 0.0
54-59 19 0 0.0 0 0.0
Total 518 9 1.7 5 1.0

142
Table 3.13: Mean z-scores, Design Effects and excluded subjects
Indicator n Mean z-scores ±
SD
Design Effect (z-
score < -2)
z-scores not
available*
z-scores out of range
Weight-for-Height
518 -1.13±1.22 1.00 4 4
Weight-for-Age 525 -1.63±1.31 1.00 0 1
Height-for-Age 516 -1.15±1.82 1.00 3 7 * contains for WHZ and WAZ the children with edema.
Plausibility check for: Kaabong_above6.as
Standard/Reference used for z-score calculation: WHO standards 2006
(If it is not mentioned, flagged data is included in the evaluation. Some parts of this plausibility report are
more for advanced users and can be skipped for a standard evaluation)
Overall data quality
Criteria Flags* Unit Excel. Good Accept Problematic Score
Flagged data Incl % 0-2.5 >2.5-5.0 >5.0-7.5 >7.5
(% of in-range subjects) 0 5 10 20 10 (5.6 %)
Overall Sex ratio Incl p >0.1 >0.05 >0.001 <=0.001
(Significant chi square) 0 2 4 10 0 (p=0.257)
Overall Age distrib Incl p >0.1 >0.05 >0.001 <=0.001
(Significant chi square) 0 2 4 10 10 (p=0.000)
Dig pref score - weight Incl # 0-7 8-12 13-20 > 20
0 2 4 10 0 (3)
Dig pref score - height Incl # 0-7 8-12 13-20 > 20
0 2 4 10 2 (11)

143
Dig pref score - MUAC Incl # 0-7 8-12 13-20 > 20
0 2 4 10 0 (0)
Standard Dev WHZ Excl SD <1.1 <1.15 <1.20 >=1.20
. and and and or
. Excl SD >0.9 >0.85 >0.80 <=0.80
0 2 6 20 2 (1.15)
Skewness WHZ Excl # <±0.2 <±0.4 <±0.6 >=±0.6
0 1 3 5 0 (-0.02)
Kurtosis WHZ Excl # <±0.2 <±0.4 <±0.6 >=±0.6
0 1 3 5 1 (-0.23)
Poisson dist WHZ-2 Excl p >0.05 >0.01 >0.001 <=0.001
0 1 3 5 0 (p=)
OVERALL SCORE WHZ = 0-9 10-14 15-24 >25 25 %
The overall score of this survey is 25 %, this is problematic.
Duplicate Entries in the database:
Line=499/ID=999 with Line=498/ID=999
Missing data:
HEIGHT: Line=5/ID=31417, Line=71/ID=32611, Line=289/ID=30503
Percentage of children with no exact birthday: 100 %
Age/Height out of range for WHZ:
HEIGHT:
Line=515/ID=32109: 31.20 cm
Anthropometric Indices likely to be in error (-3 to 3 for WHZ, -3 to 3 for HAZ, -3 to 3 for WAZ,
from observed mean - chosen in Options panel - these values will be flagged and should be excluded
from analysis for a nutrition survey in emergencies. For other surveys this might not be the best
procedure e.g. when the percentage of overweight children has to be calculated):
Line=11/ID=31515: WHZ (-4.968), Height may be incorrect
Line=19/ID=30908: WHZ (2.783), Height may be incorrect
Line=21/ID=30724: HAZ (1.918), Age may be incorrect
Line=31/ID=30412: WHZ (-4.537), Weight may be incorrect

144
Line=43/ID=32016: HAZ (2.459), Height may be incorrect
Line=52/ID=30305: WHZ (-5.095), HAZ (-4.442), WAZ (-6.197)
Line=54/ID=32215: WHZ (-5.377), WAZ (-4.481), Weight may be incorrect
Line=55/ID=32304: WHZ (-4.206), Weight may be incorrect
Line=57/ID=31808: HAZ (2.083), Height may be incorrect
Line=61/ID=30503: HAZ (2.632), Height may be incorrect
Line=62/ID=31512: WHZ (-4.304), HAZ (2.981), Height may be incorrect
Line=68/ID=31514: WHZ (-4.278), Weight may be incorrect
Line=73/ID=31918: WHZ (-4.354), HAZ (3.133), Height may be incorrect
Line=74/ID=31210: WHZ (3.060), HAZ (-5.114), Height may be incorrect
Line=78/ID=31108: WHZ (-5.046), HAZ (3.292), Height may be incorrect
Line=80/ID=30413: WAZ (-4.488), Age may be incorrect
Line=82/ID=32910: WHZ (-4.753), WAZ (-4.769), Weight may be incorrect
Line=101/ID=32014: HAZ (2.446), Height may be incorrect
Line=103/ID=30802: HAZ (5.045), WAZ (1.930), Age may be incorrect
Line=107/ID=30811: WHZ (-3.969), Weight may be incorrect
Line=111/ID=30420: HAZ (2.384), Age may be incorrect
Line=114/ID=31106: HAZ (2.944), Age may be incorrect
Line=116/ID=32211: HAZ (-5.656), WAZ (-5.241), Age may be incorrect
Line=124/ID=30707: HAZ (6.297), WAZ (2.900), Age may be incorrect
Line=125/ID=32015: HAZ (3.098), Height may be incorrect
Line=136/ID=33004: HAZ (2.042), Age may be incorrect
Line=139/ID=32903: HAZ (4.742), Age may be incorrect
Line=151/ID=31012: HAZ (5.426), WAZ (1.797), Age may be incorrect
Line=153/ID=31102: WHZ (3.829), HAZ (3.623), WAZ (4.523)
Line=158/ID=31710: HAZ (2.687), Age may be incorrect
Line=165/ID=32411: HAZ (4.947), Age may be incorrect
Line=175/ID=31814: WHZ (2.128), Height may be incorrect
Line=176/ID=30809: HAZ (2.074), WAZ (1.723), Age may be incorrect
Line=182/ID=31707: HAZ (1.969), Age may be incorrect

145
Line=200/ID=30901: WHZ (-3.965), Weight may be incorrect
Line=201/ID=30315: WAZ (-4.491), Weight may be incorrect
Line=206/ID=31215: HAZ (3.061), Age may be incorrect
Line=208/ID=32718: WHZ (3.578), WAZ (1.552), Weight may be incorrect
Line=209/ID=31107: WHZ (-5.283), HAZ (3.400), Height may be incorrect
Line=211/ID=32815: WHZ (9.893), HAZ (-5.783), WAZ (3.269)
Line=220/ID=33010: HAZ (1.622), Age may be incorrect
Line=242/ID=31518: HAZ (1.695), Height may be incorrect
Line=248/ID=30409: HAZ (4.103), Age may be incorrect
Line=260/ID=30105: HAZ (1.853), Age may be incorrect
Line=265/ID=31803: HAZ (3.711), Age may be incorrect
Line=283/ID=32408: HAZ (3.033), Age may be incorrect
Line=287/ID=30401: HAZ (1.850), Age may be incorrect
Line=295/ID=30905: HAZ (-5.549), Age may be incorrect
Line=310/ID=32505: HAZ (5.245), Age may be incorrect
Line=322/ID=30319: HAZ (2.310), WAZ (1.848), Age may be incorrect
Line=324/ID=31816: HAZ (2.754), WAZ (1.565), Age may be incorrect
Line=329/ID=31805: WHZ (3.260), Weight may be incorrect
Line=330/ID=30614: HAZ (-4.709), Age may be incorrect
Line=341/ID=31303: HAZ (2.411), WAZ (1.889), Age may be incorrect
Line=343/ID=30318: WHZ (-5.605), HAZ (-4.684), WAZ (-6.165)
Line=347/ID=30404: HAZ (2.212), Age may be incorrect
Line=350/ID=31708: HAZ (2.037), Age may be incorrect
Line=364/ID=30303: HAZ (-6.084), WAZ (-4.564), Age may be incorrect
Line=372/ID=33002: HAZ (-5.520), Age may be incorrect
Line=385/ID=33001: WHZ (2.403), Height may be incorrect
Line=386/ID=31010: HAZ (-8.215), Height may be incorrect
Line=388/ID=30516: HAZ (-5.941), Age may be incorrect
Line=395/ID=32813: WHZ (9.400), WAZ (3.673), Weight may be incorrect
Line=396/ID=31107: WHZ (6.124), HAZ (-6.826), Height may be incorrect

146
Line=397/ID=30602: HAZ (-4.750), Age may be incorrect
Line=400/ID=31406: HAZ (-6.177), WAZ (-4.614), Age may be incorrect
Line=401/ID=31113: WHZ (2.391), HAZ (-5.273), Height may be incorrect
Line=405/ID=30112: WHZ (3.130), Weight may be incorrect
Line=438/ID=31610: WHZ (7.660), WAZ (2.415), Weight may be incorrect
Line=441/ID=32909: HAZ (-5.567), Age may be incorrect
Line=448/ID=30414: HAZ (2.254), Age may be incorrect
Line=455/ID=30301: HAZ (-4.757), Age may be incorrect
Line=457/ID=32903: HAZ (-6.848), WAZ (-5.120), Age may be incorrect
Line=458/ID=32707: HAZ (3.380), Height may be incorrect
Line=465/ID=31007: WHZ (9.423), HAZ (-8.459), Height may be incorrect
Line=469/ID=32915: HAZ (-4.975), Age may be incorrect
Line=475/ID=30910: HAZ (-5.237), Height may be incorrect
Line=481/ID=31803: HAZ (-5.867), Age may be incorrect
Line=489/ID=31102: WHZ (-4.349), Weight may be incorrect
Line=491/ID=30305: HAZ (-5.526), Height may be incorrect
Line=507/ID=30106: HAZ (1.613), Height may be incorrect
Line=509/ID=32717: HAZ (-7.015), WAZ (-5.092), Age may be incorrect
Line=515/ID=32109: HAZ (-16.530), Height may be incorrect
Line=518/ID=30902: HAZ (-5.542), Age may be incorrect
Line=522/ID=31902: HAZ (2.082), Height may be incorrect
Line=525/ID=32018: HAZ (-5.901), Age may be incorrect
Percentage of values flagged with SMART flags:WHZ: 5.6 %, HAZ: 12.8 %, WAZ: 4.4 %
Age distribution:
Month 6 : ############################
Month 7 : #########################
Month 8 : #################
Month 9 : ####################
Month 10 : ############
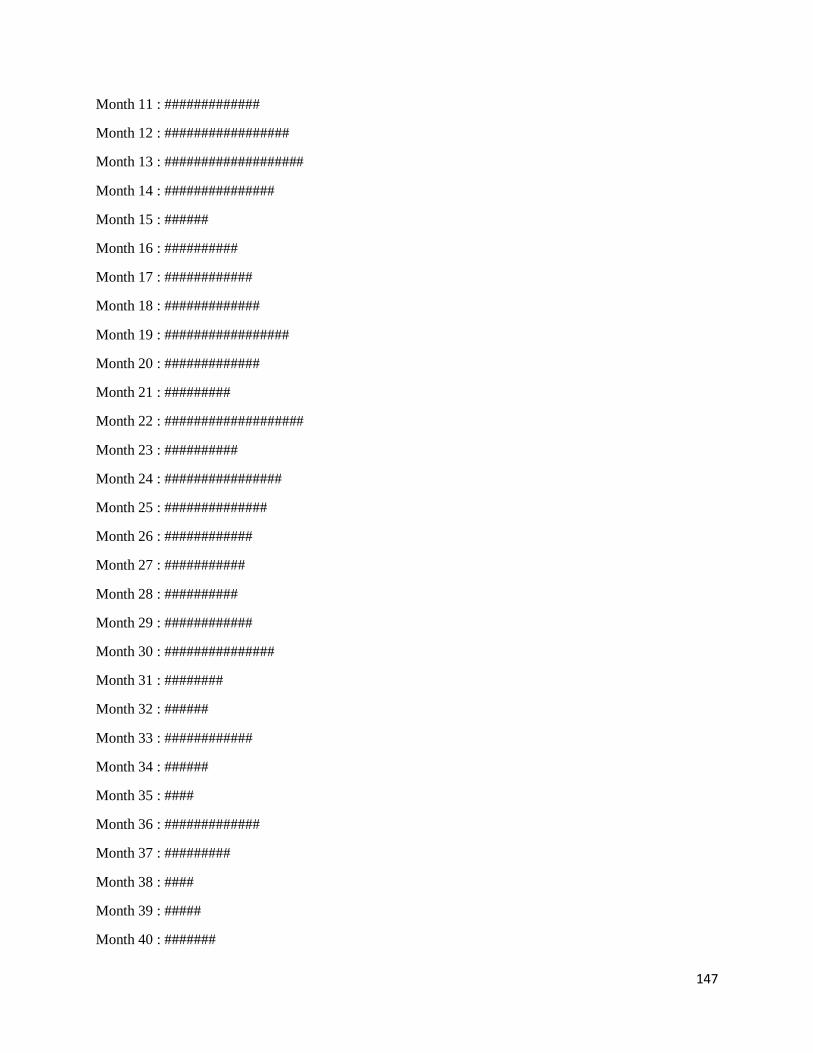
147
Month 11 : #############
Month 12 : #################
Month 13 : ###################
Month 14 : ###############
Month 15 : ######
Month 16 : ##########
Month 17 : ############
Month 18 : #############
Month 19 : #################
Month 20 : #############
Month 21 : #########
Month 22 : ###################
Month 23 : ##########
Month 24 : ################
Month 25 : ##############
Month 26 : ############
Month 27 : ###########
Month 28 : ##########
Month 29 : ############
Month 30 : ###############
Month 31 : ########
Month 32 : ######
Month 33 : ############
Month 34 : ######
Month 35 : ####
Month 36 : #############
Month 37 : #########
Month 38 : ####
Month 39 : #####
Month 40 : #######

148
Month 41 : #######
Month 42 : #####
Month 43 : ###
Month 44 : #####
Month 45 : ######
Month 46 : #####
Month 47 : ###########
Month 48 : ######
Month 49 : #####
Month 50 : ###
Month 51 : ####
Month 52 : #####
Month 53 : ##
Month 54 : #########
Month 55 : ##
Month 56 : ###
Month 57 : ######
Age ratio of 6-29 months to 30-59 months: 1.99 (The value should be around 0.85).
Statistical evaluation of sex and age ratios (using Chi squared statistic):
Age cat. mo. boys girls total ratio boys/girls
-------------------------------------------------------------------------------------
6 to 17 12 101/64.0 (1.6) 93/58.0 (1.6) 194/122.0 (1.6) 1.09
18 to 29 12 78/62.4 (1.2) 78/56.6 (1.4) 156/119.0 (1.3) 1.00
30 to 41 12 54/60.5 (0.9) 42/54.8 (0.8) 96/115.3 (0.8) 1.29
42 to 53 12 32/59.6 (0.5) 28/53.9 (0.5) 60/113.5 (0.5) 1.14
54 to 59 6 11/29.5 (0.4) 9/26.7 (0.3) 20/56.1 (0.4) 1.22
-------------------------------------------------------------------------------------
6 to 59 54 276/263.0 (1.0) 250/263.0 (1.0) 1.10
The data are expressed as observed number/expected number (ratio of obs/expect)

149
Overall sex ratio: p-value = 0.257 (boys and girls equally represented)
Overall age distribution: p-value = 0.000 (significant difference)
Overall age distribution for boys: p-value = 0.000 (significant difference)
Overall age distribution for girls: p-value = 0.000 (significant difference)
Overall sex/age distribution: p-value = 0.000 (significant difference)
Digit preference Weight:
Digit .0 : #################################################
Digit .1 : #########################################
Digit .2 : ##########################################################
Digit .3 : ##################################################
Digit .4 : #####################################################
Digit .5 : ###########################################################
Digit .6 : #########################################################
Digit .7 : #################################################
Digit .8 : ##########################################################
Digit .9 : ####################################################
Digit preference score: 3 (0-7 excellent, 8-12 good, 13-20 acceptable and > 20 problematic)
p-value for chi2: 0.794
Digit preference Height:
Digit .0 : ########################################
Digit .1 : ################################
Digit .2 : #####################################
Digit .3 : ####################
Digit .4 : #########################
Digit .5 : ##################################
Digit .6 : #####################
Digit .7 : ######################
Digit .8 : ##################
Digit .9 : #############

150
Digit preference score: 11 (0-7 excellent, 8-12 good, 13-20 acceptable and > 20 problematic)
p-value for chi2: 0.000 (significant difference)
Evaluation of Standard deviation, Normal distribution, Skewness and Kurtosis using the 3
exclusion (Flag) procedures
. no exclusion exclusion from exclusion from
. reference mean observed mean
. (WHO flags) (SMART flags)
WHZ
Standard Deviation SD: 1.68 1.33 1.15
(The SD should be between 0.8 and 1.2)
Prevalence (< -2)
observed: 20.8% 20.2% 18.9%
calculated with current SD: 26.8% 22.9% 19.5%
calculated with a SD of 1: 14.9% 16.1% 16.2%
HAZ
Standard Deviation SD: 2.15 1.92 1.35
(The SD should be between 0.8 and 1.2)
Prevalence (< -2)
observed: 37.9% 37.0% 37.5%
calculated with current SD: 39.0% 35.9% 35.5%
calculated with a SD of 1: 27.4% 24.4% 30.8%
WAZ
Standard Deviation SD: 1.42 1.39 1.20
(The SD should be between 0.8 and 1.2)
Prevalence (< -2)
observed: 35.0% 34.7% 34.4%
calculated with current SD: 35.1% 34.3% 33.0%
calculated with a SD of 1: 29.3% 28.7% 29.8%
Results for Shapiro-Wilk test for normally (Gaussian) distributed data:
WHZ p= 0.000 p= 0.001 p= 0.183
HAZ p= 0.000 p= 0.000 p= 0.001
WAZ p= 0.004 p= 0.003 p= 0.090
(If p < 0.05 then the data are not normally distributed. If p > 0.05 you can consider the data
normally distributed)
Skewness
WHZ 1.71 0.15 -0.02

151
HAZ -0.42 0.48 0.01
WAZ 0.15 0.28 -0.03
If the value is:
-below minus 0.4 there is a relative excess of wasted/stunted/underweight subjects in the sample
-between minus 0.4 and minus 0.2, there may be a relative excess of wasted/stunted/underweight
subjects in the sample.
-between minus 0.2 and plus 0.2, the distribution can be considered as symmetrical.
-between 0.2 and 0.4, there may be an excess of obese/tall/overweight subjects in the sample.
-above 0.4, there is an excess of obese/tall/overweight subjects in the sample
Kurtosis
WHZ 10.08 0.87 -0.23
HAZ 5.30 0.82 -0.70
WAZ 1.05 0.87 -0.47
Kurtosis characterizes the relative size of the body versus the tails of the distribution.
Positive kurtosis indicates relatively large tails and small body. Negative kurtosis indicates
relatively large body and small tails.
If the absolute value is:
-above 0.4 it indicates a problem. There might have been a problem with data collection or
sampling.
-between 0.2 and 0.4, the data may be affected with a problem.
-less than an absolute value of 0.2 the distribution can be considered as normal.
Are the data of the same quality at the beginning and the end of the clusters?
Evaluation of the SD for WHZ depending upon the order the cases are measured within each cluster (if
one cluster per day is measured then this will be related to the time of the day the measurement is made).
Time SD for WHZ
point 0.8 0.9 1.0 1.1 1.2 1.3 1.4 1.5 1.6 1.7 1.8 1.9 2.0 2.1 2.2 2.3
(when n is much less than the average number of subjects per cluster different symbols are used:
0 for n < 80% and ~ for n < 40%; The numbers marked "f" are the numbers of SMART flags found in
the different time points)
Analysis by Team
Team 1 999
n = 1 525
Percentage of values flagged with SMART flags:
WHZ: 0.0 7.8
HAZ: 0.0 13.4

152
WAZ: 0.0 5.6
Age ratio of 6-29 months to 30-59 months:
1.98
Sex ratio (male/female):
1.10
Digit preference Weight (%):
.0 : 0 9
.1 : 0 8
.2 : 0 11
.3 : 100 9
.4 : 0 10
.5 : 0 11
.6 : 0 11
.7 : 0 9
.8 : 0 11
.9 : 0 10
DPS: 100 3
Digit preference score (0-7 excellent, 8-12 good, 13-20 acceptable and > 20 problematic)
Digit preference Height (%):
.0 : 0 15
.1 : 0 12
.2 : 0 14
.3 : 0 8
.4 : 0 10
.5 : 0 13
.6 : 0 8
.7 : 0 8
.8 : 0 7
.9 : 100 5
DPS: 100 11

153
Digit preference score (0-7 excellent, 8-12 good, 13-20 acceptable and > 20 problematic)
Standard deviation of WHZ:
SD 0.00
Prevalence (< -2) observed: %
Prevalence (< -2) calculated with current SD: %
Prevalence (< -2) calculated with a SD of 1: %
Standard deviation of HAZ:
SD 0.00
observed: %
calculated with current SD: %
calculated with a SD of 1: %
Statistical evaluation of sex and age ratios (using Chi squared statistic) for:
Team 1:
Age cat. mo. boys girls total ratio boys/girls
-------------------------------------------------------------------------------------
6 to 17 12 1/0.2 (4.3) 0/0.0 1/0.2
18 to 29 12 0/0.2 (0.0) 0/0.0 0/0.2
30 to 41 12 0/0.2 (0.0) 0/0.0 0/0.2
42 to 53 12 0/0.2 (0.0) 0/0.0 0/0.2
54 to 59 6 0/0.1 (0.0) 0/0.0 0/0.1
-------------------------------------------------------------------------------------
6 to 59 54 1/0.5 (2.0) 0/0.5 (0.0)
The data are expressed as observed number/expected number (ratio of obs/expect)
Overall sex ratio: p-value = 0.317 (boys and girls equally represented)
Overall age distribution: p-value = 0.507 (as expected)
Overall age distribution for boys: p-value = 0.507 (as expected)
Overall sex/age distribution: p-value = 0.107 (as expected)
Team 2:
Age cat. mo. boys girls total ratio boys/girls
-------------------------------------------------------------------------------------
6 to 17 12 0/0.0 0/0.0 0/0.0
18 to 29 12 0/0.0 0/0.0 0/0.0

154
30 to 41 12 0/0.0 0/0.0 0/0.0
42 to 53 12 0/0.0 0/0.0 0/0.0
54 to 59 6 0/0.0 0/0.0 0/0.0
-------------------------------------------------------------------------------------
6 to 59 54 0/0.0 0/0.0
The data are expressed as observed number/expected number (ratio of obs/expect)
Evaluation of the SD for WHZ depending upon the order the cases are measured within each
cluster (if one cluster per day is measured then this will be related to the time of the day the
measurement is made).
Team: 1
Time SD for WHZ
point 0.8 0.9 1.0 1.1 1.2 1.3 1.4 1.5 1.6 1.7 1.8 1.9 2.0 2.1 2.2 2.3
(when n is much less than the average number of subjects per cluster different symbols are used:
0 for n < 80% and ~ for n < 40%; The numbers marked "f" are the numbers of SMART flags found in
the different time points)
Team: 2
(for better comparison it can be helpful to copy/paste part of this report into Excel)
Kotido
Model nutrition assessment report - Kotido (based on the Save the Children Fund emergency nutrition assessment handbook)
Executive summary (one to two pages only)
GAM: 11.4 % (8.8 - 14.6 95% C.I.)
SAM : 2.9 % (1.7 - 4.8 95% C.I.)
3. Results 3.1 Anthropometric results (based on WHO standards 2006):
Definitions of acute malnutrition should be given (for example, global acute malnutrition is defined as <-2 z scores weight-for-height and/or oedema, severe acute malnutrition is defined as <-3z scores weight-for-height and/or oedema) Exclusion of z-scores from Zero (reference mean) WHO flags: WHZ -5 to 5; HAZ -6 to 6; WAZ -6 to 5

155
Table 3.1: Distribution of age and sex of sample
Boys Girls Total Ratio
AGE (mo) no. % no. % no. % Boy:girl
6-17 63 41.4 89 58.6 152 33.0 0.7
18-29 56 45.5 67 54.5 123 26.7 0.8
30-41 47 44.3 59 55.7 106 23.0 0.8
42-53 34 56.7 26 43.3 60 13.0 1.3
54-59 11 57.9 8 42.1 19 4.1 1.4
Total 211 45.9 249 54.1 460 100.0 0.8
Table 3.2: Prevalence of acute malnutrition based on weight-for-height z-scores (and/or oedema) and by sex
All
n = 456
Boys
n = 210
Girls
n = 246
Prevalence of global
malnutrition
(<-2 z-score and/or oedema)
(52) 11.4 %
(8.8 - 14.6
95% C.I.)
(26) 12.4 %
(8.6 - 17.5
95% C.I.)
(26) 10.6 %
(7.3 - 15.0
95% C.I.)
Prevalence of moderate
malnutrition
(<-2 z-score and >=-3 z-score, no
oedema)
(39) 8.6 %
(6.3 - 11.5
95% C.I.)
(17) 8.1 %
(5.1 - 12.6
95% C.I.)
(22) 8.9 %
(6.0 - 13.2
95% C.I.)
Prevalence of severe
malnutrition
(<-3 z-score and/or oedema)
(13) 2.9 %
(1.7 - 4.8
95% C.I.)
(9) 4.3 %
(2.3 - 7.9
95% C.I.)
(4) 1.6 %
(0.6 - 4.1
95% C.I.)
The prevalence of oedema is 0.0 %
Table 3.3: Prevalence of acute malnutrition by age, based on weight-for-height z-scores and/or oedema
Severe wasting
(<-3 z-score)
Moderate
wasting
Normal
(> = -2 z score)
Oedema

156
(>= -3 and <-2
z-score )
Age
(mo)
Total
no.
No. % No. % No. % No. %
6-17 152 2 1.3 19 12.5 131 86.2 0 0.0
18-29 122 5 4.1 12 9.8 105 86.1 0 0.0
30-41 103 3 2.9 6 5.8 94 91.3 0 0.0
42-53 60 2 3.3 2 3.3 56 93.3 0 0.0
54-59 19 1 5.3 0 0.0 18 94.7 0 0.0
Total 456 13 2.9 39 8.6 404 88.6 0 0.0
Table 3.4: Distribution of acute malnutrition and oedema based on weight-for-height z-scores
<-3 z-score >=-3 z-score
Oedema present Marasmic kwashiorkor
No. 0
(0.0 %)
Kwashiorkor
No. 0
(0.0 %)
Oedema absent Marasmic
No. 16
(3.5 %)
Not severely malnourished
No. 443
(96.5 %)
Table 3.7: Prevalence of underweight based on weight-for-age z-scores by sex
All
n = 459
Boys
n = 211
Girls
n = 248
Prevalence of underweight
(<-2 z-score)
(114) 24.8 %
(21.1 - 29.0
95% C.I.)
(68) 32.2 %
(26.3 - 38.8
95% C.I.)
(46) 18.5 %
(14.2 - 23.9
95% C.I.)
Prevalence of moderate
underweight
(<-2 z-score and >=-3 z-score)
(73) 15.9 %
(12.8 - 19.5
95% C.I.)
(43) 20.4 %
(15.5 - 26.3
95% C.I.)
(30) 12.1 %
(8.6 - 16.7
95% C.I.)
Prevalence of severe
underweight
(41) 8.9 % (25) 11.8 % (16) 6.5 %

157
(<-3 z-score) (6.7 - 11.9
95% C.I.)
(8.2 - 16.9
95% C.I.)
(4.0 - 10.2
95% C.I.)
Table 3.8: Prevalence of underweight by age, based on weight-for-age z-scores
Severe
underweight
(<-3 z-score)
Moderate
underweight
(>= -3 and <-2
z-score )
Normal
(> = -2 z score)
Oedema
Age
(mo)
Total
no.
No. % No. % No. % No. %
6-17 152 11 7.2 23 15.1 118 77.6 0 0.0
18-29 123 10 8.1 20 16.3 93 75.6 0 0.0
30-41 105 13 12.4 17 16.2 75 71.4 0 0.0
42-53 60 6 10.0 10 16.7 44 73.3 0 0.0
54-59 19 1 5.3 3 15.8 15 78.9 0 0.0
Total 459 41 8.9 73 15.9 345 75.2 0 0.0
Table 3.9: Prevalence of stunting based on height-for-age z-scores and by sex
All
n = 456
Boys
n = 208
Girls
n = 248
Prevalence of stunting
(<-2 z-score)
(169) 37.1 %
(32.8 - 41.6
95% C.I.)
(93) 44.7 %
(38.1 - 51.5
95% C.I.)
(76) 30.6 %
(25.2 - 36.6
95% C.I.)
Prevalence of moderate stunting
(<-2 z-score and >=-3 z-score)
(83) 18.2 %
(14.9 - 22.0
95% C.I.)
(41) 19.7 %
(14.9 - 25.6
95% C.I.)
(42) 16.9 %
(12.8 - 22.1
95% C.I.)
Prevalence of severe stunting
(<-3 z-score)
(86) 18.9 %
(15.5 - 22.7
95% C.I.)
(52) 25.0 %
(19.6 - 31.3
95% C.I.)
(34) 13.7 %
(10.0 - 18.5
95% C.I.)
Table 3.10: Prevalence of stunting by age based on height-for-age z-scores
Severe
stunting
(<-3 z-score)
Moderate
stunting
(>= -3 and <-2
z-score )
Normal
(> = -2 z score)
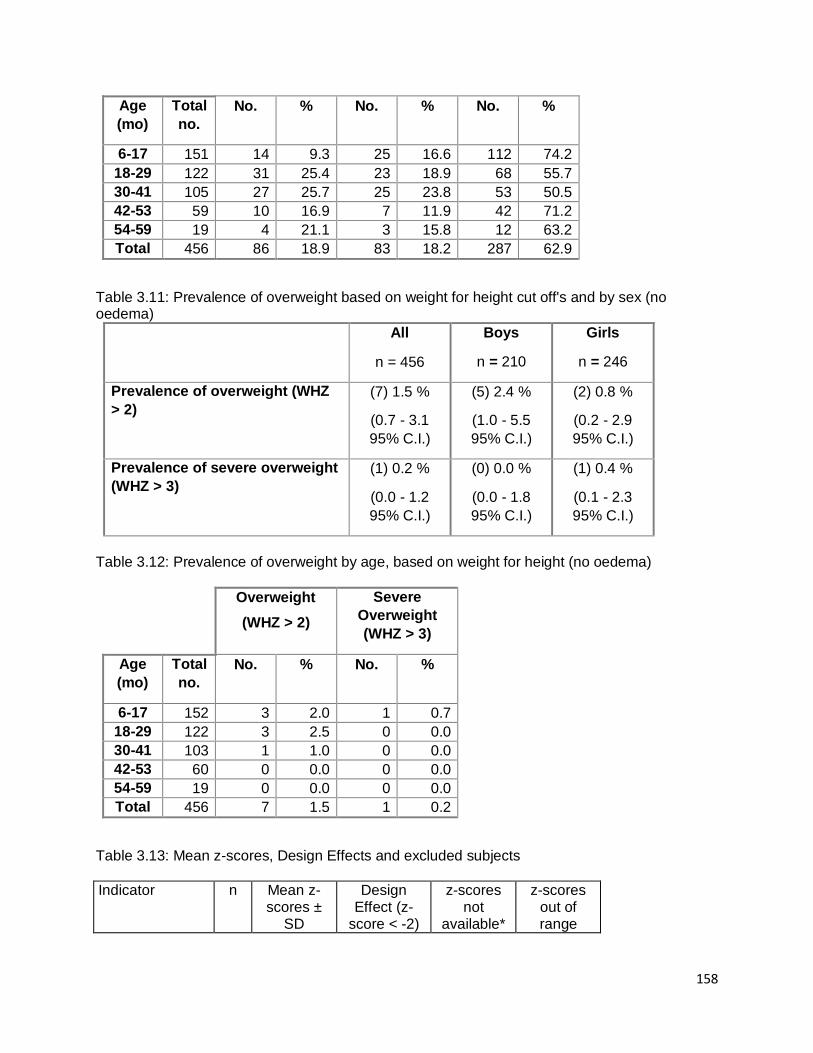
158
Age
(mo)
Total
no.
No. % No. % No. %
6-17 151 14 9.3 25 16.6 112 74.2
18-29 122 31 25.4 23 18.9 68 55.7
30-41 105 27 25.7 25 23.8 53 50.5
42-53 59 10 16.9 7 11.9 42 71.2
54-59 19 4 21.1 3 15.8 12 63.2
Total 456 86 18.9 83 18.2 287 62.9
Table 3.11: Prevalence of overweight based on weight for height cut off's and by sex (no oedema)
All
n = 456
Boys
n = 210
Girls
n = 246
Prevalence of overweight (WHZ
> 2)
(7) 1.5 %
(0.7 - 3.1
95% C.I.)
(5) 2.4 %
(1.0 - 5.5
95% C.I.)
(2) 0.8 %
(0.2 - 2.9
95% C.I.)
Prevalence of severe overweight
(WHZ > 3)
(1) 0.2 %
(0.0 - 1.2
95% C.I.)
(0) 0.0 %
(0.0 - 1.8
95% C.I.)
(1) 0.4 %
(0.1 - 2.3
95% C.I.)
Table 3.12: Prevalence of overweight by age, based on weight for height (no oedema)
Overweight
(WHZ > 2)
Severe
Overweight
(WHZ > 3)
Age
(mo)
Total
no.
No. % No. %
6-17 152 3 2.0 1 0.7
18-29 122 3 2.5 0 0.0
30-41 103 1 1.0 0 0.0
42-53 60 0 0.0 0 0.0
54-59 19 0 0.0 0 0.0
Total 456 7 1.5 1 0.2
Table 3.13: Mean z-scores, Design Effects and excluded subjects
Indicator n Mean z-scores ±
SD
Design Effect (z-
score < -2)
z-scores not
available*
z-scores out of range
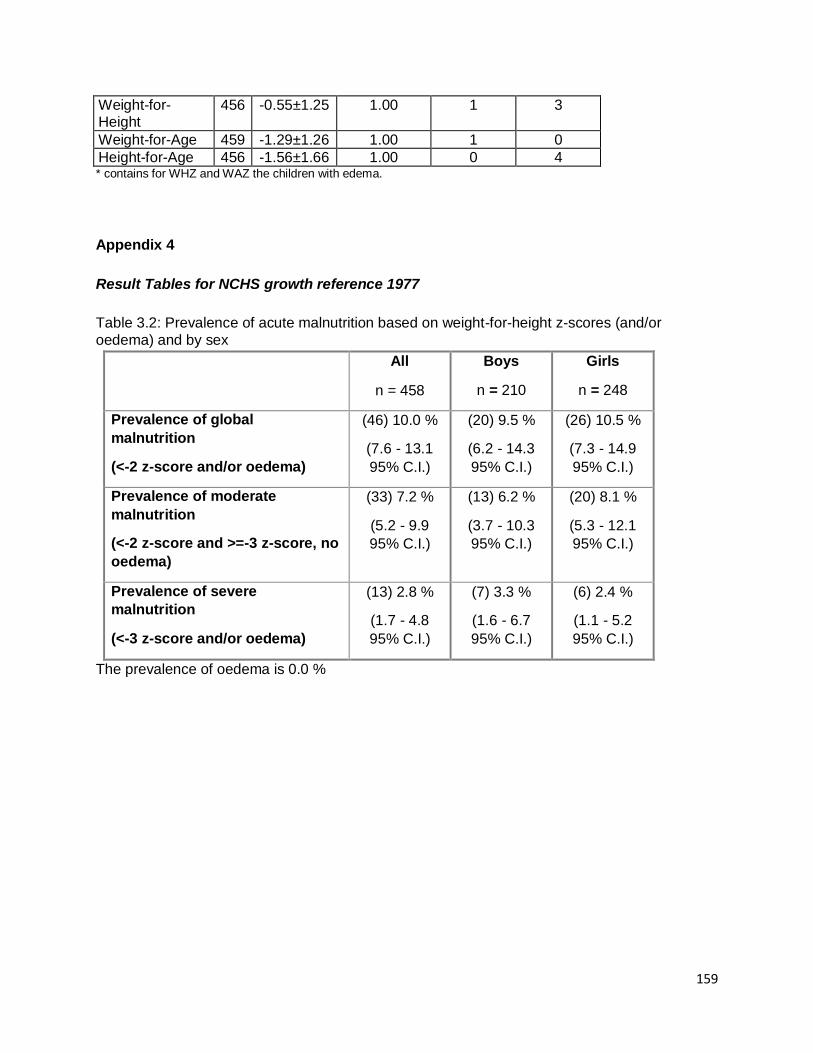
159
Weight-for-Height
456 -0.55±1.25 1.00 1 3
Weight-for-Age 459 -1.29±1.26 1.00 1 0
Height-for-Age 456 -1.56±1.66 1.00 0 4 * contains for WHZ and WAZ the children with edema.
Appendix 4
Result Tables for NCHS growth reference 1977
Table 3.2: Prevalence of acute malnutrition based on weight-for-height z-scores (and/or
oedema) and by sex
All
n = 458
Boys
n = 210
Girls
n = 248
Prevalence of global
malnutrition
(<-2 z-score and/or oedema)
(46) 10.0 %
(7.6 - 13.1
95% C.I.)
(20) 9.5 %
(6.2 - 14.3
95% C.I.)
(26) 10.5 %
(7.3 - 14.9
95% C.I.)
Prevalence of moderate
malnutrition
(<-2 z-score and >=-3 z-score, no
oedema)
(33) 7.2 %
(5.2 - 9.9
95% C.I.)
(13) 6.2 %
(3.7 - 10.3
95% C.I.)
(20) 8.1 %
(5.3 - 12.1
95% C.I.)
Prevalence of severe
malnutrition
(<-3 z-score and/or oedema)
(13) 2.8 %
(1.7 - 4.8
95% C.I.)
(7) 3.3 %
(1.6 - 6.7
95% C.I.)
(6) 2.4 %
(1.1 - 5.2
95% C.I.)
The prevalence of oedema is 0.0 %

160
Table 3.3: Prevalence of acute malnutrition by age, based on weight-for-height z-scores and/or oedema
Severe wasting
(<-3 z-score)
Moderate
wasting
(>= -3 and <-2
z-score )
Normal
(> = -2 z score)
Oedema
Age
(mo)
Total
no.
No. % No. % No. % No. %
6-17 152 2 1.3 14 9.2 136 89.5 0 0.0
18-29 123 5 4.1 11 8.9 107 87.0 0 0.0
30-41 104 4 3.8 5 4.8 95 91.3 0 0.0
42-53 60 2 3.3 2 3.3 56 93.3 0 0.0
54-59 19 0 0.0 1 5.3 18 94.7 0 0.0
Total 458 13 2.8 33 7.2 412 90.0 0 0.0
Table 3.4: Distribution of acute malnutrition and oedema based on weight-for-height z-scores
<-3 z-score >=-3 z-score
Oedema present Marasmic kwashiorkor
No. 0
(0.0 %)
Kwashiorkor
No. 0
(0.0 %)
Oedema absent Marasmic
No. 14
(3.1 %)
Not severely malnourished
No. 445
(96.9 %)
Table 3.5: Prevalence of acute malnutrition based on the percentage of the median and/or oedema
n = 458
Prevalence of global acute
malnutrition
(<80% and/or oedema)
(38) 8.3 %
(6.1 - 11.2 95%
C.I.)
Prevalence of moderate acute
malnutrition
(<80% and >= 70%, no oedema)
(32) 7.0 %
(5.0 - 9.7 95%
C.I.)
Prevalence of severe acute
malnutrition
(6) 1.3 %

161
(<70% and/or oedema) (0.6 - 2.8 95%
C.I.)
Table 3.6: Prevalence of malnutrition by age, based on weight-for-height percentage of the median and oedema
Severe
wasting
(<70% median)
Moderate
wasting
(>=70% and
<80% median)
Normal
(> =80%
median)
Oedema
Age
(mo)
Total
no.
No. % No. % No. % No. %
6-17 152 1 0.7 9 5.9 142 93.4 0 0.0
18-29 123 2 1.6 13 10.6 108 87.8 0 0.0
30-41 104 3 2.9 5 4.8 96 92.3 0 0.0
42-53 60 0 0.0 4 6.7 56 93.3 0 0.0
54-59 19 0 0.0 1 5.3 18 94.7 0 0.0
Total 458 6 1.3 32 7.0 420 91.7 0 0.0
Table 3.7: Prevalence of underweight based on weight-for-age z-scores by sex
All
n = 459
Boys
n = 211
Girls
n = 248
Prevalence of underweight
(<-2 z-score)
(156) 34.0 %
(29.8 - 38.4
95% C.I.)
(83) 39.3 %
(33.0 - 46.1
95% C.I.)
(73) 29.4 %
(24.1 - 35.4
95% C.I.)
Prevalence of moderate
underweight
(<-2 z-score and >=-3 z-score)
(118) 25.7 %
(21.9 - 29.9
95% C.I.)
(60) 28.4 %
(22.8 - 34.9
95% C.I.)
(58) 23.4 %
(18.5 - 29.0
95% C.I.)
Prevalence of severe
underweight
(<-3 z-score)
(38) 8.3 %
(6.1 - 11.2
95% C.I.)
(23) 10.9 %
(7.4 - 15.8
95% C.I.)
(15) 6.0 %
(3.7 - 9.7
95% C.I.)
Table 3.8: Prevalence of underweight by age, based on weight-for-age z-scores
Severe
underweight
(<-3 z-score)
Moderate
underweight
(>= -3 and <-2
z-score )
Normal
(> = -2 z score)
Oedema
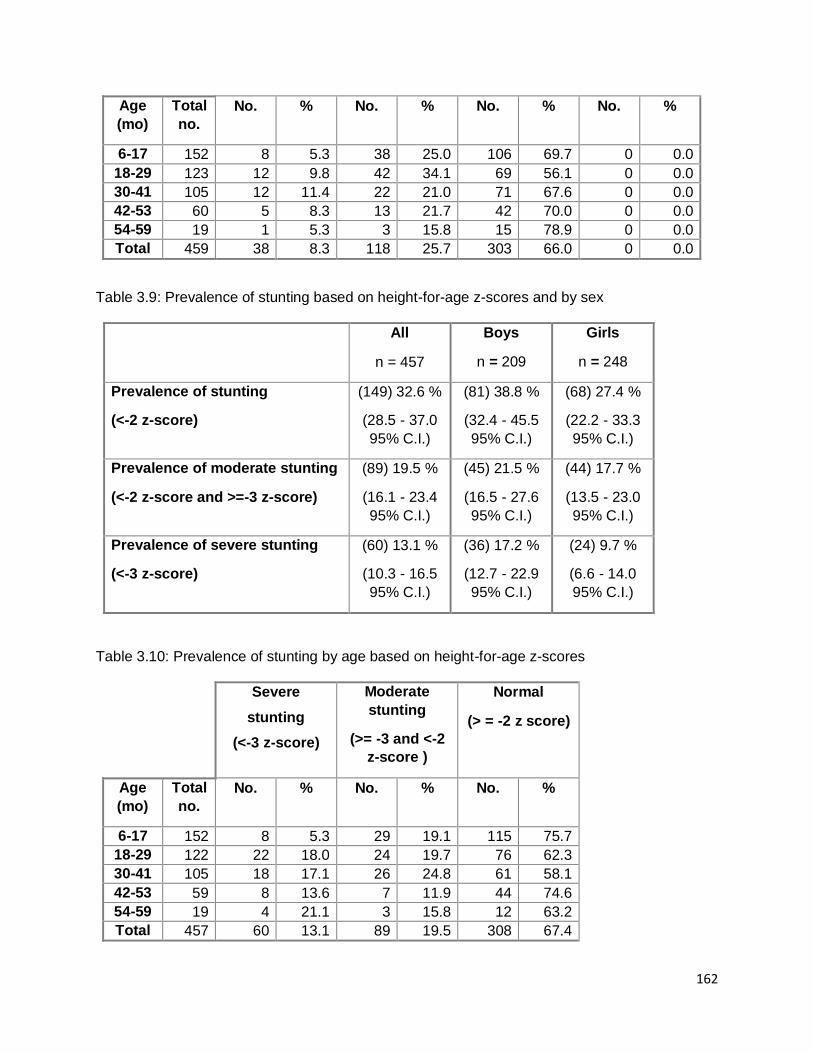
162
Age
(mo)
Total
no.
No. % No. % No. % No. %
6-17 152 8 5.3 38 25.0 106 69.7 0 0.0
18-29 123 12 9.8 42 34.1 69 56.1 0 0.0
30-41 105 12 11.4 22 21.0 71 67.6 0 0.0
42-53 60 5 8.3 13 21.7 42 70.0 0 0.0
54-59 19 1 5.3 3 15.8 15 78.9 0 0.0
Total 459 38 8.3 118 25.7 303 66.0 0 0.0
Table 3.9: Prevalence of stunting based on height-for-age z-scores and by sex
All
n = 457
Boys
n = 209
Girls
n = 248
Prevalence of stunting
(<-2 z-score)
(149) 32.6 %
(28.5 - 37.0
95% C.I.)
(81) 38.8 %
(32.4 - 45.5
95% C.I.)
(68) 27.4 %
(22.2 - 33.3
95% C.I.)
Prevalence of moderate stunting
(<-2 z-score and >=-3 z-score)
(89) 19.5 %
(16.1 - 23.4
95% C.I.)
(45) 21.5 %
(16.5 - 27.6
95% C.I.)
(44) 17.7 %
(13.5 - 23.0
95% C.I.)
Prevalence of severe stunting
(<-3 z-score)
(60) 13.1 %
(10.3 - 16.5
95% C.I.)
(36) 17.2 %
(12.7 - 22.9
95% C.I.)
(24) 9.7 %
(6.6 - 14.0
95% C.I.)
Table 3.10: Prevalence of stunting by age based on height-for-age z-scores
Severe
stunting
(<-3 z-score)
Moderate
stunting
(>= -3 and <-2
z-score )
Normal
(> = -2 z score)
Age
(mo)
Total
no.
No. % No. % No. %
6-17 152 8 5.3 29 19.1 115 75.7
18-29 122 22 18.0 24 19.7 76 62.3
30-41 105 18 17.1 26 24.8 61 58.1
42-53 59 8 13.6 7 11.9 44 74.6
54-59 19 4 21.1 3 15.8 12 63.2
Total 457 60 13.1 89 19.5 308 67.4

163
Table 3.11: Prevalence of overweight based on weight for height cut off's and by sex (no oedema)
All
n = 458
Boys
n = 210
Girls
n = 248
Prevalence of overweight (WHZ
> 2)
(2) 0.4 %
(0.1 - 1.6
95% C.I.)
(0) 0.0 %
(0.0 - 1.8
95% C.I.)
(2) 0.8 %
(0.2 - 2.9
95% C.I.)
Prevalence of severe overweight
(WHZ > 3)
(1) 0.2 %
(0.0 - 1.2
95% C.I.)
(0) 0.0 %
(0.0 - 1.8
95% C.I.)
(1) 0.4 %
(0.1 - 2.2
95% C.I.)
Table 3.12: Prevalence of overweight by age, based on weight for height (no oedema)
Overweight
(WHZ > 2)
Severe
Overweight
(WHZ > 3)
Age
(mo)
Total
no.
No. % No. %
6-17 152 2 1.3 1 0.7
18-29 123 0 0.0 0 0.0
30-41 104 0 0.0 0 0.0
42-53 60 0 0.0 0 0.0
54-59 19 0 0.0 0 0.0
Total 458 2 0.4 1 0.2
Table 3.13: Mean z-scores, Design Effects and excluded subjects
Indicator n Mean z-scores ±
SD
Design Effect (z-
score < -2)
z-scores not
available*
z-scores out of range
Weight-for-Height
458 -0.76±1.08 1.00 1 1
Weight-for-Age 459 -1.48±1.19 1.00 1 0
Height-for-Age 457 -1.36±1.60 1.00 0 3 * contains for WHZ and WAZ the children with edema.

164
Plausibility check for: Kotido_above6.as
Standard/Reference used for z-score calculation: WHO standards 2006
(If it is not mentioned, flagged data is included in the evaluation. Some parts of this plausibility report are
more for advanced users and can be skipped for a standard evaluation)
Overall data quality
Criteria Flags* Unit Excel. Good Accept Problematic Score
Flagged data Incl % 0-2.5 >2.5-5.0 >5.0-7.5 >7.5
(% of in-range subjects) 0 5 10 20 5 (3.3 %)
Overall Sex ratio Incl p >0.1 >0.05 >0.001 <=0.001
(Significant chi square) 0 2 4 10 2 (p=0.076)
Overall Age distrib Incl p >0.1 >0.05 >0.001 <=0.001
(Significant chi square) 0 2 4 10 10 (p=0.000)
Dig pref score - weight Incl # 0-7 8-12 13-20 > 20
0 2 4 10 0 (6)
Dig pref score - height Incl # 0-7 8-12 13-20 > 20
0 2 4 10 10 (27)
Dig pref score - MUAC Incl # 0-7 8-12 13-20 > 20
0 2 4 10 0 (0)
Standard Dev WHZ Excl SD <1.1 <1.15 <1.20 >=1.20
. and and and or
. Excl SD >0.9 >0.85 >0.80 <=0.80
0 2 6 20 2 (1.12)
Skewness WHZ Excl # <±0.2 <±0.4 <±0.6 >=±0.6
0 1 3 5 0 (-0.08)
Kurtosis WHZ Excl # <±0.2 <±0.4 <±0.6 >=±0.6
0 1 3 5 1 (-0.20)
Poisson dist WHZ-2 Excl p >0.05 >0.01 >0.001 <=0.001
0 1 3 5 0 (p=)
OVERALL SCORE WHZ = 0-9 10-14 15-24 >25 30 %
The overall score of this survey is 30 %, this is problematic.
There were no duplicate entries detected.
Missing data:

165
WEIGHT: Line=174/ID=4251
Percentage of children with no exact birthday: 100 %
Anthropometric Indices likely to be in error (-3 to 3 for WHZ, -3 to 3 for HAZ, -3 to 3 for WAZ,
from observed mean - chosen in Options panel - these values will be flagged and should be excluded
from analysis for a nutrition survey in emergencies. For other surveys this might not be the best
procedure e.g. when the percentage of overweight children has to be calculated):
Line=12/ID=40404: HAZ (-7.112), WAZ (-4.669), Age may be incorrect
Line=15/ID=40602: HAZ (-5.995), Height may be incorrect
Line=17/ID=41205: HAZ (-5.282), WAZ (-4.516), Age may be incorrect
Line=34/ID=40517: HAZ (2.299), Age may be incorrect
Line=35/ID=43005: WHZ (-6.477), HAZ (3.165), Height may be incorrect
Line=42/ID=42310: WHZ (-5.321), Height may be incorrect
Line=46/ID=41108: HAZ (4.027), WAZ (1.983), Age may be incorrect
Line=57/ID=42611: WHZ (-3.911), Weight may be incorrect
Line=61/ID=41017: HAZ (3.316), Age may be incorrect
Line=69/ID=40103: HAZ (1.459), Age may be incorrect
Line=85/ID=41508: WHZ (2.610), Weight may be incorrect
Line=88/ID=41905: HAZ (-4.951), Age may be incorrect
Line=93/ID=42810: WHZ (-4.788), Weight may be incorrect
Line=101/ID=42713: WHZ (-4.512), HAZ (2.160), Height may be incorrect
Line=116/ID=41915: HAZ (-5.101), Age may be incorrect
Line=132/ID=41609: WHZ (-3.928), Weight may be incorrect
Line=180/ID=42920: WHZ (-4.823), WAZ (-4.528), Weight may be incorrect
Line=183/ID=42206: HAZ (-5.924), Age may be incorrect
Line=191/ID=41315: HAZ (1.790), Age may be incorrect
Line=200/ID=42706: HAZ (-5.339), WAZ (-4.316), Age may be incorrect
Line=217/ID=41009: WHZ (2.723), Height may be incorrect
Line=226/ID=42508: HAZ (-5.511), Age may be incorrect
Line=227/ID=40107: HAZ (-5.486), Age may be incorrect
Line=228/ID=40120: WHZ (-3.767), Weight may be incorrect
Line=230/ID=42107: HAZ (-6.394), WAZ (-4.712), Age may be incorrect

166
Line=242/ID=41911: HAZ (1.516), Age may be incorrect
Line=254/ID=41006: HAZ (2.527), Height may be incorrect
Line=302/ID=40312: WHZ (3.802), Height may be incorrect
Line=311/ID=43018: HAZ (2.502), Age may be incorrect
Line=322/ID=40404: HAZ (6.743), WAZ (3.599), Age may be incorrect
Line=331/ID=42105: HAZ (-5.404), WAZ (-4.344), Age may be incorrect
Line=338/ID=42804: HAZ (-5.145), WAZ (-4.395), Age may be incorrect
Line=339/ID=42804: HAZ (-5.103), WAZ (-4.973), Age may be incorrect
Line=344/ID=42020: WAZ (1.772), Age may be incorrect
Line=376/ID=41511: HAZ (3.493), WAZ (2.075), Age may be incorrect
Line=377/ID=43008: WHZ (-5.175), HAZ (6.282), Height may be incorrect
Line=379/ID=40718: WAZ (1.838), Weight may be incorrect
Line=398/ID=41406: HAZ (3.555), Height may be incorrect
Line=399/ID=42009: WHZ (2.887), HAZ (-5.604), Height may be incorrect
Line=400/ID=42103: HAZ (3.901), WAZ (2.017), Age may be incorrect
Line=416/ID=41118: WHZ (-4.045), Weight may be incorrect
Line=418/ID=42319: HAZ (2.110), WAZ (2.459), Age may be incorrect
Line=426/ID=42519: HAZ (4.948), WAZ (1.922), Age may be incorrect
Line=429/ID=42703: HAZ (1.644), Age may be incorrect
Line=441/ID=41608: HAZ (2.330), Height may be incorrect
Line=444/ID=40303: HAZ (-4.984), Age may be incorrect
Line=456/ID=42805: HAZ (-4.954), Age may be incorrect
Line=457/ID=40716: WHZ (-3.814), HAZ (-5.028), WAZ (-4.972)
Percentage of values flagged with SMART flags:WHZ: 3.3 %, HAZ: 7.8 %, WAZ: 3.8 %
Age distribution:
Month 6 : #################
Month 7 : ##############
Month 8 : ################
Month 9 : ##############

167
Month 10 : #############
Month 11 : #############
Month 12 : ############
Month 13 : #########
Month 14 : #########
Month 15 : #####
Month 16 : ########
Month 17 : ######################
Month 18 : ###############
Month 19 : ##########
Month 20 : #######
Month 21 : #########
Month 22 : ########
Month 23 : ##########
Month 24 : ############
Month 25 : ######
Month 26 : ##############
Month 27 : #########
Month 28 : ############
Month 29 : ###########
Month 30 : #################
Month 31 : #########
Month 32 : ##########
Month 33 : #####
Month 34 : ##########
Month 35 : ############
Month 36 : ####
Month 37 : ######
Month 38 : #####
Month 39 : #######

168
Month 40 : #########
Month 41 : ############
Month 42 : ##########
Month 43 : ###
Month 44 : ####
Month 45 : ########
Month 46 : ###
Month 47 : ########
Month 48 : ###
Month 49 : #####
Month 50 : ###
Month 51 : #######
Month 52 : ##
Month 53 : ####
Month 54 : ####
Month 55 : ####
Month 56 : ###
Month 57 : ####
Month 58 : ##
Month 59 : ##
Age ratio of 6-29 months to 30-59 months: 1.49 (The value should be around 0.85).
Statistical evaluation of sex and age ratios (using Chi squared statistic):
Age cat. mo. boys girls total ratio boys/girls
-------------------------------------------------------------------------------------
6 to 17 12 63/49.0 (1.3) 89/57.8 (1.5) 152/106.7 (1.4) 0.71
18 to 29 12 56/47.7 (1.2) 67/56.3 (1.2) 123/104.1 (1.2) 0.84
30 to 41 12 47/46.3 (1.0) 59/54.6 (1.1) 106/100.9 (1.1) 0.80
42 to 53 12 34/45.5 (0.7) 26/53.7 (0.5) 60/99.3 (0.6) 1.31
54 to 59 6 11/22.5 (0.5) 8/26.6 (0.3) 19/49.1 (0.4) 1.38
-------------------------------------------------------------------------------------
6 to 59 54 211/230.0 (0.9) 249/230.0 (1.1) 0.85

169
The data are expressed as observed number/expected number (ratio of obs/expect)
Overall sex ratio: p-value = 0.076 (boys and girls equally represented)
Overall age distribution: p-value = 0.000 (significant difference)
Overall age distribution for boys: p-value = 0.006 (significant difference)
Overall age distribution for girls: p-value = 0.000 (significant difference)
Overall sex/age distribution: p-value = 0.000 (significant difference)
Digit preference Weight:
Digit .0 : ###############################################################
Digit .1 : #############################################
Digit .2 : ################################################
Digit .3 : #########################################
Digit .4 : ################################
Digit .5 : ############################################
Digit .6 : ##############################################
Digit .7 : ######################################################
Digit .8 : ######################################
Digit .9 : ################################################
Digit preference score: 6 (0-7 excellent, 8-12 good, 13-20 acceptable and > 20 problematic)
p-value for chi2: 0.116
Digit preference Height:
Digit .0 : ################################################
Digit .1 : ##############
Digit .2 : ##############
Digit .3 : #############
Digit .4 : ########
Digit .5 : ############################
Digit .6 : ##########
Digit .7 : ######

170
Digit .8 : ######
Digit .9 : #######
Digit preference score: 27 (0-7 excellent, 8-12 good, 13-20 acceptable and > 20 problematic)
p-value for chi2: 0.000 (significant difference)
Evaluation of Standard deviation, Normal distribution, Skewness and Kurtosis using the 3
exclusion (Flag) procedures
. no exclusion exclusion from exclusion from
. reference mean observed mean
. (WHO flags) (SMART flags)
WHZ
Standard Deviation SD: 1.32 1.25 1.12
(The SD should be between 0.8 and 1.2)
Prevalence (< -2)
observed: 12.1% 11.6% 10.0%
calculated with current SD: 14.3% 12.5% 9.4%
calculated with a SD of 1: 8.0% 7.5% 7.0%
HAZ
Standard Deviation SD: 1.77 1.66 1.29
(The SD should be between 0.8 and 1.2)
Prevalence (< -2)
observed: 37.2% 37.1% 36.3%
calculated with current SD: 40.0% 39.6% 37.9%
calculated with a SD of 1: 32.6% 33.1% 34.5%
WAZ
Standard Deviation SD: 1.27 1.27 1.10
(The SD should be between 0.8 and 1.2)
Prevalence (< -2)
observed: 25.2% 25.2% 24.1%
calculated with current SD: 28.9% 28.9% 25.9%
calculated with a SD of 1: 24.0% 24.0% 23.8%
Results for Shapiro-Wilk test for normally (Gaussian) distributed data:
WHZ p= 0.000 p= 0.007 p= 0.240
HAZ p= 0.000 p= 0.000 p= 0.007

171
WAZ p= 0.010 p= 0.010 p= 0.176
(If p < 0.05 then the data are not normally distributed. If p > 0.05 you can consider the data
normally distributed)
Skewness
WHZ -0.52 -0.23 -0.08
HAZ 0.56 0.34 0.03
WAZ -0.06 -0.06 -0.18
If the value is:
-below minus 0.4 there is a relative excess of wasted/stunted/underweight subjects in the sample
-between minus 0.4 and minus 0.2, there may be a relative excess of wasted/stunted/underweight
subjects in the sample.
-between minus 0.2 and plus 0.2, the distribution can be considered as symmetrical.
-between 0.2 and 0.4, there may be an excess of obese/tall/overweight subjects in the sample.
-above 0.4, there is an excess of obese/tall/overweight subjects in the sample
Kurtosis
WHZ 1.64 0.76 -0.20
HAZ 2.34 1.05 -0.57
WAZ 0.72 0.72 -0.20
Kurtosis characterizes the relative size of the body versus the tails of the distribution.
Positive kurtosis indicates relatively large tails and small body. Negative kurtosis indicates
relatively large body and small tails.
If the absolute value is:
-above 0.4 it indicates a problem. There might have been a problem with data collection or
sampling.
-between 0.2 and 0.4, the data may be affected with a problem.
-less than an absolute value of 0.2 the distribution can be considered as normal.
Are the data of the same quality at the beginning and the end of the clusters?
Evaluation of the SD for WHZ depending upon the order the cases are measured within each cluster (if
one cluster per day is measured then this will be related to the time of the day the measurement is made).
Time SD for WHZ
point 0.8 0.9 1.0 1.1 1.2 1.3 1.4 1.5 1.6 1.7 1.8 1.9 2.0 2.1 2.2 2.3
(when n is much less than the average number of subjects per cluster different symbols are used:
0 for n < 80% and ~ for n < 40%; The numbers marked "f" are the numbers of SMART flags found in
the different time points)
Analysis by Team

172
Team 1 999
n = 1 459
Percentage of values flagged with SMART flags:
WHZ: 0.0 4.9
HAZ: 0.0 7.8
WAZ: 0.0 5.3
Age ratio of 6-29 months to 30-59 months:
1.48
Sex ratio (male/female):
0.84
Digit preference Weight (%):
.0 : 0 14
.1 : 0 10
.2 : 0 10
.3 : 0 9
.4 : 0 7
.5 : 0 10
.6 : 0 10
.7 : 0 12
.8 : 0 8
.9 : 100 10
DPS: 100 6
Digit preference score (0-7 excellent, 8-12 good, 13-20 acceptable and > 20 problematic)
Digit preference Height (%):
.0 : 0 31
.1 : 0 9
.2 : 0 9
.3 : 100 8
.4 : 0 5
.5 : 0 18

173
.6 : 0 6
.7 : 0 4
.8 : 0 4
.9 : 0 5
DPS: 100 27
Digit preference score (0-7 excellent, 8-12 good, 13-20 acceptable and > 20 problematic)
Standard deviation of WHZ:
SD 0.00
Prevalence (< -2) observed: %
Prevalence (< -2) calculated with current SD: %
Prevalence (< -2) calculated with a SD of 1: %
Standard deviation of HAZ:
SD 0.00
observed: %
calculated with current SD: %
calculated with a SD of 1: %
Statistical evaluation of sex and age ratios (using Chi squared statistic) for:
Team 1:
Age cat. mo. boys girls total ratio boys/girls
-------------------------------------------------------------------------------------
6 to 17 12 1/0.2 (4.3) 0/0.0 1/0.2
18 to 29 12 0/0.2 (0.0) 0/0.0 0/0.2
30 to 41 12 0/0.2 (0.0) 0/0.0 0/0.2
42 to 53 12 0/0.2 (0.0) 0/0.0 0/0.2
54 to 59 6 0/0.1 (0.0) 0/0.0 0/0.1
-------------------------------------------------------------------------------------
6 to 59 54 1/0.5 (2.0) 0/0.5 (0.0)
The data are expressed as observed number/expected number (ratio of obs/expect)
Overall sex ratio: p-value = 0.317 (boys and girls equally represented)
Overall age distribution: p-value = 0.507 (as expected)

174
Overall age distribution for boys: p-value = 0.507 (as expected)
Overall sex/age distribution: p-value = 0.107 (as expected)
Team 2:
Age cat. mo. boys girls total ratio boys/girls
-------------------------------------------------------------------------------------
6 to 17 12 0/0.0 0/0.0 0/0.0
18 to 29 12 0/0.0 0/0.0 0/0.0
30 to 41 12 0/0.0 0/0.0 0/0.0
42 to 53 12 0/0.0 0/0.0 0/0.0
54 to 59 6 0/0.0 0/0.0 0/0.0
-------------------------------------------------------------------------------------
6 to 59 54 0/0.0 0/0.0
The data are expressed as observed number/expected number (ratio of obs/expect)
Evaluation of the SD for WHZ depending upon the order the cases are measured within each
cluster (if one cluster per day is measured then this will be related to the time of the day the
measurement is made).
Team: 1
Time SD for WHZ
point 0.8 0.9 1.0 1.1 1.2 1.3 1.4 1.5 1.6 1.7 1.8 1.9 2.0 2.1 2.2 2.3
(when n is much less than the average number of subjects per cluster different symbols are used:
0 for n < 80% and ~ for n < 40%; The numbers marked "f" are the numbers of SMART flags found in
the different time points)
Team: 2
(for better comparison it can be helpful to copy/paste part of this report into Excel)

175
Moroto
Model nutrition assessment report - Moroto (based on the Save the Children Fund emergency nutrition assessment handbook)
Executive summary (one to two pages only)
GAM: 18.5 % (15.1 - 22.3 95% C.I.)
SAM : 2.7 % (1.6 - 4.7 95% C.I.)
3. Results 3.1 Anthropometric results (based on WHO standards 2006):
Definitions of acute malnutrition should be given (for example, global acute malnutrition is defined as <-2 z scores weight-for-height and/or oedema, severe acute malnutrition is defined as <-3z scores weight-for-height and/or oedema) Exclusion of z-scores from Zero (reference mean) WHO flags: WHZ -5 to 5; HAZ -6 to 6; WAZ -6 to 5 Table 3.1: Distribution of age and sex of sample
Boys Girls Total Ratio
AGE (mo) no. % no. % no. % Boy:girl
6-17 93 53.1 82 46.9 175 39.1 1.1
18-29 65 47.1 73 52.9 138 30.8 0.9
30-41 35 40.7 51 59.3 86 19.2 0.7
42-53 15 39.5 23 60.5 38 8.5 0.7
54-59 6 54.5 5 45.5 11 2.5 1.2
Total 214 47.8 234 52.2 448 100.0 0.9
Table 3.2: Prevalence of acute malnutrition based on weight-for-height z-scores (and/or oedema) and by sex
All
n = 439
Boys
n = 210
Girls
n = 229
Prevalence of global
malnutrition
(<-2 z-score and/or oedema)
(81) 18.5 %
(15.1 - 22.3
95% C.I.)
(44) 21.0 %
(16.0 - 27.0
95% C.I.)
(37) 16.2 %
(12.0 - 21.5
95% C.I.)

176
Prevalence of moderate
malnutrition
(<-2 z-score and >=-3 z-score, no
oedema)
(69) 15.7 %
(12.6 - 19.4
95% C.I.)
(36) 17.1 %
(12.6 - 22.8
95% C.I.)
(33) 14.4 %
(10.4 - 19.5
95% C.I.)
Prevalence of severe
malnutrition
(<-3 z-score and/or oedema)
(12) 2.7 %
(1.6 - 4.7
95% C.I.)
(8) 3.8 %
(1.9 - 7.3
95% C.I.)
(4) 1.7 %
(0.7 - 4.4
95% C.I.)
The prevalence of oedema is 0.0 %
Table 3.3: Prevalence of acute malnutrition by age, based on weight-for-height z-scores and/or oedema
Severe wasting
(<-3 z-score)
Moderate
wasting
(>= -3 and <-2
z-score )
Normal
(> = -2 z score)
Oedema
Age
(mo)
Total
no.
No. % No. % No. % No. %
6-17 174 5 2.9 33 19.0 136 78.2 0 0.0
18-29 135 4 3.0 21 15.6 110 81.5 0 0.0
30-41 82 2 2.4 10 12.2 70 85.4 0 0.0
42-53 37 1 2.7 4 10.8 32 86.5 0 0.0
54-59 11 0 0.0 1 9.1 10 90.9 0 0.0
Total 439 12 2.7 69 15.7 358 81.5 0 0.0
Table 3.4: Distribution of acute malnutrition and oedema based on weight-for-height z-scores
<-3 z-score >=-3 z-score
Oedema present Marasmic kwashiorkor
No. 0
(0.0 %)
Kwashiorkor
No. 0
(0.0 %)
Oedema absent Marasmic
No. 18
(4.0 %)
Not severely malnourished
No. 428
(96.0 %)
Table 3.7: Prevalence of underweight based on weight-for-age z-scores by sex
All Boys Girls

177
n = 445 n = 212 n = 233
Prevalence of underweight
(<-2 z-score)
(187) 42.0 %
(37.5 - 46.7
95% C.I.)
(97) 45.8 %
(39.2 - 52.5
95% C.I.)
(90) 38.6 %
(32.6 - 45.0
95% C.I.)
Prevalence of moderate
underweight
(<-2 z-score and >=-3 z-score)
(109) 24.5 %
(20.7 - 28.7
95% C.I.)
(53) 25.0 %
(19.7 - 31.2
95% C.I.)
(56) 24.0 %
(19.0 - 29.9
95% C.I.)
Prevalence of severe
underweight
(<-3 z-score)
(78) 17.5 %
(14.3 - 21.3
95% C.I.)
(44) 20.8 %
(15.8 - 26.7
95% C.I.)
(34) 14.6 %
(10.6 - 19.7
95% C.I.)
Table 3.8: Prevalence of underweight by age, based on weight-for-age z-scores
Severe
underweight
(<-3 z-score)
Moderate
underweight
(>= -3 and <-2
z-score )
Normal
(> = -2 z score)
Oedema
Age
(mo)
Total
no.
No. % No. % No. % No. %
6-17 174 23 13.2 35 20.1 116 66.7 0 0.0
18-29 137 23 16.8 39 28.5 75 54.7 0 0.0
30-41 85 22 25.9 23 27.1 40 47.1 0 0.0
42-53 38 7 18.4 9 23.7 22 57.9 0 0.0
54-59 11 3 27.3 3 27.3 5 45.5 0 0.0
Total 445 78 17.5 109 24.5 258 58.0 0 0.0
Table 3.9: Prevalence of stunting based on height-for-age z-scores and by sex
All
n = 435
Boys
n = 208
Girls
n = 227
Prevalence of stunting
(<-2 z-score)
(206) 47.4 %
(42.7 - 52.1
95% C.I.)
(107) 51.4 %
(44.7 - 58.1
95% C.I.)
(99) 43.6 %
(37.3 - 50.1
95% C.I.)
Prevalence of moderate stunting
(<-2 z-score and >=-3 z-score)
(92) 21.1 %
(17.6 - 25.2
95% C.I.)
(42) 20.2 %
(15.3 - 26.2
95% C.I.)
(50) 22.0 %
(17.1 - 27.9
95% C.I.)
Prevalence of severe stunting (114) 26.2 % (65) 31.3 % (49) 21.6 %
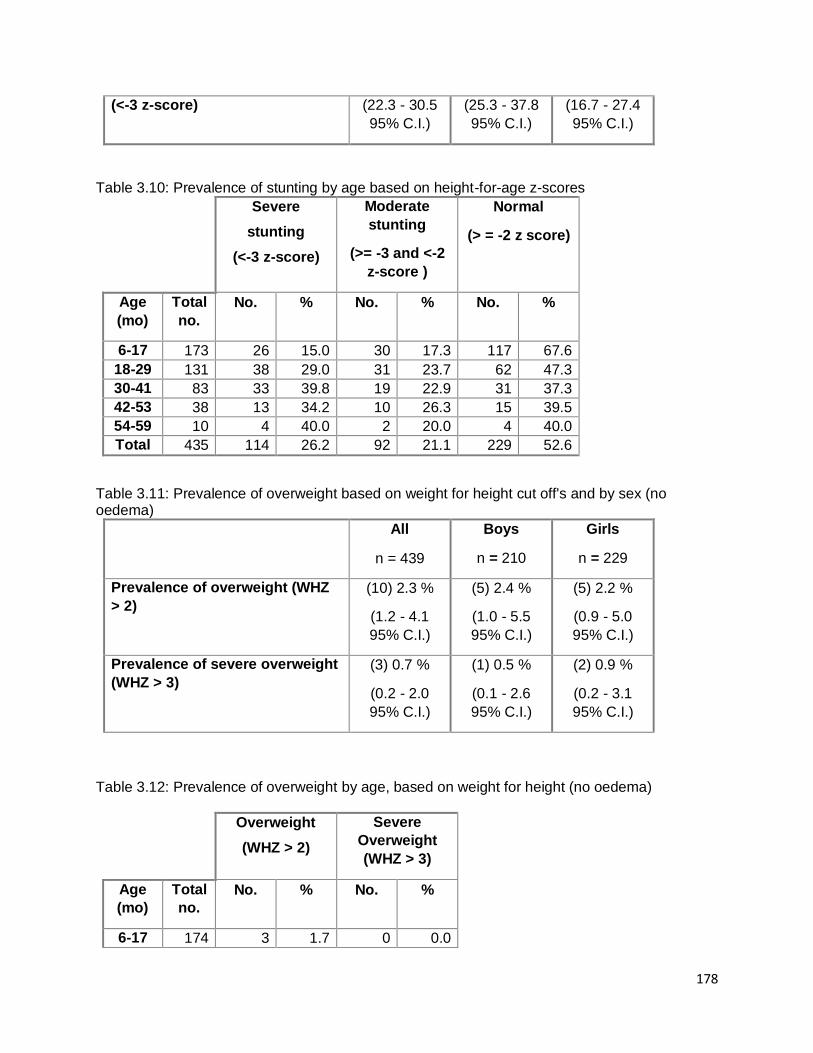
178
(<-3 z-score) (22.3 - 30.5
95% C.I.)
(25.3 - 37.8
95% C.I.)
(16.7 - 27.4
95% C.I.)
Table 3.10: Prevalence of stunting by age based on height-for-age z-scores
Severe
stunting
(<-3 z-score)
Moderate
stunting
(>= -3 and <-2
z-score )
Normal
(> = -2 z score)
Age
(mo)
Total
no.
No. % No. % No. %
6-17 173 26 15.0 30 17.3 117 67.6
18-29 131 38 29.0 31 23.7 62 47.3
30-41 83 33 39.8 19 22.9 31 37.3
42-53 38 13 34.2 10 26.3 15 39.5
54-59 10 4 40.0 2 20.0 4 40.0
Total 435 114 26.2 92 21.1 229 52.6
Table 3.11: Prevalence of overweight based on weight for height cut off's and by sex (no oedema)
All
n = 439
Boys
n = 210
Girls
n = 229
Prevalence of overweight (WHZ
> 2)
(10) 2.3 %
(1.2 - 4.1
95% C.I.)
(5) 2.4 %
(1.0 - 5.5
95% C.I.)
(5) 2.2 %
(0.9 - 5.0
95% C.I.)
Prevalence of severe overweight
(WHZ > 3)
(3) 0.7 %
(0.2 - 2.0
95% C.I.)
(1) 0.5 %
(0.1 - 2.6
95% C.I.)
(2) 0.9 %
(0.2 - 3.1
95% C.I.)
Table 3.12: Prevalence of overweight by age, based on weight for height (no oedema)
Overweight
(WHZ > 2)
Severe
Overweight
(WHZ > 3)
Age
(mo)
Total
no.
No. % No. %
6-17 174 3 1.7 0 0.0

179
18-29 135 4 3.0 1 0.7
30-41 82 2 2.4 1 1.2
42-53 37 1 2.7 1 2.7
54-59 11 0 0.0 0 0.0
Total 439 10 2.3 3 0.7
Table 3.13: Mean z-scores, Design Effects and excluded subjects
Indicator n Mean z-scores ±
SD
Design Effect (z-
score < -2)
z-scores not
available*
z-scores out of range
Weight-for-Height
439 -0.87±1.23 1.00 2 7
Weight-for-Age 445 -1.64±1.47 1.00 0 3
Height-for-Age 435 -1.74±1.99 1.00 0 13 * contains for WHZ and WAZ the children with edema.
Appendix 4
Result Tables for NCHS growth reference 1977
Table 3.2: Prevalence of acute malnutrition based on weight-for-height z-scores (and/or
oedema) and by sex
All
n = 445
Boys
n = 213
Girls
n = 232
Prevalence of global
malnutrition
(<-2 z-score and/or oedema)
(77) 17.3 %
(14.1 - 21.1
95% C.I.)
(40) 18.8 %
(14.1 - 24.6
95% C.I.)
(37) 15.9 %
(11.8 - 21.2
95% C.I.)
Prevalence of moderate
malnutrition
(<-2 z-score and >=-3 z-score, no
oedema)
(65) 14.6 %
(11.6 - 18.2
95% C.I.)
(32) 15.0 %
(10.8 - 20.4
95% C.I.)
(33) 14.2 %
(10.3 - 19.3
95% C.I.)
Prevalence of severe
malnutrition
(<-3 z-score and/or oedema)
(12) 2.7 %
(1.5 - 4.7
95% C.I.)
(8) 3.8 %
(1.9 - 7.2
95% C.I.)
(4) 1.7 %
(0.7 - 4.3
95% C.I.)
The prevalence of oedema is 0.0 %

180
Table 3.3: Prevalence of acute malnutrition by age, based on weight-for-height z-scores and/or oedema
Severe wasting
(<-3 z-score)
Moderate
wasting
(>= -3 and <-2
z-score )
Normal
(> = -2 z score)
Oedema
Age
(mo)
Total
no.
No. % No. % No. % No. %
6-17 174 3 1.7 31 17.8 140 80.5 0 0.0
18-29 137 5 3.6 20 14.6 112 81.8 0 0.0
30-41 85 2 2.4 11 12.9 72 84.7 0 0.0
42-53 38 2 5.3 3 7.9 33 86.8 0 0.0
54-59 11 0 0.0 0 0.0 11 100.0 0 0.0
Total 445 12 2.7 65 14.6 368 82.7 0 0.0
Table 3.4: Distribution of acute malnutrition and oedema based on weight-for-height z-scores
<-3 z-score >=-3 z-score
Oedema present Marasmic kwashiorkor
No. 0
(0.0 %)
Kwashiorkor
No. 0
(0.0 %)
Oedema absent Marasmic
No. 14
(3.1 %)
Not severely malnourished
No. 434
(96.9 %)
Table 3.5: Prevalence of acute malnutrition based on the percentage of the median and/or oedema
n = 445
Prevalence of global acute
malnutrition
(<80% and/or oedema)
(51) 11.5 %
(8.8 - 14.8 95%
C.I.)
Prevalence of moderate acute
malnutrition
(<80% and >= 70%, no oedema)
(44) 9.9 %
(7.4 - 13.0 95%
C.I.)
Prevalence of severe acute
malnutrition
(7) 1.6 %

181
(<70% and/or oedema) (0.8 - 3.2 95%
C.I.)
Table 3.6: Prevalence of malnutrition by age, based on weight-for-height percentage of the median and oedema
Severe
wasting
(<70% median)
Moderate
wasting
(>=70% and
<80% median)
Normal
(> =80%
median)
Oedema
Age
(mo)
Total
no.
No. % No. % No. % No. %
6-17 174 1 0.6 17 9.8 156 89.7 0 0.0
18-29 137 3 2.2 16 11.7 118 86.1 0 0.0
30-41 85 2 2.4 8 9.4 75 88.2 0 0.0
42-53 38 1 2.6 3 7.9 34 89.5 0 0.0
54-59 11 0 0.0 0 0.0 11 100.0 0 0.0
Total 445 7 1.6 44 9.9 394 88.5 0 0.0
Table 3.7: Prevalence of underweight based on weight-for-age z-scores by sex
All
n = 448
Boys
n = 214
Girls
n = 234
Prevalence of underweight
(<-2 z-score)
(218) 48.7 %
(44.1 - 53.3
95% C.I.)
(114) 53.3 %
(46.6 - 59.8
95% C.I.)
(104) 44.4 %
(38.2 - 50.8
95% C.I.)
Prevalence of moderate
underweight
(<-2 z-score and >=-3 z-score)
(136) 30.4 %
(26.3 - 34.8
95% C.I.)
(69) 32.2 %
(26.3 - 38.8
95% C.I.)
(67) 28.6 %
(23.2 - 34.7
95% C.I.)
Prevalence of severe
underweight
(<-3 z-score)
(82) 18.3 %
(15.0 - 22.1
95% C.I.)
(45) 21.0 %
(16.1 - 27.0
95% C.I.)
(37) 15.8 %
(11.7 - 21.0
95% C.I.)
Table 3.8: Prevalence of underweight by age, based on weight-for-age z-scores
Severe
underweight
(<-3 z-score)
Moderate
underweight
(>= -3 and <-2
z-score )
Normal
(> = -2 z score)
Oedema

182
Age
(mo)
Total
no.
No. % No. % No. % No. %
6-17 175 23 13.1 48 27.4 104 59.4 0 0.0
18-29 138 28 20.3 44 31.9 66 47.8 0 0.0
30-41 86 23 26.7 26 30.2 37 43.0 0 0.0
42-53 38 5 13.2 14 36.8 19 50.0 0 0.0
54-59 11 3 27.3 4 36.4 4 36.4 0 0.0
Total 448 82 18.3 136 30.4 230 51.3 0 0.0
Table 3.9: Prevalence of stunting based on height-for-age z-scores and by sex
All
n = 438
Boys
n = 208
Girls
n = 230
Prevalence of stunting
(<-2 z-score)
(186) 42.5 %
(37.9 - 47.1
95% C.I.)
(97) 46.6 %
(40.0 - 53.4
95% C.I.)
(89) 38.7 %
(32.6 - 45.1
95% C.I.)
Prevalence of moderate stunting
(<-2 z-score and >=-3 z-score)
(91) 20.8 %
(17.2 - 24.8
95% C.I.)
(47) 22.6 %
(17.4 - 28.7
95% C.I.)
(44) 19.1 %
(14.6 - 24.7
95% C.I.)
Prevalence of severe stunting
(<-3 z-score)
(95) 21.7 %
(18.1 - 25.8
95% C.I.)
(50) 24.0 %
(18.7 - 30.3
95% C.I.)
(45) 19.6 %
(15.0 - 25.2
95% C.I.)
Table 3.10: Prevalence of stunting by age based on height-for-age z-scores
Severe
stunting
(<-3 z-score)
Moderate
stunting
(>= -3 and <-2
z-score )
Normal
(> = -2 z score)
Age
(mo)
Total
no.
No. % No. % No. %
6-17 173 21 12.1 27 15.6 125 72.3
18-29 133 31 23.3 32 24.1 70 52.6
30-41 84 27 32.1 20 23.8 37 44.0
42-53 38 12 31.6 10 26.3 16 42.1
54-59 10 4 40.0 2 20.0 4 40.0
Total 438 95 21.7 91 20.8 252 57.5
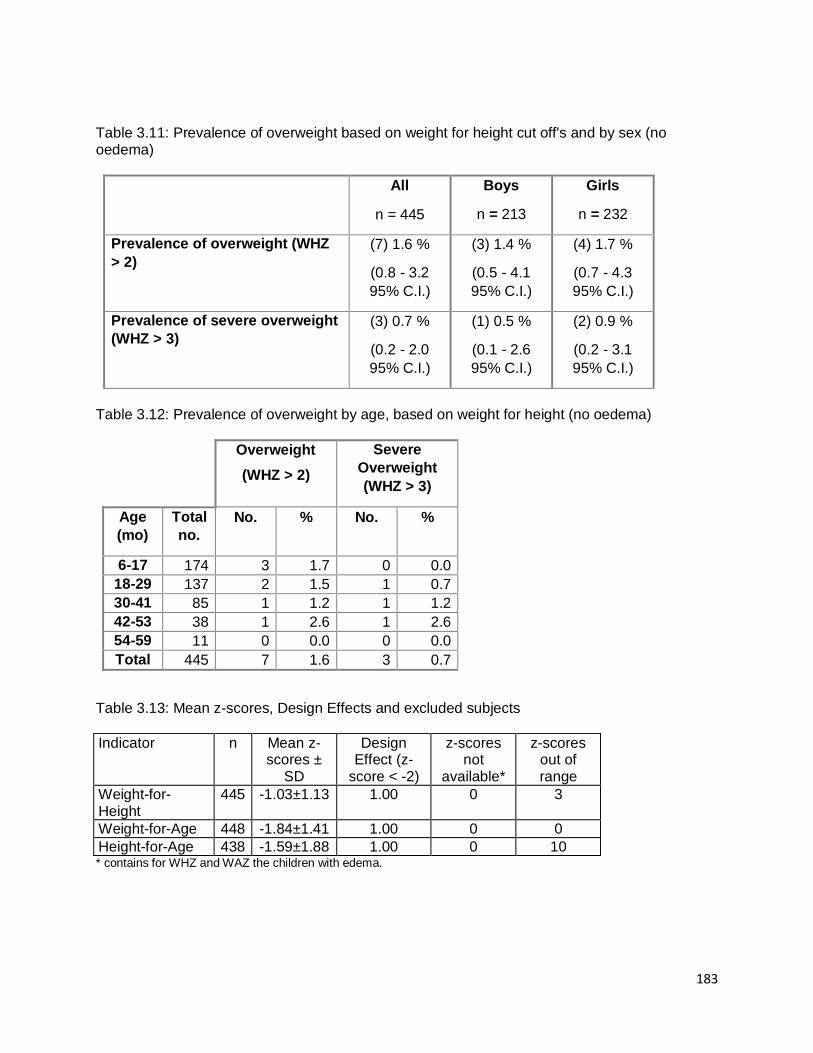
183
Table 3.11: Prevalence of overweight based on weight for height cut off's and by sex (no oedema)
All
n = 445
Boys
n = 213
Girls
n = 232
Prevalence of overweight (WHZ
> 2)
(7) 1.6 %
(0.8 - 3.2
95% C.I.)
(3) 1.4 %
(0.5 - 4.1
95% C.I.)
(4) 1.7 %
(0.7 - 4.3
95% C.I.)
Prevalence of severe overweight
(WHZ > 3)
(3) 0.7 %
(0.2 - 2.0
95% C.I.)
(1) 0.5 %
(0.1 - 2.6
95% C.I.)
(2) 0.9 %
(0.2 - 3.1
95% C.I.)
Table 3.12: Prevalence of overweight by age, based on weight for height (no oedema)
Overweight
(WHZ > 2)
Severe
Overweight
(WHZ > 3)
Age
(mo)
Total
no.
No. % No. %
6-17 174 3 1.7 0 0.0
18-29 137 2 1.5 1 0.7
30-41 85 1 1.2 1 1.2
42-53 38 1 2.6 1 2.6
54-59 11 0 0.0 0 0.0
Total 445 7 1.6 3 0.7
Table 3.13: Mean z-scores, Design Effects and excluded subjects
Indicator n Mean z-scores ±
SD
Design Effect (z-
score < -2)
z-scores not
available*
z-scores out of range
Weight-for-Height
445 -1.03±1.13 1.00 0 3
Weight-for-Age 448 -1.84±1.41 1.00 0 0
Height-for-Age 438 -1.59±1.88 1.00 0 10 * contains for WHZ and WAZ the children with edema.

184
Plausibility check for: Moroto14_above6.as
Standard/Reference used for z-score calculation: WHO standards 2006
(If it is not mentioned, flagged data is included in the evaluation. Some parts of this plausibility report are
more for advanced users and can be skipped for a standard evaluation)
Overall data quality
Criteria Flags* Unit Excel. Good Accept Problematic Score
Flagged data Incl % 0-2.5 >2.5-5.0 >5.0-7.5 >7.5
(% of in-range subjects) 0 5 10 20 5 (4.6 %)
Overall Sex ratio Incl p >0.1 >0.05 >0.001 <=0.001
(Significant chi square) 0 2 4 10 0 (p=0.345)
Overall Age distrib Incl p >0.1 >0.05 >0.001 <=0.001
(Significant chi square) 0 2 4 10 10 (p=0.000)
Dig pref score - weight Incl # 0-7 8-12 13-20 > 20
0 2 4 10 0 (4)
Dig pref score - height Incl # 0-7 8-12 13-20 > 20
0 2 4 10 2 (11)
Dig pref score - MUAC Incl # 0-7 8-12 13-20 > 20
0 2 4 10 0 (0)
Standard Dev WHZ Excl SD <1.1 <1.15 <1.20 >=1.20
. and and and or
. Excl SD >0.9 >0.85 >0.80 <=0.80
0 2 6 20 0 (1.07)
Skewness WHZ Excl # <±0.2 <±0.4 <±0.6 >=±0.6
0 1 3 5 0 (-0.04)
Kurtosis WHZ Excl # <±0.2 <±0.4 <±0.6 >=±0.6
0 1 3 5 1 (-0.32)
Poisson dist WHZ-2 Excl p >0.05 >0.01 >0.001 <=0.001
0 1 3 5 0 (p=)
OVERALL SCORE WHZ = 0-9 10-14 15-24 >25 18 %
The overall score of this survey is 18 %, this is acceptable.

185
There were no duplicate entries detected.
Percentage of children with no exact birthday: 100 %
Anthropometric Indices likely to be in error (-3 to 3 for WHZ, -3 to 3 for HAZ, -3 to 3 for WAZ,
from observed mean - chosen in Options panel - these values will be flagged and should be excluded
from analysis for a nutrition survey in emergencies. For other surveys this might not be the best
procedure e.g. when the percentage of overweight children has to be calculated):
Line=2/ID=50514: WHZ (-5.033), Height may be incorrect
Line=3/ID=50819: HAZ (2.519), Age may be incorrect
Line=6/ID=52401: HAZ (1.721), Height may be incorrect
Line=8/ID=52911: HAZ (1.734), Age may be incorrect
Line=11/ID=52804: WHZ (2.685), Weight may be incorrect
Line=15/ID=51805: HAZ (6.777), WAZ (1.852), Age may be incorrect
Line=18/ID=51805: HAZ (6.457), Age may be incorrect
Line=19/ID=52811: HAZ (1.196), Age may be incorrect
Line=27/ID=52016: HAZ (-4.817), Age may be incorrect
Line=28/ID=51405: WHZ (-6.440), HAZ (6.143), Height may be incorrect
Line=32/ID=53010: HAZ (-4.964), Age may be incorrect
Line=35/ID=51104: WHZ (2.776), Weight may be incorrect
Line=41/ID=50111: HAZ (-8.823), WAZ (-5.899), Age may be incorrect
Line=43/ID=50104: HAZ (-5.029), Age may be incorrect
Line=48/ID=50501: HAZ (-8.355), WAZ (-6.035), Age may be incorrect
Line=55/ID=51903: HAZ (-4.854), Age may be incorrect
Line=57/ID=51116: HAZ (-6.024), Age may be incorrect
Line=58/ID=53006: WAZ (1.366), Age may be incorrect
Line=61/ID=52205: HAZ (-5.923), Age may be incorrect
Line=62/ID=50508: WHZ (2.152), WAZ (1.646), Weight may be incorrect
Line=88/ID=50202: HAZ (1.406), Age may be incorrect
Line=96/ID=52307: HAZ (5.249), WAZ (2.899), Age may be incorrect
Line=97/ID=52805: WHZ (2.339), Weight may be incorrect
Line=101/ID=51812: HAZ (3.926), WAZ (1.975), Age may be incorrect
Line=104/ID=52511: HAZ (-5.277), Age may be incorrect
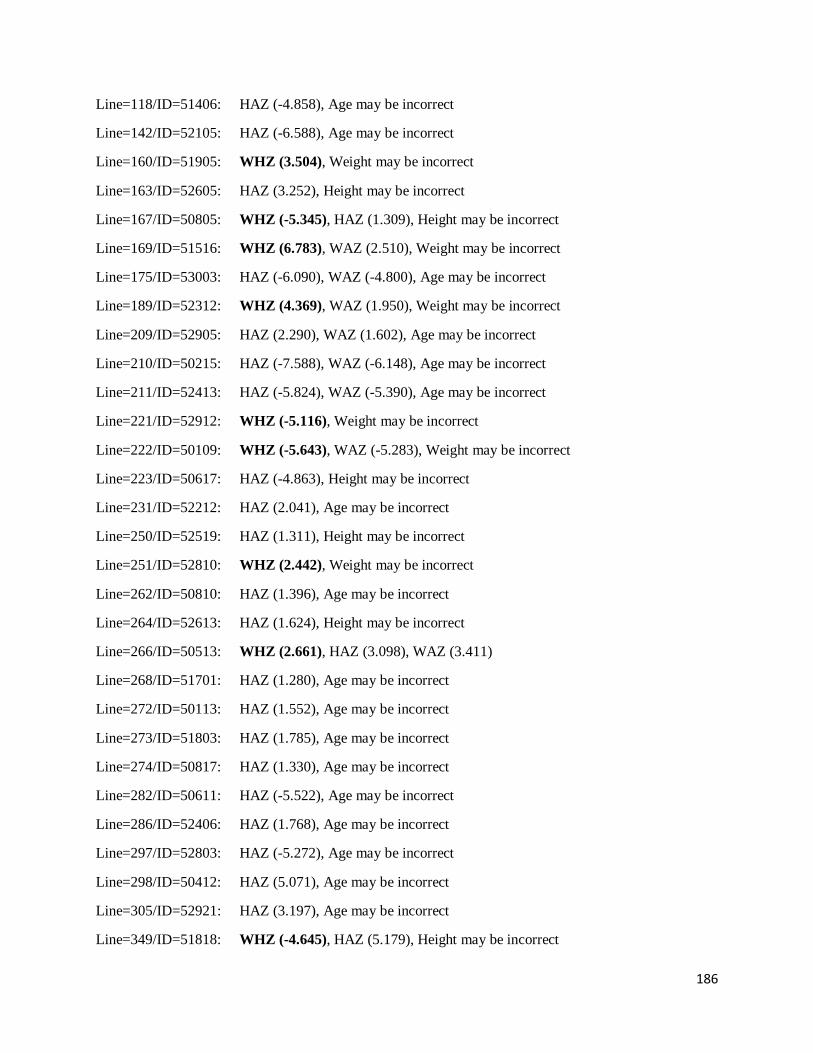
186
Line=118/ID=51406: HAZ (-4.858), Age may be incorrect
Line=142/ID=52105: HAZ (-6.588), Age may be incorrect
Line=160/ID=51905: WHZ (3.504), Weight may be incorrect
Line=163/ID=52605: HAZ (3.252), Height may be incorrect
Line=167/ID=50805: WHZ (-5.345), HAZ (1.309), Height may be incorrect
Line=169/ID=51516: WHZ (6.783), WAZ (2.510), Weight may be incorrect
Line=175/ID=53003: HAZ (-6.090), WAZ (-4.800), Age may be incorrect
Line=189/ID=52312: WHZ (4.369), WAZ (1.950), Weight may be incorrect
Line=209/ID=52905: HAZ (2.290), WAZ (1.602), Age may be incorrect
Line=210/ID=50215: HAZ (-7.588), WAZ (-6.148), Age may be incorrect
Line=211/ID=52413: HAZ (-5.824), WAZ (-5.390), Age may be incorrect
Line=221/ID=52912: WHZ (-5.116), Weight may be incorrect
Line=222/ID=50109: WHZ (-5.643), WAZ (-5.283), Weight may be incorrect
Line=223/ID=50617: HAZ (-4.863), Height may be incorrect
Line=231/ID=52212: HAZ (2.041), Age may be incorrect
Line=250/ID=52519: HAZ (1.311), Height may be incorrect
Line=251/ID=52810: WHZ (2.442), Weight may be incorrect
Line=262/ID=50810: HAZ (1.396), Age may be incorrect
Line=264/ID=52613: HAZ (1.624), Height may be incorrect
Line=266/ID=50513: WHZ (2.661), HAZ (3.098), WAZ (3.411)
Line=268/ID=51701: HAZ (1.280), Age may be incorrect
Line=272/ID=50113: HAZ (1.552), Age may be incorrect
Line=273/ID=51803: HAZ (1.785), Age may be incorrect
Line=274/ID=50817: HAZ (1.330), Age may be incorrect
Line=282/ID=50611: HAZ (-5.522), Age may be incorrect
Line=286/ID=52406: HAZ (1.768), Age may be incorrect
Line=297/ID=52803: HAZ (-5.272), Age may be incorrect
Line=298/ID=50412: HAZ (5.071), Age may be incorrect
Line=305/ID=52921: HAZ (3.197), Age may be incorrect
Line=349/ID=51818: WHZ (-4.645), HAZ (5.179), Height may be incorrect

187
Line=364/ID=52604: WHZ (-4.227), HAZ (5.880), Height may be incorrect
Line=367/ID=52522: HAZ (-5.440), Age may be incorrect
Line=377/ID=51318: HAZ (4.288), WAZ (2.108), Age may be incorrect
Line=378/ID=52618: HAZ (2.217), Age may be incorrect
Line=381/ID=51218: HAZ (-6.044), Age may be incorrect
Line=387/ID=50317: WHZ (3.510), HAZ (-8.677), Height may be incorrect
Line=391/ID=51009: HAZ (-5.048), Age may be incorrect
Line=393/ID=50801: HAZ (3.927), Age may be incorrect
Line=398/ID=50703: WHZ (2.298), HAZ (-7.216), Height may be incorrect
Line=401/ID=52605: HAZ (2.436), Height may be incorrect
Line=418/ID=52516: HAZ (4.554), Age may be incorrect
Line=419/ID=52013: HAZ (1.637), Age may be incorrect
Line=421/ID=51012: WHZ (-4.114), HAZ (-5.267), WAZ (-5.296)
Line=426/ID=51602: HAZ (-5.763), Age may be incorrect
Line=427/ID=50118: HAZ (-5.204), Age may be incorrect
Line=431/ID=50318: HAZ (-8.614), WAZ (-6.508), Age may be incorrect
Line=432/ID=50713: HAZ (2.564), Age may be incorrect
Line=437/ID=50509: HAZ (-5.808), Age may be incorrect
Line=439/ID=52106: WHZ (-6.416), WAZ (-5.251), Weight may be incorrect
Line=440/ID=52612: HAZ (-5.596), WAZ (-4.833), Age may be incorrect
Line=441/ID=50911: HAZ (3.207), WAZ (2.599), Age may be incorrect
Line=442/ID=50606: HAZ (-5.549), Age may be incorrect
Percentage of values flagged with SMART flags:WHZ: 4.6 %, HAZ: 14.3 %, WAZ: 4.8 %
Age distribution:
Month 6 : ############
Month 7 : ##############
Month 8 : #############
Month 9 : ###############
Month 10 : ############
Month 11 : #############

188
Month 12 : #####################
Month 13 : #############
Month 14 : ##############
Month 15 : #################
Month 16 : ################
Month 17 : ###############
Month 18 : ##############
Month 19 : ############
Month 20 : #######
Month 21 : ############
Month 22 : ##########
Month 23 : ###############
Month 24 : ####################
Month 25 : ################
Month 26 : #######
Month 27 : #######
Month 28 : ########
Month 29 : ##########
Month 30 : #######
Month 31 : #########
Month 32 : #########
Month 33 : #######
Month 34 : ########
Month 35 : #########
Month 36 : #########
Month 37 : ####
Month 38 : ######
Month 39 : #########
Month 40 : #######
Month 41 : ##

189
Month 42 : ########
Month 43 : ########
Month 44 : ##
Month 45 : ###
Month 46 :
Month 47 : ######
Month 48 : ##
Month 49 : ###
Month 50 : #
Month 51 : ###
Month 52 : #
Month 53 : #
Month 54 : ###
Month 55 : #
Month 56 : ###
Month 57 : #
Month 58 : #
Month 59 : ##
Age ratio of 6-29 months to 30-59 months: 2.32 (The value should be around 0.85).
Statistical evaluation of sex and age ratios (using Chi squared statistic):
Age cat. mo. boys girls total ratio boys/girls
-------------------------------------------------------------------------------------
6 to 17 12 93/49.7 (1.9) 82/54.3 (1.5) 175/103.9 (1.7) 1.13
18 to 29 12 65/48.4 (1.3) 73/52.9 (1.4) 138/101.3 (1.4) 0.89
30 to 41 12 35/46.9 (0.7) 51/51.3 (1.0) 86/98.2 (0.9) 0.69
42 to 53 12 15/46.2 (0.3) 23/50.5 (0.5) 38/96.7 (0.4) 0.65
54 to 59 6 6/22.8 (0.3) 5/25.0 (0.2) 11/47.8 (0.2) 1.20
-------------------------------------------------------------------------------------
6 to 59 54 214/224.0 (1.0) 234/224.0 (1.0) 0.91
The data are expressed as observed number/expected number (ratio of obs/expect)
Overall sex ratio: p-value = 0.345 (boys and girls equally represented)

190
Overall age distribution: p-value = 0.000 (significant difference)
Overall age distribution for boys: p-value = 0.000 (significant difference)
Overall age distribution for girls: p-value = 0.000 (significant difference)
Overall sex/age distribution: p-value = 0.000 (significant difference)
Digit preference Weight:
Digit .0 : ##############################################
Digit .1 : ######################################
Digit .2 : ######################################################
Digit .3 : ###########################################
Digit .4 : ######################################################
Digit .5 : #########################################
Digit .6 : ################################################
Digit .7 : ###################################
Digit .8 : ##############################################
Digit .9 : ###########################################
Digit preference score: 4 (0-7 excellent, 8-12 good, 13-20 acceptable and > 20 problematic)
p-value for chi2: 0.563
Digit preference Height:
Digit .0 : ######################################
Digit .1 : ##################
Digit .2 : ##########################
Digit .3 : ####################
Digit .4 : ################
Digit .5 : ################################
Digit .6 : ###################
Digit .7 : ################
Digit .8 : ####################
Digit .9 : ##################
Digit preference score: 11 (0-7 excellent, 8-12 good, 13-20 acceptable and > 20 problematic)
p-value for chi2: 0.000 (significant difference)

191
Evaluation of Standard deviation, Normal distribution, Skewness and Kurtosis using the 3
exclusion (Flag) procedures
. no exclusion exclusion from exclusion from
. reference mean observed mean
. (WHO flags) (SMART flags)
WHZ
Standard Deviation SD: 1.40 1.24 1.07
(The SD should be between 0.8 and 1.2)
Prevalence (< -2)
observed: 19.5% 18.4% 18.3%
calculated with current SD: 21.8% 17.9% 15.7%
calculated with a SD of 1: 13.8% 12.8% 14.2%
HAZ
Standard Deviation SD: 2.24 1.99 1.42
(The SD should be between 0.8 and 1.2)
Prevalence (< -2)
observed: 48.2% 47.4% 48.7%
calculated with current SD: 46.6% 44.7% 48.0%
calculated with a SD of 1: 42.4% 39.6% 47.2%
WAZ
Standard Deviation SD: 1.52 1.48 1.29
(The SD should be between 0.8 and 1.2)
Prevalence (< -2)
observed: 42.2% 41.8% 42.0%
calculated with current SD: 41.3% 40.2% 40.0%
calculated with a SD of 1: 36.9% 35.7% 37.2%
Results for Shapiro-Wilk test for normally (Gaussian) distributed data:
WHZ p= 0.000 p= 0.000 p= 0.261
HAZ p= 0.000 p= 0.000 p= 0.001
WAZ p= 0.388 p= 0.511 p= 0.007
(If p < 0.05 then the data are not normally distributed. If p > 0.05 you can consider the data
normally distributed)
Skewness
WHZ 0.18 0.42 -0.04
HAZ 0.49 0.70 0.06
WAZ 0.00 0.14 -0.03
If the value is:

192
-below minus 0.4 there is a relative excess of wasted/stunted/underweight subjects in the sample
-between minus 0.4 and minus 0.2, there may be a relative excess of wasted/stunted/underweight
subjects in the sample.
-between minus 0.2 and plus 0.2, the distribution can be considered as symmetrical.
-between 0.2 and 0.4, there may be an excess of obese/tall/overweight subjects in the sample.
-above 0.4, there is an excess of obese/tall/overweight subjects in the sample
Kurtosis
WHZ 3.79 1.32 -0.32
HAZ 1.87 1.11 -0.74
WAZ 0.44 0.22 -0.66
Kurtosis characterizes the relative size of the body versus the tails of the distribution.
Positive kurtosis indicates relatively large tails and small body. Negative kurtosis indicates
relatively large body and small tails.
If the absolute value is:
-above 0.4 it indicates a problem. There might have been a problem with data collection or
sampling.
-between 0.2 and 0.4, the data may be affected with a problem.
-less than an absolute value of 0.2 the distribution can be considered as normal.
Are the data of the same quality at the beginning and the end of the clusters?
Evaluation of the SD for WHZ depending upon the order the cases are measured within each cluster (if
one cluster per day is measured then this will be related to the time of the day the measurement is made).
Time SD for WHZ
point 0.8 0.9 1.0 1.1 1.2 1.3 1.4 1.5 1.6 1.7 1.8 1.9 2.0 2.1 2.2 2.3
(when n is much less than the average number of subjects per cluster different symbols are used:
0 for n < 80% and ~ for n < 40%; The numbers marked "f" are the numbers of SMART flags found in
the different time points)
Analysis by Team
Team 1 999
n = 1 447
Percentage of values flagged with SMART flags:
WHZ: 7.1
HAZ: 0.0 14.3
WAZ: 6.8
Age ratio of 6-29 months to 30-59 months:
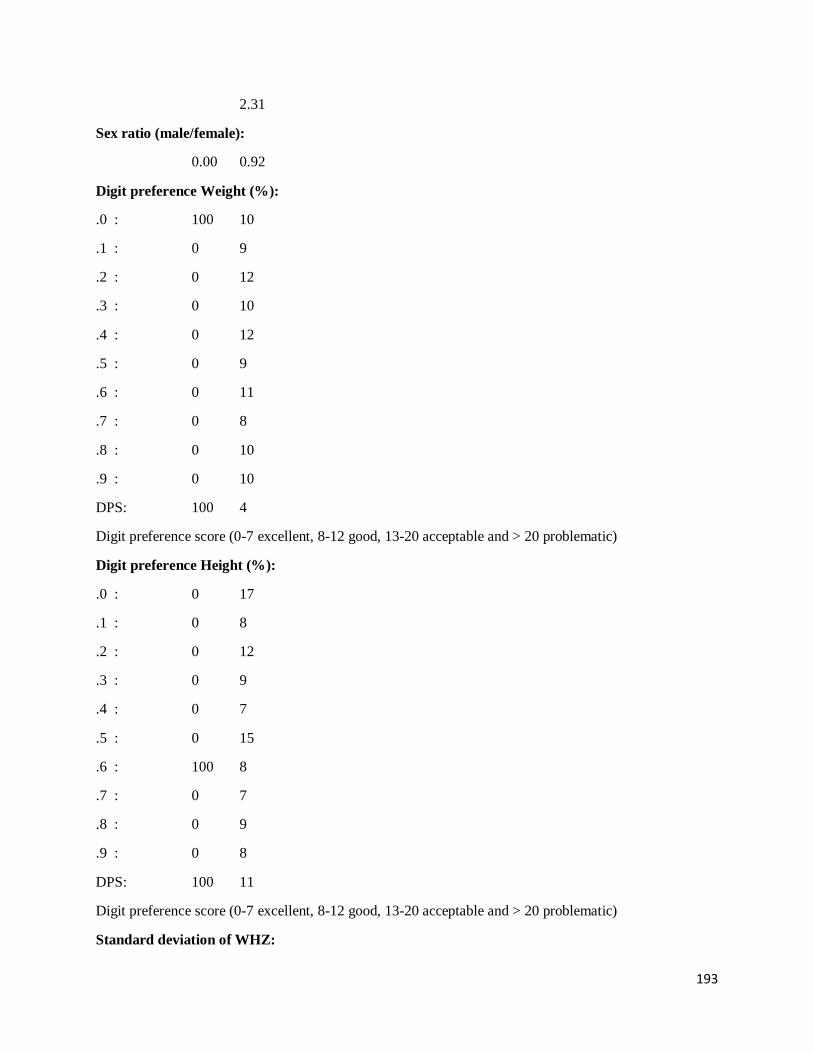
193
2.31
Sex ratio (male/female):
0.00 0.92
Digit preference Weight (%):
.0 : 100 10
.1 : 0 9
.2 : 0 12
.3 : 0 10
.4 : 0 12
.5 : 0 9
.6 : 0 11
.7 : 0 8
.8 : 0 10
.9 : 0 10
DPS: 100 4
Digit preference score (0-7 excellent, 8-12 good, 13-20 acceptable and > 20 problematic)
Digit preference Height (%):
.0 : 0 17
.1 : 0 8
.2 : 0 12
.3 : 0 9
.4 : 0 7
.5 : 0 15
.6 : 100 8
.7 : 0 7
.8 : 0 9
.9 : 0 8
DPS: 100 11
Digit preference score (0-7 excellent, 8-12 good, 13-20 acceptable and > 20 problematic)
Standard deviation of WHZ:

194
SD
Prevalence (< -2) observed: %
Prevalence (< -2) calculated with current SD: %
Prevalence (< -2) calculated with a SD of 1: %
Standard deviation of HAZ:
SD 0.00
observed: %
calculated with current SD: %
calculated with a SD of 1: %
Statistical evaluation of sex and age ratios (using Chi squared statistic) for:
Team 1:
Age cat. mo. boys girls total ratio boys/girls
-------------------------------------------------------------------------------------
6 to 17 12 0/0.0 0/0.2 (0.0) 0/0.2 (0.0)
18 to 29 12 0/0.0 1/0.2 (4.4) 1/0.2 (4.4) 0.00
30 to 41 12 0/0.0 0/0.2 (0.0) 0/0.2 (0.0)
42 to 53 12 0/0.0 0/0.2 (0.0) 0/0.2 (0.0)
54 to 59 6 0/0.0 0/0.1 (0.0) 0/0.1 (0.0)
-------------------------------------------------------------------------------------
6 to 59 54 0/0.5 (0.0) 1/0.5 (2.0) 0.00
The data are expressed as observed number/expected number (ratio of obs/expect)
Overall sex ratio: p-value = 0.317 (boys and girls equally represented)
Overall age distribution: p-value = 0.490 (as expected)
Overall age distribution for girls: p-value = 0.490 (as expected)
Overall sex/age distribution: p-value = 0.098 (as expected)
Team 2:
Age cat. mo. boys girls total ratio boys/girls
-------------------------------------------------------------------------------------
6 to 17 12 0/0.0 0/0.0 0/0.0
18 to 29 12 0/0.0 0/0.0 0/0.0
30 to 41 12 0/0.0 0/0.0 0/0.0
42 to 53 12 0/0.0 0/0.0 0/0.0
54 to 59 6 0/0.0 0/0.0 0/0.0

195
-------------------------------------------------------------------------------------
6 to 59 54 0/0.0 0/0.0
The data are expressed as observed number/expected number (ratio of obs/expect)
Nakapiripirit
Model nutrition assessment report - Nakapiripirit
(based on the Save the Children Fund emergency nutrition assessment handbook)
Executive summary (one to two pages only)
GAM: 11.6 % (8.8 - 15.1 95% C.I.)
SAM : 5.5 % (3.7 - 8.2 95% C.I.)
3. Results
3.1 Anthropometric results (based on WHO standards 2006):
Definitions of acute malnutrition should be given (for example, global acute malnutrition is
defined as <-2 z scores weight-for-height and/or oedema, severe acute malnutrition is defined
as <-3z scores weight-for-height and/or oedema)
Exclusion of z-scores from Zero (reference mean) WHO flags: WHZ -5 to 5; HAZ -6 to 6; WAZ -
6 to 5
Table 3.1: Distribution of age and sex of sample
Boys Girls Total Ratio
AGE (mo) no. % no. % no. % Boy:girl
6-17 94 57.7 69 42.3 163 40.9 1.4
18-29 73 54.5 61 45.5 134 33.6 1.2
30-41 39 60.0 26 40.0 65 16.3 1.5
42-53 16 48.5 17 51.5 33 8.3 0.9
54-59 1 25.0 3 75.0 4 1.0 0.3
Total 223 55.9 176 44.1 399 100.0 1.3
Table 3.2: Prevalence of acute malnutrition based on weight-for-height z-scores (and/or
oedema) and by sex
All
n = 398
Boys
n = 222
Girls
n = 176
Prevalence of global
malnutrition
(<-2 z-score and/or oedema)
(46) 11.6 %
(8.8 - 15.1
95% C.I.)
(32) 14.4 %
(10.4 - 19.6
95% C.I.)
(14) 8.0 %
(4.8 - 12.9
95% C.I.)
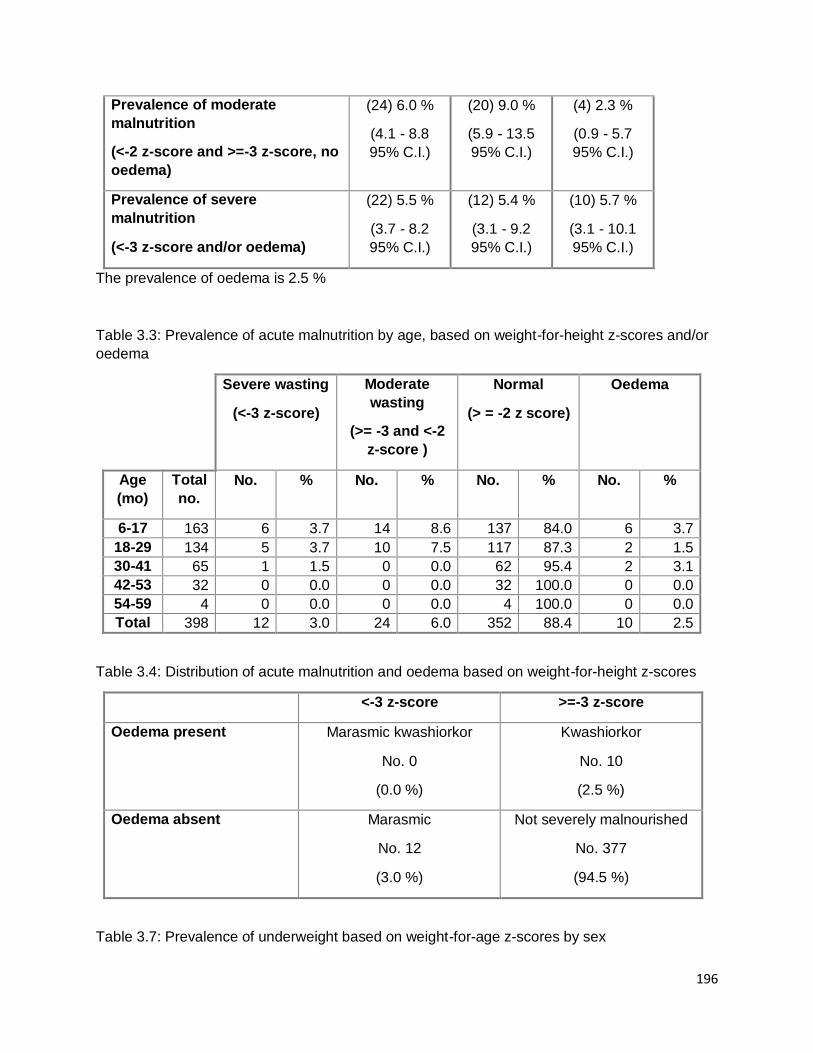
196
Prevalence of moderate
malnutrition
(<-2 z-score and >=-3 z-score, no
oedema)
(24) 6.0 %
(4.1 - 8.8
95% C.I.)
(20) 9.0 %
(5.9 - 13.5
95% C.I.)
(4) 2.3 %
(0.9 - 5.7
95% C.I.)
Prevalence of severe
malnutrition
(<-3 z-score and/or oedema)
(22) 5.5 %
(3.7 - 8.2
95% C.I.)
(12) 5.4 %
(3.1 - 9.2
95% C.I.)
(10) 5.7 %
(3.1 - 10.1
95% C.I.)
The prevalence of oedema is 2.5 %
Table 3.3: Prevalence of acute malnutrition by age, based on weight-for-height z-scores and/or
oedema
Severe wasting
(<-3 z-score)
Moderate
wasting
(>= -3 and <-2
z-score )
Normal
(> = -2 z score)
Oedema
Age
(mo)
Total
no.
No. % No. % No. % No. %
6-17 163 6 3.7 14 8.6 137 84.0 6 3.7
18-29 134 5 3.7 10 7.5 117 87.3 2 1.5
30-41 65 1 1.5 0 0.0 62 95.4 2 3.1
42-53 32 0 0.0 0 0.0 32 100.0 0 0.0
54-59 4 0 0.0 0 0.0 4 100.0 0 0.0
Total 398 12 3.0 24 6.0 352 88.4 10 2.5
Table 3.4: Distribution of acute malnutrition and oedema based on weight-for-height z-scores
<-3 z-score >=-3 z-score
Oedema present Marasmic kwashiorkor
No. 0
(0.0 %)
Kwashiorkor
No. 10
(2.5 %)
Oedema absent Marasmic
No. 12
(3.0 %)
Not severely malnourished
No. 377
(94.5 %)
Table 3.7: Prevalence of underweight based on weight-for-age z-scores by sex

197
All
n = 389
Boys
n = 219
Girls
n = 170
Prevalence of underweight
(<-2 z-score)
(118) 30.3 %
(26.0 - 35.1
95% C.I.)
(80) 36.5 %
(30.4 - 43.1
95% C.I.)
(38) 22.4 %
(16.7 - 29.2
95% C.I.)
Prevalence of moderate
underweight
(<-2 z-score and >=-3 z-score)
(82) 21.1 %
(17.3 - 25.4
95% C.I.)
(52) 23.7 %
(18.6 - 29.8
95% C.I.)
(30) 17.6 %
(12.7 - 24.1
95% C.I.)
Prevalence of severe
underweight
(<-3 z-score)
(36) 9.3 %
(6.8 - 12.5
95% C.I.)
(28) 12.8 %
(9.0 - 17.9
95% C.I.)
(8) 4.7 %
(2.4 - 9.0
95% C.I.)
Table 3.8: Prevalence of underweight by age, based on weight-for-age z-scores
Severe
underweight
(<-3 z-score)
Moderate
underweight
(>= -3 and <-2
z-score )
Normal
(> = -2 z score)
Oedema
Age
(mo)
Total
no.
No. % No. % No. % No. %
6-17 157 14 8.9 26 16.6 117 74.5 6 3.8
18-29 132 17 12.9 32 24.2 83 62.9 2 1.5
30-41 63 3 4.8 18 28.6 42 66.7 2 3.2
42-53 33 2 6.1 5 15.2 26 78.8 0 0.0
54-59 4 0 0.0 1 25.0 3 75.0 0 0.0
Total 389 36 9.3 82 21.1 271 69.7 10 2.6
Table 3.9: Prevalence of stunting based on height-for-age z-scores and by sex
All
n = 395
Boys
n = 220
Girls
n = 175
Prevalence of stunting
(<-2 z-score)
(170) 43.0 %
(38.2 - 48.0
95% C.I.)
(103) 46.8 %
(40.3 - 53.4
95% C.I.)
(67) 38.3 %
(31.4 - 45.7
95% C.I.)
Prevalence of moderate stunting (99) 25.1 % (54) 24.5 % (45) 25.7 %

198
(<-2 z-score and >=-3 z-score) (21.0 - 29.6
95% C.I.)
(19.3 - 30.6
95% C.I.)
(19.8 - 32.7
95% C.I.)
Prevalence of severe stunting
(<-3 z-score)
(71) 18.0 %
(14.5 - 22.1
95% C.I.)
(49) 22.3 %
(17.3 - 28.2
95% C.I.)
(22) 12.6 %
(8.5 - 18.3
95% C.I.)
Table 3.10: Prevalence of stunting by age based on height-for-age z-scores
Severe
stunting
(<-3 z-score)
Moderate
stunting
(>= -3 and <-2
z-score )
Normal
(> = -2 z score)
Age
(mo)
Total
no.
No. % No. % No. %
6-17 162 19 11.7 35 21.6 108 66.7
18-29 133 29 21.8 40 30.1 64 48.1
30-41 64 16 25.0 16 25.0 32 50.0
42-53 32 6 18.8 8 25.0 18 56.3
54-59 4 1 25.0 0 0.0 3 75.0
Total 395 71 18.0 99 25.1 225 57.0
Table 3.11: Prevalence of overweight based on weight for height cut off's and by sex (no
oedema)
All
n = 398
Boys
n = 222
Girls
n = 176
Prevalence of overweight (WHZ
> 2)
(5) 1.3 %
(0.5 - 2.9
95% C.I.)
(3) 1.4 %
(0.5 - 3.9
95% C.I.)
(2) 1.1 %
(0.3 - 4.0
95% C.I.)
Prevalence of severe overweight
(WHZ > 3)
(0) 0.0 %
(0.0 - 1.0
95% C.I.)
(0) 0.0 %
(0.0 - 1.7
95% C.I.)
(0) 0.0 %
(0.0 - 2.1
95% C.I.)
Table 3.12: Prevalence of overweight by age, based on weight for height (no oedema)
Overweight
(WHZ > 2)
Severe
Overweight
(WHZ > 3)

199
Age
(mo)
Total
no.
No. % No. %
6-17 163 4 2.5 0 0.0
18-29 134 0 0.0 0 0.0
30-41 65 1 1.5 0 0.0
42-53 32 0 0.0 0 0.0
54-59 4 0 0.0 0 0.0
Total 398 5 1.3 0 0.0
Table 3.13: Mean z-scores, Design Effects and excluded subjects
Indicator n Mean z-
scores ±
SD
Design
Effect (z-
score < -2)
z-scores
not
available*
z-scores
out of
range
Weight-for-
Height
388 -0.58±1.15 1.00 10 1
Weight-for-Age 389 -1.37±1.30 1.00 10 0
Height-for-Age 395 -1.76±1.54 1.00 0 4
* contains for WHZ and WAZ the children with edema.
Appendix 4
Result Tables for NCHS growth reference 1977
Table 3.2: Prevalence of acute malnutrition based on weight-for-height z-scores (and/or
oedema) and by sex
All
n = 398
Boys
n = 222
Girls
n = 176
Prevalence of global
malnutrition
(<-2 z-score and/or oedema)
(44) 11.1 %
(8.3 - 14.5
95% C.I.)
(27) 12.2 %
(8.5 - 17.1
95% C.I.)
(17) 9.7 %
(6.1 - 14.9
95% C.I.)
Prevalence of moderate
malnutrition
(<-2 z-score and >=-3 z-score, no
oedema)
(26) 6.5 %
(4.5 - 9.4
95% C.I.)
(17) 7.7 %
(4.8 - 11.9
95% C.I.)
(9) 5.1 %
(2.7 - 9.4
95% C.I.)

200
Prevalence of severe
malnutrition
(<-3 z-score and/or oedema)
(18) 4.5 %
(2.9 - 7.0
95% C.I.)
(10) 4.5 %
(2.5 - 8.1
95% C.I.)
(8) 4.5 %
(2.3 - 8.7
95% C.I.)
The prevalence of oedema is 2.5 %
Table 3.3: Prevalence of acute malnutrition by age, based on weight-for-height z-scores and/or
oedema
Severe wasting
(<-3 z-score)
Moderate
wasting
(>= -3 and <-2
z-score )
Normal
(> = -2 z score)
Oedema
Age
(mo)
Total
no.
No. % No. % No. % No. %
6-17 163 4 2.5 12 7.4 141 86.5 6 3.7
18-29 134 4 3.0 13 9.7 115 85.8 2 1.5
30-41 65 0 0.0 1 1.5 62 95.4 2 3.1
42-53 32 0 0.0 0 0.0 32 100.0 0 0.0
54-59 4 0 0.0 0 0.0 4 100.0 0 0.0
Total 398 8 2.0 26 6.5 354 88.9 10 2.5
Table 3.4: Distribution of acute malnutrition and oedema based on weight-for-height z-scores
<-3 z-score >=-3 z-score
Oedema present Marasmic kwashiorkor
No. 0
(0.0 %)
Kwashiorkor
No. 10
(2.5 %)
Oedema absent Marasmic
No. 8
(2.0 %)
Not severely malnourished
No. 381
(95.5 %)
Table 3.5: Prevalence of acute malnutrition based on the percentage of the median and/or
oedema
n = 398

201
Prevalence of global acute
malnutrition
(<80% and/or oedema)
(32) 8.0 %
(5.8 - 11.1 95%
C.I.)
Prevalence of moderate acute
malnutrition
(<80% and >= 70%, no oedema)
(20) 5.0 %
(3.3 - 7.6 95%
C.I.)
Prevalence of severe acute
malnutrition
(<70% and/or oedema)
(12) 3.0 %
(1.7 - 5.2 95%
C.I.)
Table 3.6: Prevalence of malnutrition by age, based on weight-for-height percentage of the
median and oedema
Severe
wasting
(<70% median)
Moderate
wasting
(>=70% and
<80% median)
Normal
(> =80%
median)
Oedema
Age
(mo)
Total
no.
No. % No. % No. % No. %
6-17 163 1 0.6 11 6.7 145 89.0 6 3.7
18-29 134 1 0.7 8 6.0 123 91.8 2 1.5
30-41 65 0 0.0 1 1.5 62 95.4 2 3.1
42-53 32 0 0.0 0 0.0 32 100.0 0 0.0
54-59 4 0 0.0 0 0.0 4 100.0 0 0.0
Total 398 2 0.5 20 5.0 366 92.0 10 2.5
Table 3.7: Prevalence of underweight based on weight-for-age z-scores by sex
All
n = 389
Boys
n = 219
Girls
n = 170
Prevalence of underweight
(<-2 z-score)
(154) 39.6 %
(34.9 - 44.5
95% C.I.)
(90) 41.1 %
(34.8 - 47.7
95% C.I.)
(64) 37.6 %
(30.7 - 45.1
95% C.I.)
Prevalence of moderate
underweight
(<-2 z-score and >=-3 z-score)
(109) 28.0 %
(23.8 - 32.7
95% C.I.)
(59) 26.9 %
(21.5 - 33.2
95% C.I.)
(50) 29.4 %
(23.1 - 36.7
95% C.I.)

202
Prevalence of severe
underweight
(<-3 z-score)
(45) 11.6 %
(8.8 - 15.1
95% C.I.)
(31) 14.2 %
(10.2 - 19.4
95% C.I.)
(14) 8.2 %
(5.0 - 13.3
95% C.I.)
Table 3.8: Prevalence of underweight by age, based on weight-for-age z-scores
Severe
underweight
(<-3 z-score)
Moderate
underweight
(>= -3 and <-2
z-score )
Normal
(> = -2 z score)
Oedema
Age
(mo)
Total
no.
No. % No. % No. % No. %
6-17 157 17 10.8 40 25.5 100 63.7 6 3.8
18-29 132 21 15.9 43 32.6 68 51.5 2 1.5
30-41 63 5 7.9 19 30.2 39 61.9 2 3.2
42-53 33 2 6.1 6 18.2 25 75.8 0 0.0
54-59 4 0 0.0 1 25.0 3 75.0 0 0.0
Total 389 45 11.6 109 28.0 235 60.4 10 2.6
Table 3.9: Prevalence of stunting based on height-for-age z-scores and by sex
All
n = 395
Boys
n = 220
Girls
n = 175
Prevalence of stunting
(<-2 z-score)
(145) 36.7 %
(32.1 - 41.6
95% C.I.)
(87) 39.5 %
(33.3 - 46.1
95% C.I.)
(58) 33.1 %
(26.6 - 40.4
95% C.I.)
Prevalence of moderate stunting
(<-2 z-score and >=-3 z-score)
(90) 22.8 %
(18.9 - 27.2
95% C.I.)
(51) 23.2 %
(18.1 - 29.2
95% C.I.)
(39) 22.3 %
(16.8 - 29.0
95% C.I.)
Prevalence of severe stunting
(<-3 z-score)
(55) 13.9 %
(10.9 - 17.7
95% C.I.)
(36) 16.4 %
(12.1 - 21.8
95% C.I.)
(19) 10.9 %
(7.1 - 16.3
95% C.I.)
Table 3.10: Prevalence of stunting by age based on height-for-age z-scores
Severe
stunting
Moderate
stunting
Normal

203
(<-3 z-score) (>= -3 and <-2
z-score )
(> = -2 z score)
Age
(mo)
Total
no.
No. % No. % No. %
6-17 162 15 9.3 32 19.8 115 71.0
18-29 133 24 18.0 31 23.3 78 58.6
30-41 64 9 14.1 21 32.8 34 53.1
42-53 32 6 18.8 6 18.8 20 62.5
54-59 4 1 25.0 0 0.0 3 75.0
Total 395 55 13.9 90 22.8 250 63.3
Table 3.11: Prevalence of overweight based on weight for height cut off's and by sex (no
oedema)
All
n = 398
Boys
n = 222
Girls
n = 176
Prevalence of overweight (WHZ
> 2)
(3) 0.8 %
(0.3 - 2.2
95% C.I.)
(1) 0.5 %
(0.1 - 2.5
95% C.I.)
(2) 1.1 %
(0.3 - 4.0
95% C.I.)
Prevalence of severe overweight
(WHZ > 3)
(0) 0.0 %
(0.0 - 1.0
95% C.I.)
(0) 0.0 %
(0.0 - 1.7
95% C.I.)
(0) 0.0 %
(0.0 - 2.1
95% C.I.)
Table 3.12: Prevalence of overweight by age, based on weight for height (no oedema)
Overweight
(WHZ > 2)
Severe
Overweight
(WHZ > 3)
Age
(mo)
Total
no.
No. % No. %
6-17 163 3 1.8 0 0.0
18-29 134 0 0.0 0 0.0
30-41 65 0 0.0 0 0.0
42-53 32 0 0.0 0 0.0
54-59 4 0 0.0 0 0.0
Total 398 3 0.8 0 0.0
Table 3.13: Mean z-scores, Design Effects and excluded subjects

204
Indicator n Mean z-scores
± SD
Design Effect
(z-score < -2)
z-scores not
available*
z-scores out
of range
Weight-for-Height 388 -0.76±1.00 1.00 10 1
Weight-for-Age 389 -1.58±1.24 1.00 10 0
Height-for-Age 395 -1.57±1.40 1.00 0 4 * contains for WHZ and WAZ the children with edema.
Plausibility check for: Napirit14_above6.as
Standard/Reference used for z-score calculation: WHO standards 2006
(If it is not mentioned, flagged data is included in the evaluation. Some parts of this plausibility report are
more for advanced users and can be skipped for a standard evaluation)
Overall data quality
Criteria Flags* Unit Excel. Good Accept Problematic Score
Flagged data Incl % 0-2.5 >2.5-5.0 >5.0-7.5 >7.5
(% of in-range subjects) 0 5 10 20 0 (1.5 %)
Overall Sex ratio Incl p >0.1 >0.05 >0.001 <=0.001
(Significant chi square) 0 2 4 10 4 (p=0.019)
Overall Age distrib Incl p >0.1 >0.05 >0.001 <=0.001
(Significant chi square) 0 2 4 10 10 (p=0.000)
Dig pref score - weight Incl # 0-7 8-12 13-20 > 20
0 2 4 10 0 (4)
Dig pref score - height Incl # 0-7 8-12 13-20 > 20
0 2 4 10 0 (7)
Dig pref score - MUAC Incl # 0-7 8-12 13-20 > 20
0 2 4 10 0 (0)
Standard Dev WHZ Excl SD <1.1 <1.15 <1.20 >=1.20
. and and and or
. Excl SD >0.9 >0.85 >0.80 <=0.80
0 2 6 20 0 (1.09)
Skewness WHZ Excl # <±0.2 <±0.4 <±0.6 >=±0.6
0 1 3 5 0 (-0.05)
Kurtosis WHZ Excl # <±0.2 <±0.4 <±0.6 >=±0.6
0 1 3 5 0 (-0.11)
Poisson dist WHZ-2 Excl p >0.05 >0.01 >0.001 <=0.001
0 1 3 5 0 (p=)
OVERALL SCORE WHZ = 0-9 10-14 15-24 >25 14 %

205
The overall score of this survey is 14 %, this is good.
There were no duplicate entries detected.
Percentage of children with no exact birthday: 100 %
Anthropometric Indices likely to be in error (-3 to 3 for WHZ, -3 to 3 for HAZ, -3 to 3 for WAZ,
from observed mean - chosen in Options panel - these values will be flagged and should be excluded
from analysis for a nutrition survey in emergencies. For other surveys this might not be the best
procedure e.g. when the percentage of overweight children has to be calculated):
Line=1/ID=60304: HAZ (-4.880), Age may be incorrect
Line=15/ID=60519: HAZ (-5.415), Age may be incorrect
Line=50/ID=61715: HAZ (-5.670), Age may be incorrect
Line=60/ID=60709: HAZ (-7.108), WAZ (-5.466), Age may be incorrect
Line=68/ID=60402: WHZ (-4.002), WAZ (-4.652), Weight may be incorrect
Line=76/ID=62516: HAZ (1.381), Age may be incorrect
Line=95/ID=61701: HAZ (2.357), Age may be incorrect
Line=109/ID=61712: HAZ (-5.258), Age may be incorrect
Line=131/ID=60414: WHZ (8.975), HAZ (-8.107), Height may be incorrect
Line=155/ID=61415: HAZ (-8.231), Height may be incorrect
Line=164/ID=61507: HAZ (-5.324), Age may be incorrect
Line=199/ID=60915: HAZ (-5.178), Age may be incorrect
Line=208/ID=62203: HAZ (1.397), Age may be incorrect
Line=222/ID=60810: HAZ (8.756), WAZ (3.496), Age may be incorrect
Line=224/ID=61217: HAZ (2.073), Age may be incorrect
Line=235/ID=60405: HAZ (-5.082), WAZ (-4.427), Age may be incorrect
Line=241/ID=63009: HAZ (3.261), Age may be incorrect
Line=245/ID=61508: HAZ (4.824), WAZ (2.013), Age may be incorrect
Line=246/ID=61705: HAZ (1.962), Age may be incorrect

206
Line=256/ID=62801: HAZ (3.196), Height may be incorrect
Line=270/ID=62312: HAZ (3.436), Height may be incorrect
Line=282/ID=60511: HAZ (2.687), Age may be incorrect
Line=300/ID=62318: WHZ (-3.592), WAZ (-4.433), Weight may be incorrect
Line=317/ID=61017: WHZ (-3.896), Weight may be incorrect
Line=321/ID=62404: HAZ (-4.841), Age may be incorrect
Line=354/ID=60418: HAZ (5.523), WAZ (2.837), Age may be incorrect
Line=355/ID=61907: HAZ (2.840), Age may be incorrect
Line=365/ID=62214: WHZ (2.498), HAZ (2.194), WAZ (2.735)
Line=375/ID=61708: HAZ (-5.675), WAZ (-5.177), Age may be incorrect
Line=383/ID=61514: WHZ (-4.133), WAZ (-4.788), Weight may be incorrect
Percentage of values flagged with SMART flags:WHZ: 1.5 %, HAZ: 6.5 %, WAZ: 2.6 %
Age distribution:
Month 6 : ##############
Month 7 : #############
Month 8 : ############
Month 9 : ####################
Month 10 : ##########
Month 11 : #########
Month 12 : ##############
Month 13 : ###############
Month 14 : ##################
Month 15 : ###################
Month 16 : ############
Month 17 : #######
Month 18 : #####################
Month 19 : ############
Month 20 : #######

207
Month 21 : ###########
Month 22 : ##############
Month 23 : ##########
Month 24 : ###########
Month 25 : ######
Month 26 : #############
Month 27 : ##########
Month 28 : #############
Month 29 : ######
Month 30 : ############
Month 31 : ##########
Month 32 : #######
Month 33 : ######
Month 34 : #####
Month 35 : #
Month 36 : #######
Month 37 : #####
Month 38 : ####
Month 39 : #####
Month 40 : ##
Month 41 : #
Month 42 : #######
Month 43 : #####
Month 44 : ###
Month 45 : #
Month 46 : ##
Month 47 : ##
Month 48 : ###
Month 49 : ##
Month 50 : ##
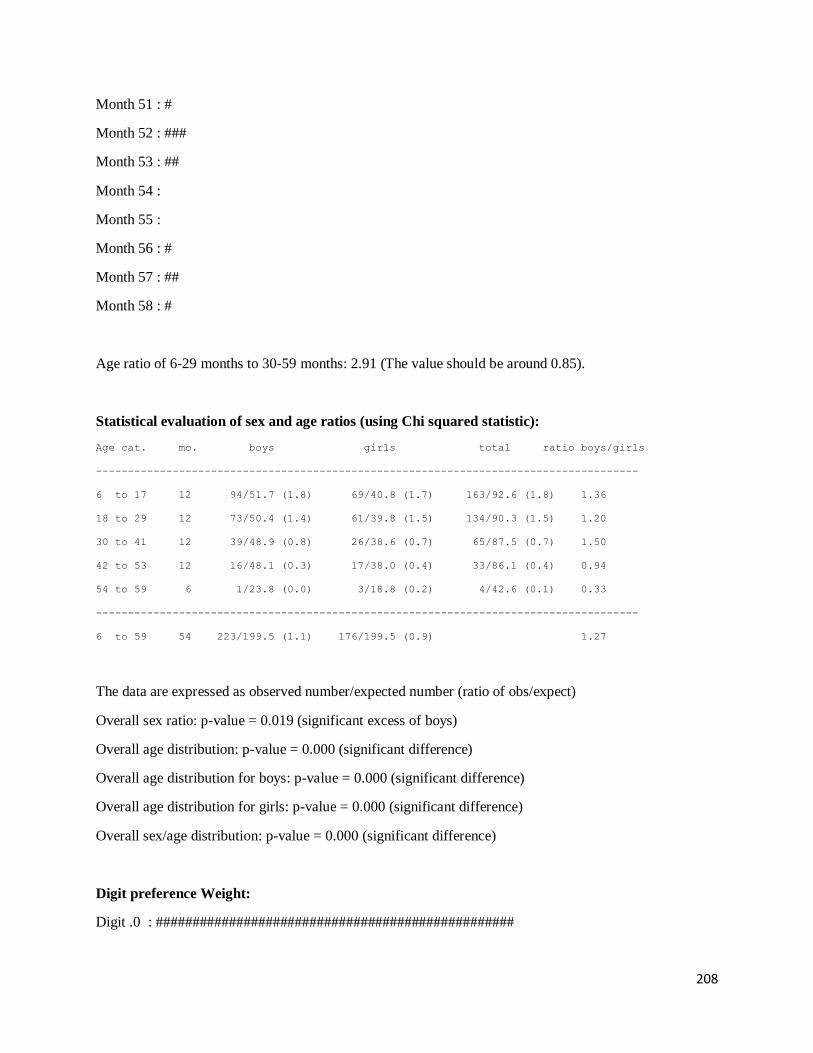
208
Month 51 : #
Month 52 : ###
Month 53 : ##
Month 54 :
Month 55 :
Month 56 : #
Month 57 : ##
Month 58 : #
Age ratio of 6-29 months to 30-59 months: 2.91 (The value should be around 0.85).
Statistical evaluation of sex and age ratios (using Chi squared statistic):
Age cat. mo. boys girls total ratio boys/girls
-------------------------------------------------------------------------------------
6 to 17 12 94/51.7 (1.8) 69/40.8 (1.7) 163/92.6 (1.8) 1.36
18 to 29 12 73/50.4 (1.4) 61/39.8 (1.5) 134/90.3 (1.5) 1.20
30 to 41 12 39/48.9 (0.8) 26/38.6 (0.7) 65/87.5 (0.7) 1.50
42 to 53 12 16/48.1 (0.3) 17/38.0 (0.4) 33/86.1 (0.4) 0.94
54 to 59 6 1/23.8 (0.0) 3/18.8 (0.2) 4/42.6 (0.1) 0.33
-------------------------------------------------------------------------------------
6 to 59 54 223/199.5 (1.1) 176/199.5 (0.9) 1.27
The data are expressed as observed number/expected number (ratio of obs/expect)
Overall sex ratio: p-value = 0.019 (significant excess of boys)
Overall age distribution: p-value = 0.000 (significant difference)
Overall age distribution for boys: p-value = 0.000 (significant difference)
Overall age distribution for girls: p-value = 0.000 (significant difference)
Overall sex/age distribution: p-value = 0.000 (significant difference)
Digit preference Weight:
Digit .0 : #################################################

209
Digit .1 : ###############################################
Digit .2 : ########################################
Digit .3 : ################################
Digit .4 : ################################
Digit .5 : #####################################
Digit .6 : ##########################################
Digit .7 : #####################################
Digit .8 : #########################################
Digit .9 : ##########################################
Digit preference score: 4 (0-7 excellent, 8-12 good, 13-20 acceptable and > 20 problematic)
p-value for chi2: 0.623
Digit preference Height:
Digit .0 : ############################################################
Digit .1 : ################################
Digit .2 : ############################################
Digit .3 : ##############################
Digit .4 : ######################################
Digit .5 : #########################################
Digit .6 : #######################################
Digit .7 : ###############################################
Digit .8 : ######################################
Digit .9 : ##############################
Digit preference score: 7 (0-7 excellent, 8-12 good, 13-20 acceptable and > 20 problematic)
p-value for chi2: 0.030 (significant difference)
Evaluation of Standard deviation, Normal distribution, Skewness and Kurtosis using the 3
exclusion (Flag) procedures
. no exclusion exclusion from exclusion from
. reference mean observed mean
. (WHO flags) (SMART flags)

210
WHZ
Standard Deviation SD: 1.24 1.15 1.09
(The SD should be between 0.8 and 1.2)
Prevalence (< -2)
observed: 9.3% 9.3% 8.4%
calculated with current SD: 12.4% 10.9% 9.3%
calculated with a SD of 1: 7.5% 7.8% 7.5%
HAZ
Standard Deviation SD: 1.70 1.54 1.18
(The SD should be between 0.8 and 1.2)
Prevalence (< -2)
observed: 43.4% 43.0% 43.2%
calculated with current SD: 45.0% 43.9% 44.7%
calculated with a SD of 1: 41.5% 40.7% 43.7%
WAZ
Standard Deviation SD: 1.30 1.30 1.17
(The SD should be between 0.8 and 1.2)
Prevalence (< -2)
observed: 30.3% 30.3% 29.6%
calculated with current SD: 31.4% 31.4% 29.1%
calculated with a SD of 1: 26.4% 26.4% 26.0%
Results for Shapiro-Wilk test for normally (Gaussian) distributed data:
WHZ p= 0.000 p= 0.214 p= 0.483
HAZ p= 0.000 p= 0.000 p= 0.229
WAZ p= 0.077 p= 0.077 p= 0.099
(If p < 0.05 then the data are not normally distributed. If p > 0.05 you can consider the data
normally distributed)
Skewness
WHZ 0.97 -0.19 -0.05
HAZ 0.81 0.72 -0.04
WAZ -0.01 -0.01 -0.11
If the value is:
-below minus 0.4 there is a relative excess of wasted/stunted/underweight subjects in the sample
-between minus 0.4 and minus 0.2, there may be a relative excess of wasted/stunted/underweight
subjects in the sample.
-between minus 0.2 and plus 0.2, the distribution can be considered as symmetrical.
-between 0.2 and 0.4, there may be an excess of obese/tall/overweight subjects in the sample.

211
-above 0.4, there is an excess of obese/tall/overweight subjects in the sample
Kurtosis
WHZ 8.35 0.23 -0.11
HAZ 5.68 2.54 -0.32
WAZ 0.62 0.62 -0.43
Kurtosis characterizes the relative size of the body versus the tails of the distribution.
Positive kurtosis indicates relatively large tails and small body. Negative kurtosis indicates
relatively large body and small tails.
If the absolute value is:
-above 0.4 it indicates a problem. There might have been a problem with data collection or
sampling.
-between 0.2 and 0.4, the data may be affected with a problem.
-less than an absolute value of 0.2 the distribution can be considered as normal.
Are the data of the same quality at the beginning and the end of the clusters?
Evaluation of the SD for WHZ depending upon the order the cases are measured within each cluster (if
one cluster per day is measured then this will be related to the time of the day the measurement is made).
Time SD for WHZ
point 0.8 0.9 1.0 1.1 1.2 1.3 1.4 1.5 1.6 1.7 1.8 1.9 2.0 2.1 2.2 2.3
(when n is much less than the average number of subjects per cluster different symbols are used:
0 for n < 80% and ~ for n < 40%; The numbers marked "f" are the numbers of SMART flags found in
the different time points)
Analysis by Team
Team 1 999
n = 1 398
Percentage of values flagged with SMART flags:
WHZ: 0.0 4.1
HAZ: 0.0 6.5
WAZ: 0.0 5.2
Age ratio of 6-29 months to 30-59 months:
2.90
Sex ratio (male/female):
1.26
Digit preference Weight (%):
.0 : 0 12

212
.1 : 0 12
.2 : 0 10
.3 : 0 8
.4 : 100 8
.5 : 0 9
.6 : 0 11
.7 : 0 9
.8 : 0 10
.9 : 0 11
DPS: 100 5
Digit preference score (0-7 excellent, 8-12 good, 13-20 acceptable and > 20 problematic)
Digit preference Height (%):
.0 : 100 15
.1 : 0 8
.2 : 0 11
.3 : 0 8
.4 : 0 10
.5 : 0 10
.6 : 0 10
.7 : 0 12
.8 : 0 10
.9 : 0 8
DPS: 100 7
Digit preference score (0-7 excellent, 8-12 good, 13-20 acceptable and > 20 problematic)
Standard deviation of WHZ:
SD 0.00
Prevalence (< -2) observed: %
Prevalence (< -2) calculated with current SD:
%
Prevalence (< -2) calculated with a SD of 1: %

213
Standard deviation of HAZ:
SD 0.00
observed: %
calculated with current SD: %
calculated with a SD of 1: %
Statistical evaluation of sex and age ratios (using Chi squared statistic) for:
Team 1:
Age cat. mo. boys girls total ratio boys/girls
-------------------------------------------------------------------------------------
6 to 17 12 1/0.2 (4.3) 0/0.0 1/0.2
18 to 29 12 0/0.2 (0.0) 0/0.0 0/0.2
30 to 41 12 0/0.2 (0.0) 0/0.0 0/0.2
42 to 53 12 0/0.2 (0.0) 0/0.0 0/0.2
54 to 59 6 0/0.1 (0.0) 0/0.0 0/0.1
-------------------------------------------------------------------------------------
6 to 59 54 1/0.5 (2.0) 0/0.5 (0.0)
The data are expressed as observed number/expected number (ratio of obs/expect)
Overall sex ratio: p-value = 0.317 (boys and girls equally represented)
Overall age distribution: p-value = 0.507 (as expected)
Overall age distribution for boys: p-value = 0.507 (as expected)
Overall sex/age distribution: p-value = 0.107 (as expected)
Team 2:
Age cat. mo. boys girls total ratio boys/girls
-------------------------------------------------------------------------------------
6 to 17 12 0/0.0 0/0.0 0/0.0
18 to 29 12 0/0.0 0/0.0 0/0.0
30 to 41 12 0/0.0 0/0.0 0/0.0
42 to 53 12 0/0.0 0/0.0 0/0.0
54 to 59 6 0/0.0 0/0.0 0/0.0
-------------------------------------------------------------------------------------
6 to 59 54 0/0.0 0/0.0
The data are expressed as observed number/expected number (ratio of obs/expect)

214
Evaluation of the SD for WHZ depending upon the order the cases are measured within each
cluster (if one cluster per day is measured then this will be related to the time of the day the
measurement is made).
Napak
Model nutrition assessment report - Napak (based on the Save the Children Fund emergency nutrition assessment handbook)
Executive summary (one to two pages only)
GAM: 11.8 % (9.0 - 15.3 95% C.I.)
SAM : 2.5 % (1.3 - 4.5 95% C.I.)
3. Results 3.1 Anthropometric results (based on WHO standards 2006):
Definitions of acute malnutrition should be given (for example, global acute malnutrition is defined as <-2 z scores weight-for-height and/or oedema, severe acute malnutrition is defined as <-3z scores weight-for-height and/or oedema) Exclusion of z-scores from Zero (reference mean) WHO flags: WHZ -5 to 5; HAZ -6 to 6; WAZ -6 to 5 Table 3.1: Distribution of age and sex of sample
Boys Girls Total Ratio
AGE (mo) no. % no. % no. % Boy:girl
6-17 69 46.0 81 54.0 150 36.6 0.9
18-29 55 44.0 70 56.0 125 30.5 0.8
30-41 31 40.8 45 59.2 76 18.5 0.7
42-53 27 62.8 16 37.2 43 10.5 1.7
54-59 10 62.5 6 37.5 16 3.9 1.7
Total 192 46.8 218 53.2 410 100.0 0.9

215
Table 3.2: Prevalence of acute malnutrition based on weight-for-height z-scores (and/or oedema) and by sex
All
n = 406
Boys
n = 191
Girls
n = 215
Prevalence of global
malnutrition
(<-2 z-score and/or oedema)
(48) 11.8 %
(9.0 - 15.3
95% C.I.)
(28) 14.7 %
(10.3 - 20.4
95% C.I.)
(20) 9.3 %
(6.1 - 13.9
95% C.I.)
Prevalence of moderate
malnutrition
(<-2 z-score and >=-3 z-score, no
oedema)
(38) 9.4 %
(6.9 - 12.6
95% C.I.)
(22) 11.5 %
(7.7 - 16.8
95% C.I.)
(16) 7.4 %
(4.6 - 11.7
95% C.I.)
Prevalence of severe
malnutrition
(<-3 z-score and/or oedema)
(10) 2.5 %
(1.3 - 4.5
95% C.I.)
(6) 3.1 %
(1.4 - 6.7
95% C.I.)
(4) 1.9 %
(0.7 - 4.7
95% C.I.)
The prevalence of oedema is 0.0 %
Table 3.3: Prevalence of acute malnutrition by age, based on weight-for-height z-scores and/or oedema
Severe wasting
(<-3 z-score)
Moderate
wasting
(>= -3 and <-2
z-score )
Normal
(> = -2 z score)
Oedema
Age
(mo)
Total
no.
No. % No. % No. % No. %
6-17 148 7 4.7 23 15.5 118 79.7 0 0.0
18-29 124 3 2.4 9 7.3 112 90.3 0 0.0
30-41 76 0 0.0 1 1.3 75 98.7 0 0.0
42-53 42 0 0.0 5 11.9 37 88.1 0 0.0
54-59 16 0 0.0 0 0.0 16 100.0 0 0.0
Total 406 10 2.5 38 9.4 358 88.2 0 0.0
Table 3.4: Distribution of acute malnutrition and oedema based on weight-for-height z-scores
<-3 z-score >=-3 z-score

216
Oedema present Marasmic kwashiorkor
No. 0
(0.0 %)
Kwashiorkor
No. 0
(0.0 %)
Oedema absent Marasmic
No. 13
(3.2 %)
Not severely malnourished
No. 397
(96.8 %)
Table 3.7: Prevalence of underweight based on weight-for-age z-scores by sex
All
n = 409
Boys
n = 191
Girls
n = 218
Prevalence of underweight
(<-2 z-score)
(112) 27.4 %
(23.3 - 31.9
95% C.I.)
(60) 31.4 %
(25.3 - 38.3
95% C.I.)
(52) 23.9 %
(18.7 - 29.9
95% C.I.)
Prevalence of moderate
underweight
(<-2 z-score and >=-3 z-score)
(71) 17.4 %
(14.0 - 21.3
95% C.I.)
(37) 19.4 %
(14.4 - 25.6
95% C.I.)
(34) 15.6 %
(11.4 - 21.0
95% C.I.)
Prevalence of severe
underweight
(<-3 z-score)
(41) 10.0 %
(7.5 - 13.3
95% C.I.)
(23) 12.0 %
(8.2 - 17.4
95% C.I.)
(18) 8.3 %
(5.3 - 12.7
95% C.I.)
Table 3.8: Prevalence of underweight by age, based on weight-for-age z-scores
Severe
underweight
(<-3 z-score)
Moderate
underweight
(>= -3 and <-2
z-score )
Normal
(> = -2 z score)
Oedema
Age
(mo)
Total
no.
No. % No. % No. % No. %
6-17 150 15 10.0 28 18.7 107 71.3 0 0.0
18-29 124 13 10.5 21 16.9 90 72.6 0 0.0
30-41 76 8 10.5 10 13.2 58 76.3 0 0.0
42-53 43 3 7.0 11 25.6 29 67.4 0 0.0
54-59 16 2 12.5 1 6.3 13 81.3 0 0.0
Total 409 41 10.0 71 17.4 297 72.6 0 0.0

217
Table 3.9: Prevalence of stunting based on height-for-age z-scores and by sex
All
n = 408
Boys
n = 191
Girls
n = 217
Prevalence of stunting
(<-2 z-score)
(147) 36.0 %
(31.5 - 40.8
95% C.I.)
(74) 38.7 %
(32.1 - 45.8
95% C.I.)
(73) 33.6 %
(27.7 - 40.2
95% C.I.)
Prevalence of moderate stunting
(<-2 z-score and >=-3 z-score)
(86) 21.1 %
(17.4 - 25.3
95% C.I.)
(39) 20.4 %
(15.3 - 26.7
95% C.I.)
(47) 21.7 %
(16.7 - 27.6
95% C.I.)
Prevalence of severe stunting
(<-3 z-score)
(61) 15.0 %
(11.8 - 18.7
95% C.I.)
(35) 18.3 %
(13.5 - 24.4
95% C.I.)
(26) 12.0 %
(8.3 - 17.0
95% C.I.)
Table 3.10: Prevalence of stunting by age based on height-for-age z-scores
Severe
stunting
(<-3 z-score)
Moderate
stunting
(>= -3 and <-2
z-score )
Normal
(> = -2 z score)
Age
(mo)
Total
no.
No. % No. % No. %
6-17 150 16 10.7 20 13.3 114 76.0
18-29 124 19 15.3 39 31.5 66 53.2
30-41 76 18 23.7 14 18.4 44 57.9
42-53 43 6 14.0 9 20.9 28 65.1
54-59 15 2 13.3 4 26.7 9 60.0
Total 408 61 15.0 86 21.1 261 64.0
Table 3.11: Prevalence of overweight based on weight for height cut off's and by sex (no oedema)
All
n = 406
Boys
n = 191
Girls
n = 215

218
Prevalence of overweight (WHZ
> 2)
(4) 1.0 %
(0.4 - 2.5
95% C.I.)
(3) 1.6 %
(0.5 - 4.5
95% C.I.)
(1) 0.5 %
(0.1 - 2.6
95% C.I.)
Prevalence of severe overweight
(WHZ > 3)
(1) 0.2 %
(0.0 - 1.4
95% C.I.)
(0) 0.0 %
(0.0 - 2.0
95% C.I.)
(1) 0.5 %
(0.1 - 2.6
95% C.I.)
Table 3.12: Prevalence of overweight by age, based on weight for height (no oedema)
Overweight
(WHZ > 2)
Severe
Overweight
(WHZ > 3)
Age
(mo)
Total
no.
No. % No. %
6-17 148 1 0.7 1 0.7
18-29 124 1 0.8 0 0.0
30-41 76 0 0.0 0 0.0
42-53 42 1 2.4 0 0.0
54-59 16 1 6.3 0 0.0
Total 406 4 1.0 1 0.2
Table 3.13: Mean z-scores, Design Effects and excluded subjects
Indicator n Mean z-scores ±
SD
Design Effect (z-
score < -2)
z-scores not
available*
z-scores out of range
Weight-for-Height
406 -0.70±1.12 1.00 0 4
Weight-for-Age 409 -1.39±1.20 1.00 0 1
Height-for-Age 408 -1.58±1.47 1.00 0 2 * contains for WHZ and WAZ the children with edema.
Appendix 4
Result Tables for NCHS growth reference 1977
Table 3.2: Prevalence of acute malnutrition based on weight-for-height z-scores (and/or oedema) and by sex
All
n = 407
Boys
n = 191
Girls
n = 216

219
Prevalence of global
malnutrition
(<-2 z-score and/or oedema)
(45) 11.1 %
(8.4 - 14.5
95% C.I.)
(24) 12.6 %
(8.6 - 18.0
95% C.I.)
(21) 9.7 %
(6.4 - 14.4
95% C.I.)
Prevalence of moderate
malnutrition
(<-2 z-score and >=-3 z-score, no
oedema)
(37) 9.1 %
(6.7 - 12.3
95% C.I.)
(21) 11.0 %
(7.3 - 16.2
95% C.I.)
(16) 7.4 %
(4.6 - 11.7
95% C.I.)
Prevalence of severe
malnutrition
(<-3 z-score and/or oedema)
(8) 2.0 %
(1.0 - 3.8
95% C.I.)
(3) 1.6 %
(0.5 - 4.5
95% C.I.)
(5) 2.3 %
(1.0 - 5.3
95% C.I.)
The prevalence of oedema is 0.0 %
Table 3.3: Prevalence of acute malnutrition by age, based on weight-for-height z-scores and/or oedema
Severe wasting
(<-3 z-score)
Moderate
wasting
(>= -3 and <-2
z-score )
Normal
(> = -2 z score)
Oedema
Age
(mo)
Total
no.
No. % No. % No. % No. %
6-17 149 5 3.4 19 12.8 125 83.9 0 0.0
18-29 124 3 2.4 13 10.5 108 87.1 0 0.0
30-41 76 0 0.0 1 1.3 75 98.7 0 0.0
42-53 42 0 0.0 4 9.5 38 90.5 0 0.0
54-59 16 0 0.0 0 0.0 16 100.0 0 0.0
Total 407 8 2.0 37 9.1 362 88.9 0 0.0
Table 3.4: Distribution of acute malnutrition and oedema based on weight-for-height z-scores
<-3 z-score >=-3 z-score
Oedema present Marasmic kwashiorkor
No. 0
(0.0 %)
Kwashiorkor
No. 0
(0.0 %)
Oedema absent Marasmic
No. 10
(2.4 %)
Not severely malnourished
No. 400
(97.6 %)

220
Table 3.5: Prevalence of acute malnutrition based on the percentage of the median and/or oedema
n = 407
Prevalence of global acute
malnutrition
(<80% and/or oedema)
(29) 7.1 %
(5.0 - 10.0 95%
C.I.)
Prevalence of moderate acute
malnutrition
(<80% and >= 70%, no oedema)
(27) 6.6 %
(4.6 - 9.5 95%
C.I.)
Prevalence of severe acute
malnutrition
(<70% and/or oedema)
(2) 0.5 %
(0.1 - 1.8 95%
C.I.)
Table 3.6: Prevalence of malnutrition by age, based on weight-for-height percentage of the median and oedema
Severe
wasting
(<70% median)
Moderate
wasting
(>=70% and
<80% median)
Normal
(> =80%
median)
Oedema
Age
(mo)
Total
no.
No. % No. % No. % No. %
6-17 149 1 0.7 15 10.1 133 89.3 0 0.0
18-29 124 1 0.8 9 7.3 114 91.9 0 0.0
30-41 76 0 0.0 1 1.3 75 98.7 0 0.0
42-53 42 0 0.0 2 4.8 40 95.2 0 0.0
54-59 16 0 0.0 0 0.0 16 100.0 0 0.0
Total 407 2 0.5 27 6.6 378 92.9 0 0.0
Table 3.7: Prevalence of underweight based on weight-for-age z-scores by sex
All
n = 410
Boys
n = 192
Girls
n = 218
Prevalence of underweight
(<-2 z-score)
(152) 37.1 %
(32.5 - 41.8
95% C.I.)
(78) 40.6 %
(33.9 - 47.7
95% C.I.)
(74) 33.9 %
(28.0 - 40.5
95% C.I.)

221
Prevalence of moderate
underweight
(<-2 z-score and >=-3 z-score)
(106) 25.9 %
(21.9 - 30.3
95% C.I.)
(55) 28.6 %
(22.7 - 35.4
95% C.I.)
(51) 23.4 %
(18.3 - 29.4
95% C.I.)
Prevalence of severe
underweight
(<-3 z-score)
(46) 11.2 %
(8.5 - 14.6
95% C.I.)
(23) 12.0 %
(8.1 - 17.3
95% C.I.)
(23) 10.6 %
(7.1 - 15.3
95% C.I.)
Table 3.8: Prevalence of underweight by age, based on weight-for-age z-scores
Severe
underweight
(<-3 z-score)
Moderate
underweight
(>= -3 and <-2
z-score )
Normal
(> = -2 z score)
Oedema
Age
(mo)
Total
no.
No. % No. % No. % No. %
6-17 150 17 11.3 39 26.0 94 62.7 0 0.0
18-29 125 16 12.8 31 24.8 78 62.4 0 0.0
30-41 76 8 10.5 16 21.1 52 68.4 0 0.0
42-53 43 3 7.0 16 37.2 24 55.8 0 0.0
54-59 16 2 12.5 4 25.0 10 62.5 0 0.0
Total 410 46 11.2 106 25.9 258 62.9 0 0.0
Table 3.9: Prevalence of stunting based on height-for-age z-scores and by sex
All
n = 408
Boys
n = 191
Girls
n = 217
Prevalence of stunting
(<-2 z-score)
(122) 29.9 %
(25.7 - 34.5
95% C.I.)
(58) 30.4 %
(24.3 - 37.2
95% C.I.)
(64) 29.5 %
(23.8 - 35.9
95% C.I.)
Prevalence of moderate stunting
(<-2 z-score and >=-3 z-score)
(74) 18.1 %
(14.7 - 22.2
95% C.I.)
(30) 15.7 %
(11.2 - 21.5
95% C.I.)
(44) 20.3 %
(15.5 - 26.1
95% C.I.)
Prevalence of severe stunting
(<-3 z-score)
(48) 11.8 %
(9.0 - 15.3
95% C.I.)
(28) 14.7 %
(10.3 - 20.4
95% C.I.)
(20) 9.2 %
(6.0 - 13.8
95% C.I.)
Table 3.10: Prevalence of stunting by age based on height-for-age z-scores

222
Severe
stunting
(<-3 z-score)
Moderate
stunting
(>= -3 and <-2
z-score )
Normal
(> = -2 z score)
Age
(mo)
Total
no.
No. % No. % No. %
6-17 150 10 6.7 21 14.0 119 79.3
18-29 124 15 12.1 34 27.4 75 60.5
30-41 76 16 21.1 8 10.5 52 68.4
42-53 43 5 11.6 7 16.3 31 72.1
54-59 15 2 13.3 4 26.7 9 60.0
Total 408 48 11.8 74 18.1 286 70.1
Table 3.11: Prevalence of overweight based on weight for height cut off's and by sex (no oedema)
All
n = 407
Boys
n = 191
Girls
n = 216
Prevalence of overweight (WHZ
> 2)
(1) 0.2 %
(0.0 - 1.4
95% C.I.)
(0) 0.0 %
(0.0 - 2.0
95% C.I.)
(1) 0.5 %
(0.1 - 2.6
95% C.I.)
Prevalence of severe overweight
(WHZ > 3)
(1) 0.2 %
(0.0 - 1.4
95% C.I.)
(0) 0.0 %
(0.0 - 2.0
95% C.I.)
(1) 0.5 %
(0.1 - 2.6
95% C.I.)
Table 3.12: Prevalence of overweight by age, based on weight for height (no oedema)
Overweight
(WHZ > 2)
Severe
Overweight
(WHZ > 3)
Age
(mo)
Total
no.
No. % No. %
6-17 149 1 0.7 1 0.7
18-29 124 0 0.0 0 0.0
30-41 76 0 0.0 0 0.0
42-53 42 0 0.0 0 0.0
54-59 16 0 0.0 0 0.0
Total 407 1 0.2 1 0.2
Table 3.13: Mean z-scores, Design Effects and excluded subjects

223
Indicator n Mean z-scores ±
SD
Design Effect (z-
score < -2)
z-scores not
available*
z-scores out of range
Weight-for-Height
407 -0.90±0.96 1.00 0 3
Weight-for-Age 410 -1.61±1.13 1.00 0 0
Height-for-Age 408 -1.42±1.37 1.00 0 2 * contains for WHZ and WAZ the children with edema.
Plausibility check for: noname.as
Standard/Reference used for z-score calculation: WHO standards 2006
(If it is not mentioned, flagged data is included in the evaluation. Some parts of this plausibility report are
more for advanced users and can be skipped for a standard evaluation)
Overall data quality
Criteria Flags* Unit Excel. Good Accept Problematic Score
Flagged data Incl % 0-2.5 >2.5-5.0 >5.0-7.5 >7.5
(% of in-range subjects) 0 5 10 20 0 (2.5 %)
Overall Sex ratio Incl p >0.1 >0.05 >0.001 <=0.001
(Significant chi square) 0 2 4 10 0 (p=0.199)
Overall Age distrib Incl p >0.1 >0.05 >0.001 <=0.001
(Significant chi square) 0 2 4 10 10 (p=0.000)
Dig pref score - weight Incl # 0-7 8-12 13-20 > 20
0 2 4 10 0 (4)
Dig pref score - height Incl # 0-7 8-12 13-20 > 20
0 2 4 10 0 (7)
Dig pref score - MUAC Incl # 0-7 8-12 13-20 > 20
0 2 4 10 0 (0)
Standard Dev WHZ Excl SD <1.1 <1.15 <1.20 >=1.20
. and and and or
. Excl SD >0.9 >0.85 >0.80 <=0.80
0 2 6 20 0 (1.04)
Skewness WHZ Excl # <±0.2 <±0.4 <±0.6 >=±0.6
0 1 3 5 1 (-0.23)
Kurtosis WHZ Excl # <±0.2 <±0.4 <±0.6 >=±0.6
0 1 3 5 0 (0.00)
Poisson dist WHZ-2 Excl p >0.05 >0.01 >0.001 <=0.001

224
0 1 3 5 0 (p=)
OVERALL SCORE WHZ = 0-9 10-14 15-24 >25 11 %
The overall score of this survey is 11 %, this is good.
Duplicate Entries in the database:
Line=374/ID=999 with Line=372/ID=999
Percentage of children with no exact birthday: 100 %
Age/Height out of range for WHZ:
HEIGHT:
Line=403/ID=72211: 43.20 cm
Anthropometric Indices likely to be in error (-3 to 3 for WHZ, -3 to 3 for HAZ, -3 to 3 for WAZ,
from observed mean - chosen in Options panel - these values will be flagged and should be excluded
from analysis for a nutrition survey in emergencies. For other surveys this might not be the best
procedure e.g. when the percentage of overweight children has to be calculated):
Line=1/ID=72714: HAZ (-5.370), WAZ (-4.540), Age may be incorrect
Line=59/ID=73007: HAZ (-4.885), Age may be incorrect
Line=64/ID=70115: WHZ (-6.490), HAZ (3.901), Height may be incorrect
Line=72/ID=71217: HAZ (-5.489), Age may be incorrect
Line=102/ID=71802: WHZ (2.926), Weight may be incorrect
Line=112/ID=71103: HAZ (-5.002), Age may be incorrect
Line=114/ID=70205: WHZ (2.409), Weight may be incorrect
Line=146/ID=70610: WHZ (-6.206), HAZ (1.511), Height may be incorrect
Line=151/ID=71918: HAZ (-6.940), WAZ (-4.773), Age may be incorrect
Line=179/ID=72419: HAZ (-4.906), Age may be incorrect
Line=194/ID=72905: HAZ (-5.151), Age may be incorrect
Line=235/ID=72107: HAZ (-5.867), Height may be incorrect
Line=243/ID=70313: HAZ (-5.589), Age may be incorrect
Line=247/ID=70804: HAZ (1.510), Height may be incorrect
Line=265/ID=70305: HAZ (4.499), Age may be incorrect

225
Line=297/ID=70809: HAZ (4.296), Age may be incorrect
Line=304/ID=70408: HAZ (2.970), WAZ (1.609), Age may be incorrect
Line=305/ID=72207: WHZ (-3.899), Weight may be incorrect
Line=308/ID=71611: HAZ (2.420), Age may be incorrect
Line=322/ID=71314: WHZ (-4.020), Weight may be incorrect
Line=329/ID=70716: HAZ (-5.747), Age may be incorrect
Line=338/ID=70909: WHZ (-4.904), HAZ (-7.145), WAZ (-6.497)
Line=364/ID=70418: HAZ (2.546), Age may be incorrect
Line=379/ID=70711: HAZ (2.386), Age may be incorrect
Line=381/ID=70620: HAZ (3.888), WAZ (1.680), Age may be incorrect
Line=386/ID=71906: WHZ (3.411), Weight may be incorrect
Line=390/ID=71815: WHZ (-5.749), WAZ (-5.282), Weight may be incorrect
Line=401/ID=73003: WHZ (5.211), WAZ (2.974), Weight may be incorrect
Line=403/ID=72211: HAZ (-12.670), Height may be incorrect
Line=404/ID=71317: HAZ (-5.227), WAZ (-4.549), Age may be incorrect
Percentage of values flagged with SMART flags:WHZ: 2.5 %, HAZ: 5.6 %, WAZ: 2.0 %
Age distribution:
Month 6 : ###############
Month 7 : ############
Month 8 : ################
Month 9 : ######
Month 10 : #########
Month 11 : #############
Month 12 : ##########
Month 13 : ###########
Month 14 : #################
Month 15 : ###############
Month 16 : #################
Month 17 : #########

226
Month 18 : ###############
Month 19 : ############
Month 20 : #########
Month 21 : ##############
Month 22 : ###############
Month 23 : #######
Month 24 : ##########
Month 25 : ###########
Month 26 : ######
Month 27 : #######
Month 28 : ########
Month 29 : ###########
Month 30 : ###########
Month 31 : #####
Month 32 : ####
Month 33 : #####
Month 34 : ########
Month 35 : #######
Month 36 : ########
Month 37 : ####
Month 38 : ######
Month 39 : ########
Month 40 : ##
Month 41 : ########
Month 42 : #####
Month 43 : #
Month 44 : ###
Month 45 : ####
Month 46 : ####
Month 47 : ######

227
Month 48 : ###
Month 49 : ###
Month 50 : #########
Month 51 : ##
Month 52 :
Month 53 : ###
Month 54 : ###
Month 55 : ###
Month 56 : #
Month 57 : ##
Month 58 : #####
Month 59 : ##
Age ratio of 6-29 months to 30-59 months: 2.04 (The value should be around 0.85).
Statistical evaluation of sex and age ratios (using Chi squared statistic):
Age cat. mo. boys girls total ratio boys/girls
-------------------------------------------------------------------------------------
6 to 17 12 69/44.5 (1.5) 81/50.6 (1.6) 150/95.1 (1.6) 0.85
18 to 29 12 55/43.4 (1.3) 70/49.3 (1.4) 125/92.7 (1.3) 0.79
30 to 41 12 31/42.1 (0.7) 45/47.8 (0.9) 76/89.9 (0.8) 0.69
42 to 53 12 27/41.4 (0.7) 16/47.0 (0.3) 43/88.5 (0.5) 1.69
54 to 59 6 10/20.5 (0.5) 6/23.3 (0.3) 16/43.8 (0.4) 1.67
-------------------------------------------------------------------------------------
6 to 59 54 192/205.0 (0.9) 218/205.0 (1.1) 0.88
The data are expressed as observed number/expected number (ratio of obs/expect)
Overall sex ratio: p-value = 0.199 (boys and girls equally represented)
Overall age distribution: p-value = 0.000 (significant difference)
Overall age distribution for boys: p-value = 0.000 (significant difference)
Overall age distribution for girls: p-value = 0.000 (significant difference)
Overall sex/age distribution: p-value = 0.000 (significant difference)

228
Digit preference Weight:
Digit .0 : ###############################################
Digit .1 : ########################################
Digit .2 : ####################################
Digit .3 : ###############################################
Digit .4 : ####################################
Digit .5 : ##########################################
Digit .6 : ########################################
Digit .7 : ###########################################
Digit .8 : ##############################################
Digit .9 : #################################
Digit preference score: 4 (0-7 excellent, 8-12 good, 13-20 acceptable and > 20 problematic)
p-value for chi2: 0.806
Digit preference Height:
Digit .0 : ##########################################################
Digit .1 : #################################################
Digit .2 : #################################################
Digit .3 : ##################################
Digit .4 : #############################
Digit .5 : #############################################
Digit .6 : ###############################
Digit .7 : ########################################
Digit .8 : ###########################################
Digit .9 : ################################
Digit preference score: 7 (0-7 excellent, 8-12 good, 13-20 acceptable and > 20 problematic)
p-value for chi2: 0.019 (significant difference)
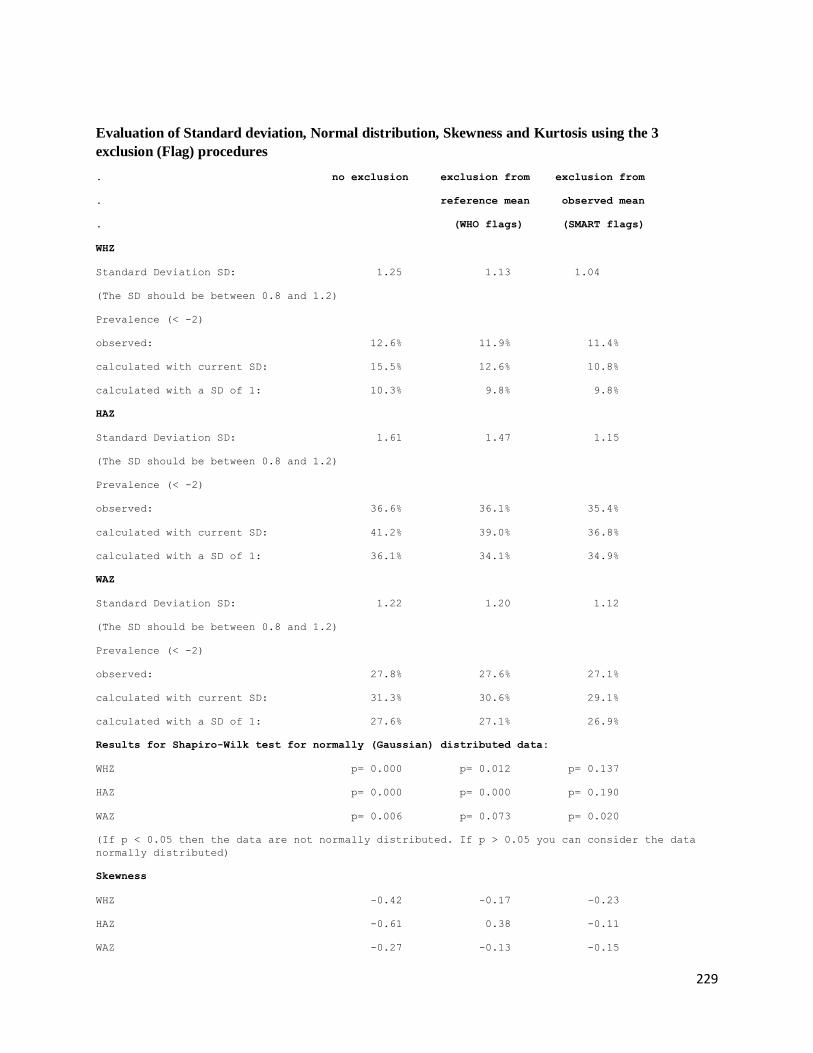
229
Evaluation of Standard deviation, Normal distribution, Skewness and Kurtosis using the 3
exclusion (Flag) procedures
. no exclusion exclusion from exclusion from
. reference mean observed mean
. (WHO flags) (SMART flags)
WHZ
Standard Deviation SD: 1.25 1.13 1.04
(The SD should be between 0.8 and 1.2)
Prevalence (< -2)
observed: 12.6% 11.9% 11.4%
calculated with current SD: 15.5% 12.6% 10.8%
calculated with a SD of 1: 10.3% 9.8% 9.8%
HAZ
Standard Deviation SD: 1.61 1.47 1.15
(The SD should be between 0.8 and 1.2)
Prevalence (< -2)
observed: 36.6% 36.1% 35.4%
calculated with current SD: 41.2% 39.0% 36.8%
calculated with a SD of 1: 36.1% 34.1% 34.9%
WAZ
Standard Deviation SD: 1.22 1.20 1.12
(The SD should be between 0.8 and 1.2)
Prevalence (< -2)
observed: 27.8% 27.6% 27.1%
calculated with current SD: 31.3% 30.6% 29.1%
calculated with a SD of 1: 27.6% 27.1% 26.9%
Results for Shapiro-Wilk test for normally (Gaussian) distributed data:
WHZ p= 0.000 p= 0.012 p= 0.137
HAZ p= 0.000 p= 0.000 p= 0.190
WAZ p= 0.006 p= 0.073 p= 0.020
(If p < 0.05 then the data are not normally distributed. If p > 0.05 you can consider the data
normally distributed)
Skewness
WHZ -0.42 -0.17 -0.23
HAZ -0.61 0.38 -0.11
WAZ -0.27 -0.13 -0.15

230
If the value is:
-below minus 0.4 there is a relative excess of wasted/stunted/underweight subjects in the sample
-between minus 0.4 and minus 0.2, there may be a relative excess of wasted/stunted/underweight
subjects in the sample.
-between minus 0.2 and plus 0.2, the distribution can be considered as symmetrical.
-between 0.2 and 0.4, there may be an excess of obese/tall/overweight subjects in the sample.
-above 0.4, there is an excess of obese/tall/overweight subjects in the sample
Kurtosis
WHZ 3.51 0.89 0.00
HAZ 6.79 2.20 -0.28
WAZ 0.84 0.37 -0.24
Kurtosis characterizes the relative size of the body versus the tails of the distribution.
Positive kurtosis indicates relatively large tails and small body. Negative kurtosis indicates
relatively large body and small tails.
If the absolute value is:
-above 0.4 it indicates a problem. There might have been a problem with data collection or
sampling.
-between 0.2 and 0.4, the data may be affected with a problem.
-less than an absolute value of 0.2 the distribution can be considered as normal.
Are the data of the same quality at the beginning and the end of the clusters?
Evaluation of the SD for WHZ depending upon the order the cases are measured within each cluster (if
one cluster per day is measured then this will be related to the time of the day the measurement is made).
Time SD for WHZ
point 0.8 0.9 1.0 1.1 1.2 1.3 1.4 1.5 1.6 1.7 1.8 1.9 2.0 2.1 2.2 2.3
(when n is much less than the average number of subjects per cluster different symbols are used:
0 for n < 80% and ~ for n < 40%; The numbers marked "f" are the numbers of SMART flags found in
the different time points)
Analysis by Team
Team 1 999
n = 1 409
Percentage of values flagged with SMART flags:
WHZ: 0.0 3.5
HAZ: 0.0 5.6
WAZ: 0.0 2.7
Age ratio of 6-29 months to 30-59 months:

231
2.03
Sex ratio (male/female):
0.88
Digit preference Weight (%):
.0 : 0 11
.1 : 0 10
.2 : 0 9
.3 : 0 11
.4 : 0 9
.5 : 0 10
.6 : 0 10
.7 : 0 11
.8 : 100 11
.9 : 0 8
DPS: 100 4
Digit preference score (0-7 excellent, 8-12 good, 13-20 acceptable and > 20 problematic)
Digit preference Height (%):
.0 : 0 14
.1 : 0 12
.2 : 0 12
.3 : 0 8
.4 : 0 7
.5 : 0 11
.6 : 0 8
.7 : 0 10
.8 : 0 11
.9 : 100 8
DPS: 100 7
Digit preference score (0-7 excellent, 8-12 good, 13-20 acceptable and > 20 problematic)
Standard deviation of WHZ:
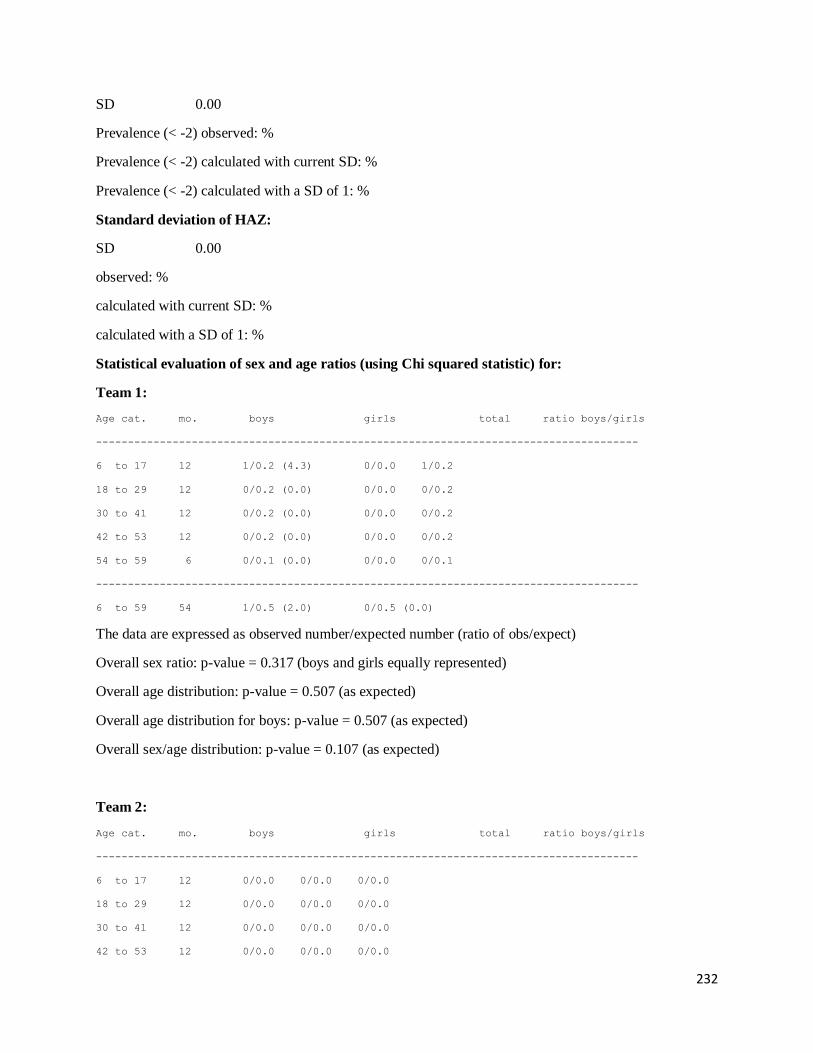
232
SD 0.00
Prevalence (< -2) observed: %
Prevalence (< -2) calculated with current SD: %
Prevalence (< -2) calculated with a SD of 1: %
Standard deviation of HAZ:
SD 0.00
observed: %
calculated with current SD: %
calculated with a SD of 1: %
Statistical evaluation of sex and age ratios (using Chi squared statistic) for:
Team 1:
Age cat. mo. boys girls total ratio boys/girls
-------------------------------------------------------------------------------------
6 to 17 12 1/0.2 (4.3) 0/0.0 1/0.2
18 to 29 12 0/0.2 (0.0) 0/0.0 0/0.2
30 to 41 12 0/0.2 (0.0) 0/0.0 0/0.2
42 to 53 12 0/0.2 (0.0) 0/0.0 0/0.2
54 to 59 6 0/0.1 (0.0) 0/0.0 0/0.1
-------------------------------------------------------------------------------------
6 to 59 54 1/0.5 (2.0) 0/0.5 (0.0)
The data are expressed as observed number/expected number (ratio of obs/expect)
Overall sex ratio: p-value = 0.317 (boys and girls equally represented)
Overall age distribution: p-value = 0.507 (as expected)
Overall age distribution for boys: p-value = 0.507 (as expected)
Overall sex/age distribution: p-value = 0.107 (as expected)
Team 2:
Age cat. mo. boys girls total ratio boys/girls
-------------------------------------------------------------------------------------
6 to 17 12 0/0.0 0/0.0 0/0.0
18 to 29 12 0/0.0 0/0.0 0/0.0
30 to 41 12 0/0.0 0/0.0 0/0.0
42 to 53 12 0/0.0 0/0.0 0/0.0

233
54 to 59 6 0/0.0 0/0.0 0/0.0
-------------------------------------------------------------------------------------
6 to 59 54 0/0.0 0/0.0
The data are expressed as observed number/expected number (ratio of obs/expect)
Evaluation of the SD for WHZ depending upon the order the cases are measured within each
cluster (if one cluster per day is measured then this will be related to the time of the day the
measurement is made).