food security status and related factors of campus …
TRANSCRIPT

FOOD SECURITY STATUS AND RELATED FACTORS OF
UNDERGRADUATE STUDENTS RECEIVING FINANCIAL AID AT
THE UNIVERSITY OF KWAZULU-NATAL, PIETERMARITZBURG
CAMPUS
BY
NOPHIWE JOB
BSc Human Nutrition (UKZN), PG Dip Community Nutrition (UKZN)
Dissertation submitted in fulfillment of the academic requirements
For the degree of Master of Science in Human Nutrition
In the Discipline of Dietetics and Human Nutrition
School of Agricultural, Earth and Environmental Sciences
College of Agriculture, Engineering and Science
University of KwaZulu-Natal
Pietermaritzburg
SOUTH AFRICA
DECEMBER 2014

ii
DECLARATION OF ORIGINALITY
I, Nophiwe Job, student number 207526109, declare that the work in this dissertation submitted
to the University of KwaZulu-Natal, School of Agricultural, Earth and Environmental Sciences
is my own independent work, except where otherwise stated. The work in this dissertation has
not been submitted for any degree before, to any tertiary institution by me or any other person.
Data from other sources in this dissertation has been appropriately acknowledged and referenced.
Signed: _______________________ Date: __________________________
Nophiwe Job (candidate)
As supervisors of this candidate we agree to the submission of this dissertation.
Signed: _______________________ Date: ___________________________
Prof Frederick Veldman (Supervisor)
Signed: _______________________ Date: ___________________________
Dr Susanna Kassier (Co-supervisor)

iii
ABSTRACT
Objectives: To determine the prevalence of food insecurity and related factors among
undergraduate recipients of financial aid at the University of KwaZulu-Natal, Pietermaritzburg
Campus (UKZN- PMB) and whether there is a relationship between food security status and
academic performance.
Design: A cross-sectional descriptive survey was conducted assessing the food security status
and related factors of students on financial aid.
Setting: UKZN-PMB campus, situated in Scottsville, Pietermaritzburg, with a student
population of 9 785.
Subjects: A sample of 268 students on financial aid was randomly selected. First year and post
graduate level students were excluded.
Outcome measures: A self-administered questionnaire consisting of the four main sections,
including: anthropometric status and socio-demographic information, food frequency
questionnaire (FFQ), household food insecurity access scale (HFIAS), nutrition knowledge
questionnaire (NKQ) and combined performance index (CPI) scores.
Results: The mean BMI of the study sample was 24.4 ± 4.7 kg/m2. A fifth (21.4%) of the
sample was overweight and a tenth (12.4%) was obese. An increase in BMI was associated with
an increase in food insecurity. The foods consumed „more than once a day‟, included the starch
group, fats and coffee and tea. Just over half (53.0%) of the sample received no additional
allowance apart from financial aid. The majority (82.4%) of the sample spent most of their
money on food. The mean amount of monthly food expenditure was R558.40 ± R211.12. Over
a third (34.7%) of the sample was food insecure with another third (33.6 %) being at risk of food
insecurity. Almost a tenth (9.7%) of the sample was severely food insecure and just over a fifth
(22%) was food secure. The main coping strategy adopted was seeking assistance from friends.
The mean NKQ score of the sample was 18.8 ± 3.8 (58.6%) which fell within the “average”
range. Food insecure students had a lower mean CPI score than those who are food secure.
Conclusion: There was a high prevalence of food insecurity and obesity among the study
sample. The diets lacked diversity with a low consumption of fruit and vegetables. Nutrition

iv
knowledge seems to have no impact on food choice. Food insecurity impacted negatively on
academic performance.

v
ACKNOWLEDGEMENTS
The authoress acknowledges and hereby expresses her sincere gratitude and appreciation to the
following people and organizations for their assistance, support and contribution to the
successful completion of this dissertation:
Professor Frederick J Veldman, my main supervisor, for his expert guidance,
encouragement and assistance obtaining funds for this research project.
Susanna M Kassier for her expert guidance, perseverance, tireless enthusiasm, and
constant encouragement and inspiration. „Suna, baie dankie.‟
College of Agriculture, Engineering and Science for awarding funding for this project.
Mrs B Dlamini (UKZN student funding) for her kindness in availing herself for an
interview after working hours for input into this study.
The lovely fieldworkers; Anna Gabe, Nangamso Siyasanga Manyakanyaka, Hlengiwe
Hazel Ndlovu, Gcina Manyathi, Nomkhosi Ncanana, Nokwethemba Ngubane and
Nonjabulo Gcabashe for outdoing themselves in recruiting subjects and ensuring a
smooth data collection process. „Girls, it was lovely working with you!‟
Francios Kassier for his kindness in assisting with data entry and analysis.
Mr Oliver Bodhlyera for his assistance with statistical analysis of data.
Thulani Singwane and Oscar Ngesa for their patience with my many statistics queries.
Students of the University of KwaZulu-Natal for participating in this study.
Denisha Govender for her kindness in editing my work.
Bridget Madlala for the sleepless night given for the creation of an e-mail database and
her encouragement.
Bongekile Mabaso for her kindness in editing my work and being a pillar of strength and
good counsel.
Karabo Bidi for editing my work and constant encouragement. „My dear, I love the way
you see me, ke batla go nna seo. Thanks for sacrificing your laptop so that I can finish in
time‟.
To all my friends for their support and encouragement especially Mpho Mokhele, Tshepo
Matete, Nita Mahlangu, Atlehang Makakole, Simphiwe Shozi, Thabisile Mkhabela,

vi
Jabulile Mnyimba and Zanele Tshabalala. Thank you Kgalalelo Dimo for coming through
in dark days.
Apostolic Faith Mission and Jubilee Ministries International family for love, support and
prayers. „Thank you for mentioning my name in prayer when I needed it most.‟
My fascinating family. „Thank you for allowing me to pursue my dreams. Mama, thank
you for being a reliable shoulder to cry on, for this reason I will never „grow up‟! I will
never be able to express my gratitude for the pillar you have been in my life. Papa, thank
you for the calls of encouragement made, your words gave me strength at my weakest
times. Boitshepo and Dudu, thanks for checking up on me, I love you ladies.‟
My heavenly Father, my Peace, my Strength and my Source thank you for revealing who
I am in You. Had You not reassured me, I would have resigned from this endeavor. I
owe You my life Great Jehovah.

vii
TABLE OF CONTENTS PAGE
DECLARATION OF ORIGINALITY ii
ABSTRACT iii
ACKNOWLEDGEMENTS v
TABLE OF CONTENTS vii
LIST OF TABLES x
LIST OF FIGURES xi
APPENDICES xii
CHAPTER 1: INTRODUCTION, THE PROBLEM AND ITS SETTING
1.1 Importance of the study 1
1.2 Purpose of the study 5
1.3 Study design 5
1.4 Study objectives 6
1.5 Study parameters 6
1.6 Assumptions 6
1.7 Definitions 7
1.8 Abbreviations 8
1.9 Conclusion 9
CHAPTER 2: LITERATURE REVIEW
2.2 Introduction 10
2.2 Food security status 11
2.2.1 Food security status of students on financial aid 11
2.2.2 Common methods of measuring food insecurity among young adults 13
2.3 Assessment of nutritional status 14
2.3.1 Anthropometric measurements commonly reported when surveying
young adults 15
2.3.2 Anthropometric status of young adults 17

viii
2.3.3 Anthropometric status of university students 18
2.3.4 Relationship between food security and anthropometric status 19
2.4 Dietary diversity 20
2.4.1 Methods used to determine dietary diversity 20
2.4.2 Nutritional requirements of young adults 21
2.4.3 Common nutrition deficiencies among young adults 22
2.5 Nutrition knowledge of university students 24
2.6 Conclusion 26
CHAPTER 3: RESEARCH METHODOLOGY
3.1 Introduction 27
3.2 Study design 27
3.3 Sample selection 27
3.3.1 Study population 28
3.3.2 Sample selection 28
3.4 Methods and materials 28
3.5 Fieldworker recruitment and training 34
3.6 Pilot study 34
3.7 Data collection 34
3.8 Data capturing, processing and analysis 35
3.9 Ethical considerations 36
3.10 Conclusion 37
CHAPTER 4: RESULTS
4.1 Introduction 38
4.1.1 Sample characteristics 38
4.2 Food security status 40
4.3 Assessment of nutritional status 46
4.4 Dietary diversity 48
4.5 Nutritional knowledge 50
4.6 Academic performance of students on financial aid 54

ix
4.7 Relationship between food security status and other variables 55
4.8 Conclusion 56
CHAPTER 5: DISCUSSION
5.1 Introduction 57
5.2 Food security status 57
5.3 Assessment of nutritional status 59
5.4 Dietary diversity 60
5.5 Nutrition knowledge 60
5.6 Food security and academic performance 61
5.7 Conclusion 62
CHAPTER 6: CONCLUSIONS AND RECOMMENDATIONS
6.1 Introduction 63
6.2 Conclusions 63
6.3 Recommendations 64
REFERENCES 66
APPENDICES 79

x
LIST OF TABLES PAGE
Table 2.1 WHO classification of overweight in adults according to Body Mass Index 16
Table 3.1 HFIAS categories 30
Table 3.2 HFIAS categorisation scheme 31
Table 3.3 Categorisation of items in questionnaire based on the South African
Food-based Dietary Guidelines 32
Table 3.4 Nutrition knowledge questionnaire score categories 33
Table 3.5 Statistical analysis of data variables 36
Table 4.1 Socio-demographic characteristics of study sample (N = 268) 39
Table 4.2 Household Food Insecurity Access (HFIAS) categorization scale showing the
frequency-of-occurrence of HFIAS related conditions 41
Table 4.3 Food security status of students on financial aid and additional
sources of income 43
Table 4.4 Coping strategies of food insecure students on financial aid
at UKZN-PMB campus 45
Table 4.5 Nutritional status of students on financial aid at UKZN-PMB campus 46
Table 4.6 The mean BMI of students in different food security categories 47
Table 4.7 Results generated by non-quantified food frequency questionnaire 48
Table 4.8 The nutrition knowledge of students on financial aid
at UKZN-PMB campus 50
Table 4.9 Nutrition knowledge test scores of students according to
academic year of study 51
Table 4.10 The mean nutrition knowledge score across different BMI categories 52
Table 4.11 Impact of nutrition knowledge on the frequency of consumption of foods 53
Table 4.12 Academic performance of students on financial aid 54
Table 4.13 Relationship between food security status and other study variables 55

xi
LIST OF FIGURES PAGE
Figure 1.1 Factors contributing to food security and its resultant outcomes among
South African university students 4
Figure 4.1 A breakdown of monthly expenses of the students on financial aid 45
at UKZN-PMB

xii
APPENDICES PAGE
APPENDIX A Questionnaire completed by all participants 79
APPENDIX B Consent form completed by all participants 88
APPENDIX C Food-based dietary guidelines for South Africa 2013 89
APPENDIX D Letter of Ethical Approval from the Humanities and Social Sciences
Ethics Committee, University of KwaZulu-Natal 90
APPENDIX E Household Food Insecurity Access Scale for measurement of food access:
Indicator guide 91

1
CHAPTER 1: INTRODUCTION, THE PROBLEM AND ITS SETTING
1.1 IMPORTANCE OF THE STUDY
Access to food is a basic human right [Food and Agriculture Organization of the United Nations
(FAO) 2006]. It is therefore the responsibility and obligation of the government to ensure that
all South African citizens are food secure. The right to food, as entrenched in the constitution of
South Africa, is the basis for the National Integrated Food Security Strategy (IFSS) [Human
Sciences Research Council (HSRC) 2004]. The vision of the IFSS is “to attain universal
physical, social and economic access to sufficient, safe and nutritious food by all South Africans
at all times to meet their dietary needs and food preferences for an active and healthy life”
(Department of Agriculture South Africa pg.13, 2002). This goal is adapted from the definition
of food security as stated by the FAO which seeks to ensure that the first Millennium
Development Goal (MDG) which aims to eradicate hunger, malnutrition and food insecurity is
achieved by 2015 [World Health Organization (WHO) 2012; FAO 2006].
Food insecurity can be explained as having insufficient food and/or the experience of hunger as a
result of food shortage and being unable to afford sufficient food. It is also the consumption of a
diet containing insufficient nutrients due to limited food options (i.e. lack of dietary diversity)
and anxiety about acquiring food or having to rely on food aid. To be food secure therefore
means that one is not worried about where their next nutritious meal will come from
(Labadarious, Davids, Mchiza & Weir-Smith 2009; FAO 2006).
Addressing food security is a major global challenge, especially in developing countries (Koch
2011; Labadarious et al 2009; FAO 2006; HSRC 2004) and especially in sub-Saharan Africa.
South Africa has been termed as food secure as it is a net exporter of agricultural commodities,
has a high per capita income, participates in foreign exchange and is not landlocked. However,
sub-populations within the country have been identified as food insecure [Koch 2011; Altman,
Hart & Jacobs 2009; FAO/ World Food Programme (WFP) 2009; Human Sciences Research
Council (HSRC) 2004; Rose & Charlton 2001]. In 2004, the HSRC reported that an estimated
35% (14 million people) of the South African population were suspected to be vulnerable to food

2
insecurity. These vulnerable groups included those of a low socio-economic status and at a
geographic disadvantage, the homeless and young children (FAO/WFP 2009). In 2012, the
South African government estimated that approximately 11 million South Africans were food
insecure (Food Bank South Africa 2013). This translates into 1 in 5 people being food insecure
in a population estimated to be 52, 98 million in mid-2013 (Statistics South Africa 2013).
Income inequality, a major contributing factor to food insecurity in South Africa, resulted in
South Africa being ranked among countries with the highest rate of income inequality in the
world (Altman et al 2009; FAO/WFP 2009; Rose & Charlton 2001). Compared to other middle
income countries, South Africa has extremely high levels of absolute poverty (Altman et al 2009;
FAO/WFP 2009; Rose & Charlton 2001). Absolute poverty is defined by the United Nations
(UN) as „a condition characterized by severe deprivation of basic human needs, including food,
safe drinking water, sanitation facilities, health, shelter, education and information. It depends
not only on income but also on access to services‟ (UN, pg.41, 1995). Over and above these
variables, South Africa also has high unemployment rates; steep increases in food and fuel
prices, energy tariffs and interest rates. These factors have placed poor households at an even
higher risk of becoming food insecure (Labadarios et al 2009). Poor households spend
significantly larger proportions (70%) of their budgets on food, fuel and electricity than those of
a higher socio-economic status (Bhorat & Oosthuizen 2005). In contrast, those of a higher socio-
economic status spend a larger proportion of their budgets on transport and medical care.
Consequently, poor households are significantly more vulnerable to food price shocks as it is
their major expenditure (Labadarios et al 2009; Bhorat & Oosthuizen 2005).
The South African government, along with other UN countries, have committed to the MDGs
(Crush & Frayne 2012). The first MDG, which is especially associated with the IFSS, is “to
eradicate hunger, malnutrition and food insecurity by half by 2015.” Achieving household food
security is a critical component in meeting this goal (Crush & Frayne 2012). Ideally, poverty
and food insecurity could be addressed by expanding employment opportunities, thereby
enhancing household income (Crush & Frayne 2012; HSRC 2004), which in turn, improves
buying power. Employment has expanded substantially since the mid-1990s. However, this has
not been enough to address income poverty (Crush & Frayne 2012; Petersen, Louw & Dumont

3
2009). As a result, income poverty has been identified as the main driver of food insecurity
(Petersen et al 2009).
Unemployment in South Africa has increased by 100 000 to 4, 6 million between the fourth
quarter of 2012 and the first quarter of 2013, resulting in an increase in the level of
unemployment to 25, 2 % (Statistics South Africa 2013). The probability of finding employment
increases with higher levels of education. In addition, those with a higher level of education also
tend to earn more (van der Berg 2008). A better-educated household is therefore less likely to
experience food insecurity.
A substantial increase in student enrolments has been experienced by South African universities
in the past decade, with numbers reaching 538 210 in 2011 and were expected to rise by 2% in
2012 (Cloete & Moja 2005). At an institution such as the University of KwaZulu-Natal
(UKZN), it is a basic requirement that at least 15% of all students in all Colleges be from low
socio-economic backgrounds, i.e. students who have completed their schooling at Quintile 1 or 2
high schools (UKZN selection criteria policy 2012). As a result, many students enrolling for
higher education are from economically disadvantaged backgrounds (Department of Higher
Education & Training 2011; Petersen et al 2009; Letseka & Maile 2008). These students are
vulnerable to food insecurity as they are both unemployed and economically disadvantaged.
Hence, large numbers of students enrolled in South African universities have been found to
experience great financial difficulties, food insecurity, hunger, a lack of dietary diversity and low
nutrient intakes (Department of Higher Education & Training 2011; Petersen et al 2009).
Student poverty, food insecurity and hunger result in high drop-out rates and low graduation
rates, especially at South African universities (Hughes, Serebryanikova, Donaldson, Leveritt
2011; Petersen et al 2009; Letseka & Maile 2008). Letseka, Breier & Visser (2010) reported that
the main reason for student drop-outs was found to be financial as opposed to academic
difficulties. In fact, only two (2) out of the 23 local universities namely, Stellenbosch University
and University of the Witwatersrand reported academic reasons as the main reason for student
drop-outs. Letseka et al (2010) further explained that due to the historically white (Caucasian)
nature of these institutions, the bulk of the students were of a high socio-economic status and

4
therefore did not require financial assistance. The factors contributing to food security and its
resultant outcomes in South African universities are illustrated in Figure1.1.
FACTORS
CONTRIBUTING TO
FOOD INSECURITY
OUTCOMES OF
FOOD
INSECURITY
Inability to
Concentrate on
Academics
Limited/No Income
High Drop-out
Rates
Poor Nutrition
Knowledge FOOD
INSECURITY Malnutrition
Poor Financial
Management Skills
Poor Human and
Economic Capital
Food Theft in
Residences Poor Dietary
Diversity
Low Graduation
Rates/Throughput
Figure1.1: Factors contributing to food security and its resultant outcomes among South African
university students.
Adapted from: Dlamini 2012; Hughes et al 2011; Azadbakht & Esmaillzadeh 2010; Innes-Hughes et al 2010; Letseka et al 2010;
Petersen et al 2009; Letseka & Maile 2008; Norvilitis, Merwin, Osberg, Roehling, Young & Kamas 2006; Wilde & Peterman
2006; Adams, Grummer-Strawn & Chavez 2003; Vozoris & Tarasuk 2003; Hoddinott & Yohannes 2002; Steyn & Ochse (2013);
Robert & Jones 2001; Newton & Turale 2000; Steyn, Senekal, Britz & Nel 2000; Reily, Mock, Cogill, Bailey & Kenefick 1999.

5
It is a governmental function to pro-actively engage in activities intended to strengthen access to
food and the use of resources to enable people to feed themselves (Right to Food 2010). As a
result, the South African government gives financial aid to the majority of financially needy
students through the National Student Financial Aid Scheme (NSFAS) (Letseka & Maile 2008).
Financial aid is given to students with financial needs (determined by a national means test), and
having the academic potential to succeed in their studies (NSFAS 2013). Financial Aid is
provided with the intention of enabling students to complete their undergraduate studies. This in
turn would improve their employment prospects and consequently result in food security and
economic independence (Innes-Hughes, Bowers, King, Chapman & Eden 2010).
Food insecurity undermines the primary function of higher education, which aims to improve
human and social capital, thereby improving the socio-economic status of people (Innes-Hughes
et al 2010). Very little published data is available to shed light on the level of food insecurity
among South African university students. It is therefore, important to conduct studies to
investigate the degree of food insecurity among local university students. Furthermore, it is
important to establish whether food insecurity is associated with poor academic performance,
thereby contributing to higher dropout rates. This relationship has, to date, only been
documented amongst school-going children in some American, Asian and European countries
(Taki, Hashizume, Sassa, Takeuchi, Asano, Kotozaki, Nouchi, Wu, Fukuda & Kawashima 2011;
Cooke 2007; Frongillo, Jyoti & Jones 2006; Jyoti, Frongillo & Jones 2005; Alaino, Olson &
Frongillo 2001).

6
1.2 PURPOSE OF THE STUDY
To determine the prevalence of food insecurity and related factors among recipients of financial
aid at the University of KwaZulu-Natal, Pietermaritzburg Campus (UKZN-PMB) and to assess
nutrition knowledge, nutritional status, dietary diversity and coping strategies of this population.
Lastly, to determine whether there is a relationship between food security category and academic
performance.
1.3 STUDY DESIGN
A cross-sectional descriptive survey was conducted to assess the food security status and related
factors of students on financial aid enrolled at UKZN-PMB campus. This method was best
suited as the study aimed to establish the prevalence of a condition at one point in time (Grimes
2002), which in the current study was food insecurity.
1.4 STUDY OBJECTIVES
The study objectives, in relation to undergraduate students on financial aid, were to:
1.4.1 Determine the prevalence of food insecurity;
1.4.2 Determine the anthropometric status using Body Mass index (BMI) as a proxy;
1.4.3 Determine the dietary diversity by means of a non-quantified food frequency questionnaire;
1.4.4 Determine the nutrition knowledge;
1.4.5 Determine the relationship between academic performance and food security status ;
1.4.6 Determine the relationship between food security status, BMI, dietary diversity, nutrition
knowledge and academic performance.
1.5 STUDY PARAMETERS
Only students registered at UKZN-PMB Campus for the 2012 academic year were eligible for
the study. First year academic students were excluded from the study based on the fact that there
were additional confounding variables that could not be accounted for, in addition an academic
history for university performance was not available. Postgraduate students were also excluded

7
from the study as the majority of them had some form of formal employment, even with the
university and earned an income.
1.6 ASSUMPTIONS
For the purpose of this study it was assumed that participants were truthful when completing the
survey questionnaires and that the data collected is representative of the study population. The
nature of the study (cross-sectional descriptive survey), will enable us to identify indicators
(study parameters) that exist within the sample (i.e. food security status, nutritional status,
nutrition knowledge and academic performance), the distribution of these indicators within the
sample and how these indicators may relate with each other.
1.7 DEFINITIONS
Academic Performance: For the purpose of this study, academic performance was measured
using the Combined Performance Index (UKZN Student funding centre 2012).
Body Mass Index: A measure indicating the nutritional status of adults, defined as weight in
kilograms divided by the square of height in metres (kg/m²) of a person. It provides the
most useful population-level measure of overweight and obesity (WHO 2012).
Combined Performance Index (CPI): A single index used to track student academic
performance over the course of their studies (UKZN Student funding centre 2012).
Dietary diversity: The number of different kinds of foods consumed over a given period of time
(Hoddinott & Yohannes 2002).
Financial Aid: A loan and bursary scheme funded by the Department of Higher Education and
Training for students who do not have the financial means to fund their studies and/or
cannot access bank funding, study loans or bursaries. Recipients have to come from
households with a total household income of R130 000/annum or less (Dlamini 2012).

8
Food security: A state whereby all people, at all times, have physical and economic access to
sufficient, safe and nutritious food to meet their dietary requirements and preferences for
healthy and active lifestyles (FAO 2006).
Nutritional Status: For the purpose of this study, nutritional status refers to energy/weight
status with regards to adiposity. Adiposity was measured using the BMI (WHO 2012).
Underweight: A BMI of lower 18.5 kg/m² is defined as underweight (WHO 2012).
Normal weight: A BMI in the range of 18.5 - 24.99 kg/m² is defined as normal (WHO 2012).
Overweight: A BMI greater than or equal to 25 kg/m² is defined as overweight (WHO 2012).
Obesity: A BMI greater than or equal to 30 kg/m² is defined as obesity. Overweight and obesity
are defined as abnormal or excessive fat accumulation that may impair health. The
cause of obesity and overweight is an energy imbalance where kilojoules consumed
exceed kilojoules expended (WHO 2012).
1.8 ABBREVIATIONS
BMI Body Mass Index
CPI Combined Performance Index
DUT Durban University of Technology
FAO Food and Agriculture Organization of the United Nations
FBDGs Food Based Dietary Guidelines
FFQ Food Frequency Questionnaire
HFIAS Household Food Insecurity Access Scale
HFII Household Food Insecurity Index
HSRC Human Sciences Research Council
IFSS Integrated Food Security Strategy
ISAK International Standards for Anthropometric Assessment

9
Kg/m² Kilograms per metres squared
MDG Millennium Development Goals
n Number
NCDs Non-communicable diseases
NGOs Non-governmental Organisations
NKQ Nutrition Knowledge Questionnaire
NKT Nutrition Knowledge Test
NSFAS National Students Financial Aid Scheme
PMB Pietermaritzburg
RDA Recommended Dietary Allowance
SCC Student Counselling Centre
SD Standard deviation
SPSS Statistical Package for Social Sciences
UKZN University of KwaZulu-Natal
UKZN-PMB University of KwaZulu-Natal Pietermaritzburg campus
UN United Nations
USAID United States Agency for International Development
US FSSM United States Food Security Survey Module
WFP World Food Programme
WHO World Health Organization
1.9 CONCLUSION
Achieving food security is essential for meeting the first MDG, namely, „to eradicate extreme
poverty and hunger‟. As a country, South Africa may be food secure; however, there are pockets
of the population that are at a high risk of being food insecure. Students receiving financial aid
have been identified to be at risk of becoming food insecure as most of them are from a low
socio-economic background. Food insecurity threatens the physical, emotional and cognitive
wellbeing of these students which might ultimately result in high drop-out and low graduation
rates. Therefore, food insecurity may undermine the primary function of higher education,
which is to improve the socio-economic status of people.

10
CHAPTER 2: LITERATURE REVIEW
2.1 INTRODUCTION
Despite South Africa‟s national “food-secure” status, an estimated 14 per cent of the population
was vulnerable to becoming food insecure in 2011 and 1 in 5 being food insecure in 2012
(Statistics South Africa 2013; Koch 2011). Food insecurity has a strong impact on dietary
quality. Malnutrition is prevalent among the local student population as a result of inadequate,
poor quality and unpredictable food intake (Hughes et al 2011; Hoddinott & Yohannes 2002;
Steyn & Ochse 2013). Paradoxically, food insecure individuals consume a diet that results in
obesity and overweight (FAO/WFP 2009; Wilde & Peterman 2006). This phenomenon is the
result of diets that are high in energy and low in nutrient density. In addition, diets of this nature
are usually more affordable than foods such as fruits and vegetables with a higher nutrient
density (Oldewage-Theron & Egal 2010; Temple, Steyn, Myburgh & Nel 2006; Kruger, Kruger
& MacIntyre 2005). This form of malnutrition increases the risk for the development non-
communicable diseases (NCDs) among the student population (Adams et al 2003; Vozoris &
Tarasuk 2003; Steyn et al 2000). In fact, students who are food insecure tend to give a poor
health report of themselves (Hughes et al 2011; Newton & Turale 2000) and a poor self-worth as
a result of the cycle of debt they get themselves into (Newton & Turale 2000). The debt incurred
may also be as a result of poor financial management and abuse of credit through impulsive
buying (Norvilitis, Merwin, Osberg, Roehling, Young & Kamas 2006). Dlamini (2012) reported
that when students were advised to purchase food in bulk in order to get better value for money,
the majority of students UKZN-PMB reported food theft as a serious problem in student
residences.
There is a lack of published evidence documenting a relationship between food insecurity and
academic performance among university students. However, there is a substantial amount of
literature providing evidence that food insecurity has a negative impact on the academic
performance outcomes of children (Taki et al 2011; Cooke 2007; Frongillo et al 2006; Jyoti et al
2005; Alaino et al 2001). Dlamini (2012) reported that students at the UKZN-PMB, who are
recipients of financial aid, often complained about not being able to concentrate on their studies

11
due to hunger as a result of an inability to purchase food. In addition, this phenomenon was
reported to be more common during exam time.
Since poor nutrition knowledge has been linked to poor dietary habits (Beydoun &Wang 2008),
the literature discussing the nutritional status, dietary diversity and nutrition knowledge of
students will be explored. This will allow an investigation into the impact of nutrition
knowledge or the lack thereof on the food security status, nutritional status and dietary diversity
of students on financial aid.
2.2 FOOD SECURITY STATUS
Food security, as defined by the USAID (Riely et al 1999), is made up of fundamental elements
that include food availability, food access, food stability and food utilization. According to this
definition, food availability is achieved when enough of food is consistently available to all
individuals supplied through household production, other domestic output, commercial imports,
or food assistance (Riely et al 1999). Food access is achieved when households and all
individuals within them have adequate resources to obtain appropriate food for a nutrient dense
diet. Access depends on available income, the distribution of income, and the price of food
(Riely et al 1999). Food utilization refers to the bio-availability of food. This requires a diet
sufficient in energy and essential nutrients, as well as access to clean water, and adequate
sanitation (Riely et al 1999). However, effective food utilization depends largely on knowledge
regarding food storage, processing techniques and basic nutrition principles (Riely et al 1999).
2.2.1 Food security status of students on financial aid
Poverty has been universally accepted as the main cause of undernutrition, and it is a serious
problem affecting the nutritional status of South Africans (Woolard & Leibbrandt 1999). It
would be expected that students receiving financial aid would be protected from food insecurity
since financial security is essential in addressing food insecurity (Petersen et al 2009) however,
this has not been true. Over the past decade, both overall government education spending and
funding for higher education has increased substantially (Letseka & Maile 2008). The increases

12
in university enrolments have resulted in the amount of available funding per student being lower
than a decade ago (Letseka & Maile 2008). The cost of food is significant for those with limited
finances and is a determining factor with regards to what they can purchase and how they
allocate their disposable income (Hughes et al 2011; Bhorat & Oosthuizen 2005). Students
receiving government financial assistance are classified as at risk, as financial aid is offered to
those whose socio-economic status is often 20–39% below the poverty line (Hughes et al 2011).
In South Africa, 70% of the families of higher education drop-outs surveyed were in the category
referred to as “low economic status” (Letseka & Maile 2008). Black families were found to be
particularly poor, with some parents and guardians earning less than R1 600 a month. The report
from the Department of Higher Education & Training (2011) states that without exception, every
Vice Chancellor and Deputy Vice Chancellor as well as the overwhelming majority of student
leaders interviewed from South African Universities indicated that the levels of NSFAS funding
provided for accommodation and food was inadequate.
At UKZN, Munro, Simpson & Quayle (2013) reported that on average, students‟ weekly food
expenditure was R127.93 and that they were significantly more likely to go hungry near exam
time. Dlamimi (2012) explained that this was due to the fact that the students usually had
exhausted their monetary allowance in the preceding month. Dlamini (2012) also reported that
at exam time students visit the student funding offices in order to request advances for the
following semester as they have run out of food. The students complain of the inability to
concentrate, demotivation and fatigue, as a result of hunger. More than 38% of the students
surveyed by Munro et al (2013) were affected by food insecurity, with 11% highly vulnerable to
food insecurity and those on financial aid being more vulnerable to food insecurity than others.
This was confirmed by Dlamini (2012) who stated that most students who are recipients of
financial aid frequently complain about experiencing hunger. The findings of Munro et al (2013)
were also supported by those of Hughes et al (2011) who found that student food insecurity was
significantly associated with receiving financial aid. Meldrum & Willows (2006) conducted a
study among students of the University of Alberta (Canada) to evaluate the adequacy of loans
funding and the risk of food insecurity. It was also found that students receiving financial aid
were likely to have insufficient funds for a nutritionally adequate diet and were highly vulnerable

13
to becoming food insecure. Dlamini (2012) also reported that approximately 70% of students on
financial aid claim to be living with grandparents who support them with pension grants.
Ntuli (2005) stated that a lack of income adversely affected the ability of students to maintain
satisfactory eating habits at the Durban University of Technology (DUT), as inadequate income
limited the quantity, quality and variety of the food being consumed. Ntuli (2005) also
suggested that students lack consumer skills such as budgeting, in order to optimally utilise
available resources and make good food choices.
The UKZN-PMB campus is located in close proximity to supermarkets and cafeterias where
food is available. However, food choice also depends on suitability/convenience with regards to
shelf life, cooking and preparation time, packaging and affordability (Ali, Kapoor & Moorthy
2010; Ayalew 1997). Foods that are nutritious and those that can be classified as being high in
fat, salt, sugar and low in dietary fibre such as chips, hamburgers and pastries are freely available
to students from food sources such as street vendors, kiosks and cafeterias. However, despite
availability, consumption is ultimately affected by the affordability of food items. Therefore,
food availability in terms of food systems does not guarantee consumption (Ali et al 2010;
Ayalew 1997). It is therefore clear that even if food is available to students, it might not be
affordable. Food availability should therefore be described as a wide choice of food options
accessible through food systems that are both acceptable and affordable (Ali et al 2010; Ayalew
1997).
2.2.2 Common methods of measuring food insecurity among young adults
The most common methods of measuring food security include the use of the Household Food
Insecurity Access Scale (HFIAS), Food Insecurity Index, and the Coping Strategies Index, the
US FSSM, Hunger Scales and various nutrition indicators (Bickel, Nord, Prince, Hamilton &
Cook 2000).
Msaki (2010) conducted a study in the Umbumbulu district of KwaZulu-Natal which included
200 individual members from 176 households. This study was aimed at developing and testing

14
tools to measure household food insecurity. The results showed that while the Household Food
Insecurity Index (HFII) explained the influence of demographic and socio-economic variables on
household food insecurity well, the HFIAS was found to be the most convenient in application
(easy data management and computation process). In addition, it was also strongly related to the
Coping Strategies Index scores. The HFIAS was found to be a good tool in differentiating
between food secure and food insecure households.
Holland, Kennedy & Hwang (2011) conducted a study among free living adults (≥ 18 years) to
compare the HFIAS, the US FSSM and a modified version of the US FSSM. The findings of
this study suggested that the HFIAS was a more appropriate instrument than the US FSSM for
measuring food security among these free living adults as it was more easily understood by the
study group surveyed.
2.3 ASSESSMENT OF NUTRITIONAL STATUS
Anthropometric measurements are commonly used as indicators of nutritional status and to
determine gross body composition (So, Swearingin, Dail & Melton 2012; Wenhold & Faber
2007; Gibson, pg.6 2005; Moreno, Joyanes, Mesana, González-Gross, Gil, Sarría, Gutierrez,
Garaulet, Perez-Prieto, Bueno, Marcos & the AVENA Study Group 2003). In addition, they are
used to measure and forecast performance, health and survival of individuals and reflect the
economic and social well-being of populations (Gibson pg.233, 2005; Cogill 2003). These
measurements allow for the identification of persons or populations that require nutrition
intervention and to assess the impact of an intervention (Cogill 2003).
Anthropometry is advantageous as it is non-invasive, quick, inexpensive, and requires limited
training. Portable equipment can be used and it is reliable, given that the equipment being used
is calibrated. This makes it ideal for field studies, nutrition surveys, epidemiological studies and
conducting nutritional surveillance (So et al 2012; Gibson pg.233, 2005; Cogill 2003; Moreno et
al 2003).

15
Anthropometric measurements also provide information on nutritional status history which
cannot be accurately obtained using other assessment methods (So et al 2012; Gibson pg.233,
2005; Moreno et al 2003). Anthropometric measurements include weight and height
measurements. These raw measurements are often combined and expressed as an index in order
to aid interpretation (Gibson pg. 7, 233 2005; Cogill 2003; Moreno et al 2003). An example of
this is the BMI. The selection of anthropometric indices for assessment of nutritional status
depends on a number of factors, such as the study objectives, sampling methods, calculated
sample size, validity, reproducibility, accuracy, random errors, systematic errors, sensitivity,
specificity, prevalence, predictive value and ethical issues (Gibson pg. 234, 2005; Cogill 2003).
2.3.1 Anthropometric measurements commonly reported when surveying young adults
Weight-to-height ratios (obesity indices) have proven to be the most useful in measuring
adiposity and serve as indicators of nutritional status among adult populations (So et al 2012;
Wenhold & Faber 2007; Gibson pg.259, 2005). These indices include the weight/height ratio
and BMI.
BMI has been found to be reasonably unbiased by height, and correlates well with laboratory
based measurements of obesity among all adult groups and adolescents (So et al 2012; Gibson
pg.259, 2005; Cogill 2003; Moreno et al 2003). The BMI is appropriate for examining effects of
short-term dietary changes such as seasonal changes in food supply or short-term nutritional
stress brought about by illness and is a good reflection of energy status (Faber & Wenhold 2007;
Cogill 2003, WHO 2000). It has also been found to be more precise than skinfold thickness
measurements and is easy to implement in large scale nutrition surveys and epidemiological
studies (So et al 2012; Gibson pg.259, 2005). As a result, it is globally used to classify weight
status among adults of all ages (Gibson pg.259, 2005). The formula for BMI is weight divided
by the squared height (WHO 2006).
Dimkpa & Oji (2010) conducted a cross-sectional study among young adult students in Ebonyi
State University, Nigeria, to investigate the relationship between BMI and haemodynamic
variables and abnormalities among 710 participants (350 males and 360 females) aged 20–25

16
years. Resting blood pressure, resting heart rate and BMI were calculated and it was found that
in both genders, BMI showed significant correlations (p<0.001, p<0.01 and p<0.05 respectively)
with these haemodynamic variables. As a result, the findings of this study showed that BMI is a
good predictor of cardiovascular disease risk. So et al (2012) conducted a study investigating
body fat measurements and their correlation with estimations based on BMI, waist
circumference, and bioelectrical impedance analysis, compared to air displacement
plethysmography among African-American students. It was found that BMI was a good
estimator of body fat.
Weight and height measurements for calculating BMI are commonly measured with the study
group dressed in light indoor clothing and without shoes (Gibson pg.235, 2005; Moreno et al
2003). The WHO (2004) BMI classifications and associated risk for co-morbidities are depicted
in table 2.1. The table shows the association between BMI category and the risk for mortality.
All students with a BMI ≥25 kg/m2 are classified as overweight, while students with BMI <18.5
kg/m2 are classified as underweight. All students with a BMI ranging between 18.5 - 24.99
kg/m2 are considered to be of a normal weight. However, it is important to note that BMI cannot
distinguish between weight associated with fat (adiposity), oedema or muscle and gives no
indication of body fat distribution (Gibson pg.259, 268, 2005).
Table 2.1: WHO classification of overweight in adults according to body mass index
Classification BMI (kg/m²)1 Risk of co-morbidities
Underweight <18.50 Low (but risk of other clinical problems is increased)
Normal Range 18.50 – 24.99 Average
Overweight
Preobese
Obese Class I
Obese Class II
Obese Class III
≥25.00
25.00 – 29.99
30.00 – 34.99
35.00 – 39.99
≥40
Increased
Moderate
Severe
Very Severe
Source: WHO 2004
1Body Mass index defined as weight in kilograms divided by the square of height in metres (kg/m²) of a person

17
2.3.2 Anthropometric status of young adults
Puoane, Steyn, Bradshaw, Laubscher, Fourie, Lambert & Nbananga (2002) conducted a study as
a follow up to the 1998 South African Demographic and Health Survey (SADHS), where a
sample of 13 089 males and females (≥15 years) were randomly selected and then stratified by
province as well as urban versus rural areas in South Africa. The mean BMI for males and
females were 22.9 kg/m² and 27.1 kg/m², respectively. Males had a 29.2% overweight or obesity
prevalence, while females showed a 56.6% prevalence of overweight or obesity rate.
Underweight was found among 12.2% of the males and 5.6% of females. The study findings
showed that obesity increased with age, and higher levels of obesity were found among urban
black women. These values are much higher than those documented in the 1998 SADHS
(Puoane et al 2002) that reported that 31.8% of black women (over the age of 15 years) were
obese and that a further 26.7% were overweight. The prevalence of obesity among men of the
same age was 6.0%, with 19.4% being overweight. These findings imply that the prevalence of
obesity is increasing among young as well as older South African adults.
In a study investigating the possible causes of obesity in a relatively young population (75% of
the sample were younger than 35 years) residing in Khayelitsha, Cape Town, it was found that
the prevalence of overweight/obesity was high (76.5%) (Malhotra, Hoyo, Østbye, Hughes,
Schwartz, Tsolekile, Zulu & Puoane 2008). In addition, obesity was more common among
women (53.4%) than men (18.7%).
Black women were also found to have the highest prevalence of obesity in a study conducted by
Senekal, Steyn & Nel (2003) among a locally economically active adult population (18– 65
years). The figures for combined overweight/obesity in the different ethnic groups were as
follows: black women, 75%; black men, 49%; coloured women, 66%; coloured men, 45.7%;
Indian women, 37%; Indian men, 36%; white women, 42%; and white men, 56%. When Venter,
Walsh, Slabber & Bester (2009) conducted a study assessing the body size perception of black
women in the Free State, 500 pre-menopausal women aged 25-44 years were recruited. Venter
et al (2009) found that 3.2% of the women were underweight, 6.3% were in the lower normal
weight range (18.5<20 kg/m²), 37.8% had a normal weight, 29.1% were overweight and 23.6%

18
were obese. The largest percentage of those women chose overweight as the healthiest body
image and acceptable weight.
2.3.3 Anthropometric status of university students
Cilliers, Senekal & Kunnene (2005) conducted a cross-sectional study on 360 female first year
students at the University of Stellenbosch to investigate the association between the weight status
of first-year female students and various weight management-related characteristics to identify
possible components of a weight management programme for students. The mean BMI of the
study sample was 21.8 kg/m², with 7.2% being underweight, 81.9% being of a normal-weight,
10.0% overweight and 0.8% obese.
Beukes, Walker & Esterhuyse (2009) conducted a study among 349 female first year students
from the University of the Free State. For the purpose of this study, a BMI of 20 kg/m² or lower
was considered to be underweight, while a BMI higher than 25 kg/m² was considered
overweight. Beukes et al (2009) found that 19.2% of the study group were underweight, while
55% had normal weight, and 25.8% were overweight. The mean BMI for the entire sample was
23.43kg/m².
Reddy, Resnicow, James, Kambaran, Omardien & Mbewu (2008) conducted a study among
9224 adolescents (13-19 years) within selected South African government-funded schools in all
nine provinces. Findings were that 9.0% of the sample was underweight. In addition, a
significantly higher percentage of males than females were underweight, while 16.9% of the total
sample was overweight. A significantly higher proportion of females than males were
overweight and obese, particularly at the age of 18 years.
When determining selected risk factors for the development of metabolic syndrome and
assessing the metabolic risk status of third-year physiology students at the University of
Stellenbosch (88 males and 178 females), Smith & Essop (2009) found that the average BMI for
males and females were within the normal range.

19
Ntuli (2005) found significant gender differences for BMI at the DUT in that 17% of the female
students were overweight and 13% were obese while 10% of the males were found to be
overweight and 7% were obese. Therefore, more females were found to be overweight and
obese than males. Steyn et al (2000) reported a prevalence of overweight of 23% among black
students at the University of the North in South Africa.
The prevalence of overweight and obesity was 21.6% and 4.9% respectively in a study
conducted by Terry, Huang, Harris, Lee, Nazir, Born & Kaur (2003) among American university
students. This implies that obesity rates among South African university students are
comparable to those documented in other, more developed countries.
In addition, the above findings are in line with that of Park & Kim (2005) among Chinese
university students, where the prevalence of overweight was 24%. Angeles-Llerenas, Carbajal-
Sanchez, Allen, Zamora-Munoz & Lazcano-Ponce (2005) conducted a study among 13 293
Mexican students aged 11–24 years. Findings were that of the total sample size, 7.3% were
underweight, 16.4% had a normal weight, 20.3% were overweight and 20.4% were obese.
Contrary to the above findings, only 2.0% of a sample of female Polish students was obese, 6.6%
overweight, 75.5% of a normal weight and 15.9% underweight (Jaworowska & Bazylak 2009).
2.3.4 Relationship between food security and anthropometric status
Gooding, Walls & Richmond (2011) found that food insecure young adult women were more
obese than their food secure counterparts. Even though Gooding et al (2011) did not find a
relationship between food security status and BMI among young men, Wilde & Peterman (2006)
found that both men and women from food insecure households were more obese and gained
more weight over a twelve month period than their peers from food secure households. A
significantly high prevalence of obesity was also reported among food insecure African-
American, White, and Mexican-American women by Brown (2008) and Adams et al (2003).
The relationship between food insecurity and obesity was also found in children, i.e. obesity
increased with a decrease in food security status (Buscemi, Beech & Relyea 2011). It is
therefore clear that the relationship between obesity and food insecurity is a strong one.

20
2.4 DIETARY DIVERSITY
2.4.1 Methods used to determine dietary diversity
Dietary diversity is measured by assessing the kind of foods individuals consume. Methods
measuring dietary diversity can be extensive, assessing not only which foods are consumed but
the methods of preparation, quantities consumed and beverage consumption, including alcohol
and caffeine containing beverages (Grosvenor & Smolin pg.47, 2006; Gibson pg. 41, 2005;
Whitney & Rolfes 1993). Tools used for measuring food consumption include 24-hour recalls,
food diary or food intake record, weighed food records, dietary history and food frequency
questionnaires (Gibson pg. 41, 2005; Whitney & Rolfes pg.16, 1993).
Another method used for assessing food consumption is known as the food frequency
questionnaire (FFQ) which aims to assess the usual intake of foods or specific groups of foods
(Gibson pg. 46, 2005; Whitney & Rolfes pg.16, 1993). Modifications and new computerised
technologies have enabled this method to reflect usual intakes. Specific combinations of foods
(food groups) are used as predictors for certain nutrients. For example, fruits and fruit juices are
used as predictors of vitamin C intake; green leafy vegetables and carrots as predictors of
carotenoids; cereals, legumes, nuts and fruits and vegetables as predictors of fibre intake; and
dairy products as predictors of calcium intake (Gibson pg. 47, 2005). The FFQ is less
demanding than other methods for both the researcher and participants and is commonly used in
epidemiological studies (Ambrosini, de Klerk, O‟Sullivan, Beilin & Oddy 2009). Ambrosini et
al (2009) assessed the reliability of the use of a semi-quantitative food frequency questionnaire
among adolescents and found that the questionnaire was able to correctly rank a reasonable
proportion of adolescents in terms of dietary diversity.

21
2.4.2 Nutritional requirements of young adults
Young adulthood is the stage of the life cycle with individuals aged between 17 - 30 years
(Grosvenor & Smolin pg.466, 2006). As far as nutritional needs are concerned, growth and
development are not completed in young adults (Grosvenor & Smolin pg. 460, 2006; Gibson
2005; Weigley, Mueller & Robinson 1997; Whitney & Rolfes pg. 527,528, 1993). During
adolescence, the composition of the body changes and nutrient requirements of both males and
females increase, as at this stage of the life cycle, sexual maturation as well as accelerated
growth occurs (Grosvenor & Smolin pg. 459, 2006; Whitney & Rolfes pg. 527, 1993), thereby
making the energy and protein requirements in adolescence higher than at any other stage of the
life cycle (Grosvenor & Smolin pg. 459,460, 2006; Whitney & Rolfes pg. 528, 1993).
In addition, micronutrient requirements increase in order to facilitate this accelerated growth
especially that of vitamin B6 as it is important for protein synthesis. Food sources of vitamin B6
include chicken, meat, fish, liver, green vegetables and cereal grains (Grosvenor & Smolin pg.
248,460, 2006; Whitney & Rolfes pg.311, 1993). In order to facilitate cell division, folate and
vitamin B12 requirements increase. Vitamin B12 is found exclusively in animal products while
folate is found in liver, legumes, oranges, green leafy vegetables and fortified cereals (Grosvenor
& Smolin pg.460, 2006; Whitney & Rolfes pg. 314, 371, 1993). It is recommended that women
of childbearing age consume increased amounts of folic acid from supplements or fortified foods
(Grosvenor & Smolin pg.460, 2006; Whitney & Rolfes pg. 313, 1993).
Young adults incorporate twice the amount of iron, zinc and magnesium into their bodies during
periods of active growth when compared to other stages of the life cycle (Grosvenor & Smolin
pg. 461, 2006; Whitney & Rolfes pg. 528,408, 1993). Organ development and the growth of
skeletal muscle cause an increase in zinc requirements due to an increase in protein synthesis
(Grosvenor & Smolin pg. 461, 2006; Gibson 2005; Whitney & Rolfes pg. 420, 1993). There is
also an increase in iron requirements and as a result, iron deficiency anaemia is common among
young adults (Grosvenor & Smolin pg. 461, 2006; Gibson 2005; Oldewage-Theron et al 2000;
Whitney & Rolfes pg.528, 1993). Iron is required in greater amounts to accommodate the
expansion of blood volume and myoglobin to facilitate an increase in muscle mass, particularly

22
in males (Grosvenor & Smolin pg. 461, 2006; Whitney & Rolfes pg. 406, 1993). Females
however, have increased iron needs as a result of menstrual losses (Grosvenor & Smolin pg. 461,
2006; Whitney & Rolfes pg. 408, 1993). Sources of iron include meat, fish, poultry, green leafy
vegetables, legumes and whole and enriched cereals (Grosvenor & Smolin pg. 308, 2006;
Whitney & Rolfes pg. 413, 1993).
Calcium is required for bone development in order for healthy skeletal growth to occur
(Grosvenor & Smolin pg. 461, 2006; Gibson 2005; Whitney & Rolfes pg.384, 1993). Forty-five
per cent of skeletal growth occurs during late adolescence and early adulthood (Grosvenor &
Smolin 2006; Whitney & Rolfes pg. 385, 1993). Hence, the Recommended Dietary Allowance
(RDAs) for calcium and vitamin D are set at adolescent levels until young adults reach 25 years
of age (Whitney & Rolfes pg. 387, 1993). Physical growth continues to about the age of 21
years, and bone growth continues to the mid-to-late twenties (Grosvenor & Smolin 2006;
Whitney & Rolfes pg. 387, 1993). Calcium deficiencies increase the risk of osteoporosis in later
life. Therefore it is important to ensure an adequate calcium intake during this stage of the
lifecycle (Grosvenor & Smolin 2006; Gibson 2005; Whitney & Rolfes pg. 387,528, 1993). Good
dietary sources of calcium include dairy products, fish with edible bones and green leafy
vegetables (Grosvenor & Smolin 2006; Whitney & Rolfes pg. 387, 1993).
From the above it is therefore evident that nutrients that are more likely to be inadequate in the
diet of young adults with suboptimal eating patterns are iron, zinc, calcium, folate, magnesium,
vitamin A, vitamin B6 and vitamin B12 (Grosvenor & Smolin 2006; Whitney & Rolfes pg.528,
1993).
2.4.3 Common nutrition deficiencies among young adults
A significant portion of the student population that enter higher education is still in late
adolescence and early adulthood in terms of growth (Hill 2009). Oldewage-Theron et al (2000)
found that iron deficiency was widespread among females aged 13-25 years, and that it was
induced by a plant–based South African diet that is low in bio-available iron. Steyn et al (2000)
also found that both female and male students were unable to meet the RDA for energy, calcium

23
and iron. A study conducted by Badenhorst, Dannhauser, Slabber, du Toit & Nel (1998) where
the nutrient intake of students enrolled at the University of the Free State was assessed, found
that more than 50% of the students had an insufficient intake of micronutrients, especially
calcium and vitamin A. The student population showed insufficient intake of various other
micronutrients that including folate, iron, magnesium, niacin, protein, riboflavin, thiamin,
vitamin B12, vitamin B6, vitamin E and zinc. The authors concluded that the dietary pattern of
the student sample surveyed resembled a typical westernised urban diet, high in energy with a
lack of micronutrients.
In the report from the Department of Higher Education & Training (2011) describing student
housing at institutions of higher education in South Africa, it was reported that the nutritional
quality of food consumed by students is poor. Moreover, there were students who went hungry
for days and hunger was highly prevalent among students at all South African universities. Pap
(stiff porridge) and milk was reported to be the most frequently consumed meal in most of the
self-catering university residences. It is therefore not surprising that Ntuli (2005) found that the
dietary intake from the vegetable, fruit, meat and dairy groups was low among students at the
DUT. As a result, the intake of nutrients such as iodine, calcium, vitamin A, zinc, vitamin C,
riboflavin, vitamin B6, iron and magnesium was reported to be inadequate. Ntuli (2005) further
stated that according to the FFQ administered, the dietary habits of students were westernized as
most reported to be consuming foods from the cereal, meat, sweets and oil groups, with a
significantly low consumption from the fruit and vegetable group. Fruits that were consumed
almost daily included: apples and bananas (27%); oranges (4%) and fruit juice (23%). As a
result, the vitamin C intake of 77% of the sample was significantly low due to a low
consumption of fruit. Ntuli (2005) also reported that 65% of the sample reported the
consumption of less than one vegetable serving per day. Legumes, soya products and nuts were
not consumed by 66% of the sample and only 30% consumed canned baked beans and/or soup
powders. The per capita bread intake was high as a significant portion of the sample reported the
consumption of bread for all three meals of the day.
Foods that resemble a traditional eating pattern such as maize meal, mabele, jeqe (steamed
bread), samp and beans were seldom consumed. In addition, Ntuli (2005) found that the diet of

24
the students were not in line with dietary recommendations when compared to the South African
food-based dietary guidelines (FBDGs) (Vorster 2001). Contrary to the findings by Ntuli
(2005), Steyn et al (2000) found that students from rural areas followed a more traditional diet
compared to urban students. Urban students consumed significantly more sugar and
confectionery, while rural students consumed more cereals and legumes. This implied that
students continued to consume familiar foods, even when they were away from home. The
nutritional intake of all students surveyed was generally poor, with their diets mainly lacking
calcium, iron and zinc (Steyn et al 2000).
2.5 NUTRITION KNOWLEDGE OF UNIVERSITY STUDENTS
The improvement of nutrition knowledge in order to improve dietary habits has received a great
deal of attention in the literature (Beydoun & Wang 2008; Kolodinsky, Harvey-Berino, Berlin,
Johnson & Reynolds 2007; Park & Kim 2005; Steyn et al 2000; Ladzani 1996; Walsh 1995; Barr
1987). After Badenhorst et al (1998) found that the dietary pattern of students enrolled at the
University of the Free State resembled a typical westernised diet, it was suggested that one of the
factors that are related to insufficient micronutrient intake is the lack of nutrition knowledge.
Ntuli (2005) also reported that students at the DUT did not consume diets that comply with
dietary guidelines as a result of their lack of nutrition knowledge regarding sound nutrition
practices. Foods that were consumed and proved to have a positive correlation with the Nutrition
Knowledge Test (NKT) were: maize meal, pasta, samp, rice, eggs, pilchards, dried beans and
peanut butter, fruits and fruit juice. These correlations were however not statistically significant.
The results showed that students had poor intakes of fruits and vegetables as a result of lack of
nutrition knowledge regarding „the use of food by the body‟. The study results also suggested
that students may lack an understanding of the relationship between nutrients and optimal health.
Kolodinsky et al (2007) conducted a cross-sectional study investigating whether the eating
patterns of 200 American college students were related to their knowledge of dietary guidance.
It was found that students who had increased nutrition knowledge about fruit, dairy, protein, and
whole grains had an increased likelihood of meeting their dietary recommendations. In addition,
nutrition knowledge was related to making more nutrient-dense food choices. Kolodinsky et al

25
(2007) suggested that guidelines such as the national dietary guidelines in conjunction with
effective public-awareness campaigns may be a useful mechanism for promoting healthier food
choices among communities. Park & Kim (2005) reported that after nutrition education was
given to Chinese students, meals were consumed more regularly. Steyn et al (2000) also found
that poor nutrition knowledge led to a low consumption of food rich in calcium, iron and zinc
among rural and urban black South African students. Kicklighter, Koonce, Rosenbloom &
Commander (2010) documented that first year students welcomed nutrition guidelines that could
be practically integrated into their lifestyles. As a result, students were given nutrition education
as part of their orientation course. Many reported to have gained nutrition knowledge and found
the module worthwhile.
Contrary to the above, available literature has also revealed that nutrition knowledge has minimal
impact on the dietary choices of different population groups (Temple et al 2006; Cleland,
Worsley & Crawford 2004). In a study conducted by Temple et al (2006), it was found that
knowledge was unrelated to whether the adolescents attending schools in Cape Town would
purchase nutrient dense foods or not. In fact, 66% of the learners who purchased the low
nutrient dense items knew that those were the least nutritious options. The same results were
found by Cleland et al (2004) among grade five and six Australian learners who chose the correct
foods to term „healthy‟, yet purchased high energy, low nutrient foods at the tuck shop (canteen)
with fruit and vegetable purchases being at a minimum. Sakamaki, Toyama, Amamoto, Liu &
Shinfuku (2005) found that although 85.6% of Chinese students were aware of the concept of
nutritionally balanced meals, only a small number of students (7%) applied this concept when
selecting food from a menu and described unhealthy options as more „tasty‟. Moreover, only
51% of students showed a desire to learn about healthy eating habits.
Nutrition knowledge also did not have an impact on the food choices of a food insecure
community of QwaQwa as the adolescents surveyed showed an understanding and appreciation
of adding variety to their diets. However, this was not reflected in their daily food choices, based
on the top 20 most commonly consumed food items (which included potato chips and vetkoek)
and their low nutrient intakes. Eighty-two per cent of the sample knew that variety should be
included in their diets. However, their dietary habits were unchanged even though 72% of the

26
sample knew that different foods performed different functions in their body. This could be
related to the fact that foods high in fat and low in micronutrients were the most affordable
(Oldewage-Theron & Egal 2010).
2.6 CONCLUSION
There seems to be a high prevalence of food insecurity among local students on financial aid.
Student poverty, food insecurity and hunger have resulted in high drop-out and low graduation
rates. As a result, food insecurity undermines the primary function of higher education which is
to improve human and social capital, with the additional aim to improve the economic status of
people. Food insecurity increases the risk of the development of NCDs as food insecure
individuals were found to be more obese then their food secure counterparts. There is a generally
low consumption of nutrient-dense foods such as fruits, vegetables and whole grains among the
student population. There are conflicting reports on whether nutrition knowledge has an effect
on dietary habits and there is a lack of available data on whether food insecurity affects academic
performance. It would therefore be important to investigate the prevalence of food insecurity,
nutritional status, dietary diversity, nutrition knowledge and academic performance of students
on financial aid at the UKZN-PMB in order to implement corrective measures to address the
factors that contribute to food insecurity amongst this study population.

27
CHAPTER 3: RESEARCH METHODOLOGY
3.1 INTRODUCTION
This chapter presents and discusses the research methods and measuring instruments used in the
study. The questionnaire design, pilot study, sample selection, data collection, capturing and
statistical analysis are discussed. The specific data collection methods employed in relation to
each study objective is also explained.
3.2 STUDY DESIGN
A cross-sectional descriptive survey was conducted. This method was suitable as the study
aimed to establish the prevalence of a condition (Grimes 2002), in this case, food insecurity.
With this study design, the sample is studied at one point in time, thereby making it cost
effective in terms of time and operational costs. As a result, a relatively large sample size can be
investigated at any given instant in time. The main disadvantage of this design is however that
variations and patterns of behaviour cannot be controlled for (Grimes 2002) and the results are
very specific to the study population.
3.3 SAMPLE SELECTION
3.3.1 Study population
UKZN comprises of five campuses based in the Durban and Pietermaritzburg area, with a total
population of 39 989 students. UKZN - PMB campus is situated in one of the suburbs in PMB,
namely Scottsville. This campus includes three colleges representing three different areas of
study with a student population of 9 785 (UKZN Management Information Fact Site 2013). Of
the total number of students on this campus, approximately 55% are recipients of financial aid
(Dlamini 2012).

28
3.3.2 Sample selection
The study participants were randomly selected from the study population which represented
students who were recipients of financial aid and studied at the UKZN-PMB Campus. The PMB
campus was conveniently chosen and two hundred and sixty-eight (n=268) participants across
three colleges with different study majors participated in the study through simple random
sampling. The sample size was representative of 5%of the student population receiving financial
aid at UKZN - PMB. Participants were excluded if they were in their first year of study or at a
masters, doctoral, or post-doctorate level of study.
All students receiving financial aid were invited to participate through UKZN student email
notifications, posters and word of mouth. The latter information was obtained from the
university financial aid database through the Student Funding Centre office. Interested students
were then invited to participate in the study. Posters were posted at various sites around the
campus and specified the inclusion criteria of the study.
3.4 METHODS AND MATERIALS
A self-administered questionnaire (Appendix A) was developed for the purpose of the study by
the researcher based on the literature and personal communication with various experts in the
field. The questionnaire was used to collect information regarding socio-demographic
characteristics, dietary diversity, accommodation, amount of money spent on food, the use of
support services and experiences relating to food insecurity, including coping strategies. As a
result, the four main sections of the questionnaire included a section on socio-demographic
information, a food frequency questionnaire (FFQ), the household food insecurity access scale
(HFIAS) (Coates, Swindale & Bilinsky 2007) and a nutrition knowledge questionnaire (NKQ)
(Whati 2005).
The first part (section A) of the questionnaire was used to record weight and height.
Anthropometric measurements were taken by trained fieldworkers in accordance with the
International Standards for Anthropometric Assessment (ISAK) (ISAK 2001) under supervision
of the researcher. Participants were requested to remove their shoes and were weighed in light
indoor clothing. Weight was measured using a digital floor scale (Seca Digital Personal)
calibrated to the nearest 100g. Height was measured using a stadiometer with a fitted measuring

29
tape and a sliding headboard (Seca Portable Stadiometer). Height was measured and recorded to
the nearest 0.1 cm. Each measurement (weight and height) was repeated three times and the
mean value was calculated. The mean weight and height of each participant was used to
calculate BMI which was then compared to WHO reference values (Wenhold & Faber 2007;
WHO 2006).
The FFQ used was semi-quantitative in nature and has been proven to be reproducible and valid
among black adolescents older than 15 years and women in the North West province and the
Birth-to-Twenty study (MacKeown, Pedro & Norris 2007). For the purpose of this study, the
FFQ was adapted by the researcher using a FFQ that was piloted and implemented for use in an
adult isiZulu speaking population by Kassier (2008).
The HFIAS (Coates et al 2007) (Appendix E) was used to determine the food security status of
the study participants. Since the tool is normally used to measure household food security, it was
adapted by the researcher to measure individual food security status. The original tool was
therefore merely reworded to make it relevant for the purpose of the current study. For example,
appendix A, section C, question 8: “In the past 4 weeks/30 days, did you or any household
member go to sleep at night hungry because there was not enough food?” was reworded to; “In
the past four weeks, did you go to sleep hungry at night because there was not enough food?”
The HFIAS score is a measure of the degree of food insecurity (access) in the individual
(household) over the past four weeks (30 days). Firstly, a HFIAS score variable is calculated for
each individual (household) by adding up the codes for each frequency-of-occurrence question.
However, before adding up the frequency-of-occurrence values, data was coded as follows:
frequency-of-occurrence was coded as zero (0) for all cases where the answer to the
corresponding occurrence question was “no”. A response code of one(1), two (2) and three (3)
were given for all the cases where the answer to the corresponding occurrence question was
“rarely”, “sometimes” and “often”, respectively. The maximum score for an individual
(household) would subsequently tally as 27 if the individual response to all nine frequency-of-
occurrence questions was “often” (coded with response code of 3). The minimum score was
zero (0) if the individual responded “no” to all frequency-of-occurrence questions. Therefore,
the higher the HFIAS score, the more food insecurity (access) the individual experienced and the

30
lower the score, the less food insecurity (access) an individual experienced (Coates et al 2007).
Table 3.1 presents the HFIAS categories for the purpose of this study.
Table 3.1: HFIAS categories
HFIAS category HFIAS score
Food secure 0 - 6.24
At risk of food security 6.25 - 13.49
Food insecure 13.5 - 20.74
Severely food insecure 20.75 – 27
The HFIAS occurrence questions relate to three different domains of food insecurity (access)
namely: i) Anxiety and uncertainty about the household food supply (addressed by question 1);
ii) Insufficient Quality, which includes variety and preferences of the type of food (addressed by
question 2, 3 and 4) and; iii) Insufficient food intake and its physical consequences (addressed by
questions 5,6,7,8 and 9).
The HFIAS categorizes the sample into four levels of household food insecurity (access) (see
table 3.1): food secure, mildly-, moderately- and severely food insecure (Coates et al 2007).
Persons are categorized as increasingly food insecure if they respond positively to more severe
conditions and/or experience those conditions more „often‟. A food secure person experiences
none of the food insecurity (access) conditions, or just experiences worry, but „rarely‟ so (Coates
et al 2007).
A mildly food insecure (access) person is one which worries about not having enough food
„sometimes‟ or „often‟, and/or is unable to eat preferred foods, and/or eats a more monotonous
diet than desired and/or some foods considered undesirable, but only „rarely‟. He/she does not
cut back on quantity nor experience any of the three most severe conditions (running out of food,
going to bed hungry, or going without food for a whole day and night) (Coates et al 2007).
Moderately food insecure persons sacrifice quality more frequently, by eating monotonous diets
or undesirable foods „sometimes‟ or „often‟, and/or have started to cut back on quantity by

31
reducing the size of meals or number of meals, „rarely‟ or „sometimes‟. However, they do not
experience any of the three most severe conditions (Coates et al 2007).
Severely food insecure persons have cut back on meal size or number of meals „often‟, and/or
experience any of the three most severe conditions (running out of food, going to bed hungry, or
going a whole day and night without eating), even if as infrequently as „rarely‟. Therefore, any
person that experiences one of these three conditions even once in the last four weeks (30 days)
is considered severely food insecure (Coates et al 2007). Table 3.2 presents the HFIAS
questionnaire illustrating the food insecurity (access) categorization scheme.
Table 3.2: HFIAS categorization scheme
Frequency
Question No (0) Rarely (1) Sometimes (2) Often (3)
1
2
3
4
5
6
7
8
9
Source: Coates et al 2007
FOOD SECURE MODERATELY FOOD INSECURE
MILDLY FOOD INSECURE SEVERELY FOOD INSECURE

32
The last section of the questionnaire was used to determine the nutrition knowledge of the study
group. These questions were extracted from a 60 question NKQ developed by Whati (2005) for
adolescents who were to participate in the Birth-To-Twenty study. The key concepts covered in
this questionnaire are based on the South African Food Based Dietary Guidelines (FBDGs)
(Voster 2001).
Table 3.3: Categorisation of items in questionnaire based on the South African food-based
dietary guidelines.
FBDGs
items numbering in
Whati (2005)
questionnaire Questions included
Items re-
numbering
1. Enjoy a variety of foods 16,17,24,37,40,51 16,37,51 3,20,31
2. Be active 14,22,26,29 - -
3. Make starchy foods the basis of
most meals
4,9,35,45,47,49 4,9,35, 1,12,9
4. Eat plenty of vegetables and
fruit every day
7,15,21,25,42,57 7,25,42,57 11,7,10,17
5. Eat dry beans, split peas, lentils
and soy regularly
54,55,56,58,60 54,55,56,58,60 30,23,29,24,18
6. Chicken, fish, meat, milk or
eggs can be eaten daily
2,18,23,33,46,59 2,18,23,33 6,4,13,8
7. Eat fats sparingly 8,19,43,48,50 8,19,43,48,50 2,5,14,15,16
8. Use salt sparingly 6,20,28,34 6,36,34 26,28,22
9. Drink lots of clean, safe water 5,27,30 - -
10. If you drink alcohol, drink
sensibly
10,31 10,31 27,21
11. Use food and drinks containing
sugar sparingly and not
between meals
1,32,36,39,52 1,39,52 25,19,32
12. Nutrition in pregnancy 3,11,12,13,38,41,44,53 - -

33
The above table (table 3.3) shows the questions extracted and re-numbered from the original
questionnaire by Whati (2005). The FBDGs were chosen as the relevant literature revealed that
students consume diets that lack diversity and micronutrients (Temple et al 2006; Ntuli 2005;
Sakamaki et al 2005; Cleland et al 2004; Steyn & Ochse 2013). Since poor dietary diversity
results in obesity among young adults (Azadbakht & Esmaillzadeh 2010), questions related to
FBDGs 1, 3 and 4 were included. Protein is often found to be lacking in the diets of the poor and
food insecure (Brooks, Simpson & Raubenheimer 2010). Therefore, all the questions related to
FBDGs 5 and 6 were included as these assess knowledge of plant and animal sources of protein.
Questions relating to FBDGs 7, 8, 10 and 11 were included as students and food insecure
populations have been found to consume high amounts of fat, sugar, salt and alcohol (Oldewage-
Theron & Egal 2010; Temple et al 2006; Ntuli 2005; Sakamaki et al 2005; Cleland et al 2004).
Questions related to alcohol were included as Dlamini (2012) reported that males were found to
spend a substantial amount of their money on alcohol. The questions pertaining to physical
activity (FBDG 2), water (FBDG 9) and nutrition in pregnancy were not included.
Table 3.4 Nutrition NKQ score categories
Category Score
Poor 1-49
Average 50-69
Good 70-100
The nutritional knowledge of the study sample was determined by calculating the test score of
each participant as a percentage. “Poor” nutrition knowledge was defined as a score ranging
from 0 - 49%, while an “average” nutrition knowledge score was defined as a score ranging from
50 – 69% and a “good” score ranging from 70 – 100%(see table 3.4 above).
The entire questionnaire was self-administered. However, the developer of the questionnaire
recommended that persons from historically disadvantaged backgrounds should receive
fieldworker assistance when completing the questionnaire (Whati 2005), as fieldworker
assistance will ensure that the participant has adequate understanding of each item before giving
his/her response to each multiple choice question.

34
In order to assess the academic performance of the sample, the combined performance index
(CPI) was used. This index is used by the UKZN to track the overall performance of individual
students for the duration of their studies. The sample was then divided into three quartiles (25th
,
50th
and 75th
) according to their CPI scores. Therefore the poorest performing students would
fall under the 25th
quartile while the best performing would fall above the 75th
quartile.
3.5 FIELDWORKER RECRUITMENT AND TRAINING
The fieldworkers were recruited from the student complement of the UKZN-PMB Department of
Dietetics and Human Nutrition. They received training by the researcher on administering the
questionnaires and taking anthropometric measurements in accordance with ISAK standards.
3.6 PILOT STUDY
The sample used for conducting the pilot study was recruited in the same manner in which the
study sample was recruited i.e. email notifications, posters and word of mouth. The sample
consisted of 15 students, representing 5% of the study sample size.
The purpose of the pilot study was to identify ambiguous questions forming part of the study
questionnaire. In addition, pilot testing was also used to determine how long it would take
participants to complete the questionnaire in order to guard against respondent fatigue. The pilot
study also allowed the fieldworkers to gain practical experience on working together as a team
and to standardise anthropometric measurement techniques. As participants answered the
questionnaire in a satisfactory manner and the questionnaire was not found to be ambiguous, no
subsequent changes were necessary prior to commencement of data collection.
3.7 DATA COLLECTION
Data collection was conducted over a two week period. Various lecture theatres and library
discussion rooms were booked for this purpose; at various sites on the UKZN-PMB campus.
The venues used for data collection had the necessary furniture to ensure that participants were
comfortably seated while data collection took place. In addition, booked venues had sufficient
open spaces for conducting anthropometric measurements. It was ensured that the venues were

35
quiet and communication between participants was discouraged to reduce respondent bias and to
enable fieldworkers to assist participants who had queries.
Upon arrival at the data collection venue, participant‟s names and student numbers were checked
against the list of financial aid recipients obtained from the Student Funding Centre. This was to
ensure that only students receiving financial aid participated in the study. Participants were then
asked to complete an informed consent form (see Appendix B). This was followed by weighing
and taking of height measurements. Once this was completed, participants were seated and were
instructed on how to complete the self-administered questionnaire. Two fieldworkers were
responsible for measuring height while two measured weight and oversaw the questionnaire
administration.
3.8 DATA CAPTURING, PROCESSING AND ANALYSIS
At the end of each data collection day, data was captured into the Statistical Package for Social
Science (SPSS) version 21. All data sets were found to be acceptable by the researcher. As a
result, no data sets were rejected. The data was reviewed by a statistician and found acceptable
and requiring no cleaning. Table 3.5 shows how the data was analysed.

36
Table 3.5: Analysis of data
Objective Variables Statistical analysis
Demographic characteristics Gender
Age
Race
Residence
College
Year of study
Employment status
Frequency distributions
Descriptive statistics
Anthropometric measurements BMI
gender
Food security status
frequency distributions
ANOVA test
ANOVA test (analysis of
variance)
Two-sample t
Dietary diversity Food frequency
Nutrition knowledge
Frequency distributions
Chi-squared
Food security status HFIAS
Monthly food expenditure
Monthly expenses
Longest time without food
Additional allowance
Coping strategies
Chi-square test
ANOVA
Frequency distributions
Levene‟s test for equality
of variances
ANOVA test
ANOVA test
Nutrition Knowledge Nutrition Knowledge
Questionnaire
BMI
Year of study
Frequency distributions
Levene‟s test for equality
of variances
Levene‟s test for equality
of variences
Academic performance CPI scores
Struggled to concentrate in
class?
HFIAS
Additional allowance
Chi-square test
Levene‟s test
ANOVA test
ANOVA test

37
3.9 ETHICAL CONSIDERATIONS
Ethical approval was obtained from the Humanities and Social Sciences Research Ethics
Committee (HSS/0150/012M) (Appendix D) of the University of KwaZulu-Natal. All
participants were referred to by a code in order to guarantee their anonymity and to prevent a
specific data set from being traced back to specific study participants. The weight and height
measurements of all participants were taken away from the seating area where questionnaires
were completed to ensure privacy.
3.10 CONCLUSION
This chapter outlined the procedures followed in obtaining the data using a cross-sectional
descriptive survey method. The measuring tools used to obtain the data related to each study
objective were discussed. The chapter discussed the manner in which sample selection,
exclusion criteria, questionnaire formulation, administration of data capturing, the interpretation
of the data for each study objective, the pilot study and the recruitment of field workers was
conducted. The results of the data analysis are reported in Chapter four.

38
CHAPTER 4: RESULTS
4.1 INTRODUCTION
Food security is an important nutrition topic amongst vulnerable population groups such as the
young and the socioeconomically disadvantaged. University students often fall into these
categories as they are young, have relatively low levels of disposable income and often live away
from home for the first time. This chapter presents the prevalence of the study parameters (i.e.
food security status, nutritional status, and nutrition knowledge), the distribution of these
indicators and how these indicators may relate with each other among undergraduate students on
financial aid at UKZN-PMB campus.
4.1.1 SAMPLE CHARACTERISTICS
The sample size consisted of 268 students (N = 268) on financial aid that met the study‟s
inclusion criteria (see Chapter three). Table 4.1 presents the socio-demographic characteristics
of the study sample.

39
Table 4.1: Socio-demographic characteristics of study sample (N=268)
1 Additional allowance refers to a monthly allowance received from family or caregiver(s).
* % of total sample (n = 268)
Variable n %*
Gender:
Male
Female
110
158
41.0
59.0
Age:
17-21
22-26
27-31
32-36
>37
185
80
2
0
1
69.0
29.8
0.8
0
0.4
Race:
Black
White
Coloured
Indian
267
0
1
0
98.9
0
0.4
0
Residence:
Home
Campus Residence
Private Accommodation
Other
14
211
42
1
5.2
78.7
15.7
0.4
College:
Humanities
Engineering and Science
Law and Management Studies
82
141
45
30.6
52.6
16.8
Year of Study:
Second
Third
Fourth
> Fourth
124
120
20
4
46.3
44.7
7.5
1.5
Part-time
Employment
Status:
Employed
Unemployed
4
143
1.5
98.1
Additional
Allowance1:
Receiving
Not Receiving
123
143
45.6
53.0

40
From the above table it is evident that nearly two thirds of the sample was made up of females.
The predominant race group was black (98.9%) while more than two-thirds (69%) of the sample
fell in the 17-21 year age category and nearly a third (29.8%) in the 22-26 year age category.
The bulk of the sample consisted of students in their second (46.3 %) or third (44.7%) year of
study, while the most (78.7%) of the students resided in university residences. The bulk of the
sample was unemployed, i.e. did not hold a part-time job (98.1%), with just over half (53.0%)
reporting that they did not receive additional financial assistance such as an allowance from
family or caregivers.
4.2 FOOD SECURITY STATUS
The HFIAS score is a continuous measure of the degree of food insecurity (access) in the
individual (household) over the past four weeks (30 days). The mean HFIAS score for the study
sample was 11.9 ± 6.78, which was indicative of the „at risk of food insecurity‟ category.
The mean HFIAS score for males was lower (11.7± 6.5) than that for females (12.1 ±6.8).
However, according to Levene‟s test for equality of variances (where p = 0.78) and the T-test
(where p = 0.65), the difference in the mean food security test score between males and females
was not statistically significant. Therefore it can be concluded that the mean HFIAS score
between males and females was similar.

41
Table 4.2 Household Food Insecurity (Access) categorization scale showing the frequency-of-
occurrence Household Food Insecurity Access-related conditions
Question
No
n (%)*
YES
Rarely
n (%)* Sometimes
n (%)* Often
n (%)
1. In the past month, did you worry that you would not have
enough food? 56 (20.7) 40 (14.8) 119 (44.1) 54 (20.0)
2. In the past month, were you not able to eat the kinds of foods
you preferred because of lack of resources? 38 (14.1) 43 (15.9) 105 (38.9) 81 (30.0)
3. In the past month, did you have to eat a limited variety of
foods due to lack of resources? 44 (16.3) 49 (18.1) 96 (35.6) 78 (28.9)
4. In the past month, did you have to eat some foods that you
really did not want to eat because of lack of resources to obtain
other types of food?
52 (19.3) 57 (21.1) 93 (34.4) 67 (24.8)
5. In the past month, did you have to eat a smaller meal than
you felt you needed because there was not enough food? 86 (31.9) 51 (18.9) 90 (33.3) 42 (15.6)
6. In the past month, did you have to eat fewer meals in a day
because there was not enough food? 74 (27.4) 62 (23.0) 92 (34.1) 40 (14.8)
7. In the past month, was there ever no food to eat of any kind
in your room because of lack resources to get food? 113 (41.9) 63 (23.3) 70 (25.9) 23 (8.5)
8. In the past month, did you go to sleep at night hungry
because there was not enough food? 140 (51.9) 58 (21.5) 52 (19.3) 16 (5.9)
9. In the past month, did you go a whole day and night without
eating anything because there was not enough food? 171 (63.3) 50 (18.5) 38 (14.1) 10 (3.7)
* % of total sample (n = 268)
FOOD SECURE
MILDLY FOOD INSECURE
MODERATELY FOOD INSECURE
SEVERELY FOOD INSECURE

42
Table 4.2 presents the HFIAS questionnaire depicting the frequency-of-occurrence of food
insecurity access conditions. The three most severe conditions of food insecurity (namely;
running out of food, going to bed hungry or going for a whole day and night without food) were
experienced by the sample. Just over a quarter (25.9%) of the sample „sometimes‟ had no food
of any kind in their rooms while close to 1 in 10 (8.5%) of the sample experienced this condition
„often‟.
Almost one fifth (19.3%) of the sample „sometimes‟ went to bed hungry due to a lack of food.
This condition was also experienced „often‟ by 5.6% of the sample, while another fifth (21.5%)
of the sample experienced it „rarely‟.
The last most severe characteristic of food insecurity (going a whole day and night without food)
was experienced „often‟ by 3.7% of the sample, while 14.1% experienced it „sometimes‟ and
almost a fifth (18.5%) experienced it „rarely‟.
The condition experienced „often‟ by most (30%) of the sample was the inability to eat the kinds
of foods they preferred because of the lack of resources followed by the obligation „to eat a
limited variety of foods due to lack of resources‟ by 28.9% of the sample.
Table 4.3 presents the food security status and additional sources of income of the study sample.

43
Table 4.3 Food security status of students on financial aid and additional sources of income1
1 Mean ± SD (n = 268) is reported
* % of total sample (n = 268)
Do you receive an additional
allowance to financial aid? How much is the
additional
allowance you
receive per
month?
How much money
do you spend on
food per month?
Total Yes No
HFIAS score1 n (%)2 n (%) n (%)
Food secure 0 - 6.2 59 (22.0) 34 (12.8) 23 (8.6) R373.71 ± R391.75 R569.50 ± R214.20
At risk of food insecurity 6.3 -13.5 90 (33.6) 44 (16.5) 46 (17.3) R310.42 ± R440.55 R554.60 ± R176.17
Food insecure 13.5 - 20.7 93 (34.7) 38 (14.2) 54 (20.4) R204.14 ± R291.25 R555.68 ± R253.44
Severely Food Insecure 20.8 – 27.0 26 (9.7) 9 (3.5) 18 (6.7) R138.92 ± R234.86 R558.00 ± R152.53
Total 268 (100) 125 (47) 141 (53) R270.22 ± R372.36 R558.40 ± R211.12
Mean HFIAS score 11.9 ± 6.7 10.9 ± 6.7 12.9 ± 6.5

44
Over a third (34.7%) of the study sample was food insecure with another third (33.6 %) being at
risk of food insecurity. Almost a tenth (9.7%) of the study sample was found to be severely food
insecure and just over a fifth (22%) of the study sample was found to be food secure.
The mean additional allowance received by the sample, apart from financial aid, was R270.22 ±
R372.36 per month. There was a statistically significant difference (p = 0.01) in the food
security status of students receiving an allowance and those that did not. Just over half (53%) of
the study sample reported that they received no other allowance in addition to financial aid.
Students who did not have an additional source of income had the highest mean HFIAS score
(12.9 ± 6.5). The remainder of the sample (47%) that did receive an additional allowance
received a mean of R270.22 ± R211.12 per month. The amount of money received, decreased
with an increase in vulnerability to food insecurity. In addition, students who were severely food
insecure and received an allowance (3.5%) received the least mean allowance (R138.92 ±
R234.86). The difference in allowance received by food secure- (22%) and severely food
insecure students (9.7%) was statistically significant (p = 0.006).
The mean amount of monthly food expenditure was R558.40 ± R211.12. There was no
statistically significant difference between the amounts of money spent on food between the
different HFIAS score categories. It would therefore seem as if monthly food expenditure did
not affect food security status.
Figure 4.1 represents a breakdown of the monthly expenses of the study sample what the study
sample.

45
1
% of total sample (n = 256)
Figure 4.1: A breakdown of the monthly expenses of the students on financial aid at UKZN-
PMB1.
From the above it is evident that the vast majority (82.4%) of the sample spent most of their
money on food. The second highest expenditure was reported to be clothing (7.8%).
Table 4.4: Coping strategies of food insecure students on financial aid at UKZN-PMB campus1
Coping Strategy % (n)* Mean HFIAS Score1
Friends 46.8 (117) 13.2 ± 6.2
Keep Busy 13.2 (33) 11.8 ± 6.9
Drink Water 12.0 (30) 12.4 ± 5.5
Family 11.2 (28) 8.8 ± 6.4
Other 16.8 (42) 12.5 ± 7.4
Total 250 (100) 12.3 ± 6.5 1 Mean ± SD (n = 250)
* % of total sample (n = 250)
211 (82.4%)
4 (1.6%)
20 (7.8%) 5
(2.0%)
6 (2.3%)
7 (2.7%)
3 (1.2%)
256 (100%)
0
50
100
150
200
250
300
food socialevents
clothing toiletries varsityextras
travellingcosts
other Total
Fre
qu
en
cy

46
When the study participants were asked to elaborate on their coping strategies when they ran out
of food and money, the four main responses included: (i) calling family members for assistance
with food or money; (ii) asking friends for assistance with food or money; (iii) keeping busy in
order to ignore the feeling of hunger; and (iv) drinking lots of water. Table 4.4 presents the
coping strategies of the study sample when running out of food and/or money.
It was found that 11.2% of the sample size sought help from family, while almost half of the
sample (46.8%) sought assistance from friends, 13.2% kept busy in order to ignore the feeling of
hunger and 12% drank a lot of water to curb hunger. Students who sought assistance from
family members had the lowest mean HFIAS score (8.8 ± 6.4) while those who sought assistance
from friends had the highest mean HFIAS score (13.2 ± 6.2). Therefore students who sought
help from family members were more food secure than those who sought assistance from
friends.
4.3 ASSESSMENT OF NUTRITIONAL STATUS
Table 4.5 presents the nutritional status of the study sample in terms of BMI (kg/m²).
Table 4.5: Nutritional status of students on financial aid at UKZN-PMB campus
WHO
Classification BMI (kg/m²)1
Males
n (%)*
Females
n (%)*
Total
n (%)*
Underweight <18.50 3 (1.1) 4 (1.5) 7 (2.6)
Normal Range 18.50 - 24.99 88 (33.0) 82 (30.7) 170 (63.7)
Overweight ≥25.00-29.99 16 (6.o) 41 (15.4) 57 (21.45)
Obese ≥30 3 (1.1) 30 (11.2) 33 (12.4)
Mean BMI 23.0 ± 3.5 25.4 ± 5.2 24.4 ± 4.7
Source: WHO (2004) 1 body mass index as weight in kilograms divided by the square of height in metres (kg/m²) of a
person * % of total sample

47
The mean BMI of the study sample was within the normal range according to the WHO (2004)
(24.4 ± 4.7 kg/m2). However, the mean BMI of females were significantly higher (p = 0.00)
than that of males and fell in the overweight category (25.4 ± 5.2 kg/m2) while the mean BMI of
males was within the normal range (22.0 ± 3.5 kg/m2).
The majority of the study sample (63.7%) had a BMI within the normal range while a fifth
(21.4%) was overweight and over a tenth (12.4%) was obese. The percentage of obese females
(11.2%) was ten times higher than that of males (1.1%) and the percentage of overweight
females (15.4%) was more than double of overweight males (6%).
Table 4.6 illustrates the relationship between food security status and BMI.
Table 4.6: The mean BMI of students in different food security categories
Food security status n (%)* Mean BMI (kg/m²)1
Food secure 59 (22.0) 24.0 ± 4.4
At risk 90 (33.6) 24.3 ± 5.2
Food insecure 93 (34.7) 24.4 ± 4.6
Severely food insecure 26 (9.7) 25.5 ± 4.5
Total 268 24.4 ± 4.7
1Body mass index as weight in kilograms divided by the square of height in metres (kg/m²) of a
person * % of total sample ( n = 268)
From the above table it is evident that there was a trend showing how an increase in BMI was
associated with an increase in food insecurity. The study participants who were severely food
insecure (9.7%) had the highest mean BMI (25.5 ± 4.5) which fell into the overweight category.
However, an ANOVA analysis yielded a non significant p-value (p = 0.79), illustrating that the
relationship between food insecurity and BMI was not a significant one.

48
4.4 DIETARY DIVERSITY
Table 4.7: Results generated by non-quantified food frequency questionnaire
How often to you eat the following
foods?
More than
once/day
n (%)*
Once/day
n (%)*
2-3 times a
week
n (%)*
Seldom
n (%)*
Never
n (%)*
Milk (fresh milk, maas, yogurt, cheese,
milk powder )
39 (14.6) 80 (30.0) 73 (27.3) 70 (26.2) 4 (1.5)
Other dairy products (e.g. cheese,
yoghurt, ice-cream)
14 (5.2) 48 (18.0) 70 (26.2) 111 (41.6) 19 (7.1)
Breakfast cereals/porridge 23 (8.6) 135 (50.6) 47 (17.6) 44 (16.5) 12 (4.5)
Bread, rice, pasta, mealie rice, samp,
phutu, jeqe (steamed bread), potatoes
160 (59.9) 73 (27.3) 25 (9.4) 6 (2.2) 0 (0)
Legumes (dried beans, peas, baked
beans, lentils, soya mince)
16 (6.0) 40 (15.0) 85 (31.8) 96 (36.0) 26 (9.7)
Meat, fish, poultry 45 (16.9) 73 (27.3) 111 (41.6) 25 (9.4) 2 (0.7)
Processed meats (e.g. ham, polony) &
organ meats
35 (13.1) 57 (21.3) 62 (23.2) 84 (31.5) 23 (8.6)
Eggs 44 (16.5) 58 (21.7) 65 (24.3) 81 (30.3) 13 (4.9)
Peanut butter, nuts 20 (7.5) 23 (8.3) 43 (16.1) 107 (40.1) 67 (25.1)
Vegetables 45 (16.9) 64 (24.0) 74 (27.7) 70 (26.2) 7 (2.6)
Fruit 50 (18.7) 78 (29.2) 77 (28.8) 48 (18.0) 7 (2.6)
Fats (e.g. sunflower/cooking oil,
margarine, mayonnaise)
105 (39.3) 90 (33.7) 52 (19.5) 16 (6.0) 2 (0.7)
Sweets (e.g. cakes, doughnuts, candy,
chocolate, biscuits)
71 (26.6) 52 (19.5) 71 (26.6) 69 (25.8) 2 (0.7)
Salty snacks (e.g. potato chips, corn
chips, pretzels)
39 (14.6) 61 (22.8) 81 (30.3) 72 (27) 8 (3.0)
Fizzy drinks & cool drinks 29 (10.9) 36 (13.5) 90 (33.7) 92 (34.5) 15 (5.6)
Alcohol (e.g. beer, wine) 1 (0.4) 4 (1.5) 17 (6.4) 65 (24.3) 170
(63.7)
Coffee & tea 93 (34.8) 70 (26.2) 46 (17.2) 39 (14.6) 14 (5.2)
Fast foods (e.g. pizza, pies, sausage
rolls, samosas, KFC, Nando’s, Chicken
Licken)
12 (4.5) 34 (12.7) 65 (24.3) 137 (51.3) 16 (6.0)
* % of total sample (n = 268)

49
According to table 4.7, the study sample consumed „milk‟ (30%) more often than „other diary
products‟ (18%) on a daily basis. However, it is evident that just over a quarter of the sample
surveyed consumed any form of dairy products only two to three times a week, whereas just over
a quarter (26.2%) of the sample seldom consumed milk.
It was evident that starchy foods such as bread, porridge, rice and phutu served as staple foods in
the diets of those surveyed as the starch group was consumed „more than once a day‟ by nearly
two-thirds (59.9%) of the study sample. More affordable sources of protein such as legumes,
peanut butter and eggs were seldom consumed by the bulk of the study sample, whereas „meat,
fish and poultry‟ took preference over the consumption of other animal sources of protein such
as processed meat and eggs. Most of the sample (41.6%) consumed meat, fish and poultry „2-3
times a week‟, while it was consumed on a daily basis by nearly a third (27.3%) and „more than
once a day‟ by 16.9% of the study sample. A fifth of the study sample consumed processed
meats once a day (21.3%) or 2-3 times a week (23.2%), while nearly a third (31.5%) consumed
them „seldom‟.
Vegetable consumption proved to be low as it was only consumed more than once a day by
16.9% of the study sample while 24 % consumed it on a daily basis followed by 27.7%
consuming it „2-3 times a week‟ and 26.2% seldom consuming them. Fruit consumption proved
to be marginally higher than vegetable consumption as 18.7% consumed it more than once per
day, followed by daily consumption reported by 29.2% and „2-3 times a week‟ by 28.8 % of the
study sample respectively.
Most of the study sample (39.3%) consumed fats „more than once a day‟ followed by „once a
day‟ for 33.7% of the study sample. A quarter (26.6%) of the sample consumed sweets „more
than once a day‟, followed by a fifth (19.5%) consuming it on a daily basis and another quarter
(26.6%) consuming it „2-3 times a week‟. Most of the study sample (30.3%) consumed salty
snacks „2-3 times a week‟. While fizzy drink consumption was reported to be consumed „2-3
times per week‟ by a third of the sample (33.7%) followed by „seldom for 34.5%. Just over ten
per cent (10.9%) of the sample consumed fizzy drinks more than „once a day.‟
The majority (63.7%) of the sample reported that they „never‟ consumed alcohol while 24.3%
seldom drank it. Coffee and tea was consumed „more than once a day‟ by the most (34.8%) of

50
the sample and was consumed once a day by 26.2%. Just over half (51.3%) of the study sample
reported to consume fast foods seldom while a quarter (24.3%) consumed fast foods „2-3 times a
week‟.
In summary, the most frequently consumed foods that were consumed more than once a day
included the starch group (bread, rice. pasta, phuthu, jege, etc.), fats (cooking oil, margarine,
mayonnaise) and coffee and tea. This was followed by milk, breakfast cereals/porridge and
fruits, which were consumed by the bulk of the study sample „once a day‟.
4.5 NUTRITIONAL KNOWLEDGE
Table 4.8 presents the nutrition knowledge of students on financial aid at UKZN-PMB campus.
Table 4.8: The nutrition knowledge of students on financial aid at UKZN-PMB campus1
1 total nutrition knowledge test score obtained expressed in %
*% of total sample (n = 268)
The mean score of the sample was 18.8 ± 3.8 (58.6%) which fell within the “average” range.
Most (66.0%) of the sample had an average NKT score while14.9 % had good nutrition
knowledge. Almost a fifth (19.0%) of the sample had „poor‟ nutrition knowledge. Table 4.9
presented below, gives an overview of NKT scores in relation to academic year of study.
Nutrition Knowledge Score (%)
n (%)*
Poor 0 - 49 51 (19.0)
Average 50 - 69 177 (66.0)
Good 70 - 100 40 (14.9)
Mean score (%) 58.6 268 (100.0)

51
Table 4.9: Nutrition knowledge test scores of students according to academic year of study.
1 Mean ± SD (n = 262)
* % of total sample (n = 262)
From the above table it is evident that there is an increase in the mean NKT score as students
progressed to subsequent years of study. To determine whether the improvement in NKT score
was statistically significant, Levene‟s test and a t-test for equality of means were performed to
compare the mean test scores of students in their second academic year to those in their fourth
year of study. Levene‟s test for equality of variances of means showed that there was no
statistically significant difference in the variances (p = 0.14). The t-test also showed that there
was no statistically significant difference between the mean test scores of the two years of study
(p = 0.23). It can therefore be concluded that academic year of study has no effect on nutrition
knowledge.
Table 4.10 illustrates the relationship between BMI category and mean nutrition knowledge
score of the study sample.
Academic year n (%) Mean (SD)
Second 118 (45) 18.5 ± 3.8
Third 120 (45.8) 18.8 ± 4.0
Fourth 20 (7.6) 19.6 ± 2.9
over fourth 4 (1.6) 18.0 ± 4.6
Total 262 (100) 18.7 ± 3.8

52
Table 4.10: The mean nutrition knowledge score across different BMI categories1
BMI Category n Mean Nutrition knowledge score
Underweight 7 18.6 ± 4.2
Normal 171 18.7 ± 3.8
Overweight 57 18.5 ± 4.1
Obese 33 19.6 ± 2.7
Total 268 18.8 ± 3.8
1Mean ± SD (n = 268) is reported
The above table illustrates that there might be an increase in the mean NKT score with an
increase in BMI category as participants who fell into the obese category had the highest mean
nutrition knowledge score (19.6 ± 2.7). To test whether the increase was significant, Levene‟s
test for equality of variances and a t-test were performed to compare the mean nutrition
knowledge score between the normal BMI category and obese category. Levene‟s test yielded a
p-value = 0.04. As a result, the null hypothesis (the null hypothesis states that the variances are
equal) is rejected and it can be concluded that the variances in nutrition knowledge between
these two groups were not equal. The t-test however, showed that there was no statistically
significant difference in the mean NKT scores between the two groups (p = 0.23).
Table 4.11 shows the impact of nutrition knowledge on the frequency of food consumption in
relation to different food groups.

53
Table 4.11 Impact of nutrition knowledge on the frequency of consumption of foods
Nutrition Knowledge n p-value
Fresh milk, maas, yoghurt, cheese,
powder milk
poor 51 0.81
good 40
Other diary products poor 50 0.43
good 40
Breakfast cereals/porridge poor 49 0.63
good 40
Bread, rice, pasta, maize meal, samp,
potatoes
poor 51 0.61
good 39
Legumes poor 51 0.42
good 38
Meat, fish, poultry poor 49 0.06*
good 39
Processed meats and organ meats poor 50 0.00*
good 38
Eggs poor 50 0.65
good 40
Nuts and peanut butter poor 49 0.73
good 40
Vegetables poor 50 0.39
good 39
Fruits poor 51 0.48
good 39
Cooking oil, margarine, mayonnaise poor 51 0.55
good 40
Cakes, doughnuts, candy, chocolate,
biscuits
poor 51 0.03*
good 40
Potato chips, corn chips, pretzels poor 50 0.35
good 38
Fizzy dinks and cool drinks poor 51 0.01*
good 39
Beer, wine poor 51 0.28
good 39
Coffee & tea poor 49 0.67
good 39
Pizza, pies, sausage rolls, samoosaa, KFC poor 50 0.04*
good 40
*p-value < 0.05

54
From the above table it would seem as if there was a significant relationship between good
versus poor nutrition knowledge on the consumption of the following groups of foods:
processed meats (p = 0.00); cakes, doughnuts, sweets (p = 0.03); fizzy drinks (p = 0.01) and;
pizza, pies, samosas, Kentucky Fried Chicken (KFC) (p =0.04). There was a moderate
significant difference for the food group „meat, fish, and poultry (p = 0.06)‟.
4.6 ACADEMIC PERFORMANCE OF STUDENTS ON FINANCIAL AID
Table 4.12: Academic performance of students on financial aid at UKZN-PMB1.
CPI 25th
quartile CPI 50th
quartile CPI 75th
quartile Totals
Total number of students [n (%)*] 72 (28.0) 128 (49.8) 57 (22.2) 257 (100)
Have you ever struggled to
concentrate in class due to hunger?
Yes [n (%)]
No [n (%)]
39 (15.2)
33 (12.8)
58 (22.6)
70 (27.2)
30 (11.7)
27 (10.5)
127 (49.4)
130 (50.6)
HFIAS score 11.9 ± 7.2 11.5 ± 6.6 12.3 ± 6.3 11.9 ± 6.7
How much is the additional
allowance do you receive per
month?
R539.81 ± R364.46
R527.81 ± R265.39
R576.25 ± R343.47
1 CPI (combined performance index) scores used to track student academic performance over the course
of the studies
*% of total sample (n = 257)
The above table shows the academic performance of the study sample. In order to assess the
academic performance, the combined performance index (CPI) was used. This index is used to
track the overall performance of individual students for the duration of their studies. The sample
was divided into three quartiles (25th, 50th and 75th) according to their CPI scores. Therefore,
the poorest performing students would fall under the 25th quartile while the best performing
would fall above the 75th quartile. In this study, 28% (n=72) of the sample‟s CPI was below the
25th quartile while 22.2% were above the 75th quartile. Approximately half (49.4%) of the
sample reported that they have struggled to concentrate in class due to hunger. More than 15%
of the sample that reported this had CPI scores below the 25th quartile. The portion of the

55
sample (22.2%) that had CPI scores above the 75th
quartile received a considerably higher
monthly allowance than those below the 25th
quartile; however the difference was not
statistically significant. The differences in the HFIAS scores among the two groups were also
not statistically significant.
4.7 RELATIONSHIP BETWEEN FOOD SECURITY STATUS AND OTHER
VARIABLES
In table 4.13 the study sample divided into 3 food security categories namely; food secure (score
range 0-6.24), moderately food insecure (score range 6.25- 13.49) and food insecure (score range
13.5 - 27). This table shows the relationship between food security status and numerical means
with their standard deviations of BMI, monthly food expenditure, days gone without food and
CPI scores.
Table 4.13: Relationship between food security status and other study variables
Food Secure Moderately Food
Insecure
Food Insecure
BMI/ (kg/m2)
1 24.0 ± 4.4 24.0 ±5.2 25.5 ± 4.5
Monthly food expenditure
(R/month)2
R569.50 ± R214.20 R554.60 ± R176.17 R558.00 ± R152.53
Days gone without food (n)3 4.40 ± 13.89 4.54 ± 6.25 6.64 ± 9.01
CPI 20114 85.9 ± 10.4 86.9 ± 13.3 83.8 ± 8.5
1Mean ± SD body mass index weight in kilograms divided by the square of height in meters of a person
2Mean ± SD money in rands (ZAR) spent per month
3Mean ± SD number of days spent without food
4Mean ± SD total CPI index score of student over the course of their study
The trends depicted in the above table suggest that an increase in BMI is associated with an
increase in food insecurity. In addition, it would seem that food secure students spend more
money on food than those who are food insecure. What is very evident is that with the
worsening of food security status, the number of days participants have gone without food also

56
increases. Food insecure students have a lower mean CPI score when compared to those that are
food secure. However, the difference was not statistically significant.
4.8 CONCLUSION
From this chapter it is evident that the vast majority of the study sample had no form of
employment and while only half of the sample received additional allowance besides financial
aid. Another alarming finding in this chapter was that more than 14% of the sample „sometimes‟
went a whole day and night without food. Asking friends for assistance seemed to be the main
coping strategy adopted by the sample. This coping strategy seemed to buffer food insecurity
more that asking family for assistance. The diet of the sample show a low intake of
micronutrients as less than 20% of the sample consumed vegetables and fruits „more than once a
day‟. This could be as a result of insufficient funds for food as mean NKT score of the sample
was average. The portions of the sample with the highest academic score were also received
higher mean monthly allowances. The results of this study are discussed in the following
chapter.

57
CHAPTER 5: DISCUSSION
5.1 INTRODUCTION
In South Africa, hunger is not a result of supply as the country can grow enough food to feed all
its citizens. Rather, the problem is one of access to food. Pockets of the population do not have
access to food. In this regard, one of the vulnerable groups that fall into this category is
university students, especially those on financial aid. This chapter will discuss the findings of
this study with reference to the available published data.
5.2 FOOD SECURITY STATUS
Students on financial aid at UKZN-PMB are at high risk of food insecurity. These findings
emulate the findings of Hughes et al (2011) and Meldrum & Willows (2006) who reported that
students on financial aid are highly vulnerable to food insecurity. In the current study sample
20% of the participants were food secure, while over 30% (1 in 3 students) was food insecure
and 10% severely food insecure. This figure is higher than the one in five people estimated by
the South African government (Statistics South Africa 2013).
On average, one out of five students experiences one or more or all the three most severe
conditions of food insecurity described in the literature (Coates et al 2007) as: completely
running out of food, going to bed hungry and going the whole day and night without food once
or more times a month. These are in line with the findings of Munro et al (2013) who also
conducted a study among UKZN students as a whole (did not target only those on financial aid)
and found that 38% of the sample was affected by food insecurity with 11% of the sample highly
vulnerable to food insecurity.
This high prevalence of food insecurity reported in the current study could be due to the fact that
half of the study sample did not receive an allowance in addition to financial aid. Therefore,
financial aid was their sole source of income. The Council of Higher Education (2011) reported
that all vice-chancellors of all universities in South Africa confirmed that financial aid alone was
not enough to cover food-related and accommodation costs. In the current study, of those
students who received an allowance in addition to financial aid, an additional R270.22 per month
was received. Students who received an allowance had a lower mean HFIAS score, thereby

58
illustrating that an increase in dispensable income decreases vulnerability to food insecurity.
Ntuli (2005) also found that a lack of income adversely affected the ability of students at the
DUT to maintain adequate nutrient intakes.
The mean monthly food expenditure amounted to R558.40 in the current study. This can be
translated into R139.60 per week. These findings are similar to that of Munro et al (2013) who
documented a weekly food expenditure of R127.93 in 2007. In view of the 49% increase in food
prices over the past 5 years (Statistics South Africa 2013), the student monthly food expenditure
has remained relatively the same. This could either mean that students are purchasing cheaper
foods in order to maintain the quantity of food items in their shopping baskets or they are buying
food in smaller quantities and cutting down on meal sizes and the number of meals consumed.
Either way, this would be characteristic of a food insecure individual (Coates et al 2007).
It is also of interest to note that there was only a R10 difference in the mean monthly food
expenditure of food secure versus the food insecure group. However, this difference was not
statistically significant, thereby indicating that all students on financial aid spend a similar
amount of money on food. This phenomenon can also be attributed to the fact that even those
least vulnerable to food insecurity do not have extra money to spend on food.
Food costs represented the highest monthly expenditure of the study sample as a whole. This
could be indicative of the fact that the sample is highly vulnerable to food insecurity as poor
households are reported to spend a significantly larger proportion (70%) of their household
income on food than those of a higher socio-economic status (Bhorat & Oosthuizen 2005). Over
80 % of the study sample spent the bulk of their money on food. This means that the sample is
significantly more vulnerable to food price hikes as it is their major source of expenditure
(Labadarios et al 2009; Bhorat & Oosthuizen 2005).
The current study showed that food insecure students spent on average nearly one week (6.6
days) without food. This finding was also echoed by a report given by the Council of Higher
Education (2011) that reported how students at South African universities claimed to have spent
days on end without food.
The main coping strategy reported by the sample when they ran out of food and/or money was to
„seek help from a friend‟. Asking for money from family was the last resort when it came to

59
coping with food insecurity. This could be due to the fact that most, if not all, of the students on
financial aid are from a low socio-economic background (Department of Higher Education and
Training 2011; Peterson et al 2009). As a result, family members are not in a position to assist in
an attempt to curb food insecurity. Letseka & Maile (2008) reported that some of the students
receiving financial aid were from homes with parents earning less than R1600 per month. In
fact, students that depended on family members for financial assistance were most vulnerable to
food insecurity while seeking assistance from friends proved to be a more reliable buffer against
food insecurity in the current study.
5.3 ASSESSMENT OF NUTRITIONAL STATUS
One in five (1 in 5) students were overweight and one in ten (1in 10) were obese. Female
participants showed a significantly higher prevalence of overweight and obesity than males.
These results are similar to that reported by Ntuli (2005) among the students from DUT where
one in five of females sampled were overweight and one in 10 females were overweight.
Females have also shown a significantly higher prevalence of obesity in studies conducted by
Cilliers et al (2005) among first year students at the University of Stellenbosch and Beukes et al
(2009) among first year female students at the University of Free State. The above findings
could be due to the fact that females tend to be less active and have a higher body fat content
than males as well as that cultural norms favour an overweight /obese state among females
(Venter et al 2009).
Food insecure students had higher BMI readings and the mean BMI of the severely food insecure
sample fell within the overweight category (WHO 2000). The same phenomenon was reported
by Gooding et al (2011) in a sample of food insecure young adult women. Wilde and Peterman
(2006) also found that food insecure young adult females were more likely to be obese and
gained more weight than their food secure counterparts. This trend has also been identified in
children (Buscemi et al 2011). These findings show that food insecurity increases the risk of
development of NCDs. In the current study however, the relationship was not statistically
significant.

60
5.4 DIETARY DIVERSITY
A lack of dietary diversity was found amongst the study sample. The most frequently consumed
foods included foods from the starch group (bread, jeqe, maize-meal, rice, pasta and potatoes),
fats (cooking oil, margarine and mayonnaise), tea and coffee, breakfast cereals, sweets and milk.
These results are in line with the report given by the Department of Higher Education and
Training (2011) stating that the most frequently consumed meal in university residences is stiff
pap (porridge) and milk.
In the current study, as was with the case reported by Ntuli (2005), there was low consumption
of vegetables, fruits and meat and a high intake of cereals and sweets. Meat was consumed 2-3
times a week whereas legumes, a more affordable source of protein, were seldom consumed.
This finding could be due to that fact that meat is expensive. As a result it is possible that the
study sample might not be consuming the daily recommended amount of protein. Although the
frequency of consuming fruit was higher than that of vegetables, it was lower than the
recommended guideline of 5 vegetables and fruit a day (see chapter 3, table 3.3 FBDG 4). As a
result, one would expect the diets of study group to be low in micronutrients such as vitamin C,
iron, folate, vitamin A, riboflavin, vitamin B6, zinc and magnesium (Ntuli 2005; Oldewage-
Theron et al 2000; Badenhorst et al 1998).
5.5 NUTRITION KNOWLEDGE
The majority of the study sample had average nutrition knowledge (score between 50 - 69%).
However, one in five students had poor nutrition knowledge (score between 1 – 49%). There
was no statistically significant difference in nutrition knowledge between students in different
academic years of study.
Students who fell in the obese BMI category had the highest nutrition test scores. This implies
that in the current study sample nutrition knowledge did not have an impact on food choice.
Nutrition knowledge was also reported to not have an impact on the food choices of a food
insecure community of QwaQwa, as their intakes largely included high energy and foods of a
low nutrient density (Oldewage-Theron et al 2000).

61
There were a few food groups where the consumption thereof showed a relationship with
nutrition knowledge. In fact, the higher nutrition knowledge of the study sample, the higher the
consumption of meat, processed meats, cakes, doughnuts and sweets, fizzy drinks and pizza,
pies, samosas and take-away foods. Temple et al (2006) also found that nutrition knowledge was
unrelated to whether adolescents chose nutrient dense foods or not. These results were also
reproduced in grade five and six learners in a study conducted by Cleland et al (2004) and
Samaki et al (2005) among Chinese students. All these samples understood the importance of
„healthy‟ food items to the body but chose to consume low nutrient containing foods. This could
be related to the fact that foods high in energy and low in micronutrients are more affordable. As
a result, affordability of foods may supersede nutrition knowledge and good nutrition practices.
5.6 FOOD SECURITY AND ACADEMIC PERFORMANCE
The portion of the study sample showing the highest food insecurity scores had lower CPI
scores. However, in the current study sample this relationship was weak and statistically
insignificant. It does however point towards a trend in the relationship between food security
status and academic performance. Although food insecurity might not directly affect mental
capacity, the experience of hunger may lead to fatigue and the feeling of hunger which impairs
concentration (Dlamini 2012). Dlamini (2012) reported that most students approached the
student funding center with claims of inability to concentrate due to hunger.
In this current study more than 90% of the sample reported the experience of hunger, especially
near exam time. Dlamini (2012) reported that the Student Funding Center of UKZN receives the
highest number of complaints of hunger during exam time as the students‟ monetary allowance
would have been exhausted in the previous month. Previously, the Student Counseling Center
also had the highest numbers of students collecting food parcels during exam time (Dlamini
2012). These physiological effects (fatigue and inability to concentrate) of hunger due to food
insecurity may hinder the progress of students in their studies, especially during exam time.

62
5.7 CONCLUSION
The long term overwhelming trend of hunger and food insecurity seen in both developed and
developing countries seems to be spreading over into university campuses. Ninety-eight per cent
(98%) of this sample had no form of employment; with more than half of the sample receiving
no other form of income either than financial aid. Over a third of the sample was food insecure
and a fifth was severely food insecure. A tenth of the sample often had no food of any kind to
eat in their room, while a fifth sometimes went to bed hungry because of the lack of food. This
is a significant problem as food insecurity is thought to result in a poor health status,
psychological distress, reduced social interaction and an altered ability to learn and concentrate.
The diets of this sample were monotonous and good nutrition knowledge did not seem to
improve food choice. Food insecurity in the student population may not only be a threat because
it may impair academic performance, but because it threatens the health status of students. Food
insecure individuals tend to have higher BMIs, consume diets high in energy and low in
micronutrients. This puts individual at risk of chronic diseases of lifestyle.

63
CHAPTER 6: CONCLUSIONS AND RECOMMENDATIONS
6.1 INTRODUCTION
In this chapter, conclusions and recommendations based on the study methods and results are
discussed. The aim of this study was to investigate the prevalence of food insecurity among the
recipients of financial aid in the student population of UKZN-PMB campus. It also aimed to
establish whether there exists a relationship between food security status and other study
variables such as nutritional status, dietary diversity and nutrition knowledge. In addition, it
aimed to investigate whether there is a relationship between food security status and academic
performance as per the CPI index used by UKZN to track academic performance over time.
6.2 CONCLUSIONS
There was a high prevalence of food insecurity among students on financial aid of the UKZN-
PMB campus. The three most severe conditions of food insecurity (running out of food, going to
bed hungry because there is no food and, going the whole day and night without food) were
experienced by over 15% of the students. On average students reported to not have eaten for up
to a week. However, an increase in monthly income was found to reduce the vulnerability to
food insecurity significantly.
The sample spent most of their monthly budget on food. This is characteristic of a household of
low socio-economic status. This places students at greater risk for becoming food insecure when
price hikes occur in the food industry.
Students mainly relied on friends for assistance with food and money during episodes of severe
food insecurity (transient/acute food insecurity) as they come from families that are not
financially capable of providing them with food or money.
Food insecurity poses a threat to the health status of students as it promotes the consumption of
inexpensive, high energy and low nutrient dense foods. As a result, food insecure individuals
present with higher BMIs which is associated with the development of NCDs of lifestyle that
include diabetes mellitus, hypertension, certain types of cancers and cardiovascular disease.

64
There was a lack of dietary diversity in the diets of this study sample. The three most frequently
consumed foods were found to be starchy foods, fats and oils and tea and coffee. This places this
group at risk of developing micronutrient deficiencies. Students dependent on financial aid are
likely to have insufficient money for a nutritionally adequate diet. Budgeting and making good
food choices, while important, would be insufficient to alleviate food insecurity among student
populations as the insufficiency of funds may supersede these practices. The cost of nutrient
dense food options may be expensive compared to their non-nutrient dense, high energy
counterparts.
It would seem that there is no relationship between nutrition knowledge and food choice. It is
therefore not surprising that although the nutrition knowledge of the study sample was average, it
did not seem to have an impact on the frequency of consumption of healthier food choices such
as fruits, vegetables and legumes.
Food insecurity and hunger impair concentration, a characteristic which is imperative during
exam time. Should this be the case, food insecurity undermines the primary aim of higher
education and government financial assistance namely to improve human capital and
consequently improve the socio-economic status of the poor and disadvantaged.
6.3 RECOMMENDATIONS
The first recommendation would be for a national investigation/review to be conducted on
the amount of financial aid received by underprivileged students. However, an investigation
of this nature will have to be preceded by research with convincing evidence that food
insecurity has a negative impact on academic performance. Therefore, as part of a
comprehensive intervention that seeks to promote academic performance and improved
throughput in students from disadvantaged backgrounds, more research should be conducted
to investigate this relationship on larger sample sizes.
University residences at UKZN are self catering. It is therefore recommended that university
residences provide subsidized meals for students at least twice a day to ensure that students
receive adequate nutrition. The cost of these meals and the necessary staffing could be added
to the residence fees on an annual basis.

65
Food banks should be established at all university campuses. These are non-perishable food
storehouses that could be established at campuses. These banks can be sponsored by
voluntary food contributions from nearby businesses and non-governmental organisations
(NGOs), the community and even students. This venture could be overseen by the student
counselling centre (SCC), which will be responsible for the issuing of food to eligible
students.
Food gardens could be encouraged at university residences. They will serve as a buffer
against severe food insecurity and add diversity to student diets. This venture could be made
possible by a liaison between the Department of Agriculture, SCC and interested NGOs. The
Department of Agriculture could be the main sponsor of seed and maintenance. Students
could also be given the opportunity to work as garden assistants for a small monetary
remuneration. Students who do not have food could visit the SCC (as it was done in the past
at UKZN-PMB campus) where they could be recommended for receiving the produce.
It is recommended that the orientation of first year students should include life skills such as
budgeting and the acquisition of basic nutrition knowledge to facilitate healthier food
purchases.
It is also recommended that all private accommodation used by students is overseen by the
university, to ensure that rent prices are kept reasonable for students. This could allow for
increased amount of income to be used for food.

66
REFERENCES
Adams EJ, Grummer-Strawn L, Chavez G (2003). Food insecurity is associated with increased
risk of obesity in Californian women. Journal of Nutrition 133(4): 1070–1074.
[http://jn.nutrition.org/content/133/4/1070.full.pdf+html] (Accessed 02/03/2012).
Alaino K, Olson CM, Frongillo EA (2001). Food insufficiency and American school-aged
children's cognitive, academic, and psychosocial development. Pediatrics 108(1): 44 -
53. [http://pediatrics.aappublications.org/content/108/1/44.full.pdf+html] (Accessed
10/12/2013).
Ali J, Kapoor S, Moorthy J (2010). Buying behaviour of consumers for food products in an
emerging economy. British Food Journal 112(2): 109-124.
[http://www.emeraldinsight.com/journals.htm?articleid=1838355&show=abstract]
(Accessed 10/12/2013).
Altman M, Hart TGB, Jacobs PT (2009). Household food security status in South Africa.
Agrekon 48(4): 345-361.
[http://www.tandfonline.com/doi/pdf/10.1080/03031853.2009.9523831] (Accessed
02/03/2012).
Ambrosini GL, de Klerk NH, O‟Sullivan TA, Beilin LJ, Oddy WH (2009). The reliability of a
food frequency questionnaire for use among adolescents. European Journal of
Clinical Nutrition 63(10): 1251–1259.
[http://www.nature.com/ejcn/journal/v63/n10/pdf/ejcn200944a.pdf] (Accessed
02/03/2012).
Angeles-Llerenas A, Carbajal-Sanchez N, Allen B, Zamora-Munoz S, Lazcano-Ponce E (2005).
Gender, body mass index and social-demographic variables associated with
knowledge about type 2 diabetes mellitus among 13 293 Mexican students. Acta
Diabetol 42 (1): 36-45. [http://link.springer.com/content/pdf/10.1007%2Fs00592-
005-0172-4] (Accessed 02/03/2012).

67
Ayalew M (1997). What is food security and famine and hunger? Internet Journal of African
Studies 1 (2). [http://ccb.colorado.edu/ijas/ijasno2/ayalew.html] (Accessed
02/03/2012).
Beukes M, Walker S, Esterhuyse K (2009). The role of coping responses in the relationship
between perceived stress and disordered eating in a cross-cultural sample of female
university students. Stress and Health 26 (4): 280–291.
[http://onlinelibrary.wiley.com/doi/10.1002/smi.1296/pdf] (Accessed 03/03/2012).
Beydoun MA, Wang Y (2008). Do nutrition knowledge and beliefs modify the association of
socio-economic factors and diet quality among US adults? Preventative Medicine
46(2): 145-153. [www.sciencedirect.com/science/article/pii/S0091743507002897]
(Accessed 01/04/2015).
Bickel G, Nord M, Price C, Hamilton W, Cook J (2000). Guide to Measuring Household Food
Security Revised 2000. [http://www.fns.usda.gov/fsec/files/fsguide.pdf] (Accessed
02/03/2012).
Brookes RC, Simpson SJ, Raubenheimer D (2010). The price of protein: combining
evolutionary and economic analysis to understand excessive energy consumption.
Obesity Reviews 11(12): 887–894.
[http://onlinelibrary.wiley.com/doi/10.1111/j.1467-789X.2010.00733.x/pdf] (Accessed
02/03/2012).
Brown ZG (2008). Emotional support, chronic disease, diet, food security and the
weight/height status of African-American, White, and Mexican-American
women. [http://gradworks.umi.com/33/35/3335304.html] (Accessed 02/03/2012).
Buscemi J, Beech BM, Relyea G (2011). Predictors of obesity in Latino children: acculturation
as a moderator of the relationship between food insecurity and body mass index
percentile. Journal of Immigrant Minority Health 13(1): 149–154.
[http://www.springerlink.com/content/vt5157v631v03n63/fulltext.pdf] (Accessed
02/03/2012).

68
Cilliers J, Senekal M, Kunneke E (2005). The association between the body mass index of first-
year female university students and their weight-related perceptions and practices,
psychological health, physical activity and other physical health indicators. Public
Health Nutrition 9(2): 234-243.
[http://journals.cambridge.org/download.php?file=%2FPHN%2FPHN9_02%2FS1368
980006000437a.pdf&code=da10c8319d4db205f111c69b82140018] (Accessed
03/03/2012).
Cleland V, Worsley A, Crawford D (2004). What are grade 5 & 6 children buying from school
canteens and what do parents and teachers think about it? Nutrition & Dietetics 6(3):
145-150. [http://www.deakin.edu.au/dro/eserv/DU:30008687/crawford-whatare-
2004.pdf] (Accessed 10/10/12).
Cloete N, Moja T (2005). Transformation tensions in higher education: Equity, efficiency, and
development. Social Research 72(3): 693–722.
[http://web.ebscohost.com/ehost/pdfviewer/pdfviewer?sid=e5cfea97-8668-4012-9f31-
054e6b99e704%40sessionmgr113&vid=2&hid=107] (Accessed 02/03/2012).
Coates J, Swindale A, Bilinsky (2007). HFIAS for measurement of household food access:
Indicator guide (volume3). Washington DC: Food and nutrition technical assistance
project, academy for educational development.
[http://www.fantaproject.org/downloads/pdfs/TN12_HHS.pdf] (Accessed
02/03/2012).
Cogill B (2003). Anthropometric indicators measurement guide. Washington DC: Food and
Nutrition Technical Assistance Project, Academy for Educational Development.
[http://www.pronutrition.org/files/Anthropometric%20measurement%202003.pdf]
(Accessed 04/03/2012).
Cooke L (2007). The importance of exposure for healthy eating in childhood: a review. Journal
of Human Nutrition and Dietetics 20(4): 294–301.
[http://onlinelibrary.wiley.com/doi/10.1111/j.1365-277X.2007.00804.x/pdf]
(Accessed 10/10/11).

69
Department of Agriculture of South Africa (2002). The Integrated Food Security Strategy for
South Africa. Pretoria: Department of Agriculture.
[http://www.nda.agric.za/doaDev/sideMenu/foodSecurity/policies.pdf] (Accessed
03/03/2012).
Department of Higher Education & Training of South Africa (2011). Report on the ministerial
committee for the review of the provision of student housing at South African
universities.
[http://www.dhet.gov.za/LinkClick.aspx?fileticket=NFkBsxqUvYM%3d&tabid=411&
mid=1369] (Accessed 07/03/2012).
Dimkpa U, Oji JO (2010). Relationship of body mass index with haemodynamic variables and
abnormalities in young adults. Journal of Human Hypertension 24 (4): 230-236.
[http://apps.webofknowledge.com/full_record.do?product=WOS&search_mode=Gene
ralSearch&qid=1&SID=U2M3nJoLec82J2OPHiO&page=1&doc=1] (Accessed
07/03/2012).
Dlamini B (2012). Student Services, University of KwaZulu-Natal, Pietermaritzburg
Campus. Personal communication.
Faber M, Wenhold F (2007). Nutrition in contemporary South Africa. Water SA 33(3): 393-
400. [http://www.ajol.info/index.php/wsa/issue/view/6729] (Accessed 15/10/11).
Food and Agriculture Organisation of the United Nations (2009). The State of Food Insecurity
in the World: Economic crises-impacts and lessons learned. Rome: Food and
Agriculture Organisation of the United Nations.
[ftp://ftp.fao.org/docrep/fao/012/i0876e/i0876e00.pdf] (Accessed 02/03/2012).
Food and Agriculture Organization of the United Nations (2006). The state of food insecurity
in the world. Washington DC: Food and Agriculture Organisation of the United
Nations. [ftp://ftp.fao.org/docrep/fao/009/a0750e/a0750e00.pdf] (Accessed
02/03/2012).

70
Frongillo EA, Jyoti DF, Jones SJ (2006). Food stamp program participation is associated with
better academic learning among school children. Journal of Nutrition 136(4): 1077-
1080. [http://nutrition.highwire.org/content/136/4/1077.full.pdf+html] (Accessed
10/12/2013).
Gibson RS (2005). Principles of nutritional assessment, 2nd
ed. New York: Oxford University
Press.
Gooding HC, Walls CE, Richmond TK (2011). Food insecurity and increased BMI in young
adult women. Obesity 21(10): 233-239.
[http://www.nature.com/oby/journal/vaop/ncurrent/full/oby2011233a.html] (Accessed
02/03/2012).
Grimes DA, Schulz KF (2002). Descriptive studies: What they can and cannot do? The Lancet
359(9301): 145-149.
[http://www.sciencedirect.com/science/article/pii/S0140673602073737] (Accessed
10/10/11).
Hoddinott J, Yohannes Y (2002). Dietary diversity as a food security indicator. Washington,
DC: Food Consumption and Nutrition Division discussion paper no. 136.
[http://zunia.org/uploads/media/knowledge/fcndp136[3].pdf ] (Accessed 07/03/2012).
Hughes R, Serebryanikova I, Donaldson K, Leveritt M (2011). Student food insecurity: The
skeleton in the university closet. Nutrition & Dietetics 68(1): 27–32.
[http://onlinelibrary.wiley.com/doi/10.1111/j.1747-0080.2010.01496.x/pdf] (Accessed
07/03/2012).
Human Sciences Research Council (2004). Food security in South Africa: Key policy issues
for the medium term–position paper. Pretoria: Human Sciences Research Council.
[http://www.sarpn.org/documents/d0000685/Food_security_SA_January2004.pdf]
(Accessed 31/03/2013).

71
Innes-Hughes C, Bowers K, King L, Chapman K, Eden B (2010). The what, how, why and
where to of food security in NSW (New South Wales) discussion paper. Sydney:
PANORG, Heart Foundation and Cancer Council NSW.
[http://onlinelibrary.wiley.com/doi/10.1111/j.1747-0080.2010.01496.x/pdf] (Accessed
07/03/2012).
International society for the advancement of Kinanthropometry (2001). International
standards for anthropometric assessment.
[http://www.google.co.za/url?sa=t&rct=j&q=&esrc=s&frm=1&source=web&cd=2&v
ed=0CC4QFjAB&url=http%3A%2F%2Fxa.yimg.com%2Fkq%2Fgroups%2F8363135
5%2F1318405609%2Fname%2F6692536-ISAK-
BOOK.pdf&ei=BfzSUr33JImqhAeyxoDwAw&usg=AFQjCNHWnfgEIkENna7glytqt
suHA6dA8w] (Accessed 09/09/2012).
Jaworowska A, Bazylak G (2009). An outbreak of body weight dissatisfaction associated with
self-perceived BMI and dieting among female pharmacy students. Biomedicine &
Pharmacotherapy 63(9): 679-692.
[http://www.sciencedirect.com/science/article/pii/S0753332208002801#] (Accessed
07/03/2012).
Jyoti DF, Frongillo EA, Jones SJ (2005). Food Insecurity Affects School Children‟s Academic
Performance, Weight Gain, and Social Skills. Journal of Nutrition 135(12): 2831-
2839. [http://jn.nutrition.org/content/135/12/2831.full.pdf+html] (Accessed
10/12/2013).
Kassiers SM (2014). Investigation of the potential of a healthy weight loss intervention to
address the problem of overweight/obesity in Zulu women in South Africa.
Unpublished thesis. Department of Dietetics, University of Cape Town, Cape Town.
Kicklighter JR, Koonce VJ, Rosenbloom CA, Commander NE (2010). College freshmen
perceptions of effective and ineffective aspects of nutrition education. Journal of
American College Health 59(2): 98-104.
[http://www.tandfonline.com/doi/pdf/10.1080/07448481.2010.483709] (Accessed
07/03/2012).

72
Koch J (2011). The food security policy context in South Africa, country study,
International Policy Centre for Inclusive Growth, No.21.
[http:hdl.handle.net/10419/71757] (Accessed 01/04/2015).
Kolodinsky J, Harvey-Berino JR, Berlin L, Johnson RK, Reynolds TW (2007). Knowledge of
current dietary guidelines and food choice by college students: better eaters have
higher knowledge of dietary guidance. Journal of the American Dietetic
Association 107(8): 1409–1413.
[http://www.sciencedirect.com/science/article/pii/S0002822307007444] (Accessed
10/12/2013).
Kruger R, Kruger HS, MacIntyre UE (2005). The determinants of overweight and obesity
among 10- to 15- year-old schoolchildren in the North West Province, South Africa –
the THUSA BANA (Transition and Health during Urbanisation of South Africans;
BANA, children) study. Public Health Nutrition 9(3): 351–358.
[http://journals.cambridge.org/download.php?file=%2FPHN%2FPHN9_03%2FS1368
980006000632a.pdf&code=062bb476b7af9f4574f024857fd4885c] (Accessed
10/10/11).
Labadarios D, Davids YD, Mchiza Z, Weir-Smith G (2009). The assessment of food insecurity
in South Africa. Pretoria: Human Sciences Research Council.
[http://www.npconline.co.za/MediaLib/Downloads/Home/Tabs/Diagnostic/MaterialCo
nditions2/The%20Assessment%20of%20Food%20Insecurity%20in%20South%20Afri
ca.pdf] (Accessed 07/03/2012).
Letseka M, Breier M, Visser M (2010). Poverty, race and student achievement in seven higher
education institutions. In: Letseka M, Cosser M, Breier M & Visser M (eds).
Student Retention and Graduate Destination: Higher Education & Labour
Market Access & Success. Cape Town: Human Sciences Research Council Press.
[http//www.Student_Retention_and_ Graduate_Destination_-_Entire_ebook.pdf]
(Accessed 07/03/2012).

73
Letseka M, Maile S (2008). High university drop-out rates: a threat to South Africa’s
future. Pretoria: Human Sciences Research Council Policy Brief.
[http://www.hsrc.ac.za/Document-2717.phtml] (Accessed 07/03/2012).
MacKeown JM, Pedro TM, Norris SA (2007). Energy, macro- and micronutrient intake among a
true longitudinal group of South African adolescents at two interceptions (2000 and
2003): The Birth-to-Twenty (Bt20) Study. Public Health Nutrition 10(6): 635–643.
[http://www.ncbi.nlm.nih.gov/pmc/articles/PMC2697375/pdf/ukmss-5070.pdf]
(Accessed 24/03/2012).
Malhotra R, Hoyo C, Østbye T, Hughes G, Schwartz D, Tsolekile L, Zulu J, Puoane T (2008).
Determinants of obesity in an urban township of South Africa. South African
Journal of Clinical Nutrition 21(4): 315-320.
[http://www.ajol.info/index.php/sajcn/article/view/34795/38484] (Accessed
07/03/2012).
Meldrum LE, Willows ND (2006). Food Insecurity in university students receiving financial aid.
Canadian Journal of Dietetic Practice and Research 67(1): 43-46.
[https://dcjournal.metapress.com/content/3w2w6hr877055m2p/resource-
secured/?target=fulltext.pdf] (Accessed 07/03/2012).
Moreno LA, Joyanes M, Mesana MI, González-Gross M, Gil GM, Sarría A, Gutierrez A,
Garaulet M, Perez-Prieto R, Bueno M, Marcos A, AVENA Study Group (2003).
Harmonization of anthropometric measurements for a multicenter nutrition survey in
Spanish adolescents. Nutrition 19(6): 481–486.
[http://www.sciencedirect.com/science/article/pii/S0899900703000406] (Accessed
07/03/2012).
Munro N, Quayle M, Simpson H, Barnsley S (2013). Hunger for knowledge: Food insecurity
among students at the University of KwaZulu-Natal. Perspectives in Education
31(4): 168-179.

74
Newton J, Turale S (2000). Student poverty at the University of Ballarat. Australian Journal
of Social Issues 35(3): 251-256. [http://en.scientificcommons.org/55799847]
(Accessed 07/03/2012).
Norvilitis JM, Merwin MM, Osberg TM, Roehling PV, Young P, Kamas MM (2006).
Personality factors, money attitudes, financial knowledge, and credit-card debt in
college students. Journal of Applied Social Psychology 36(6): 1395–1413.
[http://onlinelibrary.wiley.com/doi/10.1111/j.0021-9029.2006.00065.x/pdf] (Accessed
07/03/2012).
Ntuti Z (2005). An investigation of sociodemographics, nutrition knowledge and dietary
intakes of Black students attending the Steve Biko Campus of Durban Institute of
Technology. Unpublished thesis. Department of food and nutrition, Durban Institute
of Technology, Durban.
[http://ir.dut.ac.za/bitstream/handle/10321/97/Ntuli_2005.pdf?sequence=4] (Accessed
07/03/2012).
Oldewage-Theron WH, Egal AA (2010). Nutrition knowledge and nutritional status of primary
school children in QwaQwa. South African Journal of Clinical Nutrition 23(3):
149-154. [http://www.ajol.info/index.php/sajcn/article/viewFile/59892/48166]
(Accessed 10/10/11).
Park MS, Kim SA (2005). Effect of nutrition education on improving diet behaviour of
university students. Korean Journal of Community Nutrition 10(2): 189-195.
[http://www.koreamed.org/SearchBasic.php?RID=0106KJCN/2005.10.2.189&DT=1]
(Accessed 07/03/2012).
Petersen I, Louw J, Dumont K (2009). Adjustment to university and academic performance
among disadvantaged students in South Africa. Educational Psychology 29 (1): 99-
115. [http://www.tandfonline.com/doi/pdf/10.1080/01443410802521066] (Accessed
07/03/2012).

75
Puoane T, Steyn K, Bradshaw D, Laubscher R, Fourie J, Lambert V, Nbananga N (2002).
Obesity in South Africa: The South African Demographic and Health Survey.
Obesity Research 10 (10): 1038–1048.
[http://onlinelibrary.wiley.com/doi/10.1038/oby.2002.141/pdf] (Accessed
03/03/2012).
Reddy SP, Resnicow K, James S, Kambaran N, Omardien R, Mbewu AD (2008). Underweight,
overweight and obesity among South African adolescents: results of the 2002 National
Youth Risk Behaviour Survey. Public Health Nutrition 12(2): 203–207.
[http://journals.cambridge.org/download.php?file=%2FPHN%2FPHN12_02%2FS136
8980008002656a.pdf&code=4b291c88b19c6d04ad870197ef071dd8] (Accessed
03/03/2012).
Riely F, Mock N, Cogill B, Bailey L, Kenefick E (1999). Food Security Indicators and
Framework for Use in the Monitoring and Evaluation of Food Aid Programs.
Washington D.C.: Food and Technical Assistance, USAID.
[http://www.fantaproject.org/downloads/pdfs/fsindctr.PDF] (Accessed 03/03/2012).
Robert JA , Jones E (2001). Money attitudes, credit card use, and compulsive buying among
American college students. Journal of Consumer Affairs 35(2): 213-240.
[http://onlinelibrary.wiley.com/doi/10.1111/j.1745-6606.2001.tb00111.x/pdf]
(Accessed 07/03/2012).
Rose D, Charlton KE (2001). Prevalence of household food poverty in South Africa: results
from a large, nationally representative survey. Public Health Nutrition 5(3): 383-
389.
[http://journals.cambridge.org/download.php?file=%2FPHN%2FPHN5_03%2FS1368
98000200054Xa.pdf&code=79186423ba72d22f5367dab8427fc72d] (Accessed
07/03/2012).
Sakamaki R, Toyama K, Amamoto R, Liu C, Shinfuku N (2005). Nutritional knowledge, food
habits and health attitude of Chinese university students - a cross sectional study.
Nutrition Journal 4(4): 1-5. [http://www.biomedcentral.com/content/pdf/1475-2891-
4-4.pdf] (Accessed 29/02/2012).

76
Senekal M, Steyn NP, Nel JH (2003). Factors associated with overweight/obesity in
economically active South African populations. Ethnicity & Disease 13(1): 109–116.
[http://www.ishib.org/journal/ethn-13-01-109.pdf] (Accessed 03/03/2012).
Smith CS, Essop MF (2009). Gender differences in metabolic risk factor prevalence in a South
African student population. Cardiovascular Journal of Africa 20(3): 178-182.
[https://ir1.sun.ac.za/handle/10019.1/19374] (Accessed 29/02/2012).
So WY , Swearingin B, Dail TK, Melton D (2012). Body fat measurement in African-American
students at a historically black college and university and its correlation with
estimations based on body mass index, waist circumference, and bioelectrical
impedance analysis, compared to air displacement plethysmography. HealthMed
6(4): 1092-1096. [http://www.scopus.com/record/display.url?origin=citedby&eid=2-
s2.0-84861406686&noHighlight=false&sort=plf-
f&src=s&nlo=&nlr=&nls=&imp=t&sid=MeNQbWZ_7vQREhu0Qo36wSh%3a140&s
ot=br&sdt=cl&cluster=scoauthid%2c%228055490800%22%2ct&sl=56&s=SOURCE-
ID%2821754%29+AND+PUBYEAR+IS+2000+AND+NOT+DOCTYPE%28ip%29
&relpos=0] (Accessed 29/02/2012).
Steyn NP, Ochse R (2013). “Enjoy a variety of foods”: as a food-based dietary guideline for
South Africa. South African Journal of Clinical Nutrition 26(3): S13-S17.
[http://www.afrihealth.co.za/nutrition/foodbassep2.pdf] (Accessed 07/03/2012).
Steyn NP, Senekal M, Brits S, Nel J (2000). Urban and rural differences in dietary intake,
weight status and nutrition knowledge of black female students. Asia Pacific Journal
of Clinical Nutrition 9(1): 53-59.
[http://apjcn.nhri.org.tw/server/APJCN/Volume9/vol9.1/steyn3.pdf] (Accessed
29/02/2012).
Taki Y, Hashizume H, Sassa Y, Takeuchi H, Asano M, Asano K, Kotozaki Y, Nouchi R, Wu K,
Fukuda H, Kawashima R (2011). Correlation among body height, intelligence, and
brain grey matter volume in healthy children. NeuroImage 59(2): 1023-1027.
[http://www.ncbi.nlm.nih.gov/pubmed/21930215] (Accessed 12/10/11).

77
Temple NJ, Steyn NP, Myburgh NG, Nel JH (2006). Food items consumed by the students
attending schools in different socioeconomic areas in Cape Town, South Africa.
Nutrition 22(3): 252-258.
[http://www.sciencedirect.com/science/article/pii/S0899900705002959] (Accessed
29/02/2012).
Terry T, Huang K, Harris KJ, Lee R, Nazir N, Born W, Kaur H (2003). Assessing overweight,
obesity, diet, and physical activity in college students. Journal of American College
Health 52(2): 83-86.
[http://www.tandfonline.com/doi/pdf/10.1080/07448480309595728] (Accessed
29/02/2012).
University of KwaZulu-Natal (2012). Selection criteria policy 2012. Pietermaritzburg:
University of KwaZulu-Natal.
University of KwaZulu-Natal Student Funding Centre (2012). Combined performance index.
Pietermaritzburg: University of KwaZulu-Natal.
Van der Berg (2008). Poverty and education: Education policy series 10. Paris: The
International Institute for Educational Planning.
[http://www.iiep.unesco.org/fileadmin/user_upload/Info_Services_Publications/pdf/20
09/EdPol10.pdf] (Accessed 31/03/2013).
Venter FC, Walsh CM, Slabber M, Bester CJ (2009). Body size perception of African women
(25-44 years) in Mangaung. Journal of Family Ecology and Consumer Sciences 37
(1): 12-23. [http://www.ajol.info/index.php/jfecs/article/view/48942/35290]
(Accessed 28/02/2012).
Vorster HH (2013). Food-based dietary guidelines for South Africa. South African Journal of
Clinical Nutrition 26(3): S5 – S119.
[http://www.sajcn.co.za/index.php/SAJCN/article/view/740/1105] (Accessed
03/03/2014).

78
Vozoris NT, Tarasuk VS (2003). Household food insufficiency is associated with poorer health.
Journal of Nutrition 133(1): 120–126.
[http://jn.nutrition.org/content/133/1/120.full.pdf+html] (Accessed 29/02/2012).
Weigley ES, Mueller DH, Robinson CH (1997). Robinson’s Basic Nutrition And Diet
Therapy, 8th
ed. New Jersey: Merrill.
Wilde PE, Peterman JN (2006). Individual weight change is associated with household food
security status. Journal of Nutrition 136(5): 1395–1400.
[http://jn.nutrition.org/content/136/5/1395.full.pdf+html] (Accessed 29/02/2012).
Woolard I, Leibbrandt M (1999). Measuring poverty in South Africa. DPRU working paper no
99/33.
[http://dspace.africaportal.org/jspui/bitstream/123456789/7440/1/Measuring%20Pover
ty%20in%20South%20Africa.pdf] (Accessed 01/04/2015).
World Health Organisation (WHO) (2000). Obesity: Preventing and managing the global
epidemic: Report on a WHO consultation - Technical report Series No.894.
Geneva: World Health Organization.
[http://whqlibdoc.who.int/trs/WHO_TRS_894_(part1).pdf] (Accessed 29/02/2012).
World Health Organisation (WHO) (2012). Trade, foreign policy, diplomacy and health:
Food security. [http://www.who.int/trade/glossary/story028/en/] (Accessed
29/02/2012).
World Health Organisation(WHO) (2004). BMI classification.
[http://apps.who.int/bmi/index.jsp?introPage=intro_3.html] (Accessed 03/03/2012).

79
APPENDIX A: QUESTIONNAIRE COMPLETED BY ALL PARTICIPANTS
Questionnaires to be completed for investigation of food security status and related factors
of students on financial aid at the University of KwaZulu-Natal, Pietermaritzburg Campus
Participant code: ____________________
Dear participant
Kindly complete the following questionnaire as honestly as possible. There are no right or wrong
answers. Please note that the results of this research project will not be, in any way, linked or
traced back to you in person.
For field worker use:
WEIGHT HEIGHT Calculated BMI
1. 1.
2. 2.
3. 3.
Mean: Mean:

80
Make a cross (x) in the appropriate box
1. Age (in years)
2. Gender
3. Race
4. Where do you live?
Home Residence
(University)
Off-campus i.e. private
accommodation Other (please specify)
5. If you stay in a UKZN residence, would you prefer it if prepared meals were provided by the residence i.e.
catering company?
6. Under which College are you currently studying?
7. What academic year are you in?
8. a. Are you currently employed?
b. If yes, please indicate where you are employed __________________________
and position held __________________________
9. How much money do you spend on food per month? R ________________
10. a. Do you receive an allowance in addition to financial aid?
b. If yes, please specify. I receive R _____________________ per month
11. Where do you purchase your food? (Please choose one)
17-21 22-26 27-31 32-36 >37
Male Female
Black White Coloured Indian Other (please specify)
Yes No
Humanities Agriculture, Engineering and Science Law and Management Studies
2nd 3rd 4th Over 4th
Yes No
Yes No
Supermarket (e.g. Checkers) Vendors Cafeterias Tuck shops Other (please specify)

81
12. On what do you spend most of your money per month? (Please choose one)
a. Food b. Social
events
c. Clothes d. Toiletries e. Varsity extras (e.g.
printing credits)
f. Travelling
costs
g. Other (please
specify)
13. a. Do you use transport to and from the Campus?
b. If you answered yes to the previous question, how much money do you spend on transport/month?
R ________________
14. Have you ever used Student Counselling Centre to obtain food?
15. Have you ever struggled to concentrate in class due to hunger?
16. When have you been most hungry?
Beginning of semester End of semester (close to/ during exam time) Other (specify)
17. What is the longest time you‟ve gone without food? (excluding for religious reasons) _________________
18. How do you cope when you do not have food? Please explain
______________________________________________________________________________________
______________________________________________________________________________________
______________________________________________________________________________________
______________________________________________________________________________________
______________________________________________________________________________________
______________________________________________________________________________________
______________________________________________________________________________________
______________________________________________________________________________________
______________________________________________________________________________________
______________________________________________________________________________________
______________________________________________________________________________________
______________________________________________________________________________________
______________________________________________________________________________________
______________________________________________________________________________________
______________________________________________________________________________________
______________________________________________________________________________________
______________________________________________________________________________________
________________________________
Yes No
Yes No
Yes No

82
B. Food Frequency Questionnaire
How often do you eat the following food? (Put an “X” in the block)
Food More than once/day
Once /day 2-3 times/week
Seldom Never
Milk (fresh milk, maas, yogurt, cheese, powder milk e.g. Nespray, Klim)
Other dairy products (e.g. cheese, yoghurt, ice-cream)
Breakfast cereals/porridge
Bread, rice, pasta, mealie rice, samp, phutu, pap, jeqe (steamed bread), potatoes
Legumes( dried beans, peas, baked beans, lentils, soya mince)
Meat, fish, poultry
Processed meats (e.g. ham, polony) & organ meats
Eggs
Peanut butter, nuts
Vegetables
Fruit
Fats (e.g. sunflower/cooking oil, margarine, mayonnaise)
Sweets (e.g. cakes, doughnuts, candy, chocolate, biscuits)
Salty snacks (e.g. potato chips, corn chips, pretzels)
Fizzy drinks & cool drinks
Alcohol (e.g. beer, wine)
Coffee & tea
Fast foods (e.g. pizza, pies, sausage rolls, samosas, KFC, Nandos, Chicken Licken)

83
C. Individual Food Insecurity Access Scale
Please make a “X” in the box.
Question No Rarely Sometimes Often
1. In the past month, did you worry that you would not have enough food?
2. In the past month, were you not able to eat the kinds of foods you preferred because of lack of resources?
3. In the past month, did you have to eat a limited variety of foods due to lack of resources?
4. In the past month, did you have to eat some foods that you really did not want to eat because of lack of resources to obtain other types of food?
5. In the past month, did you have to eat a smaller meal than you felt you needed because there was not enough food?
6. In the past month, did you have to eat fewer meals in a day because there was not enough food?
7. In the past month, was there ever no food to eat of any kind in your room because of lack resources to get food?
8. In the past month, did you go to sleep at night hungry because there was not enough food?
9. In the past month, did you go a whole day and night without eating anything because there was not enough food?
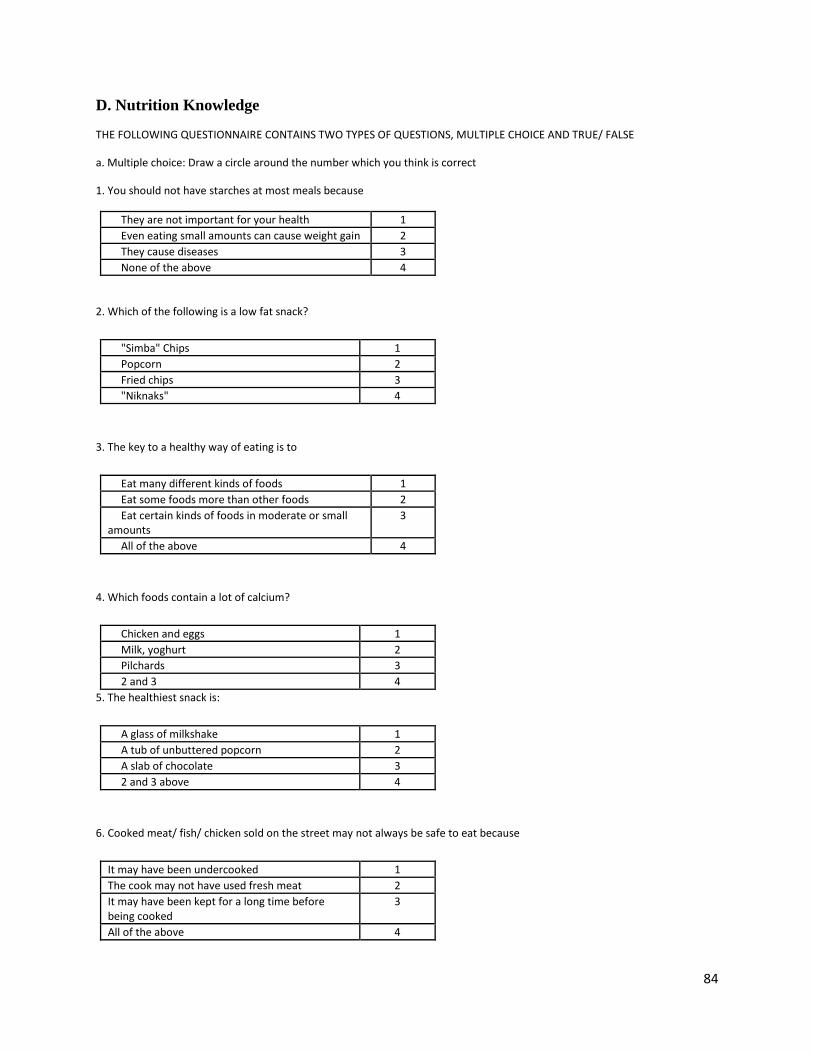
84
D. Nutrition Knowledge
THE FOLLOWING QUESTIONNAIRE CONTAINS TWO TYPES OF QUESTIONS, MULTIPLE CHOICE AND TRUE/ FALSE
a. Multiple choice: Draw a circle around the number which you think is correct
1. You should not have starches at most meals because
They are not important for your health 1
Even eating small amounts can cause weight gain 2
They cause diseases 3
None of the above 4
2. Which of the following is a low fat snack?
"Simba" Chips 1
Popcorn 2
Fried chips 3
"Niknaks" 4
3. The key to a healthy way of eating is to
Eat many different kinds of foods 1
Eat some foods more than other foods 2
Eat certain kinds of foods in moderate or small amounts
3
All of the above 4
4. Which foods contain a lot of calcium?
Chicken and eggs 1
Milk, yoghurt 2
Pilchards 3
2 and 3 4
5. The healthiest snack is:
A glass of milkshake 1
A tub of unbuttered popcorn 2
A slab of chocolate 3
2 and 3 above 4
6. Cooked meat/ fish/ chicken sold on the street may not always be safe to eat because
It may have been undercooked 1
The cook may not have used fresh meat 2
It may have been kept for a long time before being cooked
3
All of the above 4

85
7. How many fruits and vegetables should be eaten?
1 fruit and vegetable a day 1
3-4 fruits and vegetables a day 2
5 or more fruits and vegetables everyday 3
There is no need to eat fruits and vegetables daily 4
8. How much milk or maas should you have a day?
None 1
Half a cup 2
One cup 3
Two cups 4
9. A well- balanced diet
Consists mostly of meat, with smaller amounts of 1 starch, fruits, vegetables, and dairy products
Consists mostly of vegetables, and smaller 2 amounts of meat and dairy products
Consists mostly of starches, vegetables and fruits, 3 with smaller amounts of meat and dairy products
None of the above 4
10. Which one of the following groups of nutrients are found in large amounts in fruits and vegetables?
Fibre, Vitamin A 1
Starches, fat, Vitamin D 2
Fats, Iron, Calcium 3
None of the above 4
11. What is a portion of cooked vegetables?
I Tablespoon 1
Half a cup 2
I Cup 3
2 Cups 4
12. From which group of foods should you eat the most every day?
Bread, samp, rice, porridge 1
Apples, bananas, spinach, carrots 2
Milk, yogurt, cheese 3
Chicken, fish, beans, eggs 4

86
13. Which of the following choice of foods prevent certain diseases?
Fish, Chicken without skin, and lean meat 1
Beef sausage, bacon, and lean mince 2
Fried fish, fried chicken, and regular mince 3
All of the above 4
14. Which of the following breakfast menus contain little fat?
Whole-wheat toast with thinly spread margarine
1
Weet-Bix with 2% fat milk 2
Bacon and egg 3
1 and 2 4
15. To make sure that you stay healthy you should eat
Lean meat, fruits and vegetables, low fat dairy
products, and breads and cereals
1
Fruit and vegetables only 2
Bread, cereals, fruit and vegetables only 3
Low fat dairy products and lean meat only 4
16. Which of the following foods are the lowest in fat?
Corn flakes and full cream milk 1
Grilled lean steak and boiled carrots 2
Pizza and milkshake 3
Fried lamb chops and creamed spinach 4
17. Which group of foods has the most Vitamin A?
Oats, whole wheat bread, rice 1
Carrots, spinach, sweet potatoes 2
Pies, cakes, pudding 3
None of the above 4
18. The reason why beans, peas and lentils are good for you is that
They contain only small amounts of fat 1
They contain a lot of fibre 2
They can protect you from some diseases 3
All of the above 4

87
b. Choose whether the following statement is true or false.
STATEMENT TRUE FALSE
19 Sugar contains a lot of vitamins and minerals
20 Eating a lot of different kinds of foods is healthier than eating only a few kind foods
21 You can drink as much wine, beer, ciders as you want provided you have eaten first
22 Your body only needs a little bit of salt to be healthy
23 Soya mince is as healthy as meat
24 Dry beans, peas, lentils are a healthy choice to eat in place of meat
25 You should eat a lot of sugar to have enough energy
26 You should add extra salt to your cooked food before you even eat it
27 Drinking a lot wine, beer, cider can cause weight gain
28 Sugar and foods that contain sugar should be eaten in small amounts
29 You can eat as much meat as u want everyday
30 Dry beans, peas, and lentils should be eaten often
31 To protect yourself from disease you should avoid eating many different kinds of foods
32 It is healthy to snack on foods that contain a lot of sugar
THE END
THANK YOU FOR YOUR PARTICIPATION

88
APPENDIX B: CONSENT FORM COMPLETED BY ALL PARTICIPANTS
Consent to participate in a research study
Title of research project:
Food security status and related factors of students on financial aid at the University of KwaZulu- Natal,
Pietermaritzburg Campus.
Principal investigator:
Nophiwe Job
Discipline of Dietetics and Human Nutrition
School of Agricultural, Earth and Environmental Sciences
University of KwaZulu-Natal
Pietermaritzburg
Contact details:
Phone: 033 260 6063 (during working hours)
Email: [email protected]
You are hereby invited to participate in the above study conducted by Job NA (207526109) from the Department of
Dietetics and Human Nutrition. This study aims to investigate the food security status and related factors of
recipients of the NSFAS (financial aid).
Why have you been invited to participate?
As you are a recipient of financial aid your input is appreciated in determining whether financial aid meets the
requirements of students at UKZN.
What procedures will be involved in this research?
Your weight and height, while wearing light indoor clothing, will be measured.
You will be required to complete a four part questionnaire that is estimated to take up no more than 15
minutes of your time.
There are a few things we would like you to know:
This project was approved by the relevant ethics committee at UKZN to assure that the research is
acceptable (relevant reference will be quoted once ethics approval is obtained).
Your opinion will be treated as private and confidential as the researcher will identify you with a code
number only.
Your participation is voluntary.
The results of this study could be published for scientific purposes but will not reveal your name or include
any identifiable reference to you.
If you have any questions or concerns regarding the research, please feel free to contact Prof F. Veldman on 033
2605597 or Suna Kassier on 033 2605431.
Declaration by participant
By signing below I (full name) __________________________________________ agree to take part in this study.
I understand that I can withdraw from the study at any time without any negative consequences.
I declare that I have read this information and consent form. I have had a chance to ask questions and all my
questions have been adequately answered. I understand that participation in this study is voluntary and I have not
been pressurised to take part.
________________________ ________________________ ________________________
Signature of participant Signature of witness Date

89
APPENDIX C: FOOD-BASED DIETARY GUIDELINES
FOOD-BASED DIETARY GUIDELINES FOR SOUTH AFRICA 2013
1. Enjoy a variety of foods
2. Be active
3. Make starchy foods part of most meals
4. Eat dry beans, split peas, lentils and soya regularly
5. Eat plenty of vegetables and fruit every day
6. Have milk, maas or yoghurt every day
7. Fish, chicken, lean meat and eggs can be eaten daily
8. Drink lots of clean, safe water
9. Use fats sparingly: choose vegetable oils rather than hard fats
10. Use foods and drinks containing sugar sparingly, and not between meals
11. Use salt and foods high in salt sparingly
12. If you drink alcohol, drink sensibly

90
APPENDIX D: LETTER OF ETHICAL APPROVAL FROM THE HUMANITIES AND
SOCIAL SCIENCES ETHICS COMMITTEE, UNIVERSITY OF KWAZULU-NATAL

91
APPENDIX E: HOUSEHOLD FOOD INSECURITY ACCESS SCALE FOR
MEASUREMENT OF FOOD ACCESS: INDICATOR GUIDE

92

93

94

95

96

97

98

99

100

101

102

103

104

105

106

107

108

109

110

111

112

113

114

115

116

117

118

119

120

121

122

123

124

125

126