food trees project: background and general introduction · food trees project: background and...
TRANSCRIPT

Food Trees Project: Background and general introduction
Food trees for diversified diets, improved nutrition, and better livelihoods for smallholders in East Africa: Kenya and Uganda
Stepha McMullin, Project Leader19th July 2017
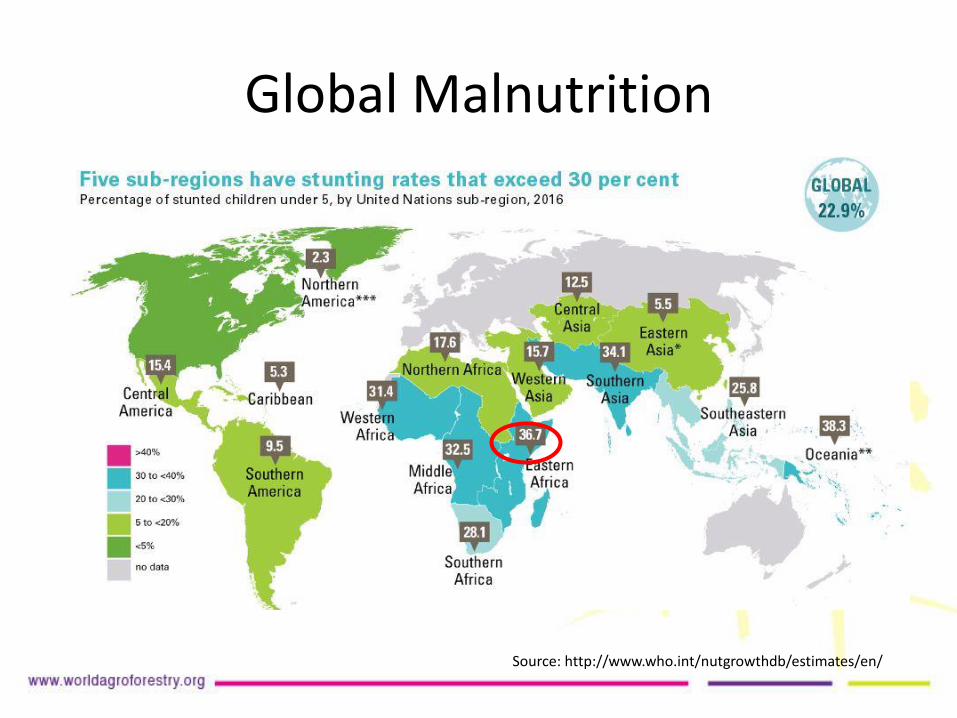
Global Malnutrition
Source: http://www.who.int/nutgrowthdb/estimates/en/

Fruit consumption gaps
Fruit consumption, grams per person per day
Source: Ruel, M. T., N. Minot, and L. Smith. 2005. Patterns and determinants of fruit and vegetable consumption in sub-Saharan Africa.

Consumption of fruits and vegetables
Past and projected fruit and vegetable consumption globally 2000 – 2030
0 50 100 150 200 250 300 350
Latin Amer. + the Caribbean
Sub-Saharan Africa
South Asia
East Asia + Pacific
Eastern Europe + Central Asia
Middle East + North Africa
United States
World
Kg fruit and vegetables/person per year
20002000-2030 change
Figure 1, Modified from Msangi and Rosegrant 2011. Feeding the Future’s Changing Diets; Ruel et al. 2005. Patterns of fruit & vegetable consumption in SSA. Figure 2, Ruel et al. 2005. Patterns of fruit & vegetable consumption in SSA
WHO-
recommended
146 kg
Kenya: 114 kg (78%)

Fruit and vegetable consumption in Kenya
Country level data available for Kenya (1997)Source: Collated from Ruel, M.T, Minot,N and L.Smith. Patterns and determinants of fruit and vegetable consumption in sub-SaharanAfrica. Background paper for the Joint FAO/WHO Workshop on Fruit and Vegetables for Health, 1-3 September 2004, Kobe Japan.
Source: ICRAF Fruiting Africa Data, Western Kenya, 2014

Production Dietary Gaps
Food production trends in sub Saharan Africa 2003/2009
Source: Herforth 2010

Fruit Tree Portfolios: year-round fruit harvest for food and dietary gaps
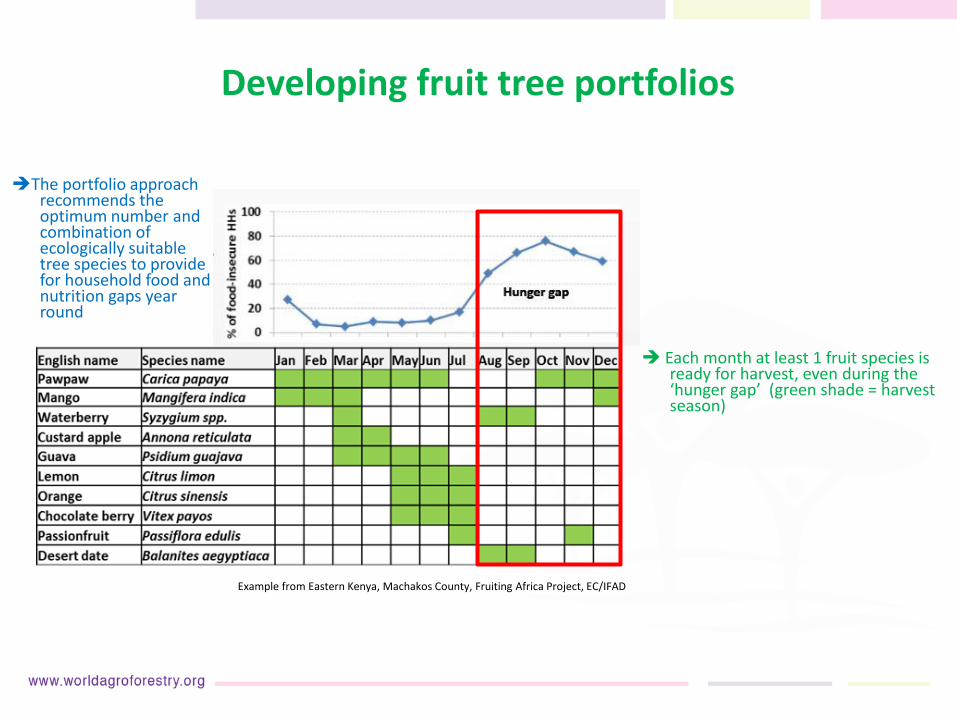
Developing fruit tree portfolios
The portfolio approach recommends the optimum number and combination of ecologically suitable tree species to provide for household food and nutrition gaps year round
Each month at least 1 fruit species is ready for harvest, even during the ‘hunger gap’ (green shade = harvest season)
Example from Eastern Kenya, Machakos County, Fruiting Africa Project, EC/IFAD

Hunger gap
Vitamin contents: +++ very high; ++ high; + good; (+) intermediate
(Pro)vitamin A and C supply possible year-round if the 10 species are grown on farm
2 IFT available during the food insecure months
The portfolio can be developed to include suitable and complementary vegetables, as well as annual and staple crops to provide for a ‘whole diet’ approach
Supply of nutrients year-round, access to food & nutrition during hunger gap (direct & indirect), income from surplus fruits

English names Scientific Names Jan Feb Mar Apr May Jun Jul Aug Sep Oct Nov Dec
Maize** Zea mays
Potatoes** Solanum tuberosum
Yams Dioscorea alata
Millet Pennisetum glaucum
Cassava Manihot esculeta
Beans** Phaseolus vulgaris
Runner beans Phaseolus coccineus
Dolichos Lablab purpureus
Groundnuts Arachis hypogaea
Peas Pisum sativum
Malabar gourd Cucurbita ficifolia
Cowpeas leaves Vigna unguiculata
Black night shade Solanum nigrum
Pumpkin leaves Cucurbita maxima
Stinging nettle Urtica mqassaica
Cat thorn Scutia myrtina
Bush plum** Carissa spinarum
Bananas** Musa x paradisiaca
Avocado** Persea americana
Mangoes** Mangifera indica
Oranges** Citrus sinensis
Guava** Psidium guajava
Mulberry Morus alba
Pawpaw Carica papaya
Magic gwarra Euclea divinorum
Annona Annona reticulata
Grewia Grewia similis
Wild berry Rhus natalensis/vulgaris
Fruit tree and crop portfolio for Rumuruti, Laikipia County
Notes: Portfolios based on 4 FDGs and HH surveys on 150 farms, 83% of HHs had experienced food scarcity in the last 12 months, **most consumed crops/vegetables & fruits according to FDGs
Food Insecure Months Baseline DataFood Insecure Months FDGsHarvest Periods
Months of food insecurity (‘hunger gap’) identified, January + February
An agroforestry
approach: the
portfolio recommends
a combination of
ecologically suitable
tree species and crops
to provide for HH food
and nutrition gaps
year round
(+) is Low; + is Moderate; ++ is High; and +++ is Very HighNutrient content data not available
Specific food and nutrient gaps identified (food consumption data) - low fruit consumption, low Vit A rich fruits consumed, low diversity of fruit consumed
Protein
(g/100g)
Carbo.
(g/100g)
Vit. A
(ug/100g)
Folic acid
(ug/100g)
Vit. C
(mg/100g)
Iron
(mg/100g)
Zinc
(mg/100g)
+++ +++ ++ + +++ +++
+ ++ (+) ++ + ++
+ ++ + + + + +
+++ +++ +++ +++ +++
(+) +++ (+) + ++ (+) ++
+++ +++ +++ (+) +++ +++
+ (+) ++ + + ++ +
+++ +++ +++ +++ +++
+++ ++ +++ +++ +++
++ + +++ ++ ++ + ++
++ (+) ++ +++ ++ ++ ++
++ (+) ++ ++ +
++ (+) +++ ++ + ++ +
++ (+) +++ (+) ++ ++
(+) + + +++ ++
(+) ++ + + + (+) +
+ (+) + ++ + + ++
(+) ++ +++ ++ ++ (+) (+)
(+) + ++ + +++ (+) (+)
++ + ++ ++ +++ (+) +
+ + (+) (+) ++ ++ +
(+) + +++ ++ +++ (+) (+)
+ ++ + + +

Fruit trees already on farms, in production but there are gaps
Frequency Mean abundance
English name Species name Origin (plots with spp.) on farms with spp. Recommendation
Tickberry Lantana camara
Pawpaw Carica papaya Exotic 65% 16 (commercial) increase frequency
Mango Mangifera indica Exotic 92% 29 (commercial) check varietiesBanana Musa x paradisiaca
Loquat Eriobotrya japonica Exotic 10% 4 promote
Mulberry Morus alba Exotic 24% 2 promote
Tamarind Tamarindus indica
Waterberry Syzygium spp. Exot/indig. 23% 1.5 promote
Custard apple Annona reticulata Exotic 13% 2 promote
Guava Psidium guajava Exotic 31% 4 promote
Pomegranate Punica granatum
White sapote Casimiroa edulis Exotic 19% 1.5 promote
Wild medlar Vangueria madagascariensis
Lemon Citrus limon Exotic 50% 5 (commercial) increase frequency
Orange Citrus sinensis Exotic 39% 11 (commercial) increase frequency
Chocolate berry Vitex payos Indig. 6% 6 promote
Avocado Persea americana
Passionfruit Passiflora edulis Exotic 14% 5 promote
Jacket plum Pappea capensis
Desert date Balanites aegyptiaca Indig. 18% 11 increase frequency
Bush plum Carissa edulis
Some species are not yet frequent or abundant on farms
Need to promote cultivation of certain species, particularly the indigenous spp.
Some species dominant on farms, potential for varietal diversity (nutrient content, harvest/maturation)
Machakos County, Data from Fruiting Africa Project, EC/IFAD, for Machakos County, Lower Eastern Kenya

Innovation Hubs for distribution of quality tree planting material, demonstration plots and farmer training on agroforestry and tree management
Communication tools with integrated agriculture and nutrition information for dissemination to farmers, extension agents and interested partners
An agroforestry approach: fruit tree and crop portfolios, year-round harvest for food and nutrition gaps

Community Agroforestry Innovation Hubs
Group nurseries in Machakos County, Eastern Kenya. Pictures: S.McMullin

e.g Nutrition-sensitive value chain: Fruits
Input ProductionPostharvest
/StorageProcessing
/ExportRetail/ Market
Varieties with
highest
nutrient
content, e.g.
vitamin A
Early and late
maturing
varieties to
extend the
harvest period
Portfolios of
diverse fruit
spp. year-
round fruit
production
Picking fruits
at the right
ripening
stage with
the highest
nutrient
content
Cold storage
to maintain
nutrients
Reduce
waste + loss
Improved
processing
techniques
to maintain
the nutrient
content
Better
packaging to
support
nutrient
retention
Product Dev.
Enhanced
marketing
pathways to
get the
product to
consumers in
short time to
retain nutrients
Awareness
creation
among
consumers
Consumer
Access
Domestic & Int
Optimal soil
fertility to
produce
nutrient-rich
fruits
Tree mgt &
cropping
systems
Kehlenbeck et al. 2012

The Right Trees for the Right Place
A. Trees for Products
B. Trees for Servicesfruit firewood medicine income Sawn wood fodder
Soil fertility Carbon erosion watershed shade biodiversity
C. Trees for right place… Simple as ABC !?

vegetationmap4africa http://www.vegetationmap4africa.org/Vegetation_map.html
New version with web-based, Google Earth and mobile maps

Thank you