food varietal differentiation using accurate-mass q · pdf fileapproaches to food varietal...
TRANSCRIPT
Approaches to Food Varietal DifferentiationUsing Accurate-Mass Q-TOF LC/MS withMolecular Feature Extraction, DatabaseMining, and Principal Component Analysis
Authors
Alyson E. Mitchell, Jihyun Lee,
Department of Food Science and
Technology, University of
California, Davis
One Shields Avenue
Davis, CA 95616
Jerry Zweigenbaum
Agilent Technologies, Inc.
2850 Centerville Road
Wilmington, DE 19808
Application Note
Food
Abstract
Onions are a major source of quercetin, an important dietary flavonoid. Using
Agilent MassHunter PCDL Manager Software, publicly available literature, and
online databases such as Phenol-Explorer and ChemSpider, an exact-mass
onion-specific flavonoid database was created. The Agilent MassHunter Qualitative
Analysis Software was used to search Q-TOF LC/MS data of extracts of seven vari-
eties of onions for matches with the flavonoid database. Nineteen flavonoids were
tentatively identified. Based on the flavonoids tentatively identified, a principal com-
ponent analysis (PCA) of the onion varieties for varietal and color difference was
performed using Agilent Mass Profiler Professional Software. The PCA showed sep-
aration in varietal and color. For comparison, a PCA of unknown compounds deter-
mined by molecular-feature extraction of possible compounds, filtered on unique-
ness in the onion varieties, was performed. Though this PCA produced similar
results, the top 10 tentatively identified nonanthocyanidin flavonoids were more
strongly associated with color and variety.
2
Introduction
A complementary report of this study of Accurate Mass Q-TOFLC/MS approaches to onion varietal differentiation is published in Physical Methods in Food Analysis, ACSSymposium Series [1].
Fruits and vegetables are the primary dietary source of vita-mins, minerals, fiber, and a wide array of nonessential nutri-ent phytochemicals such as polyphenolic antioxidants,flavonoids, carotenoids, alkaloids, and glucosinolates. Manyof these compounds exhibit potent biological activity. Therange of bioactive phytochemicals expressed are species andcultivar dependent. Bioactive phytochemicals have a widerange of chemical structures. Flavonoids, the most abundantsubclass of plant-derived polyphenolic bioactive compounds,can undergo many chemical modifications including acylation,malonylation, sulfation, methylation, and glycosylation. Theirglycoside forms can be mono-, di-, and tri-saccharide substi-tuted. The health benefits associated with the consumption offruits and vegetables are largely thought to be due to the synergistic activities of these bioactive phytochemicals.
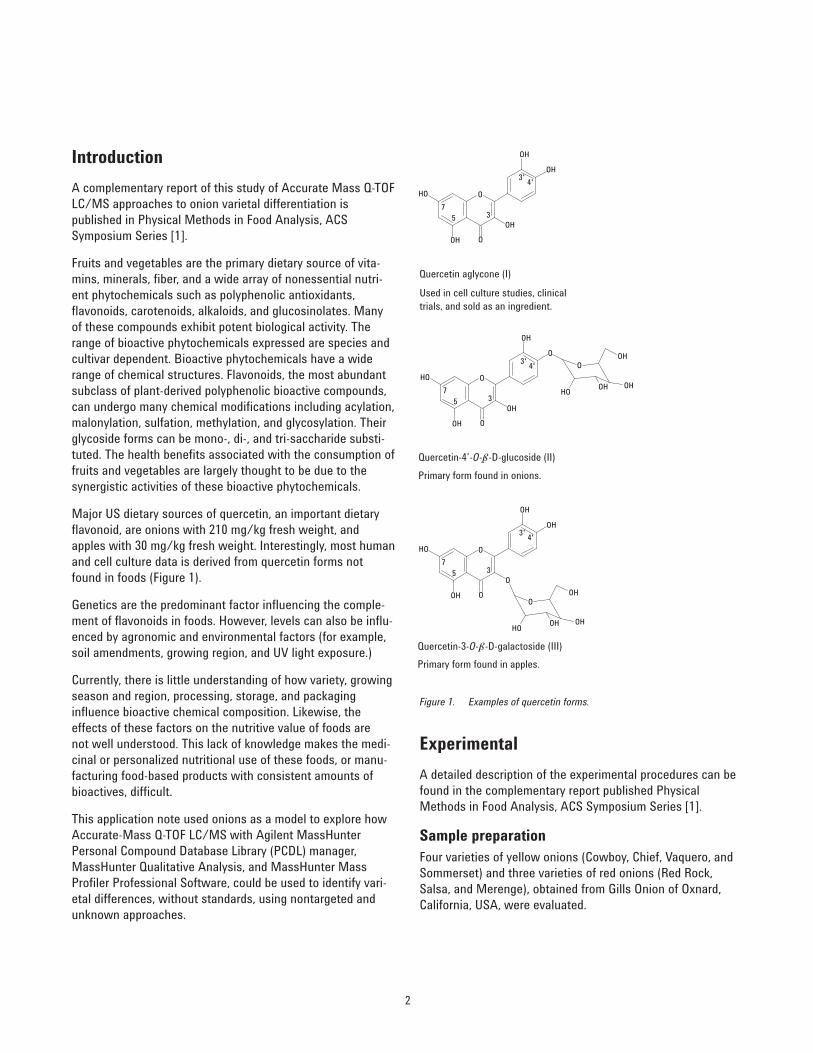
Major US dietary sources of quercetin, an important dietaryflavonoid, are onions with 210 mg/kg fresh weight, andapples with 30 mg/kg fresh weight. Interestingly, most humanand cell culture data is derived from quercetin forms notfound in foods (Figure 1).
Genetics are the predominant factor influencing the comple-ment of flavonoids in foods. However, levels can also be influ-enced by agronomic and environmental factors (for example,soil amendments, growing region, and UV light exposure.)
Currently, there is little understanding of how variety, growingseason and region, processing, storage, and packaging influence bioactive chemical composition. Likewise, theeffects of these factors on the nutritive value of foods are not well understood. This lack of knowledge makes the medi-cinal or personalized nutritional use of these foods, or manu-facturing food-based products with consistent amounts ofbioactives, difficult.
This application note used onions as a model to explore howAccurate-Mass Q-TOF LC/MS with Agilent MassHunterPersonal Compound Database Library (PCDL) manager,MassHunter Qualitative Analysis, and MassHunter MassProfiler Professional Software, could be used to identify vari-etal differences, without standards, using nontargeted andunknown approaches.
Experimental
A detailed description of the experimental procedures can befound in the complementary report published PhysicalMethods in Food Analysis, ACS Symposium Series [1].
Sample preparationFour varieties of yellow onions (Cowboy, Chief, Vaquero, andSommerset) and three varieties of red onions (Red Rock,Salsa, and Merenge), obtained from Gills Onion of Oxnard,California, USA, were evaluated.
Figure 1. Examples of quercetin forms.
HO
OH
OH
OH
OH
O
O
75 3
3' 4'
OHO
OH
HO
OH
OHOH
OH
OH
O
O
O
75 3
3' 4'
HO
OH
O
OH
OH
O
O
75 3
3' 4'
O
HO
OH
OHOH
Quercetin aglycone (I)
Quercetin-4’-O-b-D-glucoside (II)
Quercetin-3-O-b-D-galactoside (III)
Used in cell culture studies, clinicaltrials, and sold as an ingredient.
Primary form found in onions.
Primary form found in apples.

3
A general extraction procedure was used to perform an analy-sis without targeting specific compounds. Because the inneronion layers have limited anthocyanidins (red color), theywere separated from the outer layers and lyophilized andextracted with 80% MEOH for 20 minutes. Extraction condi-tions excluded anthocyanidins from differentiating the redversus the yellow varieties. The extraction was performed intriplicate.
InstrumentationThe extracted samples were analyzed using an Agilent 1290Infinity LC System coupled to an Agilent 6530 Accurate-MassQuadrupole Time-of-Flight (Q-TOF) LC/MS system withAgilent Jet Stream technology for electrospray ionization. The1290 Infinity LC System was equipped with a binary pumpwith an integrated vacuum degasser (G4220A), an autosam-pler (G4226A) with a thermostat (G1330B), and a thermostat-ted column compartment (G1316C). The 1290 Infinity LCSystem parameters are shown in Table 1.
Table 1. Agilent 1290 Infinity LC System Parameters
Instrument Agilent 1290 Infinity LC System
Mobile phases (A) 0.1% formic acid in water, initial 5% B(B) 0.1% formic acid in acetonitrile
Gradient LinearTime (min) %B
0−5 5−105−8 10−128−10 12−15
10−15 1515−18 15−5518−20 55−90
Flow rate 0.4 mL/min
Column Agilent Poroshell 120 EC-C18, 2.1 × 100 mm, 2.7 µm(p/n 695775-902)
Post run time 4 minutes at initial mobile phase
Temperature 30 °C
Injection volume 5 µL
Table 2. Q-TOF MS Parameters
Instrument Agilent 6530 Accurate Mass Q-TOF LC/MS
Ionization mode Positive and negative electrospray with Agilent Jet Stream technology
Acquisition rate 1.0 spectra/s
Mass range 100–1,000 m/z
Drying gas temperature 225 °C
Drying gas flow rate 8.0 L/min
Sheath gas temperature 300 °C
Sheath gas flow rate 10.0 L/min
Nebulizer gas 45 psi
Skimmer voltage 65 V
Octopole RF 750 V
Fragmentor 125 V
Capillary 2.5 kV
Continuous infusion of the reference ions m/z 119.0363(proton abstracted purine) and 966.0007 (formate adduct ofhexakis (1H, 1H, 3H-tetrafluoropropoxy) phosphazine orHP-921) in negative ion mode was used to correct each spec-trum to achieve accurate mass measurement typically betterthan 2 ppm.
Data analysis Data analysis was performed in four steps:
1. A flavonoid database was created and customized for theanalysis of onions.
2. Data obtained from the Q-TOF LC/MS single MS analyseswere searched for matches with the flavonoid databaseand the matches were scored.
3. Based on the compound matches (nontargeted results,that is without using standards for identification or confir-mation), a principal component analysis (PCA) of theonion varieties for varietal and color differences was performed.
4. For comparison, a PCA of all possible compounds found(unknowns, no matching used) in the onion varieties wasperformed.
A Q-TOF LC/MS analysis of the samples was performed. Toidentify all possible flavonoids, the instrument methodologywas defined as broadly as possible. Total ion spectra werecollected over a mass range of m/z 100−1,000, in both nega-tive and positive modes. Electrospray ionization generally ion-izes a broad range of compounds, with the exception of thosethat are relatively nonpolar. The flavonoids were expected torespond well, but their relative response was highly impactedby their endogenous chemical structure (for example, conjugation site, type of sugar, acylation, and so forth).
Some responded only in positive ion mode and others only innegative mode. Those that responded in both modes mayhave had much higher ionization efficiency in one modeversus the other. The Q-TOF MS parameters are shown inTable 2.
4
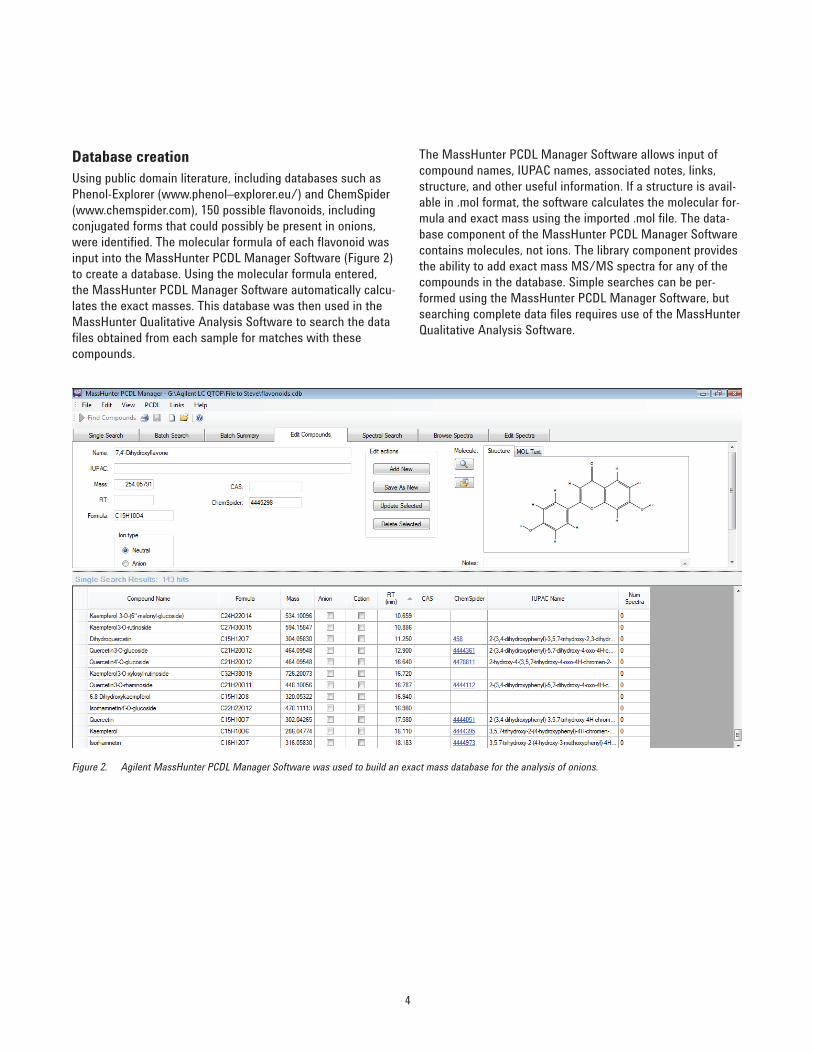
Database creationUsing public domain literature, including databases such asPhenol-Explorer (www.phenol–explorer.eu/) and ChemSpider(www.chemspider.com), 150 possible flavonoids, includingconjugated forms that could possibly be present in onions,were identified. The molecular formula of each flavonoid wasinput into the MassHunter PCDL Manager Software (Figure 2)to create a database. Using the molecular formula entered,the MassHunter PCDL Manager Software automatically calcu-lates the exact masses. This database was then used in theMassHunter Qualitative Analysis Software to search the datafiles obtained from each sample for matches with these compounds.
Figure 2. Agilent MassHunter PCDL Manager Software was used to build an exact mass database for the analysis of onions.
The MassHunter PCDL Manager Software allows input ofcompound names, IUPAC names, associated notes, links,structure, and other useful information. If a structure is avail-able in .mol format, the software calculates the molecular for-mula and exact mass using the imported .mol file. The data-base component of the MassHunter PCDL Manager Softwarecontains molecules, not ions. The library component providesthe ability to add exact mass MS/MS spectra for any of thecompounds in the database. Simple searches can be per-formed using the MassHunter PCDL Manager Software, butsearching complete data files requires use of the MassHunterQualitative Analysis Software.

5
Database searchUsing MassHunter Qualitative Analysis Software (Figure 3),the data obtained from the Q-TOF LC/MS analysis wassearched against the PCDL created in Step 1 of the dataanalysis. Specifically, using the software’s find-by-formulafeature, the accurate mass tolerances were set and thenapplied to a search of the data file for ions of the expectedisotopes, adducts (for example, H+, Na+), dimers, trimers,and so on.
Figure 3. Agilent MassHunter Qualitative Analysis Software was used to search the data for matches with the formulas in the flavonoid database.

6
The experimentally measured mass of each ion was evaluatedagainst the exact mass of the molecular formula and theexpected isotope pattern for that formula. This data was usedto score the match of the ions with the database (Figure 4).Using this approach, the flavonoids were tentatively identifiedby the software without using standards. We refer to thisapproach as a targeted search for nontarget compounds.
An exact match of mass, isotopic mass, and isotope spacingcan only confirm the molecular formula, and not whether it isactually the compound in the database. When standards arenot used, MS/MS can provide additional information that canbe used to make the identification. If standards are available,retention times and MS/MS can also be added to the data-base and used to score the match. Confirmation requirescomparison to a standard analyzed using the same conditionsas the sample.
Figure 4. Agilent MassHunter Qualitative Analysis Software was used to compare the measured masses, and isotope abundances and spacing, with those theoretically calculated to generate and score flavonoid matches.

7
Principal component analysisOnce the list of tentatively identified flavonoids was gener-ated for the different onion varieties, they were further exam-ined for varietal and color difference using the PCA capabili-ties of MassHunter Mass Profiler Professional Software. PCAwas performed in two ways. Both approaches are designed toprovide a list of compounds; one tentatively identified fromthe database search, the other a list of unknowns.
The first PCA performed was based on the matches found inthe database. The second approach used molecular featureextraction to extract all possible compounds found in the TICfrom all of the varieties. The found unknown compounds werethen filtered based on their presence in one variety andabsence in another. The molecular feature extractor withinMassHunter Qualitative Analysis Software takes all ions thatrepresent chromatographic peaks (thus eliminating back-ground ions) and groups them by adduct clusters, possibleisotopes, dimers, trimers, and so forth, all taken together asmolecular features without any determination of identity.Each feature is then calculated back to a molecular mass,again without any identification assigned. This unknownapproach to mining the data can provide differentiation ofvarietal differentiation without having to identify the distinguishing compounds.
Results and Discussion
Accurate-Mass Q-TOF LC/MS analysisAlthough the TICs from the extracted onion samples appearedsomewhat nondescript, they contained many ions represent-ing many compounds. The TIC of the inner layers of the variety Merenge is shown in Figure 5.
Database search resultsThe MassHunter Qualitative Analysis Software find-by-for-mula search of the created flavonoid database tentativelyidentified 19 flavonoids in the seven varieties of onions(Table 3).
1 1 2 2
1 2 3 4 5 6 7 8 9 10 11Acquisition time (min)
Cou
nts
12 13 14 15 16 17 18 19 20 21
×106
0
2
4
6
8
Figure 5. TIC of the variety Merenge.
Table 3. Flavonoids Tentatively Identified Using the Find-By-FormulaAlgorithm Provided with Agilent MassHunter Qualitative AnalysisSoftware to Search the Created Database
Delphinidin3-O-(6''-malonyl-glucoside)
Dihydroxykaempferol
Dihydromyricetin3-O-rhamnoside
Dihydroquercetin
Isorhamnetin
Isorhamnetin 4'-O-glucoside
Kaempferol
Kaempferol 3-O-(6"-malonyl-glucoside)
Kaempferol 3,7-O-diglucoside
Kaempferol 3-O-acetyl-glucoside
Kaempferol 3-O-rutinoside
Kaempferol 3-O-xylosyl-rutinoside
Quercetin
Quercetin 3,7,4'-triglucoside
Quercetin-O-diglucoside
Quercetin 3,4'-O-diglucoside
Quercetin 3-O-glucoside
Quercetin 3-O-rhamnoside
Quercetin 4'-O-glucoside
8
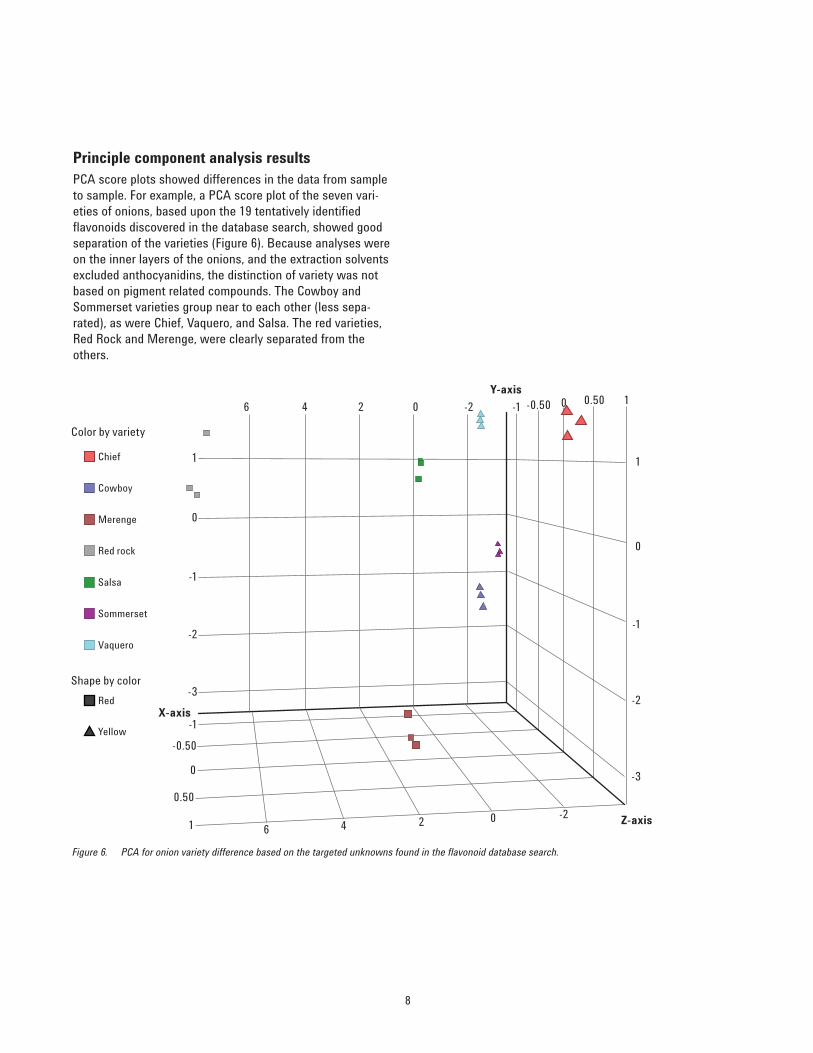
Principle component analysis resultsPCA score plots showed differences in the data from sampleto sample. For example, a PCA score plot of the seven vari-eties of onions, based upon the 19 tentatively identifiedflavonoids discovered in the database search, showed goodseparation of the varieties (Figure 6). Because analyses wereon the inner layers of the onions, and the extraction solventsexcluded anthocyanidins, the distinction of variety was notbased on pigment related compounds. The Cowboy andSommerset varieties group near to each other (less sepa-rated), as were Chief, Vaquero, and Salsa. The red varieties,Red Rock and Merenge, were clearly separated from theothers.
Y-axis
Z-axis
X-axis
6 4 2 0 -2 -1 -0.50 0 0.50 1
1
0
-1
-2
-3
-1
-0.50
0
0.50
1 6 4 2 0 -2
-3
-2
-1
0
1Chief
Color by variety
Shape by color
Cowboy
Merenge
Red rock
Salsa
Sommerset
Vaquero
Red
Yellow
Figure 6. PCA for onion variety difference based on the targeted unknowns found in the flavonoid database search.

9
The PCA score plot for color difference (Figure 7), showedlittle distinction between varieties, although there was somecorrelation along the x-axis.
Y-axis
Z-axis
X-axis
1
0
-1
-2
1
0
-1
-2
-1
0
0.50
-0.50
1
-1
00.50
-0.50
1
6 4 2 0 -2
6 4 2 0 -2
Color by color
Red
Yellow
Figure 7. PCA scores plot for color difference based on the tentative compounds found in the flavonoid database search.

10
A PCA score plot of the seven varieties of onions using allunknown compounds after molecular feature extraction of thedata (Figure 8), showed that this approach may also be applic-able to evaluating the general composition and color of thedifferent varieties.
Y-axis
Z-axis
X-axis
1,000-600500 0 -500
1,000
500
0
-500
-400 -2000
200400
-600
-400
-200
0
200
400
500
0
-500
-1,000
500
0
-500
-1,000
Chief
Color by variety
Shape by color
Cowboy
Merenge
Red rock
Salsa
Sommerset
Vaquero
Red
Yellow
Figure 8. PCA scores plot using all unknown compounds after molecular feature extraction of the data.
11
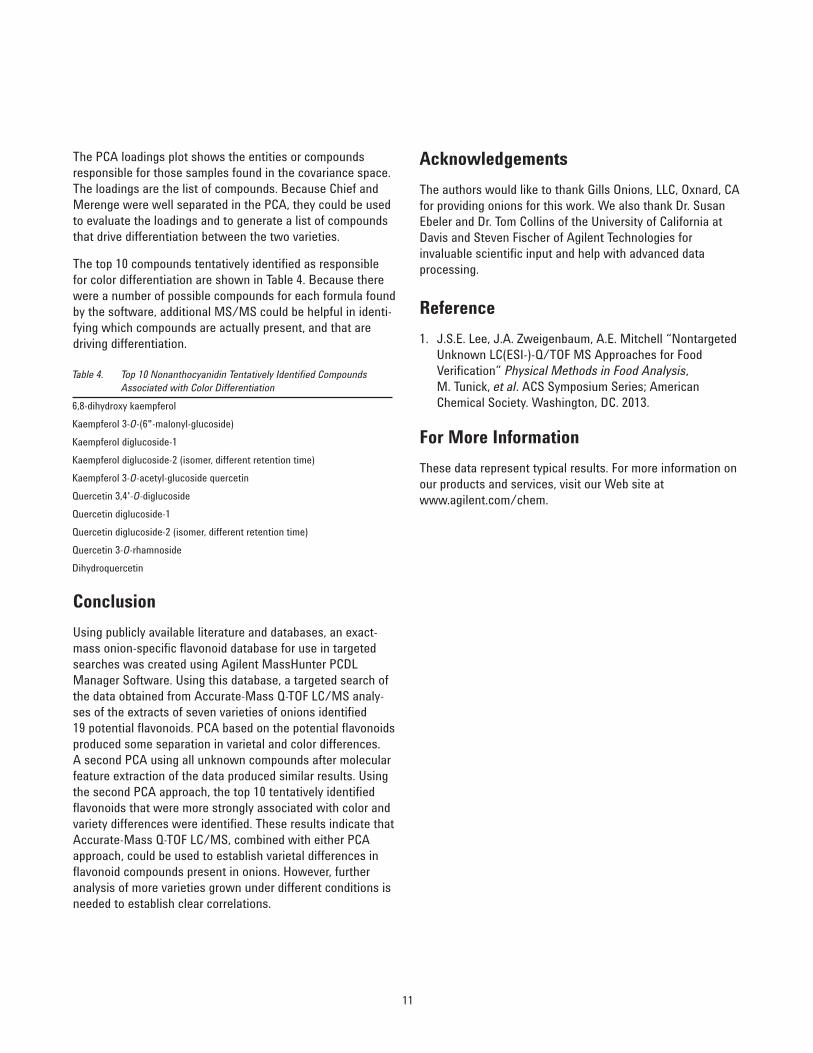
The PCA loadings plot shows the entities or compoundsresponsible for those samples found in the covariance space.The loadings are the list of compounds. Because Chief andMerenge were well separated in the PCA, they could be usedto evaluate the loadings and to generate a list of compoundsthat drive differentiation between the two varieties.
The top 10 compounds tentatively identified as responsiblefor color differentiation are shown in Table 4. Because therewere a number of possible compounds for each formula foundby the software, additional MS/MS could be helpful in identi-fying which compounds are actually present, and that are driving differentiation.
Acknowledgements
The authors would like to thank Gills Onions, LLC, Oxnard, CAfor providing onions for this work. We also thank Dr. SusanEbeler and Dr. Tom Collins of the University of California atDavis and Steven Fischer of Agilent Technologies for invaluable scientific input and help with advanced data processing.
Reference
1. J.S.E. Lee, J.A. Zweigenbaum, A.E. Mitchell “NontargetedUnknown LC(ESI-)-Q/TOF MS Approaches for FoodVerification” Physical Methods in Food Analysis,M. Tunick, et al. ACS Symposium Series; AmericanChemical Society. Washington, DC. 2013.
For More Information
These data represent typical results. For more information onour products and services, visit our Web site atwww.agilent.com/chem.
Table 4. Top 10 Nonanthocyanidin Tentatively Identified Compounds Associated with Color Differentiation
6,8-dihydroxy kaempferol
Kaempferol 3-O-(6"-malonyl-glucoside)
Kaempferol diglucoside-1
Kaempferol diglucoside-2 (isomer, different retention time)
Kaempferol 3-O-acetyl-glucoside quercetin
Quercetin 3,4'-O-diglucoside
Quercetin diglucoside-1
Quercetin diglucoside-2 (isomer, different retention time)
Quercetin 3-O-rhamnoside
Dihydroquercetin
Conclusion
Using publicly available literature and databases, an exact-mass onion-specific flavonoid database for use in targetedsearches was created using Agilent MassHunter PCDLManager Software. Using this database, a targeted search ofthe data obtained from Accurate-Mass Q-TOF LC/MS analy-ses of the extracts of seven varieties of onions identified19 potential flavonoids. PCA based on the potential flavonoidsproduced some separation in varietal and color differences.A second PCA using all unknown compounds after molecularfeature extraction of the data produced similar results. Usingthe second PCA approach, the top 10 tentatively identifiedflavonoids that were more strongly associated with color andvariety differences were identified. These results indicate thatAccurate-Mass Q-TOF LC/MS, combined with either PCAapproach, could be used to establish varietal differences inflavonoid compounds present in onions. However, furtheranalysis of more varieties grown under different conditions isneeded to establish clear correlations.

www.agilent.com/chem
Agilent shall not be liable for errors contained herein or for incidental or consequentialdamages in connection with the furnishing, performance, or use of this material.
Information, descriptions, and specifications in this publication are subject to changewithout notice.
© Agilent Technologies, Inc., 2013Published in the USANovember 13, 20135991-3419EN