for e ciency standards analysis · pdf filediscount rate distributions for use in standards...
TRANSCRIPT

Commercial Discount Rate Estimation
for E�ciency Standards Analysis
K. Sydny Fujita
Energy Analysis & Environmental Impact Department
Environmental Energy Technologies Division
Lawrence Berkeley National Laboratory
Berkeley, CA 94720
April 13, 2016
This work was supported by the Assistant Secretary for Energy E�ciency and RenewableEnergy, O�ce of Building Technology, State, and Community Programs, of the U.S.Department of Energy under Contract No. DE-AC02-05CH11231.
LBNL-1005088

DISCLAIMER
This document was prepared as an account of work sponsored by the United States Government. While thisdocument is believed to contain correct information, neither the United States Government nor any agencythereof, nor The Regents of the University of California, nor any of their employees, makes any warranty,express or implied, or assumes any legal responsibility for the accuracy, completeness, or usefulness ofany information, apparatus, product, or process disclosed, or represents that its use would not infringeprivately owned rights. Reference herein to any speci�c commercial product, process, or service by its tradename, trademark, manufacturer, or otherwise, does not necessarily constitute or imply its endorsement,recommendation, or favoring by the United States Government or any agency thereof, or The Regents ofthe University of California. The views and opinions of authors expressed herein do not necessarily stateor re�ect those of the United States Government or any agency thereof or The Regents of the Universityof California.
Ernest Orlando Lawrence Berkeley National Laboratory is an equal opportunity employer.
COPYRIGHT NOTICE
This manuscript has been authored by an author at Lawrence Berkeley National Laboratory under ContractNo. DE-AC02-05CH11231 with the U.S. Department of Energy. The U.S. Government retains, and thepublisher, by accepting the article for publication, acknowledges, that the U.S. Government retains anon-exclusive, paid-up, irrevocable, world-wide license to publish or reproduce the published form of thismanuscript, or allow others to do so, for U.S. Government purposes.

Executive Summary
Underlying each of the Department of Energy's (DOE's) federal appliance and equipment standards
are a set of complex analyses of the projected costs and bene�ts of regulation. Any new or amended
standard must be designed to achieve signi�cant additional energy conservation, provided that
it is �technologically feasible and economically justi�ed� (42 U.S.C. 6295(o)(2)(A)). A proposed
standard is considered economically justi�ed when its bene�ts exceed its burdens, as represented
by the projected net present value of costs and bene�ts.
DOE performs multiple analyses to evaluate the balance of costs and bene�ts of commercialappliance and equipment e�ciency standards, at the national and individual building or businesslevel, each framed to capture di�erent nuances of the complex impact of standards on the com-mercial end user population. The Life-Cycle Cost (LCC) analysis models the combined impactof appliance �rst cost and operating cost changes on a representative commercial building samplein order to identify the fraction of customers achieving LCC savings or incurring net cost at theconsidered e�ciency levels.1 Thus, the choice of commercial discount rate value(s) used to calculatethe present value of energy cost savings within the Life-Cycle Cost model implicitly plays a keyrole in estimating the economic impact of potential standard levels.2
This report is intended to provide a more in-depth discussion of the commercial discountrate estimation process than can be readily included in standard rulemaking Technical SupportDocuments (TSDs), including details regarding:
• Discount rate estimation methods and rationale;
• Data sources used and data limitations;
• Discount rate distributions for use in standards analysis;
• Discount rate estimation methods and distributions speci�c to the small business subgroupanalysis.
The report concludes by sketching plans for future updates to commercial discount rate distribu-tions, in the face of uncertainty regarding data availability going forward.
1As a point of comparison, the National Impact Analysis (NIA) assesses the net present value to the nation asa whole, based on �rst cost, operating cost, and shipments changes induced by standards. This report focuses onthe LCC.
2Note that a companion report on the consumer (i.e., residential) discount rate in the LCC is, or soon will be,available.
Contents
1 Introduction 1
1.1 Discounting in the Life-Cycle Cost Model . . . . . . . . . . . . . . . . . . . . . . . 11.2 A Brief Review of CAPM in the Literature . . . . . . . . . . . . . . . . . . . . . . 2
2 Methodology 4
2.1 Cost of Equity . . . . . . . . . . . . . . . . . . . . . . . . . . . . . . . . . . . . . . 42.2 Cost of Debt . . . . . . . . . . . . . . . . . . . . . . . . . . . . . . . . . . . . . . . 52.3 Weighted Average Cost of Capital . . . . . . . . . . . . . . . . . . . . . . . . . . . 5
3 Data Sources 7
4 Small Business Subgroup 9
4.1 Modifying CAPM to Account for Characteristics of Small Businesses . . . . . . . . 9
5 Discussion: Planning for Future Updates 11
A Discount Rate Distributions by Sector 13
B Additional Small Business Discount Rate Information 20
B.1 Mapping to Small Businesses in the LCC Building Sample . . . . . . . . . . . . . . 20B.2 Small Business Discount Rate Distributions by Sector . . . . . . . . . . . . . . . . 27
List of Tables
2.1 Risk-Free Rate and Equity Risk Premium, 2004-2013 . . . . . . . . . . . . . . . . . 52.2 Weighted Average Cost of Capital by Sector . . . . . . . . . . . . . . . . . . . . . . 63.1 Mapping of Sectors to CBECS Categories . . . . . . . . . . . . . . . . . . . . . . . 84.1 Size Premia and Decile De�nitions . . . . . . . . . . . . . . . . . . . . . . . . . . . 104.2 Comparison of Small Business and Full Commercial Sample: Weighted Average Cost
of Capital by Sector . . . . . . . . . . . . . . . . . . . . . . . . . . . . . . . . . . . 10A.1 O�ce (2) Discount Rate Distribution . . . . . . . . . . . . . . . . . . . . . . . . . . 13A.2 Food Sales (6) Discount Rate Distribution . . . . . . . . . . . . . . . . . . . . . . . 13A.3 Health Care (8) Discount Rate Distribution . . . . . . . . . . . . . . . . . . . . . . 14A.4 Warehouse (11) Discount Rate Distribution . . . . . . . . . . . . . . . . . . . . . . 14A.5 Public Assembly (13) Discount Rate Distribution . . . . . . . . . . . . . . . . . . . 15A.6 Education (14) Discount Rate Distribution . . . . . . . . . . . . . . . . . . . . . . 15A.7 Food Service (15) Discount Rate Distribution . . . . . . . . . . . . . . . . . . . . . 16A.8 Lodging (18) Discount Rate Distribution . . . . . . . . . . . . . . . . . . . . . . . . 16A.9 Retail - Mall (24) Discount Rate Distribution . . . . . . . . . . . . . . . . . . . . . 17A.10 Retail - Other (25) Discount Rate Distribution . . . . . . . . . . . . . . . . . . . . 17A.11 Service (26) Discount Rate Distribution . . . . . . . . . . . . . . . . . . . . . . . . 18A.12 Other (91) Discount Rate Distribution . . . . . . . . . . . . . . . . . . . . . . . . . 18A.13 Industrial Discount Rate Distribution . . . . . . . . . . . . . . . . . . . . . . . . . 19B.1 NAICS Industry Size Data Assignment to CBECS Building Type . . . . . . . . . . 21B.2 Example of Establishment Categories (NAICS 72) . . . . . . . . . . . . . . . . . . 22B.3 Maximum Number of Employees in Small Business by Sector . . . . . . . . . . . . 26B.4 O�ce (2) Discount Rate Distribution (Small Businesses) . . . . . . . . . . . . . . . 27B.5 Food Sales (6) Discount Rate Distribution (Small Businesses) . . . . . . . . . . . . 27B.6 Health Care (8) Discount Rate Distribution (Small Businesses) . . . . . . . . . . . 28

B.7 Warehouse (11) Discount Rate Distribution (Small Businesses) . . . . . . . . . . . 28B.8 Public Assembly (13) Discount Rate Distribution (Small Businesses) . . . . . . . . 29B.9 Food Service (15) Discount Rate Distribution (Small Businesses) . . . . . . . . . . 29B.10 Lodging (18) Discount Rate Distribution (Small Businesses) . . . . . . . . . . . . . 30B.11 Retail - Mall (24) Discount Rate Distribution (Small Businesses) . . . . . . . . . . 30B.12 Retail - Other (25) Discount Rate Distribution (Small Businesses) . . . . . . . . . 31B.13 Service (26) Discount Rate Distribution (Small Businesses) . . . . . . . . . . . . . 31B.14 Other (91) Discount Rate Distribution (Small Businesses) . . . . . . . . . . . . . . 32B.15 Industrial Discount Rate Distribution (Small Businesses) . . . . . . . . . . . . . . . 32
List of Figures
B.1 Assembly: Relationship between Number of Employees and Value of Sales . . . . 23B.2 Health Care: Relationship between Number of Employees and Value of Sales . . . 23B.3 Food Service: Relationship between Number of Employees and Value of Sales . . . 24B.4 Lodging: Relationship between Number of Employees and Value of Sales . . . . . 24B.5 O�ce: Relationship between Number of Employees and Value of Sales . . . . . . . 25B.6 Retail: Relationship between Number of Employees and Value of Sales . . . . . . 25
5

1 Introduction
The Life-Cycle Cost (LCC) analysis of the Department of Energy's (DOE's) energy e�ciencystandard rulemaking process is used to estimate the combined impact of �rst cost and operatingcost changes in a representative commercial building sample in order to identify the fraction ofcustomers achieving LCC savings or incurring net cost, in monetary terms, at the considerede�ciency levels.
The commercial discount rate is the rate at which future operating costs are discounted toestablish their present value in the LCC analysis. The discount rate value is applied in the LCCto future year energy costs and non-energy operations and maintenance costs to calculate theestimated net life-cycle cost of products of various e�ciency levels, and life-cycle cost savings ascompared to the baseline for a representative sample of commercial end users. Thus, the choice ofcommercial discount rate value(s) used to calculate the present value of energy cost savings withinthe Life-Cycle Cost (LCC) model implicitly plays a key role in estimating the economic impact ofpotential standard levels.
DOE's method views the purchase of a higher e�ciency appliance as an investment that yieldsa stream of value in the form of energy cost savings. DOE derived the discount rates for theLCC analysis by estimating the cost of capital for companies that purchase appliances and energy-consuming equipment. The weighted average cost of capital (WACC) is commonly used to estimatethe present value of cash �ows to be derived from a typical company project or investment. Mostcompanies use both debt and equity capital to fund investments, so their cost of capital is theweighted average of the cost to the �rm of equity and debt �nancing, as estimated from �nancialdata for publicly traded �rms in a given sector. We rely on the Capital Asset Pricing Model(CAPM) to estimate �rms' costs of equity (Modigliani and Miller 1958).
Damodaran Online, the primary source of data for this analysis, is a widely used source ofinformation about company debt and equity �nancing for most types of �rms (Damodaran Online2004-2013). Detailed sectors included in the Damondaran Online database were assigned to thefollowing aggregate categories: O�ce; Food Sales; Health Care; Warehouse; Public Assembly;Food Service; Lodging; Retail - Mall; Retail - Other; Service; Industrial. State and local bondsrates were used to separately calculate discount rate distributions associated with the Educationand Public Order & Safety sectors. These categories were chosen in order to map to the sectorsde�ned in the commercial building sample used for the LCC analysis.
The structure of this report is as follows. The remaining subsections of the introduction providean overview of discounting in the LCC and a brief review of the CAPM model as described in theliterature. Section 2 discusses the data sources used in the analysis. Section 3 discusses the calcu-lations used to derive discount rate distributions and presents summary results for the standardLCC analysis. Section 4 addresses the speci�c case of small businesses and their correspondingdiscount rate methodology and distributions. Section 5 lays out a rudimentary plan for futureupdates of this analysis. Two appendices are also provided: the �rst includes the full discount ratedistributions by sector as used in the LCC; the second describes the process of identifying smallbusinesses in the LCC building sample and presents the discount rate distributions by sector asused in the small business subgroup analysis.
1.1 Discounting in the Life-Cycle Cost Model
The LCC is used to predict how many and what type of businesses are likely to monetarily gainor lose under a proposed standard, based on a representative building sample drawn from theCommercial Building Energy Consumption Survey (CBECS). Broadly, the LCC addresses thequestions: how many commercial building owners bene�t from the proposed standard, how manywill be worse o�, and to what degree? A standard will have di�erential impacts on businessesdepending on many factors, including: the size and type of commercial building; intensity of
1
product use; building age and weatherization. A proposed standard is expected to impact thenumber of commercial buildings that obtain a positive net present value via two primary factors:product energy e�ciency (and thus energy consumption and cost) and �nal installed price.
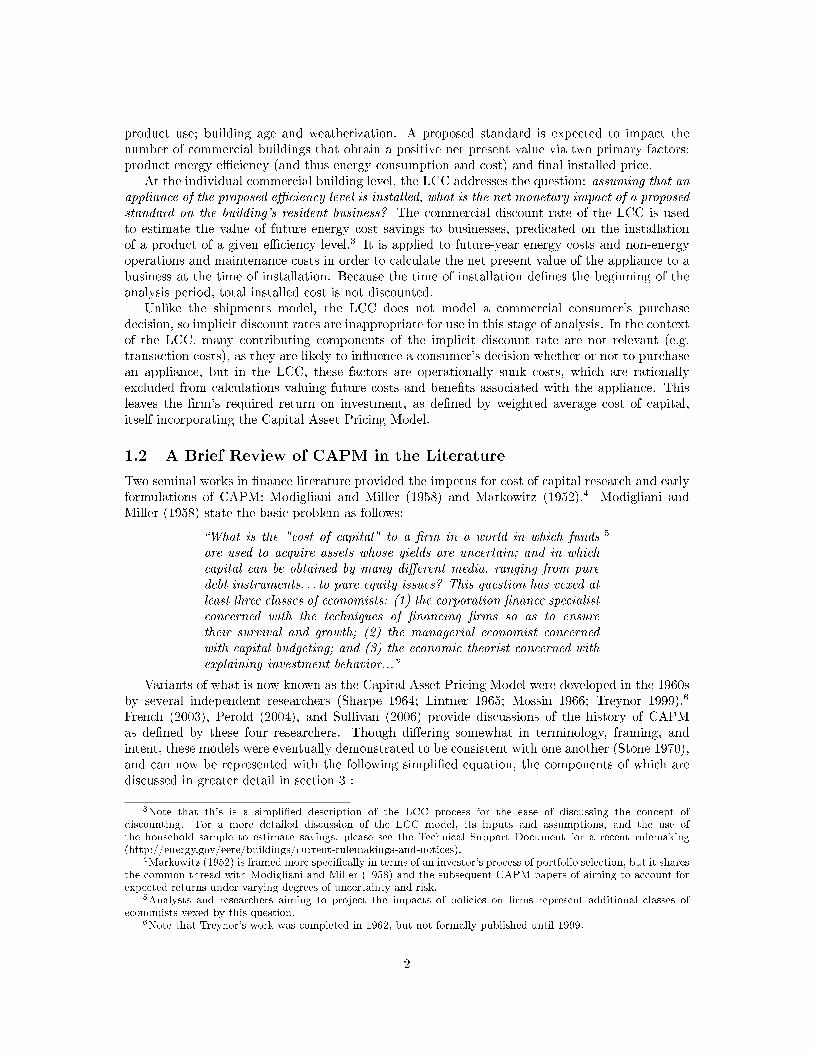
At the individual commercial building level, the LCC addresses the question: assuming that anappliance of the proposed e�ciency level is installed, what is the net monetary impact of a proposedstandard on the building's resident business? The commercial discount rate of the LCC is usedto estimate the value of future energy cost savings to businesses, predicated on the installationof a product of a given e�ciency level.3 It is applied to future-year energy costs and non-energyoperations and maintenance costs in order to calculate the net present value of the appliance to abusiness at the time of installation. Because the time of installation de�nes the beginning of theanalysis period, total installed cost is not discounted.
Unlike the shipments model, the LCC does not model a commercial consumer's purchasedecision, so implicit discount rates are inappropriate for use in this stage of analysis. In the contextof the LCC, many contributing components of the implicit discount rate are not relevant (e.g.transaction costs), as they are likely to in�uence a consumer's decision whether or not to purchasean appliance, but in the LCC, these factors are operationally sunk costs, which are rationallyexcluded from calculations valuing future costs and bene�ts associated with the appliance. Thisleaves the �rm's required return on investment, as de�ned by weighted average cost of capital,itself incorporating the Capital Asset Pricing Model.
1.2 A Brief Review of CAPM in the Literature
Two seminal works in �nance literature provided the impetus for cost of capital research and earlyformulations of CAPM: Modigliani and Miller (1958) and Markowitz (1952).4 Modigliani andMiller (1958) state the basic problem as follows:
�What is the "cost of capital" to a �rm in a world in which fundsare used to acquire assets whose yields are uncertain; and in whichcapital can be obtained by many di�erent media, ranging from puredebt instruments. . . to pure equity issues? This question has vexed atleast three classes of economists: (1) the corporation �nance specialistconcerned with the techniques of �nancing �rms so as to ensuretheir survival and growth; (2) the managerial economist concernedwith capital budgeting; and (3) the economic theorist concerned withexplaining investment behavior...�
5
Variants of what is now known as the Capital Asset Pricing Model were developed in the 1960sby several independent researchers (Sharpe 1964; Lintner 1965; Mossin 1966; Treynor 1999).6
French (2003), Perold (2004), and Sullivan (2006) provide discussions of the history of CAPMas de�ned by these four researchers. Though di�ering somewhat in terminology, framing, andintent, these models were eventually demonstrated to be consistent with one another (Stone 1970),and can now be represented with the following simpli�ed equation, the components of which arediscussed in greater detail in section 3 :
3Note that this is a simpli�ed description of the LCC process for the ease of discussing the concept ofdiscounting. For a more detailed discussion of the LCC model, its inputs and assumptions, and the use ofthe household sample to estimate savings, please see the Technical Support Document for a recent rulemaking(http://energy.gov/eere/buildings/current-rulemakings-and-notices).
4Markowitz (1952) is framed more speci�cally in terms of an investor's process of portfolio selection, but it sharesthe common thread with Modigliani and Miller (1958) and the subsequent CAPM papers of aiming to account forexpected returns under varying degrees of uncertainty and risk.
5Analysts and researchers aiming to project the impacts of policies on �rms represent additional classes ofeconomists vexed by this question.
6Note that Treynor's work was completed in 1962, but not formally published until 1999.
2

kei = Rf + βi ERP
Where:kei =cost of equity of �rm i,Rf = expected return on risk-free assets,βi =risk coe�cient of �rm i, andERP =equity risk premium.
We recognize that CAPM is a fairly simple model used to represent a complex valuation processwhich varies from investor to investor and �rm to �rm. While potentially less accurate than moredetailed models (i.e., arbitrage pricing, multifactor, discounted cash �ow),7 CAPM bene�ts fromwidespread familiarity and its comparatively simple data requirements. All potential substitutemodels and methodologies come with their own assortment of theoretical and practical weaknesses(i.e. assumptions and data requirements). For an informal yet in-depth discussion and critiqueof CAPM and its alternatives in discount rate estimation, see New York University's AswathDamodaran's blog series on the topic.8
7Damodaran (2011) notes that while such models can outperform CAPM in terms of explaining past di�erences,there is little evidence of an improvement over CAPM for predictive purposes.
8http://aswathdamodaran.blogspot.com/2011/04/alternatives-to-capm-part-1-relative.html
3
2 Methodology
DOE's methodology for estimating commercial discount rates assumes that the purchase of a highere�ciency appliance can be viewed as an investment that yields returns in the form of a stream ofenergy cost savings. For the purpose of estimating the present value of any investment, the discountrate represents the opportunity cost, over the life of the investment, of selecting that particularinvestment over other available options. The discount rate is used to calculate the value, in today'sdollars, of all future year earnings (i.e., energy cost savings) associated with the purchase of anappliance of a speci�c e�ciency. This allows DOE to compare costs between di�erent e�ciencylevels (Trial Standard Levels, TSLs).
Following this rationale, the commercial discount rate is estimated as the weighted averagecost of capital, computed from a �rm's cost of equity (i.e., expected interest rate on equity) andcost of debt (i.e., expected interest rate on debt), weighted by the �rm's ratio of debt to equity, asrecorded in the Damodaran Online dataset.
2.1 Cost of Equity
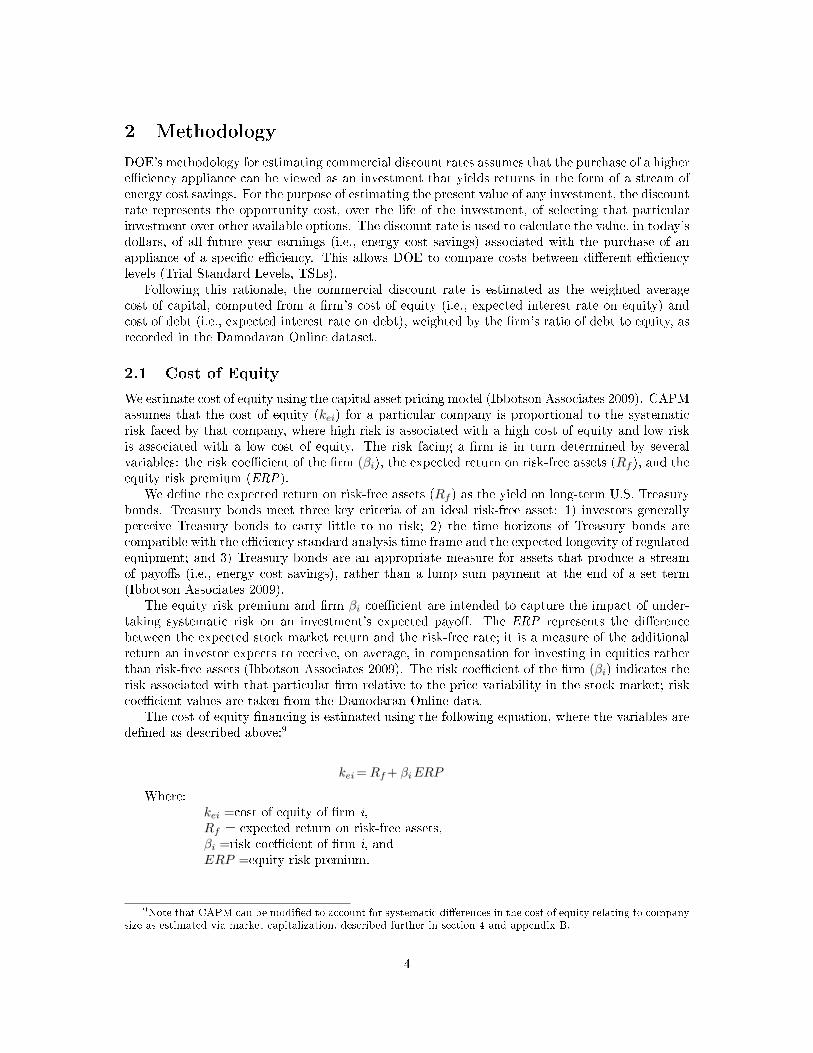
We estimate cost of equity using the capital asset pricing model (Ibbotson Associates 2009). CAPMassumes that the cost of equity (kei) for a particular company is proportional to the systematicrisk faced by that company, where high risk is associated with a high cost of equity and low riskis associated with a low cost of equity. The risk facing a �rm is in turn determined by severalvariables: the risk coe�cient of the �rm (βi), the expected return on risk-free assets (Rf ), and theequity risk premium (ERP).
We de�ne the expected return on risk-free assets (Rf ) as the yield on long-term U.S. Treasurybonds. Treasury bonds meet three key criteria of an ideal risk-free asset: 1) investors generallyperceive Treasury bonds to carry little to no risk; 2) the time horizons of Treasury bonds arecompatible with the e�ciency standard analysis time frame and the expected longevity of regulatedequipment; and 3) Treasury bonds are an appropriate measure for assets that produce a streamof payo�s (i.e., energy cost savings), rather than a lump sum payment at the end of a set term(Ibbotson Associates 2009).
The equity risk premium and �rm βi coe�cient are intended to capture the impact of under-taking systematic risk on an investment's expected payo�. The ERP represents the di�erencebetween the expected stock market return and the risk-free rate; it is a measure of the additionalreturn an investor expects to receive, on average, in compensation for investing in equities ratherthan risk-free assets (Ibbotson Associates 2009). The risk coe�cient of the �rm (βi) indicates therisk associated with that particular �rm relative to the price variability in the stock market; riskcoe�cient values are taken from the Damodaran Online data.
The cost of equity �nancing is estimated using the following equation, where the variables arede�ned as described above:9
kei = Rf + βi ERP
Where:kei =cost of equity of �rm i,Rf = expected return on risk-free assets,βi =risk coe�cient of �rm i, andERP =equity risk premium.
9Note that CAPM can be modi�ed to account for systematic di�erences in the cost of equity relating to companysize as estimated via market capitalization, described further in section 4 and appendix B.
4

Table 2.1: Risk-Free Rate and Equity Risk Premium, 2004-2013Year Risk-Free Rate (%) ERP (%)
2004 7.10 3.252005 7.11 3.682006 7.10 3.492007 7.08 3.362008 7.01 2.402009 6.88 3.072010 6.74 3.232011 6.61 2.942012 6.41 3.992013 6.24 5.81
Several parameters of the cost of capital equations can vary substantially over time, andtherefore the estimates can vary with the time period over which data is selected and the technicaldetails of the data averaging method. For guidance on the time period for selecting and averagingdata for key parameters and the averaging method, DOE used Federal Reserve methodologiesfor calculating these parameters. In its use of the CAPM, the Federal Reserve uses a forty-yearperiod for calculating discount rate averages, utilizes the gross domestic product price de�atorfor estimating in�ation, and considers the best method for determining the risk free rate as onewhere �the time horizon of the investor is matched with the term of the risk-free security� (FederalReserve Board 2005).
By taking a forty-year geometric average of Federal Reserve data on annual nominal returns for10-year Treasury bills, DOE estimated the following risk free rates for 2004 - 2013 (Table 2.1).(U.S.O�ce of Management and Budget (OMB) 2014). DOE also estimated the ERP by calculating thedi�erence between risk free rate and stock market return for the same time period, as estimatedusing Damodaran Online data on the historical return to stocks (Damodaran Online 2013).10
2.2 Cost of Debt
The cost of debt �nancing (kdi) is the interest rate paid on money borrowed by a company. Weestimate the cost of debt for a given �rm by adding a risk adjustment factor (Ra ) to the risk-freerate (Rf ). This risk adjustment factor depends on the variability of stock returns represented bystandard deviations in a �rm's stock prices. So for �rm i, the cost of debt �nancing is:
kdi = Rf +Rai
Where:kdi =cost of debt of �rm i,Rf = expected return on risk-free assets,Rai = risk adjustment factor to risk-free rate for �rm i.
2.3 Weighted Average Cost of Capital
After estimating the cost of equity and cost of debt for each �rm in the dataset, we calculate theWACC by �rm using the following equation:
10Note that annual returns to investments are not independent from each other, and thus the geometric averageis more informative than the arithmetic average.
5

Table 2.2: Weighted Average Cost of Capital by Sector
Sector Sector #Weighted AverageDiscount Rate (%)
StandardDeviation (%)
O�ce 2 6.04 1.05
Food Sales 6 5.52 0.72
Health Care 8 5.53 0.83
Warehouse 11 6.01 1.46
PublicAssembly
13 6.31 1.13
Food Service 15 5.73 0.92
Lodging 18 6.99 1.85
Retail (Mall) 24 6.36 1.12
Retail (Other) 25 5.89 1.05
Service 26 6.25 1.04
Education 14 3.30 1.10
Other 91 6.02 1.09
Industrial N/A 6.00 1.10
WACCi = kei × wei + kdi × wdi
Where:WACCi= weighted average cost of capital for �rm i,kei =cost of equity of �rm i,wei =proportion of equity �nancing for �rm i,kdi =cost of debt of �rm i,wdi =proportion of debt �nancing for �rm i.
By adjusting for the in�uence of in�ation, DOE estimates the real weighted average cost ofcapital, or discount rate, for each company. We aggregate the individual �rm real weighted averagecosts of capital to produce discount rate distributions for each of the sectors de�ned in section 3.Table 2.2 shows the average WACC values for the major sectors included in e�ciency standardsanalysis.11 While WACC values for any sector may trend higher or lower over substantial periodsof time, these values represent a cost of capital that is averaged over major business cycles.
11While this table provides average values and standard deviations, it is important to note that �rm-level WACCwithin a sector are not necessarily normally distributed; thus, DOE prefers to use binned versions of the fulldistributions in subsequent analysis, rather than trying to �t coe�cients of a speci�c distribution form.
6

3 Data Sources
This section provides information about the data sources used to estimate commercial discountrates, via a weighted average cost of capital incorporating the CAPM model, as described in 2.
Damodaran Online is a widely used source of information about company debt and equity�nancing for most types of �rms, and was the primary source of data for this analysis (DamodaranOnline 2004-2013). These datasets provide numerous annual �nancial details (e.g., market capital-ization, stock price, total debt, tax rate, etc.) for approximately 5000-6000 companies and coverthe period of 2004 � 2013.12
To streamline the application of these data to the building samples used in e�ciency standardsanalysis, detailed sectors by SIC code included in the Damondaran Online database were assignedto aggregate categories mapped to the following CBECS �Principal Building Activities�: O�ce;Food Sales; Health Care; Warehouse; Public Assembly; Food Service; Lodging; Retail (Mall/StripMall); Retail (Other than Mall); Service. For the Education and Public Order & Safety sectors, thereal interest rates on 20-year state and local bonds are applied (Table 3.1) (Board of Governors ofthe Federal Reserve System 2014; U.S. O�ce of Management and Budget (OMB) 2014).13 Thoughnot included in CBECS, Damodaran Online data also includes manufacturing, utilities, and similarindustries that are aggregated into the Industrial sector (Table 3.1). Based on CBECS PBA, sectordiscount rates are matched to the appropriate building sample records.1415
For each appliance and equipment e�ciency standard under consideration, the analysis teamwill be able to map the commercial discount rate distributions by PBA (Table 3.1) to the buildingsample speci�c to their product. By product, the overall weighted average commercial discountrate will di�er due to variation in the concentrations of types of appliances and equipment acrosssectors.
12Note that these data were available for download from Damodaran Online through early 2014, but can no longerbe accessed. Damodaran Online now only provides aggregated sector-level data. These data sets could potentiallybe reconstructed through purchase from the original sources: Bloomberg, Morningstar, Capital IQ and Compustat.
13CBECS and Damodaran Online sector categories were mapped via NAICS and SIC codes. In response tofrequently asked questions regarding CBECS, the Energy Information Administration provides a recommendedmapping of its PBA codes to NAICS (https://www.eia.gov/consumption/commercial/faq.cfm#q8). Note thatbecause CBECS PBAs are assigned based on the main activity that takes place in a building, this mapping to sectorswill be imperfect. For example, a company categorized as sector 424: Nondurables Wholesalers could conceivably bemapped to three PBAs: Food Sales, O�ce, and Warehouse. In such cases, we rely on EIA's determination of mostlikely matches, as �agged in their PBA to NAICS �crosswalk.� Because Damodaran Online provides sectors by SICcode, while PBAs are mapped to NAICS by EIA, it was necessary to compare NAICS and SIC to bridge betweenSIC and PBA (SIC: https://www.osha.gov/pls/imis/sicsearch; NAICS: http://www.census.gov/eos/www/naics/).
14Aggregated sectors are constructed from one or more CBECS PBAs; we continue to use the PBA number ofone of these CBECS buildings types for identi�cation purposes in our analysis (i.e., middle column). Numbers inparentheses in the rightmost column are the CBECS PBA codes for each individual CBECS sector.
15Note that the discount rates for the �Other� sector are the weighted average of all companies in the data set.
7

Table 3.1: Mapping of Sectors to CBECS CategoriesSector Name inDR Analysis
PrimaryCBECS PBA #
Applied to CBECS PBAs:(Sector Name and PBA number)
O�ce 2 O�ce (2)
Food Sales 6 Food Sales (6)
Health Care 8Outpatient health care (8);Inpatient health care (16);Nursing (17); Laboratory (4)
Warehouse 11Nonrefrigerated warehouse (5);Refrigerated warehouse (11)
PublicAssembly
13Public Assembly (13);Religious worship (12)
Food Service 15 Food Service (15)
Lodging 18 Lodging (18)
Retail (Mall) 24Enclosed mall (24);Strip shopping mall (23)
Retail (Other) 25 Retail other than mall (25)
Service 26 Service (26)
Education 14Education (14);Public order and safety (7)
Other 91 Other (91)
Industrial N/A N/A
It is important to note that some sectors cannot be addressed with Damodaran Online data,which only includes information on publicly-traded commercial companies. Commercial companiesthat are privately held are represented using their publicly-traded sectoral counterparts as prox-ies. Publicly-owned buildings, such as state-owned schools or government owned and occupiedo�ces, must be addressed separately. Government buildings are assigned a discount rate from adistribution of state and local or federal bond rates, as appropriate.
If a very speci�c sector is needed but not included in Damodaran Online data (i.e., laundromatsfor the commercial clothes washers analysis) Ibbotson Associate's sector summary data can beused (Ibbotson Associates 2009). The �Industrial� sector (e.g., mining, manufacturing, utilities)is currently included as a single category; however, subsectors can be broken out as necessaryfor the few speci�cally industrial products covered by e�ciency standards, such as distributiontransformers or industrial pumps.
8
4 Small Business Subgroup
The life-cycle cost sub-group analysis is included in the e�ciency standard evaluation process inorder to determine if there are any speci�c groups of consumers who may be disproportionatelya�ected by the proposed standard. In the case of commercial appliances and equipment, smallbusinesses are one of the most common subgroups analyzed.
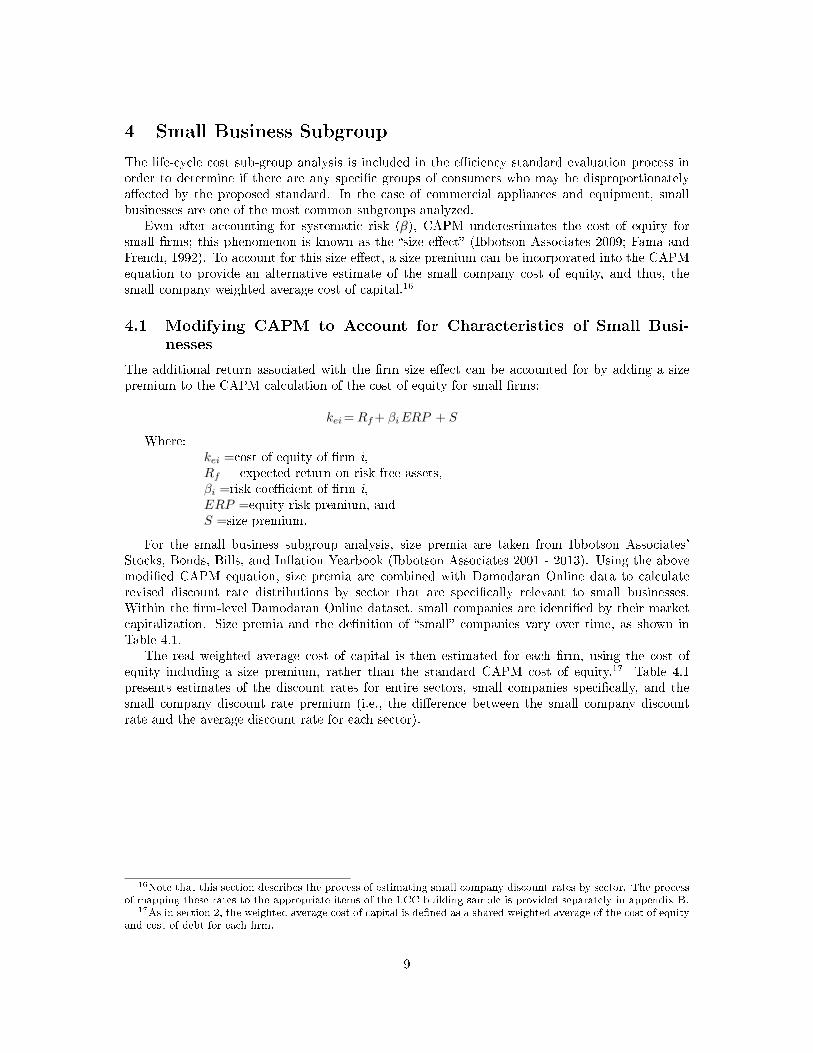
Even after accounting for systematic risk (β), CAPM underestimates the cost of equity forsmall �rms; this phenomenon is known as the �size e�ect� (Ibbotson Associates 2009; Fama andFrench, 1992). To account for this size e�ect, a size premium can be incorporated into the CAPMequation to provide an alternative estimate of the small company cost of equity, and thus, thesmall company weighted average cost of capital.16
4.1 Modifying CAPM to Account for Characteristics of Small Busi-
nesses
The additional return associated with the �rm size e�ect can be accounted for by adding a sizepremium to the CAPM calculation of the cost of equity for small �rms:
kei = Rf + βi ERP + S
Where:kei =cost of equity of �rm i,Rf = expected return on risk-free assets,βi =risk coe�cient of �rm i,ERP =equity risk premium, andS =size premium.
For the small business subgroup analysis, size premia are taken from Ibbotson Associates'Stocks, Bonds, Bills, and In�ation Yearbook (Ibbotson Associates 2001 - 2013). Using the abovemodi�ed CAPM equation, size premia are combined with Damodaran Online data to calculaterevised discount rate distributions by sector that are speci�cally relevant to small businesses.Within the �rm-level Damodaran Online dataset, small companies are identi�ed by their marketcapitalization. Size premia and the de�nition of �small� companies vary over time, as shown inTable 4.1.
The real weighted average cost of capital is then estimated for each �rm, using the cost ofequity including a size premium, rather than the standard CAPM cost of equity.17 Table 4.1presents estimates of the discount rates for entire sectors, small companies speci�cally, and thesmall company discount rate premium (i.e., the di�erence between the small company discountrate and the average discount rate for each sector).
16Note that this section describes the process of estimating small company discount rates by sector. The processof mapping these rates to the appropriate items of the LCC building sample is provided separately in appendix B.
17As in section 2, the weighted average cost of capital is de�ned as a shared weighted average of the cost of equityand cost of debt for each �rm.
9

Table 4.1: Size Premia and Decile De�nitionsYear Max. Market
Capitalization(Decile 10, $million)
Max. MarketCapitalization
(Decile 10, $million)
Size Premium(Deciles 9,10
�Microcap�, %)
2001 84.5 192.6 2.622002 141.5 314.0 3.532003 166.4 330.6 4.012004 262.7 505.4 4.022005 264.9 586.4 3.952006 314.4 626.9 3.882007 363.5 723.3 3.652008 218.5 456.3 3.742009 214.1 431.3 3.992010 235.6 477.5 4.072011 206.8 422.8 3.89201218 253.8 514.2 3.81
To estimate the impact of standards speci�cally on small businesses, the small company discountrates for each sector are input to the Life-Cycle Cost and Payback Period analysis instead of thesector average discount rates.
The small company discount rate premium is the di�erence between the weighted average costof capital for decile 9-10 companies in a sector and that of the full sample of commercial �rms inthe sector. Relying only on the original CAPM model (without size premium modi�er) would leadto underestimation of discount rates for small companies by approximately 1-3%, depending onthe sector in question.
Table 4.2: Comparison of Small Business and Full Commercial Sample: Weighted Average Cost ofCapital by Sector
Sector Sector #All CompanyWACC (%)
SmallCompanyWACC (%)
Small CompanyAvg. DR
Premium (%)
O�ce 2 6.04 7.15 1.11
Food Sales 6 5.52 7.30 1.78
Health Care 8 5.53 8.56 3.03
Warehouse 11 6.01 9.10 3.09
Public Assembly 13 6.31 7.30 0.99
Food Service 15 5.73 8.21 2.47
Lodging 18 6.99 7.74 0.75
Retail (Mall) 24 6.36 8.17 1.81
Retail (Other) 25 5.89 8.35 2.45
Service 26 6.25 7.61 1.36
Other 91 6.02 7.78 1.76
Industrial N/A 6.00 8.45 2.45
10

5 Discussion: Planning for Future Updates
In the near term, the discount rate distributions presented in this report (based on 2004-2013 �rmbetas, stock value deviations, and debt to equity ratios; risk-free rates from 40-year geometricaverage returns for 10-year Treasury bill; equity risk premia calculated from di�erence in 40-yrgeometric average of risk-free rate and stock market return; size premia from 1926-2012) can beexpected to reasonably represent the �nancial environment of U.S. �rms in the period covered inthe LCC analysis. However, over time it is likely that these distributions and their underlying datawill become outdated. Unless detailed company-level �nancial data again becomes available fromDamodaran Online (or another publicly available source), we will need to consider alternative datasources and methods to estimate commercial discount rates for e�ciency standards analysis.
Two promising options include using Damodaran Online's sector level cost of capital data orIbbotson Associates' cost of capital by SIC code.1920 However, both of these data sources arequite aggregated, and as such, they are less suited to constructing discount rate distributionsand to performing the small business discount rate estimation. Damodaran Online sector data isexpected to continue to be updated annually and publicly available for the foreseeable future. Ithas the additional advantage of sharing sector naming conventions with the detailed �rm-level datafor which we have already determined mapping to CBECS Principal Building Activities. IbbotsonAssociates' data is available at a somewhat more disaggregated level as compared to DamodaranOnline sector data (reported for major SIC codes and small versus large companies comparison).However, Ibbotson Associates data would need to be purchased each year and do not allow for theconstruction of discount rate distributions as currently applied in the LCC.
Due to cost considerations and data granularity, the discount rate distributions calculatedfrom �rm-level Damodaran Online data should continue to be applied in upcoming analyses atleast through 2018.21
19http://pages.stern.nyu.edu/~adamodar/ (Data => Current Data => Costs of Capital by Industry; Data =>Archived Data => Costs of Capital by Industry)
20Note that a third option could be to attempt to build our own version of Damodaran's �rm-level data setby purchasing data from the underlying data sources, listed at Damodaran Online as: Bloomberg, Morningstar,Capital IQ and Compustat. This option is likely to costly and complicated.
21This date is approximately 5 years after the data period concludes. While the economic and policy environmentsurrounding U.S. commercial and industrial business may alter in the next �ve years, it is important to considerthat the 2004-2013 period included in the commercial discount rate distributions already incorporates impacts of arelatively strong economy slipping into recession and subsequently beginning recovery.
11
References
• Board of Governors of the Federal Reserve System. (2014). "H.15 Historical Data Selected In-terest Rates." Retrieved December, 2014, from http://www.federalreserve.gov/releases/h15/data.htm.
• Damodaran Online. (2004-2013). "The Data Page: Cost of Capital by Industry Sector."Retrieved March, 2014, from http://pages.stern.nyu.edu/~adamodar/.
• Damodaran Online. (2013). "Data Page: Historical Returns on Stocks, Bonds and Bills-United States." Retrieved March, 2014, from http://pages.stern.nyu.edu/~adamodar/.
• Fama, E. and K. French (1992). "The Cross-Section of Expected Stock Returns." The Journalof Finance 47(2).
• Federal Reserve Board (2005). Federal Reserve Bank Services Private Sector AdjustmentFactor, 2005. Washington, D.C. Docket No.OP-1229.
• French, C. (2003). "The Treynor Capital Asset Pricing Model." Journal of InvestmentManagement 1(2): 60-72.
• Ibbotson Associates (2001 - 2013). SBBI Valuation Edition Yearbook. Chicago, IL.
• Ibbotson Associates (2009). Cost of Capital Yearbook. Chicago, IL.
• Ibbotson Associates (2009). SBBI Valuation Edition Yearbook. Chicago, IL.
• Lintner, J. (1965). "The Valuation of Risk Assets and the Selection of Risky Investmentsin Stock Portfolios and Capital Budgets." The Review of Economics and Statistics 47(1):13-37.
• Markowitz, H. (1952). "Portfolio Selection." Journal of Finance 12: 71-91.
• Modigliani, F. and M. Miller (1958). "The Cost of Capital, Corporations Finance and theTheory of Investment." American Economic Review 48(3): 261-297.
• Mossin, J. (1966). "Equilibrium in a Capital Asset Market." Econometrica 34(4): 768-783.
• Perold, A. (2004). "The Capital Asset Pricing Model." Journal of Economic Perspectives18(3): 3-24.
• Sharpe, W. (1964). "Capital Asset Prices: A Theory of Market Equilibrium under Conditionsof Risk." The Journal of Finance 19(3): 425-442.
• Stone, B. (1970). Risk, Return, and Equilibrium: A General Single-Period Theory of AssetSelection and Capital Market Equilibrium, The MIT Press.
• Sullivan, E. J. (2006). A Brief History of the Capital Asset Pricing Model. Association ofPennsylvania University Business and Economic Faculties.
• Treynor, J. (1999). Toward a Theory of Market Value of Risky Assets. Asset Pricing andPortfolio Performance. R. Korajczyk. London.
• U.S. Census Bureau (2007). Establishment and Firm Size (Including Legal Form of Organi-zation), 2007 Economic Census, Arts, Entertainment, and Recreation Subject Series.
• U.S. O�ce of Management and Budget. (2014). "Circular A-4: Regulatory Analysis,Appendix C: Real Interest Rates on Treasury Notes and Bonds of Speci�ed Maturities."Retrieved July, 2015, from http://www.whitehouse.gov/omb/circulars_a094/a94_appx-c.
12
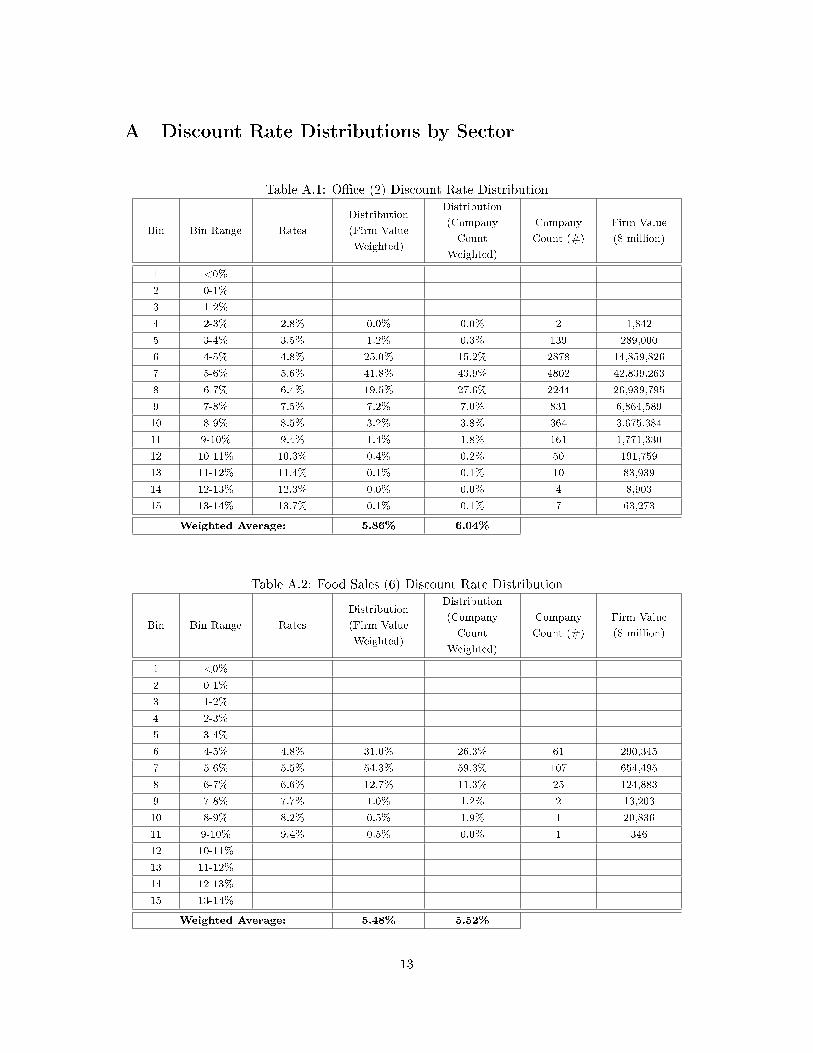
A Discount Rate Distributions by Sector
Table A.1: O�ce (2) Discount Rate Distribution
Bin Bin Range Rates
Distribution
(Firm Value
Weighted)
Distribution
(Company
Count
Weighted)
Company
Count (#)
Firm Value
($ million)
1 <0%
2 0-1%
3 1-2%
4 2-3% 2.8% 0.0% 0.0% 2 1,842
5 3-4% 3.5% 1.2% 0.3% 139 289,000
6 4-5% 4.8% 25.0% 15.2% 2878 14,859,826
7 5-6% 5.6% 41.8% 43.9% 4802 42,839,263
8 6-7% 6.4% 19.5% 27.6% 2244 26,939,795
9 7-8% 7.5% 7.2% 7.0% 831 6,864,589
10 8-9% 8.5% 3.2% 3.8% 364 3,675,384
11 9-10% 9.4% 1.4% 1.8% 161 1,771,330
12 10-11% 10.3% 0.4% 0.2% 50 191,759
13 11-12% 11.4% 0.1% 0.1% 10 83,939
14 12-13% 12.3% 0.0% 0.0% 4 8,903
15 13-14% 13.7% 0.1% 0.1% 7 63,273
Weighted Average: 5.86% 6.04%
Table A.2: Food Sales (6) Discount Rate Distribution
Bin Bin Range Rates
Distribution
(Firm Value
Weighted)
Distribution
(Company
Count
Weighted)
Company
Count (#)
Firm Value
($ million)
1 <0%
2 0-1%
3 1-2%
4 2-3%
5 3-4%
6 4-5% 4.8% 31.0% 26.3% 61 290,345
7 5-6% 5.5% 54.3% 59.3% 107 654,495
8 6-7% 6.6% 12.7% 11.3% 25 124,883
9 7-8% 7.7% 1.0% 1.2% 2 13,203
10 8-9% 8.2% 0.5% 1.9% 1 20,836
11 9-10% 9.4% 0.5% 0.0% 1 346
12 10-11%
13 11-12%
14 12-13%
15 13-14%
Weighted Average: 5.48% 5.52%
13

Table A.3: Health Care (8) Discount Rate Distribution
Bin Bin Range Rates
Distribution
(Firm Value
Weighted)
Distribution
(Company
Count
Weighted)
Company
Count (#)
Firm Value
($ million)
1 <0%
2 0-1%
3 1-2%
4 2-3% 3.0% 0.1% 0.0% 2 23
5 3-4% 3.3% 1.9% 0.2% 43 14,409
6 4-5% 4.8% 20.2% 29.6% 459 2,547,064
7 5-6% 5.5% 49.9% 52.2% 1136 4,495,187
8 6-7% 6.3% 19.1% 9.6% 435 828,726
9 7-8% 7.5% 6.0% 7.0% 137 598,175
10 8-9% 8.4% 1.8% 1.3% 41 109,671
11 9-10% 9.4% 0.8% 0.1% 18 6,563
12 10-11% 10.4% 0.1% 0.0% 3 1,947
13 11-12% 11.1% 0.0% 0.0% 1 3,188
14 12-13% 12.7% 0.0% 0.0% 1 1,100
15 13-14%
Weighted Average: 5.67% 5.53%
Table A.4: Warehouse (11) Discount Rate Distribution
Bin Bin Range Rates
Distribution
(Firm Value
Weighted)
Distribution
(Company
Count
Weighted)
Company
Count (#)
Firm Value
($ million)
1 <0%
2 0-1%
3 1-2%
4 2-3%
5 3-4% 3.6% 1.0% 0.0% 3 46
6 4-5% 4.7% 16.9% 33.1% 53 276,556
7 5-6% 5.5% 33.8% 31.9% 106 266,499
8 6-7% 6.4% 22.0% 10.7% 69 89,110
9 7-8% 7.3% 14.6% 10.0% 46 83,849
10 8-9% 8.6% 6.4% 9.3% 20 77,803
11 9-10% 9.6% 4.8% 4.9% 15 40,971
12 10-11% 10.5% 0.3% 0.0% 1 59
13 11-12% 11.7% 0.3% 0.1% 1 706
14 12-13%
15 13-14%
Weighted Average: 6.24% 6.01%
14

Table A.5: Public Assembly (13) Discount Rate Distribution
Bin Bin Range Rates
Distribution
(Firm Value
Weighted)
Distribution
(Company
Count
Weighted)
Company
Count (#)
Firm Value
($ million)
1 <0%
2 0-1%
3 1-2%
4 2-3% 2.9% 0.1% 0.0% 1 1,627
5 3-4% 3.5% 0.8% 0.4% 11 33,322
6 4-5% 4.8% 19.0% 10.9% 248 949,484
7 5-6% 5.6% 40.2% 33.2% 524 2,904,006
8 6-7% 6.4% 26.3% 35.0% 343 3,060,165
9 7-8% 7.5% 8.2% 9.8% 107 861,404
10 8-9% 8.4% 3.4% 8.9% 44 779,801
11 9-10% 9.2% 1.2% 1.1% 16 97,422
12 10-11% 10.2% 0.7% 0.2% 9 14,142
13 11-12% 11.5% 0.1% 0.5% 1 40,882
14 12-13% 12.5% 0.1% 0.1% 1 4,783
15 13-14%
Weighted Average: 5.99% 6.31%
Table A.6: Education (14) Discount Rate Distribution
Bin Bin Range Rates
Distribution
(Year Count
Weighted)
Year Count
(#)
1 <0%
2 0-1%
3 1-2% 1.5% 12.9% 4
4 2-3% 2.8% 25.8% 8
5 3-4% 3.5% 45.2% 14
6 4-5% 4.1% 6.5% 2
7 5-6% 5.1% 6.5% 2
8 6-7% 6.3% 3.2% 1
9 7-8%
10 8-9%
11 9-10%
12 10-11%
13 11-12%
14 12-13%
15 13-14%
Weighted Average: 3.30%
15
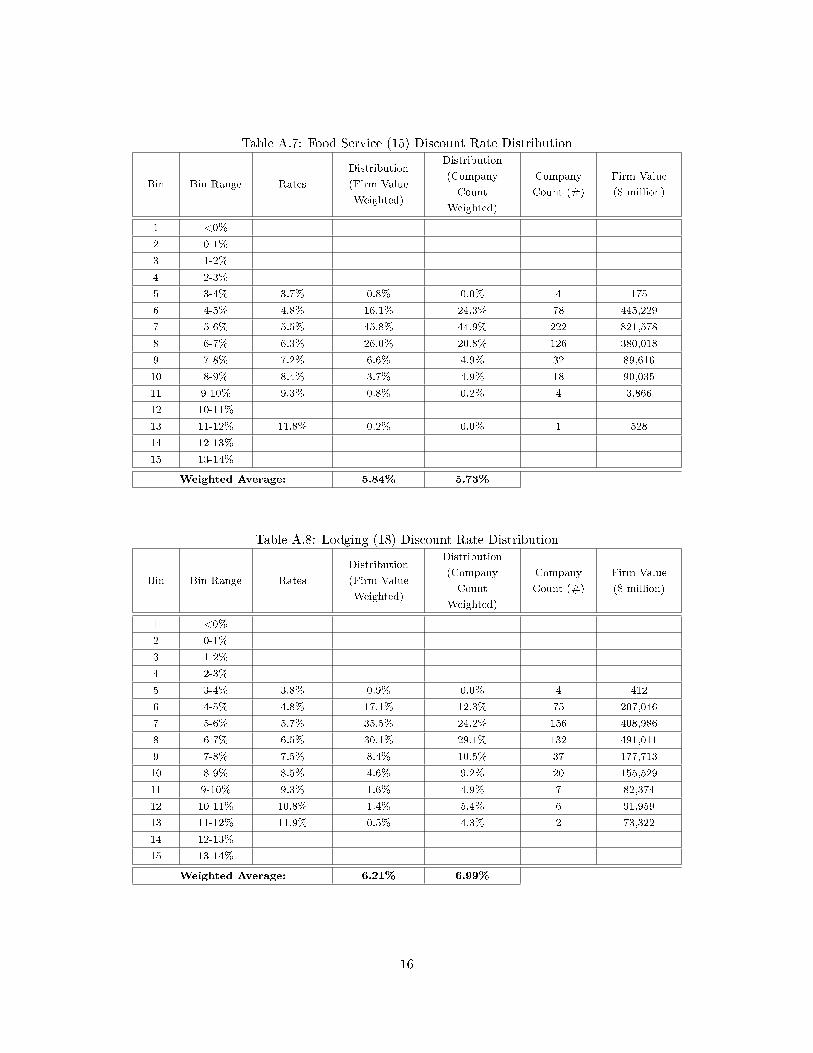
Table A.7: Food Service (15) Discount Rate Distribution
Bin Bin Range Rates
Distribution
(Firm Value
Weighted)
Distribution
(Company
Count
Weighted)
Company
Count (#)
Firm Value
($ million)
1 <0%
2 0-1%
3 1-2%
4 2-3%
5 3-4% 3.7% 0.8% 0.0% 4 175
6 4-5% 4.8% 16.1% 24.3% 78 445,229
7 5-6% 5.5% 45.8% 44.9% 222 821,578
8 6-7% 6.3% 26.0% 20.8% 126 380,018
9 7-8% 7.2% 6.6% 4.9% 32 89,616
10 8-9% 8.4% 3.7% 4.9% 18 90,035
11 9-10% 9.3% 0.8% 0.2% 4 3,866
12 10-11%
13 11-12% 11.8% 0.2% 0.0% 1 528
14 12-13%
15 13-14%
Weighted Average: 5.84% 5.73%
Table A.8: Lodging (18) Discount Rate Distribution
Bin Bin Range Rates
Distribution
(Firm Value
Weighted)
Distribution
(Company
Count
Weighted)
Company
Count (#)
Firm Value
($ million)
1 <0%
2 0-1%
3 1-2%
4 2-3%
5 3-4% 3.8% 0.9% 0.0% 4 412
6 4-5% 4.8% 17.1% 12.3% 75 207,046
7 5-6% 5.7% 35.5% 24.2% 156 408,986
8 6-7% 6.5% 30.1% 29.1% 132 491,011
9 7-8% 7.5% 8.4% 10.5% 37 177,713
10 8-9% 8.5% 4.6% 9.2% 20 155,529
11 9-10% 9.3% 1.6% 4.9% 7 82,374
12 10-11% 10.8% 1.4% 5.4% 6 91,959
13 11-12% 11.9% 0.5% 4.3% 2 73,322
14 12-13%
15 13-14%
Weighted Average: 6.21% 6.99%
16

Table A.9: Retail - Mall (24) Discount Rate Distribution
Bin Bin Range Rates
Distribution
(Firm Value
Weighted)
Distribution
(Company
Count
Weighted)
Company
Count (#)
Firm Value
($ million)
1 <0%
2 0-1%
3 1-2%
4 2-3%
5 3-4% 3.1% 0.5% 0.2% 4 3,241
6 4-5% 4.9% 18.1% 9.6% 144 150,998
7 5-6% 5.5% 36.5% 29.0% 291 454,649
8 6-7% 6.5% 30.5% 40.6% 243 637,795
9 7-8% 7.3% 10.3% 12.6% 82 197,925
10 8-9% 8.4% 2.6% 4.2% 21 66,564
11 9-10% 9.5% 1.0% 2.2% 8 34,492
12 10-11% 10.4% 0.4% 1.5% 3 23,944
13 11-12% 12.9% 0.1% 0.0% 1 43
14 12-13%
15 13-14%
Weighted Average: 6.02% 6.36%
Table A.10: Retail - Other (25) Discount Rate Distribution
Bin Bin Range Rates
Distribution
(Firm Value
Weighted)
Distribution
(Company
Count
Weighted)
Company
Count (#)
Firm Value
($ million)
1 <0%
2 0-1%
3 1-2%
4 2-3%
5 3-4% 3.9% 0.4% 0.0% 3 1,093
6 4-5% 4.8% 14.9% 20.7% 116 1,606,491
7 5-6% 5.6% 39.2% 45.4% 306 3,528,128
8 6-7% 6.4% 26.9% 22.1% 210 1,714,479
9 7-8% 7.4% 11.1% 6.6% 87 513,688
10 8-9% 8.5% 4.4% 1.8% 34 136,471
11 9-10% 9.2% 2.2% 3.2% 17 248,650
12 10-11% 10.3% 0.6% 0.2% 5 15,446
13 11-12% 11.3% 0.3% 0.0% 2 1,661
14 12-13% 14.3% 0.1% 0.0% 1 264
15 13-14%
Weighted Average: 6.14% 5.89%
17
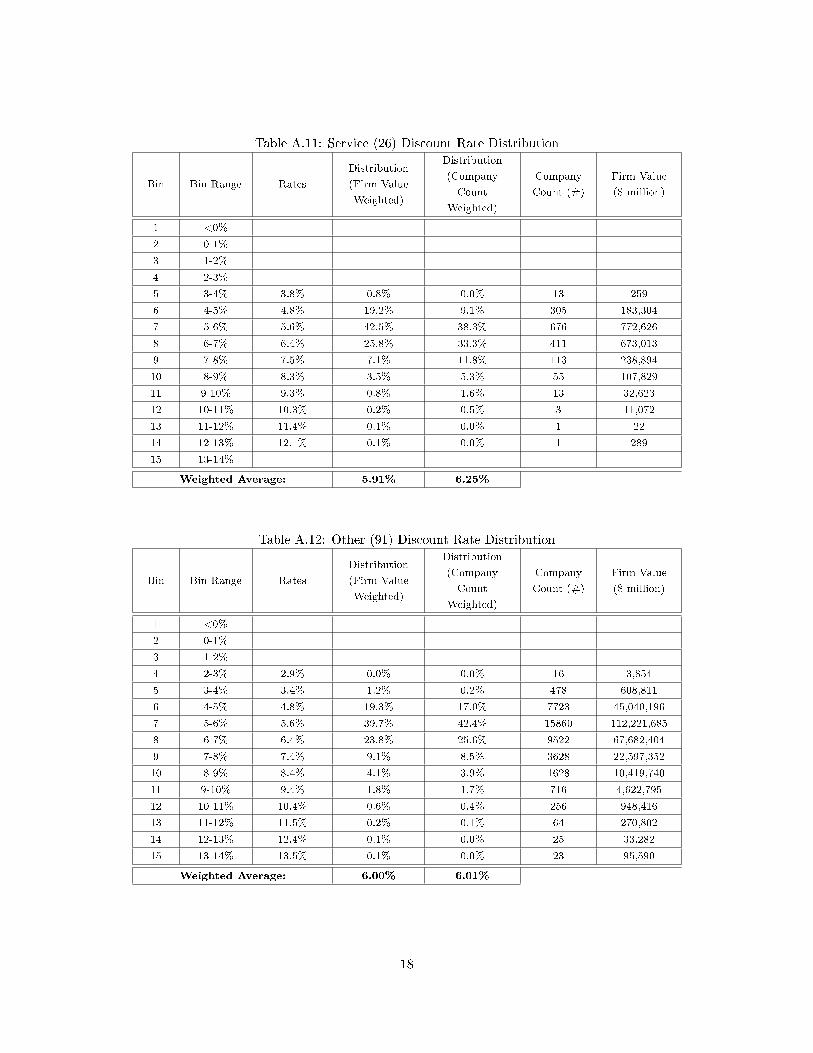
Table A.11: Service (26) Discount Rate Distribution
Bin Bin Range Rates
Distribution
(Firm Value
Weighted)
Distribution
(Company
Count
Weighted)
Company
Count (#)
Firm Value
($ million)
1 <0%
2 0-1%
3 1-2%
4 2-3%
5 3-4% 3.8% 0.8% 0.0% 13 259
6 4-5% 4.8% 19.2% 9.1% 305 183,304
7 5-6% 5.6% 42.5% 38.3% 676 772,626
8 6-7% 6.4% 25.8% 33.3% 411 673,013
9 7-8% 7.5% 7.1% 11.8% 113 238,894
10 8-9% 8.3% 3.5% 5.3% 55 107,829
11 9-10% 9.3% 0.8% 1.6% 13 32,623
12 10-11% 10.3% 0.2% 0.5% 3 11,072
13 11-12% 11.4% 0.1% 0.0% 1 22
14 12-13% 12.1% 0.1% 0.0% 1 289
15 13-14%
Weighted Average: 5.91% 6.25%
Table A.12: Other (91) Discount Rate Distribution
Bin Bin Range Rates
Distribution
(Firm Value
Weighted)
Distribution
(Company
Count
Weighted)
Company
Count (#)
Firm Value
($ million)
1 <0%
2 0-1%
3 1-2%
4 2-3% 2.9% 0.0% 0.0% 16 3,854
5 3-4% 3.4% 1.2% 0.2% 478 608,811
6 4-5% 4.8% 19.3% 17.0% 7723 45,040,196
7 5-6% 5.6% 39.7% 42.4% 15860 112,221,685
8 6-7% 6.4% 23.8% 25.6% 9522 67,682,404
9 7-8% 7.4% 9.1% 8.5% 3628 22,597,352
10 8-9% 8.4% 4.1% 3.9% 1628 10,419,740
11 9-10% 9.4% 1.8% 1.7% 716 4,622,795
12 10-11% 10.4% 0.6% 0.4% 256 948,416
13 11-12% 11.5% 0.2% 0.1% 64 270,802
14 12-13% 12.4% 0.1% 0.0% 25 33,282
15 13-14% 13.5% 0.1% 0.0% 23 95,590
Weighted Average: 6.00% 6.01%
18
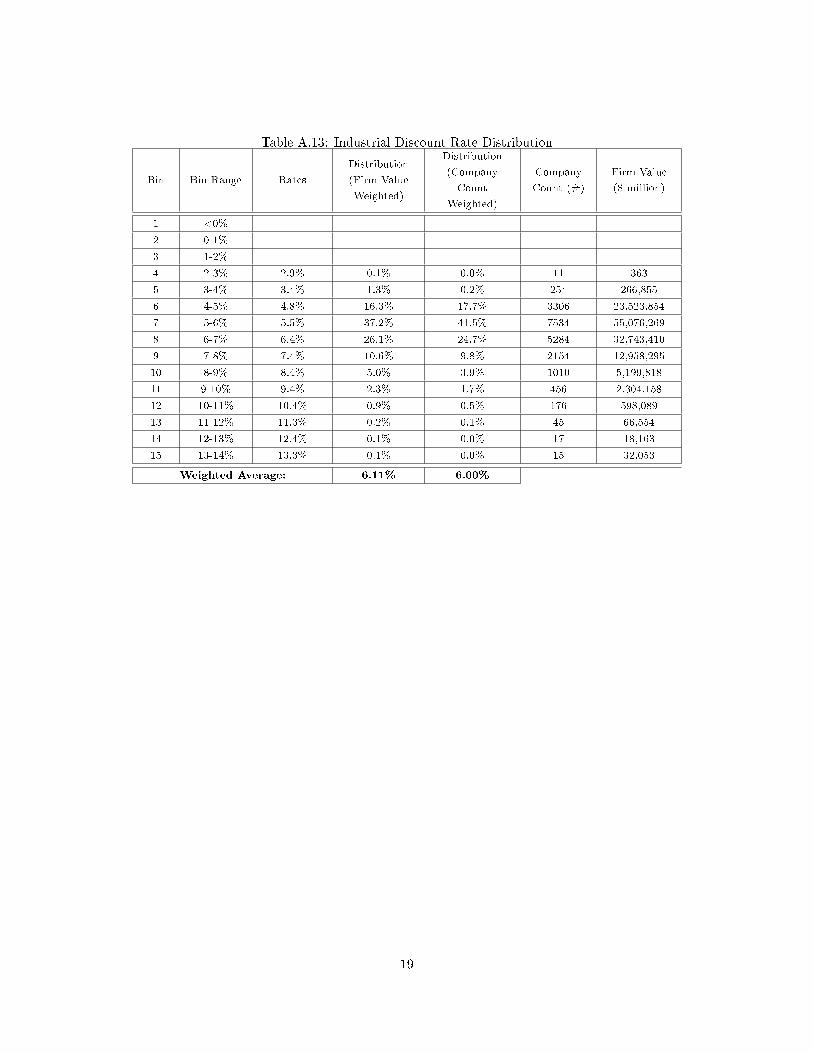
Table A.13: Industrial Discount Rate Distribution
Bin Bin Range Rates
Distribution
(Firm Value
Weighted)
Distribution
(Company
Count
Weighted)
Company
Count (#)
Firm Value
($ million)
1 <0%
2 0-1%
3 1-2%
4 2-3% 2.9% 0.1% 0.0% 11 363
5 3-4% 3.4% 1.3% 0.2% 254 266,855
6 4-5% 4.8% 16.3% 17.7% 3306 23,523,854
7 5-6% 5.5% 37.2% 41.5% 7534 55,076,269
8 6-7% 6.4% 26.1% 24.7% 5284 32,743,410
9 7-8% 7.4% 10.6% 9.8% 2154 12,958,295
10 8-9% 8.4% 5.0% 3.9% 1010 5,199,818
11 9-10% 9.4% 2.3% 1.7% 456 2,304,158
12 10-11% 10.4% 0.9% 0.5% 176 598,089
13 11-12% 11.3% 0.2% 0.1% 45 66,554
14 12-13% 12.4% 0.1% 0.0% 17 18,163
15 13-14% 13.3% 0.1% 0.0% 15 32,053
Weighted Average: 6.11% 6.00%
19
B Additional Small Business Discount Rate Information
This appendix provides additional information on discount rates used in the small business sub-group analysis. The �rst subsection describes the process of identifying small businesses in the LCCbuilding sample. The second subsection provides the full small business discount rate distributionsby sector.
B.1 Mapping to Small Businesses in the LCC Building Sample
In order to evaluate the life-cycle cost implications of higher small business discount rates, buildingslikely to contain small businesses must be identi�ed from the LCC building sample. To identify suchbuildings, Small Business Administration (SBA) size standards are used to de�ne which businessentities are considered to be small. The SBA establishes size standards for types of economicactivity, or industry, under the North American Industry Classi�cation System (NAICS).2223
In previous e�ciency standards analysis, industries occupying the following CBECS buildingtypes have been considered in the small business subgroup: public assembly, health care, lodging,food services, o�ce, retail, and warehouses. For each of these building types, DOE selectedand assigned speci�c representative economic activities from the NAICS industry de�nitions, assummarized in Table B.1.
22Title 13, Code of Federal Regulations, Chapter I-Small Business Administration, Part 121-Small BusinessAdministration, Subpart A-Size Eligibility Provisions and Standards.
23Note that SBA size standards are expressed in terms of company dollars per year of revenue while CBECSallows for the identi�cation of number of employees per building.
20
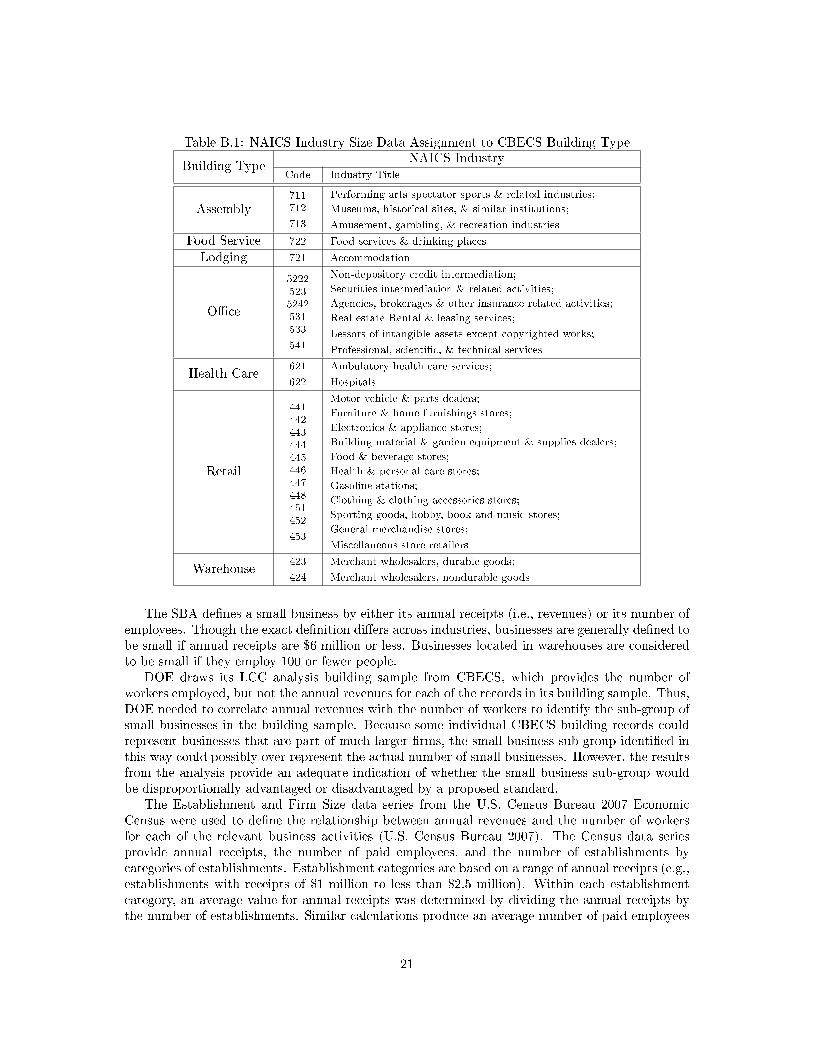
Table B.1: NAICS Industry Size Data Assignment to CBECS Building Type
Building TypeNAICS Industry
Code Industry Title
Assembly711712
713
Performing arts spectator sports & related industries;
Museums, historical sites, & similar institutions;
Amusement, gambling, & recreation industries
Food Service 722 Food services & drinking places
Lodging 721 Accommodation
O�ce
52225235242531533
541
Non-depository credit intermediation;
Securities intermediation & related activities;
Agencies, brokerages & other insurance related activities;
Real estate Rental & leasing services;
Lessors of intangible assets except copyrighted works;
Professional, scienti�c, & technical services
Health Care621
622
Ambulatory health care services;
Hospitals
Retail
441442443444445446447448451452
453
Motor vehicle & parts dealers;
Furniture & home furnishings stores;
Electronics & appliance stores;
Building material & garden equipment & supplies dealers;
Food & beverage stores;
Health & personal care stores;
Gasoline stations;
Clothing & clothing accessories stores;
Sporting goods, hobby, book and music stores;
General merchandise stores;
Miscellaneous store retailers
Warehouse423
424
Merchant wholesalers, durable goods;
Merchant wholesalers, nondurable goods
The SBA de�nes a small business by either its annual receipts (i.e., revenues) or its number ofemployees. Though the exact de�nition di�ers across industries, businesses are generally de�ned tobe small if annual receipts are $6 million or less. Businesses located in warehouses are consideredto be small if they employ 100 or fewer people.
DOE draws its LCC analysis building sample from CBECS, which provides the number ofworkers employed, but not the annual revenues for each of the records in its building sample. Thus,DOE needed to correlate annual revenues with the number of workers to identify the sub-group ofsmall businesses in the building sample. Because some individual CBECS building records couldrepresent businesses that are part of much larger �rms, the small business sub-group identi�ed inthis way could possibly over-represent the actual number of small businesses. However, the resultsfrom the analysis provide an adequate indication of whether the small business sub-group wouldbe disproportionally advantaged or disadvantaged by a proposed standard.
The Establishment and Firm Size data series from the U.S. Census Bureau 2007 EconomicCensus were used to de�ne the relationship between annual revenues and the number of workersfor each of the relevant business activities (U.S. Census Bureau 2007). The Census data seriesprovide annual receipts, the number of paid employees, and the number of establishments bycategories of establishments. Establishment categories are based on a range of annual receipts (e.g.,establishments with receipts of $1 million to less than $2.5 million). Within each establishmentcategory, an average value for annual receipts was determined by dividing the annual receipts bythe number of establishments. Similar calculations produce an average number of paid employees
21

for each establishment category.Table A.2 provides a listing of establishment categories for Lodging (NAICS code 72, and
subcodes) in the Economic Census. The primary data in Table A.2 are drawn directly from theAccommodation Establishment and Firm Size data series. The derived data in the right-handcolumns (average receipts and average number of employees) are calculated from the Census data.Note that the upper limit of what is generally considered a small business ($6 million annualreceipts) falls within the establishment category of $5 million to $9.99 million.
Table B.2: Example of Establishment Categories (NAICS 72)Primary Data (2007 Census, NAICS 72) Derived Data
Size by Sales Value # Firms Total Sales
($1000)
Number of
Employees
Average
Sales ($)
Average
Employees
Establishments with sales
less than $10,000
1,813 10,299 1,871 5,681 1
Establishments with sales of
$10,000 to $24,999
5,578 93,379 6,906 16,741 1
Establishments with sales of
$25,000 to $50,000
10,709 403,792 18,798 37,706 2
Establishments with sales of
$50,000 to $99,999
28,387 2,158,713 74,652 76,046 3
Establishments with sales of
$100,000 to $249,999
94,395 16,230,362 434,330 171,941 5
Establishments with sales of
$250,000 to $499,999
107,938 39,226,439 970,993 363,416 9
Establishments with sales of
$500,000 to $999,999
118,564 85,439,795 2,013,459 720,622 17
Establishments with sales of
$1,000,000 to $2,499,999
114,048 173,798,712 3,748,465 1,523,908 33
Establishments with sales of
$2,500,000 to $4,999,999
28,535 94,993,873 1,853,487 3,329,030 65
Establishments with sales of
$5,000,000 to $9,999,999
6,172 40,934,803 627,594 6,632,340 102
Establishments with sales of
$10,000,000 or more
3,466 133,267,583 1,286,875 38,449,966 371
By deriving the average receipts and numbers of employees for the establishment categorieswithin each of the NAICS industries listed in Table B.2, we create a data set from which to estimatethe relationship between sales (revenues) and number of employees (workers) for buildings in thesesectors (Figures B.1 - B.6).
22
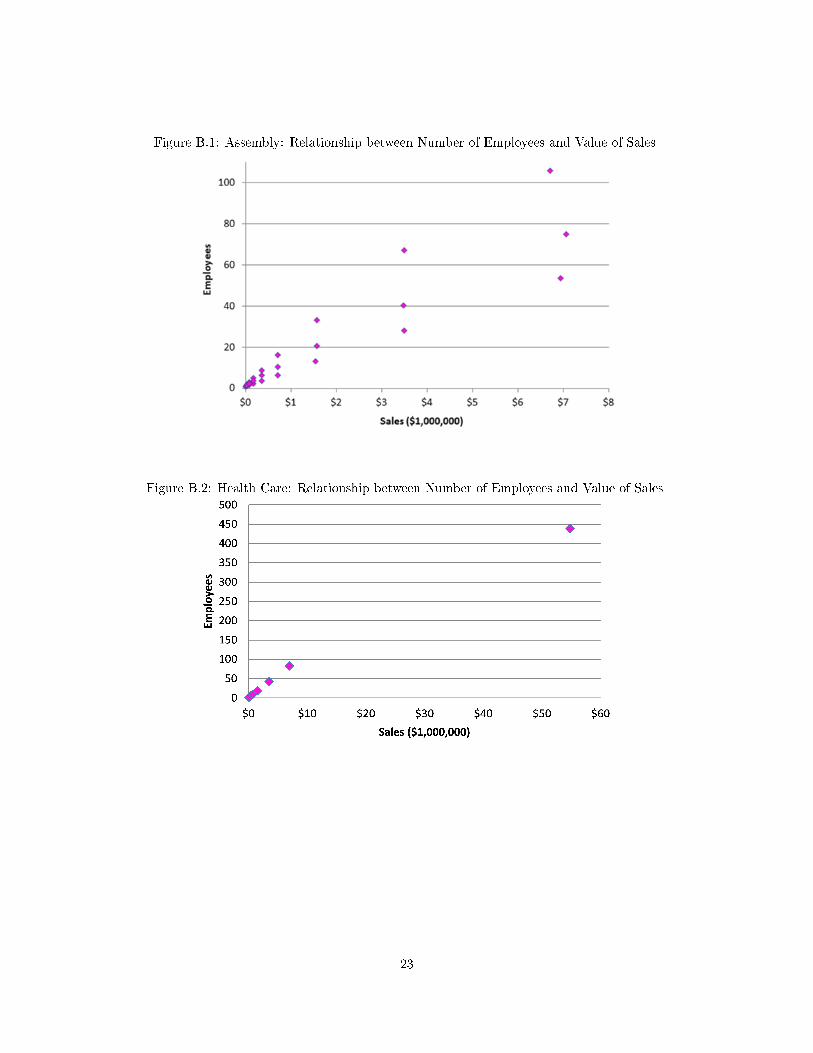
Figure B.1: Assembly: Relationship between Number of Employees and Value of Sales
Figure B.2: Health Care: Relationship between Number of Employees and Value of Sales
23
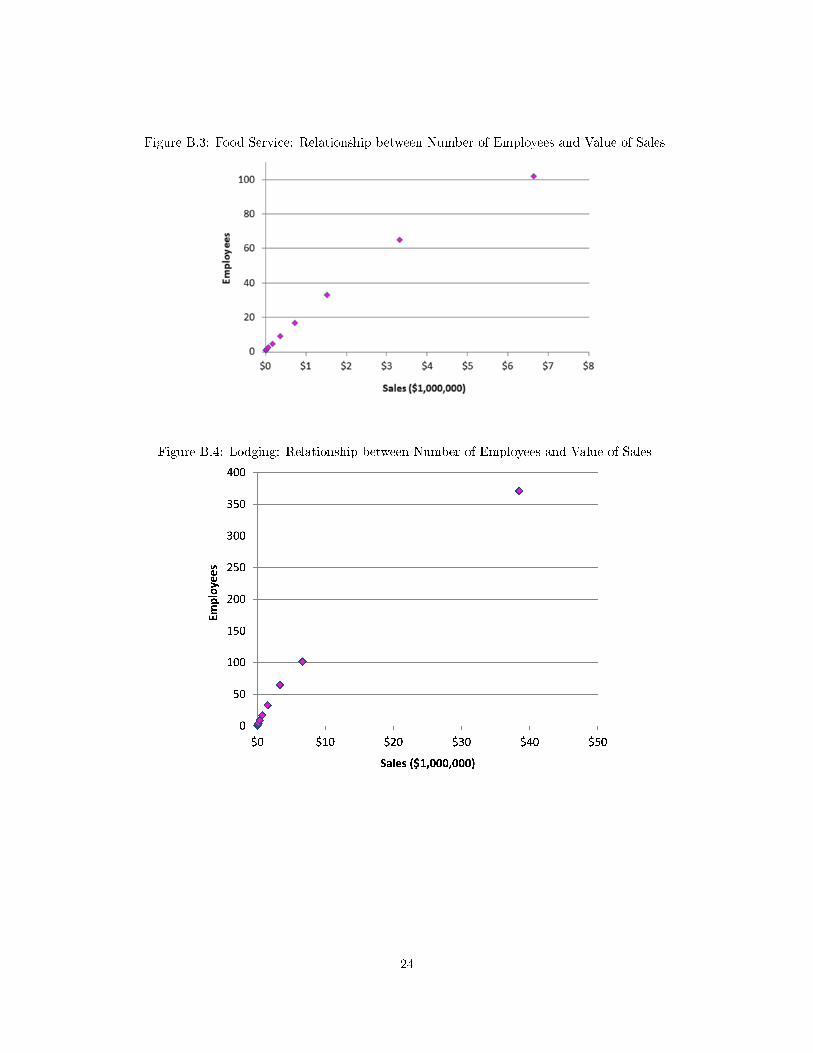
Figure B.3: Food Service: Relationship between Number of Employees and Value of Sales
Figure B.4: Lodging: Relationship between Number of Employees and Value of Sales
24

Figure B.5: O�ce: Relationship between Number of Employees and Value of Sales
Figure B.6: Retail: Relationship between Number of Employees and Value of Sales
The relationship between annual value of sales and number of employees for each building typethrough linear regression of the data in Figures B.1 - B.6. Based on the regression parameters,we then estimated the number of employees for each of the building types associated with annualsales at the upper limit of the SBA de�nition of a small business (Table B.3).
25

Table B.3: Maximum Number of Employees in Small Business by SectorSector Maximum Number
of Employees
Assembly 70Health Care 85Lodging 113Food Service 98O�ce 28Retail 32Warehouse 100
Using the maximum employee number from Table B.3, DOE was able to identify from itsbuilding sample which buildings could potentially be occupied by small businesses. It is importantto reiterate that this methodology is likely to overestimate the proportion of the total buildingsample composed of small businesses, as any small building will be �agged as a small business,even if it is in fact part of a major chain. However, of primary interest are the average �rm-levelimpacts, and the results from the analysis provide an adequate indication of any di�erential impacton the small business sub-group following a proposed standard.
26
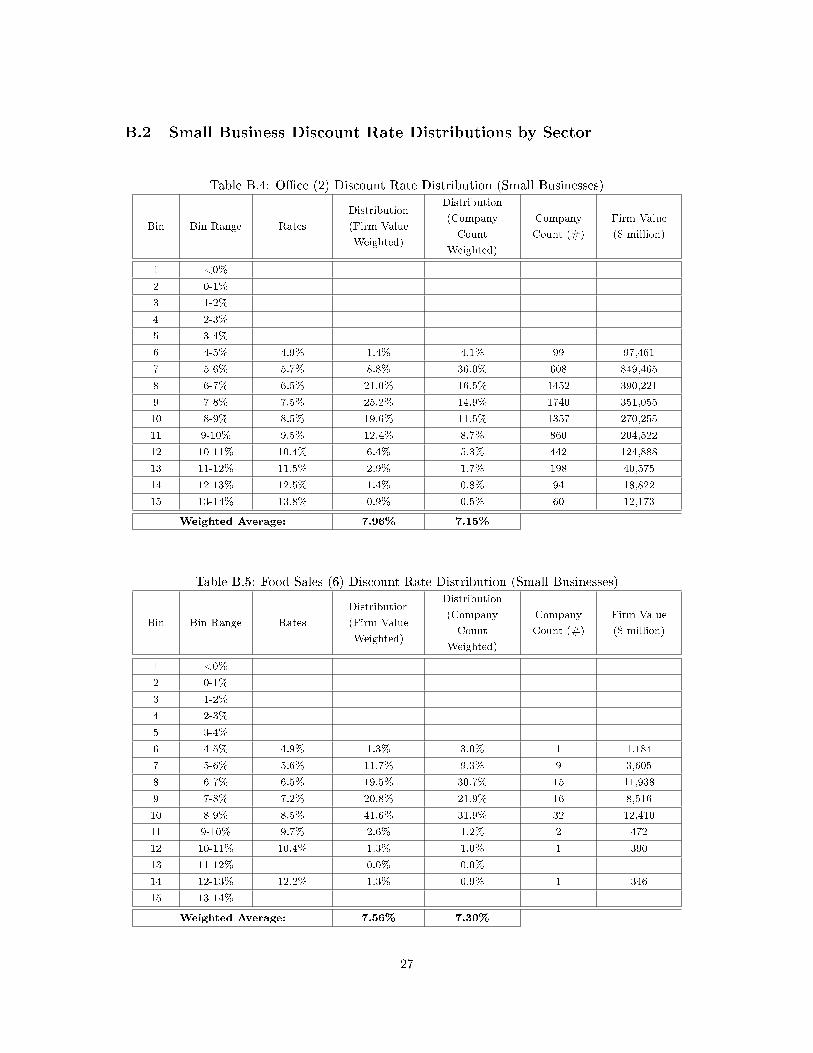
B.2 Small Business Discount Rate Distributions by Sector
Table B.4: O�ce (2) Discount Rate Distribution (Small Businesses)
Bin Bin Range Rates
Distribution
(Firm Value
Weighted)
Distribution
(Company
Count
Weighted)
Company
Count (#)
Firm Value
($ million)
1 <0%
2 0-1%
3 1-2%
4 2-3%
5 3-4%
6 4-5% 4.9% 1.4% 4.1% 99 97,461
7 5-6% 5.7% 8.8% 36.0% 608 849,465
8 6-7% 6.5% 21.0% 16.5% 1452 390,221
9 7-8% 7.5% 25.2% 14.9% 1740 351,055
10 8-9% 8.5% 19.6% 11.5% 1357 270,255
11 9-10% 9.5% 12.4% 8.7% 860 204,522
12 10-11% 10.4% 6.4% 5.3% 442 124,888
13 11-12% 11.5% 2.9% 1.7% 198 40,575
14 12-13% 12.5% 1.4% 0.8% 94 18,822
15 13-14% 13.8% 0.9% 0.5% 60 12,173
Weighted Average: 7.96% 7.15%
Table B.5: Food Sales (6) Discount Rate Distribution (Small Businesses)
Bin Bin Range Rates
Distribution
(Firm Value
Weighted)
Distribution
(Company
Count
Weighted)
Company
Count (#)
Firm Value
($ million)
1 <0%
2 0-1%
3 1-2%
4 2-3%
5 3-4%
6 4-5% 4.9% 1.3% 3.0% 1 1,184
7 5-6% 5.6% 11.7% 9.3% 9 3,605
8 6-7% 6.5% 19.5% 30.7% 15 11,938
9 7-8% 7.2% 20.8% 21.9% 16 8,516
10 8-9% 8.5% 41.6% 31.9% 32 12,410
11 9-10% 9.7% 2.6% 1.2% 2 472
12 10-11% 10.4% 1.3% 1.0% 1 390
13 11-12% 0.0% 0.0%
14 12-13% 12.2% 1.3% 0.9% 1 346
15 13-14%
Weighted Average: 7.56% 7.30%
27

Table B.6: Health Care (8) Discount Rate Distribution (Small Businesses)
Bin Bin Range Rates
Distribution
(Firm Value
Weighted)
Distribution
(Company
Count
Weighted)
Company
Count (#)
Firm Value
($ million)
1 <0%
2 0-1%
3 1-2%
4 2-3%
5 3-4%
6 4-5% 4.9% 1.5% 2.0% 21 4,016
7 5-6% 5.4% 4.5% 3.2% 62 6,457
8 6-7% 6.6% 12.3% 11.9% 168 23,607
9 7-8% 7.5% 18.7% 13.7% 256 27,214
10 8-9% 8.5% 29.1% 29.6% 398 58,989
11 9-10% 9.5% 21.3% 24.4% 291 48,525
12 10-11% 10.4% 7.8% 9.7% 107 19,249
13 11-12% 11.4% 2.9% 3.4% 39 6,770
14 12-13% 12.5% 1.5% 1.7% 20 3,448
15 13-14% 13.7% 0.4% 0.4% 6 730
Weighted Average: 8.39% 8.56%
Table B.7: Warehouse (11) Discount Rate Distribution (Small Businesses)
Bin Bin Range Rates
Distribution
(Firm Value
Weighted)
Distribution
(Company
Count
Weighted)
Company
Count (#)
Firm Value
($ million)
1 <0%
2 0-1%
3 1-2%
4 2-3%
5 3-4%
6 4-5% 5.0% 3.1% 4.4% 5 1,317
7 5-6% 5.4% 6.9% 5.4% 11 1,594
8 6-7% 6.4% 6.9% 4.9% 11 1,452
9 7-8% 7.4% 13.8% 14.1% 22 4,178
10 8-9% 8.6% 19.4% 18.4% 31 5,450
11 9-10% 9.6% 20.6% 18.5% 33 5,484
12 10-11% 10.4% 12.5% 14.8% 20 4,394
13 11-12% 11.3% 9.4% 10.6% 15 3,153
14 12-13% 12.4% 4.4% 5.6% 7 1,660
15 13-14% 13.3% 3.1% 3.3% 5 991
Weighted Average: 8.95% 9.10%
28

Table B.8: Public Assembly (13) Discount Rate Distribution (Small Businesses)
Bin Bin Range Rates
Distribution
(Firm Value
Weighted)
Distribution
(Company
Count
Weighted)
Company
Count (#)
Firm Value
($ million)
1 <0%
2 0-1%
3 1-2%
4 2-3%
5 3-4%
6 4-5% 4.9% 4.8% 7.1% 32 18,207
7 5-6% 5.6% 12.8% 21.0% 86 53,463
8 6-7% 6.4% 18.0% 20.6% 121 52,504
9 7-8% 7.5% 21.2% 17.6% 143 44,807
10 8-9% 8.4% 21.8% 16.2% 147 41,262
11 9-10% 9.4% 11.9% 9.4% 80 23,874
12 10-11% 10.3% 5.8% 4.8% 39 12,324
13 11-12% 11.5% 1.9% 2.2% 13 5,680
14 12-13% 12.3% 1.3% 0.9% 9 2,289
15 13-14% 13.6% 0.4% 0.3% 3 702
Weighted Average: 7.69% 7.30%
Table B.9: Food Service (15) Discount Rate Distribution (Small Businesses)
Bin Bin Range Rates
Distribution
(Firm Value
Weighted)
Distribution
(Company
Count
Weighted)
Company
Count (#)
Firm Value
($ million)
1 <0%
2 0-1%
3 1-2%
4 2-3%
5 3-4%
6 4-5% 4.9% 1.5% 2.4% 4 1,400
7 5-6% 5.7% 7.7% 9.1% 21 5,198
8 6-7% 6.6% 12.2% 13.8% 33 7,903
9 7-8% 7.5% 22.9% 22.3% 62 12,719
10 8-9% 8.5% 26.6% 21.2% 72 12,096
11 9-10% 9.5% 14.4% 17.2% 39 9,852
12 10-11% 10.5% 10.0% 10.0% 27 5,728
13 11-12% 11.5% 2.2% 1.8% 6 1,041
14 12-13% 12.3% 1.8% 1.2% 5 662
15 13-14% 15.1% 0.7% 1.0% 2 553
Weighted Average: 8.30% 8.21%
29
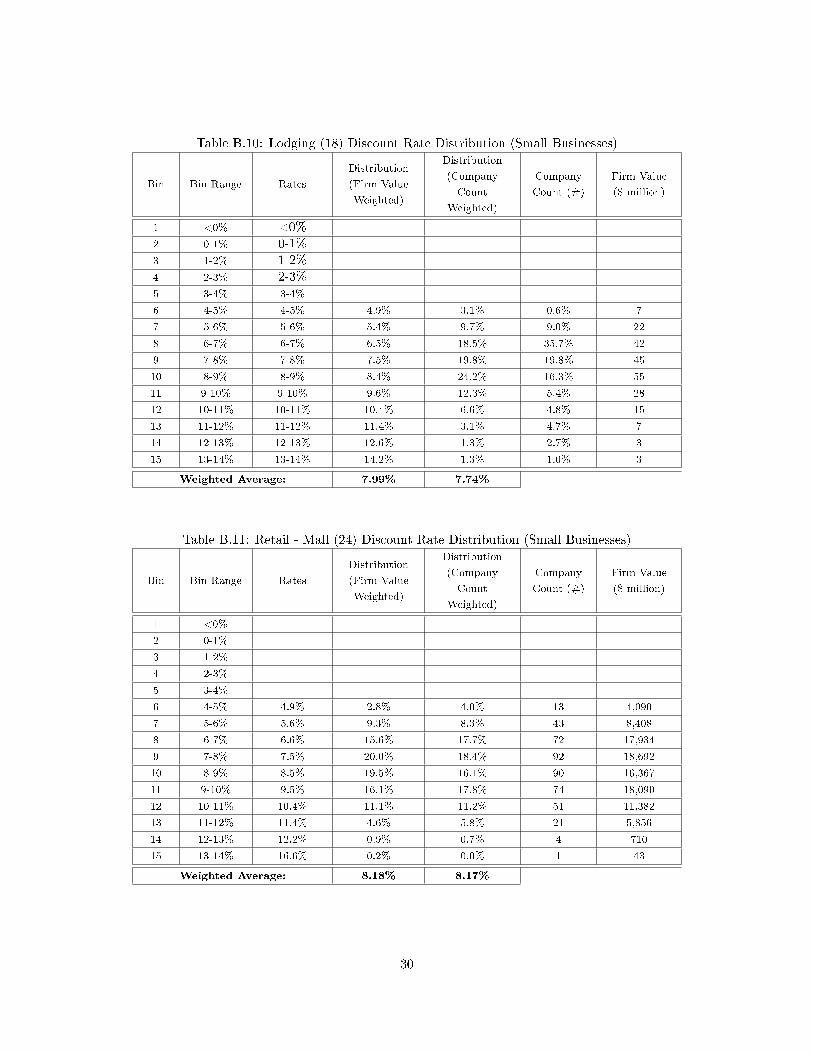
Table B.10: Lodging (18) Discount Rate Distribution (Small Businesses)
Bin Bin Range Rates
Distribution
(Firm Value
Weighted)
Distribution
(Company
Count
Weighted)
Company
Count (#)
Firm Value
($ million)
1 <0% <0%
2 0-1% 0-1%
3 1-2% 1-2%
4 2-3% 2-3%
5 3-4% 3-4%
6 4-5% 4-5% 4.9% 3.1% 0.6% 7
7 5-6% 5-6% 5.4% 9.7% 9.0% 22
8 6-7% 6-7% 6.5% 18.5% 35.7% 42
9 7-8% 7-8% 7.5% 19.8% 19.8% 45
10 8-9% 8-9% 8.4% 24.2% 16.3% 55
11 9-10% 9-10% 9.6% 12.3% 5.4% 28
12 10-11% 10-11% 10.4% 6.6% 4.8% 15
13 11-12% 11-12% 11.4% 3.1% 4.7% 7
14 12-13% 12-13% 12.6% 1.3% 2.7% 3
15 13-14% 13-14% 14.2% 1.3% 1.0% 3
Weighted Average: 7.99% 7.74%
Table B.11: Retail - Mall (24) Discount Rate Distribution (Small Businesses)
Bin Bin Range Rates
Distribution
(Firm Value
Weighted)
Distribution
(Company
Count
Weighted)
Company
Count (#)
Firm Value
($ million)
1 <0%
2 0-1%
3 1-2%
4 2-3%
5 3-4%
6 4-5% 4.9% 2.8% 4.0% 13 4,090
7 5-6% 5.6% 9.3% 8.3% 43 8,408
8 6-7% 6.6% 15.6% 17.7% 72 17,934
9 7-8% 7.5% 20.0% 18.4% 92 18,692
10 8-9% 8.5% 19.5% 16.1% 90 16,367
11 9-10% 9.5% 16.1% 17.8% 74 18,090
12 10-11% 10.4% 11.1% 11.2% 51 11,382
13 11-12% 11.4% 4.6% 5.8% 21 5,856
14 12-13% 12.2% 0.9% 0.7% 4 710
15 13-14% 16.6% 0.2% 0.0% 1 43
Weighted Average: 8.18% 8.17%
30
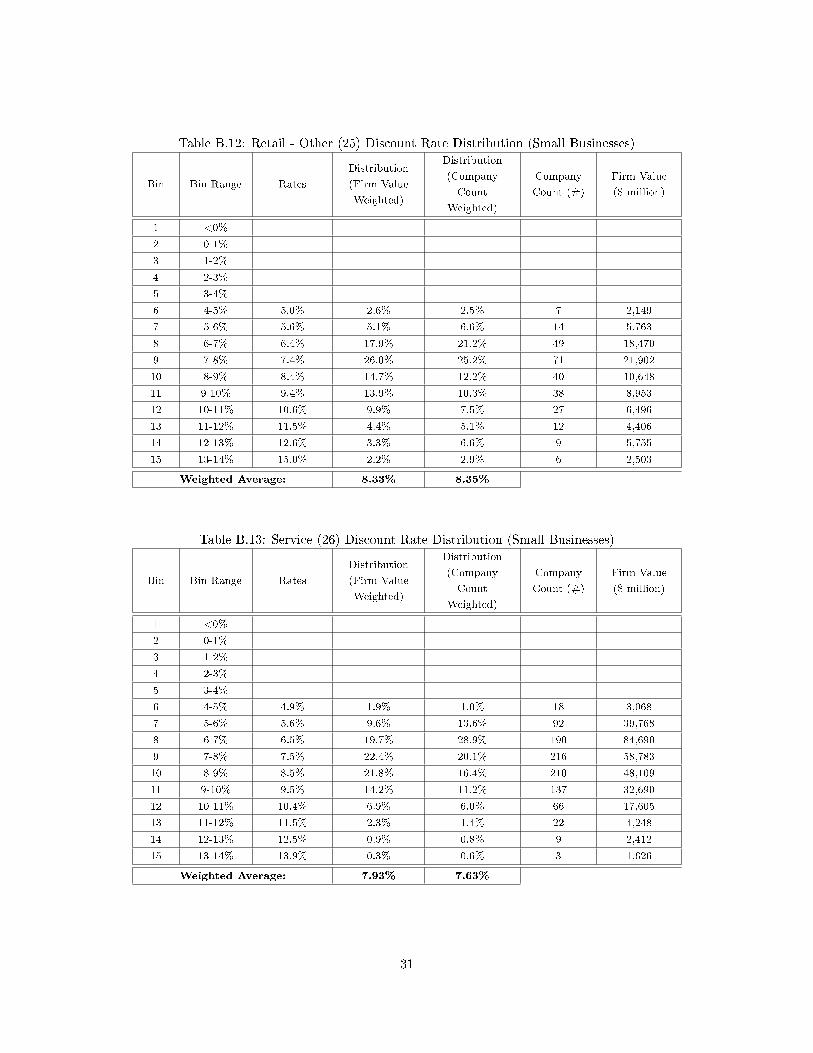
Table B.12: Retail - Other (25) Discount Rate Distribution (Small Businesses)
Bin Bin Range Rates
Distribution
(Firm Value
Weighted)
Distribution
(Company
Count
Weighted)
Company
Count (#)
Firm Value
($ million)
1 <0%
2 0-1%
3 1-2%
4 2-3%
5 3-4%
6 4-5% 5.0% 2.6% 2.5% 7 2,149
7 5-6% 5.6% 5.1% 6.6% 14 5,763
8 6-7% 6.4% 17.9% 21.2% 49 18,470
9 7-8% 7.4% 26.0% 25.2% 71 21,902
10 8-9% 8.4% 14.7% 12.2% 40 10,648
11 9-10% 9.4% 13.9% 10.3% 38 8,953
12 10-11% 10.6% 9.9% 7.5% 27 6,496
13 11-12% 11.5% 4.4% 5.1% 12 4,406
14 12-13% 12.6% 3.3% 6.6% 9 5,755
15 13-14% 15.0% 2.2% 2.9% 6 2,503
Weighted Average: 8.33% 8.35%
Table B.13: Service (26) Discount Rate Distribution (Small Businesses)
Bin Bin Range Rates
Distribution
(Firm Value
Weighted)
Distribution
(Company
Count
Weighted)
Company
Count (#)
Firm Value
($ million)
1 <0%
2 0-1%
3 1-2%
4 2-3%
5 3-4%
6 4-5% 4.9% 1.9% 1.0% 18 3,068
7 5-6% 5.6% 9.6% 13.6% 92 39,768
8 6-7% 6.5% 19.7% 28.9% 190 84,690
9 7-8% 7.5% 22.4% 20.1% 216 58,783
10 8-9% 8.5% 21.8% 16.4% 210 48,109
11 9-10% 9.5% 14.2% 11.2% 137 32,690
12 10-11% 10.4% 6.9% 6.0% 66 17,605
13 11-12% 11.5% 2.3% 1.4% 22 4,248
14 12-13% 12.5% 0.9% 0.8% 9 2,412
15 13-14% 13.9% 0.3% 0.6% 3 1,626
Weighted Average: 7.93% 7.63%
31

Table B.14: Other (91) Discount Rate Distribution (Small Businesses)
Bin Bin Range Rates
Distribution
(Firm Value
Weighted)
Distribution
(Company
Count
Weighted)
Company
Count (#)
Firm Value
($ million)
1 <0%
2 0-1%
3 1-2%
4 2-3%
5 3-4%
6 4-5% 4.9% 1.8% 3.5% 399 193,339
7 5-6% 5.6% 7.4% 20.9% 1641 1,153,617
8 6-7% 6.5% 15.6% 16.8% 3449 927,457
9 7-8% 7.5% 21.1% 16.3% 4644 898,628
10 8-9% 8.5% 21.4% 15.4% 4722 847,285
11 9-10% 9.5% 16.4% 13.0% 3626 718,599
12 10-11% 10.4% 8.9% 7.9% 1962 433,297
13 11-12% 11.5% 4.0% 3.4% 886 188,470
14 12-13% 12.5% 2.0% 1.7% 445 91,213
15 13-14% 13.9% 1.2% 1.0% 275 56,098
Weighted Average: 8.30% 67.78%
Table B.15: Industrial Discount Rate Distribution (Small Businesses)
Bin Bin Range Rates
Distribution
(Firm Value
Weighted)
Distribution
(Company
Count
Weighted)
Company
Count (#)
Firm Value
($ million)
1 <0%
2 0-1%
3 1-2%
4 2-3%
5 3-4%
6 4-5% 4.9% 1.8% 3.0% 192 60,052
7 5-6% 5.6% 6.3% 8.6% 673 174,348
8 6-7% 6.5% 12.2% 14.6% 1296 296,670
9 7-8% 7.5% 18.6% 16.7% 1981 338,535
10 8-9% 8.5% 21.5% 17.9% 2290 361,614
11 9-10% 9.5% 19.2% 17.9% 2044 362,772
12 10-11% 10.5% 10.9% 11.3% 1167 227,860
13 11-12% 11.5% 5.2% 5.6% 553 113,845
14 12-13% 12.5% 2.7% 2.6% 284 53,443
15 13-14% 13.8% 1.7% 1.8% 186 36,181
Weighted Average: 8.58% 8.45%
32