for financial as of sept3
TRANSCRIPT
8/11/2019 For Financial as of Sept3
http://slidepdf.com/reader/full/for-financial-as-of-sept3 1/27
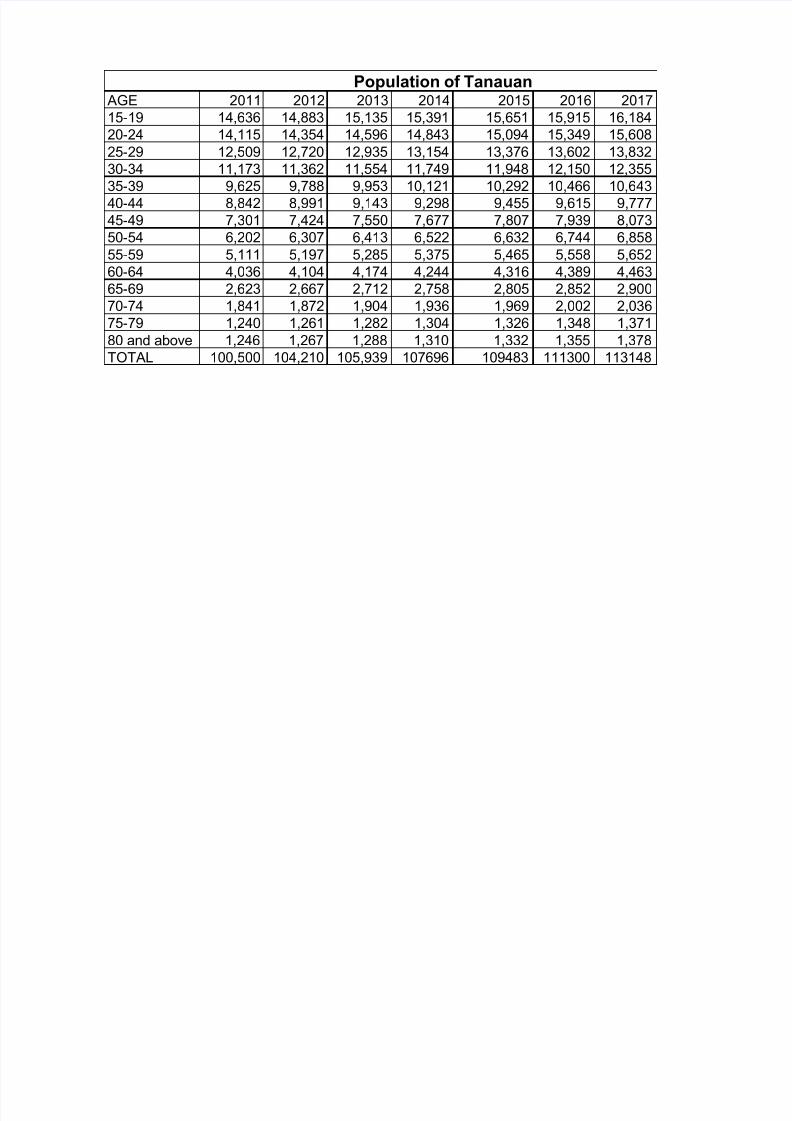
AGE 2011 2012 2013 2014 2015 2016 2017
15-19 14,636 14,883 15,135 15,391 15,651 15,915 16,184
20-24 14,115 14,354 14,596 14,843 15,094 15,349 15,608
25-29 12,509 12,720 12,935 13,154 13,376 13,602 13,832
30-34 11,173 11,362 11,554 11,749 11,948 12,150 12,355
35-39 9,625 9,788 9,953 10,121 10,292 10,466 10,643
40-44 8,842 8,991 9,143 9,298 9,455 9,615 9,777
45-49 7,301 7,424 7,550 7,677 7,807 7,939 8,073
50-54 6,202 6,307 6,413 6,522 6,632 6,744 6,858
55-59 5,111 5,197 5,285 5,375 5,465 5,558 5,652
60-64 4,036 4,104 4,174 4,244 4,316 4,389 4,463
65-69 2,623 2,667 2,712 2,758 2,805 2,852 2,900
70-74 1,841 1,872 1,904 1,936 1,969 2,002 2,036
75-79 1,240 1,261 1,282 1,304 1,326 1,348 1,371
80 and above 1,246 1,267 1,288 1,310 1,332 1,355 1,378
TOTAL 100,500 104,210 105,939 107696 109483 111300 113148
Population of Tanauan

8/11/2019 For Financial as of Sept3
http://slidepdf.com/reader/full/for-financial-as-of-sept3 2/27
2018 2019 AGE M F TOTAL AGE M
16,458 16,736 15-19 7,486 7,150 14,636 15-19 7486
15,872 16,140 20-24 6,957 7,158 14,115 20-24 6957
14,066 14,304 25-29 6,120 6,389 12,509 25-29 6120
12,564 12,776 30-34 5,394 5,779 11,173 30-34 5394
10,823 11,006 35-39 4,703 4,922 9,625 35-39 4703
9,943 10,111 40-44 4,360 4,482 8,842 40-44 4360
8,210 8,348 45-49 3,500 3,801 7,301 45-49 3500
6,974 7,092 50-54 3,042 3,160 6,202 50-54 3042
5,747 5,844 55-59 2,381 2,730 5,111 55-59 2381
4,538 4,615 60-64 1,800 2,236 4,036 60-64 1800
2,949 2,999 65-69 1,106 1,517 2,623 65-69 1106
2,070 2,105 70-74 728 1,113 1,841 70-74 728
1,394 1,418 75-79 438 802 1,240 75-79 438
1,401 1,425 80 and a 376 870 1,246 80 and a 376
115027 116938 TOTAL 100,500 TOTAL
Population 2011

8/11/2019 For Financial as of Sept3
http://slidepdf.com/reader/full/for-financial-as-of-sept3 3/27

8/11/2019 For Financial as of Sept3
http://slidepdf.com/reader/full/for-financial-as-of-sept3 4/27
AGE 2014 2015 2016 2017 2018 2019
15-19 15,697 16,067 16,447 16,835 17,232 17,639
20-24 15,138 15,495 15,861 16,235 16,619 17,011
25-29 13,416 13,732 14,056 14,388 14,728 15,075
30-34 11,983 12,266 12,555 12,851 13,155 13,465
35-39 10,323 10,566 10,816 11,071 11,332 11,60040-44 9,483 9,707 9,936 10,170 10,410 10,656
45-49 7,830 8,015 8,204 8,398 8,596 8,799
50-54 6,652 6,809 6,969 7,134 7,302 7,474
55-59 5,481 5,611 5,743 5,879 6,018 6,160
60-64 4,329 4,431 4,535 4,642 4,752 4,864
65-69 2,813 2,880 2,947 3,017 3,088 3,161
70-74 1,974 2,021 2,069 2,118 2,168 2,219
75-79 1,330 1,361 1,393 1,426 1,460 1,494
80 and above 1,336 1,368 1,400 1,433 1,467 1,502
TOTAL 107,785 110,328 112,932 115597 118325 121118
Population of Tanauan

8/11/2019 For Financial as of Sept3
http://slidepdf.com/reader/full/for-financial-as-of-sept3 5/27
AGE 2011 2012 2013 2014 2015 2016 2017 2018 2019
15-19 14,636 14,981 15,335 15,697 16,067 16,447 16,835 17,232 17,639
20-24 14,115 14,448 14,789 15,138 15,495 15,861 16,235 16,619 17,011
25-29 12,509 12,804 13,106 13,416 13,732 14,056 14,388 14,728 15,075
30-34 11,173 11,437 11,707 11,983 12,266 12,555 12,851 13,155 13,465
35-39 9,625 9,852 10,085 10,323 10,566 10,816 11,071 11,332 11,60040-44 8,842 9,051 9,264 9,483 9,707 9,936 10,170 10,410 10,656
45-49 7,301 7,473 7,650 7,830 8,015 8,204 8,398 8,596 8,799
50-54 6,202 6,348 6,498 6,652 6,809 6,969 7,134 7,302 7,474
55-59 5,111 5,232 5,355 5,481 5,611 5,743 5,879 6,018 6,160
60-64 4,036 4,131 4,229 4,329 4,431 4,535 4,642 4,752 4,864
65-69 2,623 2,685 2,748 2,813 2,880 2,947 3,017 3,088 3,161
70-74 1,841 1,884 1,929 1,974 2,021 2,069 2,118 2,168 2,219
75-79 1,240 1,269 1,299 1,330 1,361 1,393 1,426 1,460 1,494
80 and a 1,246 1,275 1,306 1,336 1,368 1,400 1,433 1,467 1,502
TOTAL 100,500 102,872 105,300 107,785 110,328 112,932 115,597 118,325 121,118

8/11/2019 For Financial as of Sept3
http://slidepdf.com/reader/full/for-financial-as-of-sept3 6/27
AGE 2014 2015 2016 2017 2018 2019
15-19 15,697 16,067 16,447 16,835 17,232 17,639
20-24 15,138 15,495 15,861 16,235 16,619 17,011
25-29 13,416 13,732 14,056 14,388 14,728 15,075
30-34 11,983 12,266 12,555 12,851 13,155 13,465
35-39 10,323 10,566 10,816 11,071 11,332 11,60040-44 9,483 9,707 9,936 10,170 10,410 10,656
45-49 7,830 8,015 8,204 8,398 8,596 8,799
50-54 6,652 6,809 6,969 7,134 7,302 7,474
55-59 5,481 5,611 5,743 5,879 6,018 6,160
60-64 4,329 4,431 4,535 4,642 4,752 4,864
65-69 2,813 2,880 2,947 3,017 3,088 3,161
TOTAL 105,158 107,593 110,086 112,637 115,249 117,922
AGE 2015 2016 2017 2018 201915-19 16,067 16,447 16,835 17,232 17,639
20-24 15,495 15,861 16,235 16,619 17,011
25-29 13,732 14,056 14,388 14,728 15,075
30-34 12,266 12,555 12,851 13,155 13,465
35-39 10,566 10,816 11,071 11,332 11,600
40-44 9,707 9,936 10,170 10,410 10,656
45-49 8,015 8,204 8,398 8,596 8,799
50-54 6,809 6,969 7,134 7,302 7,474
TOTAL 94,672 96,860 99,099 101,391 103,738
Population of Tanauan
Population of Tanauan

8/11/2019 For Financial as of Sept3
http://slidepdf.com/reader/full/for-financial-as-of-sept3 7/27
Year Population GMAR Average Consumption
2015 94,672 53% 31
2016 96,860 53% 31
2017 99,099 53% 31
2018 101,391 53% 31
2019 103,738 53% 31
Number of
times to
spend in KTV
per week
Number of
responsesTotal per week Converted per year
1 130 130 6760
2 28 56 2912
3 14 42 2184
4 2 8 416
TOTAL 12272Divided by no.
of
respondents 398 Average
Consumption 31
Year Projected SalesProjected
DemandMarket Share
2014 265,824.00 1,547,143 17.18%
2015 288,258.42 1,582,895 18.21%2016 299,096.94 1,619,490 18.47%
2017 310,342.98 1,656,948 18.73%
2018 322,011.88 1,695,290 18.99%
Year Projected SalesProjected
DemandMarket Share
2015 265,824 1,547,143 17.18%
2016 288,258 1,582,895 18.21%
2017 299,097 1,619,490 18.47%
2018 310,343 1,656,948 18.73%2019 322,012 1,695,290 18.99%

8/11/2019 For Financial as of Sept3
http://slidepdf.com/reader/full/for-financial-as-of-sept3 8/27
Projected Demand
1,547,143
1,582,895
1,619,490
1,656,948
1,695,290
N
DEDMA
okay na :)

8/11/2019 For Financial as of Sept3
http://slidepdf.com/reader/full/for-financial-as-of-sept3 9/27
398

8/11/2019 For Financial as of Sept3
http://slidepdf.com/reader/full/for-financial-as-of-sept3 10/27
Year 1 Year 2 Year 3 Year 4 Year 5
Projected Sales in Units 265,824 275,819 286,190 296,951 308,116
GDP Growth Rate 100.00% 104.51% 104.51% 104.51% 104.51%
Sales Forecast in Units 265,824 288,258 299,097 310,343 322,012
TRIAL

8/11/2019 For Financial as of Sept3
http://slidepdf.com/reader/full/for-financial-as-of-sept3 11/27
71 max ppl * 12 max hours * 26 days * 12 months

8/11/2019 For Financial as of Sept3
http://slidepdf.com/reader/full/for-financial-as-of-sept3 12/27
Property, Plant and Equipment 595,712.75
Furniture and Fixtures 240,676.00
Pre-operating Expenses
Cost of Sales per Week
Operating Expenses per Week
Total Initial Capital Requirement

8/11/2019 For Financial as of Sept3
http://slidepdf.com/reader/full/for-financial-as-of-sept3 13/27
Item Price (Php) Quantity
Useful
Life
Total cost
per unit
(Php)
32" television 17,900.00 7 15 125,300.00
50" television 27,495.00 1 15 27,495.00
Karaoke player 1,200.00 8 5 9,600.00
Amplifier 4,199.00 8 5 33,592.00Speakers 4,599.00 8 5 36,792.00
Air conditioner 14,000.00 10 20 140,000.00
Kodak photo
printer 2,000.00 15
2,000.00
Microphone 1,249.50 10 7 12,495.00
Guitar 1,200.00 2 5 2,400.00
Beat box 2,500.00 2 5 5,000.00
Disco lights 120.00 10 2 1,200.00
Fire extinguisher 2,000.00 2 3 4,000.00
Power generator 46,999.75 1 10 46,999.75
Printer 1,999.00 1 10 1,999.00
Computer set 17,000.00 1 5 17,000.00
Ceiling fan 4,000.00 13 20 52,000.00
Surveillance
camera 14,000.00 3 5 42,000.00
Ipad mini 15,000.00 1 5 15,000.00
Water dispenser 4,840.00 1 5 4,840.00Chiller 16,000.00 1 20 16,000.00TOTAL 595,712.75

8/11/2019 For Financial as of Sept3
http://slidepdf.com/reader/full/for-financial-as-of-sept3 14/27
Furnitures Unit Cost Quantity Total Cost
Sofa (6-seater) 8,000.00 4 32,000.00 3 for Music Boxes; 1 fo
Sofa (15-seater)14,500.00 1 14,500.00 for the Music Box #7
Sofa (10-seater)12,000.00 5 60,000.00 2 for Disco Box; 3 for t
Fixed case ofequipments 529.50 8 4,236.00
Stool 188.00 5 940.00 2 for lobby; 3 for extra
Center table for
Music Boxes 2,500.00 8 20,000.00 3 for 1-3; 3 for 4-6; 1 f
Coffee table and
chairs 5,000.00 1 5,000.00 for waiting area
Bar tables 3,500.00 4 14,000.00 for Disco Box
Wall mirror 10,000.00 9 90,000.00
TOTAL 240,676.00
ources: y pau oyce o nsons pa, ce ar ware
Lipa, Japan Home Center Robinsons Lipa,
lorenzfurniture.com

8/11/2019 For Financial as of Sept3
http://slidepdf.com/reader/full/for-financial-as-of-sept3 15/27
r the lobby
e music boxes (1,2,3)
r 7; 1 for lobby

8/11/2019 For Financial as of Sept3
http://slidepdf.com/reader/full/for-financial-as-of-sept3 16/27
ItemUnit Cost
(Php)Quantity Total Cost (Php)
Useful Life
Breakable
glasses10.00 100 1,000.00
2 years
Sauce
dispenser 15.00 16 240.00
2 years
Beer tower 950.00 8 7,600.00 3 yearsTray 88.00 10 880.00 5 years
Mop 550.00 2 1,100.00 1 year
Towel 17.00 3 51.00 6 months
Doormat 88.00 3 264.00 6 months
Trash can 66.00 11 726.00 2 years
Bottle spray 33.00 8 264.00 1 year
Feather duster 66.00 4 264.001 year
Pitcher 88.00 8 704.00 5 years
Broom 50.00 4 200.00 6 monthsDustpan 60.00 4 240.00 1 year Stirrer 100 0.00 1 month
Paper cups 1.40 100 140.00 1 month
0.00
0.00
0.00
0.00
TOTAL 13,673.00

8/11/2019 For Financial as of Sept3
http://slidepdf.com/reader/full/for-financial-as-of-sept3 17/27
Supplies
Unit
cost
(Php)
Quantity
Needed per
Month
Total Cost
per Month
(Php)
seful Life
Photo paper 2.90 400 1,160.00
Ink 459.00 1 459.00
Official receipt 50.00 1 50.00
5-gallon mineralwater
40.00 7 280.00
Toilet paper 7.81 36 281.16
Dishwashing
liquid66.00 2 132.00
Hand liquid
soap66.00 3 198.00
Air fragrance
spray66.00 3 198.00
Paper bucket
(big)15.00 2,000 30,000.00
Table napkin 16.00 10 160.00
Scented gel 140.00 9 1,260.00
Wipeout
cleanser 70.00 2 140.00
All-purpose
cleanser 100.00 2 200.00
Muriatic acid 50.00 2 100.00
Albatross 49.00 3 147.00
Total 34,765.16

8/11/2019 For Financial as of Sept3
http://slidepdf.com/reader/full/for-financial-as-of-sept3 18/27
ItemUnit cost
(Php)
Quantity
Needed
per Month
Total Cost
per Month
(Php)
San Miguel Pale
Pilsen26.00 14,742
383,292.00
San Miguel Light 28.00 14,742 412,776.00Red Horse 27.00 14,742 398,034.00
Softdrinks 45.00 6,552 294,840.00
Iced Tea (1liter
pack)9.50
9,828 93,366.00
Ice cubes 28.50 180 5,130.00
Pringles potato chips 80.00 1,311 104,880.00
Nachos 40.00 175 7,000.00
Nuts 100.00 190 19,000.00
Cornick 80.00 190 15,200.00
3-in-1 coffee 5.00 90 450.00
TOTAL 1,733,968.00

8/11/2019 For Financial as of Sept3
http://slidepdf.com/reader/full/for-financial-as-of-sept3 19/27
6
63 * 6 bottles (2 to
63 / 5 ave tao = 13 (ro); 13 / 2 groups na maghahati sa isang pack times 26 working days;
2 bucket sa 5 tao; 1 bucket = 2 pringles
extra; 13 groups * (1/2)=hati Ang 2 buckets(grps) sa isa
100 per kilo; 26 *
80 per kilo; 26 *

8/11/2019 For Financial as of Sept3
http://slidepdf.com/reader/full/for-financial-as-of-sept3 20/27
44226 / 3
44226 / 3
44226 / 3
3 * 4 * 26 63 yes 2 towers) ing days
ers) * 26
lus extra
; 12.6 ;26
g pk *26
4 + extra
4 + extra
63 yes times 27 average demand for beer times 26
working days
working days
working days

8/11/2019 For Financial as of Sept3
http://slidepdf.com/reader/full/for-financial-as-of-sept3 21/27
Cash
Inventory 1,733,968.00
Accounts receivables
Supplies 34,765.16
Prepaid rent 34,899.20
Other Total Current Assets 1,803,632.36
Machinery and Equipment 595,712.75
Less: Accumulated Depreciation
Furniture and Fixtures 240,676.00
Leasehold Improvements
Real Estate/Buildings
Investments
Total Fixed Assets 836,388.75
Specify
Total Other Assets
TOTAL ASSETS 2,640,021.11
ASSETS
Current Assets
Fixed Assets
Other Assets

8/11/2019 For Financial as of Sept3
http://slidepdf.com/reader/full/for-financial-as-of-sept3 22/27

8/11/2019 For Financial as of Sept3
http://slidepdf.com/reader/full/for-financial-as-of-sept3 23/27
Depreciation Schedule
For Financial Reporting Only. Not Applicable to MACRS for Tax Reporting.
Depreciation for Year …Asset Price Year Salvage Life Method 2008 2009 2010 2011
32" television 17,900.00 2014 0 15 SL - - - -
50" television 27,495.00 2014 0 15 SL - - - -
Karaoke player 1,200.00 2014 0 5 SL - - - -
Amplifier 4,199.00 2014 0 5 SL - - - -
Speakers 4,599.00 2014 0 5 SL - - - -
Air conditioner 14,000.00 2014 0 20 SL - - - -
Kodak photo
printer 2,000.002014 0 5 SL - - - -
Microphone 1,249.50 2014 0 7 SL - - - -
Guitar 1,200.00 2014 0 5 SL - - - -
Beat box 2,500.00 2014 0 5 SL - - - -
Disco lights 120.00 2014 0 2 SL - - - -
Fire extinguisher 2,000.002014 0
3SL - - - -
Power generator 46,999.752014 0
10SL - - - -
Printer 1,999.00 2014 0 10 SL - - - -
Computer set 17,000.00 2014 0 5 SL - - - -
Ceiling fan 4,000.00 2014 0 20 SL - - - -
Surveillancecamera 14,000.00
2014 05
SL - - - -
Ipad mini 15,000.00 2014 0 5 SL - - - -
Water dispenser 4,840.002014 0
5SL
Chiller 16,000.00 2014 0 20 SL
Total: 0 0 0 0

8/11/2019 For Financial as of Sept3
http://slidepdf.com/reader/full/for-financial-as-of-sept3 24/27
© 2009 Vertex42 LLC
Depreciation Schedule
2012 2013 2014 2015 2016 2017 2018 2019
- - 1193 1193 1193 1193 1193 1193
- - 1833 1833 1833 1833 1833 1833
- - 240 240 240 240 240 -
- - 840 840 840 840 840 -
- - 920 920 920 920 920 -
- - 700 700 700 700 700 700
- - 400 400 400 400 400 -
- - 179 179 179 179 179 179
- - 240 240 240 240 240 -
- - 500 500 500 500 500 -
- - 60 60 - - - -
- - 667 667 667 - - -
- - 4700 4700 4700 4700 4700 4700
- - 200 200 200 200 200 200
- - 3400 3400 3400 3400 3400 -
- - 200 200 200 200 200 200
- - 2800 2800 2800 2800 2800 -
- - 3000 3000 3000 3000 3000 -
968 968 968 968 968 -
800 800 800 800 800 800
0 0 23,039 23,039 22,979 22,312 23,112 9805
Edit the
information
in columns
B throughG. See the

8/11/2019 For Financial as of Sept3
http://slidepdf.com/reader/full/for-financial-as-of-sept3 25/27
Unit Monthly Cost
Monthly
Cost per
Room
Rent
(Building) 280.00 124.64 34,899.20 96.94
Food 432.00 432.00
Pringles 160.00
Beer tower 252.00
Nachos 20.00
Equipment
& Machines 48,847.50 156.56
Supplies 34,765.16 111.43
TOTAL 796.93

8/11/2019 For Financial as of Sept3
http://slidepdf.com/reader/full/for-financial-as-of-sept3 26/27
Capacity of Each
Room
# of
Rooms
Max.
hours in a
day
Working
days in a
month
Number
of
months
Max
Capactity
Predetermined
Capacity Rate
5 3 12 26 12 11232 90%
8 3 12 26 12 11232 90%
12 1 12 26 12 3744 90%
20 1 12 26 12 3744 90%

8/11/2019 For Financial as of Sept3
http://slidepdf.com/reader/full/for-financial-as-of-sept3 27/27
Predetermined
Capacity Demand Total Demand
Predetermined
Demand
10,109 64 188 3,441
10,109 84 188 4,517
3,370 16 188 287
3,370 24 188 430