for institutional use only - canadian investment revie · emerging markets opportunity for...
TRANSCRIPT

Emerging Markets—The Intersection of Challenges and Opportunities
Pyramis Global Advisors®
Opportunities
Brian Drainville, CFAInstitutional Portfolio Manager
November 7, 2013
For Institutional Use Only
Table of Contents
1. Emerging Markets Opportunity2. How to approach investing in Emerging Markets?3. Key considerations in low risk investment approach4. Summary
2 For Institutional Use OnlySee "Important Information" for a discussion of additional information related to this presentation.
201112-10543
Emerging Markets Opportunity
For Institutional Use Only
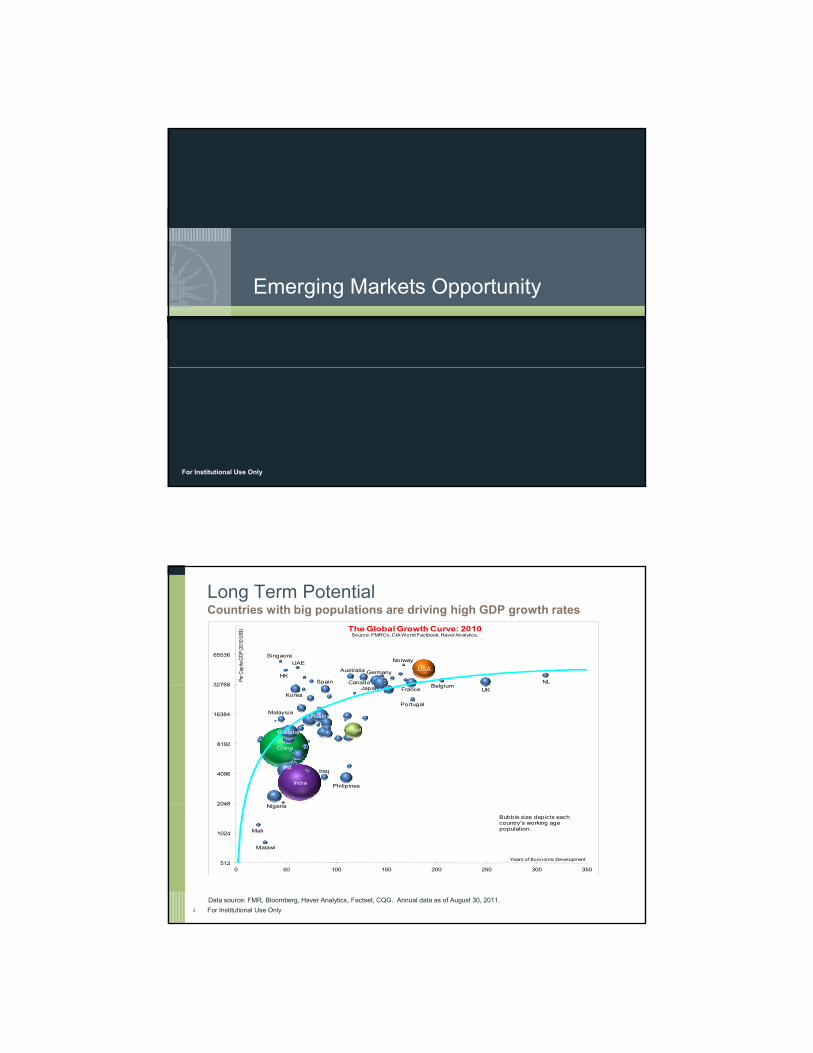
Long Term Potential Countries with big populations are driving high GDP growth rates
Singaore
HK
UAE
Spain
Australia
Canada
Germany
Norway
USA
BelgiumNL 32768
65536
Per C
apita
GDP
(201
0 US$
) The Global Growth Curve: 2010Source: FMRCo, CIA World Factbook, Haver Analytics.
Ni i
Malaysia
China
Ind
Pakistan
Korea
India
Russia
Iraq
Philipines
Brazil
Japan France
Portugal
BelgiumUK
2048
4096
8192
16384
32768
For Institutional Use Only4
Mali
Malawi
Nigeria
512
1024
2048
0 50 100 150 200 250 300 350
Years of Economic Development
Bubble size depicts each country's working age population.
Data source: FMR, Bloomberg, Haver Analytics, Factset, CQG. Annual data as of August 30, 2011.

Long Term PotentialWe believe equity is a better way to capture EM wealth creationImprovement in sovereign credit quality is a key factor
For Institutional Use Only5
Source: Journal of Portfolio Management (Kelly, Martins, Carlson), Spring 1997
201112-10543
Challenges of Investing in Emerging Markets
Higher CyclicalityVolatility Policy and Politics flux
No protection for minority rights
• Export oriented, commodity heavy
• Monetary /fiscal policy making tend to amplify economic cycles
Over time, EM equities have volatility 30% above the S&P 500
• Weaker political/economic institutions
• Opaque policy making
• Underdeveloped rule of law
• Corporate Governance and disclosure standards are loose
• Legal protection for minority shareholders may not exist
For Institutional Use Only6
Source: FMR Analysis. Data as of 2012.Index performance does not reflect the deduction of advisory fees, transaction charges and other expenses, which would reduce performance. Investing directly in an index is not possible.

The Intersection of Opportunities and Challenges
How to Approach Investing in Emerging Markets
For Institutional Use Only
Black Swans are more common in EMMSCI EM index has nearly twice negative skew than MSCI World
For Institutional Use Only8
Source: MSCI, Returns Distribution s shown for 1988-2007, pre-Global Financial Crisis period only

Importance of Limiting DownsideHigher draw downs negatively impact compounded returns over long run
Assume 2 portfolios:
• Low Volatility Portfolio: • Alternating monthly returns of 10% and -2%• Expected Returns = 10% X 0.5 + (-2%)X 0.5= 4%
• High Volatility Portfolio: • Alternating monthly returns of 20% and -12% • Expected returns = 20% X 0.5 + (-12%) X 0.5 = 4%
As the graph below shows, compounded return of the low volatility strategy is higher than for the high volatility strategy
For Institutional Use Only9For illustrative purposes only. Not intended to represent an investment in any Pyramis product.
Importance of Limiting DownsideStrong Empirical Evidence from Developed Markets
For Institutional Use Only10

Importance of Limiting DownsideSimilar Strong Empirical Evidence from Emerging Markets
• This evidence goes against the Capital Asset Pricing Model of Financial Theory
Annualized Excess Returns for Stocks (%) in the MSCI EM Index(August 2003 to July 2013)
4.27 y(Higher Risk -> Higher Returns)
• So the question is why does this anomaly exist? The possible answer lies in Behavioural Finance-2.68
-3.04-2.43
-3.16
-1.57
0.91
2.37
Leverage Profitability Volatility in Returns Beta
For Institutional Use Only11
Source: Factset, Pyramis/FMR Analysis, July 2013; Leverage = Total Debt/EBITDA (ex-financials), Profitability = Return on Equity, Volatility in Returns = 5 year highest ROE less lowest, Beta based on 104 weeks of weekly returns
g y y
Stocks in the bottom quintile of risk Stocks in the top quintile of risk
Importance of Limiting DownsideExplaining the ‘low risk’ anomaly
Preference for Lotteries Representativeness Overconfidence Compensation structure for PMs
Buying a volatile stock is like buying a
Popular press regularly highlights
People are usually overconfident about
Benchmark focus makes institutionalstock is like buying a
lottery ticket: There is a small chance of its doubling or tripling in value in a short period and a much larger chance of its declining in value.
regularly highlights multi-bagger stocks in relatively speculative sectors such as Technology, Resources Exploration, while failing to mention a high rate of failures in these sectors.
overconfident about their abilities, especially when it comes to forecasting the future. For higher volatility stocks, potential pay off of getting your forecasts right is higher
makes institutional managers less likely to exploit this low volatility anomaly
For Institutional Use Only1212
Source: Benchmarks as Limits to Arbitrage: Understanding the Low-Volatility Anomaly, Financial Analysts Journal Vol. 67, No. 1, 2011

Key Considerations in a Low Risk Investment Approach
For Institutional Use Only
Limiting Portfolio Downside RiskCase for geographic diversification: Countries/regions have very distinct drivers
EASTERN EUROPE + RUSSIA• Relatively low costs workforce
in Eastern Europe
CHINA• Strong domestic
LATIN AMERICA• Driven by
resources boom and taming of inflation in key
i h
in Eastern Europe• Resources in Russia
MIDDLE EAST AND AFRICA• Resources• Favourable demographics• Incremental improvement in
governance and policy ki
KOREA AND TAIWAN• Export Powerhouses,
with strong trade linkages to China
economy, powerful exports due to labour cost advantage
For Institutional Use Only14
economies such as Brazil
making
Variations in Drivers Results in Changes in Leadership over Time• Malaysia and Mexico were the biggest EM countries by market cap in 1992• Korea and Brazil are the biggest in 2013

• Approx. 35% of MSCI EM benchmark (26% for EM SMID) consists of export oriented sectors such as Information Technology and Resources
• This combined with relatively inefficient coverage of stocks with in Emerging Markets, offers the potential to create low risk investment portfolios exposed to more secular steadily growing stocks.
Limiting Portfolio Downside RiskDomestic sectors may offer more steady returns
steadily growing stocks.
EM “Domestic”Sectors
“Global Sectors”Blend of “Domestic” EM & Global Sectors
0%5%
10%15%20%25%30%
er
ary
les
are
als
als
ies
atio rgy
als
ion
ogy
15 For Institutional Use OnlySource: FMR, as of 7/31/13 – MSCI Emerging Markets and MSCI Emerging Markets Small and Mid Cap Index
Con
sum
eD
iscr
etio
na
Con
sum
er S
tap
Hea
lth C
a
Indu
stri
Fina
nci
Util
it
Tele
com
mun
ica
n S
ervi
ces
Ene
r
Mat
eri
Info
rmat
iTe
chno
lo
MSCI EM MSCI EM Small-Mid
Don’t ignore the impact of corporate governanceLimiting Portfolio Downside Risk
US$ GDP per Capita
16 For Institutional Use Only
Corporate Governance ScoreBetter Governance Worse Governance
Source: UBS “Governance in GEM: a Slippery Slope”, May 22, 2013
• Governance affects economic growth• But market participants can be fickle in applying this factor to company valuations

Limiting Portfolio Downside RiskPoor Corporate Governance Can Destroy Capital
• There were quite a few red flags200 INDIAN IT SERVICE PROVIDERS
Related Party Capital Misallocation
Political Affiliations Poor Disclosure Governance
Structure
There were quite a few red flags• composition of the board was not
ideal, • there were a lot of other businesses
either controlled by the Chairman or his family which benefitted directly from his relationship with local politicians
• the company was very aggressive in its pricing, yet showed comparable operating profit margins vs its peer40
60
80
100
120
140
160
180
200
Inde
x Pr
ice
Perf
orm
ance
INDIAN IT SERVICE PROVIDERS
For Institutional Use Only17
operating profit margins vs. its peer group.
• In late 2008/early 2009: The chairman surrendered to police along with his brother and admitted to inflating the company’s operating profit for the 3rd quarter of 2008
Source: Factset, December 2011Example of investment research process is shown for illustrative purposes only and is not representative of manager’s entire portfolio or all recommendations for time periods shown. Not a recommendation or offer to buy or sell any securities. Past performance of investment research process is no guarantee of future results.
0
20
40
2007 2008 2009 2010 2011IT Service Provider 1 IT Service Provider 2
IT Service Provider 3
Companies of interest• Companies with good sustainable cash flow returns and steady growth• Temporarily out-of-favour companies, with strong balance sheets, run by competent
management teams
Limiting Downside Risk in a StockFocus on the right kind of companies and management teams
management teams• Companies well below their intrinsic value leaving a reasonable margin of safety
Companies to be avoided• Companies with unsustainable growth and returns profiles, especially when they are
priced for perfection• Business models subject to obsolescence risk due to a technology or fashion going
out of favour• Companies without tangible cash flows or with poor history of generating cash flow
18 For Institutional Use Only
returns• Companies with weak corporate governance structures, or management teams with
poor records regarding the treatment of minority share holders
Keep a significant margin of safety over intrinsic value

Summary
For Institutional Use Only
SummaryEmerging Markets offer a
great potential for investors despite having certain
challenges
Investment approach with strong emphasis on
downside protection has proven to work very well in
these markets
Key to a low risk investment strategy is focus on good quality
companies with steady returns and good corporate
governance
• We are at a unique point in history where we are seeing countries with large populations driving high GDP growth rates
• EM is inefficient, opportunity for active investors
• But investors face multiple challenges ranging from
t hi h
• Protecting capital at the time of market draw-downs is the key to generate higher compounded returns over time
• Hence a low risk investment approach focused on downside protection has outperformed benchmarks in Emerging Markets over a
• At the stock level, favorsteady returns generating companies, run by competent and honest management teams; ensuring a significant margin of safety on valuation when investing in these stocks
• At portfolio level this means
For Institutional Use Only20
For illustrative purposes only.
poor governance to high volatility while investing in these countries
in Emerging Markets over a long period
At portfolio level, this means favoring more domestically oriented sectors such as Consumer, and diversifying the portfolio across the whole range of Emerging Markets

Important Information
For Institutional Use Only
Important InformationRead this important information carefully before making any investment. Speak with your relationship manager if you have any questions.
RisksPast performance is no guarantee of future results. An investment may be risky and may not be suitable for an investor's goals, objectives and risk tolerance. Investors should be aware that an investment's value may be volatile and any investment involves the risk that you may lose money. Performance results for individual accounts will differ from performance results for composites and representative accounts due to factors such as portfolio size, account objectives and restrictions, and factors specific to a particular investment structure.
The value of a strategy's investments will vary day to day in response to many factors, including in response to adverse issuer, political, regulatory, market or economic developments. The value of an individual security or a particular type of security can be more volatile thanregulatory, market or economic developments. The value of an individual security or a particular type of security can be more volatile than the market as a whole and can perform differently from the value of the market as a whole.
The performance of fixed income strategies will change daily based on changes in interest rates and market conditions and in response to other economic, political or financial developments. Debt securities are sensitive to changes in interest rates depending on their maturity, and may involve the risk that their prices may decline if interest rates rise or, conversely, if interest rates decline, their prices may increase. Debt securities carry the risk of default, prepayment risk and inflation risk. Changes specific to an issuer, which may involve its financial condition or economic environment, can affect the credit quality or value of an issuer's securities. Lower-quality debt securities are often considered to be speculative and involve greater risk, especially in periods of general economic difficulty. The value of mortgage securities may change due to shifts in the market's perception of issuers and changes in interest rates, regulatory or tax changes.
Derivatives may be volatile and involve significant risk, such as credit risk, currency risk, leverage risk, counterparty risk and liquidity risk. Using derivatives can disproportionately increase losses and reduce opportunities for gains in certain circumstances. Investments in derivatives may have limited liquidity and may be harder to value, especially in declining markets.
The performance of international strategies depends upon currency values, political and regulatory environments, and overall economic factors in the countries in which they invest. Foreign markets, particularly emerging markets, can be more volatile than the U.S. market due t i d i k f d i liti l l t k t i d l t d f diff tl f th U Sto increased risks of adverse issuer, political, regulatory, market, or economic developments and can perform differently from the U.S. market. The risks are particularly significant for strategies that focus on a single country or region.
22 For Institutional Use Only

Important Information (continued)These materials contain statements that are “forward-looking statements,” which are based on certain assumptions of future events.
Forward-looking statements are based on information available on the date hereof, and Pyramis does not assume any duty to update any forward-looking statement. Actual events may differ from those assumed. There can be no assurance that forward-looking statements, including any projected returns, will materialize or that actual market conditions and/or performance results will not be materially different or worse than those presented.
Performance Data Performance data is generally presented gross of any fees and expenses, including advisory fees, which when deducted will reducereturns. See the GIPS® Composite Performance Data for performance figures that are net of the maximum investment advisory fee h d li t l i thi t t S li t t f f t hi h if i d ill l dcharged any client employing this strategy. Some clients may request a performance fee arrangement, which if imposed will also reduce
returns when deducted. See Pyramis' Form ADV for more information about advisory fees if Pyramis Global Advisors, LLC is theinvestment manager to the account. For additional information about advisory fees related to other Pyramis advisory entities, speak with your relationship manager. All results reflect realized and unrealized appreciation and the reinvestment of dividends and investment income, if applicable. Taxes have not been deducted. In conducting its investment advisory activities, Pyramis utilizes certain assets, resources and investment personnel of FMR Co., which does not claim compliance with the Global Investment Performance Standards (GIPS®).
Representative account information is based on an account in the subject strategy’s composite that generally reflects that strategy’s management and is not based on performance of that account. An individual account’s performance will vary due to many factors, including inception dates, portfolio size, account guidelines and type of investment vehicle. Index or benchmark performance shown does not reflect the deduction of advisory fees, transaction charges and other expenses, which if charged would reduce performance. Investing directly in an index is not possible.
23 For Institutional Use Only
Important Information (continued)The business unit of Pyramis Global Advisors (Pyramis) consists of: Pyramis Global Advisors Holdings Corp. , a Delaware corporation;
Pyramis Global Advisors Trust Company, a non-depository trust company (PGATC); Pyramis Global Advisors, LLC, a U.S. registered investment adviser (PGA LLC); Pyramis Canada ULC, an Ontario registered investment adviser; Pyramis Global Advisors (UK) Limited, a U.K. registered investment manager (Pyramis-UK); Pyramis Global Advisors (Hong Kong) Limited, a Hong Kong registered investment adviser (Pyramis-HK); Pyramis Distributors Corporation LLC, a U.S. registered broker-dealer; and Fidelity Investments Canada ULC, an Alberta corporation (FIC). Investment services are provided by PGATC, PGA LLC, Pyramis Canada ULC, Pyramis-UK and/or Pyramis-HK.
"Fidelity Investments" refers collectively to FMR LLC, a US company, and its subsidiaries, including but not limited to Fidelity Management & R h C (FMR C ) d P i “Fid lit I t ti l” f ll ti l t FIL Li it d US d itResearch Company (FMR Co.) and Pyramis. “Fidelity International” refers collectively to FIL Limited, a non-US company, and its subsidiaries. “Fidelity” refers collectively to Pyramis and Fidelity Investments.
Products and services presented here are managed by the Fidelity Investments companies of Pyramis Global Advisors, LLC, a registered investment adviser, or Pyramis Global Advisors Trust Company, a non-depository limited purpose trust company. Pyramis products and services may be presented by Fidelity Investments Institutional Services Company, Inc., Fidelity Investments Canada ULC, Fidelity International, Fidelity Brokerage Services, LLC, Member NYSE, SIPC, all non-exclusive financial intermediates that are affiliated with Pyramis.
Certain data and other information in this presentation have been supplied by outside sources and are believed to be reliable as of the date of this document. Data and information from third-party databases, such as those sponsored by eVestment Alliance and Callan, are self-reported by investment management firms that generally pay a subscription fee to use such databases, and the database sponsors do not guarantee or audit the accuracy, timeliness or completeness of the data and information provided including any rankings. Rankings or similar data reflect information at the time rankings were retrieved from a third-party database, and such rankings may vary significantly as additional data from managers are reported. Pyramis has not verified and cannot verify the accuracy of information from outside sources, and potential investors should be aware that such information is subject to change without notice. Information is current as of the d t t ddate noted.
Pyramis has prepared this presentation for, and only intends to provide it to, institutional, sophisticated and/or qualified investors in one-on-one or comparable presentations. Do not distribute or reproduce this report.
Third party trademarks and service marks are the property of their respective owners. All other trademarks and services marks are the property of FMR LLC or its affiliated companies. Pyramis does not provide legal or tax advice and we encourage you to consult your own lawyer, accountant or other advisor before making an investment.
24 For Institutional Use Only