for instructors student study tools - textbook media€¦ · · 2016-03-10student study tools ....
TRANSCRIPT

Book Information
3 things about Werner/Stoner 3e:
1. Designed to provide undergrads a contemporary taste of financial managing
2. Incorporates globalization/ethics/small business
3. Bridges gap between traditional and new business practices
For Instructors
Instructor’s Manual
Solutions Manual
Computerized Test Bank
PowerPoint Lecture Slides (Distributed on a Compact Disk)
To Review Online Textbook
www.textbookmedia.com
To Request Paperback
Student Study Tools
Lecture Guide: $ 6.95
Table of Contents/ Preface
“Frank Werner is one of the most impressive human beings I have ever met in my life. I had him for my first Fordham Undergrad finance class (brilliant/genius)...
Jim Stoner and Frank Werner created a Finance and TQM Total Quality Management Course – we had CFOs from Florida Power & Light, Motorola and a host of others as guest lecturers.
It was awesome. It was like TOPGUN/Navy Fighter Weapons School for Finance. Seriously.”
-Unsolicited Comment to Textbook Media from one of Werner-Stoner students | user.

B R I E F C O N T E N T S
To the Instructor xTo the Student xxAbout the Authors xxiiiCredits xxiv
PART I ABOUT FINANCE AND MONEY 11 What is Financial Managing? 22 Data for Financial Decision Making 283 The Time Value of Money 564 Money Rates 84
PART II RAISING MONEY 1115 Financial Planning 1126 Financial Instruments 1367 Financial Markets and Institutions 166
PART III RISK VS. RETURN 1898 Risk and its Measurement 1909 The Value of Securities 218
10 The Cost of Capital 238
PART IV ADDING VALUE 26111 Capital Budgeting 26212 Investing in Permanent Working Capital Assets 28613 Improving Financial Processes 31014 Selecting the Best Debt-Equity Mix 33415 Managing Risk 360
PART V RETURNING VALUE TO SHAREHOLDERS 38316 Dividend Policy 38417 Increasing Share Price 406
PART VI LOOKING AHEAD 42918 The Future: Yours and Finance’s 430
Summary of Mathematical Relationships M–1Summary of Financial Ratios R–1Using Your Financial Calculator C–1Spreadsheet Functions S–1Time Value Tables T–1Glossary G–1Index I–1

D E T A I L E D C O N T E N T S
To the Instructor xTo the Student xxAbout the Authors xxiiiCredits xxiv
PART I ABOUT FINANCE AND MONEY 1
1 What is Financial Managing? 2What is Finance? 4 The Development of the Finance Discipline7 The Purpose of the Firm 13 Concerns About ShareholderWealth Maximization 18 Emerging New Approaches That Be-gin Reintegrating Societal and Shareholder Interests 20
Web Appendix 1A — Financial Managing and the ChangingBusiness Environment
Web Appendix 1B — The Global Financial CrisisWeb Case: Jill McDuffWeb Case: John Morehouse
2 Data for Financial Decision Making 28The Need for Good Data 30 Financial Accounting Data 30Financial Ratios 35 Managerial Accounting Data 43 OtherData 47
Web Appendix 2A — More on the Analysis of FinancialAccounting Data
Web Appendix 2B — The du Pont System of RatiosWeb Appendix 2C — Break-Even AnalysisWeb Appendix 2D — The U.S. Personal Income Tax SystemWeb Appendix 2E — The U.S. Corporate Income Tax System
3 The Time Value of Money 56The Money Rules 58 The Fundamental Relationship 60Multiple Cash Flows—Uneven Flows 69 Multiple CashFlows—Cash Flows That Form a Pattern 71
Web Appendix 3A — Solving Annuity Problems Using TimeValue Tables
Web Appendix 3B — Using a Cash Flow List on a FinancialCalculator
Web Appendix 3C — Derivation of Time Value Formulas
4 Money Rates 84Interest Rates and Present Values 86 The Components of Inter-est Rates 88 The Term Structure of Interest Rates 92 OtherInterest Rate Structures 95 Exchange Rate Systems 98 For-eign Exchange Market Quotations 100 Spot and ForwardRates 103 Business Exposure to Exchange Rates 105
Web Appendix 4A — More on the Expectations Hypothesis ofthe Term Structure

PART II RAISING MONEY 111
5 Financial Planning 112The Role of Planning 114 Specific-Item Forecasting 117Forecasts That Relate to Sales 118 The Percentage-of-SalesMethod Illustrated 121 Interpreting the Pro-Forma Statements127
Web Appendix 5A — More Complex Forecasting RelationshipsWeb Appendix 5B — The Cash BudgetWeb Appendix 5C — Financial Feedback
6 Financial Instruments 136Characteristics of Financing 138 Short-Term Debt 138 Inter-mediate- and Long-Term Debt 146 Preferred Stock 155Common Stock 158
Web Appendix 6A — Term Loan StructuresWeb Appendix 6B — Preferred Stock ArrearagesWeb Appendix 6C — The Benefits of Owning Common StockWeb Appendix 6D — About Options
7 Financial Markets and Institutions 166The Functions and Functioning of Financial Markets and Institu-tions 168 Primary Financial Markets 172 Secondary Finan-cial Markets 176 The Behavior of Financial Markets 180 Fi-nancial Intermediaries 185
Web Appendix 7A — Regulation of Financial Markets andInstitutions
Web Case: Cynthia Leonard
PART III RISK VS. RETURN 189
8 Risk and its Measurement 190What is Risk and Why Does it Matter? 192 Risk and FinancialValue 194 Sources of Risk 195 Measuring Risk—The TotalRisk Model 196 Measuring Risk—The Portfolio Risk Model202
9 The Value of Securities 218What is Value? 220 Value vs. Price 222 Bond Valuation 223Preferred Stock Valuation 230 Common Stock Valuation 231
Web Appendix 9A — Yield to First CallWeb Appendix 9B — Option Valuation
10 The Cost of Capital 238The Nature of the Cost of Capital 240 The Process of Calculat-ing a Cost of Capital 241 Determining Required Rates of Re-turn 243 Calculating the Cost of a Capital Source 245 TheCost of Various Capital Sources 248 Calculating the OverallCost of Capital 254 Producing the Marginal Cost of CapitalSchedule 255
Detailed Contents vii

PART IV ADDING VALUE 261
11 Capital Budgeting 262The Importance of Capital Budgeting 264 Identification ofData 265 Organizing the Data 270 Reaching a Decision 275
Web Appendix 11A — The Value of Accelerated DepreciationWeb Appendix 11B — Managing the Capital Budgeting ProcessWeb Appendix 11C — Mathematical Limitations of the IRR
TechniqueWeb Appendix 11D — Ranking Investment ProjectsWeb Appendix 11E — Flawed Decision Techniques—Historical
Financial Models
12 Investing in Permanent Working Capital Assets 286Types of Working Capital 288 Organizing and Analyzing Per-manent Working Capital Data 289 Permanent Cash 292 Per-manent Accounts Receivable 297
Web Appendix 12A — Why NAB Always Agrees with NPVWeb Appendix 12B — Investing in Permanent InventoryWeb Appendix 12C — The Economic Order Quantity Model
13 Improving Financial Processes 310Financial Processes 312 Recognizing Financial Processes 314Understanding Financial Processes 315 Measuring FinancialProcess Performance 318 Systematic Process Improvement320 Process Improvement Tools 324 Examples of Improve-ments in Financial Processes 328
Web Appendix 13A — More on Financial ProcessesWeb Appendix 13B — Analytical Tools of Process ImprovementWeb Appendix 13C — Behavioral Tools of Process ImprovementWeb Appendix 13D — Reengineering Ford’s Accounts Payable
ProcessWeb Case: Donna MeleWeb Case: Chip Donnello
14 Selecting the Best Debt-Equity Mix 334Leverage 336 Financing Choice Might Change a Company’sValue 339 How Investors React to Financial Leverage 342Setting the Capital Structure in Practice 351 Typical CapitalStructures 355
Web Appendix 14A — Measuring the Degree of LeverageWeb Appendix 14B — The Bottom Half of the Income StatementWeb Appendix 14C — Debt-Equity Mix Relationships
15 Managing Risk 360Hedging 362 The Four-Step Sequence of Working Capital De-cisions 364 The Debt Maturity Mix 368 Temporary WorkingCapital 372 Hedging Temporary Working Capital Flows 376
Web Appendix 15A — Transferring Money Between Cash andMarketable Securities
viii Detailed Contents

PART V RETURNING VALUE TO SHAREHOLDERS 383
16 Dividend Policy 384Does It Matter How Shareholders Get Their Returns? 386 Div-idend Theories 387 Dividends in Practice 394 How a Divi-dend Is Paid 400
Web Appendix 16A — Alternatives to Cash Dividends
17 Increasing Share Price 406How Can Management Make Share Price Go Up? 408 Finan-cial Managing Activities That Add Value 408 Evaluating aFirm 410 Barriers to Shareholder Wealth—The Agency Prob-lem 415 Barriers to Shareholder Wealth—Ignoring FinanceTheory 420 Communicating Shareholder Value 424
Web Appendix 17A — More on the Agency Problem
PART VI LOOKING AHEAD 429
18 The Future: Yours and Finance’s 430The Last-Chapter Game Plan 432 Important Concepts in Fi-nancial Managing 432 Changes in Finance Theory 436 ASecond Focus for Finance Theory 439 Changes in FinancialPractice 441 So What? Benefits and Dangers of the FinancialPerspective 446 The Appropriateness of Humility—SomeClosing Thoughts 450
Web Case: Ray Levitt
Summary of Mathematical Relationships M–1Summary of Financial Ratios R–1Using Your Financial Calculator C–1Spreadsheet Functions S–1Time Value Tables T–1Glossary G–1Index I–1
Detailed Contents ix
Where to find it: Web-based appendixes and cases can be found at the Fundamentals of Financial Man-aging section of the Textbook Media website: www.textbookmedia.com

T O T H E I N S T R U C T O R
Thank you and congratulations for adopting this book. We and the many leadingfinance professionals throughout North America who encouraged us to write itand who reviewed our work think you have made an important decision for yourstudents and for global competitiveness. Change is never easy, as we ourselvesfound out when we began asking the questions that led to this textbook.
Fundamentals of Financial Managing is a different kind of undergraduate financetext. Although all financial management texts cover finance, we know of no otherundergraduate “financial management” textbook that has anything to do withmanagement. We’re excited about the book since we believe this is the way wewill all be seeing finance in the coming years. We hope we’ve communicated ourexcitement to you and your students
1. Our Goals for the Book
In writing Fundamentals of Financial Managing, we set seven goals for ourselves:
To present finance in a clear and consistent manner The book is de-signed—through its choice of language, illustrations, and design—to be easy toread and use. The approach for analysis and problem-solving is straightforwardand is applied consistently. The book is approachable and user-friendly, thanks tofeatures such as its realistic cases and problem scenarios, cartoons, hypertext cross-references, and dual glossary.
To organize the book based on the way financial managers conceivetheir work The flow of the book is consistent with the financial managing job:raising money, using money to add value to the firm, and returning value to share-holders. This makes it easier for students to understand the “big picture.”
To make the book consistent with the direction of business educa-tion The book includes extensive material in response to four concerns of con-temporary business education: (1) globalization, (2) ethics, (3) cross-disciplinaryactivities, and (4) small business. International content is integrated throughoutthe book. Ethics appears naturally in the context of the worldwide quality-man-agement and sustainability revolutions. Cross-disciplinary activity, a requirementin modern business practice, is explicitly addressed wherever financial decisionmaking is discussed. The special needs and limitations of small business appearthroughout the book, making it applicable to organizations of all sizes.
To capture the implications of the quality and sustainability revolu-tions for financial practice The book uses the experiences of leading com-panies to report the progress finance organizations are making in identifying andserving finance’s customers, in improving finance’s processes, and in contribut-ing to global sustainability. A consistent theme throughout the book is bridging

the gap between traditional and new management practices, a current fact of lifefor finance professionals we refer to as “living in both worlds.”
To equal or surpass the best features of other textbooks We bench-marked over 50 features of both finance and nonfinance texts, looking for the bestexample(s) of each, and set out to do as well or better on every one.
To provide instructors flexibility in using the book The book containsfull coverage for an introductory course of either one or two semesters. It can beused in a traditional financial management course, or in a survey of finance coursesince its broad coverage introduces many areas of finance, not just large corpo-ration financial management. We have put more-advanced subjects, more-detailedexplanations, and derivations on the web in “Web Appendixes” to provide greaterflexibility in selecting and assigning materials. Cross-reference footnotes connectmaterial that appears in multiple chapters, helping instructors and students aliketo tie pieces of the finance subject together.
To keep the size of the book reasonable Even with all its new coverage,the book has only 18 chapters.
2. Advantages for Students, Instructors, and Society
We think there are important advantages to a finance book that is consistent withthe best management practice.
For students The approach of Fundamentals of Financial Managing makes stu-dents more attractive to employers, not only by teaching them the core compe-tencies of finance but also by showing them how to use those skills effectivelywithin a modern, world-class organization.
To the Instructor xi
© 2005 by Eric Werner. All rights reserved.

For instructors Fundamentals of Financial Managing permits instructors to teachbest practice—financial managing as it is done in companies recognized as busi-ness leaders. It supports teaching, as students find the book intuitively clear andeasy to read and understand. By integrating international and ethical issuesthroughout the book, it builds those subjects naturally into students’ analyses andremoves the need to treat them as separate topics.
For society Fundamentals of Financial Managing joins the increasing supply ofeducational materials attempting to change the way business schools prepare theirstudents. Business is changing so fast today that schools often have understand-able difficulty keeping up. The observation of Walt Kelly’s lovable cartoon pos-sum, Pogo, that “We have met the enemy, and it is us!” has been applied withsome wisdom to business education. Fundamentals of Financial Managing is ourcontribution to moving business schools from being “part of the problem” to a“part of the solution” of educating students to compete successfully in today’sglobal markets and to contribute to global sustainability.
3. Who Should Use the Book
Because of its tone and approach, Fundamentals of Financial Managing has been ap-preciated by instructors, students, and employers alike. We think the book is es-pecially appropriate for nontechnical students, since it minimizes the use of de-rivations and formulas, and for students who are employed full- or part-time andwho will immediately see the validity of the book’s approach and its relevanceto their work. Its graduate-level sibling, Modern Financial Managing—Continuityand Change, has been successfully used at the M.B.A., and executive M.B.A. lev-els and was reviewed during its development both by professors and senior fi-nancial executives from some of North America’s leading companies.
4. Pedagogical Aids
We have included many pedagogical aids to make your job of teaching easier andyour students’ job of learning more rewarding and more fun. Among the featuresto look for and take advantage of are:
Tightly integrated chapter structure Each chapter begins with a set oflearning objectives entitled “Key Points You Should Learn from This Chapter.”These points correspond precisely to the A-heads, or major sections of the chap-ter. At the end of each chapter is a “Summary of Key Points” that repeats and re-views the learning objectives.
Chapter opening and closing vignettes Each opening vignette describesa scenario faced by a finance professional and is designed to involve your stu-dents in the material by putting them “on the job.” Each closing vignette showshow the concepts of the chapter can be used to address the opening issue. Sincethe closing vignettes do not give a single definitive answer (there rarely is one),the opening story can be used as a case for class discussion, homework, or ex-aminations.
xii To the Instructor

Presentation of current finance practices of world-class companies(and some not quite so accomplished) Four types of boxes are scattered through-out the book. “Finance in Practice” boxes describe recent activities of companiesand business leaders as well as modern applications of finance theory. “ServingFinance’s Customers” boxes illustrate how a finance organization can add valueby meeting the needs of its internal and external customers. “Improving Finance’sProcesses” boxes describe examples of adding value to a corporation by doing fi-nance’s job more efficiently and effectively. “Contributing to Global Sustainabil-ity” boxes illustrate how financial activities can enhance the environment and so-ciety.
Frequent, clearly labeled, fully worked-out examples Students learnfrom examples, and we have tried to err on the side of too many rather than toofew. Where the examples are closely linked to finance theory, we often have pre-sented the example first followed by the theory, rather than the other way around,so that the theoretical concepts may be related immediately to a shared and un-derstood example. Examples are in a standard format: a problem scenario para-graph followed by a “Question,” “Solution steps,” and “Answer.” Often the “An-swer” contains further commentary to enhance students’ understanding of theexample.
Appeal to intuition rather than to formula While some students are verycomfortable with mathematical presentations, all too many are not and never learnfinance because of their “math anxiety.” This is a shame because the majority offinance can be a very intuitive subject. We have avoided formulas wherever pos-sible or placed them in Web Appendixes where they are available for those whofind them helpful. We have standardized the notation in the algebra that is in-cluded: in all cases, capital letters stand for a money amount (e.g., PV for presentvalue) while lower case letters stand for a rate (e.g., t for the marginal tax rate).
Use of the financial calculator and spreadsheet for time-value analy-ses We have purposely minimized the use of time-value tables with this text.Although some instructors find the tables useful for illustrating the basic time-value relationships, financial calculators and spreadsheet programs are universaltools in business today. It is the rare finance professional who does not use them;it is the rarer finance professional who still uses time-value tables. Also, it is of-ten cheaper for a student to purchase a calculator than to buy the textbook itself.All problems involving time value are fully worked out, showing the correct key-strokes and spreadsheet functions. At the end of the book you will find a calcu-lator appendix “Using Your Financial Calculator” illustrating the location of eachtime-value key on the most widely used financial calculators and a “SpreadsheetFunctions” appendix listing financial functions in Microsoft Excel and Corel Quat-tro Pro. By illustrating how each time-value example may be solved with calcu-lators and spreadsheets, the book provides students with extensive hands-on ex-perience. Another advantage of this approach is that our examples can be muchmore realistic and not confined to a narrow set of interest rates or time periods.
Use of visual aids Charts and tables are used throughout the book to supportlearning. Each discussion of financial market instruments features a copy of the
To the Instructor xiii

relevant quote(s) from a recent edition of The Wall Street Journal or theBloomberg.com website as seen “Through the Looking Glass” in which we mag-nify a section of the newspaper to study the numbers in more detail.
Complete glossary, both in the margin, and at the end of the bookThe marginal glossary defines terms as they are encountered in the text, so stu-dents have the definitions when they need them. The end-of-text glossary is a ref-erence students can go back to when they review and study. Also, the end-of-textglossary serves as a second index since each definition contains the number ofthe page on which the parallel marginal definition appears.
Questions that follow each chapter We have tried to make the chapter-ending questions both thought-provoking and useful for reviewing the chapterconcepts. They may be used for homework, class discussion, or examinations.
Extensive set of homework problems The problems that follow each chapter are presented in the same order as the chapter material and are clearlylabeled to identify the topic(s) they refer to. Problems come in pairs: problems 1and 2 cover the same material; so do problems 3 and 4, problems 5 and 6, etc.You can assign one problem of each pair for homework and keep the other in re-serve for classroom work, examinations, or for the student who asks for addi-tional examples. The problems range from the simple to the complex—the firstproblems are narrowly targeted at specific concepts and relationships, while thelater problems tend to be broader and integrate the chapter materials. Most prob-lems have multiple parts in which the value of one variable is systematicallychanged. Students may do all the parts at one sitting or may save one or two partsfor later review. When all parts of a problem have been completed, they illustratethe sensitivity of the result to the variable that was changed, providing anotherlearning opportunity.
Accompanying web-based cases These cases provide additional opportu-nities to explore the chapter concepts and may also be used for assignments andexaminations.
End-of-book summary of mathematical relationships and summary offinancial ratios These handy summaries can be used as study aids by stu-dents. They are also useful as reference materials for examinations if you permitstudents to bring in a list of formulas.
“NET Present Value”—references to interesting and useful websitesThese references, which appear throughout the book in the margin, direct stu-dents to interesting sites on the “net” where they can learn more about a topicand see practical, real-time applications of finance.
5. Supplements
We are creating a full set of supplements to accompany the book. For this editionthere are:
xiv To the Instructor

� A solutions manual with answers to all questions and detailed, step-by-stepsolutions to all problems.
� An instructors manual containing several suggested syllabi for both a one se-mester and full-year course, and teaching notes for each chapter and case.
� A test bank with short-answer questions and problems available both in hardcopy and on diskette for Macintosh and PC-compatible computers.
� PowerPointTM slides for each chapter to support and supplement classroompresentations containing the chapter content plus formulas, figures and tablesfrom the text.
Additional supplements planned for the future include:
� A study guide containing an outline of each chapter, worked out sample prob-lems, and self tests.
� A CD-ROM containing computerized versions of various end-of-chapter prob-lems which may be used with many popular spreadsheet programs.
� A CD-ROM containing “listen to the Authors” audio files in which we dis-cuss and elaborate concepts presented in the book.
For both instructors and students there are five books summarizing our researchfindings:
� Joining Forces—Integrating Shareholder Value and Quality Management, publishedby Fordham University Graduate School of Business. This monograph reportson a 1996 seminar at Fordham in which senior finance and other executivespresented their progress in adopting shareholder value management and mea-surement systems, such as Stern Stewart’s Economic/Market Value Added andthe Boston Consulting Group’s Total Shareholder Return/Cash Flow Returnon Investment.
� Internal Audit and Innovation, published by the Financial Executives ResearchFoundation (FERF) in 1995. Written for executives and practitioners, this bookreports on how the internal audit groups of five companies—American Stan-dard, Baxter International, Gulf Canada Resources, Motorola, and Raychem—have changed their auditing philosophies and practices to be more consistentwith their evolving management systems. FERF, the research arm of the Fi-nancial Executives Institute, was the generous sponsor of this research.
� Managing Finance for Quality—Bottom-Line Results from Top-Level Commitment,published by ASQ Quality Press and the Financial Executives Research Foun-dation in 1994. Also written for executives and practitioners, this book reportshow the quality management revolution is changing financial managementpractice. The book includes case studies of five quality-leading companies—Corning Incorporated, Federal Express, Motorola, Solectron, and Southern Pa-cific. FERF was also the generous sponsor of this research.
� Finance in the Quality Revolution—Adding Value by Integrating Financial and To-tal Quality Management, published by the Financial Executives Research Foun-dation in 1993. This shorter version of Managing Finance for Quality contains
To the Instructor xv

an executive summary, the five case studies, and a chapter on “LessonsLearned.” It was published for and distributed to the 11,000 senior financialexecutives and academics who are members of the Financial Executives Institute.
� Remaking Corporate Finance—The New Corporate Finance Emerging in Quality-Leading Companies, published by McGraw-Hill Primis in 1992. A monographdescribing transformations in finance work as seen through the observationsof senior executives from leading corporations, venture capitalists, consultingorganizations, and universities.
6. Moving Forward Together
We have worked very hard to make Fundamentals of Financial Managing an excit-ing and superior textbook. However, we believe that everything is subject to con-tinuous improvement, and we know that you all have wonderful ideas that couldenhance the book and its supplements. We would love to hear from you. Tell ushow we can (further) assist your teaching in any way; help us make the book bet-ter. Feel free to contact us any time at:
Fordham UniversityGraduate School of Business Administration113 West 60th StreetNew York, NY 10023
Frank: (212) 636-6213, [email protected]: (212) 636-6178, [email protected]
You are our customers, and delighting you and exceeding your expectations isand will always be our primary goal.
�� Acknowledgments
Writing a textbook takes the efforts of many people over many years. We extendour hearty thanks to all of them. Although we will never be able to thank eachperson adequately, we wish to identify those who played a particularly impor-tant role in the book’s development.
1. Genesis
The beginnings of this textbook were the teaching materials Frank Werner de-veloped for use in his finance classes at Fordham University and in the Manage-ment Training Program—Finance at Manufacturers Hanover Trust Company, nowpart of JPMorganChase. Thanks go to Corporate Professional Development staffat Manufacturers Hanover—especially Mort Glantz, Carol Johnson, Tom Kennedy,Tom McCaskill, Charlie Stipp, and Barbara Taylor—who helped Frank to identifythe best content and sequencing of the materials, and to Dale Broderick, who,more than any other teacher, taught Frank how to write for the classroom.
xvi To the Instructor

In 1989, Frank and Jim began their work on the interrelationships between fi-nancial managing, globalization, and quality management by conducting the firstof a series of graduate seminars with that theme. The seminars led to our stimu-lating and fruitful relationship with the Financial Executives Institute’s researcharm, the Financial Executives Research Foundation (FERF). FERF’s researchgrants, and the strong support of Roland Laing and Bill Sinnett, gave us excep-tional opportunities to learn from many CFOs and other financial executives ofcompanies that are leaders in changing financial management practice. These fi-nancial executives are showing how finance can add increasing value to their com-panies by recognizing and taking advantage of the opportunities arising from theintegration of globalization, technology, quality management, sustainability andfinancial practice. Many of the examples in this book are drawn from their suc-cesses.
We owe a great intellectual debt to the finance and quality professionals through-out the United States who taught us quality management and how it must be anintegral part of the job of financial managing. In particular, we wish to single out:
To the Instructor xvii
Fred Allerdyce, CFO, American StandardDavid Baldwin, former CFO, FloridaPower and LightLen Bardsley, former Manager, Continu-ous Improvement, Du PontRichard Buetow, VP and Director of Qual-ity, MotorolaChauncey Burton, Senior Quality Admin-istrator, Finance, Federal ExpressJim Chambers, Assistant Treasurer, Corn-ing IncorporatedWinston Chen, former Chairman, Solec-tronW. Edwards Deming, consultantJoe Doherty, Assistant VP—Finance,Southern PacificKeith Elliott, CFO, Hercules CorporationBill Fitton, Senior Manager, Corporate Fi-nancial Audit, MotorolaJustin Fox, Director—Quality, SouthernPacificBlan Godfrey, Chairman and CEO, The Ju-ran InstituteLarry Grow, VP and Director of CorporateFinancial Planning, MotorolaSandy Helton, VP and Treasurer, CorningIncorporatedDavid Hickie, former Executive VP andVice-CFO, MotorolaAlan Hunter, CFO, Stanley WorksKen Johnson, VP, Corporate Controller,and Director of Internal Audit, MotorolaJoseph M. Juran, Chairman Emeritus, TheJuran Institute
Ralph Karthein, Controller, IBM CanadaBob Lambrix, former CFO, Baxter Interna-tionalBill Latzko, President, Latzko AssociatesKen Leach, VP Administration, GlobeMetallurgicalKaren May, VP, Corporate Audit, BaxterInternationalPaul Makosz, General Auditor, GulfCanada ResourcesKo Nishimura, President and CEO, Solec-tronGabriel Pall, Vice President, The Juran In-stituteJames F. Riley, Vice President, The JuranInstitutePete Sale, Team Member—FinanceReengineering, Baxter InternationalPaul Schnitz, Director, Corporate Opera-tions Review Group, RaychemBob Siminoni, Director of Strategic Plan-ning, Treasury, WestinghouseBen Stein, VP and General Auditor, Amer-ican StandardKent Sterett, Executive VP, Quality, South-ern PacificKent Stemper, Director, Corporate Audit,Baxter InternationalBob Talbot, VP, Management Services,IBM Credit CorporationSusan Wang, CFO, SolectronLen Wood, Corporate Operations ReviewGroup, RaychemLarry Yarberry, CFO Southern Pacific

At Fordham, Frank and Jim have had the good fortune to work with excellentcolleagues in an environment where good teaching is encouraged and supported.Our faculty colleagues, particularly Victor Marek Borun, Sris Chatterjee, JohnFinnerty, Gautam Goswami, Steven Raymar, Allen Schiff, Robert Wharton, andMilan Zeleny continue to provide much of that environment. Our deans past andpresent of the Fordham Schools of Business—Susan Atherton, Arlene Eager, DavidGautschi, Robert Himmelberg, Janet Marks, Lauren Mounty, Donna Rapaccioli,Ernest Scalberg, William Small, Sharon Smith, Arthur Taylor, Maureen Tierney,and Howard Tuckman—have consistently supported us emotionally and finan-cially. Bobby Wen repeatedly played key roles in the early seminars and courseswe conducted.
2. Modern Financial Managing—Continuityand Change
In December 1991 we were introduced to Kirsten Sandberg, finance acquisitioneditor at HarperCollins College Publishers. Kirsten was quick to see the potentialof our approach and immediately understood our desire to produce a family oftextbooks using quality management techniques. In a large sense, our first text-book, Modern Financial Managing—Continuity and Change, would not have existedif it were not for her unfailing energy, good humor, and consistent faith in us andthe project. Ed Yarnell worked closely, patiently, and creatively with us in the fi-nal crunch, and arranged for our work to be read by the following academic andprofessional reviewers who responded to the manuscript in its various stages ofcompletion and who gave us many good ideas for improvement:
xviii To the Instructor
Kyle Mattson, Rochester Institute of Tech-nologyThomas H. McInish, Memphis State Uni-versityVivian Nazar, Ferris State UniversityChec K. Ng, Jackson State UniversityM. Megan Partch, University of OregonShafiqur Rahman, Portland State Univer-sityRobert G. Schwebach, University ofWyomingHugh D. Sherman, York College of Penn-sylvaniaDavid Y. Suk, Rider UniversityKenneth R. Tillery, Middle TennesseeStatePhilip M. Van Auken, Baylor UniversityCharles H. Wellens, Fitchburg State Uni-versityLen Wood, Raychem CorporationThomas V. Wright, St. Louis UniversityRobert M. Zahrowski, Portland State Uni-versity
Peter Bacon, Wright State UniversityOmar M. Benkato, Ball State UniversityT. K. Bhattacharya, Cameron UniversityJames Booth, Arizona State UniversityKuang C. Chen, California State Univer-sity-FresnoMichael C. Ehrhardt, University of Ten-nesseeJanet Hamilton, Portland State UniversityDavid W. Hickie, Motorola CorporationSherry L. Jarrell, Indiana UniversityH. Thomas Johnson, Portland State Uni-versityJohn M. Joseph, Jr., Thomas CollegeJohn Kensinger, University of North TexasRussell L. Kent, Georgia State UniversityNancy E. Kin, Lake Forest Graduate Schoolof ManagementRose Knotts, University of North TexasJohn H. Lea, Arizona State UniversityBryan Malcolm, University of Wisconsin-StoutSteven Mann, University of South Carolina
As we began to create Modern Financial Managing, we class-tested each chapter ex-tensively in the introductory courses at Fordham University. Hundreds of stu-

dents provided written feedback as they read each chapter. While it is impossi-ble to single out each by name, they are responsible for many of the book’s ex-amples and innovations. Particular thanks go to Fordham professors ChristopherBlake, Sris Chatterjee, Iftekhar Hasan, and Rohinton Karanjia who used draft sec-tions of the book in their classes and provided valuable feedback.
3. Fundamentals of Financial Managing
With the successful publication of Modern Financial Managing—Continuity andChange, we turned to writing Fundamentals of Financial Managing, the second bookin the family. We were fortunate to have the support of Trond Randøy, CynthiaLeonard, and the excellent staff at Authors Academic Publishing as we preparedthe first edition of this book.
When Authors Academic Publishing closed its doors, we discovered the new, ex-citing, and innovative textbook distribution concept developed by Textbook Me-dia. Like the people at Textbook Media, we believe that the price of traditionaltextbooks has become far too high. Our thanks go to Ed Laube and Tom Doranof Textbook Media who made the second and third editions possible and who pi-oneered the process to bring it to students at a price they can afford.
Particularly special thank yous go to Philip Schrömbgens, Kyle Houghton, Phung-porn (Bee) Jaroonjetjamnong, John Fernandez, Elizabeth Tam, and Shui Hwang,Frank’s graduate assistants at Fordham, who worked closely with Frank and Jimto prepare the manuscript. Philip managed the computer files, designed page lay-outs and edited text and artwork to produce the first edition. Kyle, Bee, and Johnpicked up where Philip left off and produced the second edition. Elizabeth andShui produced this third edition. Their skill and creativity improved immeasur-ably the quality of this book, and we are most grateful for all their efforts.
A special thank you goes to Eric Werner whose brilliant sense of humor and artis-tic skill are responsible for most of the cartoons of this edition.
4. And, of Course . . .
Finally, we both feel a debt of love and gratitude to our families—Marie, Allison,and Eric; and Barbara, Alexandra, and Carolyn—who accepted our many latenights at the office and frequent trips to visit finance and quality professionalswith very few complaints and many warm welcomes upon our return. For bothof us they formed our ultimate support system.
To the Instructor xix
© 2005 by Eric Werner. All rights reserved.

T O T H E S T U D E N T
Welcome to Fundamentals of Financial Managing. We have tried to make the bookeasy to read and learn from and a lot of fun as well. Unlike many introductoryfinance books, this one talks about two facets of finance: analytical finance, thetheory that guides financial analysis and decision making (which is in all financetexts), and operational finance, the way finance is practiced in world-class com-panies (which is in no other undergraduate finance text we know of). You are for-tunate to have a professor who is forward-looking and in touch with the enor-mous changes taking place in business practice.
As you begin to study finance you are embarking on an exciting adventure, andwe hope this book will be a good companion and guide. To help your learningfurther, we offer these suggestions:
Skim the entire book in advance Take an hour or so to look over the tableof contents and to skim the glossary and index. Then read the “part openers,” theshort sections that begin each of the six parts of the book, and read the section“Key Points You Should Learn from This Chapter” at the beginning of each chap-ter. By taking the time to do this at the beginning of the term, you will get a goodoverview of the subject and will be able to set each topic in the appropriate con-text when you get to it.
Read the section entitled “To the Instructor” It is always useful to knowas much as possible of what is on your professor’s mind. In our comments to yourinstructor, we have written about what is new and special about this book. Wehave described some of the major features of the book—most of which were de-signed to make your work as a student easier.
Put yourself in the chapter opening vignettes Each chapter opens witha scenario you might find yourself in (or may already have been in) at some pointin your business career. Before you read the chapter, think of how you might tryto deal with the situation our characters are facing. As you read the chapter, re-late the concepts to the vignette, and see how much more you could add. Whenyou reach the end of the chapter, and read the closing vignette, match up yourobservations with those of the protagonist. While there is rarely a single “rightanswer,” finance provides helpful ways of approaching each problem. You willbe delighted as you observe your thinking and analytical processes sharpenthroughout the course.
Work each example problem you encounter while you are reading achapter Take out your financial calculator or boot up your computer and gothrough the problem step by step. Doing each problem will reinforce your read-ing and help you to become proficient at using the financial calculator and/or

spreadsheet which have become universal tools of financial professionals. Youwill learn more, and the new knowledge will stay with you longer.
Relate the examples about company practices to your experiencesIf you have worked for a while, you may have been involved in or seen similarexamples of financial practice. However, even if you have little or no work expe-rience, you have been a customer of business for years. In many ways, all the ex-amples talk about universal phenomena: serving customers, increasing quality,improving work, discovering when benefits exceed costs, finding the best way todo something. In what ways are these examples different or the same as thoseyou have experienced? What could you have done differently if you had thisknowledge back then? What about these examples makes them illustrations of“world-class” performance?
Use the footnotes labeled “Cross-reference” as a hypertext deviceWhenever a reference is made to something that appears in another chapter, thereis a footnote identifying that other location. Jump back and forth as needed topick up and review supporting concepts.
Look carefully at the total results of each homework problem Wherea problem has multiple parts, you may find yourself doing the same analysis sev-eral times. Feel free to do only one or two parts at first and come back to the restlater to reinforce your learning. However, when you have completed all parts ofa repeating problem, look at the range of results. Observe how the results changedin response to the one variable that changed, an important insight beyond whatis asked in the problem.
Take advantage of the end-of-book “Summary of Mathematical Re-lationships” and “Summary of Financial Ratios” These handy pages in-clude every formula in the book and serve as useful references when doing home-work problems or preparing for examinations.
Jim discovers the true value of his textbooks
To The Student xxi
© 2005 by Eric Werner. All rights reserved.
Use the end-of-book “Glossary” as a second index When you wishto review a concept, you can look up the definition of a related term in the glos-sary. At the end of the definition you will find the number of the chapter andpage on which the term was first defined. Turn to that page, and you are at thebeginning of the section to review.
Help us make the book better As we teach financial managing to our stu-dents at Fordham, we ask each student to write a weekly memo to us telling ushow well we did each week as teachers and authors. Was the class clear and use-ful? Did this week’s chapter read well or make no sense? What didn’t you un-derstand, and which parts of the chapter worked well for you? What could wedo to make the book better? Hundreds of our students have written those memos.They have taught us a huge amount, and helped us to improve the book sig-nificantly. We invite all of you to join our Fordham students as we continue toimprove the book. Please address any comments, criticisms, and suggestions toeither of us at:
Fordham UniversityGraduate School of Business Administration113 West 60th StreetNew York, NY 10023
We promise to read your letters and consider them seriously for the next edi-tion. You are the ultimate customers of our work, and as we have learned fromour studies of world-class companies, delighting you and exceeding your ex-pectations must always be our primary goal.
Enjoy! Most important, as you study finance, HAVE FUN!! We know that therewill be times during the course where many of you will be convinced that fi-nance is anything else but fun, but this doesn’t have to be so. We believe thatone of the most important goals for every worker—whether a student, profes-sor, finance professional, or anyone else—is to find what the renowned man-agement thinker W. Edwards Deming called “joy in work.” If you put in the ef-fort to read carefully, to do the assigned problems, to go over the sticky points,to review your work, and to discuss the material with your friends who are alsotaking the course, you will be rewarded handsomely with useful and importantlearning that will last a lifetime. And as it has for your professor and us, financewill become a true labor of love.
xxii To The Student

A B O U T T H E A U T H O R S
Frank M. Werner is Associate Professor of Finance at the Schools of Business Ad-ministration of Fordham University. He received his Ph.D. in Finance from Co-lumbia University in 1978. He also received an M.Phil. in Finance from Colum-bia in 1975 and an M.B.A. from Harvard in 1968. His undergraduate degree, alsofrom Harvard, was in Engineering and Applied Physics in 1966. Dr. Werner is theauthor of a variety of journal articles, a computer-based simulation of corporatefinance decision making, and numerous monographs and cases for instructionaluse. He is a member of the American Finance Association, the American Societyfor Quality, Financial Executives International, the Financial Management Asso-ciation, and the Academy of Business Education. In addition to his responsibili-ties at Fordham, Dr. Werner advises companies in the areas of corporate financeand quality management. He has given seminars on various quality and financetopics, in both English and Spanish, throughout North, Central, and South Amer-ica; Europe; Asia; Africa; and the Middle East. His novel, The Amazing Journey ofAdam Smith (CreateSpace, 2010), explores the connection between financial self-interest and the evolving needs of society, often referred to as ‘global substain-ability.’
James A.F. Stoner is Professor of Management Systems at the Schools of BusinessAdministration of Fordham University. He received his Ph.D. from the MIT Schoolof Industrial Management (now the Sloan School) in 1967. He also earned an S.M.in Management from MIT in 1961 and a B.S. in Engineering Science from Anti-och College in 1959. Dr. Stoner is author and co-author of a number of books andjournal articles. These include Management, sixth edition, Prentice Hall; Introduc-tion to Business, Scott Foresman; and World-class Managing—Two Pages at a Time,Fordham University. He is a member of the Academy of Management and pastchair of the Management Education and Development Division; the American So-ciety for Quality; the Academy of Business Education, and the Organizational Be-havior Teaching Society, of which he is a former board member. In addition to hisresponsibilities at Fordham, Dr. Stoner advises several major companies on themovement toward quality management and teaches in executive seminars onquality and management. He has taught in executive programs in North and SouthAmerica, Europe, Africa, and Asia. In 1992, Fordham University established theJames A.F. Stoner Chair in Global Sustainability.
Drs. Werner and Stoner are the authors of five books studying changes in financein companies that are leaders in quality management: Remaking Corporate Fi-nance—The New Corporate Finance Emerging in High-Quality Companies (McGraw-Hill Primis, 1992), Finance in the Quality Revolution—Adding Value by IntegratingFinancial and Total Quality Management, (Financial Executives Research Founda-tion, 1993), Managing Finance for Quality—Bottom-Line Results from Top-Level Com-mitment (ASQ Quality Press and the Financial Executives Research Foundation,1994), Internal Audit and Innovation (Financial Executives Research Foundation,1995), and Joining Forces (Fordham Graduate School of Business monograph, 1998).They are also the authors of the textbook Modern Financial Managing—Continuityand Change.

Chapter 8Risk and its Measurement
Chapter 9The Value of Securities
Chapter 10The Cost of Capital
189
In Part III we study the interrelationship of risk and return, the frameworkused in finance theory for evaluating financial managing decisions.
Chapter 8 elaborates on risk. We define risk, describe reactions to it, es-tablish the relationship of risk to financial value, and identify the three pri-mary sources of risk. We then develop two models that relate risk to therate of return required by investors: a total risk model for a stand-aloneinvestment and a portfolio risk model, the capital asset pricing model(CAPM), for an asset held as part of a diversified portfolio.
Chapter 9 is devoted to valuation, how time value and risk can help us determine the worth of various financial instruments. We identify thevalue of a security as a present value that is independent of investors’holding periods. We distinguish between value and price. Then we studythe valuation of bonds, preferred stock, and common stock.
Chapter 10 examines the cost of capital, the rate of return a companymust earn to satisfy its investors. We present the process of calculating acost of capital: determining investors’ required rates of return, calculatingthe cost of a capital source, integrating the cost of each capital source toproduce an overall cost of capital, and producing a cost of capital sched-ule. We then illustrate each step as it applies to a company financed bybonds, preferred stock, and common stock.
PART III
RISK VS.
RETURN

CHAPTER 8
RISK
AND ITS
MEASUREMENT
Cecilia Moreira stared at the open door to her office and reflected on whathad just happened. Not more than one minute ago, Carl Leonel, one of
her best employees, had stormed out of her office in an extremely distraughtstate of mind. It was clear that Carl would not be very productive today, andCecilia wondered how this incident would affect Carl’s willingness to contributeto the organization in the future.
Cecilia was the CFO of a small company that provided service to customersseven days a week. Last week, Cecilia’s boss had circulated a memo “inform-ing” certain employees that they would have to report to work on alternate Sat-urdays. As the father of a small child, Carl felt he could not afford to work onSaturday. More important, he was enraged at what he considered a cavalier at-titude toward employees’ personal lives by the company’s management.
Cecilia thought back to last week, to a meeting with the company’s investmentbankers in which the topic was the market profile of the company’s stock. At is-sue was the high amount of risk investors felt they were taking and how thatrisk level raised the rate of return the investors demanded. Cecilia understoodthat if investors required a higher level of return, it would be more difficult toraise money and the price of the company’s stock would be depressed.
Cecilia remembered something Carl had said when he objected to working onSaturday: “Why are they making it so risky to be employed here?” As she

mulled over how to respond to Carl’s concerns, Cecilia wondered whether therisk Carl was feeling was in any way connected to the risks the investmentbankers were concerned about.
Cecilia is dealing with one of the most fundamental issues in finance, how tounderstand risk and the effects of risk on a company’s operations and value.Over the years, finance theorists have developed a comprehensive theory ofrisk as it affects the shareholder—how to define it, measure it, and estimate itsimpact on stock price. Today we are beginning to understand that each stake-holder of the firm faces risks and that all of these risks must be successfully ad-dressed if the firm is to succeed and prosper.
In this chapter we define risk and identify why it is important. We then identifydifferent types of risk and learn what events cause them. We also draw uponbasic concepts in probability and statistics to measure risk and to reach impor-tant conclusions about the relationship of risk to the financial value of the firm.
Key Points You Should Learn from This Chapter
After reading this chapter you should be able to:�� Define risk and know why it is important to the financial manager.�� State the relationship between risk and financial value.�� Describe the three primary sources of risk faced by a firm.�� Measure the risk of a single security held by itself and relate this level of risk to
investors’ required rate of return.�� Measure the risk of a security held in a diversified portfolio and relate this level
of risk to investors’ required rate of return.
191

Introductory Concepts—What Is Risk and Why Does It Matter?
Risk is the chance that something will come out worse than planned. If we crossthe street, our plan is to get to the other side safely. The risk is the chance that wemight be injured in the process. The same concept is true in finance. For exam-ple, if we invest in the common stock of a company, we anticipate a fair rate ofreturn on our investment. The risk is that we may earn less than anticipated.
Different streets have different levels of risk. The likelihood of injury in crossinga back country road is much less than that of crossing a busy urban freeway. Sim-ilarly, in finance, different investments have different levels of risk. A deposit ina federally insured bank account that pays a fixed, stated rate of interest has muchless risk than an investment in a biotech startup company.
Social scientists have identified three possible attitudes toward risk. Some peoplefind risk something that increases value. Such people are called risk seekers, andthey look for opportunities to add risk to their activities. In fact, risk seekers arewilling to pay more for something if it contains an element of risk. Gambling inLas Vegas, bungee jumping, and taking mind-altering drugs are examples of ac-tivities that are pursued by risk seekers. In each case, the individuals (or theirmoney) are safer if they avoid the activity. In each case, they pay for the oppor-tunity to be in the risky situation. In each case, the thrill from the risk itself is animportant part of the reward from the activity.
Other people dislike risk and find that it reduces value. These people are calledrisk averters. Risk averters look for opportunities to subtract risk from their ac-tivities. They stay away from risky situations and buy insurance when risk can-not be avoided. In financial markets, they insist on an increased rate of return ontheir invested money as compensation for the risks they take.
Of course, it is possible that some people are indifferent to risk. For them risk isirrelevant, and they will make decisions without taking risk into consideration.We call these people risk neutral.
When it comes to money, most people hold a combination of all three attitudes.For small amounts of money, they act as risk seekers and are willing to take smallrisks. For example, many people enjoy buying a lottery ticket, even though withthe state taking its percentage off the top, they stand to win less on average thanthey pay for the ticket. The risk of losing is high, but the amount of money at riskis very low. In this case the added excitement from the possibility of winning—however tiny—more than compensates for the small added cost.
For slightly larger amounts of money, people tend to become risk neutral. Theymight, for example, purchase tickets to a play without ever thinking that the riskof not enjoying the production should lower the ticket price.
However, as the amount of money at risk increases further and becomes a sig-nificant fraction of a person’s total wealth, almost all people become risk avert-ers. For example, there are few of us who will gamble everything we own on alottery ticket or move a long distance to take a job with an organization we knownothing about. Now the potential for significant loss dominates our thinking andoutweighs any thrill from the risk.
risk neutral—indifferent torisk
risk seeker—an individualwilling to pay to assumeadditional risk
192 Part III Risk vs. Return
risk averter—an individualwilling to pay to avoid risk

At the level of a business, large amounts of money are at risk. As a result, it isreasonable that the key stakeholders of a business—customers, suppliers, em-ployees, creditors, and investors—act as risk averters, a conclusion borne out byresearch into human and financial market behavior. If each stakeholder of the firmis a risk averter, then each will demand some form of compensation to assumerisk. And in each case, the demand for that compensation will drain value fromthe firm and leave it worse off.
� For customers, the risk of poor product or service quality reduces the pricethey are willing to pay. Over time it also reduces the amount they are willingto purchase, which further lowers the firm’s revenues.
� For suppliers, the risk of an unstable relationship increases the prices theycharge the firm. They build in protection against the possibility that their in-vestment in tooling up might not be fully recouped. They are less willing towork with an unpredictable customer or invest additional time and money,which further increases the firm’s costs.
� For employees, the risk of job changes and termination increases the wage thecompany must pay to attract and hold its staff. And as Cecilia Moreira foundout at the beginning of this chapter, employees who feel at risk tend to reducetheir willingness to contribute to the firm in general.
� For creditors, the risk of default increases the interest rate they must earn onloans to the company. They further protect themselves by writing restrictiveloan agreements that limit the firm’s operating and financial freedom.
Each of these risks—as seen by customers, suppliers, employees, and creditors—reduces the firm’s profitability and adds uncertainty to its cash flow stream. Forthe firm’s investors, the risk of lower and less-predictable income raises the rateof return they demand from the firm, increasing the firm’s “cost of capital”1 andreducing its stock price.
Chapter 8 Risk and its Measurement 193
1 Cross-reference: Cost of capital is the subject of Chapter 10.
CALVIN AND HOBBES © 1986 Watterson. Dist. by UNIVERSAL PRESS SYNDICATE. Reprinted with permission. All rights reserved.

Investors are currently demanding a rate of return of 5% on a U.S. Treasurybill considered risk-free.
Question: What rate of return will investors require from an investment inBeatriz Industries stock if the appropriate risk premium is 7%?
Solution steps: Using the Fisher equation:
Nominal rate � (1 � risk-free rate) (1 � risk premium) � 1� (1 � rf) (1 � rr) � 1 � (1.05) (1.07) � 1� .1235 � 12.35%
Answer: Investors will require a rate of return of 12.35%.
�� Risk and Financial Value
In Chapter 4 we introduced the Fisher interest rate equation:2
Nominal rate � (1 � pure rate) (1 � inflation premium) (1 � risk premium) � 1� (1 � rp) (1 � ri) (1 � rr) � 1
which, since the risk-free rate is the combination of the pure rate and the infla-tion premium, could also be written in the following form:
Nominal rate � (1 � risk-free rate) (1 � risk premium) � 1� (1 � rf ) (1 � rr) � 1
The Fisher equation illustrates the impact of risk on the rates of return investorsrequire. If an investment is perceived as being risky, investors will ask not onlyfor the risk-free rate, the interest rate appropriate for a risk-free investment, butalso for a risk premium.
194 Part III Risk vs. Return
How Risk Increases Nominal RatesExample
2 Cross-reference: The Fisher model is discussed on pages 88–92.
The level of risk estimated by investors will determine the value of the risk pre-mium (rr) and hence the required rate of return.
How a Higher Risk Premium Leads to a Higher Required Rate of Return
Example
Investors are still demanding a rate of return of 5% on a U.S. Treasury bill con-sidered risk-free. However, because of recent setbacks, investors now see Beat-riz Industries (BI) stock as a riskier investment.
Question: What rate of return will investors require from an investment inBI stock if the appropriate risk premium has risen to 8%?
Solution steps: Using the Fisher equation:
Nominal rate � (1 � risk-free rate) (1 � risk premium) � 1� (1 � rf) (1 � rr) � 1 � (1.05) (1.08) � 1� .1340 � 13.40%
Answer: Now investors will require a rate of return of 13.40%.

As financial value is the present value of the benefits investors expect to receive,financial value declines as interest rates go up.
Chapter 8 Risk and its Measurement 195
How Financial Values Decline With Higher Interest RatesExamples
Investors estimate that Beatriz Industries (BI) will produce a perpetuity of ben-efits of $5.00 per year for each common share.
Question: What was the value of BI stock when investors demanded a riskpremium of 7%.
Solution steps: With a 7% risk premium, investors required a 12.35% rate ofreturn. Using the perpetuity model:
Value � PV of perpetuity � PMT / r� $5.00 / .1235 � $40.49 per share
Answer: BI stock was worth $40.49 per share.
Question: What happened to the value of BI stock when investors raised theirrequired risk premium to 8%.
Solution steps: With a 8% risk premium, investors now require a 13.40% rateof return. Using the perpetuity model:
Value � PV of perpetuity � PMT / r� $5.00 / .1340 � $37.31 per share
Answer: The increase in perceived risk lowered BI’s stock price from $40.49to $37.31, a decline of $3.18, or 7.85%.
In summary, then, when investors perceive a high level of risk, they require a highrate of return, and the firm’s financial value is reduced. Other things equal, a firm’s value can be increased by reducing the risks to which investors are exposed.
�� Sources of Risk
Figure 8.1 identifies the forces which create risk in a firm’s financial results. Asthe figure reveals, each firm faces three primary sources of risk.
The first source of risk is environmental risk, which comes from events outsidethe firm. This includes scientific discoveries, ecological and social changes, shifts
FIGURE 8.1Sequence of risks. Vari-ability from the environ-ment is magnified by thefirm’s process variability,which is further magni-fied by the firm’s financ-ing mix.
environmental risk—unexpected changes outsidethe firm that impact itsoperations

in the business and economic climate, actions of competitors, technological ad-vances, revaluation of currency prices, political limitations such as restrictions ontransferring currency or other resources from one country to another, etc. Whilethe firm typically cannot influence these forces, it can prepare for them so that ifthey occur, plans are in place to minimize their negative impact. In addition, goodstrategic planning often finds ways to position the firm to take advantage of theseevents.
The second source of risk is process risk, which comes from unnecessary vari-ability within the firm itself. This includes problems due to out-of-control pro-duction operations as well as complications caused by dissatisfied customers, em-ployees, and suppliers. If the firm’s internal processes are functioning well, theonly variability is the small amount of natural variation found in all processes.By contrast, poorly functioning processes vary greatly in their output and tend tomagnify any problems due to changes in the environment.
Taken together, the combination of environmental risk and process risk is knownas business risk in that it describes the variability of the operating results of thebusiness. In financial terms, business risk is variability in the firm’s operatingprofit stream.
The third source of risk, known as financial risk, comes from the financing mixthe firm chooses. A firm that finances with debt adds the magnification of lever-age to its profit and cash flow. For creditors, financial risk is the risk of defaulton the debt. For stockholders, leverage magnifies any variability in the firm’s op-erating profit and cash flow, a topic explored more fully in Chapter 14.
These three risk factors cascade, one upon the other. Risks from the environmentare magnified by risks due to faulty processes, and that result is then further mag-nified by the leverage built into the financing mix. The stability of the firm’s fi-nancial results reflects the combination of these three risk sources.
�� Measuring Risk—The Total Risk Model
Since risk creates variability in a firm’s financial results, it is common to use ele-mentary statistical concepts to measure risk. In this section we look at the risk ofa single asset taken by itself. In the next section, we acknowledge that most as-sets are not held alone but rather as part of a portfolio of assets, and we look atrisk in that context.
1. Probability Distributions
To say that something is uncertain is to say that we cannot predict its outcomeprecisely. However, if we can identify possible outcomes and identify the proba-bility of each outcome occurring, we can apply some elementary concepts in prob-ability and statistics to the problem.
A probability distribution is a listing of possible outcomes along with the chancethat each will occur. For example, if we flip a fair coin, there is a 50% chance ofgetting heads and a 50% chance of getting tails. The probability distribution forthis event is therefore:
196 Part III Risk vs. Return
business risk—the totalvariability of a firm’soperating results
financial risk—the increasedvariability in a firm’sfinancial results caused byits financing mix
process risk—unnecessaryvariability caused by systemswithin the firm that are outof control
probability distribution—alisting of all possible resultsof some activity showingthe chance of each resulttaking place
NNEETT PPrreesseenntt VVaalluueeTo learn more about therisks faced by a businessvisit the International RiskManagement Institutewebsite at www.irmi.com
Outcome Probability
Heads 150% � 1.50Tails 150% � 1.50
100% � 1.00
The probabilities of all outcomes taken together must add up to 100% (or 1.00) ifwe are including every possible outcome.
A probability distribution for the returns from an investment looks much the same.Each outcome, usually shown as a rate of return, is listed along with its proba-bility. Often there is a third column describing the underlying economic condi-tions which lead to each outcome. Consider, for example, an investment in com-mon stock. In general, the better the economy, the more likely the company is toprosper, leading to increased dividends and a higher stock price, hence to highrates of return. Conversely, the worse the economy, the less likely the companyis to prosper, leading to reduced dividends and a lower stock price, therefore tolow rates of return.
Suppose you are considering an investment in the stock of one of two companies,AMR Corporation (American Airlines) and Con Edison (the New York City–areautility). AMR’s performance is very dependent on economic conditions which in-fluence the volume of business and leisure travel. By contrast, Con Edison’s busi-ness is relatively stable as demand for gas and electricity depends on populationtrends and the weather and is somewhat independent of the business cycle.
Chapter 8 Risk and its Measurement 197
FINANCE IN PRACTICE
A Classic Tale: Excessive Finan-cial Risk at PanAm
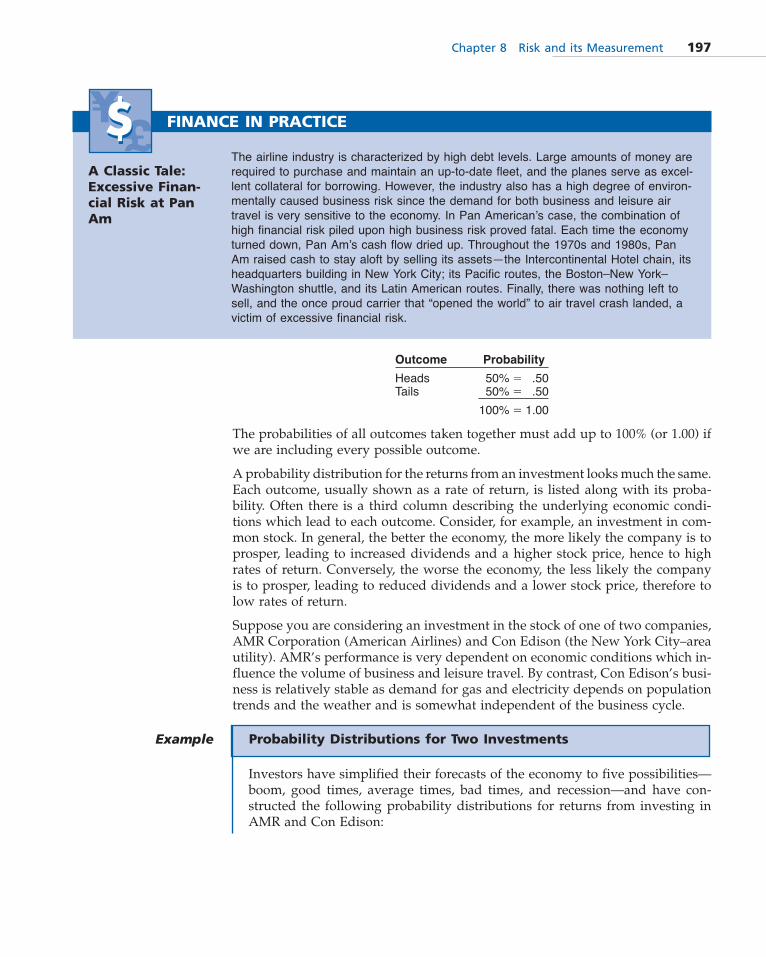
The airline industry is characterized by high debt levels. Large amounts of money arerequired to purchase and maintain an up-to-date fleet, and the planes serve as excel-lent collateral for borrowing. However, the industry also has a high degree of environ-mentally caused business risk since the demand for both business and leisure airtravel is very sensitive to the economy. In Pan American’s case, the combination ofhigh financial risk piled upon high business risk proved fatal. Each time the economyturned down, Pan Am’s cash flow dried up. Throughout the 1970s and 1980s, PanAm raised cash to stay aloft by selling its assets—the Intercontinental Hotel chain, itsheadquarters building in New York City; its Pacific routes, the Boston–New York–Washington shuttle, and its Latin American routes. Finally, there was nothing left tosell, and the once proud carrier that “opened the world” to air travel crash landed, avictim of excessive financial risk.
Probability Distributions for Two Investments Example
Investors have simplified their forecasts of the economy to five possibilities—boom, good times, average times, bad times, and recession—and have con-structed the following probability distributions for returns from investing inAMR and Con Edison:

Working with the probability distributions for returns from investing in AMRand Con Edison:
AMR Corp. Con EdisonState of the Probability Return Product Return ProductEconomy (1) (2) (1) � (2) (3) (1) � (3)
Boom .10 75.% 7.5% 30.% 3.0%Good times .20 40. 8.0 20. 4.0Average times .40 20. 8.0 12. 4.8Bad times .20 �10. �2.0 5. 1.0Recession .10 �40. �4.0 �10. �1.0
1.00 17.5% 11.8%
The expected rate of return from an investment in AMR stock is 17.5% andfrom Con Edison stock is 11.8%
State of the Probability of This Rate of Return fromEconomy State of the Economy AMR Corp. Con Edison
Boom 10%1 � 1.10 �75% �30%Good times 20%1 � 1.20 �40 �20Average times 40%1 � 1.40 �20 �12Bad times 20%1 � 1.20 �10 �15Recession 10%1 � 1.10 �40 �10
100% � 1.00
198 Part III Risk vs. Return
From the example we see that investors estimate a 10% chance of a boom, in whichcase Con Edison should do well (a 30% rate of return) and AMR should do verywell (returning 75%). Investors also estimate a 10% chance of a recession, in whichcase both companies are expected to do poorly, although AMR (a 40% loss) is ex-pected to fare worse than Con Edison (down 10%). Because AMR is so much moredependent on the economy than Con Edison, its performance is estimated to varymuch more widely, both in a boom and in a recession.
2. Expected Value
Looking a bit further at the numbers in the above example, it appears that AMRis expected to provide a higher rate of return than Con Edison. It is useful to haveone number that captures the average anticipated level of returns; a common mea-sure used for this is the expected value of the probability distribution.
The expected value of a probability distribution is calculated by multiplying eachforecasted outcome by the probability of its occurrence and summing the results.3
expected value—theweighted average of theforecasted rates of returnfrom an investment
3 Cross-reference: Formulas for expected value and the other statistical calculations discussed in thischapter are given in the Summary of Mathematical Formulas at the end of the book.
Expected Values of Two Investments Example
3. Graphing Probability Distributions
It is common to illustrate probability distributions by graphing them. Figure 8.2shows probability distributions for both AMR Corp. and Con Edison.
While it is convenient to estimate probability distributions as if there were only afew states of the economy that could take place, in reality there are many possi-

Chapter 8 Risk and its Measurement 199
ble states of the economy—a continuum of possibilities. Figure 8.3 extends theprobability distributions of AMR Corp. and Con Edison to be continuous distri-butions by filling in probabilities for the remaining possible rates of return. Thisproduces smooth curves. As is true of all probability distributions, the sum of allthe probabilities must equal 1.00, hence the total area under each curve equals1.00. With an infinite number of possible rates of return, this means that the prob-ability of any one particular rate of return occurring is infinitesimally small.
4. Variance and Standard Deviation
From Figures 8.2 and 8.3, we can see that the probability distribution for Con Edi-son is quite a bit narrower than the distribution for AMR Corp. This means thereis less of a chance that Con Edison’s rate of return will deviate far from its ex-pected value than will that of AMR. In particular, there is a smaller chance thatCon Edison’s rate of return will be significantly below its expected value—pre-cisely the concept of risk discussed earlier in the chapter.
It is common to use the concepts of variance and standard deviation to measurethe width of a probability distribution, and as a result, variance and standard de-viation are used in finance to measure the risk of financial returns. The variance(written as �2) of a probability distribution is a measure of how far each possibleoutcome deviates from the distribution’s expected value. It is calculated by: (1) ob-
FIGURE 8.2Probability distributionsfor AMR Corp. and ConEdison. The returns fromAMR are expected tovary over a much widerrange than the returnsfrom Con Edison.
FIGURE 8.3Continuous probabilitydistributions for AMRCorp. and Con Edison. Inreality there are manypossible rates of returnfrom each security.
variance—a measure of thevariability of rates of return

200 Part III Risk vs. Return
taining the deviation of each outcome by subtracting the expected value, (2) squar-ing the deviations to eliminate any difference between positive and negative de-viations, and (3) calculating a weighted average of the results using the proba-bilities as weights in the same way as we calculated the expected value. Thestandard deviation (�) is the square root of the variance and has the virtue thatits unit of measure is rate of return (whereas variance is measured as “rate of re-turn squared,” an awkward concept).
standard deviation—thesquare root of the variance
Variance and Standard Deviation of Two Investments Example
Working with the probability distributions for returns from investing in AMRand Con Edison:
1. AMR Corp. (expected return � 17.5%)
State of the Probability Return Deviation Deviation2 ProductEconomy (1) (2) (3) � (2) � 17.5 (4) � (3)2 (1) � (4)
Boom .10 75.% 57.5% 3306.25 330.625Good times .20 40. 22.5 506.25 101.250Average times .40 20. 2.5 6.25 2.500Bad times .20 �10. �27.5 756.25 151.250Recession .10 �40. �57.5 3306.25 330.625
1.00 916.250
and �9�1�6�.2�5�0� � 30.27%
The variance of AMR’s expected returns is 916.250 and the standard devia-tion is 30.27%.
2. Con Edison (expected return � 11.8%)State of the Probability Return Deviation Deviation2 ProductEconomy (1) (2) (3) � (2) � 11.8 (4) � (3)2 (1) � (4)
Boom .10 30.% 18.2% 331.24 33.124Good times .20 20. 8.2 67.24 13.448Average times .40 12. .2 .04 .016Bad times .20 5. �6.8 46.24 9.248Recession .10 �10. �21.8 475.24 47.524
1.00 103.360
and �1�0�3�.3�6�0� � 10.17%
The variance of Con Edison’s expected returns is 103.360 and the standarddeviation is 10.17%.
The calculations confirm our visual observations that Con Edison stock has lessrisk than AMR stock since Con Edison has a much lower variance and stan-dard deviation.
If the distribution of returns for a security is estimated to be normal (bell-shaped),then roughly 68% of the probability lies within plus-or-minus one standard de-viation from the expected value, about 95% lies within plus-or-minus two stan-dard deviations, and well over 99% lies between plus-or-minus three standard de-viations.

Chapter 8 Risk and its Measurement 201
Interpreting the Standard Deviation of ReturnsExample
Con Edison’s expected return is 11.8%and its standard deviation is 10.17%. Thistells us that investors are forecasting thatthe probability is 68% that the rate of re-turn on Con Edison stock will fall be-tween:
11.8% � 10.17% � 1.63%and
11.8% � 10.17% � 21.97%
By contrast, AMR’s expected return is17.5% and its standard deviation is30.27%. This tells us that investors areforecasting that the probability is 68%that the rate of return on AMR stock willfall between:
17.5% � 30.27% � � 12.77%and
17.5% � 30.27% � 47.77%
Again, these numbers point out howmuch riskier AMR stock is compared toCon Edison stock.
5. The Capital Market Line (CML)
It is common to summarize the risk-return relationship for a single asset usingthe capital market line (CML). The CML, illustrated in Figure 8.4, shows the re-lationship between the expected return and total risk from investing in a single as-set. At the left of the graph are assets with no risk, which return the risk-free rate.Further to the right on the graph lie the risky assets. The graph’s upward slopereflects investors’ risk aversion as they insist on higher rates of return to com-pensate for taking on riskier investments.
capital market line (CML)—agraph of investors’ requiredrate of return as a functionof an asset’s total risk
FIGURE 8.4The capital market line(CML). For an individualasset, investors’ requiredrate of return increaseswith total risk (�).

202 Part III Risk vs. Return
The equation of the CML is that of a straight line:
Required rate of return � rf � (slope) � �� rf � (market price of total risk) � �
where the slope is the market price of total risk, the added return required perunit of standard deviation. Note that the CML is consistent with the Fisher model:4
Nominal rate � rf � risk premium� rf � (market price of total risk) � �
For a single asset, the risk premium equals the market price of total risk multi-plied by �, the total risk of the investment.
�� Measuring Risk—The Portfolio Risk Model
So far we have treated each investment as if it were the only one owned by aninvestor. However, most investors do not put all their eggs in one basket. Rather,they spread their money across several investments. Intuitively, this makes sense.An investor who holds only one security is particularly vulnerable to any setbackin that investment. An investor who holds several securities, on the other hand,has spread the risk; low returns from one security are often offset by higher re-turns from the others, and a poor performance by one security is far less of a con-cern. In this section, we look at the risk and return of a portfolio of investments.
1. The Concept of a Portfolio
A portfolio of investments is simply a group of investments held together. If youhave $5,000 to invest, and you choose to buy $1,000 worth of each of five securi-ties, you own a five-security portfolio. When you purchase a portfolio, you havechosen to diversify your investments.
A portfolio is characterized by the investments included in it and also by theamount invested in each security. As we will see, the securities in which more isinvested play a larger role in the portfolio’s performance than those with little in-vested. In the above example you elected to invest an equal amount in each ofthe five securities, and they will all contribute equally to the portfolio’s risk andreturn. By contrast, had you chosen to invest $3,000 of your $5,000 in one secu-rity and $500 in each of the four others, you would be holding a quite differentportfolio, and the $3,000 security would dominate the portfolio’s performance.
2. Portfolio Returns
The rate of return from a portfolio is simply the weighted average of the returnsfrom each security in the portfolio where the weights reflect how much money isinvested in each security.
portfolio—a group ofinvestments held at thesame time
diversify—to spread yourmoney across severalinvestments, i.e., topurchase a portfolio
market price of total risk—the additional returndemanded by investors totake on one unit of totalrisk
4 Elaboration: On page 89 we wrote the Fisher model in expanded form as: Nominal rate = rp + ri + rr + rpri + rprr + rirr + rprirr
Regrouping the terms gives: Nominal Rate = (rp + ri + rpri) + rr (1 + rp + ri + rpri)
= rf + risk premium

Since the expected return from a portfolio is an average, it will always lie some-where in the middle of the expected returns from each security that makes up theportfolio (13.51% lies between 11.8% and 17.5%). It is impossible to produce higherexpected returns by investing in a portfolio!
3. Portfolio Risk
The real benefit from a portfolio lies in its risk-reducing ability, because, unlikethe expected return, the risk of a portfolio is not simply the weighted average ofthe risks of its components. Rather, the standard deviation of a portfolio is almostalways lower than the weighted average of the standard deviations of the com-ponent securities. To illustrate, suppose Cecilia Moreira is thinking of “investing”$1,000 in the flip of a coin.5 If heads comes up she earns 40% and gets back $1,400(her initial $1000 plus $400). If tails comes up she loses 20% or $200 and only re-trieves $800 as shown in the table below. This is certainly a risky “investment”(with expected return of 10% or $100 and standard deviation of 30% or $300).There is a 50% chance Cecilia will lose money.
Outcome Probability Payoff
Heads .50 40%($1,000) ��$400Tails .50 �20%($1,000) ��$200
Suppose, instead, Cecilia elects to diversify and invest $500 in each of two coinflips instead. The possible outcomes from this “two-investment portfolio” are:
Outcome PayoffCoin 1 Coin 2 Probability From Coin 1 From Coin 2 Total
Heads Heads .25 �40%($500) � �$200 �40%($500) � �$200 �$400Heads Tails
.50�40%($500) � �$200 �20%($500) � �$100 �
$100Tails Heads �20%($500) � �$100 �40%($500) � �$200Tails Tails .25 �20%($500) � �$100 �20%($500) � �$100 �$200
Chapter 8 Risk and its Measurement 203
Rate of Return from a PortfolioExample
Cecilia Moreira owns a portfolio consisting of $3,000 worth of AMR stock and$7,000 worth of Con Edison stock.
Question: What is the expected rate of return from Cecilia’s portfolio?
Solution steps: Calculate the weighted average rate of return given that 30%of her money is invested in AMR and the other 70% in Con Edison.
Expected Percent ofSecurity Return Portfolio Product
AMR 17.5% 30% 5.25%Con Edison 11.8% 70% 18.26
13.51%
Answer: The portfolio has an expected return of 13.51%. Since Cecilia hasmore than half (70%) of her money in Con Edison, the portfolio’s expectedreturn is closer to that investment’s 11.8% expected return than it is to AMR’s expected return of 17.5%.
5 Observation: A foolish thing to do, perhaps, but the beginning of a very good illustration of theportfolio risk reduction effect.
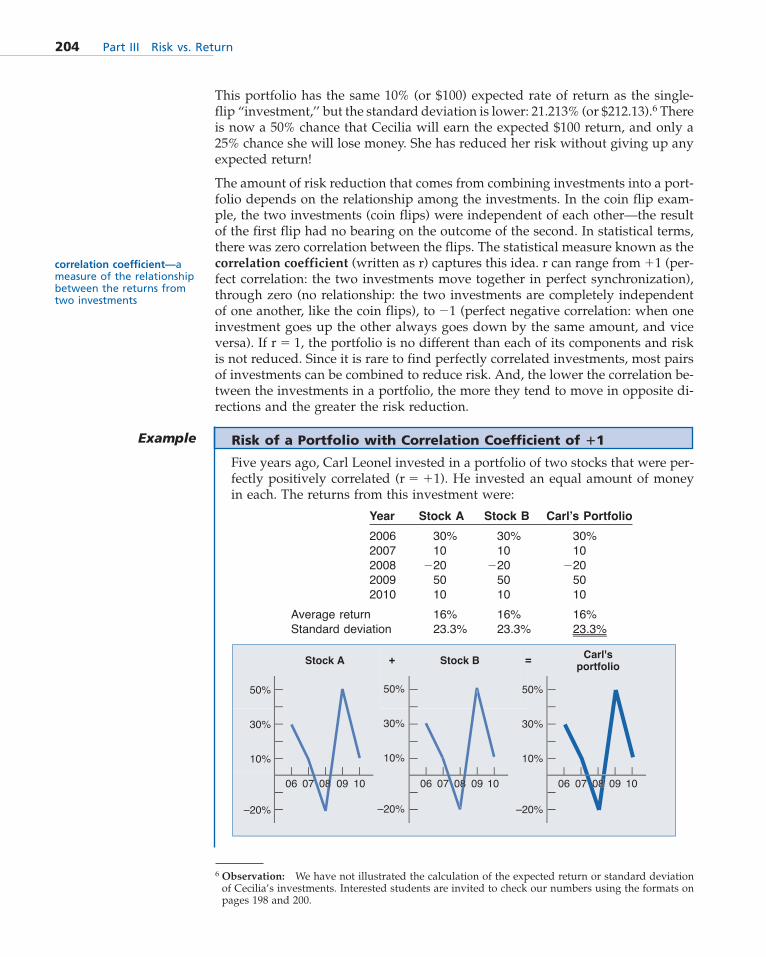
This portfolio has the same 10% (or $100) expected rate of return as the single-flip “investment,’’ but the standard deviation is lower: 21.213% (or $212.13).6 Thereis now a 50% chance that Cecilia will earn the expected $100 return, and only a25% chance she will lose money. She has reduced her risk without giving up anyexpected return!
The amount of risk reduction that comes from combining investments into a port-folio depends on the relationship among the investments. In the coin flip exam-ple, the two investments (coin flips) were independent of each other—the resultof the first flip had no bearing on the outcome of the second. In statistical terms,there was zero correlation between the flips. The statistical measure known as thecorrelation coefficient (written as r) captures this idea. r can range from �1 (per-fect correlation: the two investments move together in perfect synchronization),through zero (no relationship: the two investments are completely independentof one another, like the coin flips), to �1 (perfect negative correlation: when oneinvestment goes up the other always goes down by the same amount, and viceversa). If r � 1, the portfolio is no different than each of its components and riskis not reduced. Since it is rare to find perfectly correlated investments, most pairsof investments can be combined to reduce risk. And, the lower the correlation be-tween the investments in a portfolio, the more they tend to move in opposite di-rections and the greater the risk reduction.
204 Part III Risk vs. Return
6 Observation: We have not illustrated the calculation of the expected return or standard deviationof Cecilia’s investments. Interested students are invited to check our numbers using the formats onpages 198 and 200.
correlation coefficient—ameasure of the relationshipbetween the returns fromtwo investments
Risk of a Portfolio with Correlation Coefficient of �1Example
Five years ago, Carl Leonel invested in a portfolio of two stocks that were per-fectly positively correlated (r � �1). He invested an equal amount of moneyin each. The returns from this investment were:
Year Stock A Stock B Carl’s Portfolio
2006 30% 30% 30%2007 10 10 102008 �20 �20 �202009 50 50 502010 10 10 10
Average return 16% 16% 16%Standard deviation 23.3% 23.3% 23.3%

Chapter 8 Risk and its Measurement 205
Since the two stocks moved precisely with one another, Carl’s portfolio per-formed no differently than each of the individual stocks, and the portfolio hadthe same standard deviation as each stock. Diversification did not reduce risk.
Since the two stocks did not move precisely with one another, Carl’s portfoliohad a lower standard deviation than each stock. Diversification reduced risk.
Risk of a Portfolio with Correlation Coefficient Between �1and �1
Example
Five years ago, Carl Leonel invested in a second portfolio of two stocks thatwere somewhat positively correlated (r � �0.757). He invested an equalamount of money in each. The returns from this investment were:
Year Stock A Stock C Carl’s Portfolio
2006 30% 19% 24.5%2007 10 38 24.02008 �20 �28 �24.02009 50 33 41.52010 10 18 14.0
Average return 16% 16% 16%Standard deviation 23.3% 23.3% 21.9%
Risk of a Portfolio with Correlation Coefficient of �1Example
Five years ago, Carl Leonel invested in a third portfolio of two stocks that wereperfectly negatively correlated (r � �1). He invested an equal amount of moneyin each. The returns from this investment were:
Year Stock A Stock D Carl’s Portfolio
2006 30% 2% 16%2007 10 22 162008 �20 52 162009 50 �18 162010 10 22 16
Average return 16% 16% 16%Standard deviation 23.3% 23.3% 0%

Both U.S. federal and state law recognize the risk reducing benefits from a port-folio and require most financial institutions to hold a diverse portfolio of invest-ments. Insurance companies, for example, must spread their investments amongmany securities, and banks can lend no more than a small portion of their assetsto any one borrower. The many available mutual funds make it possible for everyinvestor, even one with a small amount of money to invest, to own a share of abroadly diversified portfolio.
4. Systematic and Unsystematic Risk
Total risk may be decomposed into two components: systematic risk and unsys-tematic risk. This division is important because diversification affects each com-ponent differently. In this section we identify these two components of total riskand begin the discussion of how investors can use diversification to reduce them.
All investments are tied in some way to the overall economy. When employmentrises, or inflation goes down, or the dollar falls against foreign currencies everyinvestment is affected in some way. The variability caused by these environmen-tal risk sources is known as systematic or systemic risk because it is due to theoverall economic system.
Systematic risk is what causes investments to be correlated. For example, a weakerdollar helps exporters so they all will do better if the dollar declines in value. Atthe same time, importers will fare worse as the falling dollar increases the priceof foreign goods. A portfolio of the stocks of exporters would have a high degreeof correlation, as would a portfolio composed only of the stocks of importers. Aportfolio of some importers and some exporters would have a much lower cor-relation. In the same manner, companies in a given industry have a high degreeof correlation since they tend to be affected similarly by economic events. As a re-sult, a portfolio of only steel manufacturers would not be very diversified.
Unsystematic or idiosyncratic risk is the variability that is not shared by othercompanies. Much of a company’s unsystematic risk comes from the variability inits internal processes—variability specific to that firm. Other sources of unsys-tematic risk are product successes and failures, patent and other legal issues, and
systematic (systemic) risk—the variability in aninvestment’s rate of returncaused by factors thatimpact all investments
unsystematic (idiosyncratic)risk—the variability in aninvestment’s rate of returncaused by factors that onlyimpact that investment
206 Part III Risk vs. Return
mutual fund—a pool ofmoney from many investorsthat is invested in aportfolio of securities
Since the two stocks moved precisely opposite to one another, the upswings inone stock were cancelled out by the downswings from the other. Diversificat-ion completely eliminated risk.

Chapter 8 Risk and its Measurement 207
personnel problems such as management shakeups and strikes. Since, by defini-tion, the unsystematic risk of one company is unrelated to the unsystematic riskof other companies, there is no correlation between changes in rates of return dueto these factors. This means that in any portfolio of securities, unsystematic move-ments tend to cancel each other out and lower risk—in the same way as CeciliaMoreira’s two-coin-flip portfolio reduced her risk.
Figure 8.5 shows what happens when portfolios of various size are constructedat random, a process known as naive diversification. Small portfolios (at the leftside of the graph) have both systematic and unsystematic risk. In larger portfo-lios, unsystematic risk is diversified away as the unsystematic movements in eachsecurity’s returns are offset by the unsystematic movements of the others. By thetime the portfolio has grown to about 15 securities, most of the unsystematic riskhas been eliminated. By contrast, systematic risk cannot be diversified away bynaive diversification. Rather, we must combine securities that have a low corre-lation with each other; random combinations of securities will not necessarily havethe low correlations required to reduce systematic risk.
Figure 8.6 points out that, compared to a portfolio composed only of domestic in-vestments, an internationally diversified portfolio has less systematic risk, per-
FIGURE 8.5How unsystematic riskcan be diversified awayby naive diversification.Any portfolio of 15 ormore securities has virtually no unsystematicrisk.
naive diversification—theconstruction of a portfolioat random
FIGURE 8.6International naive diversification. Sinceeconomies are not perfectly correlated, diversifying internationally permitsfurther risk reduction.

mitting much greater naive diversification. In the same way that the returns fromcompanies in a given industry tend to be more highly correlated than returns fromcompanies chosen from a variety of industries, the securities of companies fromone country are more highly correlated than an international selection of invest-ments. This is because all companies in a country are affected by that country’seconomy while the economies of different countries may not be highly correlated.In the global economy, systematic risk comes only from those factors that have aconsistent impact on more than one economy.
5. Beta
It is useful to have a measure of systematic risk, the way each firm responds tochanges in the overall economy. Figure 8.7 shows the characteristic lines of threeinvestments, a plot of the rate of return from the investment versus the rate of re-turn available from investing in the economy as a whole. For convenience, therate of return from the economy is typically measured by a major stock marketindex, such as the Standard & Poor’s 500 stock index, and is called the market re-turn. A low-risk investment has a characteristic line with a gradual slope, indi-cating that its rate of return is not too sensitive to changes in the economy. An av-erage-risk investment has a characteristic line with a slope of 1 (a 45-degree line)and moves up and down at the same rate as the economy. A high-risk investmenthas a characteristic line with a steep slope, indicating that it is particularly sensi-tive to changes in the economy.
The slope of an investment’s characteristic line is known as that investment’s beta.Beta equals 1 for an average-risk investment, which means that the investment’srate of return closely follows the market. If the market moves up by 5%, an av-erage-risk investment will also move up by 5%; if the market moves down by 5%,the investment will move down by 5%. A high-risk investment has a beta greaterthan 1: a 5% increase in the market will cause this investment to rise by more than5%, while a 5% market decline will push this investment down by more than 5%.
FIGURE 8.7The characteristic lines ofthree securities with dif-ferent betas. Beta, theslope of the line, mea-sures how the security’srate of return respondsto stock market movements.
208 Part III Risk vs. Return
characteristic line—therelationship of aninvestment’s rate of returnto the overall rate of returnavailable in the market
market return—the rate ofreturn from the economy,commonly measured by amajor stock market index
beta—the numericalrelationship between thereturns from an investmentand the returns from theoverall market

A low-risk investment has a beta less than 1, and a 5% change in the market willcause this investment to change by less than 5%. (Of course, no stock follows themarket precisely—betas measure average responses to market movements overtime.) Because it rises by a greater amount than the market when stock prices arerising, an investment with a beta above 1 is called an aggressive security and issought after in an up market. By contrast, an investment with beta less than 1moves by a smaller amount than the market and is known as a defensive secu-rity because it tends not to lose much of its value in a down market.
Industrial stocks in general tend to have values of beta that are distributed aroundthe market average of 1. Securities of companies which are quite sensitive to con-dition of the economy, for example airlines like AMR, have high betas. Stocks ofcompanies that are less influenced by the state of the economy, like Con Edison,have low betas. Figure 8.8 illustrates these points by listing the betas of the stocksthat make up the Dow Jones industrial, transportation, and utility averages, three
Chapter 8 Risk and its Measurement 209
aggressive security—aninvestment with a betagreater than 1
defensive security—aninvestment with a beta lessthan 1
FIGURE 8.8Beta coefficients of the Dow Jones stocks. Most Transportations are aggressive while most Utilities are defen-sive. The betas of the Industrials are distributed around the market average beta of 1.00.
The Stocks that Make Up the Dow Jones Averages and Their Betas
30 Industrials 20 Transportations 15 Utilities
Alcoa 1.86 Alexander & Baldwin 1.38 AES 1.55American Express 1.47 AMR 1.63 American Electric Power .69AT&T .50 C.H. Robinson Worldwide .70 Centerpoint Energy .72Bank of America 1.40 Con-way .99 Consolidated Edison .51Boeing 1.36 CSX 1.63 Dominion Resources .67
Caterpillar 1.85 Delta Air Lines 1.08 Duke Energy .45Chevron 1.02 Expeditors International .96 Edison International .82Cisco 1.28 FedEx 1.16 Exelon .85Coca-Cola .47 GATX 1.36 FirstEnergy .77Du Pont 1.42 Hunt Transportation .88 Nextera Energy .66
ExxonMobil .92 JetBlue Airways 1.38 Nisource .85General Electric 1.50 Kansas City Southern 2.04 PG&E .58Hewlett-Packard 1.07 Landstar System .80 Public Service Enterprises .79Home Depot 1.05 Norfolk Southern 1.41 Southern Company .43IBM .84 Overseas Shipholding Group 1.88 Williams Companies 1.66
Intel 1.05 Ryder System 1.63Johnson&Johnson .45 Southwest Airlines 1.01JPMorgan Chase 1.31 Union Pacific 1.35Kraft Foods .38 United Continental Holdings 1.73McDonald’s .37 United Parcel Service 1.01
Merck .64Microsoft .82Minnesota Mining (3M) .94Pfizer .69Procter & Gamble .42
Travelers .63United Technologies 1.06Verizon .35Wal-Mart .42Walt Disney 1.22 Reference: Bloomberg, June 1, 2011

widely followed indexes of stock market performance constructed from groupsof securities. The transportation stocks often have a beta greater than 1, reflectingtheir relatively high level of risk. The utilities, by contrast, have low betas whichindicate their relative stability. In between are the betas of the industrial stockswhich represent a broad cross-section of industries.
If a portfolio is sufficiently diversified so that all unsystematic risk has been elim-inated, the only risk remaining is the systematic—the risk connected with the over-all economy. As a result, for a well-diversified portfolio, its beta measures its risk.The beta of a portfolio, much like the expected return of a portfolio, can be cal-culated by taking the weighted average of the betas of its component investments.Adding another security changes the portfolio beta by the amount invested in thenew security multiplied by the new security’s beta. Therefore, beta captures themarginal risk of adding a security to a well-diversified portfolio. When investorsdiversify, beta becomes the appropriate measure of the risk of an investment.
6. Alpha
There is a second attribute of an investment’s characteristic line that is of interestto investors: where it intersects the Y-axis. This value, known as the alpha of theinvestment, is the rate of return from the investment when the return from theoverall market equals zero. More important, the greater an investment’s alpha,the greater the return from the investment no matter what the overall market isdoing.
Figure 8.9 shows the characteristic lines of three investments that differ only bytheir alpha. Since they all have the same slope, or beta, all three investments havethe same systematic risk. The thickest line is the average security of this risk classwith alpha equal to zero. Lying above the thick line is the charactersitc line of an
210 Part III Risk vs. Return
alpha—the extra returnfrom an investment abovethat of the average securityof the same risk
FIGURE 8.9The characteristic lines ofthree securities with dif-ferent alphas. Alpha, theY-intercept of the line,measures how the securi-ty’s rate of return differsfrom the average secu-rity of the same risk.
NNEETT PPrreesseenntt VVaalluueeBetas can be found atYahoo by going tohttp://finance.yahoo.comEnter the ticker symbol ofthe stock and click theGET QUOTES button, thenclick on “Key Statistics”under “COMPANY” in theleft-hand menu bar.

Chapter 8 Risk and its Measurement 211
investment with positive alpha. Note that for any level of market return, the re-turn from this investment exceeds that of the average security. Below the thickline is the characterstic line of an investment with negative alpha. This investmentyields a lower return than the average security for any level of market return.
If the only reason for differences in the rate of return from invesetments were dif-ferences in their systematic risk as measured by beta, all investments would havealpha equal to zero in an efficient market. Investors would arbitrage away non-zero alphas. Positive alpha securities with their higher return would be demandedby investors who would bid up their price and lower their rate of return. Investorswould avoid negative alpha investments, and their price would fall thereby in-creasing their rate of return. However, since positive and negative alphas do ex-ist, either the financial markets are not efficient in recognizing and removing theseabnormal returns or there are other factors beyond systematic risk that are deter-mining the returns of these investments.
Investments with positive alpha are very attractive to investors. They have thesame risk (beta) as the average investment yet they provide a higher rate of re-turn. As a result, no matter what level of risk investors desire to take, they are al-ways “seeking alpha.”
7. The Security Market Line (SML)
It is common to summarize the risk-return relationship for a portfolio or for anasset held in a portfolio by using the security market line (SML), as shown inFigure 8.10. The SML illustrates the relationship between the expected return frominvesting in an asset and its portfolio risk. At the left of the graph are assets withno risk, which return the risk-free rate. Further to the right lie the risky assets.The graph’s upward slope reflects investors’ risk aversion as they insist on higherrates of return to compensate for taking on riskier investments.
Since the market average beta is 1.00, investments with betas equal to 1 reflect therisk of the market as a whole and would be expected to provide a rate of returnequal to that of the market in general, a rate known as the “rate of return on themarket portfolio.” This point is illustrated by the dotted lines on the graph.
security market line (SML)—a graph of investors’required rate of return as afunction of an asset’sportfolio (systematic) risk
FIGURE 8.10The security market line(SML). For an asset heldas part of a portfolio, investors’ required rateof return increases withportfolio risk (�).

The equation of the SML is that of a straight line:
Required rate of return � rf � (slope) � �� rf � (market price of portfolio risk) � �
where the slope is called the market price of portfolio risk, the added return re-quired per unit of beta. In Figure 8.10, investors’ required rate of return rises fromthe risk-free rate (rf) to the required rate of return on the market portfolio (rm) asbeta goes from zero to one. Since the slope of a straight line is �y/�x, the mar-ket price of portfolio risk must be:
��
�
yx� � �
r1m
�
�
0rf� � rm � rf
which is the difference between the rate of return currently required on an aver-age risk stock or portfolio and today’s risk-free rate. Including this detail, the SMLcan be written:
Required rate of return � rf � (rm � rf ) �
Like the capital market line, this equation is also consistent with the Fisher model:
Nominal rate � rf � risk premium� rf � (rm � rf) �
Here, the risk premium equals the market price of portfolio risk (rm � rf) multi-plied by �, the portfolio risk of the investment.
212 Part III Risk vs. Return
market price of portfoliorisk—the additional returndemanded by investors totake on one unit ofportfolio risk
Using the Security Market Line to Obtain Required Rates of Return
Example
AMR stock has a beta of 1.35, and Con Edison has a beta of .75. The risk-freerate is 5% and market price of portfolio risk is 8.5%.
Question: What is the required rate of return on a stock of average risk, onAMR stock, and on Con Edison stock?
Solution steps:
1. Average-risk stock—Recall that the average-risk stock has a beta of 1:
Required rate � rf � (market price of portfolio risk) � �� 5% � 8.5% � 1.00� 5% � 8.5% � 13.50%
2. AMR stock:
Required rate � rf � (market price of portfolio risk) � �� 5% � 8.5% � 1.35� 5% � 11.475% � 16.475% ≈ 16.48%
3. Con Edison stock:
Required rate � rf � (market price of portfolio risk) � �� 5% � 8.5% � 0.75� 5% � 6.375% � 11.375% ≈ 11.38%

Chapter 8 Risk and its Measurement 213
Answer: Investors will require a rate of return of 11.38% on the low-risk ConEdison stock, 13.50% on the average-risk stock, and 16.48% on the high-riskAMR stock.
Earlier we pointed out that an investor can eliminate unsystematic risk throughnaive diversification by simply constructing any portfolio of 15 or more invest-ments. Since naive diversification is so easy and costless, the financial marketsprovide no added return to those who take on unsystematic risk. Eliminating sys-tematic risk, on the other hand, is not costless but requires combining assets thatdo not respond in tandem to economic forces, the concept captured by beta. Alow-beta investment, with its low correlation with the economy, tends to reducethe systematic risk of a portfolio, as opposed to a high-beta investment which canadd risk. Accordingly, low-beta securities are highly desirable and sell at highprices and low rates of return. High-beta securities are risky, and investors insiston much higher rates of return as compensation.
As we shall explore more fully in the next chapter, investors use the required rateof return on an investment as an important input in setting an investment’s mar-ket price. The security market line relationship, relating required rates of returnto beta, thus also tells us something about the appropriate price for an asset thatis likely to be held in a portfolio in the capital markets. As a result, finance theo-rists have given this model the name capital asset pricing model (CAPM).
The security market line differs from the capital market line in that the CML re-lates return to total risk while the SML relates return to portfolio risk. The CMLis the appropriate model to use when evaluating assets that will not be held in aportfolio, for example, when evaluating the worth of a small business fully ownedby its founder who owns few other investments. The SML is the appropriate modelto use when valuing a publicly traded security, one that most likely appears inmany investment portfolios. This insight, that the correct measure of investmentrisk depends on the context in which investments are held, is one of the impor-tant discoveries of modern financial theory.
capital asset pricing model(CAPM)—the finance modelrelating asset prices andrates of return to the asset’sbeta, its impact on the riskof a well-diversifiedportfolio

Summary of Key Points
�� Define risk and know why it is important to the fi-nancial manager. Risk is the chance that an out-come might turn out to be worse than expected. It isimportant to financial managing because the firm’sstakeholders are risk averters when it comes to in-vestments of large amounts of time, energy, andmoney; they require additional compensation for as-suming a greater amount of risk. As a result, highrisk levels are costly—value can be added to the firmand all its stakeholders by keeping risk levels low.
�� State the relationship between risk and financialvalue. The Fisher model of interest rates identifiesrisk premiums as an important component of rates.Financial values, the present values of expected fu-ture cash flows, are inversely related to interest rates.Accordingly, a firm that exposes its stakeholders tohigh risks must produce higher rates of return to ad-equately reward its stakeholders.
�� Describe the three primary sources of risk faced bya firm. There are three sources of risk for the busi-ness firm. Environmental risk comes from changes
external to the business—economic, ecological, social,technological, attitudinal, etc. Process risk resultsfrom unnecessary variability inside the firm. Com-bined, environmental risk and process risk are knownas business risk. The third risk is financial risk, theadded variability of the firm’s profit and cash flowstream due to the firm’s financing mix.
�� Measure the risk of a single security held by itselfand relate this level of risk to investors’ requiredrate of return. Risk can be measured using basic statistical concepts. Forecasts of future events aretranslated into probability distributions. The ex-pected value of the distribution measures the amountof return and, for a single investment, standard de-viation measures the risk. The capital market linesummarizes the return-risk relationship for a singleasset.
�� Measure the risk of a security held in a diversifiedportfolio and relate this level of risk to investors’required rate of return. Many investments are heldas part of diversified portfolios. While the expected value of returns from a portfolio is an average of theexpected values of the individual components, the
214 Part III Risk vs. Return
Cecilia Moreira hung up the phone. She had just finished giving the goodnews to Carl Leonel. Earlier that day she had convinced her company’s
president to withdraw the memo that had so enraged Carl and to empower ateam of the affected employees to work on a better solution to the problem.Carl was clearly relieved, and Cecilia also felt a lot better. As she reflected onCarl’s complaint, she found herself a bit more comfortable with the issues theincident had triggered.
Risk comes from uncertainty, from not knowing what will happen. When peoplepredict there will be risk, they increase their demands on the firm. The conceptis the same whether the subject is rates of return provided to stockholders,product quality delivered to the customers, or the job environment as perceivedby employees like Carl. An important role of managing is to reduce perceivedrisk levels to get the most from every contributor to the company’s success.
For investors holding portfolios of securities, the relationship between Carl andthe company was not very important. It was part of their unsystematic risk andwas easy to diversify away. To Carl, on the other hand, his job was his only fi-nancial resource and not simply one component of a larger portfolio. Carl hadno way to “diversify away” his on-the-job risk.
Cecilia made a note to examine the systematic and unsystematic risk of hercompany’s stock. She was certain that this would help her understand and thenaddress the risk levels the company’s stockholders were seeing. She sat backand smiled as she recognized how her understanding of finance had broad ap-plicability throughout the company.

Chapter 8 Risk and its Measurement 215
standard deviation is not. Rather, it depends on thecorrelation between the returns from the portfolio’sinvestments, and this enables portfolios to reduce in-vestment risk. A high degree of positive correlationresults in little risk reduction while a low or negativecorrelation permits much of the risk to be eliminated.At the extreme, investments with a perfect negative(–1) correlation can be combined to eliminate all ofthe risk. The capital asset pricing model shows thatrisk can be subdivided into the systematic and theunsystematic. Unsystematic (or idiosyncratic) risk,the variability of each investment that is not relatedto any other, can be eliminated with naive diversifi-cation (any combination of assets will suffice) andtherefore carries no added rate of return. Systematic(or systemic) risk, the variability related to broad eco-nomic factors, affects all investments and is not soeasily eliminated. To measure systematic risk, we cal-culate an investment’s beta, the way in which its re-turns change with the economy. Since reducing sys-tematic risk requires finding low-beta investments,beta is the relevant risk variable for investments heldin diversified portfolios. The security market line pro-vides the relationship of required rates of return tobeta.
Questions1. What is risk? Give an example of a risk faced by each
of the following stakeholders:
a. Customersb. Employeesc. Suppliersd. Governmentse. Neighborsf. Lendersg. Investors
2. If risk is the chance of loss, why is the standard de-viation used as a risk measure when it measures vari-ation both below and above the expected value?
3. Are you risk averse, risk neutral, or a risk seeker? Isyour answer absolute or can you think of circum-stances where you might have each of these attitudes?
4. Give an example of each of the following risks facedby the firm:
a. Environmental riskb. Process riskc. Financial risk
5. What is a portfolio? Why do people diversify their in-vestments? Why is it better to diversify across coun-tries than only within one country?
6. Under what circumstance would the risk of a portfo-lio be the same as the riskiness of its component parts?
7. Why is it not too useful to diversify by buying thestocks of five companies in the same industry?
8. Why is naive diversification called naive? What doesit do?
9. Comment on the accuracy of the following assertion:“It is easy to diversify away unsystematic risk, but itis impossible to eliminate systematic risk.”
10. Even though the unsystematic risk within one com-pany does not affect the risk of a holder of a largeportfolio, it may still be relevant to that investor.Why?
11. What is the beta of a security? Connect it to the fol-lowing concepts:
a. Low-risk securityb. Average-risk securityc. High-risk securityd. Aggressive securitye. Defensive security
12. Why do transportation stocks have high betas whileutilities have low betas?
13. What is the alpha of a security? Why do investors“seek alpha”?
14. Identify the:
a. Capital market lineb. Security market line
Distinguish between them. When should each beused?
15. How would the security market line change if:
a. Investors’ forecast of inflation changed?b. Investors’ level of risk aversion changed?
16. The AT&T company sponsors a well-known “Colle-giate Investment Challenge,” in which students sim-ulate managing a $500,000 stock portfolio and com-pete to see who can produce the highest-valueportfolio by the end of the game. What portfolio ofstocks is likely to be the winning one?
Problems1. (Required rates of return) U.S. Treasury bills cur-
rently return 4.5%. Determine the required rate on aninvestment with a risk premium of:
a. 2% c. 7%b. 4.5% d. 9.5%
2. (Required rates of return) U.S. Treasury bills cur-rently return 5%. Determine the risk premium in-vestors are demanding if their required rate of returnis:
a. 5% c. 10%b. 7.5% d. 12.5%

3. (Probability distributions of returns) Investors havemade the following forecast about the returns frominvesting in securities issued by two companies:
State of the Probability of thiseconomy state of the economy
Boom 15% � 1.15Good times 25% � 1.25Average times 35% � 1.35Bad times 20% � 1.20Recession 5% � 1.05
100% � 1.00
State of the Rate of Return fromeconomy Company A Company B
Boom 50% 25%Good times 30 20Average times 20 15Bad times �5 5Recession �25 0
a. Graph each probability distribution.b. Calculate the expected return of each distribution.c. Calculate the standard deviation of each distribu-
tion.d. In terms of total risk, which security is riskier? How
do you conclude this?
4. (Probability distribution of returns) Investors havemade the following forecast about the returns frominvesting in securities issued by two companies:
State of the Probability of thiseconomy state of the economy
Boom 5% � 1.05Good times 20% � 1.20Average times 50% � 1.50Bad times 15% � 1.15Recession 10% � 1.10
100% � 1.00
State of the Rate of Return fromeconomy Company C Company D
Boom 25% 50%Good times 20 30Average times 15 20Bad times 5 �5Recession 0 �25
a. Graph each probability distribution.b. Calculate the expected return of each distribution.c. Calculate the standard deviation of each distribu-
tion.d. In terms of total risk, which security is riskier? How
do you conclude this?
5. (The capital market line) The risk free rate of inter-est is 4% and the market price of total risk is 0.5.
a. Write the equation of the capital market line.b. What is the required rate of return on a security
with a standard deviation of 5%?c. What is the required rate of return on a security
with a standard deviation of 10%?d. What is the required rate of return on a security
with a standard deviation of 15%?
6. (The capital market line) The capital market line isgiven by:
Required rate � .06 � 0.4 �
a. What is the risk-free rate of interest?b. What is the value of the market price of total risk?c. What is the required rate of return on a security
with a standard deviation of 12%?d. What is the standard deviation of a security with
a required rate of return of 14%?
7. (Rate of return on a portfolio) A portfolio has beenconstructed from the following securities:
Security Expected return Amount invested
K 15.% $5,000L 9. 3,000M 20. 2,000
a. What is the expected rate of return from this port-folio?
b. If Security L is sold, what will be the expected re-turn of the remaining two-stock portfolio?
c. If the investor buys $10,000 of Security N, with ex-pected return of 12%, and adds it to the portfolio,what will be the expected return of the resultingfour-stock portfolio?
d. If the investor sells $2,000 of Security K, what willbe the expected return of the remaining three-stockportfolio?
8. (Rate of return on a portfolio) A portfolio has beenconstructed from the following securities:
Security Expected return Amount invested
P 5.% $40,000Q 18. 25,000R 15. 35,000
a. What is the expected rate of return from this port-folio?
b. If Security Q is sold, what will be the expected re-turn of the remaining two-stock portfolio?
c. If the investor buys $50,000 of Security S, with ex-pected return of 10%, and adds it to the portfolio,what will be the expected return of the resultingfour-stock portfolio?
d. If the investor sells $20,000 of Security R, what willbe the expected return of the remaining three-stockportfolio?
216 Part III Risk vs. Return

9. (Risk of a portfolio) Stocks T, U, and V have pro-vided the following returns to investors over the pastfive years:
Year Stock T Stock U Stock V
2006 15.% 15.% 5.%2007 �10. �10. 30.
2008 20. 20. 0.
2009 35. 35. �15.
2010 5. 5... 15.
a. What was the average annual rate of return on eachstock?
b. What would have been the average rate of returnon a portfolio composed of 50% of Stock T and 50%of Stock U?
c. What would have been the average rate of returnon a portfolio composed of 50% of Stock T and 50%of Stock V?
d. Which securities are positively correlated? nega-tively correlated?
10. (Risk of a portfolio) You are thinking of investinghalf of your money into each of two stocks, both ofwhich have a 50%–50% chance of earning 25% orearning only 5%.
a. What is the expected rate of return from eachstock?
b. What is the standard deviation of returns from eachstock?
c. What is the standard deviation of your plannedportfolio?
d. Why have you lowered your risk by investing inthe two securities instead of just one?
11. (Beta) ABC Transport has a beta of 1.3 while CentralGas and Power has a beta of .70
a. Which stock is aggressive?b. Which stock is defensive?c. If the market rose by 20%, what would happen to
the value of each on average?d. If the market fell by 10%, what would happen to
the value of each on average?
12. (Beta) Classify the following stocks as aggressive, av-erage, or defensive and identify if its beta is less than1, equal to 1, or greater than 1:
a. Stock rises by 30% in response to a market rise of20%.
b. Stock rises 10% in response to a market rise of 10%.c. Stock falls 15% in response to a market decline of
20%.
d. Stock falls 10% in response to a market decline of10%.
13. (Beta of a portfolio) ABC Transport has a beta of 1.3while Central Gas and Power (CGP) has a beta of .70.What is the beta of a portfolio of these two securitiesif the amount of each is:
a. 20% ABC, 80% CGP?b. 40% ABC, 60% CGP?c. 60% ABC, 40% CGP?d. 80% ABC, 20% CGP?
14. (Beta of a portfolio) A portfolio manager currentlyholds a diversified portfolio of 30 stocks. The amountinvested in each stock is $10,000, and the portfoliobeta is 1.05. What would happen to the portfolio betaunder each of the following scenarios?
a. Another stock is added to the portfolio: amount$10,000, beta 1.05.
b. One of the stocks with beta 1.05 is sold.c. Another stock is added to the portfolio: amount
$10,000, beta 1.50.d. One of the stocks with beta 0.75 is sold.
15. (The security market line) The risk-free rate of in-terest is 7%, and the risk premium for a stock withbeta of 1 is 6%. XXX stock has a beta of 0.85, and YYYstock has a beta of 1.2.
a. What is the equation of the SML?b. Draw the SML.c. What is the required rate of return on XXX stock?d. What is the required rate of return on YYY stock?
16. (The security market line) The pure rate of interestis 3%, investors demand a 5% inflation premium onlong-term investments, and the risk premium for astock with beta of 1 is 7%. ZZZ stock has a beta of1.35.
a. What is the required rate of return on ZZZ stock?b. Suppose investors increase their inflation premium
to 6%. What is the new required rate of return onZZZ stock?
c. Now suppose investors increase their risk pre-mium for a stock with beta of 1 to 8% (the infla-tion premium is still 5%). What is the new requiredrate of return on ZZZ stock?
d. Now suppose investors decrease their estimate ofZZZ’s beta to 1.25 (the inflation premium is still5%, and the risk premium is still 7%). What is thenew required rate of return on ZZZ stock?
Chapter 8 Risk and its Measurement 217

C R E D I T S
Art (cartoons): pages xi, xix, xxi, 12, 36, 66, 117, 154, 180, 232, 240, 267, 303, 352,378, 397, and 444: © 2006, 2011 and reprinted by permission of Eric Werner; page91: by permission of John L. Hart FLP, and Creators Syndicate, Inc.; page 193:CALVIN AND HOBBES © 1986 Watterson. Dist. by UNIVERSAL PRESS SYNDI-CATE. Reprinted with permission. All rights reserved.; page 328: © 2005 Leo Cul-lum from cartoonbank.com. All rights reserved.; page 425: © The New Yorker Col-lection 1965 Joseph Mirachi from cartoonbank.com. All rights reserved.
Figures: 1.5: Johnson & Johnson Credo reprinted by permission of Johnson & John-son; 4.1, 4.2: Financial data from Bloomberg website. Reproduced with permis-sion of Bloomberg, LP; 4.5, 7.5, 9.2, 9.3, and 6D.1: Financial data from THE WALLSTREET JOURNAL, EASTERN EDITION by BARTLEY, ROBERT L. Copyright2000 by DOW JONES & CO., INC. Reproduced with permission of DOW JONES& CO., INC. via Copyright Clearance Center; 7.2: China Hydroeclectric Corpora-tion tombstone reprinted by permission of Broadband Capital Management, LLC;7.3: City of Winooski, Vermont tombstone reprinted by permission of Bittel Fi-nancial Advisors; 13.3, 13.8: Juran Trilogy and Quality Storyboard reprinted bypermission of the Juran Institute, Inc.; 16.4: McDonald’s Dividend and Split In-formation screenshot reprinted by permission of McDonald’s Corporation.
Calculators: HP–10bII, HP–10bII+, HP–12c, HP–12c Platinum, HP–17bII+,HP–20b: images courtesy of and © Copyright 2011 Hewlett-Packard DevelopmentCompany, L.P. Reproduced with permission; BA II PLUS, BA II PLUS Professional:images courtesy of and used with permission. © Texas Instruments Incorporated.
Spreadsheets: screen shots created with Microsoft ® Office Excel 2007 ® spread-sheet software and reprinted with permission from Microsoft Corporation.