for lease - loopnetimages2.loopnet.com/d2/...kdhap6fiispatufradawnmniyg8r_aw/doc… · zoning: il:...
TRANSCRIPT
Campana Waltz Commercial Real Estate, LLC
Ron A. Campana, Jr.
11832 Fishing Point Drive, Suite 400
Newport News, Virginia 23606
757.327.0333
www.CampanaWaltz.com
This information was obtained from sources deemed to be reliable, but is not warranted.
This offer subject to errors and omissions, or withdrawal, without notice.
FOR ADDITIONAL INFORMATION, PLEASE CONTACT:
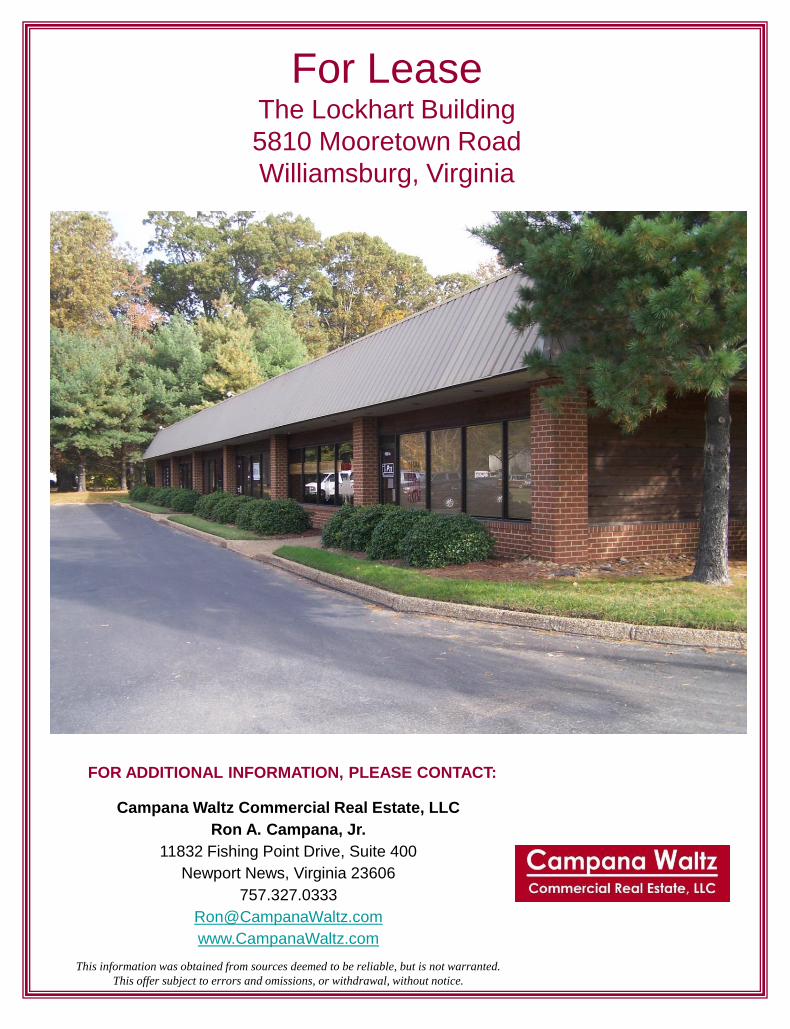
For LeaseThe Lockhart Building
5810 Mooretown Road
Williamsburg, Virginia

FOR LEASE The Lockhart Building
5810 Mooretown Road
Williamsburg, Virginia 23185
Description: The Lockhart Building is a flex space with retail frontage and
warehouse space in the rear. Ideal for a contractor or other business
that needs a showroom and work area. Frontage on Mooretown
Road gives business ideal exposure at an aggressive rental rate.
The Property is located within minutes of I-64, Route 199,
Wal-Mart, Lowes, Home Depot, and Sentara Medical Center.
Available Spaces: Suites A&B= 3,000 square feet
Suite C= 1,500 square feet
(Suites A, B, and C can be combined for a total of 4,500 square
feet)
Built: 1985
Lease Rate: $11.00/Square Foot (Lease Rate is inclusive of CAM fees)
Zoning: IL: Limited Industrial
Additional Information: Location Map
Demographics
For Additional Information, Please Contact:
Ron A. Campana, Jr.
Campana Waltz Commercial Real Estate, LLC
11832 Fishing Point Drive, Suite 400
Newport News, Virginia, 23606
757.327.0333
www.CampanaWaltz.com
This information was obtained from sources deemed to be reliable, but is not warranted.
This offer subject to errors and omissions or withdrawal without notice.

This information was obtained from sources deemed to be reliable, but is not warranted.
This offer subject to errors and omissions, or withdrawal, without notice.
5810 Mooretown Road,
Williamsburg, Virginia

This information was obtained from sources deemed to be reliable, but is not warranted.
This offer subject to errors and omissions, or withdrawal, without notice.
5810 Mooretown Road,
Williamsburg, Virginia

Demographic and Income Profile5810 Mooretown Rd, Williamsburg, Virginia, 23188 Prepared by Janice Lewis, CCIMDrive Time: 5 minute radius Latitude: 37.32190
Longitude: -76.73528
Summary Census 2010 2016 2021Population 3,728 4,006 4,248Households 1,431 1,528 1,615Families 889 946 997Average Household Size 2.60 2.62 2.63Owner Occupied Housing Units 791 827 878Renter Occupied Housing Units 640 701 737Median Age 36.1 37.2 38.2
Trends: 2016 - 2021 Annual Rate Area State NationalPopulation 1.18% 0.97% 0.84%Households 1.11% 0.93% 0.79%Families 1.06% 0.86% 0.72%Owner HHs 1.20% 0.89% 0.73%Median Household Income -1.73% 2.35% 1.89%
2016 2021 Households by Income Number Percent Number Percent
<$15,000 156 10.2% 186 11.5%$15,000 - $24,999 162 10.6% 167 10.3%$25,000 - $34,999 151 9.9% 144 8.9%$35,000 - $49,999 233 15.2% 323 20.0%$50,000 - $74,999 297 19.4% 181 11.2%$75,000 - $99,999 204 13.4% 221 13.7%$100,000 - $149,999 212 13.9% 248 15.4%$150,000 - $199,999 85 5.6% 111 6.9%$200,000+ 28 1.8% 34 2.1%
Median Household Income $53,679 $49,191Average Household Income $66,557 $70,117Per Capita Income $27,774 $29,156
Census 2010 2016 2021 Population by Age Number Percent Number Percent Number Percent
0 - 4 261 7.0% 259 6.5% 268 6.3%5 - 9 223 6.0% 260 6.5% 266 6.3%10 - 14 223 6.0% 232 5.8% 274 6.4%15 - 19 234 6.3% 207 5.2% 218 5.1%20 - 24 300 8.0% 240 6.0% 212 5.0%25 - 34 577 15.5% 684 17.1% 668 15.7%35 - 44 464 12.4% 501 12.5% 618 14.5%45 - 54 494 13.2% 489 12.2% 450 10.6%55 - 64 410 11.0% 455 11.4% 476 11.2%65 - 74 292 7.8% 379 9.5% 417 9.8%75 - 84 190 5.1% 219 5.5% 279 6.6%
85+ 61 1.6% 82 2.0% 103 2.4%Census 2010 2016 2021
Race and Ethnicity Number Percent Number Percent Number PercentWhite Alone 2,508 67.3% 2,596 64.8% 2,646 62.3%Black Alone 827 22.2% 898 22.4% 962 22.6%American Indian Alone 14 0.4% 18 0.4% 21 0.5%Asian Alone 107 2.9% 129 3.2% 153 3.6%Pacific Islander Alone 2 0.1% 2 0.0% 2 0.0%Some Other Race Alone 111 3.0% 157 3.9% 205 4.8%Two or More Races 159 4.3% 207 5.2% 259 6.1%
Hispanic Origin (Any Race) 297 8.0% 424 10.6% 548 12.9%Data Note: Income is expressed in current dollars.
Source: U.S. Census Bureau, Census 2010 Summary File 1. Esri forecasts for 2016 and 2021.
March 20, 2017
©2016 Esri Page 1 of 6

Demographic and Income Profile5810 Mooretown Rd, Williamsburg, Virginia, 23188 Prepared by Janice Lewis, CCIMDrive Time: 5 minute radius Latitude: 37.32190
Longitude: -76.73528
AreaStateUSA
Trends 2016-2021Trends 2016-2021
Ann
ual R
ate
(in
perc
ent)
2
1.5
1
0.5
0
-0.5
-1
-1.5
Population Households Families Owner HHs Median HH Income
20162021
Population by AgePopulation by Age
Perc
ent
16
14
12
10
8
6
4
2
00-4 5-9 10-14 15-19 20-24 25-34 35-44 45-54 55-64 65-74 75-84 85+
2016 Household Income 2016 Household Income
<$15K10.2%
$15K - $24K10.6%
$25K - $34K9.9%
$35K - $49K15.2%
$50K - $74K19.4%
$75K - $99K13.4%
$100K - $149K13.9%
$150K - $199K5.6%
$200K+1.8%
2016 Population by Race2016 Population by Race
Perc
ent
605550454035302520151050
White Black Am. Ind. Asian Pacific Other Two+
2016 Percent Hispanic Origin: 10.6%
Source: U.S. Census Bureau, Census 2010 Summary File 1. Esri forecasts for 2016 and 2021.
March 20, 2017
©2016 Esri Page 2 of 6
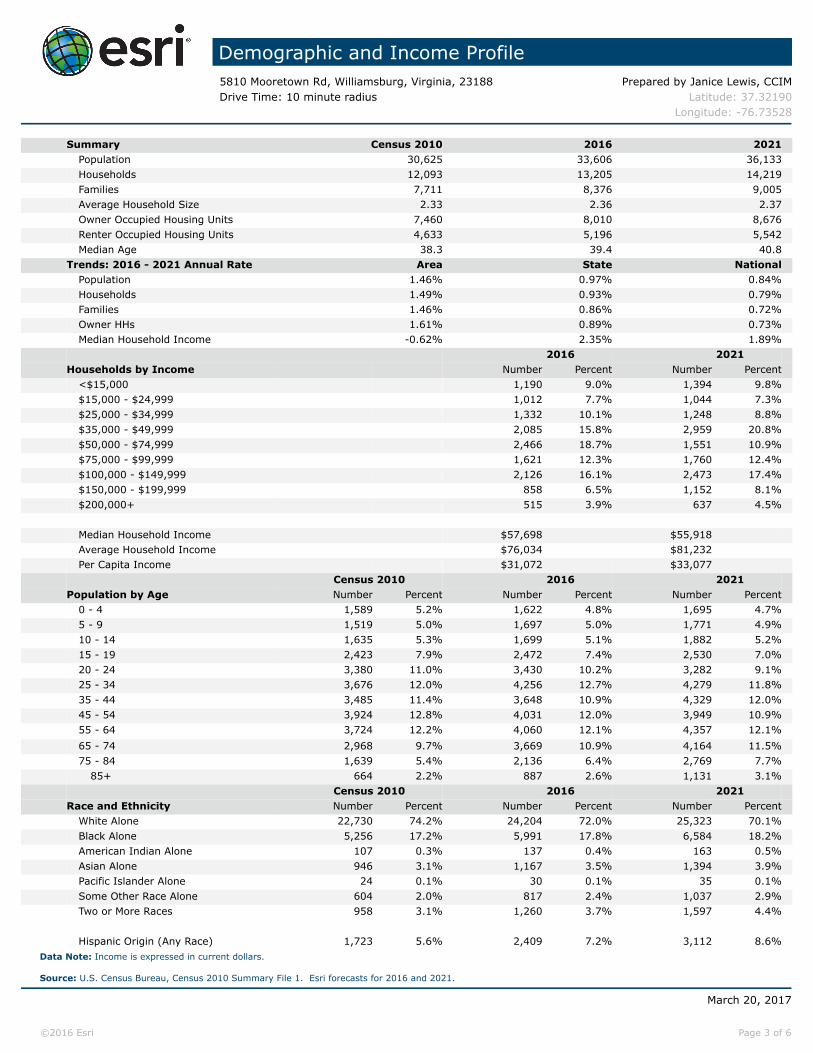
Demographic and Income Profile5810 Mooretown Rd, Williamsburg, Virginia, 23188 Prepared by Janice Lewis, CCIMDrive Time: 10 minute radius Latitude: 37.32190
Longitude: -76.73528
Summary Census 2010 2016 2021Population 30,625 33,606 36,133Households 12,093 13,205 14,219Families 7,711 8,376 9,005Average Household Size 2.33 2.36 2.37Owner Occupied Housing Units 7,460 8,010 8,676Renter Occupied Housing Units 4,633 5,196 5,542Median Age 38.3 39.4 40.8
Trends: 2016 - 2021 Annual Rate Area State NationalPopulation 1.46% 0.97% 0.84%Households 1.49% 0.93% 0.79%Families 1.46% 0.86% 0.72%Owner HHs 1.61% 0.89% 0.73%Median Household Income -0.62% 2.35% 1.89%
2016 2021 Households by Income Number Percent Number Percent
<$15,000 1,190 9.0% 1,394 9.8%$15,000 - $24,999 1,012 7.7% 1,044 7.3%$25,000 - $34,999 1,332 10.1% 1,248 8.8%$35,000 - $49,999 2,085 15.8% 2,959 20.8%$50,000 - $74,999 2,466 18.7% 1,551 10.9%$75,000 - $99,999 1,621 12.3% 1,760 12.4%$100,000 - $149,999 2,126 16.1% 2,473 17.4%$150,000 - $199,999 858 6.5% 1,152 8.1%$200,000+ 515 3.9% 637 4.5%
Median Household Income $57,698 $55,918Average Household Income $76,034 $81,232Per Capita Income $31,072 $33,077
Census 2010 2016 2021 Population by Age Number Percent Number Percent Number Percent
0 - 4 1,589 5.2% 1,622 4.8% 1,695 4.7%5 - 9 1,519 5.0% 1,697 5.0% 1,771 4.9%10 - 14 1,635 5.3% 1,699 5.1% 1,882 5.2%15 - 19 2,423 7.9% 2,472 7.4% 2,530 7.0%20 - 24 3,380 11.0% 3,430 10.2% 3,282 9.1%25 - 34 3,676 12.0% 4,256 12.7% 4,279 11.8%35 - 44 3,485 11.4% 3,648 10.9% 4,329 12.0%45 - 54 3,924 12.8% 4,031 12.0% 3,949 10.9%55 - 64 3,724 12.2% 4,060 12.1% 4,357 12.1%65 - 74 2,968 9.7% 3,669 10.9% 4,164 11.5%75 - 84 1,639 5.4% 2,136 6.4% 2,769 7.7%
85+ 664 2.2% 887 2.6% 1,131 3.1%Census 2010 2016 2021
Race and Ethnicity Number Percent Number Percent Number PercentWhite Alone 22,730 74.2% 24,204 72.0% 25,323 70.1%Black Alone 5,256 17.2% 5,991 17.8% 6,584 18.2%American Indian Alone 107 0.3% 137 0.4% 163 0.5%Asian Alone 946 3.1% 1,167 3.5% 1,394 3.9%Pacific Islander Alone 24 0.1% 30 0.1% 35 0.1%Some Other Race Alone 604 2.0% 817 2.4% 1,037 2.9%Two or More Races 958 3.1% 1,260 3.7% 1,597 4.4%
Hispanic Origin (Any Race) 1,723 5.6% 2,409 7.2% 3,112 8.6%Data Note: Income is expressed in current dollars.
Source: U.S. Census Bureau, Census 2010 Summary File 1. Esri forecasts for 2016 and 2021.
March 20, 2017
©2016 Esri Page 3 of 6
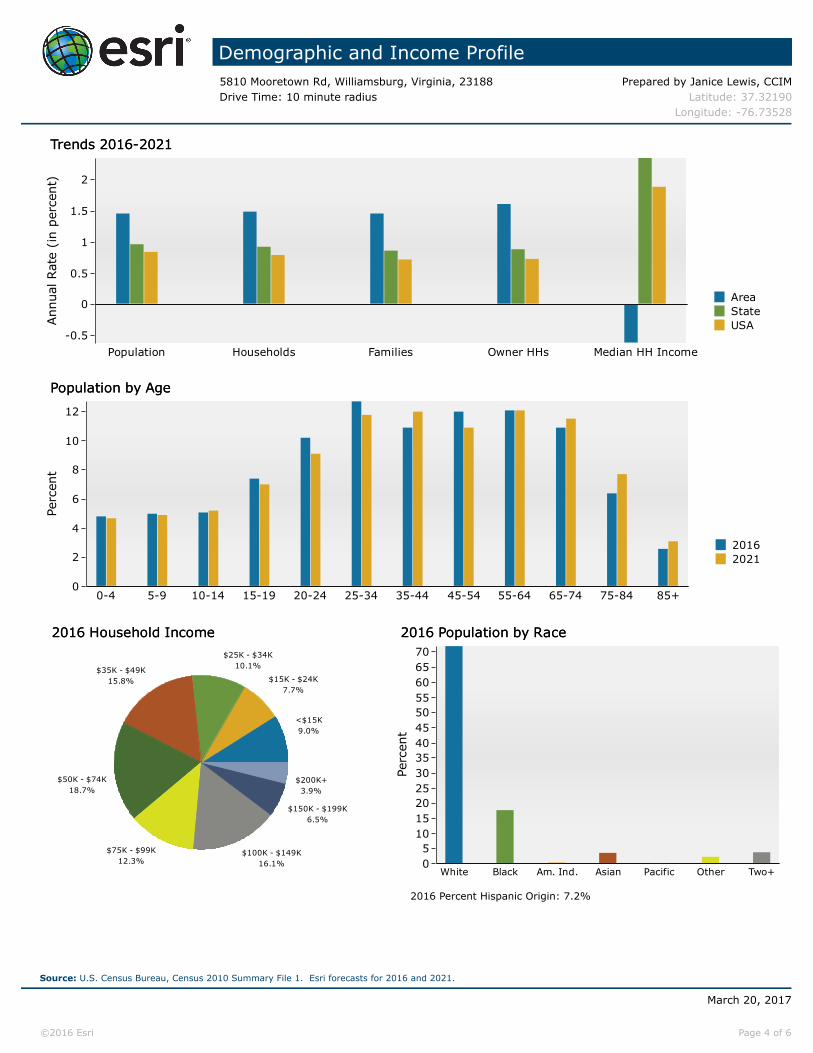
Demographic and Income Profile5810 Mooretown Rd, Williamsburg, Virginia, 23188 Prepared by Janice Lewis, CCIMDrive Time: 10 minute radius Latitude: 37.32190
Longitude: -76.73528
AreaStateUSA
Trends 2016-2021Trends 2016-2021
Ann
ual R
ate
(in
perc
ent) 2
1.5
1
0.5
0
-0.5Population Households Families Owner HHs Median HH Income
20162021
Population by AgePopulation by Age
Perc
ent
12
10
8
6
4
2
00-4 5-9 10-14 15-19 20-24 25-34 35-44 45-54 55-64 65-74 75-84 85+
2016 Household Income 2016 Household Income
<$15K9.0%
$15K - $24K7.7%
$25K - $34K10.1%$35K - $49K
15.8%
$50K - $74K18.7%
$75K - $99K12.3%
$100K - $149K16.1%
$150K - $199K6.5%
$200K+3.9%
2016 Population by Race2016 Population by Race
Perc
ent
7065605550454035302520151050
White Black Am. Ind. Asian Pacific Other Two+
2016 Percent Hispanic Origin: 7.2%
Source: U.S. Census Bureau, Census 2010 Summary File 1. Esri forecasts for 2016 and 2021.
March 20, 2017
©2016 Esri Page 4 of 6

Demographic and Income Profile5810 Mooretown Rd, Williamsburg, Virginia, 23188 Prepared by Janice Lewis, CCIMDrive Time: 15 minute radius Latitude: 37.32190
Longitude: -76.73528
Summary Census 2010 2016 2021Population 74,724 82,447 89,198Households 28,723 31,516 34,131Families 19,711 21,506 23,240Average Household Size 2.43 2.46 2.47Owner Occupied Housing Units 20,056 21,662 23,446Renter Occupied Housing Units 8,667 9,853 10,685Median Age 40.5 41.8 43.0
Trends: 2016 - 2021 Annual Rate Area State NationalPopulation 1.59% 0.97% 0.84%Households 1.61% 0.93% 0.79%Families 1.56% 0.86% 0.72%Owner HHs 1.60% 0.89% 0.73%Median Household Income 2.06% 2.35% 1.89%
2016 2021 Households by Income Number Percent Number Percent
<$15,000 2,363 7.5% 2,838 8.3%$15,000 - $24,999 1,944 6.2% 2,007 5.9%$25,000 - $34,999 2,625 8.3% 2,480 7.3%$35,000 - $49,999 4,141 13.1% 5,781 16.9%$50,000 - $74,999 5,566 17.7% 3,426 10.0%$75,000 - $99,999 4,263 13.5% 4,688 13.7%$100,000 - $149,999 5,666 18.0% 6,596 19.3%$150,000 - $199,999 2,463 7.8% 3,250 9.5%$200,000+ 2,484 7.9% 3,066 9.0%
Median Household Income $69,690 $77,177Average Household Income $93,314 $100,859Per Capita Income $36,852 $39,693
Census 2010 2016 2021 Population by Age Number Percent Number Percent Number Percent
0 - 4 3,702 5.0% 3,790 4.6% 3,992 4.5%5 - 9 3,947 5.3% 4,120 5.0% 4,304 4.8%10 - 14 4,280 5.7% 4,436 5.4% 4,689 5.3%15 - 19 6,068 8.1% 6,259 7.6% 6,408 7.2%20 - 24 7,104 9.5% 7,586 9.2% 7,292 8.2%25 - 34 7,884 10.6% 9,254 11.2% 9,942 11.1%35 - 44 8,511 11.4% 8,602 10.4% 9,891 11.1%45 - 54 9,994 13.4% 10,264 12.4% 9,968 11.2%55 - 64 9,570 12.8% 10,773 13.1% 11,773 13.2%65 - 74 7,736 10.4% 9,779 11.9% 11,356 12.7%75 - 84 4,379 5.9% 5,514 6.7% 6,987 7.8%
85+ 1,548 2.1% 2,070 2.5% 2,594 2.9%Census 2010 2016 2021
Race and Ethnicity Number Percent Number Percent Number PercentWhite Alone 57,260 76.6% 61,667 74.8% 65,118 73.0%Black Alone 11,312 15.1% 12,610 15.3% 13,753 15.4%American Indian Alone 240 0.3% 304 0.4% 362 0.4%Asian Alone 2,336 3.1% 2,962 3.6% 3,622 4.1%Pacific Islander Alone 73 0.1% 105 0.1% 131 0.1%Some Other Race Alone 1,266 1.7% 1,787 2.2% 2,347 2.6%Two or More Races 2,236 3.0% 3,012 3.7% 3,865 4.3%
Hispanic Origin (Any Race) 3,708 5.0% 5,405 6.6% 7,153 8.0%Data Note: Income is expressed in current dollars.
Source: U.S. Census Bureau, Census 2010 Summary File 1. Esri forecasts for 2016 and 2021.
March 20, 2017
©2016 Esri Page 5 of 6

Demographic and Income Profile5810 Mooretown Rd, Williamsburg, Virginia, 23188 Prepared by Janice Lewis, CCIMDrive Time: 15 minute radius Latitude: 37.32190
Longitude: -76.73528
AreaStateUSA
Trends 2016-2021Trends 2016-2021
Ann
ual R
ate
(in
perc
ent)
2.22
1.81.61.41.2
10.80.60.40.2
Population Households Families Owner HHs Median HH Income
20162021
Population by AgePopulation by Age
Perc
ent
12
10
8
6
4
2
00-4 5-9 10-14 15-19 20-24 25-34 35-44 45-54 55-64 65-74 75-84 85+
2016 Household Income 2016 Household Income
<$15K7.5%
$15K - $24K6.2%
$25K - $34K8.3%
$35K - $49K13.1%
$50K - $74K17.7%
$75K - $99K13.5%
$100K - $149K18.0%
$150K - $199K7.8%
$200K+7.9%
2016 Population by Race2016 Population by Race
Perc
ent
70
60
50
40
30
20
10
0White Black Am. Ind. Asian Pacific Other Two+
2016 Percent Hispanic Origin: 6.6%
Source: U.S. Census Bureau, Census 2010 Summary File 1. Esri forecasts for 2016 and 2021.
March 20, 2017
©2016 Esri Page 6 of 6

Traffic Count Map5810 Mooretown Rd, Williamsburg, Virginia, 23188 2 Prepared by Janice Lewis, CCIM5810 Mooretown Rd, Williamsburg, Virginia, 23188 Latitude: 37.3219Rings: 1, 3, 5 mile radii Longitude: -76.73528
Source: ©2016 Kalibrate Technologies
March 20, 2017
©2016 Esri Page 1 of 1

AGENCY DISCLOSURE
In a real estate transaction, when the Agent represents the:
Seller/Landlord:
then an Agent under a listing agreement with a seller acts as the agent for the seller. The
listing company and all of its broker/agents, and the selling company and all of its agents
as subagents of the seller, would owe their fiduciary duties to the seller. The broker and
broker's agents may still provide buyer/tenants, as customers, with information about
properties and available financing, may show them properties, and may assist them in
preparing an offer to purchase, option or lease a particular property.
Buyer/Tenant:
then an Agent under a contract with a buyer acts as the agent for that buyer only, as a
"Buyer/Broker/Agent," and the Agent is not the seller's agent, even if the Purchase
Contract provides that the Seller or the Listing Broker will pay the Agent for the services
rendered to the buyer/tenant. An Agent acting as the buyer's/tenant's agent must disclaim
sub agency if offered and must disclose the Buyer/Tenant Broker/Agent relationship when
dealing with the seller's/landlord's Agent or the Seller/Landlord. The Buyer/Tenant
Broker/Agent owes its fiduciary duties to the buyer/tenant.
Buyer and Seller (Acting as a Dual Agent):
then an Agent, either acting directly or through one or more of the brokerage firm's other
Agents, may be the Agent of both the buyer and the seller, but only if the scope of the
agency is limited by a written agreement and only with the express knowledge and written
consent of both the buyer and the seller. An Agent representing both the buyer and the
seller must disclose all information regarding the agency relationship, including the
limitation on the Agent's ability to represent either party folly and exclusively. The Agent
must not disclose to either party, without the prior consent of the party adversely affected
by the disclosure, any information obtained within the confidentiality and trust of the
fiduciary relationship. As an example, the Agent must not tell the buyer that the seller
will accept a price lower than the listing price, nor tell the seller that the buyer will pay a
price offered, without the prior consent of the party adversely affected by the disclosure.
Campana Waltz Commercial Real Estate, LLC is the Listing Broker, Buyer Broker,
Dual Agent for the property submitted in this information package.
Acknowledged by:
Campana Waltz Commercial Real Estate, LLC