for personal use only · 2019. 9. 25. · potential products from its iron ridge project. fenix...
TRANSCRIPT

FENIX RESOURCES LIMITED
ABN 68 125 323 622
ANNUAL REPORT
FOR THE YEAR ENDED
30 JUNE 2019
For
per
sona
l use
onl
y

DIRECTORS’ REPORT
FENIX RESOURCES LIMITED - 2 -
CORPORATE DIRECTORY
Directors Share Registry Robert Brierley Managing Director Automic Registry Services Garry Plowright Executive Director Level 2, 267 St Georges Terrace Bevan Tarratt Non-Executive Chairman Perth WA 6000 Petar Tomasevic Non-Executive Director Telephone: 1300 288 664 Facsimile: +61 2 9698 5414 Company Secretary Matthew Foy Stock Exchange Listing Australian Securities Exchange Auditor ASX Code - FEX Grant Thornton Audit Pty Ltd Central Park Registered and Principal Office Level 43, 152-158 St Georges Terrace Unit 1, Level 1, 89 St Georges Terrace Perth WA 6000 Perth WA 6000 Telephone: +61 8 9226 2011 Bankers Facsimile: +61 8 9226 2099 National Australia Bank Limited Email: [email protected] 50 St Georges Terrace Web: www.fenixresources.com.au Perth WA 6000
CONTENTS
Corporate Directory 2
Directors’ Report 3
Auditor’s Independence Declaration 26
Consolidated statement of Profit or Loss and Other Comprehensive Income 27
Consolidated statement of Financial Position 28
Consolidated statement of Changes in Equity 29
Consolidated statement of Cash Flows 30
Notes to and forming part of the Consolidated Financial Statements 31
Directors’ Declaration 65
Independent Auditor’s Report 66
Additional Information 69
For
per
sona
l use
onl
y

DIRECTORS’ REPORT
FENIX RESOURCES LIMITED - 3 -
The Directors present their financial report for the consolidated entity consisting of Fenix Resources Limited (Company or Fenix) and the entities it controls (Consolidated Entity or Group) at the end of, or during, the year ended 30 June 2019.
REVIEW OF OPERATIONS
Iron Ridge Project - Maiden Drill Program at Iron Ridge Project & Mineral Resources Estimate Upgrade
During the period Fenix received all necessary approvals to commence a combined diamond and RC drill program at its flagship Iron Ridge Project in the Mid-west region of Western Australia. The drill program consisted of 21 RC holes and 8 diamond holes and was designed to test the depth and strike extent of the deposit, as well as increase the confidence level of the Resource to Indicated category.
Figure 1: Iron Ridge Project, Western Australia; Drill Hole Location Plan
CSA Global Pty Ltd (CSA Global) had previously prepared documentation to allow the Mineral Resource to be reported in accordance to the JORC Code (2012 Edition) status and subsequently completed an Exploration Target of 0.6Mt to 7.1Mt of predominantly hematite mineralisation in a grade range of between 64.1% Fe and 65.3% with low deleterious elements, and a further 0.1Mt to 5.7Mt of goethite mineralisation grading 58% to 59.5% Fe with slightly elevated deleterious elements.
Please note that the potential quantity and grade of this Exploration Target is conceptual in nature, there has been insufficient exploration to estimate a Mineral Resource and it is uncertain if further exploration will result in the estimation of a Mineral Resource. The exploration target is based on historical exploration results as well as a field visit conducted by CSA Global in 2018.
For
per
sona
l use
onl
y

DIRECTORS’ REPORT (continued)
FENIX RESOURCES LIMITED - 4 -
The Company reported all the assay results from the 21 RC holes and 8 diamond holes drilled in three batches. The following highlights illustrate the consistent high grades in the Main BIF unit with nineteen separate intercepts of between 16m and 70m grading >62.9% Fe.
o 58.2m @ 66.6% Fe from 79.3m in hole IR002
o 70m @ 64.4% Fe from 91m in hole IR004
o 51.1m @ 65.9% Fe from 161m in hole IR005
o 51m @ 63.9% Fe from 36m in hole IR001
o 16.2m @ 65.9% Fe from 41m in hole IR006
o 22.7m @ 62.9% Fe from 50m in hole IR003
o 23m @ 67.8% Fe from 159.2m in hole IR003
o 38.9m @ 66.7% Fe from 211m in hole IR033D
o 39.7m @ 65.9% Fe from 73.8m in hole IR020
o 70m @ 64.8% Fe from 72m in hole IR011
o 66m @ 66.2% Fe from 80m in hole IR015
o 58m @ 66.7% Fe from 84m in hole IR018
o 52m @ 66.2% Fe from 130m in hole IR035
o 56m @ 63.6% Fe from 54m in hole IR017
o 50m @ 66.6% Fe from 152m in hole IR016
o 40m @ 65.6% Fe from 164m in hole IR012
o 20m @ 65.9% Fe from 70m in hole IR022
o 46m @ 66.3% Fe from 206m in hole IR036
o 26m @ 65.6% Fe from 74m in hole IR046
Figure 2: Section through drill holes IR011, IR012 and IR013
The drilling identified a shallow south-westerly plunge component to the mineralisation. It explains why some of the drilling to the north-east either missed the mineralisation or only hit thin intersections.
It opens up the prospectivity of the western end of the deposit with high-grade intercepts up to 220m below surface projected to extend to near-surface. These near-surface expressions of the mineralisation are currently undrilled as they lie within the perimeter of the heritage exclusion zone.
For
per
sona
l use
onl
y

DIRECTORS’ REPORT (continued)
FENIX RESOURCES LIMITED - 5 -
Figure 3: Section through drill holes IR017, IR018 and IR019
Figure 4: Section through drill holes IR020 and IR021
For
per
sona
l use
onl
y

DIRECTORS’ REPORT (continued)
FENIX RESOURCES LIMITED - 6 -
Subsequent to year end on 30 July 2019 Fenix announced the assay results of a diamond drill program that had a dual focus; drilling seven resource definition holes into the shallow part of the Inferred Mineral Resource estimated in March 2019 and three holes for geotechnical test work.
In addition to the diamond drilling, five reverse circulation (RC) water monitoring bores were drilled, three of which were sampled as they intersected the BIF units. Water bore drilling techniques differ slightly from resource definition RC techniques with a higher potential for contamination; however, the indicative results are consistent with the previously completed mineral resource focused drilling (both diamond and RC). Based on field inspection, the results reported in the opinion of CP do not pose any material risk. Significant results from the water bore drilling include:
• 166.5m @ 65.4% Fe from 4m in hole IRMB-D2;
• 90m @ 62.7% Fe from 20m in hole IRMB-E; and
• 104m @ 61.9% Fe from 6m in hole IRMB-C.
Interpretation of the assay results in the vicinity of the Mineral Resource have confirmed the previous high grade hematite zone results (average 64 to 67 % Fe) in the Main BIF unit and the lower grade (57 to 63 % Fe) Little BIF unit to the south. The focus of the drill program was the near surface Inferred Mineral Resource area in the Main BIF, targeting its high iron grades and low level of deleterious elements.
Following the drill and assay program, CSA Global commenced work on an updated Mineral Resource estimation (MRE). Geophysical testwork was also completed in February 2019 which provided an accurate determination of density to assist in the MRE.
Iron Ridge Mineral Resource Upgrade
Subsequent to the year end on 21 August 2019 Fenix advised the outcome of the mineral resource estimation upgrade. Fenix reported a Mineral Resource Estimate at Iron Ridge of 10.5Mt @ 64.2% Fe following recent drilling programme (from 9.2Mt @ 64.1% in March 2019). This update delivered a significant increase in overall Resource confidence, with the Indicated Mineral Resource increasing by 51% to 10.0Mt at 64.3% Fe, 3.2% SiO2, 2.6% Al2O3 and 0.05% P (from previous estimate of 6.6Mt at 64.5% Fe, 3.1% SiO2, 2.5% Al2O3 and 0.04% P)
The Mineral Resource is categorised into Indicated and Inferred Mineral Resources as shown in Table 1.
Classification Tonnes Fe Al2O3 LOI P SiO2 TiO2 Mt % % % % % %
Indicated 10.0 64.3 2.56 1.90 0.046 3.21 0.09 Inferred 0.5 62.5 2.80 3.13 0.046 4.41 0.12
Total 10.5 64.2 2.57 1.96 0.046 3.26 0.09 Table 1 : Iron Ridge Mineral Resource Estimate reported above a 58% Fe cut-off grade
Additionally, the Mineral Resource estimate has been further categorised depending on stratigraphy, with the Main BIF being the thicker, higher-grade iron mineralised unit as shown in Table 2.
Water table Class.
Tonnes Fe Al2O3 LOI P SiO2 TiO2
Mt % % % % % %
BIF 1 (Main BIF)
Above Indicated 2.7 62.7 3.63 2.10 0.06 4.21 0.09 Inferred 0.3 64.2 2.70 1.29 0.04 3.88 0.13 Subtotal 3 62.8 3.54 2.02 0.06 4.18 0.09
Below
Indicated 6.2 65.8 1.95 1.19 0.04 2.45 0.09 Inferred 0.01 65.6 1.91 1.10 0.03 2.93 0.09 Sub Total 6.2 65.8 1.95 1.19 0.04 2.46 0.09
For
per
sona
l use
onl
y

DIRECTORS’ REPORT (continued)
FENIX RESOURCES LIMITED - 7 -
Water table Class.
Tonnes Fe Al2O3 LOI P SiO2 TiO2
Mt % % % % % %
Subtotal 9.2 64.9 2.46 1.46 0.04 3.01 0.09
BIF 2 (Little BIF)
Above Indicated 0.5 60.2 3.48 5.21 0.08 4.72 0.09
Below Indicated 0.7 59.9 3.34 5.42 0.08 5.10 0.07 Inferred 0.2 59.2 3.07 6.64 0.07 5.52 0.09 Subtotal 0.8 59.8 3.29 5.67 0.07 5.19 0.08
Subtotal 1.3 59.9 3.35 5.50 0.07 5.02 0.08 Grand Total 10.5 64.2 2.57 1.96 0.05 3.26 0.09
Table 2 : Iron Ridge Mineral Resource Estimate above a 58% cut-off, broken down by stratigraphic unit
The Mineral Resource has been reported above a cut-off grade of 58% Fe. This was selected based on economic factors and the grade - tonnage curve (see Figure 5 below) which indicated that 58% was most appropriate for reporting a premium, high-iron grade product.
Figure 5: Drill Hole Location Plan showing Cross Section location and
surface projection of the mineralised wireframes.
For
per
sona
l use
onl
y

DIRECTORS’ REPORT (continued)
FENIX RESOURCES LIMITED - 8 -
Figure 6: Grade - Tonnage Curves of the Iron Ridge total Mineral Resource at varying cut-off grades, highlighting the Mineral Resource at 58% Fe cut-off
Excellent Preliminary Metallurgical Results Validate High Quality Mining Opportunity at Iron Ridge
During the year the Company advised it had received strongly positive metallurgical testwork results in respect of potential products from its Iron Ridge Project. Fenix engaged independent consultant METS Engineering Group Pty Ltd (METS) to prepare a metallurgical testwork summary report for the Project. The metallurgical testwork programme was designed to assess the characteristic properties of the Project’s potential product and its applicability for transport and downstream processing.
Testwork was performed by Nagrom, ALS (Iron Ore Technical Centre) and E-Precision laboratory and involved assessment of particular size distribution, reducibility, decrepitation, comminution and lump ore properties.
Key Outcomes
The report by METS summarised that the mineralisation tested has desirable characteristic properties. The samples tested were shown to be amenable to standard crushing and screening.
Key observations include the following:
• Deleterious elements including phosphorous in the lump and fines are low, well within the acceptable limits
• Premium >65% Fe lump products and >63% Fe fines products with low deleterious elements were generated
• The samples tested indicate the deposit delivers approximately 25-30% of the mineralisation as a lump product (+8 mm)
• The potential product is soft and friable, the 3 composite samples tested exhibited very low Crushing Work Index (CWi) and Bond Abrasion Index (Ai) values
o Average CWi of 2.6 kWh/t indicates low power consumption for crushing the easily fragmented rock
For
per
sona
l use
onl
y

DIRECTORS’ REPORT (continued)
FENIX RESOURCES LIMITED - 9 -
o Average Ai result of 0.018 indicates low equipment consumable consumption rates
• The lump product properties (Reduction Index, Reduction-Disintegration Index and Decrepitation Index) derived for the three composites were encouraging for blast furnace use
Ongoing work has been conducted through CSIRO to confirm the iron ore fines amenability to sintering.
Lump Ratio & Potential for Premium Pricing
Based on the drop tower test results, the expected lump product percentage is estimated to be 25-30%. Ultimately the ability for Fenix to extract a premium pricing for this anticipated lump component will be determined by discussions with end users, the specific requirements of each end user, and any offtake agreement(s) that might be established. Fenix intends to assume nil lump premium in its base case assessment of the Project until end user verification is received.
Joint Cooperation Agreement with Geraldton Port
On 29 May 2019 Fenix announced it had signed a cooperation agreement with the manager of the Port of Geraldton (Port), the Mid West Ports Authority (MWPA), relating to the export of Iron Ore product.
Fenix and MWPA have signed the Joint Cooperation Agreement (JCA) in relation to the investigation into how MWPA might provide approximately 1 million tonnes per annum of export capacity through the Port. Pursuant to the JCA agreement, Fenix and MWPA have agreed to negotiate Port access, capacity reservations, handling services and Iron Ore product export contracts.
The JCA provides a further breakthrough in the progression of the Project as the Company advances towards development. A key component of the Project, being the Port Logistics, is now a step closer to being finalised as part of the agreement.
Strategic Alliance with Key Trucking and Logistics Provider
During the year Fenix advised that it had formed a strategic alliance with trucking and logistics company, Newhaul Pty Ltd formerly Minehaul Pty Ltd (Newhaul), signalling a significant development milestone of the Project.
Fenix and Newhaul have formed a new 50/50 joint venture company (JVC) known as Fenix Newhaul Pty Ltd formerly Premium Minehaul Pty Ltd (FN). It is intended that FN will provide all trucking services to the Project and hence the JVC represents a significant step forward in the Company’s aim to commercialise the Project.
Mr Craig Mitchell, the owner of Newhaul, has been elected as Chairman and CEO of the newly formed JVC. Mr Mitchell was the founder and former owner of Mitchell Corp, a major supplier of transport and logistics services to the Western Australian mining industry. Mitchell Corp was acquired by Toll Group for approximately $110 million in 2011.
Pursuant to the JVC agreement, Fenix has provided an undertaking that it will ensure all iron ore transport it is involved with in the Mid-West region of WA (including relating to the Project) will be conducted through the JVC.
The terms relating to the provision of these services are to be agreed in the coming months and pursuant to a separate road haulage contract agreement, however the Company expects the JVC arrangements to provide several key benefits to Fenix, including but not limited to:
• Greater transparency in relation to the likely transport costs associated with the Project;
• Significant experience that Mr Craig Mitchell brings to Fenix’s trucking operations;
• Potential for significant cost savings relating to transport costs; and
For
per
sona
l use
onl
y

DIRECTORS’ REPORT (continued)
FENIX RESOURCES LIMITED - 10 -
• Elimination of management role duplication and the sharing of the benefits of innovation throughout the life of the project.
Anticipated Trucking Costs
The Project is located approximately 490km by road from the Geraldton port and therefore it is expected that a significant proportion of the total operating costs associated with the Project will be related to the cost of road transport and logistics. This proportion will be confirmed through ongoing studies relating to the Project.
Consequently, the JVC represents a significant milestone in the management and reduction of the most significant discrete operating cost at the Project.
Concurrent Equity Investment by Newhaul Pty Ltd formerly Minehaul Pty Ltd
Demonstrating its support for Fenix and alignment of interests, an associated company of Newhaul subscribed for $0.25 million of new shares as part of a larger placement of 22,750,000 shares to raise $1.25 million that the Company completed on 18 June 2019. The funds were raised at a share price of 5.5¢ per share.
Project Feasibility Update
Subsequent to the year end on 5 September 2019 Fenix provided an update on the pending Feasibility Study on the Iron Ridge DSO hematite project. The Feasibility Study, which is being conducted internally using reputable and highly experienced consultants, is on track for delivery in October 2019. Documents have been issued to a select group of mining contracting companies capable of delivering all the necessary services to deliver crushed and screened fines and lump products ready for hauling to the port of Geraldton, for a firm quotation on costs for whole-of-mine services. Proposals are currently being assessed and these prices, together with the soon to be finalised road transport contract, will be the major items in determining the cost structure of the operation and the initial capital expenditure requirements.
In addition, mine scheduling analysis has derived the optimum mining, processing and road haulage rate and the updated mineral resource estimate is currently being incorporated into a revised mine schedule with positive impact on mineral inventory expected.
Negotiations are well advanced with Mid-West Port Authority at Geraldton (“Geraldton Port”) where export capacity is available. Discussions are continuing with the Geraldton Port on securing a commercial arrangement for the storage, handling and ship loading of iron ore products.
Discussions are advancing with potential offtake and financing partners. Subject to ongoing review and the determination by the Board that it is in the best interest of shareholders, Fenix has established a strategy to leverage the offtake of its planned high-grade iron ore products to obtain a financing solution for initial project capital expenditure and product inventory build
Tenement Acquisition
Subsequent to the year end the Company was granted Ministerial consent to acquire tenement E20/936 from Mr Gary Powell for consideration of $20,000 and a $1 per tonne royalty on any iron ore mined and sold from the tenement. E20/936 is located adjacent to M20/118-I, the mining lease that the Company’s Iron Ridge project is situated on. Whilst Fenix considers the tenement to be of low prospectivity for hosting iron ore mineralisation, it is strategic as it lies on the flat terrain making it ideal to house some of the infrastructure required for the development of the Iron Ridge project (e.g.; offices, camp, workshops, product stockpiles). Additionally, approximately 2km of the existing access track to the project lies on E20/936.
For
per
sona
l use
onl
y

DIRECTORS’ REPORT (continued)
FENIX RESOURCES LIMITED - 11 -
Beyondie Magnetite Project
In February 2019 the Company advised De Grey Mining Limited that it had withdrawn from the Beyondie Farmin Agreement and therefore relinquished its 80% interest in the iron ore rights to the Beyondie Project in Western Australia.
Competent Persons Statement
The information in this report that relates to Exploration Results, Exploration Targets and Mineral Resources is based on information compiled by Mr James Potter. Mr Potter is a full-time employee of CSA Global Pty Ltd and is a Member of the Australasian Institute of Mining and Metallurgy and a Member of the Australian Institute of Geoscientists. Mr Potter has sufficient experience relevant to the style of mineralisation and type of deposit under consideration and to the activity which he is undertaking to qualify as Competent Person as defined in the 2012 edition of the Australasian Code for the Reporting of Exploration Results, Mineral Resources, and Ore Reserves (JORC Code). Mr Potter consents to the disclosure of the information in this report in the form and context in which it appears. Additionally, Mr Potter confirms that the entity is not aware of any new information or data that materially affects the information contained in the ASX releases referred to in this report. Additionally, Mr Potter confirms that the entity is not aware of any new information or data that materially affects the information contained in the ASX releases referred to in this report.
The Company’s interests in tenements is as follows as at the date of this report:
Location Project Tenement No. Interest
Western Australia Iron Ridge M20/118-I 100%
Western Australia Iron Ridge E20/936 100%
CORPORATE
$4.5 Million Prospectus Offer Closed
During the year the Company advised that the offers made under the Company’s Prospectus dated 5 September 2018 successfully closed on 2 November 2018.
Following the successful close of the Prospectus offers, Non-Executive Directors Edmond Yao and Jian-Hua Sang resigned as Directors of the Company, on 2 November 2018.
Following completion of the Prospectus Offer, on 21 November 2018, the Company confirmed that:
- Mr Garry Plowright had been appointed as an Executive Director; and - Mr Robert Brierley had been appointed as an Executive Director of Fenix.
Following completion of the Prospectus Offer and satisfaction of compliance with the ASX Listing Rules, Fenix’s shares were reinstated to trading on 30 November 2018.
The Company advised on 19 February 2019 that it had granted a total of 19.75 million Performance Rights to management and employees of the Company that include performance milestone hurdles focused on the development of the Iron Ridge Project. Shareholders approved the issue of 6 million performance rights to Managing Director Mr Robert Brierley at a general meeting of shareholders on 14 May 2019.
In April 2019 the Company advised it had raised $1.75 million (before costs) through a placement of 31,930,000 shares at an issue price of 5.5¢ per share pursuant to its ASX Listing Rule 7.1 capacity.
The Placement was managed by Hartleys Limited as Lead Broker and was heavily oversubscribed with demand from new and existing Institutional Shareholders significantly exceeding expectations.
For
per
sona
l use
onl
y

DIRECTORS’ REPORT (continued)
FENIX RESOURCES LIMITED - 12 -
The proceeds of the Placement were used to accelerate the development activities at the Iron Ridge Project in the Mid-West region of Western Australia, including for funding in respect of:
• Ongoing metallurgical test-work at the Project; • Discussions with potential off-takers; • Mine design and scheduling work at the Project; • The statutory permitting process for the Project; • Road haulage, port storage and handling arrangements; and • Feasibility studies at the Project.
Additionally, the Company advised that Mr Rob Brierley had been appointed Managing Director (previously Executive Director) effective 1 March 2019.
DIRECTORS
The names of Directors who held office during the year and up to the date of signing this report, unless otherwise stated are:
Bevan Tarratt Non-Executive Chairman (appointed as Chairman 29 August 2018)
Petar Tomasevic Non-Executive Director (appointed 2 November 2017)
Robert Brierley Managing Director (appointed Non-Executive Director 1 June 2018, appointed Executive Director 21 November 2018, appointed Managing Director 1 March 2019)
Garry Plowright Executive Director (appointed 21 November 2018)
Edmond Yao Non-Executive Director (resigned as Chairman 29 August 2018, resigned as Non-Executive Director 2 November 2018)
Jian-Hua Sang Non-Executive Director (resigned as Non-Executive Director 2 November 2018)
PRINCIPAL ACTIVITIES
The principal activity of the Group during the year was to explore mineral tenements in Western Australia.
DIVIDENDS
No dividends have been declared, provided for or paid in respect of the financial year (30 June 2018: Nil).
FINANCIAL SUMMARY
The Group made a net loss after tax of $2,613,166 for the financial year ended 30 June 2019 (30 June 2018: loss $923,420). At 30 June 2019, the Group had net assets of $8,175,028 (30 June 2018: $355,580) and cash assets of $4,213,915 (30 June 2018: $423,339).
SIGNIFICANT CHANGES IN THE STATE OF AFFAIRS
The significant changes in the state of affairs of the Consolidated Entity during the financial period and to the date of this report are set out in the review of operations above.
MATTERS SUBSEQUENT TO THE END OF THE REPORTING PERIOD
Subsequent to the year end on 9 July 2019, the Company advised that 15,000,000 Class A Performance Shares had not met the requirement for conversion and, pursuant to the terms and conditions of the Performance Shares, all unconverted Class A Performance Shares held by the each holder were automatically consolidated into one Share each.
For
per
sona
l use
onl
y

DIRECTORS’ REPORT (continued)
FENIX RESOURCES LIMITED - 13 -
Subsequent to the year end on 21 August 2019 Fenix advised the outcome of the mineral resource estimation upgrade. Fenix reported a Mineral Resource Estimate at Iron Ridge of 10.5Mt @ 64.2% Fe following recent drilling programme (from 9.2Mt @ 64.1% in March 2019).
Other than as set out above there has not arisen in the interval between the end of the period and the date of this report any item, transaction or event of a material and unusual nature likely, in the opinion of the Directors of the Company to affect substantially the operations of the Company, the results of those operations or the state of affairs of the Company in subsequent financial years.
INFORMATION ON DIRECTORS
The following information is current as at the date of this report.
Mr Bevan Tarratt Non-Executive Chairman (appointed as Chairman 29 August 2018)
Experience Mr Tarratt has an extensive background in the accounting industry primarily focused on small cap resource companies. This experience has allowed Mr Tarratt to develop an in-depth understanding of the resource sector within Western Australia and globally, allowing Mr Tarratt to systematically evaluate project and corporate opportunities. Mr Tarratt has extensive equity capital markets experience with Paterson’s Securities Ltd.
Committee Memberships Audit Committee, Risk Committee and Remuneration Committee
Equity Interests 3,000,000 options over ordinary shares
Directorships held in other listed entities
Mr Tarratt is currently a director of ASX listed Protean Energy Ltd, Jacka Resources Ltd and Pura Vida Energy NL. No other listed directorships have been held by Mr Tarratt in the previous three years.
Mr Robert Brierley Managing Director (appointed Non-Executive Director 1 June 2018, appointed Executive Director 21 November 2018 and appointed Managing Director on 1 March 2019)
Experience Mr Brierley is an experienced company director with significant operational experience in many mining operations including acting as Registered Mine/Quarry Manager at Yandi, Marandoo and Koolan Island high grade DSO iron ore mines.
Mr Brierley holds a Bachelor of Mining Engineering and a graduate Diploma in Applied Finance and Investment. He is experienced in project and mine management, corporate finance, leadership, corporate governance and equities research. He has 15 years’ experience in financial markets including Head of Equities Research at Patersons Securities Ltd.
Mr Brierley is a Graduate Member of the Australian Institute of Company Directors.
Committee Memberships Risk Committee
Equity Interests 2,250,000 ordinary shares
2,000,000 options over ordinary shares
4,500,000 performance rights over ordinary shares
Directorships held in other listed entities
No other current directorships. Mr Brierley has held no other directorships of ASX listed companies in the last three years. For
per
sona
l use
onl
y

DIRECTORS’ REPORT (continued)
FENIX RESOURCES LIMITED - 14 -
Mr Garry Plowright Executive Director (appointed 21 November 2018)
Experience Mr Plowright is an experienced executive with over 25 years’ experience in finance, commercial and technical development within the mining and exploration industry, working for some of Australia’s leading resource companies.
He had been involved in gold, base metals and iron ore exploration and mining development projects in Australia and worldwide. He has previous experience with the supply and logistics of services to the mining and exploration industry including capital raising, corporate governance and compliance, project management, mining and environmental approvals and regulations, contract negotiations, tenure management, land access, stakeholder and community engagement. Mr Plowright has extensive experience in mining law and has provided services to the industry in property acquisitions, project generation and joint venture negotiations.
Mr Plowright has held global operational and corporate roles with Gindalbie Metals Ltd, Mt Edon Gold Ltd, Pacmin Mining, Atlas Iron Ltd, Tigris Gold (South Korea) and Westland Titanium (New Zealand).
Committee Memberships Audit Committee, Risk Committee and Remuneration Committee
Equity Interests 5,092,587 ordinary shares
2,000,000 options over ordinary shares
19,615,385 performance shares
Directorships held in other listed entities
Mr Plowright is currently Non-Executive Director of Hexagon Resources Limited. No other listed directorships have been held by Mr Plowright in the previous three years.
Mr Petar Tomasevic Non-Executive Director (appointed 2 November 2017)
Experience Mr Tomasevic has significant experience in the financial services industry having worked with numerous ASX listed companies in marketing and investor relations roles. Whilst engaged by Stocks Digital, a leading Australian marketing firm, he specialised in digital marketing strategies and investor relations.
Mr Tomasevic has substantial business practical business knowledge and was the former Managing Director of an international sports manufacturing company. Mr Tomasevic is fluent in 5 languages and is currently appointed to assist in project evaluation.
Committee Memberships Audit Committee and Remuneration Committee
Equity Interests 2,000,000 options over ordinary shares
Directorships held in other listed entities
No other current directorships. Mr Tomasevic has held no other directorships of ASX listed companies in the last three years.
Mr Edmond Yao Non-Executive Director (resigned as Chairman 29 August 2018, resigned as Non-Executive Director 2 November 2018)
Experience Mr Yao is currently Chairman of The China Cable and Wire Association. Mr Yao has previously represented China Hua Dian Corp, one of the Big Five China Power EPC companies, during this period he was responsible for the construction of two national scale Thermal Power Stations and the largest power grid in Cambodia. Mr Yao possesses an extensive background in equity capital markets and corporate transactions.
Directorships held in other listed entities
No other current directorships. In the last three years Mr Yao has not held any other listed directorships.
For
per
sona
l use
onl
y

DIRECTORS’ REPORT (continued)
FENIX RESOURCES LIMITED - 15 -
Mr Jian-Hua Sang Non-Executive Director (resigned as Non-Executive Director 2 November 2018)
Experience Mr Sang trained in China and was the first Chinese postgraduate student studying Economic Geology in Western Australia. He has more than 25 years of international exploration, mining and corporate experience in Asia, Australia and Africa.
Directorships held in other listed entities
No other current directorships. In the last three years Mr Sang has not held any other listed directorships.
Company Secretary
Mr Matthew Foy,
BCom, GradDipAppFin, GradDipACG, SAFin, AGIA, ACIS
Mr Foy is an active member of the WA State Governance Council of the Governance Institute Australia (GIA). He spent four years at the ASX facilitating the listing and compliance of companies and possesses core competencies in publicly listed company secretarial, operational and governance disciplines. His working knowledge of ASIC and ASX reporting and document drafting skills ensure a solid base to make a valued contribution to Fenix.
Meetings of Directors
Provided the activity during the year and the changing size of the company, the Board established two separate committees – Audit & Risk and Remuneration.
During the financial year, five (5) meetings of Directors and one (1) meeting of the Remuneration Committee were held. The Audit & Risk Committees held their inaugural meeting subsequent to the end of the financial year. Attendances by each Director during the year were as follows:
Directors’ Meetings Remuneration Committee Meetings
Number eligible to attend Number attended
Number eligible to attend Number attended
B Tarratt 5 5 1 1
R Brierley (1) 5 5 - -
G Plowright (2) 4 4 1 1
P Tomasevic 5 5 1 1
E Yao (3) - - - -
J Sang (4) - - - -
1 Mr Brierley was appointed Executive Director 21 November 2018 and Managing Director 1 March 2019. 2 Mr Plowright was appointed Executive Director 21 November 2018. 3 Mr Yao resigned as Non-Executive Director 2 November 2018. 4 Mr Sang resigned as Non-Executive Director 2 November 2018.
For
per
sona
l use
onl
y

DIRECTORS’ REPORT (continued)
FENIX RESOURCES LIMITED - 16 -
REMUNERATION REPORT (AUDITED) The remuneration report is set out under the following main headings:
A. Introduction
B. Remuneration governance
C. Key management personnel
D. Remuneration and performance
E. Remuneration structure
• Executive • Non-executive directors
F. Executive service agreements
G. Details of remuneration
H. Share based compensation
I. Other information
This report details the nature and amount of remuneration for each Director and key management personnel of Fenix Resources Limited.
A. INTRODUCTION
The remuneration policy of the Company has been designed to align Director and Management objectives with shareholder and business objectives by providing a fixed remuneration component, and offering specific long-term incentives, based on key performance areas affecting the Group’s financial results. Key performance areas include cash flow management, growth in share price, successful exploration and subsequent exploitation of the Group’s tenements. The Company believes the remuneration policy to be appropriate and effective in its ability to attract and retain the best management and Directors to run and manage the Group, as well as create goal congruence between Directors, executives and shareholders.
During the year the Company did not engage remuneration consultants.
B. REMUNERATION GOVERNANCE
The Board retains overall responsibility for remuneration policies and practices of the Company.
During the year, due to the change in activity and size of the company, the Board has established a Remuneration Committee (Committee) which operated in accordance with its charter as approved by the Board. The Committee comprises of two independent Non-Executive Directors and one Executive Director.
The primary purpose of the Committee is to support and advise the Board in fulfilling its responsibility to shareholders by:
• ensuring competitive and reasonable remuneration, enabling the company to attract and retain key talent; • aligning remuneration to the Company’s strategic and business objectives and the creation of shareholder value; • ensuring transparent policies which are easily understood and acceptable to Shareholders.
At the 2018 annual general meeting, the Company’s remuneration report was passed by the requisite majority of shareholders (100% by a show of hands).
For
per
sona
l use
onl
y

DIRECTORS’ REPORT (continued)
FENIX RESOURCES LIMITED - 17 -
REMUNERATION REPORT (AUDITED) (continued)
C. KEY MANAGEMENT PERSONNEL
The key management personnel in this report are as follows:
Executives – Current
• Robert Brierley (Managing Director) – appointed Non-Executive Director 1 June 2018, appointed Executive Director 21 November 2018 and appointed Managing Director 1 March 2019
• Garry Plowright (Executive Director) – appointed 21 November 2018
Non-Executive Directors – Current
• Bevan Tarratt (Non-Executive Chairman) – appointed as Chairman 29 August 2018 • Petar Tomasevic (Non-Executive Director) – appointed 2 November 2017
Non-Executive Directors – Former
• Edmond Yao (Non-Executive Director) - resigned as Chairman 29 August 2018, resigned as Non-Executive Director 2 November 2018
• Jian-Hua Sang (Non-Executive Director) - resigned as Non-Executive Director 2 November 2018
D. REMUNERATION AND PERFORMANCE
The following table shows the gross revenue, net losses attributable to members of the Company and share price of the Group at the end of the current and previous four financial years.
30 June 2019
$ 30 June 2018
$ 30 June 2017
$ 30 June 2016
$ 30 June 2015
$
Revenue from continuing operations
31,808 18,904 38,811 58,921 69,862
Net loss attributable to members of the Company
(2,613,166) (923,420) (554,611) (1,862,176) (3,351,113)
Share price 0.100 0.045 0.045 0.055 0.060
E. REMUNERATION STRUCTURE
Executive remuneration structure
The Board’s policy for determining the nature and amount of remuneration for senior executives of the Group is as follows. The remuneration policy, setting the terms and conditions for executive directors and other senior executives, was developed and approved by the Board. All executives receive a base salary (which is based on factors such as length of service and experience), superannuation, fringe benefits, options and performance incentives. The Board reviews executive packages annually by reference to the Group’s performance, executive performance, and comparable information from industry sectors and other listed companies in similar industries.
Executives are also entitled to participate in the employee share option and performance rights plans. If an executive is invited to participate in an employee share option or performance rights plan arrangement, the issue and vesting of any equity securities will be dependent on performance conditions relating to the executive’s role in the Group and/or a tenure based milestone.
The employees of the Group receive a superannuation guarantee contribution required by the Government, which is currently 9.50%, and do not receive any other retirement benefits.
For
per
sona
l use
onl
y

DIRECTORS’ REPORT (continued)
FENIX RESOURCES LIMITED - 18 -
REMUNERATION REPORT (AUDITED) (continued)
Non-executive remuneration structure
Fees and payment to Non-Executive Directors reflects the demands that are made on them and the responsibilities of, the Directors from time to time.
Non-executive Directors' fees and payments are reviewed annually by the Board. For the year ended 30 June 2019, remuneration for a Non-Executive Director/Chairman was between $60,000 and $96,000 per annum exclusive of superannuation. There are no termination or retirement benefits paid to Non-Executive Directors (other than statutory superannuation). Total remuneration for all Non-Executive Directors was last voted on by shareholders on 30 November 2010, whereby it is not to exceed $300,000 per annum. Directors’ fees cover all normal Board activities.
A Director may also be paid fees or other amounts as the Directors determine, if a Director performs special duties or otherwise performs duties outside the scope of the normal duties of a Director. A Director may also be reimbursed for out of pocket expenses incurred as a result of their directorship or any special duties.
At the date of this report the Company has not entered into any agreements with Directors or senior executives which include performance based components.
Non-Executive Directors are able to participate in the employee share option or performance rights plans. In addition, in order to align their interests with those of shareholders, the non-executive Directors are encouraged to hold shares in the Company.
The Company has established an employee options plan (Plan) to attract directors with suitable qualifications, skills and experience to plan, carry out and evaluate the Company’ Strategy and to motivate and retain those directors and employees. Participants in the Plan may be directors of the Company or any of its subsidiaries or any other related body corporate of the Company. On 10 September 2018 shareholders approved the issue of options to Non-Executive Directors, the options vested immediately.
During the year the Company did not engage remuneration consultants.
At the 2018 annual general meeting, the resolution relating to the adoption of the remuneration report was passed by a show of hands.
F. EXECUTIVE SERVICE AGREEMENTS
Remuneration and other terms of employment for key management personnel are formalised in service agreements. The service agreements specify the components of remuneration, benefits and notice periods. Participation in the share and performance rights plans are subject to the Board's discretion. Other major provisions of the agreements relating to remuneration are set out below. Termination benefits are within the limits set by the Corporations Act 2001 such that they do not require shareholder approval.
For
per
sona
l use
onl
y

DIRECTORS’ REPORT (continued)
FENIX RESOURCES LIMITED - 19 -
REMUNERATION REPORT (AUDITED) (continued)
Contractual arrangement with key management personnel
Executives – Current
Name Effective date Term of agreement
Notice period
Base salary per annum (3)
$
Termination payments
Robert Brierley (1), Managing Director 21-Nov-18 No fixed term 3 months 150,000 3 months
01-Mar-19 No fixed term 3 months 200,000 3 months
Garry Plowright (2), Executive Director 21-Nov-18 No fixed term 1 month 72,000 1 month
1 Mr Brierley – appointed Executive Director on 21 November 2018 and Managing Director on 1 March 2019. 2 Mr Plowright – appointed Executive Director on 21 November 2018. 3 Mr Brierley’s base salary based on a time commitment of 3 days per week and Mr Plowright’s base salary based on a time commitment
of 8 days per month.
G. DETAILS OF REMUNERATION
Details of remuneration of the key management personnel (KMP) (as defined in AASB 124 Related Party Disclosures) of the Company is set out below.
Remuneration of KMP for the 2019 financial year is set out below:
Short-term benefits Post-employment benefits Share based payments Total
Cash salary
Consulting fees Bonus Non-cash
benefits (1) Super-
annuation Termi-nation
Performance rights (2) Options (3)
$ $ $ $ $ $ $
Executive Directors – Current
R Brierley (4) 108,333 - - 300 10,292 - 282,187 37,860 438,972
G Plowright (5) 44,182 - - 400 4,197 - - 37,860 86,639
Non-Executive Director – Current
B Tarratt 72,000 - - 600 6,840 - - 56,790 136,230
P Tomasevic 60,000 - - 600 5,700 - - 37,860 104,160
Non-Executive Director – Former
R Brierley (4) 23,333 55,000 - - 2,217 - - - 80,550
E Yao (6) 50,000 - 75,000 - - - - - 125,000
J Sang (7) 25,000 - - 250 2,375 - - - 27,625
Total 382,848 55,000 75,000 2,150 31,621 - 282,187 170,369 999,175
1 Other benefits include the provision of a mobile phone allowance. 2 Performance rights granted as part of remuneration package, AASB 2 – Share Based Payments requires the fair value at grant date of the
performance rights granted to be expensed over the vesting period. 3 Options granted as part of remuneration have been valued in accordance with AASB 2 – Share Based Payments. 4 Mr Brierley, Managing Director, transitioned from Non-Executive to Executive Director on 21 November 2018 and to Managing Director
on 1 March 2019. 5 Mr Plowright, Executive Director, was appointed on 21 November 2018. 6 Mr Yao resigned as Chairman 29 August 2018 and resigned as Non-Executive Director 2 November 2018. 7 Mr Sang resigned as Non-Executive Director 2 November 2018.
For
per
sona
l use
onl
y

DIRECTORS’ REPORT (continued)
FENIX RESOURCES LIMITED - 20 -
REMUNERATION REPORT (AUDITED) (continued)
The following table sets out each KMP’s relevant interest in fully paid ordinary shares, options and performance rights to acquire shares in the Company, as at 30 June 2019:
Name Fully paid ordinary
shares Options Performance rights Performance shares
R Brierley (1) 750,000 2,000,000 6,000,000 -
G Plowright (2) 5,029,587 2,000,000 - 22,633,137
B Tarratt - 3,000,000 -
P Tomasevic - 2,000,000 -
1 Mr Brierley, Managing Director, transitioned from Non-Executive to Executive Director on 21 November 2018 and to Managing Director on 1 March 2019.
2 Mr Plowright, Executive Director, was appointed on 21 November 2018.
Remuneration of KMP for the 2018 financial year is set out below:
Short-term benefits Post-employment benefits Share based payments Total
Cash salary
Consulting fees
Non-cash benefits
Super-annuation
Termi-nation
Performance rights Options
$ $ $ $ $ $ $
Non-Executive Directors – Current
E Yao 62,250 - - - - - - 65,250
B Tarratt 110,600 - - - - - - 110,600
J Sang 110,600 - - - - - - 110,600
P Tomasevic (1) 40,400 - - - - - - 40,400
R Brierley (2) 24,500 - - - - - - 24,500
Non-Executive Director – Former
D Rod (3) - - - - - - - -
Total 348,350 - - - - - - 348,350
1 Mr Tomasevic appointed 2 November 2017. 3 Mr Brierley appointed 1 June 2018. 2 Mr Rod resigned 2 November 2017.
H. SHARE BASED COMPENSATION
Performance rights
During the year ended 30 June 2019, the following performance rights were granted, vested and/or lapsed to KMP:
Grant date
Grant value (1)
$
Number granted as
remuneration
Number of vested
during the year
Number vested but
not yet exercisable
Number lapsed
during the year
Maximum value yet to
expense $
Robert Brierley - Managing Director (2)
11-Apr-18 480,000 6,000,000 1,500,000 - - 197,813
1 The value of performance rights is calculated as the fair value of the rights at grant date and allocated to remuneration equally over the period from grant date to expected vesting date.
2 Mr Brierley transitioned from Non-Executive to Executive Director on 21 November 2018 and to Managing Director on 1 March 2019.
For
per
sona
l use
onl
y

DIRECTORS’ REPORT (continued)
FENIX RESOURCES LIMITED - 21 -
REMUNERATION REPORT (AUDITED) (continued)
The key conditions of awards affecting remuneration in the current and future reporting periods are set out below:
Type of grant
Grant date
Expected vesting dates
Expiry date
Exercise price
$
Average fair value (1)
$
Service and/or
performance condition Achieved Vested
Performance rights 11-Apr-18 22-May-19 to
13-May-22 13-May-22 - 0.45 (3)(4) Performance
(5) 25% 25%
1 The value of performance rights is calculated as the fair value of the rights at grant date, which is equal to the share price on grant date. The values are allocated to remuneration equally over the period from grant date to expected vesting date.
2 Performance rights can only be converted if they have vested. Upon conversion each performance right is convertible into one ordinary share which will rank equally with all other issued ordinary shares.
3 The value of performance rights granted are calculated in accordance with AASB2 Share based Payments at grant date. Refer to Note 17 of the financial statements for details of the assumptions used in calculating the value of each performance right as at their grant date.
4 Performance rights have been split equally into 4 tranches with a continuous service condition. Each tranche will vest on completion of any of the below milestones:
Milestone 1 The Company entering into a binding offtake with a third party for the purchase from the Company of a minimum combined total of 6,000,000 tonnes of iron ore produced from the Iron Ridge Project;
Milestone 2 Completion of a feasibility study that derives a Net Present Value (NPV) (utilising a discount rate of 10%) of the Iron Ridge Project of not less than $50 million and is signed off and validated by an independent consultant and agreed by the Board;
Milestone 3 Securing necessary funding to commence production at the Iron Ridge Project, including via equity or debt (or a combination of both) or other funding mechanism such as joint venture or forward payments on offtake agreement;
Delineating a material resource upgrade at the Iron Ridge Project of: Milestone 4 An initial upgrade of the existing JORC-code compliant resource to a total of not less than 6Mt @65% Fe at a cut-off grade
of no less than 50% Fe with at least 60% of the total resource categorised in at least the Indicated category in accordance with the JORC Code (2012); and
Milestone 5 A further upgrade of the JORC-code compliant resource to a total of not less than 8Mt @65% Fe at a cut-off grade of no less than 50% Fe with at least 60% of the total resource categorised in at least the Indicated category in accordance with the JORC Code (2012);
Milestone 6 Obtaining all environmental and mining licence approvals necessary to commence mining at the Iron Ridge Project.
The performance rights were issued to incentivise KMP as part of their remuneration package. The performance rights were issued to encourage continued improvement in the performance of the Company and individuals, as well as to provide a method to share in the added value created contributing to the attainment of the results. The issue of the performance rights is appropriate and effective in its ability to attract and retain the best management and Directors to run and manage the Group, as well as create goal congruence between Directors, executives and shareholders.
For
per
sona
l use
onl
y

DIRECTORS’ REPORT (continued)
FENIX RESOURCES LIMITED - 22 -
REMUNERATION REPORT (AUDITED) (continued)
Options
Grant date (1)
Grant value (2)
$ Number granted
Value per option (3)
$ Expiry date
Vesting date
Number exercised Vested %
Robert Brierley - Managing Director (4)
10-Sep-18 37,860 2,000,000 0.0189 9-Sep-21 10-Sep-18 - 100%
Garry Plowright - Executive Director (5)
10-Sep-18 37,860 2,000,000 0.0189 9-Sep-21 10-Sep-18 - 100%
Bevan Tarratt - Non-Executive Director
10-Sep-18 56,790 3,000,000 0.0189 9-Sep-21 10-Sep-18 - 100%
Petar Tomasevic - Non-Executive Director
10-Sep-18 37,860 2,000,000 0.0189 9-Sep-21 10-Sep-18 - 100%
1 Issuance of options to directors were dependent on all the acquisition resolutions being passed, with no other performance conditions attached. The securities were approved on the 10 September 2018 at the Company’s General Meeting.
2 Value of options has been calculated in accordance with AASB 2: Share Based Payments. 3 Refer to Note 17 of the financial statements for details of the assumptions used in calculating the value of each option as at their grant
date. 4 Mr Brierley transitioned from Non-Executive to Executive Director on 21 November 2018 and to Managing Director on 1 March 2019. 5 Mr Plowright was appointed Executive Director on 21 November 2018.
The options carry no dividend or voting rights. No conditions must be satisfied for the options to vest. When exercisable, each option is convertible into one ordinary share of Fenix Resources Limited. No options were exercised during the year, the table above shows the number of options over ordinary shares in the company provided as remuneration during the year to KMP is shown in the table above.
Relative proportions of fixed vs variable remuneration expense
The following table shows the relative proportions of remuneration that are linked to performance and those that are fixed, based on the amounts disclosed as statutory remuneration expense for the 2019 and 2018 financial years:
Fixed remuneration At risk STI At risk LTI Fixed
remuneration At risk STI At risk LTI
2019 2018
Executive Directors – Current
R Brierley (1) 27% 73% - 100% - -
G Plowright (2) 56% 44% - 100% - -
Non-Executive Director – Current
B Tarratt 58% 42% - 100% - -
P Tomasevic 64% 36% - 100% - -
Non-Executive Director – Former
R Brierley (1) 100% - - 100% - -
E Yao (3) 100% - - 100% - -
J Sang (4) 100% - - 100% - -
D Rod (5) - - -
1 Mr Brierley transitioned from Non-Executive to Executive Director on 21 November 2018 and to Managing Director on 1 March 2019. 2 Mr Plowright was appointed on 21 November 2018. 3 Mr Yao resigned as Chairman 29 August 2018 and resigned as Non-Executive Director 2 November 2018. 4 Mr Sang resigned as Non-Executive Director 2 November 2018. 5 Mr Rod resigned 2 November 2017.
For
per
sona
l use
onl
y

DIRECTORS’ REPORT (continued)
FENIX RESOURCES LIMITED - 23 -
REMUNERATION REPORT (AUDITED) (continued)
Reconciliation of equity instruments held by KMP
The following table sets out a reconciliation of each KMP’s relevant interest in ordinary shares and options, performance rights and performance shares to acquire shares in the Company for the 2019 and 2018 financial years:
Balance at the start of the year/period
Granted/ Acquired
Exercised/ Vested Lapsed
Other changes
Balance at year end
Executives – Current
R Brierley (1)
Fully paid ordinary shares - 750,000 - - - 750,000
Options - 2,000,000 - - - 2,000,000
Performance rights - 6,000,000 - - - 6,000,000
G Plowright (2)
Fully paid ordinary shares - 5,029,586 - - - 5,029,586
Options - 2,000,000 - - - 2,000,000
Performance shares - 22,633,137 - - - 22,633,137
Non-Executive Directors – Current
B Tarratt
Fully paid ordinary shares - - - - - -
Options - 3,000,000 - - - 3,000,000
P Tomasevic
Fully paid ordinary shares - - - - - -
Options - 2,000,000 - - - 2,000,000
Non-Executives Directors – Former
E Yao (3)
Fully paid ordinary shares - - - - - -
J Sang (4)
Fully paid ordinary shares - - - - - -
1 Mr Brierley transitioned from Non-Executive to Executive Director on 21 November 2018 and to Managing Director on 1 March 2019. 2 Mr Plowright was appointed on 21 November 2018. 3 Mr Yao resigned as Chairman 29 August 2018 and resigned as Non-Executive Director 2 November 2018. 4 Mr Sang resigned as Non-Executive Director 2 November 2018.
None of the fully paid ordinary shares above are held nominally by the Directors or any other KMP. I. OTHER INFORMATION
Share capital issued
Mr Garry Plowright was one of the vendors to the acquisition of Prometheus on 22 November 2018. Accordingly, Mr Plowright received a portion of the consideration securities on completion of the Acquisition, being 5,029,586 Shares and 22,633,139 Performance Shares (comprising 3,017,752 Class A Performance Shares, 6,035,502 Class B Performance Shares, 7,544,379 Class C Performance Shares and 6,035,502 Class D Performance Shares).
Convertible debt facility
Mr Brierley provided $15,000 of the convertible debt facility that was acquired by the Company, as part of the asset acquisition. The debt facility was provided on an arm’s length basis.
For
per
sona
l use
onl
y

DIRECTORS’ REPORT (continued)
FENIX RESOURCES LIMITED - 24 -
REMUNERATION REPORT (AUDITED) (continued)
Terms and conditions
On 10 September 2018, the Group acquired, as part of the asset acquisition, short term convertible loan facilities for $600,000. The convertible loans were a fixed in Australian-dollar and are carried at fair value through profit or loss.
Prometheus Mining Pty Ltd issued 600,000 convertible notes, at an interest rate of 12% with a fair value of $1 per convertible note. The interest on the notes was only payable if Prometheus wasn’t acquired by the Company. The notes convert into ordinary shares of the Company, at the option of the Company on completion of the acquisition and capital raising. The notes converted at the conversion price, being $0.02, a 50% discount to the share issue price of $0.04.
On 22 November 2018, the Company issued 30,000,000 shares at $0.02 to the holders of convertible loans in satisfaction of the outstanding convertible loan amounts which have now been extinguished.
Loans
Mr Plowright provided $7,000 of the loan facility that was acquired by the Company, as part of the asset acquisition. The debt facility was provided on an arm’s length basis.
Terms and conditions
On 10 September 2018, the shareholder of the Company approved the acquisition of Prometheus Mining Pty Ltd. On 22 November 2018 the acquisition was completed. Prometheus had entered into short-term loans from Directors to provide working capital during the acquisition for up to $20,000.
The loans were fixed in Australian-dollars, at an interest rate of 12% per annum and due to their short-term nature the carrying value are assumed to be the same as their fair value.
On 29 November 2018, the Company completed its recompliance and was readmitted to trading. As at 30 June 2019, allowable expenditure had been presented to the company and the loan had been repaid in full.
There were no outstanding loans to or from related parties at as 30 June 2019 (30 June 2018: nil).
Transactions with other related parties
Purchases from entities associated with key management personnel
A director, Mr Bevan Tarratt, is a Director of Pura Vida Energy NL which has provided shared office costs per an arrangement with the Company on normal commercial terms and conditions. The expenses recognised during the year was $4,368 (ex GST) (30 June 2018: $304).
This concludes the Remuneration Report which has been audited.
UNISSUED ORDINARY SHARES
Unissued ordinary shares under option/right at the date of this report are 175,812,500 and broken-down as follows:
Options
- Issued to Directors 9,000,000 - Issued to employees, consultants and vendors 50,000,000
Options over ordinary shares range can be exercised at $0.08.
Performance rights
- Issued to Directors 4,500,000 - Issued to employees, consultants and vendors 14,812,500
Performance rights may be converted subject to various performance milestones.
For
per
sona
l use
onl
y
DIRECTORS’ REPORT (continued)
FENIX RESOURCES LIMITED - 25 -
Performance shares
- Issued to Directors 19,615,385 - Issued to vendors 77,884,615
Performance shares may be converted subject to various performance milestones.
ENVIRONMENTAL REGULATIONS
The Company’s policy is to comply with, or exceed, its environmental obligations in each jurisdiction in which it operates. No known environmental breaches have occurred.
INDEMNIFYING OFFICERS
During the financial year, the Company paid a premium in respect of a policy insuring the Company’s Directors, secretaries, executive officers and any related body corporate against a liability incurred as such a director, secretary or officer to the extent permitted by the Corporations Act 2001. The policy of insurance prohibits disclosure of the nature of the liability and the amount of the premium. The Company has entered into Deeds of Indemnity, Insurance and Access with the Company’s Directors, Secretary and Executive Officers.
The Company has not otherwise, during or since the end of the financial year, except to the extent permitted by law, indemnified or agreed to indemnify an officer or auditor of the Company or any of the related body corporates against a liability incurred as such an officer or auditor.
PROCEEDINGS ON BEHALF OF COMPANY
No person has applied to the Court under section 237 of the Corporations Act 2001 for leave to bring proceedings on behalf of Fenix, or to intervene in any proceedings to which the Company is a party, for the purpose of taking responsibility on behalf of Fenix for all or part of these proceedings.
No proceedings have been brought or intervened in on behalf of Fenix with leave of the Court under section 237 of the Corporations Act 2001.
AUDITOR’S INDEPENDENCE DECLARATION The auditor’s independence declaration, as required under section 307C of the Corporations Act 2001 for the year ended 30 June 2019 has been received and can be found on page 27.
AUDITOR’S REMUNERATION
During the financial year no fees were paid or payable for services provided by related entities of Grant Thornton Audit Pty Ltd.
The Company may decide to employ the auditor on assignments additional to their statutory audit duties where the auditor’s expertise and experience with the Company and/or the Group are important.
This report is signed in accordance with a resolution of the Board of Directors made pursuant to section 295(5) of the Corporations Act 2001.
Signed in accordance with a resolution of the directors
BEVAN TARRATT Non-Executive Chairman
Perth 25 September 2019
For
per
sona
l use
onl
y

Grant Thornton Audit Pty Ltd Level 43 Central Park 152-158 St Georges TerracePerth WA 6000PO Box 7757Cloisters SquarePerth WA 6850
T +61 8 9480 2000
ACN-130 913 594
Grant Thornton Audit Pty Ltd ACN 130 913 594 a subsidiary or related entity of Grant Thornton Australia Limited ABN 41 127 556 389 ‘Grant Thornton’ refers to the brand under which the Grant Thornton member firms provide assurance, tax and advisory services to their clients and/or refers to one or more member firms, as the context requires. Grant Thornton Australia Limited is a member firm of Grant Thornton International Ltd (GTIL). GTIL and the member firms are not a worldwide partnership. GTIL and each member firm is a separate legal entity. Services are delivered by the member firms. GTIL does not provide services to clients. GTIL and its member firms are not agents of, and do not obligate one another and are not liable for one another’s acts or omissions. In the Australian context only, the use of the term ‘Grant Thornton’ may refer to Grant Thornton Australia Limited ABN 41 127 556 389 and its Australian subsidiaries and related entities. Liability limited by a scheme approved under Professional Standards Legislation.
www.grantthornton.com.au
Auditor’s Independence Declaration
To the Directors of Fenix Resources Limited
In accordance with the requirements of section 307C of the Corporations Act 2001, as lead auditor for
the audit of Fenix Resources Limited for the year ended 30 June 2019, I declare that, to the best of my
knowledge and belief, there have been:
a no contraventions of the auditor independence requirements of the Corporations Act 2001 in
relation to the audit; and
b no contraventions of any applicable code of professional conduct in relation to the audit.
GRANT THORNTON AUDIT PTY LTD
Chartered Accountants
P W Warr
Partner – Audit & Assurance
Perth, 25 September 2019
For
per
sona
l use
onl
y

CONSOLIDATED STATEMENT OF PROFIT OR LOSS AND OTHER COMPREHENSIVE INCOME For the year ended 30 June 2019
FENIX RESOURCES LIMITED - 27 -
Notes 2019
$ 2018
$
Revenue
Interest income 31,808 18,904
Expenses
Exploration expense 1 (10,174) (287,496)
Exploration costs impaired 1 (20,889) (57,043)
Depreciation expense 8 (1,765) (2,375)
Plant and Equipment written off 8 (9,622) -
Share-based payments expense 1 (1,272,378) -
Finance costs 1 (34,463) -
Loan written off (308) -
Administrative expenses 1 (1,295,375) (652,454)
Loss before income tax expense (2,613,166) (923,420)
Income tax expense - -
Loss after income tax expense for the period attributable to the owners of the Group (2,613,166) (923,420)
Other comprehensive income
Other comprehensive income for the period, net of tax - -
Total comprehensive income for year attributable to owners of Fenix Resources Limited (2,613,166) (923,420)
Basic and diluted (loss) per share (cents per share) 19 (1.69) (0.41)
The above consolidated statement of profit or loss and other comprehensive income should be read in conjunction with the accompanying notes.
For
per
sona
l use
onl
y

CONSOLIDATED STATEMENT OF FINANCIAL POSITION As at 30 June 2019
FENIX RESOURCES LIMITED - 28 -
Notes 2019
$ 2018
$
Current Assets
Cash and cash equivalents 5 4,213,915 423,339
Other current assets – term deposit 6 50,000 -
Trade and other receivables 6 163,373 27,806
Total Current Assets 4,427,288 451,145
Non-Current Assets
Plant and equipment 8 2,763 10,337
Capitalised exploration and evaluation expenditure 7 4,380,204 -
Total Non-Current Assets 4,382,967 10,377
Total Assets 8,810,255 461,482
Current Liabilities
Trade and other payables 11 631,106 105,902
Provisions 12 4,121 -
Borrowings 13 - -
Total Current Liabilities 635,227 105,902
Total Liabilities 635,227 105,902
Net Assets 8,175,028 355,580
Equity
Issued capital 15 27,755,148 19,375,906
Reserves 15 2,053,372 -
Accumulated losses 15 (21,633,492) (19,020,326)
Total Equity 8,175,028 355,580
The above consolidated statement of financial position should be read in conjunction with the accompanying notes.
For
per
sona
l use
onl
y

CONSOLIDATED STATEMENT OF CHANGES IN EQUITY For the year ended 30 June 2019
FENIX RESOURCES LIMITED - 29 -
Issued Capital
$ Reserves
$
Accumulated Losses
$ Total
$
Balance at 1 July 2017 19,375,906 - (18,096,906) 1,279,000
Loss for the year - - (923,420) (923,420)
Other comprehensive income - - - -
Total comprehensive loss for the year - - (923,420) (923,420)
Balance at 30 June 2018 19,375,906 - (19,020,326) 355,580
Loss for the year - - (2,613,166) (2,613,166)
Other comprehensive income - - - -
Total comprehensive loss for the year - - (2,613,166) (2,613,166)
Transactions with owners in their capacity as owners
Shares issued during the year 9,707,400 - - 9,707,400
Share issue costs (1,334,058) 780,994 - (553,064)
Contribution from options issued during the year 5,900 - - 5,900
Options expense recognised during the year - 1,272,378 - 1,272,378
Balance at 30 June 2019 27,755,148 2,053,372 (21,633,492) 8,175,028
The above consolidated statement of changes in equity should be read in conjunction with the accompanying notes.
For
per
sona
l use
onl
y

CONSOLIDATED STATEMENT OF CASH FLOWS For the year ended 30 June 2019
FENIX RESOURCES LIMITED - 30 -
Notes 2019
$ 2018
$
Cash flows from operating activities
Payments to suppliers, consultants and employees (1,380,251) (834,413)
Interest received 25,976 22,195
Net cash used in operating activities 26 (1,354,275) (812,218)
Cash flows from investing activities
Payments for plant and equipment 8 (3,812) -
Movement in term deposits (50,000) -
Payments for exploration and evaluation (1,696,835) (56,005)
Cash acquired as part of asset acquisition 3 (10,226) -
Net cash used in investing activities (1,760,873) (56,005)
Cash flows from financing activities
Proceeds from new issues of shares 7,507,153 -
Proceeds from issue of options 15 5,900 -
Share issue costs (553,065) -
Proceeds from borrowings 13 117,044 -
Repayment of borrowings (136,844) -
Cost of borrowings 1 (34,463) -
Net cash provided by financing activities 6,905,725 -
Net increase / (decrease) in cash held 3,790,576 (868,223)
Cash and cash equivalents at the beginning of the period 423,339 1,291,562
Cash and cash equivalents at the end of the period 5 4,213,915 423,339
The above consolidated statement of cash flows should be read in conjunction with the accompanying notes.
For
per
sona
l use
onl
y

NOTES TO THE CONSOLIDATED FINANCIAL STATEMENTS For the year ended 30 June 2019
FENIX RESOURCES LIMITED - 31 -
1 EXPENDITURE
Notes 2019
$ 2018
$
Administrative expense
Advertising and marketing costs 130,660 -
Advisory costs 320,444 5,493
Compliance costs 202,442 65,255
Consultants 143,484 331,386
Director benefits expense (1) 375,692 205,675
Other administrative expenses 122,653 44,645
Total administrative expense 1,295,375 652,454
Finance costs
Loan fees 13 31,172 -
Interest expense 13 3,291 -
Total finance costs 34,463 -
Share-based payments expense
Director options 17 170,369 -
Performance rights expense 17 628,761
Advisor options 17 473,248 -
Total share-based payments expense 1,272,378 -
Exploration expense (2) 10,174 287,496
Exploration costs impaired (3) 20,889 57,043
1 A portion of the Directors benefits expense has been capitalised as an exploration and evaluation assets. 2 Exploration costs incurred that did not meet the criteria to be capitalised. 3 Exploration cost impaired are incurred in relation to the Beyondie Iron Project, which the Company withdrew from during the
year as a result any cost capitalised during the year have been impaired.
2 OPERATING SEGMENTS
Management has determined that the Group has two reportable segments, being exploration activities at the Iron Ridge Project and Beyondie Project. Following the withdrawal from the Beyondie Project, the Group had one reportable segment. This determination is based on the internal reports that are reviewed and used by the Board (chief operating decision maker) in assessing performance and determining the allocation of resources. As the Group is focused on exploration, the Board monitors the Group based on actual versus budgeted exploration expenditure incurred by area of interest. This internal reporting framework is the most relevant to assist the Board with making decisions regarding the Group and its ongoing exploration activities, while also taking into consideration the results of exploration work that has been performed to date.
For
per
sona
l use
onl
y

NOTES TO THE CONSOLIDATED FINANCIAL STATEMENTS For the year ended 30 June 2019
FENIX RESOURCES LIMITED - 32 -
2 OPERATING SEGMENTS (continued)
Iron Ridge Project
$
Beyondie Project
$ Other
$ Total
$
For the year ended 30 June 2019
Income from external sources - - 31,808 31,808
Reportable segment loss - (20,889) (2,592,277) (2,613,166)
Reportable segment assets (1) 3,781,549 - 4,428,706 8,210,255
Reportable segment liabilities (519,099) - (116,128) (635,227)
For the year ended 30 June 2018
Income from external sources - - 18,904 18,904
Reportable segment loss - (57,043) (866,377) (923,420)
Reportable segment assets (2) - 5,272 456,211 461,483
Reportable segment liabilities - (2,288) (103,615) (105,903)
1 Other includes cash held of $4,263,886 2 Other includes cash held of $423,339
3 ASSET ACQUISITION
On 10 September 2018, shareholders approved the acquisition of the assets held by Prometheus Mining Pty Ltd (Prometheus), through the acquisition of 100% of its share capital. Prometheus owns 100% of mining lease M20/118-I located approximately 67km from the mining town of Cue in the Midwest region of Western Australia (the Iron Ridge Project or Project). The transaction was completed on 22 November 2018.
The fair value of Prometheus at the date of acquisition was:
Note
10 September 2018
$
Current assets
Cash and cash equivalents 29
Other current assets 5,464
Non-current assets
Exploration and evaluation expenditure 7 2,224,562
Total assets 2,230,055
Current liabilities
Bank overdraft 10,255
Other current liabilities 13 19,800
Total liabilities 30,055
Net assets 2,200,000
For
per
sona
l use
onl
y

NOTES TO THE CONSOLIDATED FINANCIAL STATEMENTS For the year ended 30 June 2019
FENIX RESOURCES LIMITED - 33 -
3 ASSET ACQUISITION (continued)
In consideration for 100% equity in Prometheus, Fenix issued 55,000,000 ordinary shares and 112,500,000 performance shares. The fair value of consideration issued on 22 November 2018 was $2,200,000, which was by reference to the fair value of shares and performance rights issued in connection with the acquisition.
Note
10 September 2018
$
Fair value of net assets acquired 2,200,000
Consideration provided for assets acquired
Ordinary shares 15 2,200,000
Performance shares 17 -
2,200,000
Significant accounting judgments
Asset acquisition not constituting a Business
When an asset acquisition does not constitute a business combination, the assets and liabilities are assigned a carrying amount based on their relative fair values in an asset purchase transaction and no deferred tax will arise in relation to the acquired assets and assumed liabilities as the initial recognition exemption for deferred tax under AASB 112 applies. No goodwill will arise on the acquisition and transaction costs of the acquisition will be included in the capitalised cost of the asset.
In determining when an acquisition is determined to be an asset acquisition and not a business, significant judgement is required to assess whether the assets acquired constitute a business in accordance with AASB 3. Under AASB 3 a business is an integrated set of activities and assets that is capable of being conducted or managed for the purpose of providing a return, and consists of inputs and processes, which when applied to those inputs has the ability to create outputs.
Management determined that the acquisition of Prometheus Mining Pty Ltd was an asset acquisition.
Fair value of asset acquisition
During the period 55,000,000 ordinary shares and 112,500,000 performance shares were issued in consideration for the Iron Ridge Project. The fair value of consideration was by reference to the fair value of shares and performance rights issued in connection with the acquisition in accordance with AASB 2, see Note 17. The fair value of the assets and liabilities was determined to be $2,200,000.
4 TAXATION
2019 $
2018 $
Income tax benefit
Current tax - (253,941)
Deferred tax - 253,941
Income tax benefit - -
For
per
sona
l use
onl
y

NOTES TO THE CONSOLIDATED FINANCIAL STATEMENTS For the year ended 30 June 2019
FENIX RESOURCES LIMITED - 34 -
4 TAXATION (continued)
2019 $
2018 $
Reconciliation of income tax to prima facie tax payable
Loss before income tax (2,613,166) (923,420)
Income tax benefit at 27.5% (30 June 2018: 27.5%) (718,621) (253,941)
Tax effect of amounts which are not deductible (taxable) in calculating taxable income:
Impairment of assets 5,744 15,686
Share based payments 349,904 -
Capital raising costs 39,785 (841)
Tax losses and other timing differences not recognised 323,188 239,096
Total income tax benefit - -
Deferred tax balances
Deferred tax assets and liabilities not recognised relate to the following:
Other - 1,579
Net deferred tax assets unrecognised - 1,579
Unrecognised deferred tax assets
Deferred tax assets and liabilities not recognised relate to the following:
Tax losses 5,372,873 4,613,363
Other 22,782 17,399
Net deferred tax assets unrecognised 5,395,655 4,630,762
Significant accounting judgment
Deferred tax assets
The Group expects to have carried forward tax losses, which have not been recognised as deferred tax assets, as it is not considered sufficiently probable that these losses will be recouped by means of future profits taxable in the relevant jurisdictions. The utilisation of the tax losses is subject to the Group passing the required Continuity of Ownership and Same Business Test rules at the time the losses are utilised. Net deferred tax assets have not been brought to account as it is not probable within the immediate future that tax profits will be available against which deductible temporary difference can be utilised.
For
per
sona
l use
onl
y

NOTES TO THE CONSOLIDATED FINANCIAL STATEMENTS For the year ended 30 June 2019
FENIX RESOURCES LIMITED - 35 -
5 CASH AND CASH EQUIVALENTS
(a) Risk exposure
Refer to Note 18 for details of the risk exposure and management of the Group’s cash and cash equivalents.
(b) Deposits at call
Deposits at call are presented as cash equivalents if they have a maturity of three months or less. Refer Note 30(i) for the Group's other accounting policies on cash and cash equivalents.
2019 $
2018 $
Cash at bank 1,263,915 223,339
Deposits at call 2,950,000 200,000
4,213,915 423,339
6 TRADE AND OTHER RECEIVABLES AND OTHER CURRENT ASSETS
Due to the short-term nature of the current receivables, their carrying amount is assumed to be the same as their fair value.
Other receivables are generally due for settlement within 30 days and are therefore classified as current.
Refer to Note 18 for details of the risk exposure and management of the Group’s trade and other receivables.
The term deposit has a maturity of more than three months.
2019 $
2018 $
Trade and other receivables
Trade receivables 156,210 22,328
Prepayments 7,163 5,478
163,373 27,806
Other Current Assets
Term deposit 50,000 -
50,000 -
7 EXPLORATION AND EVALUATION ASSETS
Note
2019 $
2018 $
Iron Ridge Project
Opening balance - -
Acquisition of exploration assets 3 2,224,562 -
Exploration expenditure incurred 2,155,642 -
Closing balance 4,380,204 -
Beyondie Project
Opening balance - -
Exploration expenditure incurred 20,889 57,043
Exploration expenditure written off 1 (20,889) (57,043)
Closing balance - -
Total closing balance 4,380,204 -
For
per
sona
l use
onl
y

NOTES TO THE CONSOLIDATED FINANCIAL STATEMENTS For the year ended 30 June 2019
FENIX RESOURCES LIMITED - 36 -
7 EXPLORATION AND EVALUATION ASSETS (continued)
Significant accounting estimates and assumptions
Impairment of capitalised exploration and evaluation expenditure
The future recoverability of capitalised exploration and evaluation expenditure is dependent on a number of factors, including whether the Group decides to exploit the related lease itself or, if not, whether it successfully recovers the related exploration and evaluation asset through sale.
Factors that could impact the future recoverability include the level of reserves and resources, future technological changes, costs of drilling and production, production rates, future legal changes (including changes to environmental restoration obligations) and changes to commodity prices
The carrying values of items of exploration and evaluation expenditure are reviewed for impairment indicators at each reporting date and are subject to impairment testing when events or changes in circumstances indicate that the carrying values may not be recoverable. These reviews gave rise to an impairment charge on the Beyondie Project during the year 30 June 2019 of $20,889 (30 June 2018: $57,043).
Significant accounting judgement
Capitalisation of exploration and evaluation expenditure
The Group has capitalised significant exploration and evaluation expenditure on the basis that this is expected to be recouped through future successful development (or alternatively sale) of the areas of interest concerned or on the basis that it is not yet possible to assess whether it will be recouped.
8 PLANT AND EQUIPMENT
Office Equipment $
Field Equipment $
Total $
Year ended 30 June 2019
Opening net book value 5,065 5,272 10,337
Additions 2,004 1,808 3,812
Disposals (4,902) (4,719) (9,621)
Depreciation charge (748) (1,017) (1,765)
Closing net book amount 1,419 1,344 2,763 Cost 2,004 1,808 3,812
Accumulated depreciation (585) (464) (1,049)
Net book amount 1,419 1,344 2,763
Year ended 30 June 2018
Opening net book value 6,431 6,281 12,712
Depreciation charge (1,366) (1,009) (2,375)
Closing net book amount 5,065 5,272 10,337 Cost 40,909 21,254 62,163
Accumulated depreciation (35,844) (15,982) (51,826)
Net book amount 5,065 5,272 10,337
For
per
sona
l use
onl
y

NOTES TO THE CONSOLIDATED FINANCIAL STATEMENTS For the year ended 30 June 2019
FENIX RESOURCES LIMITED - 37 -
8 PLANT AND EQUIPMENT (continued)
The carrying values of items of plant and equipment are reviewed for impairment at each reporting date and are subject to impairment testing when events or changes in circumstances indicate that the carrying values may not be recoverable.
(a) Revaluation, depreciation methods and useful lives
Plant and equipment is recognised at historical cost less depreciation and any accumulated impairment losses.
Estimate of useful life
Depreciation is calculated using both the diminishing value and straight-line methods to allocate their cost or revalued amounts, net of their residual values, over their estimated useful lives:
- Office equipment 2 - 20 years
- Field Equipment 3 - 20 years
Refer Note 30(l) for the Group's other accounting policies on plant and equipment.
Significant estimate and judgement
Impairment of assets
The Group reviews whether there are any indicators of impairment annually. No impairment indicators were identified and no impairment has been recognised for the current period (30 June 2018 – $ nil).
9 INTEREST IN JOINT VENTURE
During the year, Fenix formed a strategic alliance with trucking and logistics company, Newhaul Pty Ltd formerly Minehaul Pty Ltd (Newhaul). Fenix and Newhaul have formed a new joint venture company (JVC) known as Fenix Newhaul Pty Ltd formerly Premium Minehaul Pty Ltd (FN). It is intended that FN will provide all trucking services for the Iron Ridge Project.
Interests in joint ventures
Set out below is the JV of the Group as at 30 June 2019 which, in the opinion of the directors, is immaterial to the Group. The entity listed below has share capital consisting solely of ordinary shares, which are held directly by the Group. The country of incorporation or registration is also their principal place of business, and the proportion of ownership interest is the same as the proportion of voting rights held.
Name of entity
Place of business/ country of
incorporation Measurement
method
% of ownership interest
Quoted fair value
2019 2018 2019 2018
% % $ $
Fenix Newhaul Pty Ltd Western Australia Equity method 50 - N/A (1) -
1 As the entity is a private entity no quoted prices are available.
Significant accounting estimates, assumptions and judgements
Control Assessment
The directors determined that they jointly control the JV. The Group has a 50% interest in the issued capital of this entity, with the other 50% being owned by Newhaul Pty Ltd formerly Minehaul Pty Ltd . Each of the shareholder groups have 1 Board member representing their interests, with decisions around the JV being made jointly.
Carrying value of interest in joint venture
The JV has not had any activity during the year and currently has a nil carrying value, as a result no impairment assessment has been performed.
For
per
sona
l use
onl
y

NOTES TO THE CONSOLIDATED FINANCIAL STATEMENTS For the year ended 30 June 2019
FENIX RESOURCES LIMITED - 38 -
10 INTEREST IN JOINT OPERATIONS
Under an agreement entered into with De Grey Mining Limited on 1 May 2008, Fenix has rights to 80% of the iron ore, vanadium and manganese on EL52/1806 and EL52/2215. The Company will sole fund the tenements until it makes a decision to mine. De Grey Mining Limited may then contribute on its 20% interest basis or convert to a 2% net smelter royalty. During the year the Company advised De Grey Mining Limited that it had withdrawn from the Beyondie Farmin Agreement and therefore relinquished its 80% interest in the iron ore rights to the Beyondie Project in Western Australia
Interests in joint operations
Set out below is the joint operation of the Group as at 30 June 2019 which, in the opinion of the directors, is immaterial to the Group.
Measurement method
% of ownership interest Quoted fair value Carrying value
2019 2018 2019 2018 2019 2018
% % $ $ $ $
Equity method - 80 - N/A (1) - -
1 As the entity is a private entity no quoted prices are available.
Assets employed by these joint ventures and the Company’s expenditure in respect of them is brought to account initially as capitalised exploration and evaluation expenditure until a formal joint venture agreement is entered into. Thereafter, investment in joint ventures is recorded distinctly from capitalised exploration costs incurred on the Company’s 100% owned projects.
Significant accounting estimates, assumptions and judgements
Classification of joint arrangements
The joint venture agreements in relation to EL52/1806 and EL52/2215 require unanimous consent from all parties for all relevant activities. The two partners have direct rights to the assets of the partnership and are jointly and severally liable for the liabilities incurred by the partnership. This entity is therefore classified as a joint operation and the group recognises its direct right to the jointly held assets, liabilities, revenues and expenses as described in Note 30(a).
11 TRADE AND OTHER PAYABLES
Trade and other payables are normally settled within 30 days from receipt of notice. All amounts recognised a trade and other payables, but not yet invoiced, are expected to settle within 12 months.
The carrying value of trade and other payables are assumed to be the same as their fair value, due to their short-term nature.
Refer to Note 18 for details of the risk exposure and management of the Group’s trade and other receivables.
2019 $
2018 $
Trade payables 512,541 42,634
Sundry payables and accruals 118,565 63,268
631,106 105,902
For
per
sona
l use
onl
y

NOTES TO THE CONSOLIDATED FINANCIAL STATEMENTS For the year ended 30 June 2019
FENIX RESOURCES LIMITED - 39 -
12 PROVISIONS
The current provision for employee benefits relate to annual leave which is provided for all employees of the Group in line with their employment contracts and the balance for the year ended 30 June 2019 is expected to be settled within 12 months. The measurement and recognition criteria relating to employee benefits have been included in Note 30(p) to this report.
2019 $
2018 $
Employee benefits 4,121 -
13 BORROWINGS
Working capital loan – October 2018
On 19 October 2018, the Company entered into a short-term loan facility for up to $300,000, with a sophisticated investor to provide working capital during the company’s recompliance.
The loan was a fixed in Australian-dollars, at a fixed daily interest rate of 0.085% and due to their short-term nature the carrying value are assumed to be the same as their fair value.
On 29 November 2018, the Company completed its recompliance and was readmitted to trading. On 10 December 2018 the loan was repaid.
A reconciliation of the loan is in the table.
Note 2019
$
Loan drawn down 117,044
Facility fee 1 30,000
Advance fee 1 1,172
Interest payable 1 3,291
Repayment (151,507)
-
Director loans – Acquired as part of Asset Acquisition
On 10 September 2018, the shareholders of the Company approved the acquisition of Prometheus Mining Pty Ltd. On 22 November 2018 the acquisition was completed. Prometheus had entered into short-term loans from Directors to provide working capital during the acquisition for up to $20,000.
The loans were fixed in Australian-dollars, at an interest rate of 12% per annum and due to their short-term nature the carrying value are assumed to be the same as their fair value.
The loan agreements state that in the event of acquisition the loan amount will be repaid in the order of allowable expenditure in respect of the Western Australian mining lease M20/118-I validly incurred and evidenced by the Company, with any interest forgiven. If there is no allowable expenditure, then the loan holder agrees upon acquisition to forgive the whole of the loan amount and any interest payable.
On 29 November 2018, the Company completed its recompliance and was readmitted to trading. During the year allowable expenditure in excess of the loan amounts had been presented to the company and the loan amounts were repaid.
Note 2019
$
Loans acquired 3 19,800
Loans repaid (19,800)
-
For
per
sona
l use
onl
y

NOTES TO THE CONSOLIDATED FINANCIAL STATEMENTS For the year ended 30 June 2019
FENIX RESOURCES LIMITED - 40 -
14 FAIR VALUES OF FINANCIAL INSTRUMENTS
This note provides an update on the judgements and estimates made by the Group in determining the fair values of the financial instruments since the last annual financial report.
Fair value hierarchy
To provide an indication about the reliability of the inputs used in determining fair value, the Group classifies its financial instruments into the three levels prescribed under the accounting standards. An explanation follows. At 30 June 2019 and 2018, no such assets or liabilities were recorded at fair value.
There were no transfers between levels during the period. The Group's policy is to recognise transfers into and transfers out of fair value hierarchy levels as at the end of the reporting period.
The fair value of financial assets and liabilities held by the Group must be estimated for recognition, measurement and/or disclosure purposes.
The Group measures fair values by level, per the following fair value measurement hierarchy:
Level 1: quoted prices (unadjusted) in active markets for identical assets or liabilities;
Level 2: inputs other than quoted prices included within Level 1 that are observable for the asset or liability, either directly (as prices) or indirectly (derived from prices); and
Level 3: inputs for the asset or liability that are not based on observable market data (unobservable inputs).
The Group’s policy is to recognise transfers into and out of fair value hierarchy levels as at the end of the reporting period.
Valuation techniques used to determine fair values
The Group’s did not have any financial instruments that are recognised in the financial statements where their carrying value differed from the fair value. The fair value of the financial assets and liabilities are included at the amount at which the instrument could be exchanged in a current transaction between willing parties, other than in a forced or liquidation sale. The carrying amounts of cash and short-term trade and other receivables, trade payables and other current liabilities approximate their fair values largely due to the short-term maturities of these payments.
15 ISSUED CAPITAL
(a) Issued Capital
2019
Shares 2018
Shares 2019
$ 2018
$
Fully paid 272,515,633 226,991,001 27,755,148 19,375,906
For
per
sona
l use
onl
y

NOTES TO THE CONSOLIDATED FINANCIAL STATEMENTS For the year ended 30 June 2019
FENIX RESOURCES LIMITED - 41 -
15 ISSUED CAPITAL (continued)
Movements in ordinary share capital during the financial year are as follows:
Details Note Date Number of
shares Issue price
$ $
Balance at 1 July 2017 226,991,001 19,375,906
Movement - -
Balance at 30 June 2018 226,991,001 19,375,906
Balance at 12 September 2018 12-Sep-18 226,991,001 -
Share consolidation 5:1 45,398,133 -
Issue of shares 22-Nov-18 112,500,000 0.04 4,500,000
Issue of shares – Acquisition of Prometheus Mining Pty Ltd 3 22-Nov-18 55,000,000 0.04 2,200,000
Issue of options 22-Nov-18 - - 5,900
Issue of shares 11-Apr-19 31,930,000 0.055 1,756,150
Issue of shares - Conversion performance rights 22-May-19 4,937,500 - -
Issue of shares 18-Jun-19 22,750,000 0.055 1,251,250
Less: Share issue costs (1,334,058)
Balance at 30 June 2019 272,515,633 27,755,148
(b) Reserves
The following table shows a breakdown of the reserves and the movements in these reserves during the year. A description of the nature and purpose of each reserve is provided.
Note 2019
$ 2018
$
Share based payments reserve
Balance at 1 July - -
Performance rights expense – directors and employees 17(b) 628,761 -
Performance rights expense – advisors 17(c) 396,000 -
Options expense – Director share options 17(a) 170,369 -
Options expense – Advisor share options 17(a) 473,248 -
Options expense – Underwriter options 17(a) 384,994 -
Balance at 30 June 2,053,372 -
For
per
sona
l use
onl
y

NOTES TO THE CONSOLIDATED FINANCIAL STATEMENTS For the year ended 30 June 2019
FENIX RESOURCES LIMITED - 42 -
15 ISSUED CAPITAL (continued)
Share based payments reserve
The share based payments reserve is used to recognise: (a) the grant date fair value of options issued but not exercised; (b) the grant date fair value of market based performance rights granted to directors, employees, consultants and vendors but not yet vested; and (c) the fair value non-market based performance rights granted to directors, employees, consultants and vendors but not yet vested.
(c) Accumulated losses
2019
$ 2018
$
Balance at 1 July (19,020,326) (18,096,906)
Net loss attributable to owners of the Company (2,613,166) (923,420)
Balance at 30 June (21,633,492) (19,020,326)
16 DIVIDENDS
No dividends have been declared or paid for the year ended 30 June 2019 (30 June 2018: nil).
17 SHARE-BASED PAYMENTS
Share-based payment transactions are recognised at fair value in accordance with AASB 2 Share based payments.
The total movement arising from share-based payment transactions recognised during the year were as follows:
Note 2019
$ 2018
$
As part of share-based payment expense:
Options issued 17(a) 170,369 -
Performance rights issued 17(b) 628,761 -
As part of administrative expense
Options issued 17(a) 473,248 -
As part of capitalised exploration assets
Ordinary shares 17(d) 2,200,000 -
Performance shares 17(d) - -
Recognised in equity as a capital raising cost
Options issued 17(a) 384,994 -
Performance rights issued 17(c) 396,000 -
4,253,372 -
For
per
sona
l use
onl
y

NOTES TO THE CONSOLIDATED FINANCIAL STATEMENTS For the year ended 30 June 2019
FENIX RESOURCES LIMITED - 43 -
17 SHARE-BASED PAYMENTS (continued)
During the year the Group had the following share-based payments:
(a) Share options
The Fenix Resources Limited share options are used to reward Directors, employees, consultants and advisors for their performance and to align their remuneration with the creation of shareholder wealth through the performance requirements attached to the options. Options are granted at the discretion of the Board of Directors and no individual has a contractual right to participate in the plan or to receive any guaranteed benefits. Any options granted to directors are approved by shareholders prior to issue.
The options are not listed and carry no dividend or voting right. Upon exercise, each option is convertible into one ordinary share to rank pari passu in all respects with the Company’s existing fully paid ordinary shares.
Set out below are summaries of options granted:
2019 2018
Average exercise price per option
Number of options
Average exercise price per option
Number of options
Opening balance - - - -
Granted during the period $0.08 59,000,000 - -
Exercised during the period - - - -
Closing balance $0.08 59,000,000 - -
Vested and exercisable $0.08 59,000,000 - -
Grant date(1) Expiry date Exercise price 2019
Number of options 2018
Number of options
(i) 10-Sep-18 9-Sep-21 $0.08 25,000,000 -
(ii) 10-Sep-18 30-Nov-20 $0.08 25,000,000 -
(iii) 10-Sep-18 9-Sep-21 $0.08 9,000,000 -
59,000,000 -
Weighted average remaining contractual life of options outstanding at the end of the year: 2.36 years - years
1 The securities were approved on the 10 September 2018 at the Company’s General Meeting.
The fair value of options issued is measured by reference to the value of the goods or services received. The fair value of services received in return for share options granted to Directors, employees and consultants is measured by reference to the fair value of options granted. The fair value of services received by advisors couldn’t be reliably measured and are therefore measured by reference to the fair value of the equity instruments granted. The estimate of the fair value of the services is measured based on a Black-Scholes option valuation methodology. The life of the options including early exercise options are built into the option model. The fair value of the options are expensed over the expected vesting period.
For
per
sona
l use
onl
y

NOTES TO THE CONSOLIDATED FINANCIAL STATEMENTS For the year ended 30 June 2019
FENIX RESOURCES LIMITED - 44 -
17 SHARE-BASED PAYMENTS (continued)
The model inputs for options granted during the period include:
Series Exercise
price Expiry (years) Share price at
grant date (1) Expected
volatility (2) Dividend
yield
Risk free interest rate
(3) Option value
(i) $0.08 3.00 $0.036 110% 0% 2.03% $0.0189
(ii) $0.08 2.22 $0.036 110% 0% 2.03% $0.0154
(iii) $0.08 3.00 $0.036 110% 0% 2.03% $0.0189
1 The share price has been based upon the closing shares price on readmission to listing on 29 November 2018. 2 The expected price volatility is based on historical volatility (based on the remaining life of the option), adjusted for any expected
changes to future volatility due to publicly available information. 3 Risk free rate of securities with comparable terms to maturity.
The total expense arising from options issued during the reporting period as part of share-based payments expense was as follows:
Series 2019
$ 2018
$
(i) Underwriting options 384,994 -
(ii) Advisory options 473,248 -
(iii) Directors options 170,369 -
1,028,611 -
(b) Performance rights
The Company’s Performance Rights Plan was approved and adopted by shareholders on 10 September 2018. Each performance right will vest as an entitlement to one fully paid ordinary share upon achievement of certain performance milestones. If the performance milestones are not met, the performance rights will lapse and the eligible participant will have no entitlement to any shares.
Performance rights are not listed and carry no dividend or voting rights. Upon exercise each performance right is convertible into one fully paid ordinary share to rank pari passu in all respects with existing fully paid ordinary shares.
Movement in the performance rights for the current year is shown below:
Grant date Expiry date
Exercise price
Balance at start of the
period
Granted during the
period
Converted during the
period
Forfeited during the
period Balance at period end
Vested at period end
19-Feb-19 18-Feb-22 - - 7,750,000 (1,937,500) - 5,812,500 -
11-Apr-19 13-May-22 - - 6,000,000 - - 6,000,000 1,500,000
Total - 13,750,000 (1,937,500)) - 11,812,500 1,500,000
The weighted average remaining contractual life of performance rights outstanding at 30 June 2019 was 1.35 years. There were no performance rights granted for the year ended 30 June 2018.
For
per
sona
l use
onl
y

NOTES TO THE CONSOLIDATED FINANCIAL STATEMENTS For the year ended 30 June 2019
FENIX RESOURCES LIMITED - 45 -
17 SHARE-BASED PAYMENTS (continued)
Key inputs used in the fair value calculation of the performance rights which have been granted during the year ended 30 June 2019 were as follows:
Number Granted Exercise price
Expected vesting dates Expiry date
Share price at grant date
Fair value per performance right
Total fair value
Grant date:19 Feb 2019 (1)
7,750,000 $ - 22-May-19 to 18-Feb-22 18-Feb-22 $0.066 $0.066 $511,400
Grant date: 11 Apr 2019 (2)
6,000,000 $ - 22-May-19 to 13-May-22 13-May-22 $0.080 $0.080 $480,000
1 Performance rights have been split equally into 4 tranches. Each tranche will vest on completion of any of the below milestones: Milestone 1 The Company entering into a binding offtake with a third party for the purchase from the Company of a minimum
combined total of 6,000,000 tonnes of iron ore produced from the Iron Ridge Project; Milestone 2 Completion of a feasibility study that derives a Net Present Value (NPV) (utilising a discount rate of 10%) of the Iron
Ridge Project of not less than $50 million and is signed off and validated by an independent consultant and agreed by the Board;
Milestone 3 Completion of a transportation study and execution of agreements for trucking and port for transportation of iron ore from The lron Ridge Project which has been signed off and validated by an independent consultant and agreed by The Board;
Milestone 4 Securing necessary funding to commence production at the Iron Ridge Project, including via equity or debt (or a combination of both) or other funding mechanism such as joint venture or forward payments on offtake agreement;
Delineating a material resource upgrade at the Iron Ridge Project of: Milestone 5 An initial upgrade of the existing JORC-code compliant resource to a total of not less than 6Mt @65% Fe at a cut-
off grade of no less than 50% Fe with at least 60% of the total resource categorised in at least the Indicated category in accordance with the JORC Code (2012); and
Milestone 6 A further upgrade of the JORC-code compliant resource to a total of not less than 8Mt @65% Fe at a cut-off grade of no less than 50% Fe with at least 60% of the total resource categorised in at least the Indicated category in accordance with the JORC Code (2012);
Milestone 7 Obtaining all environmental and mining licence approvals necessary to commence mining at the Iron Ridge Project.
2 Performance rights have been split equally into 4 tranches. Each tranche will vest on completion of any of the below milestones: Milestone 1 The Company entering into a binding offtake with a third party for the purchase from the Company of a minimum
combined total of 6,000,000 tonnes of iron ore produced from the Iron Ridge Project; Milestone 2 Completion of a feasibility study that derives a Net Present Value (NPV) (utilising a discount rate of 10%) of the Iron
Ridge Project of not less than $50 million and is signed off and validated by an independent consultant and agreed by the Board;
Milestone 3 Securing necessary funding to commence production at the Iron Ridge Project, including via equity or debt (or a combination of both) or other funding mechanism such as joint venture or forward payments on offtake agreement;
Delineating a material resource upgrade at the Iron Ridge Project of: Milestone 4 An initial upgrade of the existing JORC-code compliant resource to a total of not less than 6Mt @65% Fe at a cut-
off grade of no less than 50% Fe with at least 60% of the total resource categorised in at least the Indicated category in accordance with the JORC Code (2012); and
Milestone 5 A further upgrade of the JORC-code compliant resource to a total of not less than 8Mt @65% Fe at a cut-off grade of no less than 50% Fe with at least 60% of the total resource categorised in at least the Indicated category in accordance with the JORC Code (2012);
Milestone 6 Obtaining all environmental and mining licence approvals necessary to commence mining at the Iron Ridge Project.
As at 30 June 2019, management believe that all other performance and service hurdles will be met and accordingly have recognised a share-based payment expense over the respective vesting periods.
For
per
sona
l use
onl
y

NOTES TO THE CONSOLIDATED FINANCIAL STATEMENTS For the year ended 30 June 2019
FENIX RESOURCES LIMITED - 46 -
17 SHARE-BASED PAYMENTS (continued)
The total director, employee and consultant share performance rights expensed expense arising from performance rights recognised during the reporting period as part of share-based payment expense were as follows:
2019
$ 2018
$
Performance rights granted during prior periods - -
Performance rights granted during the year 628,760 -
628,760 -
(c) Share capital to vendors
During the financial year:
• On 19 February 2019, 6,500,000 performance rights were issued to the MBC Enterprise (WA) Unit Trust in consideration for advisory fees. The fair value of the shares recognised was by direct reference to the fair value of service received. This was determined by the corresponding invoice received which amounted to $214,500 (excluding GST). This amount has been recognised in the Statement of Financial Position under capital raising costs;
• On 19 February 2019, 5,500,000 performance rights were issued to the Advantage Management Trust in consideration for advisory fees. The fair value of the shares recognised was by direct reference to the fair value of service received. This was determined by the corresponding invoice received which amounted to $181,500 (excluding GST). This amount has been recognised in the Statement of Financial Position under capital raising costs.
(d) Share-based payment – Asset acquisition
On 22 November 2018 the Company issued 55,000,000 shares and 112,500,000 performance shares to the vendors of Prometheus in consideration for the acquisition of 100% of the mining lease M20/118-I.
Performance share were split between four milestones, being 15 million under Milestone A, 30 million under Milestone B, 37.5 million under Milestone C and 30 million under Milestone D. On achievement of the milestones each performance share will convert into one ordinary fully paid share, if the milestone are not achieved the performance shares consolidate and entitle each holder to one ordinary fully paid share per holder per milestone. There are a total of 11 holders of the performance rights. Milestones are as follows:
Milestone A On declaration of an Inferred Mineral Resource of not less than 8 million tonnes of iron ore at 65% Fe grade in accordance with the JORC Code of 2012 within 6 months from commencement of drilling on the Tenement.
Milestone B On achievement of 1,000,000 tonnes cumulative of shipped iron ore production from the Tenement at an Operating Margin of greater than US$15 per dry metric tonne shipped within the earlier of 24 months from commencement of mining on the Tenement and 60 months from the Settlement Date.
Milestone C On achievement of 2,000,000 tonnes cumulative of shipped iron ore production from the Tenement at an Operating Margin of greater than US$15 per dry metric tonne shipped within the earlier of 36 months from commencement of mining on the Tenement and 60 months from the Settlement Date.
Milestone D On achievement of 3,000,000 tonnes cumulative of shipped iron ore production from the Tenement at an Operating Margin of greater than US$15 per dry metric tonne shipped within the earlier of 48 months from commencement of mining on the Tenement and 60 months from the Settlement Date.
For
per
sona
l use
onl
y

NOTES TO THE CONSOLIDATED FINANCIAL STATEMENTS For the year ended 30 June 2019
FENIX RESOURCES LIMITED - 47 -
17 SHARE-BASED PAYMENTS (continued)
The fair value of consideration was by reference to the fair value of the share and performance shares issues in connection with the acquisition.
The fair value of the shares issued was determined by reference to the share price on grant date, based on the fair value price ($0.04 per share), refer to Note 15 for details.
The fair value of the performance shares was determined using a share option pricing model, after assigning a probability of achievement this was determined to be $0. Management assigned an average 8.6% probability of achievement in relation to the performance hurdles. As management assessed that the performance hurdles are unlikely to be met, the value of these rights was recorded as $0.
The fair value of the assets and liabilities acquired were measured at $2,200,000, see Note 3 for further details. These assets were recognised as exploration asset in the Statement of Financial Position.
Significant accounting estimates, assumptions and judgements
Estimation of fair value of share-based payments
The Group measures the cost of equity-settled transactions by reference to the fair value of the equity instruments at the date at which they are granted. The fair value is determined using the Black-Scholes or Monte-Carlo model taking into account the assumptions detailed within this note.
Probability of vesting conditions being achieved
Inputs to pricing models may require an estimation of reasonable expectations about achievement of future vesting conditions. Vesting conditions must be satisfied for the counterparty to become entitled to receive cash, other assets or equity instruments of the entity, under a share-based payment arrangement.
Vesting conditions include service conditions, which require the other party to complete a specified period of service, and performance conditions, which require specified performance targets to be met (such as a specified increase in the entity's profit over a specified period of time) or completion of performance hurdles.
The Group recognises an amount for the goods or services received during the vesting period based on the best available estimate of the number of equity instruments expected to vest and shall revise that estimate, if necessary, if subsequent information Indicates that the number of equity instruments expected to vest differs from previous estimates. On vesting date, the entity shall revise the estimate to equal the number of equity instruments that ultimately vested.
The achievement of future vesting conditions are reassessed each reporting period.
18 FINANCIAL AND CAPITAL RISK MANAGEMENT
Overview The financial risks that arise during the normal course of the Group’s operations comprise market risk, credit risk and liquidity risk. In managing financial risk, it is policy to seek a balance between the potential adverse effects of financial risks on financial performance and position, and the "upside" potential made possible by exposure to these risks and by taking into account the costs and expected benefits of the various risk management methods available to manage them.
General objectives, policies and processes
The Board is responsible for approving policies on risk oversight and management and ensuring management has developed and implemented effective risk management and internal control. The Board receives reports as required from the Managing Director in which they review the effectiveness of the processes implemented and the appropriateness of the objectives and policies it sets. The Board oversees how management monitors compliance with the Group's risk management policies and procedures and reviews the adequacy of the risk management framework in relation to the risks faced.
For
per
sona
l use
onl
y

NOTES TO THE CONSOLIDATED FINANCIAL STATEMENTS For the year ended 30 June 2019
FENIX RESOURCES LIMITED - 48 -
18 FINANCIAL AND CAPITAL RISK MANAGEMENT (continued)
These disclosures are not, nor are they intended to be an exhaustive list of risks to which the Group is exposed.
Financial Instruments
The Group has the following financial instruments:
2019 $
2018 $
Financial assets
Cash and cash equivalents 4,213,915 423,339
Trade and other receivables 156,210 22,328
Other current assets 50,000 -
4,420,125 445,668
Financial liabilities
Trade and other payables 631,106 105,902
631,106 105,902
(a) Market Risk
Market risk can arise from the Group’s use of interest-bearing financial instruments and exposure to commodity prices. It is a risk that the fair value of future cash flows of a financial instrument will fluctuate because of changes in interest rates (interest rate risk) and fluctuations in commodity prices (commodity price risk).
(i) Interest rate risk
The Board manages the Group's exposure to interest rate risk by regularly assessing exposure, taking into account funding requirements and selecting appropriate instruments to manage its exposure. As at the 30 June 2019, the Group has interest-bearing assets, being cash at bank (30 June 2018 cash at bank and interest-bearing liabilities).
As such, the Group's income and operating cash flows is not highly dependent on material changes in market interest rates.
Sensitivity analysis
The Group does not consider this to be a material risk/exposure to the Group and have therefore not undertaken any further analysis.
The weighted average effective interest rate of funds on deposit is 1.81% (30 June 2018: 1.82%).
(ii) Commodity price risk
As the Group has not yet entered into mineral or energy production, the risk exposure to changes in commodity price is not considered significant.
(b) Credit risk
Credit risk arises from cash and cash equivalents and deposits with financial institutions, as well as trade receivables. Credit risk is managed on a Group basis. For cash balances held with bank or financial institutions, only independently rated parties with a minimum rating of ‘-AA’ are accepted.
The Board are of the opinion that the credit risk arising as a result of the concentration of the Group's assets is more than offset by the potential benefits gained.
For
per
sona
l use
onl
y

NOTES TO THE CONSOLIDATED FINANCIAL STATEMENTS For the year ended 30 June 2019
FENIX RESOURCES LIMITED - 49 -
18 FINANCIAL AND CAPITAL RISK MANAGEMENT (continued)
The maximum exposure to credit risk at the reporting date is the carrying amount of the assets as summarised, none of which are impaired or past due.
Exposure to credit risk
The carrying amount of the Group’s financial assets represents the maximum credit exposure. The Group’s maximum exposure to credit risk at the reporting date was:
2019 $
2018 $
Cash and cash equivalents 4,213,915 423,339
Trade and other receivables 156,210 22,328
Other current assets 50,000 -
4,420,125 445,668
The credit quality of financial assets that are neither past due nor impaired can be assessed by reference to external credit ratings (if available) or to historical information about counterparty default rates.
2019 $
2018 $
Cash at bank and short-term deposits
Held with Australian banks and financial institutions
AA- S&P rating 4,213,886 423,247
A+ S&P rating - -
Unrated 29 92
Total 4,213,915 423,339
Other receivables
Counterparties with external credit ratings 132,481 22,066
Counterparties without external credit ratings(1)
Group 1 - -
Group 2 23,729 262
Group 3 - -
Total 156,210 22,328
Other current assets – term deposit
Held with Australian banks and financial institutions
AA- S&P rating 50,000 -
Total 50,000 -
1 Group 1 — new customers (less than 6 months) Group 2 — existing customers (more than 6 months) with no defaults in the past Group 3 — existing customers (more than 6 months) with some defaults in the past. All defaults were fully recovered.
(c) Liquidity risk
Liquidity risk is the risk that the Group will not be able to meet its financial obligations as they fall due. The Group’s approach to managing liquidity is to ensure, as far as possible, that it will always have sufficient liquidity to meet its liabilities when due, under both normal and stressed conditions, without incurring unacceptable losses or risking damage to the Group’s reputation. Through continuous monitoring of forecast and actual cash flows the Group manages liquidity risk by maintaining adequate reserves to meet future cash needs. The decision on how the Group will raise future capital will depend on market conditions existing at that time.
For
per
sona
l use
onl
y

NOTES TO THE CONSOLIDATED FINANCIAL STATEMENTS For the year ended 30 June 2019
FENIX RESOURCES LIMITED - 50 -
18 FINANCIAL AND CAPITAL RISK MANAGEMENT (continued)
Maturities of financial liabilities
The table below analyses the Group’s financial liabilities into relevant maturity groupings based on the remaining period at the reporting date to the contractual maturity date. The amounts disclosed in the table are the contractual undiscounted cash flows.
Less than 6 months
$
6 - 12 months
$
1 - 5 years
$
Over 5 years
$
Total contractual cash flows
$
Carrying amount of liabilities
$
At 30 June 2019
Trade and other payables 631,106 - - - 631,106 631,106
At 30 June 2018
Trade and other payables 105,902 - - - 105,902 105,902
(d) Capital risk management
The Group’s objective when managing capital is to safeguard the ability to continue as a going concern. This is to provide returns for shareholders, benefits for other stakeholders and to maintain an optimal capital structure to reduce the cost of capital.
The Board monitors capital on an ad-hoc basis. No formal targets are in place for return on capital, or gearing ratios, as the Group has not derived any income from operations.
19 LOSS PER SHARE
2019 2018
Basic and diluted loss per share
Net loss after tax attributable to the members of the Company $ (2,613,166) $ (923,420)
Weighted average number of ordinary shares (1) 154,630,907 226,991,001
Basic and diluted loss per share (cents) (1.69) (0.41)
1 On the 14 September 2018, the Company completed the share consolidation of a 5:1 ratio, see Note 15.
20 CRITICAL ACCOUNTING ESTIMATES AND JUDGEMENTS
The preparation of the financial statements requires the use of accounting estimates which, by definition, will seldom equal the actual results. Management also needs to exercise judgement in applying the Group's accounting policies.
This Note provides an overview of the areas that involved a higher degree of judgement or complexity and items which are more likely to be materially adjusted. Detailed information about each of these estimates and judgements is included in the Notes together with information about the basis of calculation for each affected line item in the financial statements.
Significant accounting estimates and judgements
The areas involving significant estimates or judgements are:
Asset acquisition not constituting a business combination – Note 3;
Fair value of assets acquisition – Note 3;
For
per
sona
l use
onl
y

NOTES TO THE CONSOLIDATED FINANCIAL STATEMENTS For the year ended 30 June 2019
FENIX RESOURCES LIMITED - 51 -
20 CRITICAL ACCOUNTING ESTIMATES AND JUDGEMENTS (continued)
Recognition of deferred tax asset for carried forward tax losses — Note 4;
Impairment of assets – Note 6 and Note 8;
Capitalisation of exploration expenditure – Note 7;
Estimate of useful life – Note 8;
Control assessment – Note 9;
Carrying value of interest in Joint Venture – Note 9;
Classification of joint arrangement – Note 10;
Probability of vesting conditions being achieved– Note 17; and
Estimation of fair value of share-based payments – Note 17.
Estimates and judgements are continually evaluated. They are based on historical experience and other factors, including expectations of future events that may have a financial impact on the entity and that are believed to be reasonable under the circumstances.
There have been no actual adjustments this year as a result of an error and of changes to previous estimates.
21 CONTINGENCIES
(a) Contingent liabilities
There were no material contingent liabilities not provided for in the financial statements of the Company as at 30 June 2019 or 30 June 2018 other than:
Native Title and Aboriginal Heritage
Native title claims have been made with respect to areas which include tenements in which the Company has an interest. The Company is unable to determine the prospects for success or otherwise of the claims and, in any event, whether or not and to what extent the claims may significantly affect the Company or its projects. Agreement is being or has been reached with various native title claimants in relation to Aboriginal Heritage issues regarding certain areas in which the Company has an interest.
(b) Contingent assets
There were no material contingent assets as at 30 June 2019 or 30 June 2018.
22 COMMITMENTS
Significant capital expenditure contracted for at the end of the reporting period but not recognised as a liability is as follows:
2019 (1) $
2018 (2) $
Within one year 13,178 138,000
Later than one year but no later than five years 52,712 -
Later than five years 90,068 -
155,958 138,000
1 Commitment for the Iron Ridge project. 2 Commitment for the Beyondie project.
For
per
sona
l use
onl
y

NOTES TO THE CONSOLIDATED FINANCIAL STATEMENTS For the year ended 30 June 2019
FENIX RESOURCES LIMITED - 52 -
23 RELATED PARTY TRANSACTIONS
Transactions with related parties are on normal commercial terms and conditions no more favourable than those available to other parties unless otherwise stated.
Key management personnel compensation
2019 $
2018 $
Short-term employee benefits 514,998 385,285
Post-employment benefits 31,621 15,675
Share based payments 452,556 -
999,175 400,960
Detailed remuneration disclosures are provided within the remuneration report.
Parent entity
The ultimate parent entity and ultimate controlling party is Fenix Resources Limited (incorporated in Australia).
Subsidiaries
Interests in subsidiaries are set out in Note 24.
Transactions with related parties
Remuneration
The Company and Mr Robert Brierley have entered into an executive services agreement for his role as an Executive Director of the Company with effect from 21 November 2018.
The principal terms of the agreement are as follows:
(i) Mr Brierley will be engaged as Executive Director — Corporate and Project Development with a time commitment of 3 days per week equivalent.
(ii) The remuneration comprises a salary of $12,500 per month (inclusive of Directors fees but exclusive of statutory superannuation).
(iii) The agreement may be terminated by either party without cause with 3 months' written notice or if the Company elects, with payment in lieu of notice.
The agreement otherwise contains industry-standard provisions for a senior executive of a public listed company.
The Company and Mr Garry Plowright have entered into an executive services agreement for his role as an Executive Director of the Company with effect from 21 November 2018.
The principal terms of the agreement are as follows:
(i) Mr Plowright will be engaged as Executive Director — Permitting, Access and Environmental with a time commitment of 8 days per month equivalent.
(ii) The remuneration comprises a salary of $6,000 per month (inclusive of Directors fees but exclusive of statutory superannuation).
(iii) The agreement may be terminated by either party without cause with 1 month written notice or if the Company elects, with payment in lieu of notice.
The agreement otherwise contains industry-standard provisions for a senior executive of a public listed company.
Other related parties have continued to receive remuneration on the terms described in the Remuneration Report in the Company's last Annual Financial Report.
For
per
sona
l use
onl
y

NOTES TO THE CONSOLIDATED FINANCIAL STATEMENTS For the year ended 30 June 2019
FENIX RESOURCES LIMITED - 53 -
23 RELATED PARTY TRANSACTIONS (continued)
Share capital issued
Mr Garry Plowright was one of the vendors to the acquisition of Prometheus on 22 November 2018. Accordingly, Mr Plowright received a portion of the consideration securities on completion of the Acquisition, being 5,029,586 Shares and 22,633,139 Performance Shares (comprising 3,017,752 Class A Performance Shares, 6,035,502 Class B Performance Shares, 7,544,379 Class C Performance Shares and 6,035,502 Class D Performance Shares).
Convertible debt facility
Mr Brierley has provided $15,000 of the convertible debt facility that was acquired by the Company, as part of the asset acquisition. The debt facility was provided on an arm’s length basis on the same terms as the facilities identified in Note 13.
2019
$
Face value of the notes acquired 15,000
Fair value adjustment – issue of share capital (1) 15,000
Interest payable -
Settlement of convertible loans (30,000)
-
1 The fair value adjustment represents the discount to the rights issue price.
Terms and conditions
On 10 September 2018, the Group acquired, as part of the asset acquisition, short term convertible loan facilities for $600,000. The convertible loans were a fixed in Australian-dollar and are carried at fair value through profit or loss.
Prometheus Mining Pty Ltd issued 600,000 convertible notes, at an interest rate of 12% with a fair value of $1 per convertible note. The interest on the notes was only payable if Prometheus wasn’t acquired by the Company. The notes convert into ordinary shares of the Company, at the option of the Company on completion of the acquisition and capital raising. The notes convert at the conversion price, being $0.02, a 50% discount to the share issue price of $0.04. Costs associated with the convertible notes were recognised as transaction costs to the loan account and amortised over the life of the convertible notes.
On 22 November 2018, the Company issued 30,000,000 shares at $0.02 to the holders of convertible loans in satisfaction of the outstanding convertible loan amounts which have now been extinguished.
There were no outstanding convertible debt facilities to or from related parties at as 30 June 2019 (30 June 2018: nil).
Loans
Mr Plowright has provided $7,000 of the loan facility that was acquired by the Company, as part of the asset acquisition. The debt facility was provided on an arm’s length basis on the same terms as the facilities identified in Note 13.
2019
$
Loans acquired 7,000
Repayment of loans (7,000)
-
Terms and conditions
On 10 September 2018, the shareholder of the Company approved the acquisition of Prometheus Mining Pty Ltd. On 22 November 2018 the acquisition was completed. Prometheus had entered into short-term loans from Directors to provide working capital during the acquisition for up to $20,000.
For
per
sona
l use
onl
y

NOTES TO THE CONSOLIDATED FINANCIAL STATEMENTS For the year ended 30 June 2019
FENIX RESOURCES LIMITED - 54 -
23 RELATED PARTY TRANSACTIONS (continued)
The loans were fixed in Australian dollars, at an interest rate of 12% per annum and due to their short-term nature the carrying value are assumed to be the same as their fair value.
The loan agreements state that in the event of acquisition the loan amount will be repaid in the order of allowable expenditure in respect of the Western Australian mining lease M20/118-I validly incurred and evidenced by the Company, with any interest forgiven. If there is no allowable expenditure, then the loan holder agrees upon acquisition to forgive the whole of the loan amount and any interest payable.
On 29 November 2018, the Company completed its recompliance and was readmitted to trading. As at 30 June 2019, allowable expenditure had been presented to the company and the loan had been repaid in full.
There were no outstanding loans to or from related parties at as 30 June 2019 (30 June 2018: nil).
Share-based payments
During the year the following equity instruments were granted:
- Mr Tarratt was granted 3,000,000 options;
- Mr Brierley was granted 2,000,000 options;
- Mr Brierley was granted 6,000,000 performance rights;
- Mr Tomasevic was granted 2,000,000 options; and
- Mr Plowright was granted 2,000,000 options.
Details of the valuation pertaining to the above-mentioned equity instruments are set out in Note 17.
There were no other related party transaction during the period.
Transactions with other related parties
Purchases from entities associated with key management personnel
A director, Mr Bevan Tarratt, is a Director of Pura Vida Energy NL which has provided shares office costs per an arrangement and with the Company on normal commercial terms and conditions. The expenses recognised during the year was $4,368 (ex GST) (30 June 2018: $304).
24 INTEREST IN OTHER ENTITIES
(a) Investments in controlled entities
The consolidated financial statements incorporate the assets, liabilities and results of the following subsidiaries in accordance with the accounting policy described in Note 30(a):
Name of entity Country of
incorporation 2019
Equity holding 2018
Equity holding
Prometheus Mining Pty Ltd (1) Australia 100% -
1 Subsidiary acquired on 22 November 2018.
25 EVENTS SUBSEQUENT TO REPORTING DATE
Subsequent to the year end on 9 July, the Company advised that 15,000,000 Class A Performance Shares had not met the requirement for conversion and, pursuant to the terms and conditions of the Performance Shares, all unconverted Class A Performance Shares held by the each holder were automatically consolidated into one Share each.
For
per
sona
l use
onl
y

NOTES TO THE CONSOLIDATED FINANCIAL STATEMENTS For the year ended 30 June 2019
FENIX RESOURCES LIMITED - 55 -
25 EVENTS SUBSEQUENT TO REPORTING DATE (continued)
Subsequent to the year end on 21 August 2019 Fenix advised the outcome of the mineral resource estimation upgrade. Fenix reported a Mineral Resource Estimate at Iron Ridge of 10.5Mt @ 64.2% Fe following recent drilling programme (from 9.2Mt @ 64.1% in March 2019).
In the opinion of the Directors, no other event of a material nature or transaction, has arisen since period end and the date of this report that has significantly affected, or may significantly affect, the Group’s operations, the results of those operations.
26 RECONCILATION OF LOSS AFTER INCOME TAX TO NET CASH OUTFLOW FROM OPERATING ACTIVITIES
Note 2019
$ 2018
$
Loss for the period (2,613,166) (923,420)
Add/(less) non-cash items:
Depreciation and amortisation 8 1,765 2,375
Property, plant and equipment written off 8 9,621 -
Exploration costs impaired/written off 1 20,889 57,043
Performance rights expense – Directors and Employees 17 628,761 -
Options expense – Director share options 17 170,369 -
Options expense – Advisor share options 17 473,248 -
Forgiveness of loan 308 -
Add/ (less) items classified as invested/financing activities:
Finance costs 13 34,463
Changes in assets and liabilities during the financial year:
Decrease/(increase) in receivables (115,759) (19,682)
Increase/(decrease) in payables 31,105 71,466
Increase/(decrease) in employee provision 4,121 -
Net cash outflow from operating activities (1,354,275) (812,218)
27 REMUNERATION OF AUDITORS
During the year the following fees were paid or payable for services provided by the auditor of the parent entity, its related parties and non-related audit firms:
2019 $
2018 $
Audit and assurance services Grant Thornton Audit Pty Ltd
Audit and review of financial statements 32,213 31,304
Total remuneration 32,213 31,304
For
per
sona
l use
onl
y

NOTES TO THE CONSOLIDATED FINANCIAL STATEMENTS For the year ended 30 June 2019
FENIX RESOURCES LIMITED - 56 -
27 REMUNERATION OF AUDITORS (continued)
From time to time the Consolidated Entity may decide to employ an external auditor on assignments additional to their statutory audit duties where the auditor's expertise and experience with the Consolidated Entity are important. These assignments are principally tax advice and due diligence on acquisitions, which are awarded on a competitive basis. It is the Group’s policy to seek competitive tenders for all major consulting projects.
28 PARENT ENTITY INFORMATION
The following information relates to the parent entity, Fenix Resources Limited as at 30 June 2019. The information presented here has been prepared using consistent accounting policies as presented in Note 30. No information has been presented as at 30 June 2018 as the company did not present consolidated statements for that year.
(a) Summary of financial information The individual aggregate financial information for the parent entity is shown in the table.
(b) Guarantees entered into by the parent entity The parent entity did not have any guarantees as at 30 June 2019.
(c) Contingent liabilities of the parent entity The parent entity did not have any contingent liabilities as at 30 June 2019.
(d) Contractual commitments for the acquisition of property, plant and equipment
The parent entity did not have any contractual commitments for the acquisition of property, plant and equipment as at 30 June 2019.
Company
2019
$
Financial position
Current assets 4,422,103
Total assets 8,210,259
Current liabilities 635,232
Total liabilities 635,232
Equity
Contributed equity 27,155,148
Share based payment reserves 2,053,372
Accumulated losses (21,633,492)
Total equity 7,575,028
Financial performance
Loss for the year (2,613,166)
Total comprehensive loss (2,613,166)
29. CHANGES IN ACCOUNTING POLICIES
This note explains the changes in the Group’s accounting policies as a result of the adoption of AASB 9 Financial instruments and AASB 15 Revenue from Contracts with Customers, however the prior year financial statements did not have to be restated as a result.
(a) AASB 15 Revenue from Contracts with Customers (“AASB 15”)
AASB 15 Revenue from contracts with Customers replaces AASB 118 Revenue. AASB 15 was adopted by the Group on 1 July 2018. AASB 15 provides a single, principles-based five-step model to be applied to all contracts with customers. The Group has considered AASB 15 in detail and determined that the impact on the Group’s sales revenue from contracts under AASB 15 is insignificant for the period. The Group’s new revenue accounting policy is detailed below:
Revenue is recognised when or as the Group transfers control of goods or services to a customer at the amount to which the Group expects to be entitled. If the consideration promised includes a variable component, the Group estimates the expected consideration for the estimated impact of the variable component at the point of recognition and re-estimated at every reporting period.
For
per
sona
l use
onl
y

NOTES TO THE CONSOLIDATED FINANCIAL STATEMENTS For the year ended 30 June 2019
FENIX RESOURCES LIMITED - 57 -
29. CHANGES IN ACCOUNTING POLICIES (continued)
(b) AASB 9 Financial Instruments (“AASB 9”)
AASB 9 replaces the provisions of AASB 139 Financial Instruments: Measurement and Recognition (“AASB 139”) that relate to the recognition, classification and measurement of financial assets and liabilities, recognition of financial instruments, impairment of financial assets and hedge accounting.
The adoption of AASB 9 resulted in minimal changes in accounting policies. The new accounting policies are set out below. Transitional adjustments were however required, as set out below, which were recognised on 1 July 2018, in accordance with the transitional provisions of AASB 9.
AASB 9 - Impact of adoption
Classification and measurement of financial assets
The adoption of AASB 9 on the Group’s trade and other receivables did not have a material impact.
AASB 9 - Accounting policies applied from 1 July 2018
Investments and other financial assets
Classification
From 1 July 2018, the Group classifies its financial assets in the following measurement categories:
- those to be measured subsequently at fair value (either through OCI, or through profit or loss), and - those to be measured at amortised cost.
The classification depends on the entity's business model for managing the financial assets and the contractual terms of the cash flows.
For assets measured at fair value, gains and losses will either be recorded in profit or loss or OCI. For investments in equity instruments that are not held for trading, this will depend on whether the Group has made an irrevocable election at the time of initial recognition to account for the equity investment at fair value through other comprehensive income (FVOCI). The Group reclassifies debt investments when and only when its business model for managing those assets changes.
Measurement
At initial recognition, the Group measures a financial asset at its fair value plus, in the case of a financial asset not at fair value through profit or loss (FVPL), transaction costs that are directly attributable to the acquisition of the financial asset. Transaction costs of financial assets carried at FVPL are expensed in profit or loss.
Financial assets with embedded derivatives are considered in their entirety when determining whether their cash flows are solely payment of principal and interest.
Impairment
From 1 July 2018, the Group assesses on a forward-looking basis the expected credit losses associated with its debt instruments carried at amortised cost and FVOCI. The impairment methodology applied depends on whether there has been a significant increase in credit risk.
For trade receivables, the Group applies the simplified approach permitted by AASB 9, which requires expected lifetime losses to be recognised from initial recognition of the receivables.
For
per
sona
l use
onl
y

NOTES TO THE CONSOLIDATED FINANCIAL STATEMENTS For the year ended 30 June 2019
FENIX RESOURCES LIMITED - 58 -
30 STATEMENT OF SIGNIFICANT ACCOUNTING POLICES
Fenix Resources Limited (Company or Fenix) is a company incorporated in Australia whose shares are publicly traded on the Australian Securities Exchange. Fenix Resources Limited is the ultimate parent entity of the Group.
The consolidated financial statements of Fenix Resources Limited for the year ended 30 June 2019 comprise the Company and its controlled subsidiaries (together referred to as the Group and individually as Group entities).
Statement of compliance
These general-purpose financial statements have been prepared in accordance with Australian Accounting Standards, other authoritative pronouncements of the Australian Accounting Standards Board, Australian Accounting Group Interpretations and the Corporations Act 2001. Fenix Resources Limited is a for-profit entity for the purpose of preparing the financial statements.
The consolidated financial statements of the Group also comply with International Financial Reporting Standards (IFRS) as issued by the International Accounting Standards Board (IASB).
Historical cost convention
These financial statements have been prepared on an accruals basis and are based on historical costs and do not take into account changing money values or, except where stated, current valuations of non-current assets. Cost is based on the fair values of the consideration given in exchange for assets.
Critical accounting estimates and significant judgements
The preparation of financial statements requires the use of certain critical accounting estimates. It also requires Management to exercise its judgment in the process of applying the Group's accounting policies. The areas involving a higher degree of judgment or complexity, or areas where assumptions and estimates are significant to the financial statements are disclosed within Note 20.
New and amended standards adopted by the Group
A number of new or amended standards became applicable for the current reporting period and the Group has changed its accounting policies as a result of the adoption of the following standards:
• AASB 9 Financial Instruments; and
• AASB 15 Revenue from Contracts with Customers.
The impact of the adoption of these standards and the new accounting policies are disclosed below. The impact of these standards, and the other new and amended standards adopted by the Group, has not had a material impact on the amounts presented in the Group’s financial statements.
AASB 9 Financial Instruments
AASB 9 Financial Instruments replaces AASB 139 Financial Instruments: Recognition and Measurement. It makes major changes to the previous guidance on the classification and measurement of financial assets and introduces an ‘expected credit loss’ model for impairment of financial assets.
The adoption of this standard has had no impact on the current or previous reporting period and as such there have been no adjustments to the opening balance of retained earnings.
AASB 15 Revenue from Contracts with Customers
AASB 15 replaces AASB 118 Revenue, AASB 111 Construction Contracts and several revenue-related Interpretations. The new Standard has been applied as at 1 July 2018 using the modified retrospective approach. Under this method, the cumulative effect of initial application is recognised as an adjustment to the opening balance of retained earnings at 1 July 2018 and comparatives are not restated.
New standards and interpretations not yet adopted
AASB 16 Leases
AASB 16 eliminates the operating and finance lease classifications for lessees currently accounted for under AASB 117 Leases. It instead requires an entity to bring most leases onto its balance sheet in a similar way to how existing finance leases are treated under AASB 117. An entity be required to recognise a lease liability and a right of use asset in its balance sheet for most leases. There are some optional exemptions for leases with a period of 12 months or less and for low value leases.
Lessor accounting remains largely unchanged from AASB 117.
The entity is yet to undertake a detailed assessment of the impact of AASB 16. However, based on the entity’s preliminary assessment, the Standard is not expected to have a material impact on the transactions and balances recognised in the financial statements when it is first adopted for the year ending 30 June 2020.
There are no other standards that are not yet effective and that are expected to have a material impact on the Group in the current or future reporting period and in the foreseeable future.
Accounting policies
In order to assist in the understanding of the financial statements, the following summary explains the principle accounting policies that have been adopted in the preparation of the financial report. These policies have been applied consistently to all of the periods presented, unless otherwise stated.
(a) Principles of Consolidation
Subsidiaries
The consolidated financial statements incorporate the assets and liabilities of subsidiaries of the Company at the end of the reporting period. Subsidiaries are all those entities (including
For
per
sona
l use
onl
y

NOTES TO THE CONSOLIDATED FINANCIAL STATEMENTS For the year ended 30 June 2019
FENIX RESOURCES LIMITED - 59 -
special purpose entities) over which the Group has the power to govern the financial and operating policies, generally accompanying a shareholding of more than one-half of the voting rights. The existence and effect of potential voting rights that are currently exercisable or convertible are considered when assessing whether the Group controls another entity.
Subsidiaries are fully consolidated from the date on which control is transferred to the Group. They are de-consolidated from the date that control ceases. Where a subsidiary has entered or left the Group during the year, the financial performance of those entities is included only for the period of the year that they were controlled. A list of subsidiaries is contained in Note 24 to the financial statements.
Intercompany transactions, balances and unrealised gains on transactions between Group companies are eliminated in full on consolidation. Unrealised losses are also eliminated unless the transaction provides evidence of the impairment of the asset transferred.
Non-controlling interests in the results and equity of subsidiaries are shown separately in the consolidated statement of profit or loss and other comprehensive income, consolidated statement of changes in equity and consolidated statement of financial position.
Accounting policies of subsidiaries have been changed where necessary to ensure consistency with the policies adopted by the Group.
Equity method
Under the equity method of accounting, the investments are initially recognised at cost and adjusted thereafter to recognise the Group’s share of the post-acquisition profits or losses of the investee in profit or loss, and the Group’s share of movements in other comprehensive income of the investee in other comprehensive income. Dividends received or receivable from associates and joint ventures are recognised as a reduction in the carrying amount of the investment.
When the Group’s share of losses in an equity-accounted investment equals or exceeds its interest in the entity, including any other unsecured long-term receivables, the Group does not recognise further losses, unless it has incurred obligations or made payments on behalf of the other entity.
Unrealised gains on transactions between the Group and its associates and joint ventures are eliminated to the extent of the Group’s interest in these entities. Unrealised losses are also eliminated unless the transaction provides evidence of an impairment of the asset transferred. Accounting policies of equity accounted investees have been changed where necessary to ensure consistency with the policies adopted by the Group.
The carrying amount of equity-accounted investments is tested for impairment in accordance with the policy described in Note 30(h).
Changes in ownership interests
The Group treats transactions with non-controlling interests that do not result in a loss of control as transactions with equity owners of the Group. A change in ownership interest results in an adjustment between the carrying amounts of the controlling and non-controlling interests to reflect their relative interests in the subsidiary. Any difference between the amount of the adjustment to non-controlling interests and any consideration paid or received is recognised in a separate reserve within equity attributable to owners of Fenix Resources Limited.
When the Group ceases to consolidate or equity account for an investment because of a loss of control, joint control or significant influence, any retained interest in the entity is remeasured to its fair value with the change in carrying amount recognised in profit or loss. This fair value becomes the initial carrying amount for the purposes of subsequently accounting for the retained interest as an associate, joint venture or financial asset. In addition, any amounts previously recognised in other comprehensive income in respect of that entity are accounted for as if the Group had directly disposed of the related assets or liabilities. This may mean that amounts previously recognised in other comprehensive income are reclassified to profit or loss.
If the ownership interest in a joint venture or an associate is reduced but joint control or significant influence is retained, only a proportionate share of the amounts previously recognised in other comprehensive income are reclassified to profit or loss where appropriate.
(b) Segment Reporting
Operating segments are reported in a manner that is consistent with the internal reporting to the chief operating decision maker, which has been identified by the company as the Board. (c) Foreign currency translation
Functional and presentation currency
Items included in the financial statements of the Group are measured using the currency of the primary economic environment in which the Group operates (‘the functional currency). The consolidated financial statements are presented in Australian dollars, which is Fenix Resources Limited’s functional and presentation currency.
Transactions and balances
Foreign currency transactions are translated into functional currency using the exchange rates prevailing at the dates of the transactions. Foreign currency monetary assets and liabilities at the reporting date are translated at the exchange rate existing at reporting date. Exchange differences are recognised in profit or loss in the period in which they arise.
No dividends were paid or proposed during the year.
For
per
sona
l use
onl
y

NOTES TO THE CONSOLIDATED FINANCIAL STATEMENTS For the year ended 30 June 2019
FENIX RESOURCES LIMITED - 60 -
Group companies
The results and financial position of foreign operations (none of which has the currency of a hyperinflationary economy) that have a functional currency different from the presentation currency are translated into the presentation currency as follows:
• assets and liabilities for each statement of financial position presented are translated at the closing rate at the date of that balance sheet;
• income and expenses for each statement of profit or loss and other comprehensive income are translated at average exchange rates (unless this is not a reasonable approximation of the cumulative effect of the rates prevailing on the transaction dates, in which case income and expenses are translated at the dates of the transactions); and
• all resulting exchange differences are recognised in other comprehensive income.
On consolidation, exchange differences arising from the translation of any net investment in foreign entities, and of borrowings and other financial instruments designated as hedges of such investments, are recognised in other comprehensive income. When a foreign operation is sold or any borrowings forming part of the net investment are repaid, a proportionate share of such exchange difference is reclassified to profit or loss, as part of the gain or loss on sale where applicable.
Goodwill and fair value adjustments arising on the acquisition of a foreign operation are treated as assets and liabilities of the foreign operation and translated at the closing rate.
(d) Revenue Recognition
Revenue is measured as the fair value of the consideration received or receivable. The Group recognises revenue when the amount of revenue can be reliably measured it is probable that future economic benefits will flow to the entity.
Revenue for other business activities is recognised on the following basis:
Interest income
Interest revenue is recognised on a time proportionate basis that takes into account the effective yield on the financial asset.
(e) Income Tax and Other Taxes
The income tax expense or revenue for the period is the tax payable on the current period’s taxable income based on the applicable income tax rate for each jurisdiction adjusted by changes in deferred tax assets and liabilities attributable to temporary differences and to unused tax losses.
The current income tax charge is calculated on the basis of the tax laws enacted or substantively enacted at the end of the reporting period in the countries where the company’s subsidiaries and associates operate and generate taxable income.
Management periodically evaluates positions taken in tax returns with respect to situations in which applicable tax regulation is subject to interpretation. It establishes provision where appropriate on the basis of amounts expected to be paid to the tax authorities.
Deferred income tax is provided in full, using the liability method, on temporary differences arising between the tax bases of assets and liabilities and their carrying amounts in the consolidated financial statements. However, deferred tax liabilities are not recognised if they arise from the initial recognition of goodwill. Deferred income tax is also not accounted for if it arises from initial recognition of an asset or liability in a transaction other than a business combination that at the time of the transaction affects neither accounting nor taxable profit or loss. Deferred income tax is determined using tax rates (and laws) that have been enacted or substantially enacted by the end of the reporting period and are expected to apply when the related deferred income tax asset is realised or the deferred income tax liability is settled.
Deferred tax assets are recognised for deductible temporary differences and unused tax losses only if it is probable that future taxable amounts will be available to utilise those temporary differences and losses.
Deferred tax liabilities and assets are not recognised for temporary differences between the carrying amount and tax bases of investments in foreign operations where the company is able to control the timing of the reversal of the temporary differences and it is probable that the differences will not reverse in the foreseeable future.
Deferred tax assets and liabilities are offset when there is a legally enforceable right to offset current tax assets and liabilities and when the deferred tax balances relate to the same taxation authority. Current tax assets and tax liabilities are offset where the entity has a legally enforceable right to offset and intends either to settle on a net basis, or to realise the asset and settle the liability simultaneously.
Fenix Resources Limited and its wholly-owned Australian controlled entities have implemented the tax consolidation legislation. As a consequence, these entities are taxed as a single entity and the deferred tax assets and liabilities of these entities are set off in the consolidated financial statements.
Current and deferred tax is recognised in profit or loss, except to the extent that it relates to items recognised in other comprehensive income or directly in equity. In this case, the tax is also recognised in other comprehensive income or directly in equity, respectively.
(f) Goods and Services Tax (GST)
Revenues, expenses and assets are recognised net of the amount of GST except:
• where the GST incurred on a purchase of goods and services
For
per
sona
l use
onl
y

NOTES TO THE CONSOLIDATED FINANCIAL STATEMENTS For the year ended 30 June 2019
FENIX RESOURCES LIMITED - 61 -
is not recoverable from the taxation authority, in which case the GST is recognised as part of the cost of acquisition of the asset or as part of the expense item as applicable; and
• receivables and payables are stated with the amount of GST included.
The net amount of GST recoverable from, or payable to, the taxation authority is included as part of receivables or payables in the Statement of Financial Position.
Cash flows are included in the Statement of Cash Flows on a gross basis and the GST component of cash flow arising from investing and financing activities, which is recoverable from, or payable to, the taxation authority are classified as operating cash flows.
Commitments and contingencies are disclosed net of the amount of GST recoverable from, or payable to, the taxation authority.
(g) Exploration and evaluation expenditure
The Group’s policy with respect to exploration and evaluation expenditure is to use the area of interest method.
This method allows the costs associated with the acquisition, exploration and evaluation of a prospect to be aggregated on the consolidated statement of financial position and matched against the benefits derived from commercial production once this commences. Costs
Exploration lease acquisition costs relating to exploration provinces are initially capitalised and then amortised over the shorter term of the lease or the expected life of the project.
All other exploration and evaluation costs, including general permit activity, geological and geophysical costs and new venture activity costs are charged as expenses as incurred except where:
• such evaluation costs are expected to be recouped through successful development and exploitation of the area of interest or alternatively, by its sale; or
• exploration and/or evaluation activities in the area of interest have not yet reached a stage which permits a reasonable assessment of the existence or otherwise of economically recoverable reserves and active and significant operations in relation to the area are continuing.
Areas of interest are recognised at permit level. Subsequent to the recognition of an area of interest, all further costs relating to the Area of Interest are initially capitalised. Each area of interest is reviewed at least bi-annually to determine whether economic quantities of reserves exist or whether further exploration and evaluation work is required to support the continued carry forward of capitalised costs. To the extent it is considered that the relevant expenditure will not be recovered, it is written off.
In the statement of cash flows, those cash flows associated with the capitalised exploration and evaluation expenditure are classified as cash flows used in investing activities exploration and
evaluation expenditure expensed is classified as cash flows used in operating activities.
Future restoration costs
The Group’s aim is to avoid or minimise environmental impacts resulting from its operations and reviews work scope and cost estimates for restoration annually.
Provision is made in the consolidated statement of financial position for the estimated costs of legal and constructive obligations to restore operating locations in the period in which the obligation arises. The estimated costs are capitalised as part of the cost of the related project where recognition occurs in the operating locations. The costs are then recognised as an expense on a units of production basis during the production phase of the project.
(h) Impairment of Assets
The Group assesses at each reporting date whether there is an indication that an asset may be impaired. If any such indication exists, or when annual impairment testing for an asset is required, the Group makes an estimate of the asset’s recoverable amount. An asset’s recoverable amount is the higher of its fair value less costs to sell and its value in use and is determined for an individual asset, unless the asset does not generate cash inflows that are largely independent of those from other assets or groups of assets and the asset’s values in use cannot be estimated to be close to its fair value. In such cases the asset is tested for impairment as part of the cash generating unit to which it belongs.
When the carrying amount of an asset or cash-generating unit exceeds its recoverable amount, the asset or cash-generating unit is considered impaired and is written down to its recoverable amount. In assessing value in use, the estimated future cash flows are discounted to their present value using a pre-tax discount rate that reflects current market assessments of the time value of money and the risks specific to the asset. Impairment losses relating to continuing operations are recognised in those expense categories consistent with the function of the impaired asset unless the asset is carried at re-valued amount (in which case the impairment loss is treated as a revaluation decrease).
As assessment is also made at each reporting date as to whether there is any indication that previously recognised impairment losses may no longer exist or may have decreased. If such indication exists, the recoverable amount is estimated. A previously recognised impairment loss is reversed only if there has been a change in the estimates used to determine the asset’s recoverable amount since the last impairment loss was recognised. If that is the case the carrying amount of the asset is increased to its recoverable amount. That increased amount cannot exceed the carrying amount that would have been determined, net of depreciation, had the impairment loss been recognised for the asset in prior years. Such reversal is
For
per
sona
l use
onl
y

NOTES TO THE CONSOLIDATED FINANCIAL STATEMENTS For the year ended 30 June 2019
FENIX RESOURCES LIMITED - 62 -
recognised in profit or loss unless the asset is carried at the re-valued amount, in which case the reversal is treated as a revaluation increase. After such a reversal the depreciation charge is adjusted in future periods to allocate the asset’s revised carrying amount, less any residual value, on a systematic basis over its remaining useful life.
(i) Cash and Cash Equivalents
For the purposes of the statement of cash flows, cash and cash equivalents includes cash on hand, cash in bank accounts, money market investments readily convertible to cash within two working days, and bank bills but net of outstanding bank overdrafts.
(j) Trade and Other Receivables
Receivables are initially recognised at fair value and subsequently measured at amortised cost, less provision for doubtful debts. Current receivables for GST are due for settlement within 30 days and other current receivables within 12 months.
(k) Investments and other financial assets
AASB 9 replaces the provisions of AASB 139 Financial Instruments: Measurement and Recognition (“AASB 139”) that relate to the recognition, classification and measurement of financial assets and liabilities, recognition of financial instruments, impairment of financial assets and hedge accounting.
The adoption of AASB 9 resulted in minimal changes in accounting policies. The new accounting policies are set out below. Transitional adjustments were however required, as set out below, which were recognised on 1 July 2018, in accordance with the transitional provisions of AASB 9.
AASB 9 - Impact of adoption
Classification and measurement of financial assets
The adoption of AASB 9 on the Group’s trade and other receivables did not have a material impact.
AASB 9 - Accounting policies applied from 1 July 2018
Investments and other financial assets
Classification
From 1 July 2018, the Group classifies its financial assets in the following measurement categories:
- those to be measured subsequently at fair value (either through OCI, or through profit or loss), and
- those to be measured at amortised cost.
The classification depends on the entity's business model for managing the financial assets and the contractual terms of the cash flows.
For assets measured at fair value, gains and losses will either be recorded in profit or loss or OCI. For investments in equity instruments that are not held for trading, this will depend on
whether the group has made an irrevocable election at the time of initial recognition to account for the equity investment at fair value through other comprehensive income (FVOCI). The group reclassifies debt investments when and only when its business model for managing those assets changes.
Measurement
At initial recognition, the group measures a financial asset at its fair value plus, in the case of a financial asset not at fair value through profit or loss (FVPL), transaction costs that are directly attributable to the acquisition of the financial asset. Transaction costs of financial assets carried at FVPL are expensed in profit or loss.
Financial assets with embedded derivatives are considered in their entirety when determining whether their cash flows are solely payment of principal and interest.
Impairment
From 1 July 2018, the Group assesses on a forward-looking basis the expected credit losses associated with its debt instruments carried at amortised cost and FVOCI. The impairment methodology applied depends on whether there has been a significant increase in credit risk.
For trade receivables, the Group applies the simplified approach permitted by AASB 9, which requires expected lifetime losses to be recognised from initial recognition of the receivables.
(l) Plant and Equipment
Plant and equipment is stated at historical cost less accumulated depreciation and any impairment in value. Historical cost includes expenditure that is directly attributable to the acquisition of the items.
Subsequent costs are included in the asset’s carrying amount or recognised as a separate asset, as appropriate, only when it is probable that future economic benefits associated with the item will flow to the Group and the cost of the item can be measured reliably. The carrying amount of any component accounted for as a separate asset is derecognised when replaced.
The depreciation methods and periods used by the Group are disclosed in Note 8.
The assets’ residual values and useful lives are reviewed, and adjusted if appropriate, at the end of each reporting period.
An asset’s carrying amount is written down immediately to its recoverable amount if the asset’s carrying amount is greater than its estimated recoverable amount.
Gains and losses on disposals are determined by comparing proceeds with carrying amount. These are included in profit or loss.
(m) Acquisition of assets
Where an entity or operation is acquired, the identifiable assets acquired (and, where applicable, identifiable liabilities assumed)
For
per
sona
l use
onl
y

NOTES TO THE CONSOLIDATED FINANCIAL STATEMENTS For the year ended 30 June 2019
FENIX RESOURCES LIMITED - 63 -
are to be measured at the acquisition date at their relative fair values of the purchase consideration.
Where the acquisition is a group of assets or net assets, the cost of acquisition will be apportioned to the individual assets acquired (and, where applicable, liabilities assumed). Where a group of assets acquired does not form an entity or operation, the cost of acquisition is apportioned to each asset in proportion to the fair values of the assets as at the acquisition date.
(n) Share Based Payment Transactions
Benefits to Employees and consultants (including Directors)
The Group provides benefits to employees and consultants (including directors) of the Group in the form of share based payment transactions, whereby employees render services in exchange for shares or rights over shares or options (“equity-settled transactions”).
The costs of these equity settled transactions are measured by reference to the fair value of the equity instruments at the date on which they are granted. The fair value of performance rights granted is determined using the single barrier share option pricing model. The fair value of options granted is determined by using the Black-Scholes option pricing technique. Further details of options and performance rights granted are disclosed in Note 17.
The cost of these equity-settled transactions is recognised, together with a corresponding increase in equity, over the period in which the performance and/or service conditions are fulfilled (the vesting period).
At each subsequent reporting date until vesting, the cumulative charge to the profit or loss is the product of: (i) the fair value at grant date of the award; (ii) the current best estimate of the number of equity instruments that will vest, taking into account such factors as the likelihood of employee turnover during the vesting period and the likelihood of non-market performance conditions being met; and (iii) the expired portion of the vesting period.
The charge to the profit or loss for the period is the cumulative amount as calculated above less the amounts already charged in previous periods. There is a corresponding credit to equity.
Until an equity instrument has vested, any amounts recorded are contingent and will be adjusted if more or fewer equity instruments vest than were originally anticipated to do so. Any equity instrument subject to a market condition is valued as if it will vest irrespective of whether or not that market condition is fulfilled, provided that all other conditions are satisfied.
If the terms of an equity-settled award are modified, as a minimum, an expense is recognised as if the terms had not been modified. An additional expense is recognised for any modification that increases the total fair value of the share based payment arrangement, or is otherwise beneficial to the recipient of the award, as measured at the date of modification.
If an equity-settled transaction is cancelled (other than a grant cancelled by forfeiture when the vesting conditions are not satisfied), it is treated as if it had vested on the date of cancellation, and any expense not yet recognised for the award is recognised immediately. However, if a new equity instrument is substituted for the cancelled award and designated as a replacement award on the date that it is granted, the cancelled and new equity instrument are treated as if they were a modification of the original award, as described in the preceding paragraph.
Benefits to Vendors
The Group provides benefits to vendors of the Group in the form of share based payment transactions, whereby the vendor has render services in exchange for shares or rights over shares or options (“equity-settled transactions”).
The fair value is measured by reference to the value of the goods or services received. If these cannot be reliably measured, then by reference to the fair value of the equity instruments granted.
The cost of these equity-settled transactions is recognised over the period in which the service was received.
(o) Fair value estimation
The fair value of financial assets and financial liabilities must be estimated for recognition and measurement or for disclosure purposes.
The carrying value less impairment provision of trade receivables and payables are assumed to approximately their fair value due to their short-term nature. The fair value of financial liabilities for disclosure purposes is estimated by discounting the future contractual cash flows at the current market interest rate that is available to the Group for similar financial instruments.
(p) Employee Entitlements
The Group’s liability for employee entitlements arising from services rendered by employees to reporting date is recognised in other payables. Employee entitlements expected to be settled within one year together with entitlements arising from wages and salaries, and annual leave which will be settled within one year, have been measured at their nominal amount and include related on-costs.
(q) Loss per share
Basic loss per share
Basic earnings per share is determined by dividing the operating loss attributable to the equity holder of the Group after income tax by the weighted average number of ordinary shares outstanding during the financial year.
Diluted earnings per share
Diluted earnings per share adjusts the figures used in determination of basic earnings per share by taking into account amounts unpaid on ordinary shares and any reduction in earnings
For
per
sona
l use
onl
y

NOTES TO THE CONSOLIDATED FINANCIAL STATEMENTS For the year ended 30 June 2019
FENIX RESOURCES LIMITED - 64 -
per share that will arise from the exercise of options outstanding during the year.
(r) Trade and other payables
Trade payables and other payables are carried at amortised cost and represent liabilities for goods and services provided to the Group prior to the end of the financial period that are unpaid and arise when the Group becomes obliged to make future payments in respect of the purchase of these goods and services. The amounts are unsecured and usually paid within 30 days of recognition.
(s) Contributed equity
Issued and paid up capital is recognised at the fair value of the consideration received by the Group. Any transaction costs arising on the issue of ordinary shares are recognised directly in equity as a reduction of the share proceeds received.
(t) Dividends
No dividends were paid or proposed during the year.
(u) Comparatives
Comparative figures have been restated to conform with the current year’s presentation. This has had no impact on the financial statements.
(v) Parent entity financial information
The financial information for the parent entity, Fenix Resources Limited, disclosed in Note 28 has been prepared on the same basis as the consolidated financial statements except as set out below:
Investments in subsidiaries
Investments in subsidiaries are accounted for at cost and subject to an annual impairment review.
For
per
sona
l use
onl
y

DIRECTORS’ DECLARATION
FENIX RESOURCES LIMITED - 65 -
The Directors of the Group declare that:
1. The financial statements, comprising the consolidated statement of profit or loss and other comprehensive income, consolidated statement of financial position, consolidated statement of cash flows, consolidated statement of changes in equity and accompanying notes, are in accordance with the Corporations Act 2001 and:
(a) comply with Accounting Standards, the Corporations Regulations 2001 and other mandatory professional reporting requirements; and
(b) give a true and fair view of the financial position as at 30 June 2019 and of the performance for the year ended on that date of the consolidated entity.
2. In the Directors’ opinion, there are reasonable grounds to believe that the Group will be able to pay its debts as and when they become due and payable.
3. The Group has included in the notes to the financial statements and explicit an unreserved statement of compliance with International Financial Reporting Standards.
4. The Directors have been given the declarations by the chief executive officer and chief financial officer required by section 295A.
This declaration is made in accordance with a resolution of the Board of Directors and is signed for and on behalf of the Directors by:
Bevan Tarratt
Non-Executive Chairman
Perth
25 September 2019
For
per
sona
l use
onl
y

Grant Thornton Audit Pty Ltd Level 43 Central Park 152-158 St Georges Terrace Perth WA 6000 PO Box 7757 Cloisters Square Perth WA 6850
T +61 8 9480 2000
ACN-130 913 594
Grant Thornton Audit Pty Ltd ACN 130 913 594 a subsidiary or related entity of Grant Thornton Australia Limited ABN 41 127 556 389 ‘Grant Thornton’ refers to the brand under which the Grant Thornton member firms provide assurance, tax and advisory services to their clients and/or refers to one or more member firms, as the context requires. Grant Thornton Australia Limited is a member firm of Grant Thornton International Ltd (GTIL). GTIL and the member firms are not a worldwide partnership. GTIL and each member firm is a separate legal entity. Services are delivered by the member firms. GTIL does not provide services to clients. GTIL and its member firms are not agents of, and do not obligate one another and are not liable for one another’s acts or omissions. In the Australian context only, the use of the term ‘Grant Thornton’ may refer to Grant Thornton Australia Limited ABN 41 127 556 389 and its Australian subsidiaries and related entities. Liability limited by a scheme approved under Professional Standards Legislation.
www.grantthornton.com.au
Independent Auditor’s Report To the Members of Fenix Resources Limited
Report on the audit of the financial report
Opinion
We have audited the financial report of Fenix Resources Limited (the Company) and its subsidiaries (the
Group), which comprises the consolidated statement of financial position as 30 June 2019, the
consolidated statement of profit or loss and other comprehensive income, consolidated statement of
changes in equity and consolidated statement of cash flows for the year then ended, and notes to the
consolidated financial statements, including a summary of significant accounting policies, and the
Directors’ declaration.
In our opinion, the accompanying financial report of the Group is in accordance with the Corporations
Act 2001, including:
a giving a true and fair view of the Group’s financial position as at 30 June 2019 and of its financial
performance for the year then ended; and
b complying with Australian Accounting Standards and the Corporations Regulations 2001.
Basis for Opinion
We conducted our audit in accordance with Australian Auditing Standards. Our responsibilities under
those standards are further described in the Auditor’s Responsibilities for the Audit of the Financial
Report section of our report. We are independent of the Group in accordance with the auditor
independence requirements of the Corporations Act 2001 and the ethical requirements of the
Accounting Professional and Ethical Standards Board’s APES 110 Code of Ethics for Professional
Accountants (the Code) that are relevant to our audit of the financial report in Australia. We have also
fulfilled our other ethical responsibilities in accordance with the Code. We believe that the audit evidence
we have obtained is sufficient and appropriate to provide a basis for our opinion.
For
per
sona
l use
onl
y

© 2019 Grant Thornton Australia Limited. 2
Key Audit Matters
Key audit matters are those matters that, in our professional judgement, were of most significance in our
audit of the financial report of the current period. These matters were addressed in the context of our
audit of the financial report as a whole, and in forming our opinion thereon, and we do not provide a
separate opinion on these matters.
Key audit matter How our audit addressed the key audit matter
Exploration and Evaluation Assets
Note 7
At 30 June 2019 the carrying value of
Exploration and Evaluation Assets was $4.38
million.
In accordance with AASB 6 Exploration for and
Evaluation of Mineral Resources, the Group is
required to assess at each reporting date if there
are any triggers for impairment which may
suggest the carrying value is in excess of the
recoverable value.
The process undertaken by management to
assess whether there are any impairment
triggers in each area of interest involves an
element of management judgement.
This area is a key audit matter due to the
significant judgement involved in determining the
existence of impairment triggers.
Our procedures included, amongst others:
Obtained management's reconciliation
of capitalised exploration and
evaluation expenditure and agreeing to
the general ledger;
Reviewed management’s area of
interest considerations against AASB
6;
Conducted a detailed review of
management’s assessment of trigger
events prepared in accordance with
AASB 6 including;
o Traced projects to exploration
licenses and statutory register to
determine whether a right of
tenure existed;
o Enquired of management
regarding their intentions to carry
out exploration and evaluation
activity in the relevant exploration
area, including review of
management’s budgeted
expenditure;
o Understood whether any data
exists to suggest that the carrying
value of these exploration and
evaluation assets are unlikely to
be recovered through
development or sale;
Assessed the accuracy of impairment
recorded for the year as it pertained to
exploration interests; and
Assessed the appropriateness of the
related financial statement disclosures.
For
per
sona
l use
onl
y

© 2019 Grant Thornton Australia Limited. 3
Asset Acquisition
Note 3
On 10 September 2018, the shareholders
approved the acquisition of assets held by
Prometheus Mining Pty Ltd (Prometheus)
through the acquisition of 100% of its share
capital, and was completed on 22 November
2018.
Accounting for this transaction requires
management judgement to determine if this was
a business combination or an asset acquisition,
the fair value of the purchase consideration and
the allocation of the purchase price to assets
acquired.
We considered this transaction to be a key audit
matter because of the degree of complexity
involved in the acquisition and the materiality of
the matter to the users of the financial
statements.
Our procedures included, amongst others:
Considering the legal documents and
managements position paper on the
acquisition to obtain an understanding
of the transaction;
Assessing the acquisition in relation to
identifying whether the transaction is a
business combination in accordance to
AASB 3 Business Combinations or an
asset acquisition;
Evaluating the determination of the fair
value of the consideration calculated;
and
Assessing the adequacy of the
disclosures in the financial statements.
Information Other than the Financial Report and Auditor’s Report Thereon
The Directors are responsible for the other information. The other information comprises the information
included in the Group’s annual report for the year ended 30 June 2019, but does not include the financial
report and our auditor’s report thereon.
Our opinion on the financial report does not cover the other information and accordingly we do not
express any form of assurance conclusion thereon.
In connection with our audit of the financial report, our responsibility is to read the other information and,
in doing so, consider whether the other information is materially inconsistent with the financial report or
our knowledge obtained in the audit or otherwise appears to be materially misstated.
If, based on the work we have performed, we conclude that there is a material misstatement of this other
information, we are required to report that fact. We have nothing to report in this regard.
Responsibilities of the Directors for the Financial Report
The Directors of the Company are responsible for the preparation of the financial report that gives a true
and fair view in accordance with Australian Accounting Standards and the Corporations Act 2001 and for
such internal control as the Directors determine is necessary to enable the preparation of the financial
report that gives a true and fair view and is free from material misstatement, whether due to fraud or
error.
In preparing the financial report, the Directors are responsible for assessing the Group’s ability to
continue as a going concern, disclosing, as applicable, matters related to going concern and using the
going concern basis of accounting unless the Directors either intend to liquidate the Group or to cease
operations, or have no realistic alternative but to do so.
For
per
sona
l use
onl
y

© 2019 Grant Thornton Australia Limited. 4
Auditor’s Responsibilities for the Audit of the Financial Report
Our objectives are to obtain reasonable assurance about whether the financial report as a whole is free
from material misstatement, whether due to fraud or error, and to issue an auditor’s report that includes
our opinion. Reasonable assurance is a high level of assurance, but is not a guarantee that an audit
conducted in accordance with the Australian Auditing Standards will always detect a material
misstatement when it exists. Misstatements can arise from fraud or error and are considered material if,
individually or in the aggregate, they could reasonably be expected to influence the economic decisions
of users taken on the basis of this financial report.
A further description of our responsibilities for the audit of the financial report is located at the Auditing
and Assurance Standards Board website at: http://www.auasb.gov.au/auditors_responsibilities/ar1.pdf.
This description forms part of our auditor’s report.
Report on the Remuneration Report
Opinion on the Remuneration Report
We have audited the Remuneration Report included in pages 16 to 24 of the directors’ report for the
year ended 30 June 2019.
In our opinion, the Remuneration Report of Fenix Resources Limited, for the year ended 30 June 2019,
complies with section 300A of the Corporations Act 2001.
Responsibilities
The Directors of the Company are responsible for the preparation and presentation of the Remuneration
Report in accordance with section 300A of the Corporations Act 2001. Our responsibility is to express an
opinion on the Remuneration Report, based on our audit conducted in accordance with Australian
Auditing Standards.
GRANT THORNTON AUDIT PTY LTD
Chartered Accountants
P W Warr
Partner – Audit & Assurance
Perth, 25 September 2019
For
per
sona
l use
onl
y

ADDITIONAL INFORMATION
FENIX RESOURCES LIMITED - 69 -
Information as at 25 September 2019
(a) Distribution of Shareholders
The number of shareholdings held in less than marketable parcels is 464.
Category (size of holding) Holders Total Units
1 – 1,000 141 64,245 1,001 – 5,000 265 720,004 5,001 – 10,000 139 1,107,276 10,001 – 100,000 463 19,625,725 100,001 – and over 288 252,498,394
Total 1,296 274,015,641
(b) Voting rights
The voting rights attached to each class of equity security are as follows:
Ordinary Share
Each ordinary share is entitled to one vote when a poll is called, otherwise each member present at a meeting or by proxy has one vote on a show of hands.
Options, Performance Shares & Performance Rights
There are no voting rights attached to any class of options, performance shares or performance rights that are on issue.
(c) 20 Largest Shareholders — Ordinary Shares as at 25 September 2019
Rank Name Ordinary Shares Held
% of Issued Capital
1 CITICORP NOMINEES PTY LIMITED 14,358,386 5.24% 2 ZERO NOMINEES PTY LTD 13,601,285 4.96% 3 BELL POTTER NOMINEES LTD <BB NOMINEES A/C> 12,440,000 4.54% 4 GAB SUPERANNUATION FUND PTY LTD <GAB SUPERANNUATION FUND A/C> 9,707,955 3.54% 5 HSBC CUSTODY NOMINEES (AUSTRALIA) LIMITED <EUROCLEAR BANK SA NV A/C> 8,115,263 2.96% 6 EXXTEN PTY LTD <C & T MITCHELL S/FUND A/C> 6,044,500 2.21% 7 AGNI INTERNATIONAL PTE LTD 5,155,326 1.88% 8 GARRY & DONELLA PLOWRIGHT <THE PLOWRIGHT FAMILY A/C> 5,029,587 1.84% 8 RACHEAL OSMAN <R & K OSMAN FAMILY A/C> 5,029,587 1.84% 9 MSI 888 PTY LTD <MSI 888 A/C> 5,003,000 1.83% 10 MR CONNOR MICHAEL MALONEY 5,000,000 1.82% 11 MR ASHLEY ROBERT BROWN 4,813,615 1.76% 12 VULCAN DEVELOPMENT LTD 4,400,889 1.61% 13 MS FIONA NICOLE VAN DEN BERG 4,400,000 1.61% 14 NATIONAL HYDROCARBONS PTY LTD <FISCHER SUPER FUND A/C> 4,183,466 1.53% 15 MR MICHEAL DAVID STRETTON 3,150,000 1.15% 16 TUBECHANGERS PTY LTD <KING FAMILY A/C> 3,000,000 1.09% 16 SARGON CT PTY LTD <VP CAPITAL FUND I> 3,000,000 1.09% 16 ZERRIN INVESTMENTS PTY LTD 3,000,000 1.09% 17 TITAN RECRUITMENT PTY LTD 2,780,000 1.01% 18 AP MITCHELL SUPERANNUATION FUND PTY LTD <AP MITCHELL SUPERFUND A/C> 2,700,000 0.99% 19 TUBECHANGERS PTY LTD <KING FAMILY A/C> 2,650,000 0.97% 20 PRE-OWNED ROAD TANKERS PTY LTD 2,500,000 0.91%
Total 130,062,859 47.47% Balance of register 143,952,785 52.53%
Grand total 274,015,641 100.00%
(d) Substantial Shareholders
As at 25 September 2019 there were no shareholders who hold 5% or more of the issued capital of the Company as per substantial shareholder notices lodged with ASX.
For
per
sona
l use
onl
y
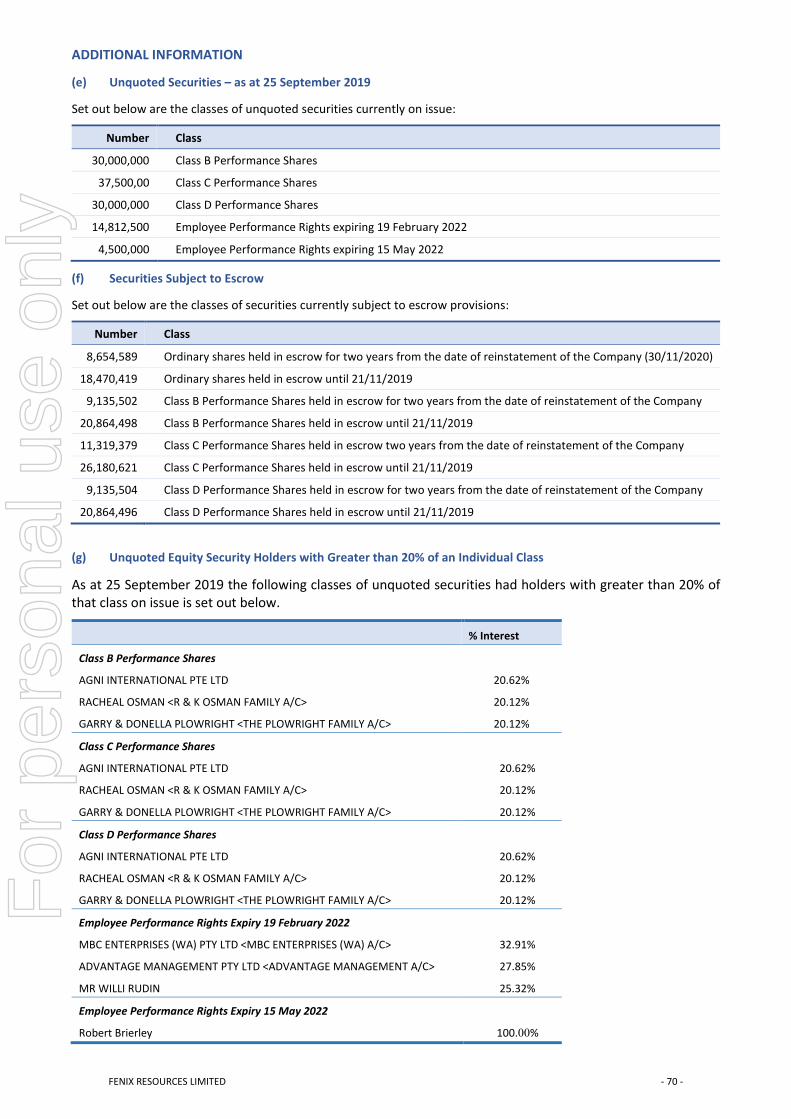
ADDITIONAL INFORMATION
FENIX RESOURCES LIMITED - 70 -
(e) Unquoted Securities – as at 25 September 2019
Set out below are the classes of unquoted securities currently on issue:
Number Class
30,000,000 Class B Performance Shares
37,500,00 Class C Performance Shares
30,000,000 Class D Performance Shares
14,812,500 Employee Performance Rights expiring 19 February 2022
4,500,000 Employee Performance Rights expiring 15 May 2022
(f) Securities Subject to Escrow
Set out below are the classes of securities currently subject to escrow provisions:
Number Class
8,654,589 Ordinary shares held in escrow for two years from the date of reinstatement of the Company (30/11/2020)
18,470,419 Ordinary shares held in escrow until 21/11/2019
9,135,502 Class B Performance Shares held in escrow for two years from the date of reinstatement of the Company
20,864,498 Class B Performance Shares held in escrow until 21/11/2019
11,319,379 Class C Performance Shares held in escrow two years from the date of reinstatement of the Company
26,180,621 Class C Performance Shares held in escrow until 21/11/2019
9,135,504 Class D Performance Shares held in escrow for two years from the date of reinstatement of the Company
20,864,496 Class D Performance Shares held in escrow until 21/11/2019
(g) Unquoted Equity Security Holders with Greater than 20% of an Individual Class
As at 25 September 2019 the following classes of unquoted securities had holders with greater than 20% of that class on issue is set out below.
% Interest
Class B Performance Shares
AGNI INTERNATIONAL PTE LTD 20.62%
RACHEAL OSMAN <R & K OSMAN FAMILY A/C> 20.12%
GARRY & DONELLA PLOWRIGHT <THE PLOWRIGHT FAMILY A/C> 20.12%
Class C Performance Shares
AGNI INTERNATIONAL PTE LTD 20.62%
RACHEAL OSMAN <R & K OSMAN FAMILY A/C> 20.12%
GARRY & DONELLA PLOWRIGHT <THE PLOWRIGHT FAMILY A/C> 20.12%
Class D Performance Shares
AGNI INTERNATIONAL PTE LTD 20.62%
RACHEAL OSMAN <R & K OSMAN FAMILY A/C> 20.12%
GARRY & DONELLA PLOWRIGHT <THE PLOWRIGHT FAMILY A/C> 20.12%
Employee Performance Rights Expiry 19 February 2022
MBC ENTERPRISES (WA) PTY LTD <MBC ENTERPRISES (WA) A/C> 32.91%
ADVANTAGE MANAGEMENT PTY LTD <ADVANTAGE MANAGEMENT A/C> 27.85%
MR WILLI RUDIN 25.32%
Employee Performance Rights Expiry 15 May 2022
Robert Brierley 100.00%
For
per
sona
l use
onl
y

ADDITIONAL INFORMATION
FENIX RESOURCES LIMITED - 71 -
(h) On-market Buy-Back
Currently there is no on-market buy-back of the Company’s securities.
(i) Tenement Schedule
Tenement Name Tenement No. Interest
Iron Ridge M20/118-I 100%
Iron Ridge E20/936 100%
(j) Corporate Governance
Pursuant to the ASX Listing Rules, the Company’s Corporate Governance Statement will be released in conjunction with this report. The Company’s Corporate Governance Statement is available on the Company’s website at: http://fenixresources.com.au/about/corporate-governance/
For
per
sona
l use
onl
y