for personal use only - asx · 2015. 11. 25. · rent received 41,598 41,598 41,598 124,794 rent...
TRANSCRIPT

2015 ANNUAL GENERAL MEETING
1
26 November 2015
ASX: AIK
Andrew Grant – Managing DirectorFor
per
sona
l use
onl
y
CONTENTS
2
INVESTMENT PROPOSITION 3
GROUP OVERVIEW 5
INVESTMENTS
TLRENTALS 9
HAL GROUP ITSERVICES 20
LEADING EDGE GROUP 22
PLATFORM FINANCE GROUP 25
CONCLUSION 28For
per
sona
l use
onl
y

INVESTMENT PROPOSITION
We are here to create
long term value by
generating capital
growth
3
For
per
sona
l use
onl
y

INVESTMENT PROPOSITION
LEADS TO
Growth in
the value
of AIK’s
business
investments
Growth in
the value
ofAIK
Increase in
the AIK
share price
LEADS TO
4
For
per
sona
l use
onl
y

OVERVIEW – AIKRecent History
-
2
4
6
8
10
12
14
16
NTA
Share price
5
30 June 2011 30 June 2015
Cents
per
share
For
per
sona
l use
onl
y

AIK PORTFOLIO
HEAVILY SKEWED TOWARDS GROWTH FROM THE FINANCING OF
ESSENTIAL BUSINESSASSETS
6
56%
9%
0%
35%
HAL
Valuation at 31 October 2015 is $39.6m. This
valuation is driven by a business in growth
mode which provides corporate financing
solutions for essential business equipment.
PLATFORM FINANCE GROUP*
Valuation is $24m. PFG provides motor vehicle
and general business equipment finance.
Portfolio of investments
(% of AIK group NTA)
Hal
Group Platform
Riverwise
* Assuming Group Platform deal settles
$69.9m
For
per
sona
l use
onl
y

SOLID FINANCIAL PERFORMANCE IN 2015
7
Financials - Year ended 30 June
($m)
2015 2014
Revenue 3.0 4.1
Unrealised gain on
investments6.7 1.4
Profit before income
tax8.1 4.0
Income tax expense (0.3) (0.4)
Profit after tax 7.8 3.6
HIGHLIGHTS
• The increase in unrealised gain on
investments and profit reflects
significant increases in the value of
the Hal business due to strong
growth in lease origination.
For
per
sona
l use
onl
y

STRONG FOUNDATIONS
8
Balance Sheet - Year ended 30 June
($m)
2015 2014
Cash 10.8 0.8
Financial assets 46.1 36.6
Intangible assets 0.4 0.6
Total assets 57.5 38.1
Other liabilities (0.7) (1.1)
Total equity 56.8 37.0
HIGHLIGHTS
• Increase in cash is due to the
capital raising of $12m in April
2015
• The increase in financial
assets is due to the
revaluation of the Hal
business
For
per
sona
l use
onl
y

9
For
per
sona
l use
onl
y
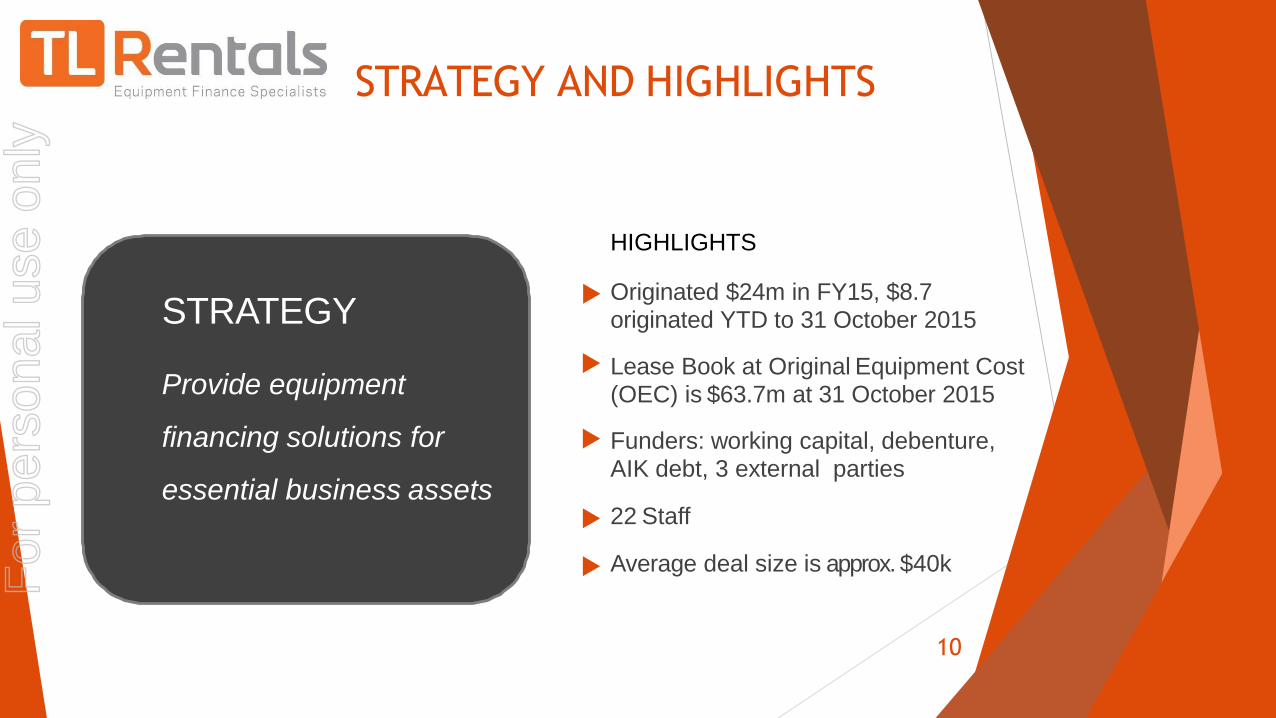
STRATEGY AND HIGHLIGHTS
HIGHLIGHTS
Originated $24m in FY15, $8.7 originated YTD to 31 October 2015
Lease Book at Original Equipment Cost (OEC) is $63.7m at 31 October 2015
Funders: working capital, debenture, AIK debt, 3 external parties
22 Staff
Average deal size is approx. $40k
STRATEGY
Provide equipment
financing solutions for
essential business assets
10
For
per
sona
l use
onl
y

LEASE PORTFOLIO BY ASSET TYPE
Lease Book at
Original
Equipment Cost
as at
31 October 15
11
$8.5m
$6.9m
$4.5m
$8.1m
$9.8m
$3.5m
$12.6m
$9.8m
Other
Telephony
Software
IT
Industrial Plant and Equipment
Fixures & Fittings
Commercial Vehicles
Audio Visual
For
per
sona
l use
onl
y

LEASE PORTFOLIO
GEOGRAPHICAL SPREAD
12
40%
21%
26%
13%
NSW VIC QLD Other
QLD
Other
$63.7m
NSW
VIC
* At original equipment cost
For
per
sona
l use
onl
y

LEASE ORIGINATION CONTINUES
TO GROW
0.3 1.77.3
15.1
22.5
31.0
2011 FY 2012 FY 2013 FY 2014 FY 2015 FY 2016
FORECAST
$m of Leases Written
* At original equipment cost
$8.7m YTD
31 October 2015
13* 2008 TL Rentals Originated $60m
For
per
sona
l use
onl
y

LEASING MODEL PRODUCES
CASH FLOWS
14
CASHFLOWS FOR TL Rentals ex GST
Day 1 Year 1 Year 2 Year 3 Year 4 Total
Equipment paid for OEC (100,000) (100,000)
Brokerage paid (4,000) (4,000)
Proceeds from funding 107,432 107,432
Rent received 41,598 41,598 41,598 124,794
Rent paid to funder (41,598) (41,598) (41,598) (124,794)
Inertia rentals/equipt.
sales proceeds
20,000 20,000
Net cash flow for TLR 3,432 - - - 20,000 23,432
* Cash flows are the core of the valuation model
For
per
sona
l use
onl
y

KEY DATA
LEASE PERFORMANCE
15
Arrears continue to track at 1% or less
Write offs continue to track at 1.5% or less
For
per
sona
l use
onl
y

KEY DATA
SECONDARY INCOME
16
% of return on inertia on a year to year basis
Year % inertia
2011 19%
2012 21%
2013 21%
2014 23%
2015 23%
* % of original equipment cost
For
per
sona
l use
onl
y

KEY DATA
“INTEREST RATE Vs
COST OF FUNDS”
Weighted average spread
17
+4%
For
per
sona
l use
onl
y

COMPETITIVE ADVANTAGE
18
TL rental value
propositionTL Rentals value
proposition
Experienced staff across
sales, accounting,
finance, collections,
credit, end-of-term
Systems (IT and people)
Nimble credit team, able to
structure/assess non-standard
lesseesFunding
Our lease documentation
and the application of it
For
per
sona
l use
onl
y

2016 OBJECTIVES
Grow the lease book (aim is 20% per annum)
Broaden funding sources (reduce risk, cheaper funding,
more leases can be written)
Vendor partners to become their preferred financier
Build the sales team
19
For
per
sona
l use
onl
y

A growing and profitable AustralianIT
services business
20
For
per
sona
l use
onl
y

Snapshot
Data Services
(Hal) –
commenced
1993, IT
equipment trader
June 2015 Hal
acquired CCA (for
$200k) to merge
and improve
offering
HistoryHal - large corporate
and government
client base + vendor
network
CCA - SME client base
+ an expanded
service offering
(wireless, cloud,
telephony etc)
30 staff – Chatswood,
Perth
Significant growth
mode, building sales
pipeline. Referral
source for TL
Rentals
Forecast for combined
business to make $426k
EBITDA for FY16
IT Services
21
For
per
sona
l use
onl
y

Holding company for
Operates sales channels for
telecommunication partners in
Australia, NZ and the U.K. and one of
Australia’s largest retail buying groups
22
For
per
sona
l use
onl
y

23
UK telco
Sales channel management
for British Telecom
Strategic focus: drive more sales and
restructure the arrangement with British
Telecom
Australian buying groups
One of Australia’s largest retail
buying groups with more than 900
members
Strategic focus: improving
profitability, adding new groups,
expanding services
New Zealand telco
Sales channel management
for Spark (ex Telecom NZ)
Strategic focus: drive sales, develop
new sales channel partners
Australian telco
Owns and operates large Telstra
Business Centres in Box Hill and
Rosebery
Strategic focus: driving sales growth,
expanding product/service offering
Business overview and strategy
For
per
sona
l use
onl
y
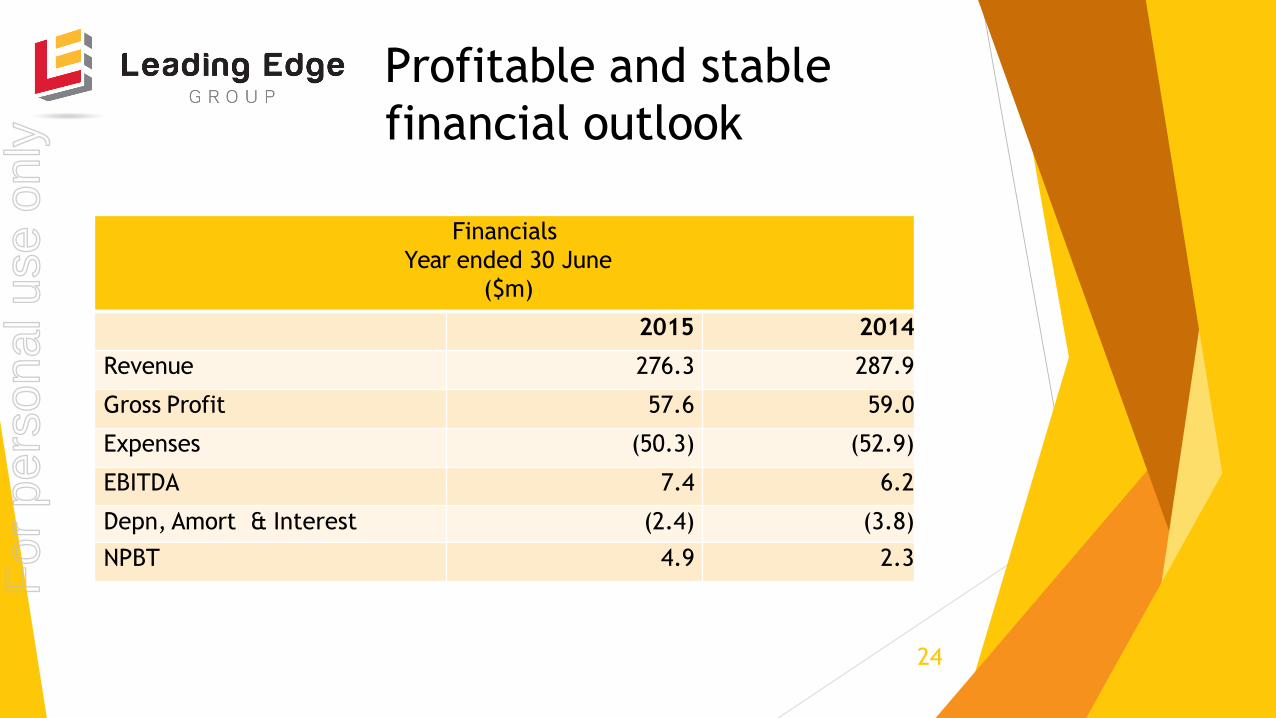
Profitable and stable
financial outlook
Financials
Year ended 30 June
($m)
2015 2014
Revenue 276.3 287.9
Gross Profit 57.6 59.0
Expenses (50.3) (52.9)
EBITDA 7.4 6.2
Depn, Amort & Interest (2.4) (3.8)
NPBT 4.9 2.3
24
For
per
sona
l use
onl
y

An Australian asset finance broker and
aggregator in motor vehicles and
general business equipment finance
25
For
per
sona
l use
onl
y

Snapshot and Strategy
o Number of employees – 53
o Office locations – Mildura, Melbourne & St Leonards
o Operate across Australia for predominantly motor vehicle finance
o Strategy
Grow business organically and through acquisitions of other
finance brokers
Stay at the forefront of industry compliance, innovation and funder
relationships
Finance in FY16 $1b of motor vehicle contracts 26
For
per
sona
l use
onl
y

27
Improving financial results driven by
consistent growth in equipment
financedFinancials
Year ended 30 June
($m)
FY12 FY13 FY14 FY15
EBIDA 1.5 2.5 3.5 3.8
NPBT 1.2 2.2 3.0 3.7
NPAT 1.1 1.9 2.4 2.9
Equipment
financed directly
245.7 285.1 343.9 405.8
Total financed
through Group
Platform
303.7 591.5 630.8 851.6
For
per
sona
l use
onl
y

Key People
28
Andrew Grant
MD AIK and TL Rentals, founder of
Hal Group
Hal Group
Chris Dawson
Director of Hal Group, founder of
Hal Group
TL Rentals
George Matis
Sales Director TL Rentals, founder of
Hal Group
Group Platform
Peter Schroeder
CEO
Michael Nicholls
Sales Director
Michael Mitrovits
CFO
Peet Jordaan
Technical Services Director
Raylee Carruthers
CFO AIK, TLRentals and Hal Group
For
per
sona
l use
onl
y

Contact details
Andrew Grant
Managing Director
Ph: 0415 166 090
For
per
sona
l use
onl
y