for personal use only - asx · 2015 annual report aurelia metals ltd 2 corporation place orange nsw...
TRANSCRIPT
2015 ANNUAL REPORT
AURELIA METALS LTD
2 CORPORATION PLACE ORANGE NSW 2800
ASX CODE: AMIABN: 37 108 476 384
PHONE: +61 2 6363 5200 FAX: +61 2 6361 4711
WWW.AURELIAMETALS.COM
AURELIA METALS LTD 2015 ANNUAL REPORT
For
per
sona
l use
onl
y

AURELIA METALS LIMITED – ANNUAL REPORT 2015 1
CONTENTS COMPANY INFORMATION ........................................................................................................................................... 2
CHAIRMAN’S LETTER..................................................................................................................................................... 3
REVIEW OF OPERATIONS........................................................................................................................................... 5
COMPETENT PERSONS STATEMENTS ............................................................................................................... 11
STATEMENT OF RESOURCES AND RESERVES ........................................................................................... 13
DIRECTORS’ REPORT .................................................................................................................................................. 14
REMUNERATION REPORT (AUDITED) .............................................................................................................. 28
FINANCIAL STATEMENTS ......................................................................................................................................... 34
NOTES TO FINANCIAL STATEMENTS................................................................................................................ 38
DIRECTORS’ DECLARATION ................................................................................................................................... 78
AUDITORS INDEPENDENCE DECLARATION ................................................................................................. 79
INDEPENDENT AUDITORS REPORT ...................................................................................................................80
ADDITIONAL ASX INFORMATION ....................................................................................................................... 83
F
or p
erso
nal u
se o
nly
AURELIA METALS LIMITED – ANNUAL REPORT 2015 2
COMPANY INFORMATION Directors Mr Anthony Wehby – Chairman Mr Gary Comb Mr Paul Espie Mr Mark Milazzo Company Secretary Mr Richard Willson Registered Office and Principal Place of Business Aurelia Metals Limited Telephone: (02) 6363 5200 2 Corporation Place Facsimile: (02) 6361 4711 ORANGE NSW 2800 Email: [email protected] Share Register Security Transfer Registrars Pty Ltd 770 Canning Highway Applecross WA 6153 Telephone: (08) 9315 2333 Facsimile: (08) 9315 2233 Stock Exchange Listing Aurelia Metals Limited shares are listed on the Australian Stock Exchange, the home branch being Perth. ASX Code: AMI Auditors Ernst and Young 680 George Street Sydney NSW 2000 Website www.aureliametals.com
F
or p
erso
nal u
se o
nly

AURELIA METALS LIMITED – ANNUAL REPORT 2015 3
CHAIRMAN’S LETTER
Dear Stakeholders
Looking back into the 2015 financial year Aurelia achieved some notable milestones, some of which were imminent at the time of our last AGM. It graduated from being an exploration company to being a mining company, a processing plant was built and brought on line, gold and base metal concentrates were produced and sales during commissioning and commercial production in excess of A$36m were achieved.
While the Hera mine continues to improve and provide every reason for confidence in its future, there is money to be spent to rectify process plant problems. The reality for the future of Aurelia is complex and uncertain.
The Financial Statements set out in this Annual Report reflect the impact of both the operating problems experienced during and since commissioning of the Hera processing plant and the dispute with Glencore regarding conversion of Facility A and Facility B Converting Notes. It is clear from those Financial Statements that in order to remain viable Aurelia needs to repair its Balance Sheet and establish adequate liquidity to achieve the potential of its assets.
At the time of writing, the Company is in litigation with Glencore; by the time of our AGM the initial results of that litigation may be known – I will, therefore, update shareholders at an appropriate time before the AGM.
I am pleased to advise that, despite the ongoing proceedings in the Supreme Court of NSW, negotiations with Glencore to secure an agreed settlement are continuing.
Throughout these very trying times I have been buoyed by the operational improvements being made at Hera and by the focus, commitment and support of our staff, contractors and suppliers. While not yet being in a financial position to make the necessary changes to the processing plant, the operations at Hera are now cash flow positive.
Contact from shareholders during this period, to express support or provide advice, has been greatly appreciated.
On behalf of the Board, and personally, I express my deep appreciation to staff and management for their professionalism and dedication in difficult times. Finally, a sincere thank you to my fellow directors for their support and unflagging commitment to the Company.
Yours sincerely
Anthony Wehby Non-Executive Chairman
12 October 2015
F
or p
erso
nal u
se o
nly

AURELIA METALS LIMITED – ANNUAL REPORT 2015 4
F
or p
erso
nal u
se o
nly

AURELIA METALS LIMITED – ANNUAL REPORT 2015 5
REVIEW OF OPERATIONS The financial year commenced strongly for Aurelia with the on-time completion of the Hera project construction, the first gold and concentrate production in the December quarter, and numerous strong exploration drilling results extending the Hera deposit to the north and south. Disappointing operating performance since the commencement of the Hera Project commissioning provided for a poor operating result with a net loss recorded for the period of $118.158 million after a $92.915 million asset impairment. At time of this report, the operating performance of Hera has substantially improved, however the performance over the year has placed considerable financial strain on the Company. The Company has sought to deliver a significant recapitalisation, seeking new funding and reducing gearing through the conversion of some $79m of convertible debt held by Glencore Group Funding Limited (‘Glencore’). This process is being challenged by Glencore who have purported an event of default and attempted to appoint an Administrator to the Company. As a key driver of the recapitalisation, Aurelia is seeking additional external funding for the delivery of the Hera Expansion Plan, which leverages off the expanded Hera resource to expand and rectify key areas of the Hera processing circuit and to deliver an expanded throughput capacity for the mine and process plant of up to 450,000 t/y with increased metal production, reduced operating costs and attractive financial returns. At time of this report, there remained considerable uncertainty as to the Company’s future funding arrangements and to the proposed conversion of Glencore debt. The Company’s ability to convert is currently due to be heard by a court in early-November. Note that at the time of writing the court date has been deferred from the original plan of 14 October to 4 and 5 November. The Directors’ Report and Financial Statements contained in this annual report were finalised prior to this new information being available and refer to the earlier date of 14 October. The financial uncertainty and operating losses notwithstanding, the Company retains the view as to the value and potential of both the Hera mine and the neighbouring Nymagee copper deposit and is hopeful of a near term resolution of the funding uncertainty, the delivery of the Hera Expansion Study, and the return of value to shareholders.
HERA-NYMAGEE PROJECT
The Hera-Nymagee Project represents Aurelia Metals’ (AMI) flagship Project and consists of the Hera gold-base metal deposit (AMI 100%) and the Nymagee copper deposit (AMI 95%), and is located approximately 100km south-east of Cobar, hosted in the Cobar Basin rocks of central NSW. The Cobar Basin also hosts the major mineral deposits at CSA (Cu-Ag), The Peak (Cu-Au) and Endeavor (Cu-Pb-Zn-Ag). Company activities for the period were dominated by the finalisation of development activities on the Hera Project and the commissioning and ramp-up of the Hera processing plant.
HERA PROJECT
SUMMARY The operational performance of the Hera Project for the 12 months to June 2015 was disappointing and below expectations. The highlights for the year included:
• The successful on-time completion of the Hera Project construction
F
or p
erso
nal u
se o
nly

AURELIA METALS LIMITED – ANNUAL REPORT 2015 6
• First gold pour in September 2014 and first concentrate shipment in November 2014 • The formal opening of the Hera Mine on 26 November 2014 • Successful exploration extending high-grade gold-lead-zinc mineralisation to the north and south
However, despite these highlights, the Hera process plant commissioning and production ramp up has been challenged by numerous issues, summarised by:
• The under performance of the gold grades in the Hera orebody, relative to the reserve block model • Poor mechanical stability of the Hera Process Plant, particularly in the tertiary crushing circuit • Poor gold and silver recovery • Poor zinc recovery • High process operating and process maintenance costs
At the report date, substantial improvement in each of these areas had been achieved, however the disappointing operating performance has substantially contributed to significant financial uncertainty, which is detailed elsewhere in this report. Total metal production for the year, which includes production during commissioning and during the commercial production phase, is summarised in the table below: Physicals Units Total FY15
Gold Production oz 12,930
Silver Production oz 7,246
Concentrate produced DMT 20,773
Concentrate Grade - Gold g/t 7.96
Concentrate Grade - Silver g/t 112.50
Concentrate Grade - Lead % 24.35
Concentrate Grade - Zinc % 28.86
HERA UNDERGROUND
The development of the Hera underground mine progressed smoothly for the year with the commencement of stope ore production in March 2015. Underground development and mining rates progressed well ahead of schedule during the year, leaving the mine well developed at June 2015. During the year 223,338 tonnes of ore was mined grading 3.26g/t gold, 13.4g/t silver, 2.77% lead and 3.90% zinc.
HERA PROCESS PLANT
Construction of the Hera Process Plant progressed well during the year, with commissioning commencing on time in August 2014 and the formal plant acceptance from the EPCM contractors taken on 22 September 2014. Notwithstanding a successful construction period, the Hera Process Plant performance for the year has been disappointing with numerous challenges summarised below. Gold production for the year was 12,930 ounces with 4,125 ounces produced in the operating period and 8,805 ounces produced during the commissioning period. Gold production was derived from the processing of 223,215 tonnes of ore grading 2.9 g/t gold, 2.6% lead and 3.45% zinc. Gold recovery averaged 62%.
F
or p
erso
nal u
se o
nly

AURELIA METALS LIMITED – ANNUAL REPORT 2015 7
Summary physical production for the year is presented in the table below: Physicals Units Total
Ore Processed t 223,215
Ore Processed Grade - Gold g/t 2.92
Ore Processed Grade - Silver g/t 14.05
Ore Processed Grade - Lead % 2.60
Ore Processed Grade - Zinc % 3.45
Ore Processed Grade - Copper % 0.20
% Recovery - Gravity Gold % 30.37
% Recovery - Leach Gold % 31.33
% Recovery - Total Gold % 61.71
% Recovery - Silver Dore % 7.43
% Recovery - Silver Concentrate % 82.84
% Recovery - Total Silver % 90.28
% Recovery - Lead % 86.16
% Recovery - Zinc % 78.36
Gold Production oz 12,930
Silver Production oz 7,246
Concentrate produced DMT 20,773
Concentrate Grade - Gold g/t 7.96
Concentrate Grade - Silver g/t 112.50
Concentrate Grade - Lead % 24.35
Concentrate Grade - Zinc % 28.86
Production - Contained Metal - Silver oz 75,133
Production - Contained Metal - Lead t 5,057
Production - Contained Metal - Zinc t 5,995
Throughput Process plant throughput has been challenged by poor mechanical stability, particularly in the tertiary crushing circuit, merrill crowe circuit and the concentrate filter press. Issues with mechanical stability have been sequentially addressed during the year, and design throughput rates were achieved in May 2015. Design throughput rates in the crushing circuit are largely being achieved through the reconfiguration of the primary and secondary crushers to reduce the load on the under-performing tertiary VSI (Vertical Shaft Impact) crushers. This has had a consequential impact on processing maintenance costs as other elements of the crushing circuit are taking the load and experiencing higher wear rates than design.
Precious Metal Recovery Gold recovery has fallen below expectation since the start of commissioning, affected by a series of issues including:
• Poor performance of the gravity gold circuit • Unstable leach conditions caused by the oxidation of reactive ore on the ROM stockpile • Instability in the Merrill Crowe circuit • Concentrate filter cloth failures
F
or p
erso
nal u
se o
nly

AURELIA METALS LIMITED – ANNUAL REPORT 2015 8
The process circuit is designed to recover gold by gravity separation and by cyanide leach extraction. To date, gravity gold recovery has been below design level (approx. 30%), which has meant that additional gold is reporting to the leach circuit for recovery. Peroxide/oxygen sparging, and increasing cyanide dosing have been employed to enhance gold recovery in the leach circuit. These actions have contributed to the currently high process operating cost. In addition, the gold room furnace was inoperable for most of the month of June resulting in delayed shipments of gold production. The furnace has returned to operations in July with a new larger furnace planned for installation in the December 2015 quarter. Total gold recovery was 62% to June 2015 and showed little improvement since the completion of commissioning. However at report date gold recoveries had been substantially improved to 73% for September 2015. Gold recovery of 80%-90% is considered achievable under stable process conditions. Changes in process design to both enhance precious metal recovery and reduce operating costs were in progress at June 2015. The installation of additional gravity infrastructure, being a Knelson concentrator on the rougher concentrate (now installed), and hydro-cyclones are expected to make material improvements in gravity gold recovery. Silver recovery to doré of 7.5% is well below design, due to poor silver extraction from the leach circuit. Whilst some commercial value is recovered from payable silver in concentrate, further work is required to bring silver leach performance back to design.
Lead and Zinc Recovery Lead and zinc recovery were both at design level in the December quarter at approximately 90%. These levels reduced to mid-80% in the March quarter, with lead recovery remaining steady in the mid-80% level with zinc reducing further into the June quarter. Zinc recovery has been affected by a concerted effort to reduce silica content in the final concentrate product. Further work is ongoing to resolve this issue and continuous improvement in the zinc recovery is underway, including changes to reagents. Lead flotation performance is very satisfactory however recovery was partially affected by the focus on silica content reduction in the June quarter.
HERA EXPLORATION
AMI maintained a significant exploration effort around the Hera deposit during the first half of the financial year. Highlights of the exploration effort were the discovery of high grade gold-lead-zinc mineralisation at the Hera North Pod, and high grade extensions to Hera Main Lens south, the 1530 Lens and the Hays South Lens. Highlight exploration results from these areas received in the year include: Hera North Pod
o 17.1m @ 14.8g/t Au, 168g/t Ag, 15.9% Pb and 15.2% Zn o 3.65m at 39.7 g/t Au, 243 g/t Ag, 7.91% Pb and 11.3% Zn
Hera Main Lens South: o 9.0m @ 32.6g/t Au, 1.3% Pb and 2.3% Zn o 3.1m @ 80.9g/t Au, 24g/t Ag, 1.1% Pb and 1.6% Zn o 4.2m @ 17g/t Au, 6g/t Ag, 0.9% Pb and 1.9% Zn
F
or p
erso
nal u
se o
nly

AURELIA METALS LIMITED – ANNUAL REPORT 2015 9
Hays Lens South:
o 7.7m @ 16.4g/t Au, 9g/t Ag and 5.1% Pb+Zn o 7.2m @ 10.5g/t Au, 29g/t Ag and 10.2% Pb+Zn o 4.0m @ 32.8g/t Au, 22g/t Ag and 4.8% Pb+Zn o 12.0m at 24 g/t Au and 4.3% Pb+Zn
HERA RESOURCE REVISION
In April 2015, Aurelia released a new resource estimate for the Hera ore-body, inclusive of stope delineation drilling and exploration success at Hera North, Hays North and the 1530 Lens. In June 2015, following an independent review, a coding problem in the April 2015 resource was found which served to overestimate volumes by approximately 12%. As a result, the Resource was re-estimated with this issue resolved and inclusive of adopting more conservative geo-statistical parameters. These more conservative parameters provide a stronger correlation to the reconciled ore grades to June 2015 (based on reconciliations of around 2% of the previous resource). The revised resource was released in July 2015, as per the table below: Category Tonnes NSR ($/t) Au (g/t) Ag (g/t) Cu (%) Pb (%) Zn (%)
Measured 658,000 277.9 5.14 15.59 0.24 2.96 3.40
Indicated 958,000 220.0 3.37 17.97 0.15 3.02 4.51
Inferred 890,000 224.9 2.37 73.91 0.10 4.85 6.02
Total 2,506,000 236.9 3.48 37.21 0.15 3.65 4.76 Whilst tonnage has been reduced relative to the April 2015 estimate, and the gold grade has been reduced from 3.75g/t Au to 3.48g/t Au, the grade of silver, zinc and lead have all increased as a result of the revision, and overall, the resource model demonstrates that Hera remains a high grade deposit. In addition the higher confidence categories of measured and indicated resources still represents approximately 65% of the total resource.
HERA EXPANSION STUDY
To deliver improved operating performance the Company has developed the Hera Expansion Study to rectify sections of the Process Plant, to deliver improved performance of the processing circuit and lower operating costs, but also deliver enhanced throughput capacity of up to 450,000 t/y. The Expansion Study shows the Hera Project capable of delivering:
• A five year mine life assuming no additional exploration success • Mining inventory of 2.18 Mt at 3.1 g/t gold, 3.2% lead and 4.2% zinc • Average annual production of 40,000 ounces gold, 14,000 t/y zinc, 12,500 t/y lead • LOM operating costs of around $160/t (mining, processing, admin, transport & royalty) • An All-in Sustaining Cost (AISC) over the life of mine of less than A$700/ounce, after base metal credits • Processing capital expenditure of $16.8 million in FY16 (revised crushing and grinding circuit including ball mill
installation) is based on acquiring second hand equipment.
The delivery of the Hera Expansion Project is contingent on securing external funding and an amendment to the existing project approval for increased annual mining rates and total ore mined, an increase in groundwater extraction licences, and an extension to the existing Hera Mining Lease. The study includes allowances for timing and cost for additional licence and permit requirements for the study. The study has not yet included any value associated with the planned Stage 2 integration of the Nymagee copper deposit, nor has it included any further exploration success and attendant mine life additions. The Company has confidence that each of these will be delivered in time providing additional uplift to the value of the Hera Expansion Study.
F
or p
erso
nal u
se o
nly

AURELIA METALS LIMITED – ANNUAL REPORT 2015 10
CORPORATE
Share issues In September 2014, Aurelia reached agreement to issue shares to the value of $2 million (5,590,027 Ordinary Fully Paid shares at an average price of 35.78 cents per share) to Pybar Mining Services as part payment for mining services rendered. At the same time, agreement was also reached with Pacific Road Capital subscribed for $3.2 million of new equity, according to a share subscription agreement, on the following terms: 2,778,050 shares at $0.2434 to raise $676,177 and 7,126,950 shares at $0.3578 to raise $2,552,032.
Rights issue On 21 January 2015, Aurelia closed a fully underwritten, non-renounceable rights issue to raise $10 million. Applications for 18,316,232 new shares to raise $4.286 million were received from eligible shareholders, not including the sub-underwriter and major shareholder Pacific Road Capital Management Pty Ltd as trustee for the YTC Managed Investment Trust (Pacific Road). In addition to the applications received from eligible shareholders, pursuant to the underwriting agreement between Key Pacific Advisory Partners Pty Ltd (fully sub-underwritten by Aurelia’s largest shareholder, Pacific Road) a total of 24,661,011 new shares were allotted to the underwriter/sub-underwriter. Pacific Road as the holder of 19.99% of the Company’s shares prior to the issue of the new shares were entitled to subscribe for 8,594,159 new shares under the offer which were taken up as part of the underwritten amount. A total of 42,977,243 new shares raising $10,056,675 (before costs) were issued on 28 January 2015. The Company wishes to thank shareholders including Pacific Road, for their strong support of this Rights Issue.
CORPORATE GOVERNANCE
A copy of The Company’s Corporate Governance Statement is located on the Company’s website: http://www.aureliametals.com/about/Corporate-Governance.aspx
F
or p
erso
nal u
se o
nly
AURELIA METALS LIMITED – ANNUAL REPORT 2015 11
COMPETENT PERSONS STATEMENTS Competent Persons Statement – Exploration Results The information in this report that relates to Exploration Results is based on information compiled by Rimas Kairaitis, who is a Member of the Australasian Institute of Mining and Metallurgy. Rimas Kairaitis is a fulltime employee of Aurelia Metals and has sufficient experience which is relevant to the style of mineralisation and type of deposit under consideration and to the activity which he is undertaking to qualify as a Competent Person as defined in the 2012 Edition of the ‘Australasian Code for Reporting of Exploration Results, Mineral Resources and Ore Reserves.’ Mr Kairaitis consents to the inclusion in this report of the matters based on his information in the form and context in which it appears.
Competent Persons Statement –Hera Resource Estimate The Resource Estimation for the Hera deposit has been completed by:
· Mr Lynn Widenbar, BSc (Hons), MSc, DIC, MAusIMM, MAIG , is a geologist and a Director and Principal of Widenbar and Associates, and co-authored by:
· Mr Stuart Jeffrey, Senior Project Geologist – Hera Project BSc (Hons), MSc (Econ Geology), MAusIMM
Mr Widenbar is a full time employee of Widenbar and Associates Pty Ltd. Mr Widenbar has sufficient experience that is relevant to the style of mineralisation and type of deposit under consideration and to the activity that is being undertaken to qualify as a Competent Person as defined in the 2012 Edition of the ‘Australasian Code for Reporting of Exploration Results, Minerals Resources and Ore Reserves’. Mr Widenbar consents to the inclusion in the report of the matters based on his information in the form and context that the information appears. Mr Jeffrey is a full time employee of Aurelia Metals Limited and has sufficient experience which is relevant to the style of mineralisation and type of deposit under consideration and to the activity which he is undertaking to qualify as a Competent Person as defined in the 2012 Edition of the ‘Australasian Code for Reporting of Exploration Results, Mineral Resources and Ore Reserves.’ Mr Jeffrey consents to the inclusion in this report of the matters based on his information in the form and context in which it appears.
Competent Persons Statement – Nymagee Resource Estimate The Resource Estimation for the Nymagee deposits has been completed by Mr Dean Fredericksen who is a Member of the Australasian Institute of Mining and Metallurgy. Mr Dean Fredericksen was a full time employee of Aurelia Metals and has sufficient experience which is relevant to the style of mineralisation and type of deposit under consideration and to the activity which he is undertaking to qualify as a Competent Person as defined in the 2012 Edition of the ‘Australasian Code for Reporting of Exploration Results, Mineral Resources and Ore Reserves.’ Mr Fredericksen consents to the inclusion in this report of the matters based on his information in the form and context in which it appears. The information on the Nymagee and Hera Resource estimates is extracted from the ASX Reports available on the Aurelia Metals Website:
· Maiden Nymagee Resource Estimate – 22 December 2011 The Company confirms that it is not aware of any new information or data that materially affects the information included in the original market announcement and that all material assumptions and technical parameters underpinning the estimates in the relevant market announcement continue to apply and have not materially changed. The Company confirms that the form and context in which the Competent Person’s findings are presented have not been materially modified from the original market announcement.
Competent Persons Statement – Hera DFS Ore Reserve The Information in this report relating to Ore Reserves is based on work undertaken by Mr Michael Leak of Optiro Pty Ltd under supervision of Mr Sean Pearce. This report has been compiled by Sean Pearce, who is a Member of the Australasian Institute of Mining and Metallurgy. Sean Pearce was a full time employee of Aurelia Metals and has sufficient experience which is relevant to the style of mineralisation and type of deposit under consideration and to the activity which he is undertaking to qualify as a Competent Person as defined in the 2012 Edition of the ‘Australasian Code for Reporting of Exploration Results, Mineral Resources and Ore Reserves.’ Mr Pearce consents to the inclusion in this report of the matters based on his information in the form and context in which it appears. The information on the Hera Ore Reserve is extracted from the ASX Report available on the Aurelia Metals Website:
· Hera DFS Release – 19 September 2011 The Company confirms that it is not aware of any new information or data that materially affects the information included in the original market announcement and that all material assumptions and technical parameters underpinning the estimates in the relevant market announcement continue to apply and have not materially changed. The Company confirms that the form and
F
or p
erso
nal u
se o
nly

AURELIA METALS LIMITED – ANNUAL REPORT 2015 12
context in which the Competent Person’s findings are presented have not been materially modified from the original market announcement.
Competent Persons Statement – 3KEL-Midway Resource Estimation The resource estimates of oxide material at 3KEL and Midway have been performed by Dr William Yeo, MAusIMM, who is an employee of Hellman & Schofield Pty Ltd and who qualifies as a Competent Person under the meaning of the 2012 JORC Code. He consents to the inclusion of these estimates, and the attached notes, in the form and context in which they appear. The information on the Nymagee and Hera Resource estimates is extracted from the ASX Reports available on the Aurelia Website:
· Inferred Resource for 3KEL and Midway Laterite Deposits – 3 March 2008 The Company confirms that it is not aware of any new information or data that materially affects the information included in the original market announcement and that all material assumptions and technical parameters underpinning the estimates in the relevant market announcement continue to apply and have not materially changed. The Company confirms that the form and context in which the Competent Person’s findings are presented have not been materially modified from the original market announcement.
F
or p
erso
nal u
se o
nly

AURELIA METALS LIMITED – ANNUAL REPORT 2015 13
STATEMENT OF RESOURCES AND RESERVES Hera Deposit Mineral Resource Estimate (AMI– 100%) – July 2015
Category Tonnes NSR ($/t) Au (g/t) Ag (g/t) Cu (%) Pb (%) Zn (%)
Measured 658,000 277.9 5.14 15.59 0.24 2.96 3.40
Indicated 958,000 220.0 3.37 17.97 0.15 3.02 4.51
Inferred 890,000 224.9 2.37 73.91 0.10 4.85 6.02
Total 2,506,000 236.9 3.48 37.21 0.15 3.65 4.76
Hera Deposit – DFS Mining Reserve (AMI-100%) – September 2011
Source Tonnes Au (g/t) Ag (g/t) Cu (%) Pb (%) Zn (%) Au Eq (g/t)
Contained Gold
Ounces (Au Eq.)
Development Sub-total 278,158 2.86 13.06 0.13 2.26 3.19
Stope Sub-Total 1,597,760 3.72 15.39 0.17 2.56 3.55
MINE PROBABLE RESERVE 1,875,918 3.59 15.04 0.16 2.51 3.50 7.00 423,471
Nymagee Deposit Mineral Resource Estimate (AMI– 95%) – December 2011
Description Cut Off Tonnes Cu % Pb % Zn % Ag g/t
INDICATED
Shallow Cu Resource (above 90mRL) 0.3% Cu 5,147,000 1.00 0.10 0.20 5
Deeper Cu Resource (below 90m RL) 0.75% Cu 1,984,000 1.80 0.30 0.60 11
Lead-Zinc-Silver Lens 5% Pb + Zn 364,000 0.50 4.40 7.80 41
INFERRED
Deeper Cu Resource (below 90m RL) 0.75% Cu 601,000 1.30 0.10 0.20 8
GLOBAL 8,096,000 1.20 0.30 0.70 9
Contained Metal (tonnes) 96,000t 27,000 53,000 69
Midway & 3KEL deposits – Doradilla JV (AMI 100%) – February 2008
Midway 3KEL TOTAL
Category Sn Cut-off Tonnes (M) % Sn Tonnes (M) % Sn Tonnes (M) % Sn
Inferred 0.1% 4.63 0.25 3.18 0.34 7.81 0.29
Inferred 0.2% 1.97 0.4 1.85 0.48 3.82 0.44
Inferred 0.5% 0.38 0.92 0.56 0.89 0.94 0.90
F
or p
erso
nal u
se o
nly

AURELIA METALS LIMITED – ANNUAL REPORT 2015 14
DIRECTORS’ REPORT The following report is submitted in respect of the results of Aurelia Metals Limited (‘Aurelia’ or ‘the Company’, formerly YTC Resources Limited) and its subsidiaries, together the consolidated group (‘Group’), for the financial year ended 30 June 2015, together with the state of affairs of the Group as at that date.
DIRECTORS AND OFFICERS
The names, qualifications and experience of the Company’s Directors in office during the financial year and until the date of this report are as follows. Directors and Officers were in office for this entire period unless otherwise stated.
Mr Anthony Wehby - Chairman Anthony Wehby was a partner with PWC Australia (Coopers & Lybrand) for 19 years during which time he specialised in the provision of corporate finance advice to a wide range of clients including those in the mining and exploration sectors. Since 2001, Mr Wehby has maintained a financial consulting practice, advising corporate clients considering significant changes to their business activities. Mr Wehby is a Fellow of the Institute of Chartered Accountants in Australia and a Member of the Australian Institute of Company Directors. Mr Wehby is a Director of Royal Rehab, and he was the Chairman of Tellus Resources Limited until December 2013.
Mr Gary Comb Gary Comb is an engineer with over 30 years’ experience in the Australian Mining Industry, both with mining companies and in mining contractor roles. From 2003, Mr Comb was Managing Director of Jabiru Metals Limited, taking the Jaguar Copper/Zinc Project from discovery through feasibility, construction to operations. Jabiru Metals was taken over by Independence Group Limited for A$532 million in 2011. Prior to joining Jabiru, Mr Comb was the Chief Executive Officer of BGC Contracting Pty Ltd, the mining contracting arm of West Australian construction group BGC Pty Ltd. Mr Comb has also worked in various mining operational management roles including with Macmahon Contractors, St Barbara Mines, Metana Minerals and Central Murchison Gold. Mr Comb is currently a Non-Executive Director of Ironbark Zinc Ltd and Non-Executive Chairman at Finders Resources Ltd, he was previously a director of Jabiru Metals Ltd and Tanami Gold Ltd.
Mr Paul Espie Paul Espie established the Pacific Road Group, investment banking business in resources and infrastructure, in 1986. He was Chairman of Oxiana Limited during the development of the Sepon copper/gold project in Laos (2000 to 2003) and prior to that Chairman of Cobar Mines Pty Ltd after a management buy-out in 1993. Mr Espie was previously responsible for Bank of America operations in Australia, New Zealand and Papua New Guinea and Chairman of the Australian Infrastructure Fund. He is a Fellow of the Australian Institute of Company Directors and Trustee of the Australian Institute of Mining & Metallurgy, Educational Endowment Fund, also a Director of the Menzies Research Centre.
Mr Mark Milazzo Mark Milazzo is a mining engineer with over 30 years’ experience in the development and management of mines and mineral processing plants across a range of commodities in Australia and overseas. This includes both underground and surface operations, and covers a wide range of mining applications, from small scale
F
or p
erso
nal u
se o
nly

AURELIA METALS LIMITED – ANNUAL REPORT 2015 15
selective to mechanised bulk extraction methods. He has been involved in a number of new mine development and mine expansion projects. Past senior roles include General Manager of the Olympic Dam Mine and Kambalda Nickel Operations with WMC Resources, and General Manager with mining contractor HWE Mining. Mr Milazzo is a Fellow of the Australasian Institute of Mining and Metallurgy and a Member of the Australian Institute of Company Directors. He is a Non-Executive Director of Red 5 Limited and was previously a Director of Mirabela Nickel Limited from June 2014 until September 2015 and Cortona Resources Limited from May 2011 until January 2013.
Mr Rimas Kairaitis (Resigned as Director 2 August 2015) Rimas Kairaitis is a geologist with over 20 years’ experience in minerals exploration and resource development in gold, base metals and industrial minerals in Queensland and NSW, working with companies including Shell Minerals, Plutonic Resources, CRA (Rio Tinto) and Alkane Resources. Mr Kairaitis was a founding Director of the mineral exploration company LFB Resources NL (now a subsidiary of Alkane Resources Limited). From 1999 to 2006 he worked as a geological consultant to Alkane until becoming a founding Director of Aurelia Metals Limited and its Chief Executive Officer in 2007. Mr Kairaitis has a strong exploration track record, leading the geological field team to the discovery of the Tomingley Gold deposit in NSW in 2001 and the McPhillamy’s Gold Deposit in 2006. He graduated with a Bachelor of Applied Science (Geology) with first class Honours and University Medal in 1992 from the University of Technology, Sydney. He is also a member of the Australian Institute of Mining and Metallurgy. In the last three years Mr Kairaitis has held no other listed company directorships.
Mr Michael Menzies (Resigned 26 June 2015) Michael Menzies is a law graduate who has over 35 years of experience in a variety of industrial, operational and managerial roles within the mining industry in Australia and off- shore, in base metals, gold, mineral sands and coal. He has worked with Renison Goldfields CRA Limited and in private equity, prior to working in mining consultancy work in recent times. From 1998 to 2003 Mr Menzies was employed as Executive General Manager Mining of MIM Holdings LTD. Mr Menzies is experienced in mining project operational and investment evaluation work. Mr Menzies is a former Director of Australian Mines and Metals Association and former Vice-President of the Queensland Mining Council.
Dr Guoqing Zhang (Resigned 12 November 2014) Dr Zhang is Chief Executive Officer of Yunnan Tin Australia TDK Resources Pty Ltd and Chairman of China Yunnan Tin Minerals Group Company Limited (Hong Kong Stock Exchange), appointed 26 November 2010. Dr Zhang was previously Deputy General Manager of the Sino-Platinum Metal Company Limited, which is a Shanghai listed subsidiary company of the Yunnan Tin Group. Dr. Zhang is based in Australia and is a Director of Australian companies controlled by the Yunnan Tin Group. Dr Zhang has extensive experience in research and development of metal alloys and has received a number of Chinese national awards. Dr. Zhang has a B.Sc (Hon) degree and Ph.D. in Material Science.
F
or p
erso
nal u
se o
nly

AURELIA METALS LIMITED – ANNUAL REPORT 2015 16
Mr Yong Chen – Alternate for Dr Guoqing (to 12 November 2014) Yong Chen is an accountant with more than 20 years’ experience in both Australia and China. Mr Chen is a Director and CFO of Yunnan Tin Australia Investment Holding Pty Limited, a subsidiary of Yunnan Tin Group Limited based in China which is the world’s largest tin producer. He has worked in various accounting roles including 9 years as the GST & Investment Accountant with Sydney Church of England Grammar School (Shore School) in North Sydney. Mr Chen has a Bachelor of Economics from the Shanghai University of Finance & Economics and a Master of Business in Accounting and Finance from the University of Technology, Sydney.
Ms Susan Corlett – Alternate for Mr Paul Espie (for 17 July 2014) Susan Corlett is a geologist and executive with over 20 years’ experience in exploration, mining, and finance in Africa, Australasia and the Pacific Rim. Ms Corlett is an Investment Director of Pacific Road Capital and a Director of the not-for-profit charity, the David Burgess Foundation. She was previously a Non-Executive Director of Mawson West Limited from 5 April 2014 to 15 October 2014. Ms Corlett’s experience includes exploration and mine geology with RGC Limited and Goldfields Limited, and broad experience in the banking industry with Standard Bank, Macquarie Bank and Deutsche Bank. Ms Corlett holds a BSc Hons (Geology) from the University of Melbourne, is a Member of the AusIMM and a graduate of the Australian Institute of Company Directors.
Mr Richard Willson – Company Secretary, Alternate for Mr Gary Comb and Mr Mark Milazzo (to 22 January 2015). Richard Willson is an accountant with more than 20 years’ experience in public practice and in various financial management and company secretarial roles within the resources and agricultural sectors for both publicly listed and private companies. Mr Willson has a Bachelor of Accounting from the University of South Australia, is a fellow of CPA Australia, and a Fellow of the Australian Institute of Company Directors. In addition to his role as Company Secretary with Aurelia Metals Limited, Mr Willson is Company Secretary of the ASX listed Beston Global Food Company Limited, a Non-Executive Director of ASX listed companies Aus Tin Mining Limited and Crestal Petroleum Limited, and a Non-Executive Director and Company Secretary of the not-for-profit Unity Housing Company.
F
or p
erso
nal u
se o
nly

AURELIA METALS LIMITED – ANNUAL REPORT 2015 17
DIRECTORS’ INTERESTS IN THE SHARES AND OPTIONS OF THE COMPANY
At the date of this report the interests of the Directors in the shares and other equity securities of the Company were: Ordinary
Shares Options over Ordinary
Shares Performance
Rights Directors Anthony Wehby 978,125 600,000 - Gary Comb 281,250 500,000 - Paul Espie - - - Mark Milazzo 225,000 500,000 - Rimas Kairaitis * 4,473,544 600,000 250,000 Michael Menzies* 112,500 - - Guoqing Zhang - - - Yong Chen - - - Susan Corlett - - - Richard Willson 37,574 - 50,000 Total 6,107,993 2,200,000 300,000
*For past directors, holdings were current at date of final director’s interest notice.
DIVIDENDS
No dividend was paid or declared by the Company in the period since the end of the previous financial year, and up to the date of this report. The Directors do not recommend that any amount be paid by way of dividend for the financial year ended 30 June 2015.
CORPORATE STRUCTURE
Aurelia Metals Limited (formerly YTC Resources Limited) is a company limited by shares that is incorporated and domiciled in Australia. Aurelia has four wholly owned subsidiaries, Stannum Pty Ltd (incorporated 15 September 2007), Defiance Resources Pty Ltd (incorporated 15 May 2007), Hera Resources Pty Ltd (incorporated 20 August 2009) and Nymagee Resources Pty Ltd (incorporated 7 November 2011).
F
or p
erso
nal u
se o
nly

AURELIA METALS LIMITED – ANNUAL REPORT 2015 18
OPERATIONS AND FINANCIAL REVIEW 1. Overview Aurelia Metals Limited is an Australian gold, lead and zinc miner and exploration company. The Company operates the wholly-owned gold and base metal mine Hera, in central west New South Wales. The majority of activity during the financial year was related to the construction and commissioning of the Hera mine, with commercial operations commencing for the last quarter of the fiscal year on 1 April 2015. On 23 September 2014, the Company announced the move from the construction phase into the commissioning phase of the processing circuit. During the construction and commissioning phase, all revenue associated with metal production during the commissioning phase was credited towards the cost of mine development and all site costs were capitalised until commercial production was declared. It was determined that the effective date of commercial production at Hera was 1 April 2015. From this date, all relevant operating costs and revenue were accounted for in the income statement. Commercial production was declared after the satisfactory review of a number of key design and financial parameters, including process plant availability, throughput, metal recovery and final product quality. On 16 December 2014, the Company announced an underwritten non-renounceable 1:8 rights issue to raise approximately $10 million. Funds were utilised for working capital during commissioning, and to accelerate exploration around the Hera underground resource, particularly to the north. A longer commissioning phase than planned, together with a delayed ramp up in operating performance in the first quarter of operations, delivered a weak financial result for the year. Lower than planned gold recovery reduced expected revenues and higher than planned reagent consumption and crusher maintenance costs in the processing circuit, delivered significantly higher costs than planned. These factors significantly impacted the financial performance of the first quarter of operations and therefore the full year financial results. A review of the Company’s asset carrying values, in the context of the lower than planned operating performance and an underestimate of certain site administration and processing costs relative to the feasibility study, and other factors, resulted in the impairment of the carrying value of some assets. The review has resulted in the recognition of a total impairment loss of $92.915 million, comprising mine properties ($75.031 million) and exploration assets ($17.884 million). The reported net loss for the period was $118.158 million after the $92.915 million asset impairment. To deliver improved operating and financial performance, the Company developed the Hera Expansion Study. The key element of this plan is the rectification of sections of the process plant; to deliver improved performance of the processing circuit and lower operating costs, but also deliver expanded throughput capacity for the mine and process plant of up to 450,000 t/y. The detailed Hera Expansion Study was released to ASX on 7 July 2015 ‘Hera Project Performance, Expansion Study and Financial Update’, with the Study demonstrating that the Hera Project is capable of delivering:
• A five year mine life assuming no additional exploration success • Mining inventory of 2.18 Mt at 3.1 g/t Au, 3.2% lead and 4.2% zinc • Average annual production of 40,000 oz gold, 14,000 t/y zinc, 12,500 t/y lead • Life of Mine (LOM) operating costs of around $160/t (mining, processing, admin, transport and royalty) • An All-in Sustaining Cost (AISC) over the life of mine of less than A$700/oz, after base metal credits • Processing capital expenditure of $16.8 million (revised crushing and grinding circuit including ball mill
installation) based on acquiring second hand equipment. The delivery of the Hera Expansion Project is contingent on securing external funding and an amendment to the existing project approval for increased annual mining rates and total ore mined, an increase in groundwater extraction licences, and an extension to the existing Hera Mining Lease. The study includes allowances for timing and cost for additional licence and permit requirements for the study.
F
or p
erso
nal u
se o
nly

AURELIA METALS LIMITED – ANNUAL REPORT 2015 19
To secure the future value of the Hera Project, a recapitalisation of the Company’s balance sheet was proposed to the Company’s secured lender Glencore Group Funding Limited ‘Glencore’, involving a conversion of a portion of existing debt facilities together with a potential equity raising. As announced to ASX on 1 July 2015, Glencore lodged a Notice of Default, which if valid, would bar the debt conversion. The notice of default was given on the grounds that the secured lender believed or believes the Company to be insolvent. This has been rejected by the Company. Conversion notices, to convert a combined amount of $70 million of principal debt (excluding capitalised interest), were issued to Glencore on 7 July (Facility B) and 7 September (Facility A). Glencore rejected the conversion notices due to the notice purporting an event of default. Without consultation with the Company’s Board, Glencore appointed a voluntary administrator to the Company and certain of its subsidiaries on 14 September 2015. The Company sought and received from the Supreme Court of NSW on the 15 September 2015 a standstill on the secured creditor’s appointment of an administrator and a standstill on the Company’s ability to convert the Glencore facilities A and B. The matter is to be heard by the Supreme Court on 14 October 2015. The going concern basis upon which these accounts are prepared rely on a positive outcome of the court hearing on the 14 October or any alternative settlement achieved with the secured lender. Regardless of the Company’s legal position, there remains uncertainty as to the outcome of the court hearing and therefore uncertainty about the validity of the secured creditor’s appointment of the voluntary administrator.
2. Operating and Financial Performance Commercial production at the Hera Operation was declared on 1 April 2015. Performance in the last quarter of the 2015 financial year was below expectations due to a range of mechanical and technical issues which affected gold and zinc recovery, processing throughput, and processing operating costs. The Company incurred a net loss of $118.158 million compared to a net loss of $10.623 million in the prior year. The key significant item is the combined asset and exploration impairment loss of $92.915 million. 2.1 Asset impairment amounts
Accounting standards require an entity to assess at each reporting date whether there is an indication that an asset book value may be impaired. Where the indicators are present, a full review of the recoverable amount of the assets at the cash generating unit (‘CGU’) level is required. Any excess of asset book value at the reporting period, over the recoverable value, is impaired. The primary impairment indicator has been the performance of Hera since commissioning. The review has resulted in the recognition of a total impairment loss of $92.915 million, comprising mine development ($75.031 million) and exploration and evaluation assets ($17.884 million). The impairment of exploration and evaluation assets is in recognition of the uncertainty around the recovery of asset values through successful development. The Nymagee asset, in particular, has been written down to a nominal value reflecting the timing and certainty of recovery of the former book value. The impairment has created negative equity on the balance sheet, which can be restored through profitable trading, and or, a conversion of debt into equity, and or, the introduction of new equity. The impairment is a non-cash item and therefore has no impact on the Company’s cash position. The written down asset values do not create any concern with regard to conditions around the Company’s debt facilities with Glencore. 2.2 Sales
Sales revenue for the period was $13.220 million, with $6.187 million derived from gold sales and $6.988 million derived from the sale of lead zinc concentrates. Gold sales were derived from the sale of 3,924oz of gold at an average price of A$1578/oz. Concentrate sales were derived from the sale of 10,144 dmt of lead zinc concentrate shipped.
F
or p
erso
nal u
se o
nly
AURELIA METALS LIMITED – ANNUAL REPORT 2015 20
During the year the Company utilised gold and base metal hedging contracts to protect against adverse movements in metal prices. All gold forwards, gold put options and lead and zinc metal quotational period hedge contracts were closed out at year end. 2.3 Production
Gold production for the operating period was 4,125 ounces, with 8,805oz produced during the commissioning period. Gold production was derived from the processing of 75,660 tonnes of ore grading 2.7 g/t gold, 2.5% lead and 3.3% zinc. Gold recovery averaged 62.1%. Processing throughput in the June quarter was at a nominal annualised 303,000 t/y rate, some 85% of nameplate capacity. Significant effort is being applied to improve throughput despite the limitations of the tertiary crushing circuit. Post balance date, throughput has improved with the plant operating at a nominal annualised rate of 325,000 t/y during July and August 2015. As noted in the Hera Expansion Study (released to ASX 7 July) to deliver a step change in performance, certain sections of the plant require rectification, particularly the tertiary crushing circuit which will require replacement with a tertiary cone crusher and installation of a ball mill. Gold recovery was 62% during the period and has shown steady improvement post year end, with gold recovery averaging 70% during July and August 2015. Gold recoveries of greater than 80% are considered achievable once operating stability is achieved in the leach, gravity and Merrill Crowe circuits. Zinc recovery was 66%, but improved to 80% in the month of June and has averaged 84% during July and August 2015. Lower recoveries in the year were in part related to trial work associated with suppression of silica in the concentrate. The performance of the underground mine has remained positive. A total of 69,319 t of ore was mined during the year at an average grade of 2.6 g/t gold and 2.5% lead and 3.3% zinc. Ore was sourced from three active stopes with some 60-70% from stoping, the remainder from development. Underground development of 215 m was comprised wholly of operating development. Discussions are continuing with our mining contractor with a view to achieving a significant reduction in the current schedule of rates. 2.4 Costs
Total cost of sales for the period was $26.445 million. Site production costs were $13.161 million (mining, processing and site admin departments), transport and refining costs were $1.368 million (gold refining charges, concentrate trucking, rail, port and shipping charges) and a cost of $5.381 million relating to a reduction in inventory (primarily related to the sale of two shipments of lead zinc concentrates in the period). Depreciation charged in the period of $6.453 million was based on asset values prior to the asset impairment at 30 June 2015. 2.5 Cash flow
As at 30 June 2015, the Company held cash in bank of $4.848 million ($3.020 million which is unavailable and held as cash deposits for environmental bonds). Operating cash flow for the period of negative $3.009 million was impacted by concentrate shipment#4, which departed on 29 June with cash from provisional invoicing not received until after balance date. Investment cash outflows were $25.702 million and related primarily to $43.128 million of payments for capital expenditure (completion of construction and commissioning activity up to 31 March 2015) net of $19.595 million of receipts from product sales during the commissioning period. Net cash flow from financing activities was positive $11.968 million. The key inflows related to two separate capital raisings during the year. In October 2014 the Company completed a placement to Pacific Road raising $3.226 million (before issue costs) and in January 2015 raised $10.506 million (before issue costs) via a non-renounceable rights issue to shareholders.
F
or p
erso
nal u
se o
nly

AURELIA METALS LIMITED – ANNUAL REPORT 2015 21
2.6 Borrowings
At balance date, the Company held $114.652 million of borrowings, consisting of $22.737 million of current borrowings and $91.915 million of non-current borrowings. The classification between current and non-current borrowings is based on the Company’s legal position that the notice of default issued by the Company’s secured creditor (see Overview section) is invalid. If valid, the classification of current borrowings would increase to reflect all borrowings related to Glencore as due and payable. The total borrowings from the Company’s secured lender (Glencore) at balance date was $117.246 million across four facilities (Facilities A, B, C and E), inclusive of accrued interest and prior to facility establishment costs. At balance date, Facility A had a principal and accrued interest balance of $23.054 million, Facility B had a principal and accrued interest balance of $55.774 million, Facility C had a principal and accrued interest balance of $32.592 million and Facility E had a principal and accrued interest balance of $5.824 million. Facility A and B, representing total outstanding liabilities of $78.829 million, are in the form of Converting Notes and have an original terms of 60 months. A key feature of these securities is the ability convert these Notes into ordinary equity of the Company based on certain pricing formulae. The decision to convert the Notes in accordance with the Converting Note Deed Poll is at the election of the Company, subject to satisfaction of certain conditions, namely FIRB approval, no Event of Default is continuing and The Security Trustee (a Glencore entity) has not commenced enforcement proceedings. The remaining facilities, Facility C and E, represent total outstanding debt of $38.416 million and have original terms of 60 months and 42 months respectively. The first repayment date across all facilities was 15 September 2015. The repayment obligation was approximately $4.23 million on 15 September, and $4.84 million on 15 October, then quarterly repayment obligations from this date until maturity. Maturity of the facilities is 30 months from first repayment on Facilities A, B and C and 13 months from first repayment of Facility E. Assuming conversion of Facilities A and B prior to first repayment, the repayment obligations would reduce to $1.56 million on 15 September and $1.77 million on 15 October, then quarterly repayment obligations from this date until maturity. As discussed in the overview section, the Company has, after balance date, issued the lender with conversion notices to convert the outstanding balances of Facilities A and B into shares at set prices. At the date of this report, the Company remains in a court-ordered standstill with its secured lender. As a result of the court-ordered standstill, all debt repayments due on 15 September were frozen until the outcome of the court hearing on 14 October 2015 is known.
3. Material business risks Aurelia Metals prepares its business plan using estimates of production and financial performance based on a range of assumptions and forecasts. There is uncertainty in these assumptions and forecasts, and risk that variation from them could result in actual performance being different to expected outcomes. The uncertainties arise from a range of factors, including the nature of the mining industry and general economic factors. The material business risks faced by the Group that may have an impact on the operating and financial prospects of the Group as at 30 June 2015 are: Financial solvency The Company has significant short and long term financial obligations. Maintaining sufficient liquidity to operate the business is impacted by the operational and financial risk factors identified below. Additional risk factor relate to the Company’s ability to reorganise its debts when required to manage any foreseen or unforeseen liquidity events. The Company currently has a single source of income from one operating asset. The lack of asset diversity, together with significant debt amounts, can exacerbate overall risk to the Company.
F
or p
erso
nal u
se o
nly
AURELIA METALS LIMITED – ANNUAL REPORT 2015 22
The Company is in dispute with its major lender (as detailed in the overview section), who has lodged a default notice and declared all amounts owing are immediately due and payable. The Company has rejected this notice and as the date of this report is currently in a court ordered standstill with its secured lender. Under the standstill, the Company cannot exercise its rights to convert debt into equity (under the terms of the Convertible Notes Deed Poll), repayment obligations are suspended, and the secured lender is restrained from exercising its rights to enforce its security by appointing a voluntary administrator. The court hearing date is set for 14 October 2015. An outcome of the court hearing could be that the appointment of the voluntary administrator by the secured lender is valid. In this case, the Company may immediately enter voluntary administration, with management control of the Company passing to the Voluntary Administrator. A favourable ruling could enable the Company to significantly reduce its debt through converting the majority of its debt to equity. If completed, the debt to equity conversion will significantly increase Glencore’s equity ownership and potential control of the Company. Fluctuations in the commodity price The Group’s revenues are exposed to fluctuations in the price of gold, silver, lead and zinc. Volatility in metal prices creates revenue uncertainty and requires careful management of business performance to ensure that operating cash margins are maintained despite volatile metal prices. Metal prices are denominated in US dollars, hence the Company has a foreign exchange price risk when the US$ price of a particular commodity is translated back to Australian dollars. Declining metal prices can also impact operations by requiring a reassessment of the feasibility of a particular exploration or development project. Even if a project is ultimately determined to be economically viable, the need to conduct such a reassessment could cause substantial delays and/or may interrupt operations, which may have a material adverse effect on our results of operations and financial condition. Mineral reserves and resources Company ore reserves and mineral resources are estimates, and no assurance can be given that the estimated reserves and resources are accurate or that the indicated level of metal or other mineral will be produced. Such estimates are, in large part, based on interpretations of geological data obtained from drill holes and other sampling techniques. Actual mineralisation or geological conditions may be different from those predicted. No assurance can be given that any part or all of Company’s mineral resources constitute or will be converted into reserves. Market price fluctuations of metal prices as well as increased production and capital costs may render the Company’s ore reserves unprofitable to develop for periods of time or may render mineral reserves containing relatively lower grade mineralisation uneconomic. Estimated reserves may have to be recalculated based on actual production experience. Any of these factors may require the Company to modify its mineral reserves and resources, which could have a negative, or positive impact on the Company’s financial results. Replacement of depleted reserves The Company must continually replace reserves depleted by production to maintain production levels over the long term. Reserves can be replaced by expanding known ore bodies, locating new deposits or making acquisitions. Exploration is highly speculative in nature. The Company’s exploration projects involve many risks and are frequently unsuccessful. Once a site with mineralisation is discovered, it may take several years from the initial phases of drilling until production is possible. As a result, there is no assurance that current or future exploration programs will be successful. There is a risk that depletion of reserves will not be offset by discoveries or acquisitions or that divestitures of assets will lead to a lower reserve base. The mineral base of the Company may decline if reserves are mined without adequate replacement and the Company may not be able to sustain production beyond the current mine lives, based on current production rates.
F
or p
erso
nal u
se o
nly
AURELIA METALS LIMITED – ANNUAL REPORT 2015 23
Mining risks and insurance risks The mining industry is subject to significant risks and hazards, including environmental hazards, industrial accidents, unusual or unexpected geological conditions, unavailability of materials and equipment, rock failures, cave-ins, and weather conditions (including flooding and bushfires), most of which are beyond the Company’s control. These risks and hazards could result in significant costs or delays that could have a material adverse effect on the Company’s financial performance, liquidity and results of operation. The Company maintains insurance to cover some of these risks and hazards. The insurance is maintained in amounts that are believed to be reasonable depending on the circumstances surrounding each identified risk. However property, liability and other insurance may not provide sufficient coverage for losses related to these or other risks or hazards. Production and cost estimates The Company, from time to time, prepares estimates of future production, cash costs and capital costs of production. No assurance can be given that such estimates will be achieved. Failure to achieve production or cost estimates or material increases in costs could have an adverse impact on the Company’s future cash flows, profitability, results of operations and financial condition. The Company’s actual production and costs may vary from estimates for a variety of reasons, including: actual ore mined varying from estimates of grade, tonnage, dilution and metallurgical and other characteristics; short-term operating factors relating to the ore reserves, such as the need for sequential development of ore bodies and the processing of new or different ore grades; revisions to mine plans; risks and hazards associated with mining; natural phenomena, such as inclement weather conditions, water availability, and floods; and unexpected labour shortages or strikes. Costs of production may also be affected by a variety of factors, including: ore grade metallurgy, labour costs, consumable costs, the cost of commodities, general inflationary pressures and currency exchange rates. Environmental, health and safety regulations; permits The Company’s mining and processing operations and exploration activities are subject to extensive laws and regulations governing the protection of the environment, waste disposal, worker safety, mine development and protection of endangered and other special status species. The Company’s ability to obtain permits and approvals and to successfully operate may be adversely impacted by real or perceived detrimental events associated with the Company’s activities or those of other mining companies affecting the environment, human health and safety or the surrounding communities. Delays in obtaining or failure to obtain government permits and approvals may adversely affect the Company’s operations, including its ability to continue operations. While the Company has implemented health, safety and community initiatives at its operations to ensure the health and safety of its employees, contractors and members of the community affected by its operations, there is no guarantee that such measures will eliminate the occurrence of accidents or other incidents which may result in personal injuries or damage to property, and in certain instances such occurrences could give rise to regulatory fines and/or civil liability. Community Relations The Company operates near established communities. The Company recognises that a failure to appropriately manage local community stakeholder expectations may lead to dissatisfactions which has the potential to disrupt production and exploration activities.
SIGNIFICANT CHANGES IN THE STATE OF AFFAIRS
Significant changes in the state of affairs of the Company during the financial year follows in chronological order as announced on:
• 24 July 2014, discovery of a new massive sulphide lens at Hera North.
F
or p
erso
nal u
se o
nly
AURELIA METALS LIMITED – ANNUAL REPORT 2015 24
• 5 August 2014, commission started at Hera process plant • 1 September 2014, first base metal concentrate produced at Hera • 15 September 2014, first gold pour at Hera. • 22 September 2014, agreement to issue shares to the value of $2 million (5,590,027 Ordinary Fully Paid
shares at an average price of 35.78 cents per share) to Pybar Mining Services as part payment for mining services rendered. It also announced that Pacific Road Capital subscribed for $3.2 million of new equity, according to a share subscription agreement, on the following terms: 2,778,050 shares at $0.2434 to raise $676,177 and 7,126,950 shares at $0.3578 to raise $2,552,032.
• 12 November 2014, retirement of Director Guoquing Zhang. • 27 November 2014, formal Hera mine opening and the first concentrate shipment made. • 16 December 2014, announced fully underwritten, non-renounceable rights issue pursuant to which eligible
shareholders were entitled to subscribe for 1 new share for every 8 shares held at $0.234 per share to raise approximately $10.0 million.
• 3 February 2015, as a result of the underwriting agreement relating to the rights issue announced on 16 December 2014, Pacific Road’s interest in the Company increased from 20% to 24.2%.
• 6 March 2015, reported half year loss to 31 December 2014 of $5,487,317. • 14 April 2015, effective date of commercial production at Hera declared as 1 April 2015. • 21 April 2015, updated Hera resource to 3.2 Mt at 3.75 g/t Au, 33.4 g/t Ag, 3.5% Pb and 4.6% Zn. • 4 June 2015, Pybar become a substantial shareholder with a 5.01% ownership interest. • 29 June 2015, resignation of Director Mike Menzies. • 30 June 2015, entered a voluntary suspension from official quotation.
. Apart from the above, or as noted elsewhere in this report, no significant changes in the state of affairs of the Company occurred during the financial year.
SIGNIFICANT EVENTS AFTER THE BALANCE DATE
The following significant events occurred after 30 June 2015 as announced by the Company on:
• 1 July 2015, received a notice on 26 June from Glencore Group Funding Limited (‘Glencore’) asserting that an event of default had occurred under its loan facility documentation. The principal event of default asserted by Glencore was an alleged inability on the part of Aurelia and/or the other borrowers within the group to repay the amounts borrowed under the four separate facilities provided by Glencore. Aurelia rejected the notice and engaged in discussions with Glencore.
• 7 July 2015, deposited a conversion notice with Glencore Group Funding Limited (Glencore) in respect of its A$50,000,000 Facility B Converting Notes.
• 7 July 2015, update on Hera Project Performance, the Hera Expansion Study and a financial performance update.
• 7 July 2015, due to a coding error and more conservative estimation parameters in the resource estimate, the estimate previously released on 21 April was revised to 2.5 Mt at 3.48 g/t Au, 37.2 g/t Ag, 3.65% Pb and 4.76% Zn.
• 9 July 2015, received notification from Glencore that it considers the conversion notice of 7 July not to be effective.
• From 23 July 2015 to 7 September 2015: during the period mutual ongoing agreements with Glencore extended the Conversion Date with respect of its A$50,000,000 Facility B Converting Notes from 31 July to 10th September 2015 and that Glencore agreed not to take any action to enforce any right it contends that it had as a consequence of the alleged event of default, before the 9th September 2015.
• 3 August 2015, Rimas Kairaitis resigned as Managing Director and continued as CEO. • 7 September 2015, deposited a conversion notice with Glencore Group Funding Limited (Glencore) in
respect of its A$20,000,000 Facility A Converting Notes. • 9 September 2015, improved Hera production performance with record gold production in July and August
and a Term Sheet for a $6m Working Capital Facility and a $6m Standby Funding Facility executed with Pacific Road Capital Management.
F
or p
erso
nal u
se o
nly

AURELIA METALS LIMITED – ANNUAL REPORT 2015 25
• 16 September 2015, discussions with Glencore on a negotiated re-financing ceased. Without consultation, on Monday 14 September Glencore appointed a voluntary administrator to Aurelia and its subsidiaries on the grounds of alleged insolvency. The Company successfully obtained orders from the Supreme Court of NSW deeming that the appointment of the administrator is not effective (and the administrator has no power over Aurelia and its subsidiaries) until a court hearing on the validity of the appointment can be heard. An injunction has been granted by the court, pending a further hearing on 14 October 2015.
• 28 September 2015, $6m Working Capital Facility and a $6m convertible subordinated loan facility formally executed with Pacific Road together with entitlement to underwrite up to $25 million in new equity. Pybar agreed to adjusted payment terms for outstanding amounts owed to 31 January 2016.
FUTURE DEVELOPMENTS
Other likely developments in the operations of the Company and the expected results of those operations in future financial years have not been included in this report as the inclusion of such information is likely to result in unreasonable prejudice to the Company. Accordingly, this information has not been disclosed in this report.
ENVIRONMENTAL REGULATIONS
The Company is subject to significant environmental regulation in respect to its exploration, mining and processing activities. The Company aims to ensure the appropriate standard of environmental care is achieved, and in doing so, that it is aware of and is in compliance with all environmental legislation. The Directors of the Company are not aware of any breach of environmental legislation for the year under review.
F
or p
erso
nal u
se o
nly
AURELIA METALS LIMITED – ANNUAL REPORT 2015 26
SHARE OPTIONS
Unissued shares under option
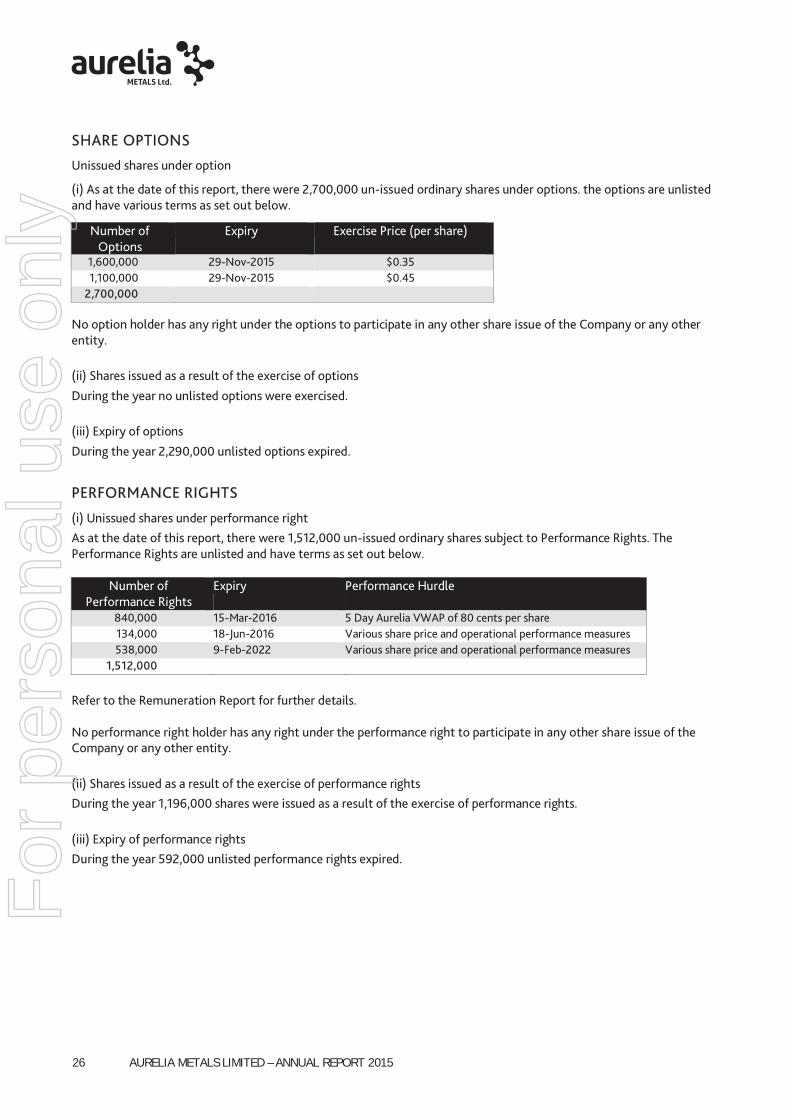
(i) As at the date of this report, there were 2,700,000 un-issued ordinary shares under options. the options are unlisted and have various terms as set out below.
No option holder has any right under the options to participate in any other share issue of the Company or any other entity. (ii) Shares issued as a result of the exercise of options
During the year no unlisted options were exercised. (iii) Expiry of options
During the year 2,290,000 unlisted options expired.
PERFORMANCE RIGHTS
(i) Unissued shares under performance right As at the date of this report, there were 1,512,000 un-issued ordinary shares subject to Performance Rights. The Performance Rights are unlisted and have terms as set out below.
Number of Performance Rights
Expiry Performance Hurdle
840,000 15-Mar-2016 5 Day Aurelia VWAP of 80 cents per share 134,000 18-Jun-2016 Various share price and operational performance measures 538,000 9-Feb-2022 Various share price and operational performance measures
1,512,000
Refer to the Remuneration Report for further details. No performance right holder has any right under the performance right to participate in any other share issue of the Company or any other entity. (ii) Shares issued as a result of the exercise of performance rights During the year 1,196,000 shares were issued as a result of the exercise of performance rights. (iii) Expiry of performance rights During the year 592,000 unlisted performance rights expired.
Number of Options
Expiry Exercise Price (per share)
1,600,000 29-Nov-2015 $0.35 1,100,000 29-Nov-2015 $0.45
2,700,000
F
or p
erso
nal u
se o
nly

AURELIA METALS LIMITED – ANNUAL REPORT 2015 27
MEETINGS OF DIRECTORS
During the financial year, the number of meetings of Directors attended by each director and the number of meetings held was as follows:
Board Meetings
Committee Meetings
Board Audit Finance Nomination Remuneration Operations
(i) (ii) (i) (ii) (i) (ii) (i) (ii) (i) (ii) (i) (ii)
Anthony Wehby 13 13 2 2 7 7 1 1 2 2 - -
Gary Comb 11 13 - - 7 7 1 1 - - 3 3
Paul Espie 9 11 - - 5 6 1 1 - - - -
Mark Milazzo 12 13 2 2 - - - - 2 2 3 3
Rimas Kairaitis 13 13 - - 7 7 - - - - 3 3
Michael Menzies 12 12 2 2 - - - - 2 2 3 3
Guoqing Zhang 3 3 - - - - - - - - - -
Yong Chen - - - - - - - - - - - -
Susan Corlett 1 - - - - - - - - - - -
Richard Willson - - - - - - - - - - - - (i) Attended - Number of Board/Board Committee Meetings attended (ii) Eligible - Number of Board/Board Committee Meetings held which were eligible to be attended Current members of various Board Committees at 30 June 2015 Board Committee Members of each committee Audit Committee Mark Milazzo, Anthony Wehby
Finance Committee Gary Comb, Paul Espie, Rimas Kairaitis, Anthony Wehby
Remuneration Committee Mark Milazzo, Anthony Wehby
Nomination Committee Gary Comb, Paul Espie, Anthony Wehby
Operations Committee Gary Comb, Rimas Kairaitis, Mark Milazzo
EMPLOYEES
The Company had 57 employees at 30 June 2015 (2014: 27 employees) with 14 (25%) being female (2014: 12 female (44%)). None of the senior executives is female. The Company’s Board has 1 female alternate director.
INDEMNIFICATION AND INSURANCE OF DIRECTORS AND OFFICERS
During the financial year the Company paid a premium in respect of a contract insuring the Directors of the Company, the company secretaries and all executive officers of the Company and of any related body corporate against a liability incurred as such a Director, secretary or executive officer to the extent permitted by the Corporations Act 2001. The contract of insurance prohibits disclosure of the nature of the liability and the amount of the premium.
INDEMNIFICATION OF AUDITOR
To the extent permitted by law, the Company has agreed to indemnify its auditor, Ernst & Young, as part of the terms of its audit engagement agreement against claims by third parties arising from the audit (for an unspecified amount). No payment has been made to indemnify Ernst & Young during or since the financial year.
F
or p
erso
nal u
se o
nly

AURELIA METALS LIMITED – ANNUAL REPORT 2015 28
REMUNERATION REPORT (AUDITED) This remuneration report outlines the director and executive remuneration arrangements of the Company and the Group in accordance with the requirements of the Corporations Act 2001 and its Regulations. For the purposes of this report, key management personnel (KMP) of the Group are defined as those persons having authority and responsibility for planning, directing and controlling the major activities of the Company and the Group, directly or indirectly, including any Director (whether executive or otherwise) of the Company, and includes key management personnel.
Remuneration policy and committee
As part of its Corporate Governance Policies and Procedures, the Board has adopted a formal Remuneration Committee Charter and has established a Remuneration Committee. The Remuneration Committee is responsible for determining and reviewing compensation arrangements for the directors and executives. The committee assesses the appropriateness of the nature and amount of emoluments of such officers on a periodic basis by reference to relevant employment market conditions with the overall objective of ensuring maximum stakeholder benefit from the retention of a high quality board and executive team. At the committee’s discretion the nature and amount of executive and director’s emoluments may be linked to the Company’s financial and operational performance. Details of Directors and Key Management Personnel
Directors Position Appointed Resigned
Anthony Wehby Independent Non-Executive Director Independent Non-Executive Chairman
14-Sep-2006 13-Dec-2011
- -
Gary Comb Independent Non-Executive Director 4-Jul-2012 -
Paul Espie Non-Executive Director 10-Dec-2013 -
Mark Milazzo Independent Non-Executive Director 6-Aug-2012 -
Rimas Kairaitis Managing Director 12-Jun-2008* 2-Aug-2015
Michael Menzies Non-Executive Director 26-Mar-2013 26-Jun-15
Guoqing Zhang Non-Executive Director Alternate Director
13-Mar-2014 24-Nov-2011
11-Nov-2014 13-Mar-2014
Yong Chen Alternate Director 4-Jun-2014 5-Dec-2011
11-Nov-2014 6-Nov-2013
Susan Corlett Alternate Director 17-Jul-2014 30-Jan-2014
17-Jul-2014 30-Jan-2014
Richard Willson Alternate Director 4-Jul-2012 22-Sep-2012 20-Nov-2012
4-Jul-2012 22-Oct-2012 22-Jan-2015
Executives
Rimas Kairaitis Chief Executive Officer 24-Mar-2004 -
Timothy Churcher Chief Financial Officer 29-Sep-2014 -
Dean Fredericksen Chief Operating Officer 1-Mar-2011 12-Jun-2015
Sean Pearce General Manager – Hera Project 1-Mar-2011 21-Apr-2015
Richard Willson Company Secretary 5-Feb-2010 -
* Rimas Kairaitis was a Director from 24 March 2004 to 27 March 2007.
F
or p
erso
nal u
se o
nly

AURELIA METALS LIMITED – ANNUAL REPORT 2015 29
Remuneration of Directors and Key Management Personnel
Short term
Post employment
Share based payment Remuneration
consisting of options/
performance rights
Directors
Fees Salary and
Fees Non-
Monetary Other Superannuation
Options/ Perform-
ance Rights Total
$ $ $ $ $ $ %
2015 - Directors
Anthony Wehby 75,000 - - - 7,125 9,563 91,688 10%
Rimas Kairaitis - 322,329 34,733 - 28,541 9,563 395,166 2%
Gary Comb 50,000 - - - 4,750 7,969 62,719 13%
Paul Espie 50,000 - - - - 50,000 -
Mike Menzies 49,450 - - - - 49,450 -
Mark Milazzo 50,000 - - - 4,750 7,969 62,719 13%
Guoqing Zhang 18,390 - - - 1,747 20,137 -
2015 - Executives
Timothy Churcher(iv) - 205,474 5,957 19,520 230,951 -
Richard Willson 206,521 - 68,188(i) 26,097 27,320 328,126 8%
Dean Fredericksen - 280,299 19,595 147,597(ii) 26,629 48,533 522,653 9%
Sean Pearce - 233,465 12,858 155,643(ii) 22,179 44,533 468,678 10%
Total 2015 292,840 1,248,088 73,143 371,428 141,338 155,450 2,282,287 7%
2014 – Directors
Anthony Wehby 60,000 - - - 5,550 45,700 111,250 41%
Rimas Kairaitis - 308,174 28,027 - 25,204 45,700 407,105 11%
Gary Comb 50,000 7,500 - - 5,319 38,083 100,902 38%
Paul Espie 27,842 - - - - - 27,842 -
Mike Menzies 50,000 - - - - - 50,000 -
Mark Milazzo 50,000 - - - 4,625 38,083 92,708 41%
Guoqing Zhang 15,102 - - - 1,397 - 16,499 -
Robin Chambers 34,863 - - - 3,224 7,802 45,889 33%
Wenxiang Gao 38,087 - - - - 7,802 45,889 33%
Christine Ng 19,162 - - - - (37,698)(iii) (18,536) -
2014 – Executives
Dean Fredericksen - 297,577 20,238 - 24,923 23,473 366,211 6%
Sean Pearce - 301,044 32,471 - 26,039 19,473 379,027 5%
Richard Willson - 237,739 - - 18,760 - 256,499 - Total 2014 345,056 1,152,034 80,736 - 115,041 188,418 1,881,285 10%
(i) Compensation for reduction in duties from full-time to part-time on 1 March 2015 (ii) Employment termination payments relating to 30 June 2015, paid in July 2015 (iii) Reversal of prior year share based income, due to vesting conditions not being met (iv) Commenced employment on 29 September 2014
F
or p
erso
nal u
se o
nly
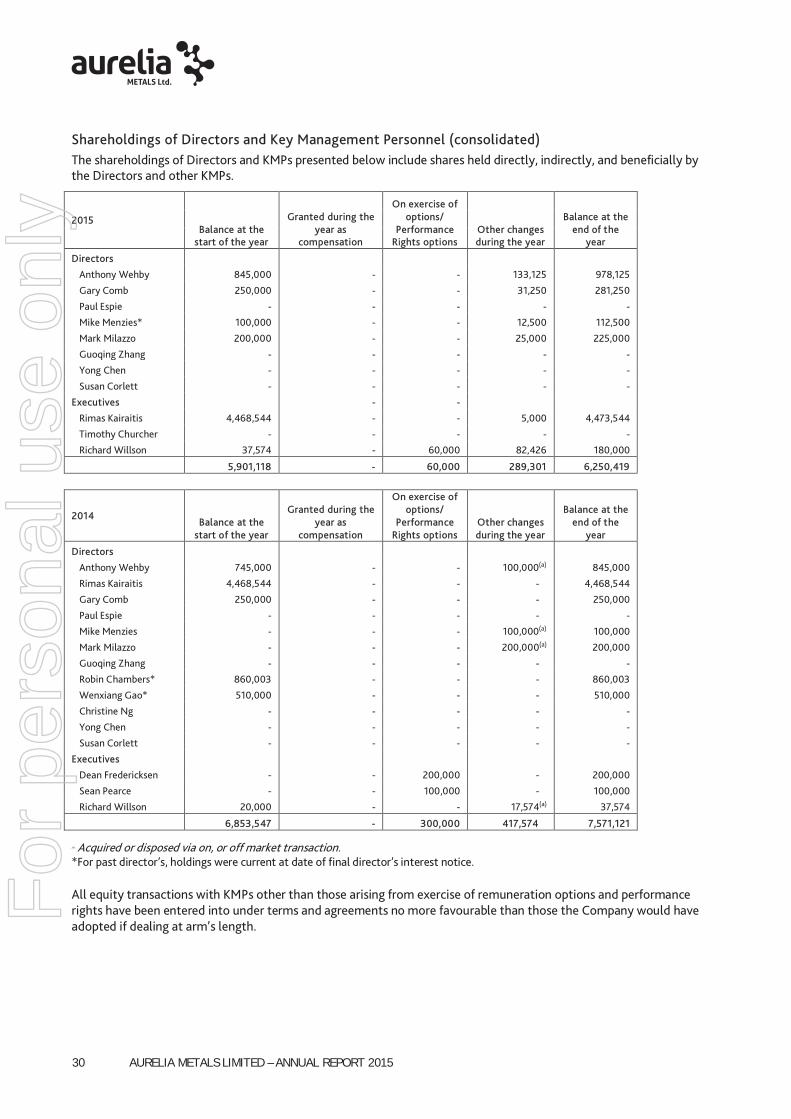
AURELIA METALS LIMITED – ANNUAL REPORT 2015 30
Shareholdings of Directors and Key Management Personnel (consolidated) The shareholdings of Directors and KMPs presented below include shares held directly, indirectly, and beneficially by the Directors and other KMPs.
(a) Acquired or disposed via on, or off market transaction. *For past director’s, holdings were current at date of final director’s interest notice. All equity transactions with KMPs other than those arising from exercise of remuneration options and performance rights have been entered into under terms and agreements no more favourable than those the Company would have adopted if dealing at arm’s length.
2015 Balance at the
start of the year
Granted during the year as
compensation
On exercise of options/
Performance Rights options
Other changes during the year
Balance at the end of the
year
Directors
Anthony Wehby 845,000 - - 133,125 978,125
Gary Comb 250,000 - - 31,250 281,250
Paul Espie - - - - -
Mike Menzies* 100,000 - - 12,500 112,500
Mark Milazzo 200,000 - - 25,000 225,000
Guoqing Zhang - - - - -
Yong Chen - - - - -
Susan Corlett - - - - -
Executives - -
Rimas Kairaitis 4,468,544 - - 5,000 4,473,544
Timothy Churcher - - - - -
Richard Willson 37,574 - 60,000 82,426 180,000
5,901,118 - 60,000 289,301 6,250,419
2014 Balance at the
start of the year
Granted during the year as
compensation
On exercise of options/
Performance Rights options
Other changes during the year
Balance at the end of the
year
Directors
Anthony Wehby 745,000 - - 100,000(a) 845,000
Rimas Kairaitis 4,468,544 - - -(a) 4,468,544
Gary Comb 250,000 - - -(a) 250,000
Paul Espie - - - -(a) -
Mike Menzies - - - 100,000(a) 100,000
Mark Milazzo - - - 200,000(a) 200,000
Guoqing Zhang - - - -(a) -
Robin Chambers* 860,003 - - -(a) 860,003
Wenxiang Gao* 510,000 - - -(a) 510,000
Christine Ng - - - -(a) -
Yong Chen - - - -(a) -
Susan Corlett - - - -(a) -
Executives
Dean Fredericksen - - 200,000 -(a) 200,000
Sean Pearce - - 100,000 -(a) 100,000
Richard Willson 20,000 - - 17,574(a) 37,574
6,853,547 - 300,000 417,574(a) 7,571,121
F
or p
erso
nal u
se o
nly

AURELIA METALS LIMITED – ANNUAL REPORT 2015 31
Option holdings of Directors and Key Management Personnel (consolidated) The numbers of options over ordinary shares in the Company held during the financial year by each director, executive and key management personnel of Aurelia Metals Limited and specified executive of the Group, including their personally related parties, are set out below.
2015 Balance at the start of the year
Granted during the year as
compensation
Exercised during the
year Other changes during the year
Balance at the end of the year
Directors
Anthony Wehby 600,000 - - - 600,000
Gary Comb 500,000 - - - 500,000
Paul Espie - - - - -
Mike Menzies - - - - -
Mark Milazzo 500,000 - - - 500,000
Guoqing Zhang - - - - -
Yong Chen - - - - -
Susan Corlett - - - - -
Executives
Rimas Kairaitis 600,000 - - - 600,000
Timothy Churcher - - - - -
Dean Fredericksen 340,000 - - (340,000)(b) -
Sean Pearce 500,000 - - (500,000)(b) -
Richard Willson 100,000 - - (100,000)(b) -
3,140,000 - - (940,000) 2,200,000
2014 Balance at the start of the year
Granted during the year as
compensation
Exercised during the
year Other changes during the year
Balance at the end of the year
Directors
Anthony Wehby 600,000 - - -)(a) 600,000
Rimas Kairaitis 600,000 - - -)(a) 600,000
Gary Comb 500,000 - - -)(a) 500,000
Paul Espie - - - -)(a) -
Mike Menzies - - - -)(a) -
Mark Milazzo 500,000 - - -)(a) 500,000
Guoqing Zhang - - - -)(a) -
Robin Chambers 500,000 - - (250,000)(a) 250,000
Wenxiang Gao 500,000 - - (250,000)(a) 250,000
Christine Ng 500,000 - - (500,000)(a) -
Yong Chen - - - -)(a) -
Susan Corlett - - - -)(a) -
Executives Dean Fredericksen 340,000 - - -)(a) 340,000
Sean Pearce 500,000 - - -)(a) 500,000
Richard Willson 100,000 - - -)(a) 100,000
4,640,000 - - (1,000,000)(a) 3,640,000 (a) Lapsed due to vesting conditions not being met (b) Expired during the year
F
or p
erso
nal u
se o
nly

AURELIA METALS LIMITED – ANNUAL REPORT 2015 32
Performance right holdings of Directors and Key Management Personnel (consolidated) The numbers of performance rights held during the financial year by each director, executive and key management personnel of Aurelia Metals Limited and specified executive of the Group, including their personally related parties, are set out below.
2015 Balance at the start of the year
Granted during the year as
compensation
Exercised during the
year Other changes during the year
Balance at the end of the year
Executives
Rimas Kairaitis 250,000 - - - 250,000
Timothy Churcher
- - - -
Dean Fredericksen 160,000 250,000 (120,000) (290,000) -
Sean Pearce 195,000 220,000 (120,000) (295,000) -
Richard Willson 50,000 150,000 (60,000) (40,000) 100,000
655,000 620,000 (300,000) (625,000) 350,000
2014 Balance at the start of the year
Granted during the year as
compensation Exercised
during the year Other changes during the year
Balance at the end of the year
Directors
Rimas Kairaitis 250,000 - -) -) 250,000
Executives Dean Fredericksen 410,000 - (200,000) (50,000)(a) 160,000
Sean Pearce 320,000 - (100,000) (25,000)(a) 195,000
Richard Willson 50,000 - -) -)(a) 50,000
1,030,000 - (300,000) (75,000)(1) 655,000 (a) Expired during the year
Compensation options and performance rights: granted and vested during the year (consolidated) On 9 February 2015, 620,000 Performance Rights with various share price and operational performance hurdles were issued to KMPs. During the year, 300,000 Performance Rights previously issued to KMPs vested and were exercised. A further 625,000 Performance Rights previously issued to KMPs expired. No other options or performance rights were granted or vested in relation to KMPs during the financial year ended 30 June 2015.
Directors and Executives A summary of the key terms of remuneration agreements with directors and executives are outlined below: Executive Directors and Executives
The Chief Executive Officer, Rimas Kairaitis, is employed under an executive employment agreement. The agreement may be terminated by Mr Kairaitis at any time by giving three months’ notice in writing, or such shorter period of notice as may be agreed. The Company may terminate the agreement by the Board giving three months written notice and making a payment equivalent to nine months remuneration or by paying an amount equivalent to twelve months remuneration or by giving one months’ notice for gross misconduct or a serious persistent beach of the employment agreement or without notice in case of Mr Kairaitis being convicted of a major criminal offence which brings the Company into lasting disrepute, at which time Mr Kairaitis would be entitled to that portion of remuneration arising up to the date of termination. Mr Kairaitis’ annual salary is $358,886 inclusive of superannuation for services as Chief Executive Officer. Mr Kairaitis is entitled to the private use of a company motor vehicle.
F
or p
erso
nal u
se o
nly
AURELIA METALS LIMITED – ANNUAL REPORT 2015 33
The Chief Financial Officer, Timothy Churcher, is employed under an executive employment agreement. The agreement may be terminated by Mr Churcher at any time by giving three months’ notice in writing, or such shorter period of notice as may be agreed. The Company may terminate the agreement by the Board giving three months written notice and making a payment equivalent to nine months remuneration or by paying an amount equivalent to twelve months remuneration or by giving one months’ notice for gross misconduct or a serious persistent beach of the employment agreement or without notice in case of Mr Churcher being convicted of a major criminal offence which brings the Company into lasting disrepute, at which time Mr Churcher would be entitled to that portion of remuneration arising up to the date of termination. Mr Churcher’s annual salary is $339,450 inclusive of superannuation for services as Chief Financial Officer. Mr Churcher is entitled to the private use of a company motor vehicle. The Company Secretary, Richard Willson, is employed under an executive employment agreement. The agreement may be terminated by Mr Willson at any time by giving three months’ notice in writing, or such shorter period of notice as may be agreed. The Company may terminate the agreement by giving three months written notice and making a payment equivalent to nine months remuneration or by paying an amount equivalent to twelve months remuneration or by giving one months’ notice for gross misconduct or a serious persistent beach of the employment agreement or without notice in case of Mr Willson being convicted of a major criminal offence which brings the Company into lasting disrepute, at which time Mr Willson would be entitled to that portion of remuneration arising up to the date of termination. Mr Willson’s annual salary is $164,250 inclusive of superannuation for services as Company Secretary. No performance conditions are currently stipulated in any of the executive agreements. Non-Executive Directors
The constitution and the ASX listing rules specify that the aggregate remuneration of Non-Executive Directors shall be determined from time to time by a general meeting. The latest determination was an aggregate annual remuneration excluding consulting fees of $600,000. Directors’ fees are as follows:
• Chairman $90,000 annual fee plus superannuation or equivalent • Directors $50,000 annual fee plus superannuation or equivalent
AUDITOR’S INDEPENDENCE AND NON-AUDIT SERVICES During the year the Company’s auditor did not provide any non-audit services. The Company has obtained an independence declaration from its auditor, Ernst and Young, which forms part of this report. A copy of that declaration is included at page 79 of this report. Signed on behalf of the Board in accordance with a resolution of the Directors. Mr Anthony Wehby Non-Executive Chairman 30 September 2015
F
or p
erso
nal u
se o
nly

AURELIA METALS LIMITED – ANNUAL REPORT 2015 34
FINANCIAL STATEMENTS
STATEMENT OF COMPREHENSIVE INCOME for the year ended 30 June 2015 Consolidated
Note 2015 2014 $ $
Operating sales revenue 3(a) 13,220,208) -) Cost of sales 3(b) (26,444,951) -) Gross profit (13,224,743) -) Corporate administration expenses 3(c) (4,357,210) (3,589,420) Exploration and evaluation costs written off 9 (3,347,093) (788,291) Impairment of exploration and evaluation assets 9 (17,884,374) -) Impairment of mine properties 10 (75,031,403) -) Other income/(expenses) 3(d) 24,667) 85,286) Loss on commodity derivatives (1,674,599) (6,318,966) Loss on revaluation of investments (287,231) (272,800) Loss before interest and income tax (115,781,986) (10,884,191) Finance income 279,680) 260,750) Finance costs 3(e) (2,656,142) -) Loss before income tax (118,158,448) (10,623,441) Income tax expense 4 -) -) Loss after income tax 16 (118,158,448) (10,623,441) Other comprehensive income -) -) Total comprehensive profit/(loss) for the period (118,158,448) (10,623,441)
Earnings per share for loss attributable to the ordinary equity holders of the parent Basic profit/(loss) per share (cents per share) 20 (33.01) (3.54) Diluted profit/(loss) per share (cents per share) 20
(33.01) (3.54)
The above Statement of Comprehensive Income should be read in conjunction with the accompanying notes.
F
or p
erso
nal u
se o
nly

AURELIA METALS LIMITED – ANNUAL REPORT 2015 35
STATEMENT OF FINANCIAL POSITION as at 30 June 2015 Consolidated Note 2015 2014
$ $ ASSETS Current assets Cash and cash equivalents )) 17(b) 4,847,638) 21,590,959) Trade and other receivables 5 6,184,999) 915,788) Inventories 6 2,692,563) 2,437,235) Prepayments 145,234) 117,253) Total current assets 13,870,434) 25,061,235) Non-current assets Property, plant and equipment 7 57,459,043) 939,283) Financial assets 8 272,800) 3,940,884) Exploration and evaluation 9 116,000) 19,228,531) Mine properties 10 33,306,747) 143,408,631) Total non-current assets 91,154,590) 167,517,329) Total assets 105,025,024) 192,578,564)
LIABILITIES Current liabilities Trade and other payables 11 16,394,713) 8,739,703) Provisions 12 1,885,698) 1,344,163) Borrowings 13 22,737,009) 397,653) Total current liabilities 41,017,420) 10,481,519) Non-current liabilities Provisions 12 7,856,432) 8,248,049) Borrowings 13 91,914,752) 106,185,245) Total non-current liabilities 99,771,184) 114,433,294) Total liabilities 140,788,604) 124,914,813) Net assets (35,763,580) 67,663,751) EQUITY Contributed equity 14 99,929,152) 85,361,160) Reserves 15 3,060,597) 2,897,472) Retained losses 16 (138,753,329) (20,594,881) Total equity (35,763,580) 67,663,751)
The above Statement of Financial Position should be read in conjunction with the accompanying notes.
F
or p
erso
nal u
se o
nly

AURELIA METALS LIMITED – ANNUAL REPORT 2015 36
STATEMENT OF CHANGES IN EQUITY for the year ended 30 June 2015
Consolidated Note
Issued Share Capital
Share Based Payments Reserve
Accumulated Losses Total
$ $ $ $ Balance as at 1 July 2013 70,180,671) 2,396,118) (9,971,440) 62,605,349) Total comprehensive profit loss for the period
-) -) (10,623,441) (10,623,441)
Transactions with owners in their capacity as owners
Shares issued for the period 15,983,823) -) -) 15,983,823) Costs of share issue (803,334) -) -) (803,334) Share based payments -) 501,354) -) 501,354)
Balance as at 30 June 2014
85,361,160) 2,897,472) (20,594,881) 67,663,751) Balance as at 1 July 2014 85,361,160) 2,897,472) (20,594,881) 67,663,751) Total comprehensive loss for the period
-) -) (118,158,448) (118,158,448)
Transactions with owners in their capacity as owners
Shares issued for the period 15,282,736) -) -) 15,282,736) Costs of share issue (714,744) -) -) (714,744) Share based payments -) 163,125) -) 163,125)
Balance as at 30 June 2015 14,15 99,929,152) 3,060,597) (138,753,329) (35,763,580)
The above Statement of Changes in Equity should be read in conjunction with the accompanying notes.
F
or p
erso
nal u
se o
nly

AURELIA METALS LIMITED – ANNUAL REPORT 2015 37
CASH FLOW STATEMENT for the year ended 30 June 2015 Consolidated Note 2015 2014
$ $
Cash flows from operating activities Receipts from customers (1)
8,206,624) - ) Payments to suppliers and employees
(15,904,256) (2,839,053)
Research & development refund 85,286) 547,384) Interest received
355,474) 627,283)
Receipt from Close out of Hedge
388,289) -) GST on purchases refunded from ATO 3,859,403) 8,065,066) Net cash flows from operating activities
17 (a) (3,009,180)) 6,400,680)
Cash flows from investing activities
Purchase of property, plant and equipment
(657,832) (10,761)
Sale of property, plant and equipment 30,531) -) Exploration & evaluation expenditure
(2,450,229) (3,574,349)
Development expenditure (43,128,286) (82,975,871) Receipts from pre-production sales(1) 19,595,301) -) Receipts from sale of gold put options 8 (b) 1,119,905) -) Deferred acquisition (Hera royalty) (211,537) -) Net cash flows from investing activities
(25,702,147) (86,560,981)
Cash flows from financing activities
Proceeds from issue of shares
13,282,736) 14,390,331)
Borrowings -) 72,138,564) Loan repayments (397,653) (34,384) Interest on borrowings (150,333) (12,906) Share issue costs (726,744) (803,334) Facility establishment costs
(40,000) (240,000)
Net cash flows from financing activities
11,968,006) 85,438,271)
Net increase in cash and cash equivalents
(16,743,321) 5,277,970) Cash and cash equivalents at beginning of year
21,590,959) 16,312,989)
Cash and cash equivalents at end of year
17 (b) 4,847,638) 21,590,959) (1) Total receipts from customers for the year ended 30 June 2015 pre and post the declaration of commercial production on 1 April 2015 was $27,801,925.
The above Cash Flow Statement should be read in conjunction with the accompanying notes.
F
or p
erso
nal u
se o
nly

AURELIA METALS LIMITED – ANNUAL REPORT 2015 38
NOTES TO FINANCIAL STATEMENTS 1. CORPORATE INFORMATION
The financial report of Aurelia Metals Limited and its subsidiaries for the year ended 30 June 2015 was authorised for issue in accordance with a resolution of the Directors on 30 September 2015. Aurelia Metals Limited is a company limited by shares incorporated in Australia whose shares are publicly traded on the Australian Stock Exchange. The Company is a for-profit entity. Aurelia Metals has four 100% owned subsidiaries, Stannum Pty Ltd (incorporated 15 September 2007), Defiance Resources Pty Ltd (incorporated 15 May 2007), Hera Resources Pty Ltd (incorporated 20 August 2009) and Nymagee Resources Pty Ltd (incorporated 7 November 2011). The current nature of the operations and principal activities of the Group are gold, lead and zinc production and mineral exploration.
2A. SUMMARY OF SIGNIFICANT ACCOUNTING
The significant accounting policies that have been adopted by Aurelia Metals Limited are as follows: (a) Basis of preparation
The financial report is a general-purpose financial report which has been prepared in accordance with the requirements of the Corporations Act 2001, the Australian Accounting Standards and other authoritative pronouncements of the Australian Accounting Standards Board. The financial report has been prepared on a historical cost basis, except deferred acquisition costs which are measured at fair value. The financial report is presented in Australian dollars, which is the functional currency of the Company. (i) Going concern The financial report has been prepared on the going concern basis which contemplates the continuity of normal business activities and the realisation of assets and the settlement of liabilities in the ordinary course of business. For the full year ended 30 June 2015, the Group reported a net loss of $118.158 million (2014: $10.623 million) and net operating cash outflows of $3.009 million (2014: inflows of $6.401 million). At 30 June 2015, the Group is in a net current liability position of $27.147 million and net liability position of $35.764 million. The net liability position reflects the outstanding loan arrangements with the Company’s main financiers. The Company anticipated the conversion of a significant amount of this balance into equity, under the terms of the facility agreements. The Company has, after balance date, issued the lender with conversion notices to convert the outstanding balances of Facilities A and B into shares at set prices. As announced to ASX on 1 July 2015, Glencore lodged a notice of default, which if valid, would bar the debt conversion. The notice of default was given on the grounds that the secured lender believed or believes the Company to be insolvent. This has been rejected by the Company. Without the consultation of the Company’s Board, Glencore appointed a voluntary administrator to the Company and certain of its subsidiaries on 14 September 2015. The Company sought and received from the Supreme Court of NSW on the 15 September 2015 a standstill. Under the standstill, the Company cannot exercise its rights to convert debt into equity (under the terms of the Convertible Notes Deed Poll), repayment obligations are suspended, and the secured lender is restrained from exercising its rights to enforce its security by appointing a voluntary administrator. The matter is to be heard by the Supreme Court on 14 October 2015. While the Company rejects the position taken by Glencore, the going concern basis upon which the financial statements have been prepared is reliant on the outcome of the Court case, the Company’s ability to convert the Facilities A and B as intended and an anticipated equity raise subsequent to these matters being resolved. Until this
F
or p
erso
nal u
se o
nly

AURELIA METALS LIMITED – ANNUAL REPORT 2015 39
matter is resolved in the Court and the financing options available to the Company are executed, which include and not limited to refinancing of the borrowings and an equity raising, there is a significant uncertainty whether the Group will continue to operate as a going concern. If the Group is unable to continue as a going concern it may be required to realise its assets and extinguish its liabilities other than in the normal course of business and at amounts different to those stated in the financial statements. No adjustments have been made to the financial report relating to the recoverability and classification of the asset carrying amounts or the classification of liabilities that might be necessary should the Group not continue as a going concern. (ii) Classification of non-current borrowings At balance date, the Company held $114.652 million of borrowings, consisting of $22.737 million of current borrowings and $91.915 million of non-current borrowings. The classification between current and non-current borrowings is based on the Company’s legal position that the notice of default issued by the Company’s secured creditor is invalid. An outcome of the court hearing could be that the appointment of the voluntary administrator by the secured lender is valid. In this case, the classification of current borrowings would increase to reflect all borrowings related to Glencore as due and payable. A favourable ruling is expected to enable the Company to complete the debt to equity conversion and the current classification would therefore remain appropriate. (b) Compliance with IFRS
The Financial Report complies with Australian Accounting Standards as issued by the Australian Accounting Standards Board and International Financial Reporting Standards as issued by the International Accounting Standards Board. (c) New accounting standards and interpretations
Changes in accounting policy and disclosures
The accounting policies adopted are consistent with those of the previous financial year, except that the Group has adopted new and amended Australian Accounting Standards and AASB interpretations where applicable from 1 July 2014, which were assessed to have no material impact on the Company, as follows:
Reference Title Application date of standard
Application date for Group
AASB 2013-3 Amendments to AASB 136 – Recoverable Amount Disclosures for Non-Financial Assets
1 January 2014 1 July 2014
AASB 1031 Materiality 1 January 2014 1 July 2014
(d) Accounting standards and interpretations issued but not yet effective
The following table sets out new Australian Accounting Standards and Interpretations that have been issued but are not yet mandatory and which have not been early adopted by the Company for the annual reporting period ending 30 June 2015, and have been assessed to have no material impact on the Company.
Reference Title Application date of standard
Application date for Group
AASB 2014-1 Amendments to Australian Accounting Standards – Part A – Annual Improvements to IFRs 2010-2012 Cycle
1 July 2014 1 July 2014
AASB 9 Financial Instruments 1 January 2018 1 July 2018 AASB 2014-4 Clarification of Acceptable Methods of
Depreciation and Amortisation (Amendments to AASB 116 and AASB 138)
1 January 2016 1 July 2016
IFRS 15 Revenue from Contracts with Customers 1 January 2017 1 July 2017
F
or p
erso
nal u
se o
nly
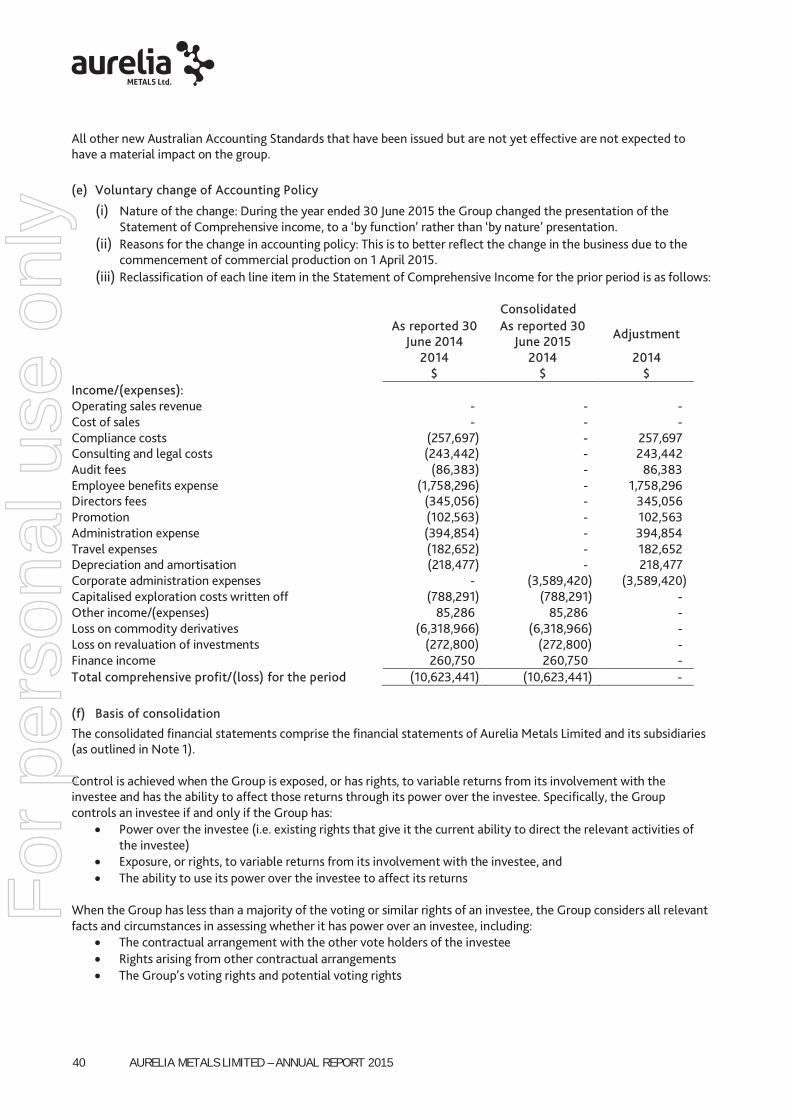
AURELIA METALS LIMITED – ANNUAL REPORT 2015 40
All other new Australian Accounting Standards that have been issued but are not yet effective are not expected to have a material impact on the group. (e) Voluntary change of Accounting Policy
(i) Nature of the change: During the year ended 30 June 2015 the Group changed the presentation of the Statement of Comprehensive income, to a ‘by function’ rather than ‘by nature’ presentation.
(ii) Reasons for the change in accounting policy: This is to better reflect the change in the business due to the commencement of commercial production on 1 April 2015.
(iii) Reclassification of each line item in the Statement of Comprehensive Income for the prior period is as follows: Consolidated
As reported 30 June 2014
As reported 30 June 2015 Adjustment
2014 2014 2014 $ $ $
Income/(expenses): Operating sales revenue -) -) -) Cost of sales -) -) -) Compliance costs (257,697) -) 257,697) Consulting and legal costs (243,442) -) 243,442) Audit fees (86,383) -) 86,383) Employee benefits expense (1,758,296) -) 1,758,296) Directors fees (345,056) -) 345,056) Promotion (102,563) -) 102,563) Administration expense (394,854) -) 394,854) Travel expenses (182,652) -) 182,652) Depreciation and amortisation (218,477) -) 218,477) Corporate administration expenses -) (3,589,420) (3,589,420) Capitalised exploration costs written off (788,291) (788,291) -) Other income/(expenses) 85,286) 85,286) -) Loss on commodity derivatives (6,318,966) (6,318,966) -) Loss on revaluation of investments (272,800) (272,800) -) Finance income 260,750) 260,750) -) Total comprehensive profit/(loss) for the period (10,623,441) (10,623,441) -) (f) Basis of consolidation
The consolidated financial statements comprise the financial statements of Aurelia Metals Limited and its subsidiaries (as outlined in Note 1). Control is achieved when the Group is exposed, or has rights, to variable returns from its involvement with the investee and has the ability to affect those returns through its power over the investee. Specifically, the Group controls an investee if and only if the Group has:
• Power over the investee (i.e. existing rights that give it the current ability to direct the relevant activities of the investee)
• Exposure, or rights, to variable returns from its involvement with the investee, and • The ability to use its power over the investee to affect its returns
When the Group has less than a majority of the voting or similar rights of an investee, the Group considers all relevant facts and circumstances in assessing whether it has power over an investee, including:
• The contractual arrangement with the other vote holders of the investee • Rights arising from other contractual arrangements • The Group’s voting rights and potential voting rights
F
or p
erso
nal u
se o
nly

AURELIA METALS LIMITED – ANNUAL REPORT 2015 41
The Group re-assesses whether or not it controls an investee if facts and circumstances indicate that there are changes to one or more of the three elements of control. Consolidation of a subsidiary begins when the Group obtains control over the subsidiary and ceases when the Group loses control of the subsidiary. Assets, liabilities, income and expenses of a subsidiary acquired or disposed of during the year are included in the statement of comprehensive income from the date the Group gains control until the date the Group ceases to control the subsidiary. The financial statements of subsidiaries are prepared for the same reporting period as the Company, using consistent accounting policies. Adjustments are made to bring into line any dissimilar accounting policies that may exist. In preparing the consolidated financial statements, all intercompany balances and transactions, income and expenses and profit and losses resulting from intra-group transactions, have been eliminated in full. (g) Foreign Currency
Functional and Presentation Currency Both the functional and presentation currency of Aurelia Metals Limited and its controlled entities is Australian Dollars ($ or A$). Transactions and Balances Transactions in foreign currency are initially recorded in the foreign currency at the exchange rates ruling at the date of transaction. The subsequent payment of receipt of funds related to a transaction is translated at the rate applicable on the date of payment or receipt. Monetary assets and liabilities denominated in foreign currencies are retranslated at the rate of exchange ruling at the reporting date. All exchange differences in the consolidated financial statements are taken to the Income Statement as gain or loss on exchange. (h) Cash and cash equivalents
Cash and cash equivalents in the balance sheet comprise cash at bank and on hand and short-term deposits with an original maturity of three months or less that are readily convertible to known amounts of cash and which are subject to an insignificant risk of changes in value. For the purposes of the cash flow statement, cash and cash equivalents consist of cash and cash equivalents as defined above, net of outstanding bank overdrafts. Bank overdrafts are included within interest-bearing loans and borrowings in current liabilities on the balance sheet. (i) Trade and other receivables
Trade receivables comprising base metal concentrates and gold bullion awaiting settlement are initially recorded at the fair value of contracted sale proceeds expected to be received only when there has been a passing of significant risks and awards of ownership to the customer. Collectability of debtors is reviewed on an ongoing basis. An estimate for doubtful debts is made when collection of the full amount is no longer probable. Bad debts are written off when identified. Other collectables are recognised and carried at original invoice amount less an allowance for any uncollectible amounts.
F
or p
erso
nal u
se o
nly

AURELIA METALS LIMITED – ANNUAL REPORT 2015 42
(j) Inventories / Materials on hand
Gold bullion, metal in concentrate, metal in circuit and ore stockpiles are physically measured or estimated and valued at the lower of cost or net realisable value. Net realisable value is the estimated future sales price of the product the entity expects to realise when the product is processed and sold, less estimated costs to complete production and bring the product to sale. Where the time value of money is material, these future prices and costs to complete are discounted. Until mine properties are in production, any differences in cost and net realisable value are capitalised to the respective asset in development. If the ore stockpile is not expected to be processed in 12 months after the reporting date, it is included in non-current assets and the net realisable value is calculated on a discounted cash flow basis. Cost is determined by using the weighted-average method and comprises direct purchase costs and an appropriate portion of fixed and variable overhead costs, including depreciation and amortisation, incurred in converting materials into finished goods, based on the normal production capacity. The cost of production is allocated to joint products using a ratio of spot prices by volume at each month end. Separately identifiable costs of conversion of each metal are specifically allocated. Materials and supplies on hand are valued at the lower of cost or net realisable value. Any provision for obsolescence is determined by reference to specific items of stock. A regular review is undertaken to determine the extent of any provision for obsolescence. (k) Property Plant and Equipment and Mine Properties
Items of property, plant and equipment and producing mines are stated at cost, less accumulated depreciation, amortisation and accumulated impairment losses. Initial recognition The initial cost of an asset comprises its purchase price or construction cost, any costs directly attributable to bringing the asset into operation, the initial estimate of the rehabilitation obligation, and, for qualifying assets (where relevant), borrowing costs. The purchase price or construction cost is the aggregate amount paid and the fair value of any other consideration given to acquire the asset. The capitalised value of a finance lease is also included in property, plant and equipment. Mine properties also consist of the fair value attributable to mineral reserves and the portion of mineral resources considered to be probable of economic extraction at the time of an acquisition. When a mine construction project moves into the production phase, the capitalisation of certain mine construction costs ceases, and costs are either regarded as part of the cost of inventory or expensed, except for costs which qualify for capitalisation relating to mining asset additions, improvements or new developments, underground mine development or mineable reserve development. Depreciation/amortisation Accumulated mine development costs are depreciated/amortised on a unit-of-production basis over the economically recoverable reserves and the portion of mineral resources considered to be probable of economic extraction, except in the case of assets whose useful life is shorter than the life of the mine, in which case the straight-line method is applied. The unit of account for run of mines (ROM) costs is tonnes of ore mined, whereas the unit of account for post-ROM costs is tonnes of ore processed. Rights and concessions are depleted on the unit-of-production (UOP) basis over the economically recoverable reserves of the relevant area. The unit-of-production rate calculation for the depreciation/amortisation of mine development costs takes into account expenditures incurred to date, together with planned future development expenditure. The estimated fair value attributable to the mineral reserves and the portion of mineral resources considered to be probable of economic extraction at the time of the acquisition is amortised on a UOP basis whereby the denominator is the proven and probable reserves and the portion of resources expected to be extracted economically. The estimated fair value of the mineral resources that are not considered to be probable of economic extraction at the
F
or p
erso
nal u
se o
nly

AURELIA METALS LIMITED – ANNUAL REPORT 2015 43
time of the acquisition is not subject to amortisation, until the resource becomes probable of economic extraction in the future and is recognised in exploration and evaluation assets. Other plant and equipment, is calculated on a straight-line basis over their estimated useful lives as follows:
• Plant and equipment over three to five years • Land – not depreciated • Motor vehicles – three to five years • Leasehold improvements – three to five years
Impairment The carrying values of plant and equipment are reviewed for impairment when events or changes in circumstances indicate the carrying value may not be recoverable. For an asset that does not generate largely independent cash inflows, the recoverable amount is determined for the cash-generating unit to which the asset belongs. If any indication of impairment exists and where the carrying values exceed the estimated recoverable amount, the assets or cash-generating units are written down to their recoverable amount. The recoverable amount of plant and equipment is the greater of fair value less costs to sell and value in use. In assessing value in use, the estimated future cash flows are discounted to their present value using a pre-tax discount rate that reflects current market assessments of the time value of money and the risks specific to the asset. Impairment losses are recognised in the income statement. Gains and losses on disposals are determined by comparing proceeds with the carrying amount. These are included in the income statement. Derecognition Items of property, plant and equipment and producing mines are derecognised upon disposal or when no further future economic benefits are expected from its use or disposal. (l) Recoverable amount of assets
At each reporting date, the Company assesses whether there is any indication that an asset may be impaired. Where an indicator of impairment exists, the Company makes a formal estimate of recoverable amount. Where the carrying amount of an asset exceeds its recoverable amount the asset is considered impaired and is written down to its recoverable amount. Recoverable amount is the greater of fair value less costs to sell and value in use. It is determined for an individual asset, unless the asset's value in use cannot be estimated to be close to its fair value less costs to sell and it does not generate cash inflows that are largely independent of those from other assets or groups of assets, in which case, the recoverable amount is determined for the cash-generating unit to which the asset belongs. In assessing value in use, the estimated future cash flows are discounted to their present value using a pre-tax discount rate that reflects current market assessments of the time value of money and the risks specific to the asset. (m) Exploration and evaluation expenditure Expenditure on acquisition, exploration and evaluation relating to an area of interest is carried forward where rights to tenure of the area of interest are current and; i) It is expected that expenditure will be recouped through successful development and exploitation of the area of
interest or alternatively by its sale and/or; ii) Exploration and evaluation activities are continuing in an area of interest but at balance date have not yet
reached a stage which permits a reasonable assessment of the existence or otherwise of economically recoverable reserves.
If facts and circumstances suggest that the carrying amount of any recognised exploration and evaluation assets may be impaired, the entity must perform impairment tests on those assets in accordance with AASB 136 ‘Impairment of Assets’. Impairment of exploration and evaluation assets is to be assessed at a cash generating unit or group of cash
F
or p
erso
nal u
se o
nly

AURELIA METALS LIMITED – ANNUAL REPORT 2015 44
generating units level provided this is no larger than an area of interest. Any impairment loss is to be recognised as an expense in accordance with AASB 136. Accumulated costs in relation to an abandoned area are written off to the income statement in the period in which the decision to abandon the area is made. Mines under construction When the technical feasibility and commercial viability of extracting a mineral resource have been demonstrated then any capitalised exploration and evaluation expenditure is reclassified as capitalised ‘Mine properties under construction ’. Prior to reclassification, capitalised exploration and evaluation expenditure is assessed for impairment. Producing mines Upon completion of the mine construction phase, assets are transferred into ‘Property, Plant and Equipment’ or ‘Mine Properties’. (n) Trade and other payables Trade payables and other payables are carried at amortised cost. They represent liabilities for goods and services provided to the Company prior to the end of the financial year that are unpaid and arise when the Company becomes obliged to make future payments in respect of the purchase of these goods and services. The amounts are unsecured and are usually paid within 30 days of recognition. (o) Provisions and employee benefits
Provisions are recognised when the Company has a present obligation (legal or constructive) as a result of a past event, it is probable that an outflow of resources embodying economic benefits will be required to settle the obligation and a reliable estimate can be made of the amount of the obligation. Where the Company expects some or all of a provision to be reimbursed, the reimbursement is recognised as a separate asset but only when the reimbursement is virtually certain. The expense relating to any provision is presented in the income statement net of any reimbursement. If the effect of the time value of money is material, provisions are determined by discounting the expected future cash flows at a pre-tax rate that reflects current market assessments of the time value of money and, where appropriate, the risks specific to the liability. Where discounting is used, the increase in the provision due to the passage of time is recognised as a finance cost. Liabilities for wages and salaries, including non-monetary benefits, annual leave, long service leave and accumulating sick leave expected to be settled within 12 months of the reporting date are recognised in respect of employee’s services up to the reporting date. They are measured at the amounts expected to be paid when the liabilities are settled. Liabilities for non-accumulating sick leave are recognised when the leave is taken and are measured at the rates paid or payable. (p) Leases
The determination of whether an arrangement is, or contains, a lease is based on the substance of the arrangement at the inception date. The arrangement is assessed for whether fulfilment of the arrangement is dependent on the use of a specific asset or assets or the arrangement conveys a right to use the asset or assets, even if that right is not explicitly specified in an arrangement. Finance leases that transfer substantially all the risks and benefits incidental to ownership of the leased item to the Group, are capitalised at the commencement of the lease at the fair value of the leased property or, if lower, at the present value of the minimum lease payments. Lease payments are apportioned between finance charges and reduction of the lease liability so as to achieve a constant rate of interest on the remaining balance of the liability. Finance charges are recognised in finance costs in the statement of profit or loss.
F
or p
erso
nal u
se o
nly

AURELIA METALS LIMITED – ANNUAL REPORT 2015 45
A leased asset is depreciated over the useful life of the asset. However, if there is no reasonable certainty that the Group will obtain ownership by the end of the lease term, the asset is depreciated over the shorter of the estimated useful life of the asset and the lease term. Operating lease payments are recognised as an operating expense in the statement of profit or loss on a straight-line basis over the lease term. (q) Borrowing costs
Borrowing costs directly attributable to the acquisition, construction or production of an asset that necessarily takes a substantial period of time to get ready for its intended use or sale are capitalised as part of the cost of the asset. All other borrowing costs are expensed in the period in which they occur. Borrowing costs consist of interest and other costs that an entity incurs in connection with the borrowing of funds. (r) Income recognition Income, including management fees, is recognised and measured at the fair value of the consideration received or receivable to the extent it is probable that the economic benefits will flow to the Company and the income can be reliably measured. The following specific recognition criteria must also be met before income can be recognised: Gold and Silver Bullion Sales Revenue from gold and silver bullion sales is brought to account when the significant risks and rewards of ownership have transferred to the buyer and selling prices are known or can be reasonably estimated. Zinc, Lead and Silver in Concentrate Sales The terms of metal in concentrate sales contracts with third parties contain provisional pricing arrangements whereby the selling price for metal in concentrate is based on prevailing spot prices on a specified future date after shipment to the customer (quotation period). Adjustments to the sales price occur based on movements in quoted market prices up to the date of final settlement. The period between provisional invoicing and final settlement is typically between one and three months. Interest Income is recognised as interest accrues using the effective interest method. This is a method of calculating the amortised cost of a financial asset and allocating the interest income over the relevant period using the effective interest rate. This is the rate that exactly discounts estimated future cash receipts through the expected life of the financial asset to the net carrying amount of the financial asset. (s) Share-based payment transactions
The Company provides benefits to employees (including directors) in the form of share-based payment transactions, whereby employees render services in exchange for shares or rights over shares (‘equity-settled transactions’). The cost of these equity-settled transactions with employees is measured by reference to the fair value at the date at which they are granted. The fair value is determined by an internal valuation using the Black Scholes model or Trinomial Barrier Option model. In valuing equity-settled transactions, no account is taken of any performance conditions, other than conditions linked to the price of the shares of Aurelia (‘market conditions’). The cost of equity-settled transactions is recognised, together with a corresponding increase in equity, over the period in which the performance conditions are fulfilled, ending on the date on which the relevant employees become fully entitled to the award (‘vesting date’). The cumulative expense recognised for equity-settled transactions at each reporting date until vesting date reflects (i) the extent to which the vesting period has expired and (ii) the number of awards that, in the opinion of the Directors of the Company, will ultimately vest. This opinion is formed based on the best available information at balance date. No
F
or p
erso
nal u
se o
nly

AURELIA METALS LIMITED – ANNUAL REPORT 2015 46
adjustment is made for the likelihood of market performance conditions being met as the effect of these conditions is included in the determination of fair value at grant date. No expense is recognised for awards that do not ultimately vest, except for awards where vesting is conditional upon a market condition. Where the terms of an equity-settled award are modified, as a minimum an expense is recognised as if the terms had not been modified. In addition, an expense is recognised for any increase in the value of the transaction as a result of the modification, as measured at the date of modification. Where an equity-settled award is cancelled, it is treated as if it had vested on the date of cancellation, and any expense not yet recognised for the award is recognised immediately. However, if a new award is substituted for the cancelled award, and designated as a replacement award on the date that it is granted, the cancelled and new award are treated as if they were a modification of the original award, as described in the previous paragraph. The dilutive effect, if any, of outstanding options is reflected as additional share dilution in the computation of earnings per share. (t) Income tax
Current tax assets and liabilities for the current and prior periods are measured at the amount expected to be recovered from or paid to the taxation authorities based on the current period’s taxable income. The tax rates and tax laws used to compute the amount are those that are enacted or substantively enacted by the balance sheet date. Deferred income tax is provided on all temporary differences at the balance sheet date between the tax bases of assets and liabilities and their carrying amounts for financial reporting purposes. Deferred income tax liabilities are recognised for all taxable temporary differences:
• Except where the deferred income tax liability arises from the initial recognition of an asset or liability in a transaction that is not a business combination and, at the time of the transaction, affects neither the accounting profit nor taxable profit or loss; and
• In respect of taxable temporary differences associated with investments in subsidiaries, associates and interests in joint ventures, except where the timing of the reversal of the temporary differences can be controlled and it is probable that the temporary differences will not reverse in the foreseeable future.
Deferred income tax assets are recognised for all deductible temporary differences, carry-forward of unused tax assets and unused tax losses, to the extent that it is probable that taxable profit will be available against which the deductible temporary differences, and the carry-forward of unused tax assets and unused tax losses can be utilised:
• Except where the deferred income tax asset relating to the deductible temporary difference arises from the initial recognition of an asset or liability in a transaction that is not a business combination and, at the time of the transaction, affects neither the accounting profit nor taxable profit or loss; and
• In respect of deductible temporary differences associated with investments in subsidiaries, associates and interests in joint ventures, deferred tax assets are only recognised to the extent that it is probable that the temporary differences will reverse in the foreseeable future and taxable profit will be available against which the temporary differences can be utilised.
The carrying amount of deferred income tax assets is reviewed at each balance sheet date and reduced to the extent that it is no longer probable that sufficient taxable profit will be available to allow all or part of the deferred income tax asset to be utilised. Unrecognised deferred income tax assets are reassessed at each balance sheet date and are recognised to the extent that it has become probable that future taxable profit will allow the deferred tax asset to be recovered. Deferred income tax assets and liabilities are measured at the tax rates that are expected to apply to the year when the asset is realised or the liability is settled, based on tax rates (and tax laws) that have been enacted or substantively enacted at the balance sheet date.
F
or p
erso
nal u
se o
nly

AURELIA METALS LIMITED – ANNUAL REPORT 2015 47
Income taxes relating to items recognised directly in equity are recognised in equity and not in the income statement. Deferred tax assets and deferred tax liabilities are offset only if a legally enforceable right exists to set off current tax assets against current tax liabilities and the deferred tax assets and liabilities relate to the same taxable entity and the same taxation authority.
(u) Other taxes Income, expenses and assets are recognised net of the amount of GST except:
• Where the GST incurred on a purchase of goods and services is not recoverable from the taxation authority, in which case the GST is recognised as part of the cost of acquisition of the asset or as part of the expense item as applicable; and
• Receivables and payables are stated with the amount of GST included. The net amount of GST recoverable from, or payable to, the taxation authority is included as part of receivables or payables in the balance sheet. Cash flows are included in the cash flow statement on a gross basis and the GST component of cash flows arising from investing and financing activities, which is recoverable from, or payable to, the taxation authority are classified as operating cash flows. Commitments and contingencies are disclosed net of the amount of GST recoverable from, or payable to, the taxation authority. (v) Contributed equity
Ordinary shares are classified as equity. Incremental costs directly attributable to the issue of new shares or options are shown directly in equity as a deduction, net of tax, from proceeds. (w) Operating segments
An operating segment is a component of an entity that engages in business activities from which it may earn income and incur expenses (including income and expenses relating to transactions with other components of the same entity), whose operating results are regularly reviewed by the entity's chief operating decision maker to make decisions about resources to be allocated to the segment and assess its performance and for which discrete financial information is available. This includes start up operations which are yet to earn income. Management will also consider other factors in determining operating segments such as the existence of a line manager and the level of segment information presented to the Board of Directors. Operating segments have been identified based on the information provided to the chief operating decision makers – being the executive management team. The group aggregates two or more operating segments when they have similar economic characteristics, and the segments are similar in each of the following respects:
• Nature of the products and services • Nature of the production processes • Type or class of customer for the products and services • Methods used to distribute the products or provide the services, and if applicable • Nature of the regulatory environment.
Operating segments that meet the quantitative criteria as prescribed by AASB 8 are reported separately. However, an operating segment that does not meet the quantitative criteria is still reported separately where information about the segment would be useful to users of the financial statements. Information about other business activities and operating segments that are below the quantitative criteria are combined and disclosed in a separate category for ‘all other segments’.
F
or p
erso
nal u
se o
nly

AURELIA METALS LIMITED – ANNUAL REPORT 2015 48
(x) Profit/(loss) per share
Basic profit/(loss) per share Basic profit / (loss) per share is calculated by dividing the profit / (loss) attributable to equity holders of the company, excluding any costs of servicing equity other than dividends, by the weighted average number of ordinary shares, adjusted for any bonus elements.
Diluted profit/(loss) per share Diluted earnings per share is calculated as net profit / (loss) attributable to members of the Company, adjusted for:
• Costs of servicing equity (other than dividends); • The after tax effect of dividends and interest associated with dilutive potential ordinary shares that have been
recognised as expenses; and • Other non-discretionary changes in income or expenses during the period that would result from the dilution
of potential ordinary shares; divided by the weighted average number of ordinary shares and dilutive potential ordinary shares, adjusted for any bonus elements. (y) Financial instruments
(i) Financial assets Investments and financial assets in the scope of AASB 139 Financial Instruments: Recognition and Measurement are categorised as either financial assets at fair value through profit or loss, loans and receivables, held-to-maturity investments, or available-for-sale financial assets. The classification depends on the purpose for which the investments were acquired or originated. Designation is re-evaluated at each reporting date, but there are restrictions on reclassifying to other categories. When financial assets are recognised initially, they are measured at fair value, plus, in the case of assets not at fair value through profit or loss, directly attributable transaction costs.
Recognition and de-recognition All regular way purchases and sales of financial assets are recognised on the trade date i.e., the date that the Group commits to purchase the asset. Regular way purchases or sales are purchases or sales of financial assets under contracts that require delivery of the assets within the period established generally by regulation or convention in the market place. Financial assets are derecognised when the right to receive cash flows from the financial assets has expired or when the entity transfers substantially all the risks and rewards of the financial assets. If the entity neither retains nor transfers substantially all of the risks and rewards, it derecognises the asset if it has transferred control of the assets. Subsequent valuation After initial recognition, the Group measures financial assets, including derivatives that are assets, at their fair values, without any deduction for transaction costs it may incur on sale or other disposal, except for the following financial assets:
• Loans and receivables as defined in paragraph, which shall be measured at amortised cost • using the effective interest method; • Held-to-maturity investments as defined in paragraph, which shall be measured at amortised cost using the
effective interest method; and • Investments in equity instruments that do not have a quoted market price in an active market and whose fair
value cannot be reliably measured and derivatives that are linked to and must be settled by delivery of such unquoted equity instruments, which shall be measured at cost.
The Group assesses, at each reporting date, whether there is any objective evidence that a financial asset or a group of financial assets is impaired. A financial asset or a group of financial assets is deemed to be impaired if, and only if, there is objective evidence of impairment as a result of one or more events that has occurred after the initial recognition of
F
or p
erso
nal u
se o
nly

AURELIA METALS LIMITED – ANNUAL REPORT 2015 49
the asset (an incurred ‘loss event’) and that loss event has an impact on the estimated future cash flows of the financial asset or the group of financial assets that can be reliably estimated. (ii) Financial liabilities Initial recognition and measurement Financial liabilities are classified, at initial recognition, as financial liabilities at fair value through profit or loss, loans and borrowings, payables, or as derivatives designated as hedging instruments in an effective hedge, as appropriate. All financial liabilities are recognised initially at fair value and, in the case of loans and borrowings and payables, net of directly attributable transaction costs. The Group’s financial liabilities may include trade and other payables, loans and borrowings, including bank overdrafts, and derivative financial instruments. Subsequent measurement The measurement of financial liabilities depends on their classification, as described below: Financial liabilities at fair value through profit or loss Financial liabilities at fair value through profit or loss include financial liabilities held for trading and financial liabilities designated upon initial recognition as at fair value through profit or loss. Financial liabilities are classified as held for trading if they are acquired or incurred for the purpose of selling or repurchasing in the near term. This category also includes derivative financial instruments entered into by the Group that are not designated as hedging instruments in hedge relationships as defined by AASB 139. Separated embedded derivatives are also classified as held for trading unless they are designated as effective hedging instruments. Gains or losses on liabilities held for trading are recognised in the statement of profit or loss. Financial liabilities designated upon initial recognition at fair value through profit or loss are designated at the initial date of recognition, and only if the criteria in AASB 139 are satisfied. The Group has not designated any financial liability as at fair value through profit or loss. Loans and borrowings After initial recognition, interest-bearing loans and borrowings are subsequently measured at amortised cost using the Effective Interest Rate (‘EIR’) method. Gains and losses are recognised in profit or loss when the liabilities are de-recognised as well as through the EIR amortisation process. Amortised cost is calculated by taking into account any discount or premium on acquisition and fees or costs that are an integral part of the EIR. The EIR amortisation is included in finance costs in the statement of profit or loss. This category generally applies to interest-bearing loans and borrowings. For more information refer Note 13. De-recognition A financial liability is de-recognised when the obligation under the liability is discharged or cancelled, or expires. When an existing financial liability is replaced by another from the same lender on substantially different terms, or the terms of an existing liability are substantially modified, such an exchange or modification is treated as the de-recognition of the original liability and the recognition of a new liability. The difference in the respective carrying amounts is recognised in the statement or profit or loss. (iii) Offsetting of Financial Instruments Financial assets and financial liabilities are offset and the net amount is reported in the consolidated statement of financial position if there is a currently enforceable legal right to offset the recognised amounts and there is an intention to settle on a net basis, to realise the assets and settle the liabilities simultaneously. (z) Comparative information
Where necessary, the prior year financial data was restated for comparability purposes.
F
or p
erso
nal u
se o
nly

AURELIA METALS LIMITED – ANNUAL REPORT 2015 50
2B. CRITICAL ACCOUNTING ESTIMATES AND ASSUMPTIONS
The preparation of the financial statements requires management to make judgements, estimates and assumptions that affect the reported amounts in the financial statements. Management continually evaluates its judgements and estimates in relation to assets, liabilities, contingent liabilities, income and expenses. Management bases its judgements and estimates on historical experience and on various other factors it believes to be reasonable under the circumstances, the result of which form the basis of the carrying values of assets and liabilities that are not readily apparent from other sources. Actual results may differ from these estimates under different assumptions and conditions. Management has identified the following critical accounting policies for which significant judgements, estimates and assumptions are made. Actual results may differ from these estimates under different assumptions and conditions and may materially affect financial results or the financial position reported in future periods. (a) Significant accounting judgements
(i) Exploration and evaluation expenditure Exploration and evaluation expenditure is capitalised when either, costs are expected to be recouped through successful development and exploitation of the area of interest; or alternatively by its sale: or exploration and/or evaluation activities in the area have not reached a stage which permits a reasonable assessment of the existence or otherwise of economically recoverable reserves. Costs incurred on mining tenements are allocated to specific geological structures within the mining tenement. Where specific geological structures within tenement are yet to be identified, the costs are allocated across the entire tenement on a proportional basis. In determining this, assumptions, including the maintenance of title, ongoing expenditure and prospectivity are made and in the event that these assumptions no longer hold valid then this expenditure may, in part or full, be expensed through the income statement in future periods – see Note 9 for disclosure of carrying values. (ii) Production start date The Company assesses the stage of each mine under construction to determine when a mine moves into the production phase. This being when the mine is substantially complete, ready and available for its intended use. The criteria used to assess the start date are determined based on the unique nature of each mine construction project, such as the complexity of the project and its location. The Company considers various relevant criteria to assess when the production phase is considered to have commenced. At this point, all related amounts are reclassified from ‘Mines under construction’ to ‘producing mines’ and/or ‘Property, Plant and Equipment.’ Some of the criteria used to identify the production start date include, but are not limited to:
• Level of capital expenditure incurred compared with the original construction cost estimate • Completion of a reasonable period of testing of the mine plant and equipment (‘commissioning period’) • Ability to produce metal in saleable form (within specifications) • Ability to sustain ongoing production of metal at commercial production level
When a mine development/construction project moves into the production phase, the capitalisation of certain mine development/construction costs ceases and costs are either regarded as forming part of the cost of inventory or expensed, except for costs that qualify for capitalisation relating to mining asset additions or improvements, underground mine development or mineable reserve development. It is also at this point that depreciation/amortisation commences. Revenue generated during a development or commissioning period from the production and sale of metal is considered to be integral to the development of the mine and is therefore credited to the mine development asset. Revenue earned after the production start date is credited to the profit and loss. At 1 April 2015, Aurelia Metals moved from ‘Mine under Construction’ to ‘Producing Mine’.
F
or p
erso
nal u
se o
nly

AURELIA METALS LIMITED – ANNUAL REPORT 2015 51
(b) Significant accounting estimates and assumptions
(i) Share-based payment transactions The Company measures the cost of equity-settled transactions with employees by reference to the fair value of the equity instruments at the date at which they are granted. The fair value is determined by using a Black-Scholes or Trinomial Barrier Option Model formula taking into account the terms and conditions upon which the instruments were granted. The accounting estimates and assumptions relating to equity-settled share-based payments would have no impact on the carrying amounts of assets and liabilities within the next annual reporting period but may impact expenses and equity. (ii) Deferred acquisition costs in relation to Hera The Company measures the deferred acquisition costs by reference to the fair value of net present value of future cash outflows. The following assumptions have been taken into account: risk free bond rate, gold price, timing and possibility of payment. (iii) Unit of Production Method of Depreciation/Amortisation The Company uses the unit-of production basis where depreciating/amortising specific assets which results in a depreciation/amortisation charge proportional to the depletion of the anticipated remaining life of mine production. Each item’s economic life, which is assessed annually, has due regard to both its physical life limitations and to present assessments of economically recoverable reserves of the mine property at which it is located. These calculations require the use of estimates and assumptions. (iv) Impairment of Assets The Company assesses each Cash-Generating Unit (GGU), annually to determine whether there is any indication of impairment or reversal. Where an indicator of impairment or reversal exists, a formal estimate of the recoverable amount is made, which is deemed as being the higher of the fair value costs of disposal and value in use calculated in accordance with accounting policy note 2(m). These assessments require the use of estimates and assumptions such as discount rates, exchange rates, commodity prices, gold multiple values, future operating development and sustaining capital requirements and operating performance.
F
or p
erso
nal u
se o
nly
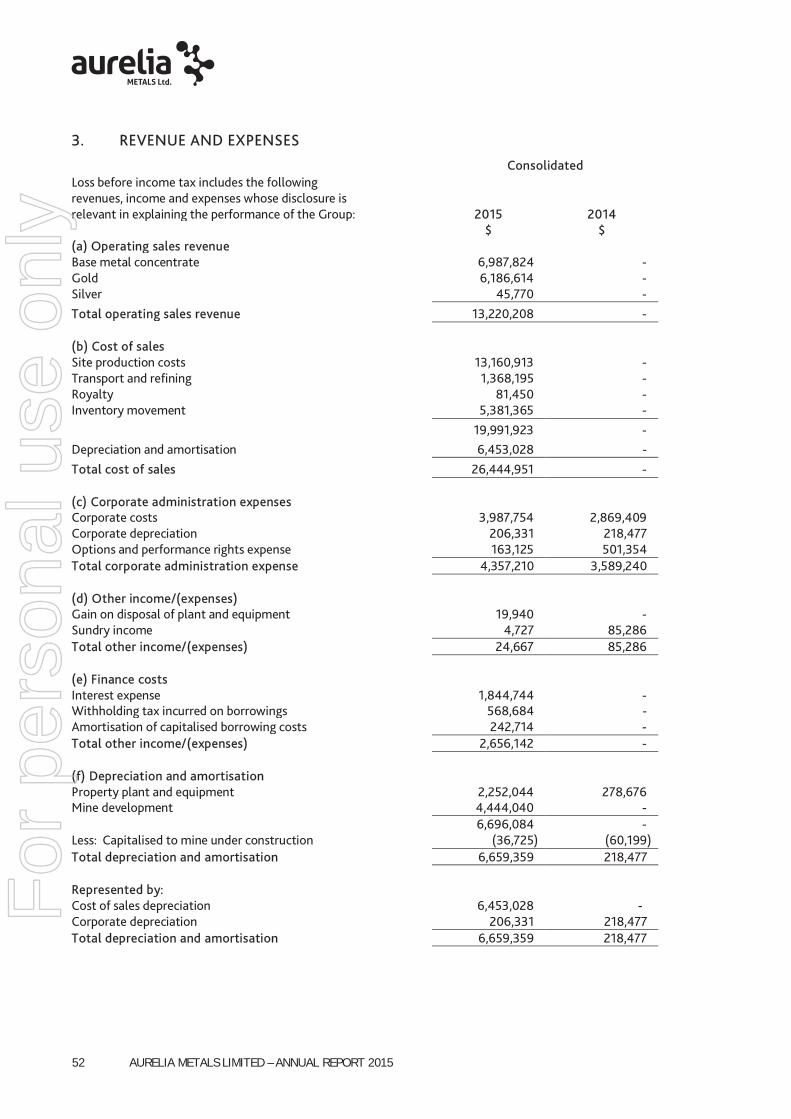
AURELIA METALS LIMITED – ANNUAL REPORT 2015 52
3. REVENUE AND EXPENSES
Consolidated Loss before income tax includes the following revenues, income and expenses whose disclosure is relevant in explaining the performance of the Group:
2015 2014
$ $ (a) Operating sales revenue Base metal concentrate 6,987,824) -) Gold 6,186,614) -) Silver 45,770) -) Total operating sales revenue 13,220,208) -) (b) Cost of sales Site production costs 13,160,913) -) Transport and refining 1,368,195) -) Royalty 81,450) -) Inventory movement 5,381,365) -) 19,991,923) -) Depreciation and amortisation 6,453,028) -) Total cost of sales 26,444,951) -) (c) Corporate administration expenses Corporate costs 3,987,754) 2,869,409) Corporate depreciation 206,331) 218,477) Options and performance rights expense 163,125) 501,354) Total corporate administration expense 4,357,210) 3,589,240) (d) Other income/(expenses) Gain on disposal of plant and equipment 19,940) -) Sundry income 4,727) 85,286) Total other income/(expenses) 24,667) 85,286) (e) Finance costs Interest expense 1,844,744) -) Withholding tax incurred on borrowings 568,684) -) Amortisation of capitalised borrowing costs 242,714) -) Total other income/(expenses) 2,656,142) -) (f) Depreciation and amortisation Property plant and equipment 2,252,044) 278,676) Mine development 4,444,040) -) 6,696,084) -) Less: Capitalised to mine under construction (36,725) (60,199) Total depreciation and amortisation 6,659,359) 218,477) Represented by: Cost of sales depreciation 6,453,028) -)) Corporate depreciation 206,331) 218,477) Total depreciation and amortisation 6,659,359) 218,477)
F
or p
erso
nal u
se o
nly

AURELIA METALS LIMITED – ANNUAL REPORT 2015 53
Consolidated 2015 2014 $ $ (g) Employee benefits expense Salaries, on-costs and other employment benefits 3,680,416 1,162,934 Superannuation expense 350,182 94,008 Options and performance rights expense 163,125 501,354 Total employee benefits expense 4,193,723 1,758,296 (h) Other items Operating lease rentals 75,920 68,911
4. INCOME TAX
A reconciliation between tax expense and the product of accounting loss before income tax multiplied by the Company's applicable income tax rate is as follows: Consolidated
2015 2014
$ $
The major components of income tax expense income statement Current income tax Current income tax charge - (201,686)
Deferred income tax Relating to origination and reversal of temporary differences 5,484,672 1,237,831
Unrecognised tax losses (5,484,672) (1,036,145)
Income tax expense reported in the income statement - - A reconciliation between tax expense and the product of accounting loss before income tax multiplied by the Company's applicable income tax rate is as follows:
Accounting profit/(loss) before income tax (118,158,448) (10,623,441) At the Company's statutory income tax rate (30%) (35,447,534) (3,187,032) Share based payments & other non-assessable items (175,921) (201,687) Income tax benefit (expense) not brought to account 35,623,455 3,388,719 Income tax reported in the income statement - -
F
or p
erso
nal u
se o
nly
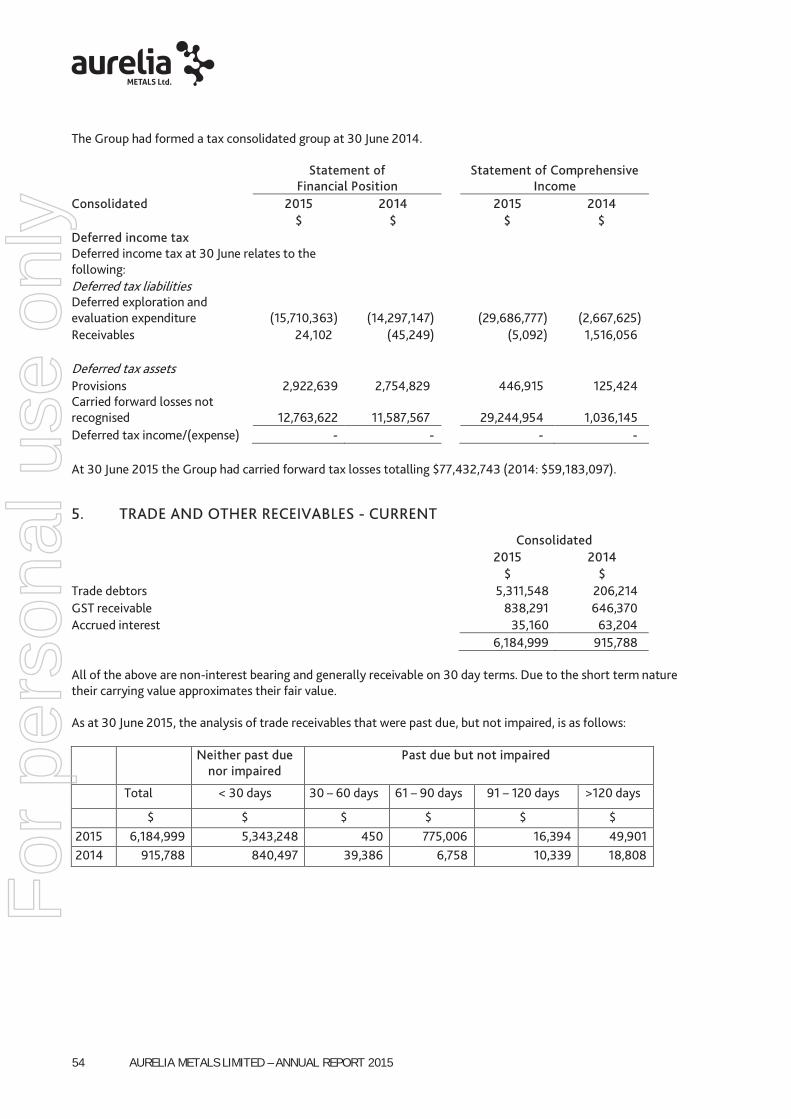
AURELIA METALS LIMITED – ANNUAL REPORT 2015 54
The Group had formed a tax consolidated group at 30 June 2014.
Statement of
Financial Position Statement of Comprehensive
Income Consolidated
2015 2014
2015 2014
$ $
$ $
Deferred income tax Deferred income tax at 30 June relates to the
following: Deferred tax liabilities
Deferred exploration and evaluation expenditure (15,710,363) (14,297,147)
(29,686,777) (2,667,625)
Receivables
24,102))) (45,249)
(5,092) 1,516,056)
Deferred tax assets
Provisions
2,922,639 2,754,829)
446,915) 125,424)
Carried forward losses not recognised 12,763,622 11,587,567)
29,244,954) 1,036,145)
Deferred tax income/(expense) - -
-) -) At 30 June 2015 the Group had carried forward tax losses totalling $77,432,743 (2014: $59,183,097).
5. TRADE AND OTHER RECEIVABLES - CURRENT
Consolidated 2015 2014 $ $ Trade debtors 5,311,548 206,214) GST receivable 838,291 646,370) Accrued interest 35,160 63,204)
6,184,999 915,788) All of the above are non-interest bearing and generally receivable on 30 day terms. Due to the short term nature their carrying value approximates their fair value. As at 30 June 2015, the analysis of trade receivables that were past due, but not impaired, is as follows: Neither past due
nor impaired Past due but not impaired
Total < 30 days 30 – 60 days 61 – 90 days 91 – 120 days >120 days
$ $ $ $ $ $ 2015 6,184,999 5,343,248 450 775,006 16,394 49,901 2014 915,788 840,497 39,386 6,758 10,339 18,808
F
or p
erso
nal u
se o
nly

AURELIA METALS LIMITED – ANNUAL REPORT 2015 55
6. INVENTORIES
Consolidated 2015 2014 $ $ Stores inventory (Materials on hand) 1,476,792 87,464 Ore stockpiles 23,880 2,349,771 Metal in circuit 515,378 - Finished concentrate 471,691 - Finished gold dore 204,872 - Total current inventory 2,692,563 2,437,235 Ore, metal and finished gold dore are held at Net Realisable Value (NRV). Finished concentrate is held at cost. Stores inventory is held at cost. The result of the NRV/cost adjustment of inventories has been recognised through cost of sales during the period.
7. PROPERTY, PLANT AND EQUIPMENT
Consolidated Note 2015 2014 $ $ Plant and equipment at cost 60,440,267) 1,744,103) Property at cost(1) 275,000) 275,000) Accumulated depreciation and impairment (3,256,224) (1,079,820) Total property, plant and equipment 57,459,043) 939,283) Year ended 30 June Carrying amount at 1 July 939,283) 1,208,177) Additions/expenditure during the year 598,029) 9,782) Reclassification/transfers(2) 10 58,181,590) - Depreciation for the year (2,252,044) (278,676) Disposals of assets (7,815) - Carrying amount at 30 June 57,459,043) 939,283) (1) Property assets are held at cost and are not depreciated. (2) Represents reclassification/transfer from mines under development upon declaration of commercial production.
8. FINANCIAL ASSETS
Consolidated Note 2015 2014 (a) Carrying values of financial assets $ $ Shares in Aus Tin Mining Limited 272,800) 204,600) Options in Aus Tin Mining Limited - 355,431) Gold put options 8(b) - 3,380,853)
272,800) 3,940,884) (b) Gold Put Options At 1 July 3,380,853) 9,699,819) Loss on revaluation of put options 17 (2,260,948) (6,318,966) Cash received on closure of put options (1,119,905) - At 30 June - 3,380,853)
F
or p
erso
nal u
se o
nly

AURELIA METALS LIMITED – ANNUAL REPORT 2015 56
9. EXPLORATION AND EVALUATION ASSETS
Consolidated 2015 2014 $ $ At cost 23,188,430) 21,131,532) Accumulated write offs (5,188,056) (1,903,001) Accumulated impairment (17,884,374) - Total exploration and evaluation assets 116,000) 19,228,531) At 1 July 19,228,531) 16,149,403) Exploration expenditure during the year 2,118,936) 3,867,419) Exploration and evaluation assets written off (3,347,093) (788,291) Exploration and evaluation assets impaired (17,884,374) - At 30 June 116,000) 19,228,531) The recoverability of the carrying amount of the deferred exploration and evaluation expenditure is dependent on successful development and commercial exploitation, or alternatively the sale, of the respective areas of interest. An impairment charge of $17,884,374 has been recognised in 2015 (2014: Nil). Impairment has been recognised on exploration and evaluation assets where recoupment through successful development is now uncertain. See Note 10 for further discussion. Movements in the provision for impairment loss were as follows: Consolidated 2015 2014 $ $ At 1 July (1,903,001) (1,222,311) Tenements relinquished during the year 62,038) 107,601) Exploration and evaluation assets written off (3,347,093) (788,291) Exploration and evaluation assets impaired (17,884,374) - At 30 June (23,072,430) (1,903,001)
F
or p
erso
nal u
se o
nly

AURELIA METALS LIMITED – ANNUAL REPORT 2015 57
10. MINE PROPERTIES
Consolidated Note 2015 2014 $ $ Mines under construction: At 1 July 143,408,631) 57,934,018 Development expenditure during the year 40,792,684) 78,257,231 Increase/(decrease) in deferred acquisition costs (528,176) 754,065 Amortisation of project loan facility establishment costs 730,810) 633,030 Interest on project borrowings 6,019,562) 5,830,287 Sales during commissioning (22,801,274) - Treatment and refining charges during commissioning 3,341,543) 170,963,780) 143,408,631 Less: Transfers to property, plant and equipment 7 (58,181,590) - Less: Transfers to producing mines (112,782,190) - Mine under construction 30 June - 143,408,631 Producing Mines: At 1 July - - Transfers from mines under construction 112,782,190) - Impairment of mine properties (75,031,403) - Amortisation for the year (4,444,040) - Producing mines 30 June 33,306,747) -
Impairment losses
A comprehensive impairment review was conducted at 30 June 2015. The recoverable amount of each cash generating unit (‘CGU’) was reviewed. As a result of the review, asset values have been reduced to their recoverable amounts through the recognition of an impairment charge.
In assessing whether an impairment is required, the carrying value of the asset or CGU is compared with its recoverable amount. The recoverable amount is the higher of the CGU’s Fair Value Less Cost of Disposal (FVLCD) and Value In Use (VIU). Given the nature of the Company’s activities, information on the fair value of an asset is usually difficult to obtain unless negotiations with potential purchasers or similar transactions are taking place. Consequently, the FVLCD for each CGU was determined based on the net present value of the future estimated cash flows (expressed in real terms) expected to be generated from the continued use of the CGUs (based on the most recent life of mine plans), including any expansion projects, and its eventual disposal, using assumptions a market participant may take into account. These cash flows were discounted using a real post-tax discount rate that reflected current market assessments of the time value of money and the risks specific to the CGU. The determination of FVLCD for each CGU uses Level 3 valuation techniques. Inputs into the FVLCD calculation included: forecast payable production of approximately 196,000 oz gold, 57,000 tonnes of lead and 60,000 tonnes of zinc based on the Company’s expanded life of mine plan; long term commodity prices of US$1207/oz gold, $2000/t lead and US$2750/t zinc; average A$/US$ exchange rate of 0.78; cash flows discounted using an after tax real discount rate of 10%.
F
or p
erso
nal u
se o
nly

AURELIA METALS LIMITED – ANNUAL REPORT 2015 58
a) Summary of impairments
As a result of the review, the following impairment losses were recognised:
Impairment losses 2015 2014
$ $
Mine properties 75,031,403 -
Exploration and evaluation assets 17,884,374 -
Total 92,915,777 -
Impairment losses by CGU Mine properties Exploration and evaluation assets
Total Impairment Value
$ $ $ Hera Project 75,031,403 3,465,531 78,496,934
Nymagee Project 14,386,405 14,386,405
Regional exploration 32,438 32,438
Total 75,031,403 17,884,374 92,915,777 Mine properties: Total impairment losses of $75,031,403 (2014: Nil) were recognised in respect of the Hera CGU mine property. The triggers for the impairment test were primarily the effect of recent operating experience, which resulted in higher costs of extraction and lower than expected gold recovery relative to the feasibility study estimates. The recoverable amount of Hera was based on management’s estimate of FVLCD. Exploration and evaluation (E&E) assets: Total impairment losses of $17,884,374 (2014: Nil) were recognised in respect of Hera, Nymagee and regional exploration properties. The triggers for impairment of the Hera E & E asset is related to the Hera CGU impairment, whereby increased forecast operating costs have rendered certain inferred resource uneconomic and unlikely to be recoverable. At Nymagee, it is management’s view that the focus on improving performance at Hera will mean that the timeline for any development of Nymagee is now deferred to an indefinite future date. Management’s expectation that the book value of E&E assets at Nymagee, together with smaller E&E assets in the regional exploration portfolio, will be recouped through successful development is now uncertain. As such, these assets have been impaired to a nominal value representing security deposits recoverable upon relinquishment of tenement.
11. TRADE AND OTHER PAYABLES
Consolidated 2015 2014 $ $ Trade payables 6,101,969) 665,202) Accrued expenses 10,292,744) 8,074,501)
16,394,713) 8,739,703) Trade payables are non-interest bearing and generally payable on 7 to 30 day terms and due to the short term nature of these payables their carrying value is assumed to approximate their fair value.
F
or p
erso
nal u
se o
nly

AURELIA METALS LIMITED – ANNUAL REPORT 2015 59
12. PROVISIONS
Rehabilitation CBH Royalty Other Total At 1 July 2014 1,445,000 7,816,368 330,844 9,592,212 Arising during the year(a) 71,000 59,183 212,041 342,224 Paid during the year (192,306) (192,306) At 30 June 2015 1,516,000 7,683,245 542,885 9,742,130
Comprising: Current 2015 - 1,382,232 503,466 1,885,698 Non-current 2015 1,516,000 6,301,013 39,419 7,856,432 Total Provisions 2015 1,516,000 7,683,245 542,885 9,742,130 Current 2014 - 1,013,319 330,844 1,344,163 Non-current 2014 1,445,000 6,803,049 - 8,248,049 Total Provisions 2014 1,445,000 7,816,368 330,844 9,592,212
(a) The Group makes full provision for the future cost of rehabilitating the Hera mine site and related production facilities at the time of developing the mine and installing and using those facilities. The rehabilitation provision represents the present value of rehabilitation costs relating to mine sites, which are expected to be incurred up to July 2020. These provisions have been created based on Aurelia’s internal estimates. Assumptions based on the current economic environment have been made, which management believes are a reasonable basis upon which to estimate the future liability. These estimates are reviewed regularly to take into account any material changes to the assumptions. However, actual rehabilitation costs will ultimately depend upon future market prices for the necessary rehabilitation works required that will reflect market conditions at the relevant time. Furthermore, the timing of rehabilitation is likely to depend on when the mine ceases to produce at economically viable rates. This, in turn, will depend upon future gold, lead and zinc prices, which are inherently uncertain. During the period $71,000 (2014: $1,106,000) has been provided for as a result of further development at the Hera project site.
13. BORROWINGS
Consolidated 2015 2014 Current $ $ Finance leases(a) 426,685) 397,653) Insurance funding 80,407) -) Glencore borrowings 22,229,917) -) Total current borrowings 22,737,009) 397,653) Non-current Glencore borrowings: Facility A 20,000,000) 20,000,000) Facility B 50,000,000) 50,000,000) Facility C 30,000,000) 30,000,000) Facility E 5,000,000) 5,000,000) Glencore facilities drawn 105,000,000) 105,000,000) Add: Interest accrued on borrowings 12,245,821) 4,833,236) Total Glencore borrowings 117,245,821) 109,833,236) Less: Facility establishment costs (4,380,994) (5,354,518) Net Glencore borrowings 112,864,827) 104,478,718) Less: Current portion of Glencore borrowings (22,229,917) -) Net Glencore borrowings – non-current 90,634,910) 104,478,718) Add: Finance leases – non-current(a) 1,279,842) 1,706,527) Total non-current borrowings 91,914,752) 106,185,245)
a) Finance leases have been used to fund light vehicles, and some fixed and mobile plant for the crushing/screening circuit of the processing mill. Terms: Fixed monthly repayments in advance; Period three-five years; Fixed interest rates ranging between 6.66% - 7.13%; Nil residual.
The Glencore borrowings are fully secured against all mine property, plant and equipment assets.
F
or p
erso
nal u
se o
nly

AURELIA METALS LIMITED – ANNUAL REPORT 2015 60
The key terms of the Glencore loan facilities are summarised below:
Facility A Limit: A$20 million Converting Note Facility Conversion: Convertible at Aurelia’s option at $0.251 per share Interest Rate: 3M AUD BBSW + 4% Use of Funds:
Maturity Date: Drawdown Period:
Hera Development, Nymagee feasibility study and development, working capital 60 months after date of shareholder approval 12 months from date of shareholder approval
Facility B Limit: A$50 million Converting Note Facility Conversion: Convertible at Aurelia’s option at 60 day VWAP Price prior to conversion Interest Rate: 3M AUD BBSW + 4% Use of Funds:
Maturity Date: Drawdown Period:
Hera Development, Nymagee feasibility study and development, working capital 60 months after date of shareholder approval 12 months from date of shareholder approval
Facility C Limit: A$30 million Debt Facility Interest Rate: 3M AUD BBSW + 4.5% Use of Funds:
Maturity Date: Drawdown Period:
Hera Development, Nymagee feasibility study and development, working capital 60 months after date of shareholder approval 18 months from date of shareholder approval
Facility D Limit: A$50 million Debt Facility Interest Rate: 3M AUD BBSW + 4.5% Use of Funds:
Maturity Date: Drawdown Period:
Nymagee development 42 months after first drawdown 12 months after completion of approved Nymagee bankable feasibility study or earlier with Glencore consent
Facility E Limit: A$5m Debt Facility Interest Rate: 3M AUD BBSW + 4.5% Use of Funds: Purchase of precious and/or base metal option cover. Maturity Date: 42 months after first drawdown Drawdown Period: 12 months from date of shareholder approval As discussed in the overview section and Basis of Preparation 2A the Company has, after balance date, issued the lender with conversion notices to convert the outstanding balances of Facilities A and B into shares at set prices. As announced to ASX on 1 July 2015, Glencore lodged a notice of default, which if valid, would bar the debt conversion. The notice of default was given on the grounds that the secured lender believed or believes the Company to be insolvent. This has been rejected by the Company. Without the consultation of the Company’s Board, Glencore appointed a voluntary administrator to the Company and its subsidiaries on 14 September 2015. The Company sought and received from the Supreme Court of NSW on the 15 September 2015 a standstill. Under the standstill, the Company cannot exercise its rights to convert debt into equity (under the terms of the Convertible Notes Deed Poll), repayment obligations are suspended, and the secured lender is restrained from exercising its rights to enforce its security by appointing a voluntary administrator. The matter is to be heard by the Supreme Court on 14 October 2015.
F
or p
erso
nal u
se o
nly

AURELIA METALS LIMITED – ANNUAL REPORT 2015 61
14. CONTRIBUTED EQUITY
(a) Issued and paid up capital
Consolidated 2015 2014 $ $
Ordinary shares fully paid 9999,929,152) 85,361,160) (b) Movements in ordinary shares on issue
2015 Date Number of shares $
Opening balance 01-Jul-2014 328,322,918) 85,361,160) Issue of shares (i) 03-Oct-2014 5,590,027) 2,000,000) Issue of shares (ii) 03-Oct-2014 9,905,000) 3,226,311) Issue of shares (iii) 28-Jan-2015 42,977,243) 10,056,425) Less: Share issue costs (714,744) Closing balance 30-Jun-2015 386,795,188) 99,929,152) 2014 Opening balance 1-Jul-2013 262,669,890) 70,180,671) Issue of shares 13-Sep-2013 917,459) 183,492) Issue of shares 3-Oct-2013 332,541) 66,508) Issue of shares 14-Oct-2013 4,000,000) 1,160,000) Issue of shares 9-Dec-2013 874,126) 250,000) Issue of shares 10-Dec-2013 58,848,902) 14,323,823) Issue of shares 07-Apr-2014 680,000) -) Less: Share issue costs -) (803,334) Closing balance 30-Jun-2014 328,322,918 85,361,160)
(i) During the period AMI reached an agreement with its primary underground contractor, Pybar Mining Services Pty Ltd, to
issue shares as part payment for mining services rendered to the Company during July and August 2014. (ii) During the period AMI and Pacific Road agreed an amendment to the Share Subscription Agreement (‘SSA’) announced to
the ASX on 6 December 2013, and issued 2,778,050 shares at $0.2434 to raise $676,177 being the remaining Phase 1 shares under the SSA and 7,126,950 shares at $0.3578 to raise $2,549,880 being shares issued under Phase 2 of the amended SSA.
(iii) Fully underwritten 1 for 8 rights issue at $0.234 per share.
(c) Ordinary shares
Ordinary shares have the right to receive dividends as declared and, in the event of a winding up of the Parent, to participate in the proceeds from sale of all surplus assets in proportion to the number of and amounts paid up on shares held. Ordinary shares entitle their holder to one vote, either in person or proxy, at a meeting of the Company. (d) Capital management
The entity does not have a defined share buy-back plan or a dividend reinvestment plan. No dividends were paid in the year ending 30 June 2015.
F
or p
erso
nal u
se o
nly

AURELIA METALS LIMITED – ANNUAL REPORT 2015 62
15. RESERVES
Consolidated 2015 2014 $ $ Option and performance rights reserve 3,060,597 2,897,472 (a) Movements Carrying amount at beginning of financial year 2,897,472 2,396,118 Options and performance rights vested (previously issued) during the year 163,125 501,354 Carrying amount at the end of the financial year 3,060,597 2,897,472 (b) Details of options and performance rights issued or lapsed
2015 Date Number $ Opening balance 1-Jul-2014 5,560,000) 2,897,472) Expiry of 340,000 options at $0.40 31-Dec-2014 (340,000) -) Expiry of 950,000 options at $0.45 31-Dec-2014 (950,000) -) Expiry of 596,000 performance rights 4-Feb-2015 (596,000) -) Issue of 1,730,000 performance rights(i) 9-Feb-2015 1,730,000) -) Expiry of 696,000 performance rights 28-Apr-2015 (696,000) -) Expiry of 496,000 performance rights 29-Apr-2015 (496,000) -) Vesting of previously issued performance rights -) 163,125) Closing balance 30-Jun-2015 4,212,000) 3,060,597) 2014 Opening balance 1-Jul-2013 7,500,000) 2,396,118) Exercise of 680,000 performance rights 7-Apr-2014 (680,000) -) Expiry of 250,000 options at $0.35 9-Apr-2014 (250,000) -) Expiry of 750,000 options at $0.45 9-Apr-2014 (750,000) -) Expiry of 70,000 performance rights 9-Apr-2014 (70,000) -) Expiry of 190,000 performance rights 9-Apr-2014 (190,000) -) Vesting of previously issued performance rights -) 501,354) Closing balance 30-Jun-2014 5,560,000) 2,897,472)
(i) The Company Performance Right Plan imposes various restrictions on the sale of the shares upon the exercise of performance rights.
16. RETAINED LOSSES
Consolidated 2015 2014 Movements in retained losses were as follows: $ $ Balance at beginning of year (20,594,881) (9,971,440) Net loss attributable to members of Aurelia Metals Limited (118,158,448) (10,623,441) Balance at end of year (138,753,329) (20,594,881)
F
or p
erso
nal u
se o
nly

AURELIA METALS LIMITED – ANNUAL REPORT 2015 63
17. CASHFLOW STATEMENT
Consolidated 2015 2014 $ $ (a) Reconciliation of the net loss after tax to the net cash flows used in operating activities Net loss after tax (118,158,448) (10,623,441) Adjustments for: ) Share based payments 163,125) 501,354) Exploration and evaluation assets written off 3,347,093) 788,291) Impairment of exploration and evaluation assets 17,884,374) -) Impairment of producing mine assets 75,031,403) -) Depreciation and amortisation 6,659,359) 218,477) Gain on sale of PPE (19,940) -) Loss on revaluation of investments 287,231) 272,800) (Profit)/loss on revaluation of commodity derivatives 2,260,948) 6,318,966) Interest expense and amortisation of borrowing costs 2,656,142) -) GST not included in net loss 4,277,774) 7,932,547) Changes in assets and liabilities: -) -) (Increase)/decrease in receivables (5,269,211) 574,112) (Increase)/decrease in prepayments (27,981) 1,539) Increase/(decrease) in trade and other payables 7,329,206) 4,882,485) Increase/(decrease) in provisions 475,722) 1,137,655) Changes in asset and liability values not related to net loss 94,023) (5,604,105) Net cash flow from operating activities (3,009,180) 6,400,680) (b) Reconciliation of cash Cash at bank and in hand (i) 1,827,638) 9,420,959) Short-term deposits (ii) 3,020,000) 12,170,000) Total cash 4,847,638) 21,590,959)
(i) Of the $1,827,638 of cash at bank held at 30 June 2015 ($9,420,959 at 30 June 2014), $1,258,560 (30 June 2014: $11,265,799)
is held within Hera Resources Limited and subject to existing loan agreements is restricted for use by Hera Resources. (ii) Of the $3,020,000 short term deposits held at 30 June 2015 ($12,170,000 at 30 June 2014), $3,020,000 (30 June 2014:
$3,970,000) has been pledged as security, and cannot currently be withdrawn.
F
or p
erso
nal u
se o
nly
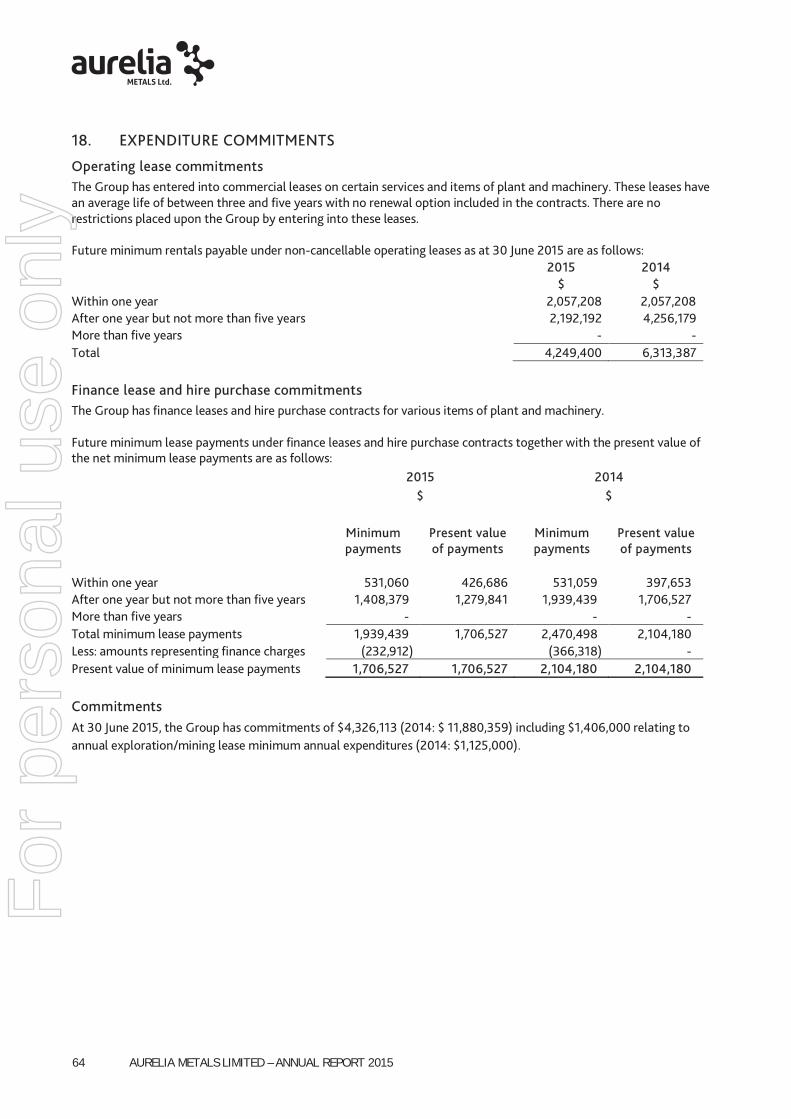
AURELIA METALS LIMITED – ANNUAL REPORT 2015 64
18. EXPENDITURE COMMITMENTS
Operating lease commitments The Group has entered into commercial leases on certain services and items of plant and machinery. These leases have an average life of between three and five years with no renewal option included in the contracts. There are no restrictions placed upon the Group by entering into these leases. Future minimum rentals payable under non-cancellable operating leases as at 30 June 2015 are as follows: 2015 2014 $ $ Within one year 2,057,208 2,057,208 After one year but not more than five years 2,192,192 4,256,179 More than five years - - Total 4,249,400 6,313,387
Finance lease and hire purchase commitments The Group has finance leases and hire purchase contracts for various items of plant and machinery. Future minimum lease payments under finance leases and hire purchase contracts together with the present value of the net minimum lease payments are as follows: 2015 2014 $ $
Minimum payments
Present value of payments
Minimum payments
Present value of payments
Within one year 531,060) 426,686 531,059) 397,653) After one year but not more than five years 1,408,379) 1,279,841 1,939,439) 1,706,527) More than five years -) -) -) Total minimum lease payments 1,939,439) 1,706,527 2,470,498) 2,104,180) Less: amounts representing finance charges (232,912) (366,318) -) Present value of minimum lease payments 1,706,527) 1,706,527 2,104,180) 2,104,180)
Commitments At 30 June 2015, the Group has commitments of $4,326,113 (2014: $ 11,880,359) including $1,406,000 relating to annual exploration/mining lease minimum annual expenditures (2014: $1,125,000).
F
or p
erso
nal u
se o
nly

AURELIA METALS LIMITED – ANNUAL REPORT 2015 65
19. SUBSEQUENT EVENTS
The key events after the balance date affecting the Company were: • 1 July 2015, received a notice on 26 June from Glencore Group Funding Limited (‘Glencore’) asserting that an
event of default had occurred under its loan facility documentation. The principal event of default asserted by Glencore was an alleged inability on the part of Aurelia and/or the other borrowers within the group to repay the amounts borrowed under the four separate facilities provided by Glencore. Aurelia rejected the notice and engaged in discussions with Glencore.
• 7 July 2015, deposited a conversion notice with Glencore Group Funding Limited (Glencore) in respect of its A$50,000,000 Facility B Converting Notes.
• From 23 July 2015 to 7 September 2015: during the period mutual ongoing agreements with Glencore extended the Conversion Date with respect of its A$50,000,000 Facility B Converting Notes from 31 July to 10th September 2015 and that Glencore agreed not to take any action to enforce any right it contends that it had as a consequence of the alleged event of default, before the 9th September 2015.
• 7 September 2015, deposited a conversion notice with Glencore Group Funding Limited (Glencore) in respect of its A$20,000,000 Facility A Converting Notes.
• 9 September 2015, improved Hera production performance with record gold production in July and August and a Term Sheet for a $6m Working Capital Facility and a $6m Standby Funding Facility executed with Pacific Road Capital Management.
• 16 September 2015, discussions with Glencore on a negotiated re-financing ceased. Without consultation, on Monday 14 September Glencore appointed a voluntary administrator to Aurelia and its subsidiaries on the grounds of alleged insolvency. The Company successfully obtained orders from the Supreme Court of NSW deeming that the appointment of the administrator is not effective (and the administrator has no power over Aurelia and its subsidiaries) until a court hearing on the validity of the appointment can be heard. An injunction has been granted by the court, pending a further hearing on 14 October 2015.
• 28 September 2015, $6m Working Capital Facility and a $6m convertible subordinated loan facility formally executed with Pacific Road together with entitlement to underwrite up to $25 million in new equity. Pybar agreed to adjusted payment terms for outstanding amounts owed to 31 January 2016.
Refer to the Operations and Financial Review for further detail on all subsequent events.
20. PROFIT/(LOSS) PER SHARE
Consolidated 2015 2014 $ $ Loss used in calculating basic and dilutive EPS (118,158,448) (10,623,441) Weighted average number of ordinary shares outstanding during the period used in the calculation of basic EPS 357,960,309) 255,224,325) Weighted average number of ordinary shares outstanding during the period used in the calculation of diluted EPS 362,172,309) 262,724,325) Basic loss per share (cents per share) (33.01) (3.54) Loss per share (cents per share) (33.01) (3.54)
21. AUDITOR’S REMUNERATION
The Auditor of Aurelia Metals Limited is Ernst & Young. Consolidated
2015 2014 Amounts received or due and receivable by Ernst & Young for: $ $ Audit or review of the financial report of the Company and any other entity in the Group 121,651) 86,383) There were no other services provided by Ernst & Young other than as disclosed above.
F
or p
erso
nal u
se o
nly

AURELIA METALS LIMITED – ANNUAL REPORT 2015 66
22. HERA PROJECT DEFFERED ACQUISITION COSTS
On 18 June 2009, the Company reached agreement to purchase a 100% interest in the Hera Project and an 80% interest in the adjacent Nymagee Joint Venture from CBH Resources Limited (CBH). The total cost of the acquisition was as follows:
• Initial purchase price of $12,000,000 paid in cash. • 5% gold royalty on gravity gold dore production from the Hera deposit, capped at 250,000 oz Au. • During the reporting period ending 30 June 2013, the Consolidated Entity made a payment of $1,000,000 to
amend the terms of the acquisition, which includes reducing the gold royalty from 5% to 4.5%. The Consolidated Entity has recorded deferred consideration of $7,683,245 ($7,816,368 at 30 June 2014) representing the net present value of projected royalty payments due under the revised terms of the acquisition, calculated based on information available as at 30 June 2015. The deferred consideration is revalued at each reporting date in accordance with AASB 3 with a through the profit and loss.
23. OPERATING SEGMENTS
Identification of reportable segments The Consolidated Entity has identified its operating segments based on the internal reports that are reviewed and used by the Managing Director and the Board of Directors (the chief operating decision makers) in assessing performance and in determining the allocation of resources. The Consolidated Entity operates entirely in the industry of exploration for and development of minerals in Australia. The operating segments are identified by management based on the size of the exploration tenement. The reportable segments are split between the Hera – Nymagee project, being the most significant current project of the Company, and all other tenements. Financial information about each of these segments is reported to the Managing Director and Board of Directors on a monthly basis. Corporate office activities are not allocated to operating segments and form part of the reconciliation to net loss after tax.
Accounting policies and inter-segment transactions The accounting policies used by the Company in reporting segments are the same as those contained in note 2A to the accounts. The following items are not allocated to operating segments as they are not considered part of the core operations of any segment:
• Interest and other income • Gain or loss on sale of financial assets • Research and development refund • Corporate costs • Depreciation and amortisation of property, plant and equipment
F
or p
erso
nal u
se o
nly

AURELIA METALS LIMITED – ANNUAL REPORT 2015 67
The following represents profit and loss and asset and liability information for reportable segments for the years ended 30 June 2015 and 30 June 2014.
Segment Results
Hera – Nymagee
project
Other Exploration
Projects Total $ $ $
Year ended 30 June 2015 Sales 13,220,208) - 13,220,208) Site EBITDA (6,565,384) - (6,565,384) Depreciation and amortisation (6,453,028) - (6,453,028) Impairment of mine properties (75,031,403) - (75,031,403) Impairment of exploration assets (17,884,374) - (17,884,374) Exploration costs written-off (3,347,093) (3,347,093) Segment net profit/(loss) after tax (105,934,189) (3,347,093) (109,281,282) Reconciliation of segment net profit/(loss) after tax to net profit/(loss) after tax: Interest income 279,680) Other income 24,667) Loss on revaluation of investments (287,231) Corporate operating costs (4,357,210) Loss on hedging, foreign exchange and derivatives (1,674,599) Interest and finance charges (2,656,142) Corporate depreciation and amortisation (206,331) Net loss after tax per the statement of comprehensive income (118,158,448) Year ended 30 June 2014 Segment loss - revaluation of financial asset (6,318,966)) -) (6,318,966) Deferred exploration costs written-off -) (788,291) (788,291) Segment net profit after tax (6,318,966)) (788,291) (7,107,257) Reconciliation of segment net loss after tax to net loss after tax Interest income 260,750) Other income -) Loss on sale/revaluation of investments in associates (272,800) Research and development refund 85,286) Corporate operating costs (3,370,943) Corporate asset depreciation and amortisation (218,477) Net profit after tax per the statement of comprehensive income (10,623,441)
F
or p
erso
nal u
se o
nly

AURELIA METALS LIMITED – ANNUAL REPORT 2015 68
Segment Results
Hera – Nymagee
project
Other Exploration
Projects Total $ $ $
Segment assets and liabilities for the year ended 30 June 2015 are as follows: Segment assets at 30 June 2015 Cash and cash equivalents 1,258,560 - 1,258,560 Trade and other receivables 5,309,666 - 5,309,666 Prepayments 45,180 - 45,180 Property, plant and equipment 56,956,173 - 56,956,173 Financial Assets - Inventory – ore/product in circuit 1,215,770 - 1,215,770 Materials on hand 1,476,792 - 1,476,792 Deferred exploration and evaluation expenditure 43,000 73,000 116,000 Mines Properties 33,306,747 - 33,306,747 99,611,888 73,000 99,684,888 Reconciliation of segment assets to total assets Cash and cash equivalents 3,589,079 Trade and other receivables 875,333 Prepayments 100,054 Corporate plant and equipment 502,870 Financial assets 272,800 Total assets per the balance sheet at 30 June 2015 105,025,024 Segment liabilities at 30 June 2015 Trade and other payables 16,370,761 - 16,370,761 Deferred acquisition costs – current 1,382,232 - 1,382,232 Deferred acquisition costs – non-current 6,301,013 - 6,301,013 Hera rehabilitation provision 1,516,000 - 1,516,000 Provisions 133,694 - 133,694 Insurance funding 80,407 80,407 Borrowings 114,571,354 - 114,571,354 140,355,461 - 140,355,461
Reconciliation of segment liabilities to total liabilities Trade and other payables 23,950 Provisions 409,193 Total liabilities per the balance sheet at 30 June 2015 140,788,604
F
or p
erso
nal u
se o
nly

AURELIA METALS LIMITED – ANNUAL REPORT 2015 69
Segment Results
Hera – Nymagee
project
Other Exploration
Projects Total $ $ $
Segment assets and liabilities for the year ended 30 June 2014 are as follows: Segment assets at 30 June 2014 Cash and cash equivalents 11,265,799 - 11,265,799 Trade and other receivables 22,630 - 22,630 Property, plant and equipment 315,002 - 315,002 Financial Assets 3,380,853 - 3,380,853 Inventory – Ore/product in circuit 2,349,771 - 2,349,771 Materials on hand 87,464 - 87,464 Deferred exploration and evaluation expenditure 15,913,268
3,315,263 19,228,531
Mines under development 143,408,631 - 143,408,631 176,743,418 3,315,263 180,058,681 Reconciliation of segment assets to total assets Cash and cash equivalents 10,325,160 Trade and other receivables 893,158 Prepayments 117,253 Corporate plant and equipment 624,281 Financial assets 560,031 Total assets per the balance sheet at 30 June 2014 192,578,564 Segment liabilities at 30 June 2014 Trade and other payables 16,370,761 - 16,370,761 Deferred acquisition costs – current 1,382,232 - 1,382,232 Deferred acquisition costs – non-current 6,301,013 - 6,301,013 Hera rehabilitation provision 1,516,000 - 1,516,000 Provisions 133,694 - 133,694 Insurance funding 47,623 47,623 Borrowings 114,571,354 - 114,571,354 140,322,677 - 140,322,677 Reconciliation of segment liabilities to total liabilities
Trade and other payables 685,505 Provisions 330,844 Total liabilities per the balance sheet at 30 June 2014 124,914,813 (1) Geographic and revenue diversity information During the period the $6.232 million of gold and silver revenue was derived from customers in Australia and base metal revenue of $6.988 million was derived from countries outside of Australia. The Company has base metal concentrate offtake agreements with Glencore. During the period approximately 52% of revenue relied on the sale and purchase of base metal concentrate from Glencore.
F
or p
erso
nal u
se o
nly
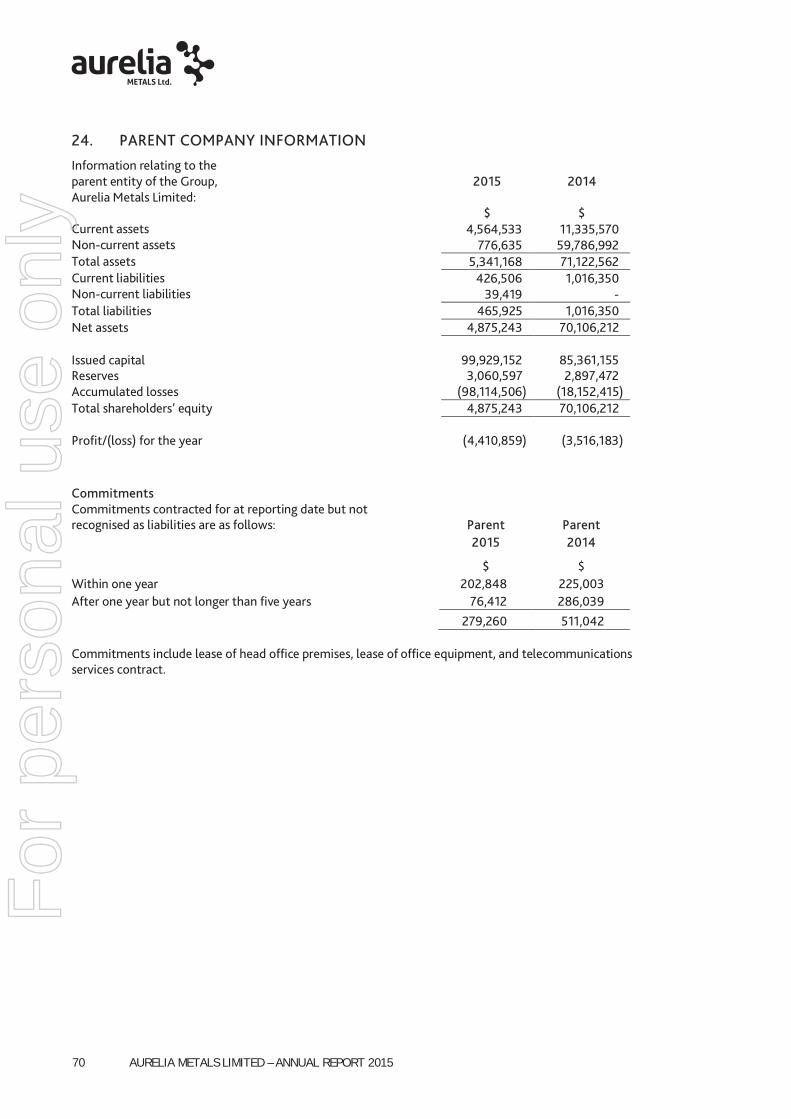
AURELIA METALS LIMITED – ANNUAL REPORT 2015 70
24. PARENT COMPANY INFORMATION
Information relating to the parent entity of the Group, Aurelia Metals Limited:
2015
2014
$ $ Current assets 4,564,533) 11,335,570) Non-current assets 776,635) 59,786,992) Total assets 5,341,168) 71,122,562) Current liabilities 426,506) 1,016,350) Non-current liabilities 39,419) -) Total liabilities 465,925) 1,016,350) Net assets 4,875,243) 70,106,212) Issued capital 99,929,152) 85,361,155) Reserves 3,060,597) 2,897,472) Accumulated losses (98,114,506) (18,152,415) Total shareholders’ equity 4,875,243) 70,106,212) Profit/(loss) for the year (4,410,859) (3,516,183)
Commitments Commitments contracted for at reporting date but not recognised as liabilities are as follows: Parent Parent 2015 2014
$ $ Within one year 202,848 225,003 After one year but not longer than five years 76,412 286,039 279,260 511,042 Commitments include lease of head office premises, lease of office equipment, and telecommunications services contract.
F
or p
erso
nal u
se o
nly

AURELIA METALS LIMITED – ANNUAL REPORT 2015 71
25. FINANCIAL RISK MANAGEMENT OBJECTIVES AND POLICIES
The Group’s management of financial risk aims to ensure cash flows are sufficient to: • Withstand significant changes in cash flow at risk scenarios and still meet all financial commitments as and
when they fall due; and • Maintain the capacity to fund project development, exploration and acquisition strategies.
The Group continually monitors and tests its forecast financial position against these criteria. The key financial risk exposures are liquidity risk, credit risk, and market risk (including foreign exchange risk, commodity price risk and interest rate risk). The Directors are responsible for monitoring and managing financial risk exposures of the Group. The Group’s financial instruments consist mainly of borrowings, deposits with banks, derivatives, payables and receivables. The Group holds the following financial instruments: The Group holds the following financial instruments: 2015 2014 Financial Assets $ $ Cash at bank 1,827,638 9,420,959 Term deposits 3,020,000 12,170,000 Receivables 6,184,999 915,788 Derivatives (Put Options) - 3,380,853 Other financial assets 272,800 560,031 Total financial assets 11,305,437 26,447,631 Financial Liabilities Trade and other payables 16,394,713 8,739,703 Borrowings 114,651,761 106,582,898 Total financial liabilities 131,046,474 115,322,601
a) Liquidity Risk Liquidity risk arises from the possibility that the group might encounter difficulty in settling its debts or otherwise meeting its obligations related to financial liabilities. The Company has significant short and long term financial obligations. The primary risk factor relates to the Company’s ability to reorganise its debts when required to manage any foreseen or unforeseen liquidity events. As detailed in the Accounting Policy 2(a) Basis of Preparation, the Company is currently in dispute with its major lender who has lodged a default notice and declared all amounts owning are immediately due and payable. The Company has rejected this notice and as the date of this report is currently in a court ordered standstill with its secured lender. Under the standstill, the Company cannot exercise its rights to convert debt into equity (under the terms of the Convertible Notes Deed Poll), repayment obligations are suspended, and the secured lender is restrained from exercising its rights to enforce its security by appointing a voluntary administrator. The Company’s operation remains in a state of ramp-up after initial commissioning. Liquidity risk is managed through maximising operational cash flow, negotiation of its current debt commitments and a reliance on equity funding from its shareholders or other market participants.
F
or p
erso
nal u
se o
nly

AURELIA METALS LIMITED – ANNUAL REPORT 2015 72
Maturities of financial liabilities: Payables: Trade and other payables are expected to be settled within 12 months. Borrowings: The table below shows the Group’s financial arrangements at 30 June 2015 in their relevant contractual maturity groupings. The contractual maturity of loans for 2015 exclude $4.381 million of facility establishment costs (2014: $5.355 million). 2015
2014 Contractual maturities of loans
<1 Year
1-2 Years
2-3 Years
3-4 Years
4-5 Years
Total
Glencore Facility A matures 5/3/18
- 13,962,375 7,684,106 - - 21,646,481
Glencore Facility B matures 5/3/18
- 6,534,091 13,659,333
32,134,713 - 52,328,137
Glencore Facility C matures 5/3/18
- 3,706,907 5,963,490 20,745,124 - 30,415,521
Glencore Facility E matures 15/8/16
- 1,352,246 4,090,851 - - 5,443,097
Equipment Loans 397,653 426,685 449,007 419,349 411,486 2,104,180 Total 397,653 25,982,304 31,846,787 53,299,186 411,486 111,937,416 b) Credit Risk Exposures
Credit risk represents the loss that would be recognised if counterparties failed to perform as contracted. The credit risk on financial assets of the entity which have been recognised in the Consolidated Statement of Financial Position is the carrying amount, net of any provision for doubtful debts. Credit risk is managed through the maintenance of procedures which ensure, to the extent possible, that counterparties to transactions are of sound creditworthiness. Such monitoring is used in assessing receivables for impairment. No receivables are considered past due or impaired.
Contractual maturities of loans
<1 Year
1-2 Years
2-3 Years
3-4 Years
4-5 Years
Total
Glencore Facility A matures 15/3/18
3,264,125 4,853,098 14,937,264 - - 23,054,487
Glencore Facility B matures 15/3/18 7,896,776
11,740,924 36,137,174 - - 55,774,874
Glencore Facility C matures 15/3/18
4,614,411 6,860,706 21,116,877 - - 32,591,994
Glencore Facility E matures 15/8/16
2,173,776 3,650,690 - - - 5,824,466
Equipment Loans 426,685 449,007 419,349 411,486 - 1,706,527 Insurance Fund 80,407 - - - - 80,407 Total 18,456,180 27,554,425 72,610,664 411,486 - 119,032,755
F
or p
erso
nal u
se o
nly

AURELIA METALS LIMITED – ANNUAL REPORT 2015 73
c) Market Risk Exposures i) Foreign Currency Risk
The Group undertakes transactions impacted by foreign currencies; hence exposures to exchange rate fluctuations arise. Although the majority of the Group costs, including development expenditure, are in Australian dollars many of these costs are affected either directly or indirectly by movements in exchange rates. Revenue during the year from the sale of commodities in 2015 most of the revenue will be affected by movements in the USD:AUD exchange rate.
Currently the Group does not hedge against this risk. The group considers the effects of foreign currency risk on its financial position and financial performance and assesses its option to hedge based on current economic conditions and available market data.
The foreign currency exposure to revenue in the period to a 10% change in US$ exchange rate was approximately 10% and was immaterial to net income. The majority of sales, 100% in the case of gold and 75% to 80% in the case of base metals, are immediately converted to Australian dollars at the time of sale.
ii) Commodity Price Risk
The Group’s revenue is exposed to commodity price fluctuations, particularly gold, lead and zinc prices. Price risk relates to the risk that the fair value of future cash flows of commodity sales will fluctuate because of changes in market prices largely due to supply and demand factors for commodities. The Group is exposed to commodity price risk due to the sale of gold, lead, zinc and copper on physical prices determined by the market at the time of sale.
Gold price risk is managed, from time to time and as required and deemed appropriate by the Board, with the use of hedging strategies through the purchase of put options or forward sale contracts. These contracts can establish a minimum commodity price denominated in either US$ or A$ over part of the group’s future metal production.
Gold put options, gold forward sales and base metal quotational period hedging was used throughout the year. At balance date, there are no hedging products in existence.
During the financial year gold sales were to 3,924 ounces, therefore the effect on the income statement to changes in gold price were immaterial, with a 10% price movement impacting gold revenue by 10% but impacting net income by less than 1%. Likewise with payable lead sold in the year of 2,338 tonnes and payable zinc sold in the year of 1,983 tonnes, the sensitivity to lead and zinc revenue with a 10% price movement was approximately 15% to base metal revenue but impacting net income by less than 1%. iii) Interest Rate Risk
Exposure to interest rate risk arises on financial assets and liabilities recognised at reporting date whereby a future change in interest rates will affect future cash flows or the fair value of fixed rate financial instruments. The group has long term financial liabilities on which it pays interest and also holds cash and short term deposits on which it receives interest.
The Group has not entered in any hedging activities to cover interest rate risk. The Group continually analyses its exposure to interest rate risk. Consideration is given to alternative financing options, potential renewal of existing positions, alternative investments and the mix of fixed and variable interest rates.
The Group has performed a sensitivity analysis relating to its exposure to interest rate risk at balance date. This sensitivity analysis demonstrates the effect on the current year income result which could result from a change in interest rates.
The following table demonstrates the impact on Income before tax, due to a reasonably possible change in interest rates over the year by +/– 2 %, on the major secured debts of the Company (with all other variables held constant). Trade and other receivables, payables, derivatives and available for sale assets, are not interest bearing.
F
or p
erso
nal u
se o
nly
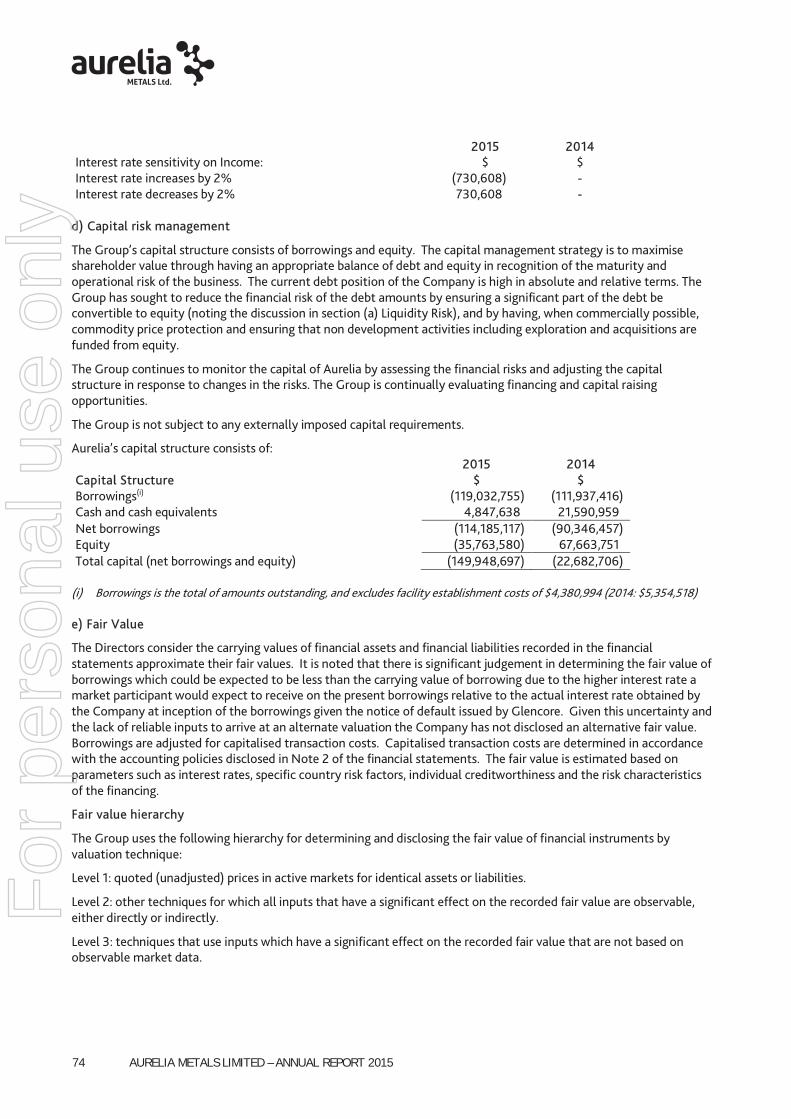
AURELIA METALS LIMITED – ANNUAL REPORT 2015 74
2015 2014 Interest rate sensitivity on Income: $ $ Interest rate increases by 2% (730,608) - Interest rate decreases by 2% 730,608) -
d) Capital risk management
The Group’s capital structure consists of borrowings and equity. The capital management strategy is to maximise shareholder value through having an appropriate balance of debt and equity in recognition of the maturity and operational risk of the business. The current debt position of the Company is high in absolute and relative terms. The Group has sought to reduce the financial risk of the debt amounts by ensuring a significant part of the debt be convertible to equity (noting the discussion in section (a) Liquidity Risk), and by having, when commercially possible, commodity price protection and ensuring that non development activities including exploration and acquisitions are funded from equity.
The Group continues to monitor the capital of Aurelia by assessing the financial risks and adjusting the capital structure in response to changes in the risks. The Group is continually evaluating financing and capital raising opportunities.
The Group is not subject to any externally imposed capital requirements.
Aurelia’s capital structure consists of: 2015 2014 Capital Structure $ $ Borrowings(i) (119,032,755) (111,937,416) Cash and cash equivalents 4,847,638) 21,590,959) Net borrowings (114,185,117) (90,346,457) Equity (35,763,580) 67,663,751) Total capital (net borrowings and equity) (149,948,697) (22,682,706)
(i) Borrowings is the total of amounts outstanding, and excludes facility establishment costs of $4,380,994 (2014: $5,354,518)
e) Fair Value
The Directors consider the carrying values of financial assets and financial liabilities recorded in the financial statements approximate their fair values. It is noted that there is significant judgement in determining the fair value of borrowings which could be expected to be less than the carrying value of borrowing due to the higher interest rate a market participant would expect to receive on the present borrowings relative to the actual interest rate obtained by the Company at inception of the borrowings given the notice of default issued by Glencore. Given this uncertainty and the lack of reliable inputs to arrive at an alternate valuation the Company has not disclosed an alternative fair value. Borrowings are adjusted for capitalised transaction costs. Capitalised transaction costs are determined in accordance with the accounting policies disclosed in Note 2 of the financial statements. The fair value is estimated based on parameters such as interest rates, specific country risk factors, individual creditworthiness and the risk characteristics of the financing.
Fair value hierarchy
The Group uses the following hierarchy for determining and disclosing the fair value of financial instruments by valuation technique:
Level 1: quoted (unadjusted) prices in active markets for identical assets or liabilities.
Level 2: other techniques for which all inputs that have a significant effect on the recorded fair value are observable, either directly or indirectly.
Level 3: techniques that use inputs which have a significant effect on the recorded fair value that are not based on observable market data.
F
or p
erso
nal u
se o
nly
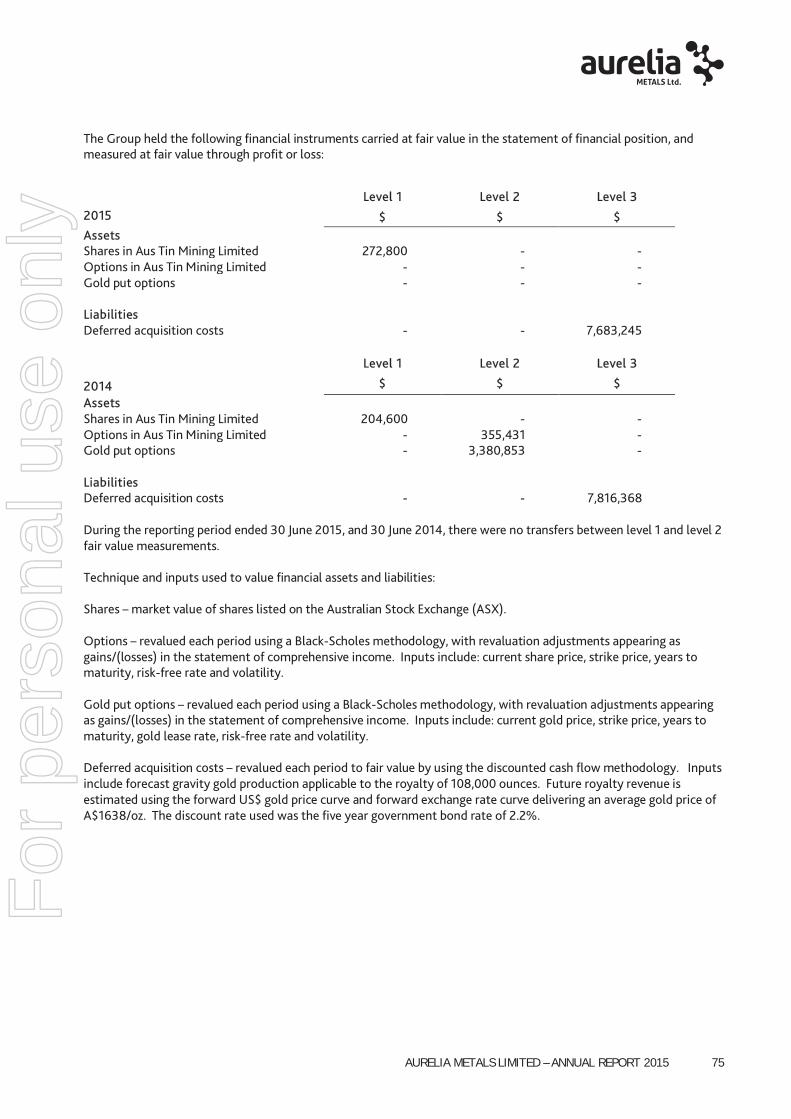
AURELIA METALS LIMITED – ANNUAL REPORT 2015 75
The Group held the following financial instruments carried at fair value in the statement of financial position, and measured at fair value through profit or loss:
Level 1 Level 2 Level 3 2015 $ $ $ Assets Shares in Aus Tin Mining Limited 272,800 - - Options in Aus Tin Mining Limited - - - Gold put options - - - Liabilities Deferred acquisition costs - - 7,683,245 Level 1 Level 2 Level 3
2014 $ $ $ Assets Shares in Aus Tin Mining Limited 204,600 - - Options in Aus Tin Mining Limited - 355,431 - Gold put options - 3,380,853 - Liabilities Deferred acquisition costs - - 7,816,368 During the reporting period ended 30 June 2015, and 30 June 2014, there were no transfers between level 1 and level 2 fair value measurements. Technique and inputs used to value financial assets and liabilities: Shares – market value of shares listed on the Australian Stock Exchange (ASX). Options – revalued each period using a Black-Scholes methodology, with revaluation adjustments appearing as gains/(losses) in the statement of comprehensive income. Inputs include: current share price, strike price, years to maturity, risk-free rate and volatility. Gold put options – revalued each period using a Black-Scholes methodology, with revaluation adjustments appearing as gains/(losses) in the statement of comprehensive income. Inputs include: current gold price, strike price, years to maturity, gold lease rate, risk-free rate and volatility. Deferred acquisition costs – revalued each period to fair value by using the discounted cash flow methodology. Inputs include forecast gravity gold production applicable to the royalty of 108,000 ounces. Future royalty revenue is estimated using the forward US$ gold price curve and forward exchange rate curve delivering an average gold price of A$1638/oz. The discount rate used was the five year government bond rate of 2.2%.
F
or p
erso
nal u
se o
nly

AURELIA METALS LIMITED – ANNUAL REPORT 2015 76
26. SHARE BASED PAYMENT ARRANGEMENTS
(a) Recognised share based payments expenses The expense recognised for executive and employee services received during the year is shown in the table below:
Consolidated 2015 2014 $ $ Expenses arising from the equity settled share based payment transactions - eligible employees and directors
163,125
501,354
(b) Type of share based payment plan Employee Share Option Plan and Performance Rights Plan The Company has established an Employee Share Option Plan (ESOP) and a Performance Rights Plan. The objective of these is to assist in the recruitment, reward, retention and motivation of employees of Aurelia Metals. An individual may receive the options or nominate a relative or associate to receive the options. The plans are open to directors and eligible employees of Aurelia Metals.
(a) Options and performance rights granted as at 30 June 2015
Grant Date Expiry Date
Exercise Price
Balance at start of the
year Number
Granted during the
year Number
Exercised during the
year Number
Forfeited or Lapsed
during the year Number
Balance at the end of
the year Number
Exercisable at the end of
the year Number
6-May-11 31-Dec-14 $0.40 340,000 - - 340,000 - - 6-May-11 31-Dec-14 $0.45 950,000 - - 950,000 - -
15-Mar-12 15-Mar-16 - 840,000 - - - 840,000 - 29-Nov-12 29-Nov-15 $0.35 1,600,000 - - - 1,600,000 1,600,000 29-Nov-12 29-Nov-15 $0.45 1,100,000 - - - 1,100,000 1,100,000 12-Apr-13 18-Jun-16 - 730,000 - 500,000 96,000 134,000 134,000 9-Feb-15 9-Feb-22 - - 1,730,000 696,000 496,000 538,000 538,000
5,560,000 1,730,000 1,196,000 1,882,000 4,212,000 3,372,000
Weighted average exercise price 0.41 - - 0.30 0.25 0.39
(b) Options and performance rights granted as at 30 June 2014
Grant Date Expiry Date
Exercise Price
Balance at start of the
year Number
Granted during the
year Number
Exercised during the
year Number
Lapsed during the
year Number
Balance at the end of
the year Number
Exercisable at the end of
the year Number
6-May-11 31-Dec-14 $0.40 340,000 - - - 340,000 340,000 6-May-11 31-Dec-14 $0.45 950,000 - - - 950,000 950,000
15-Mar-12 15-Mar-16 - 840,000 - - - 840,000 - 29-Nov-12 29-Nov-15 $0.35 1,850,000 - - 250,000 1,600,000 1,600,000 29-Nov-12 29-Nov-15 $0.45 1,850,000 - - 750,000 1,100,000 - 12-Apr-13 18-Jun-16 - 1,670,000 - 680,000 260,000 730,000 80,000
7,500,000 - 680,000 1,260,000 5,560,000 2,970,000
Weighted average exercise price 0.41 - - 0.43 0.41 0.39
(c) Weighted average remaining contractual life
The weighted average remaining contractual life for the options outstanding as at 30 June 2015 is 1.3 years (2014: 1.3 years).
F
or p
erso
nal u
se o
nly

AURELIA METALS LIMITED – ANNUAL REPORT 2015 77
(d) Fair value of options granted
There were no options issued during the year. (e) Fair value of performance rights
During the year there were 1,740,000 Performance Rights issued with various share price and operational performance measure performance hurdles. As at the date of this report, there were 1,512,000 un-issued ordinary shares subject to performance rights. The performance rights are unlisted and have terms as set out below.
Number of Performance
Rights
Expiry Performance Hurdle
840,000 15-Mar-2016 5 Day Aurelia VWAP of 80 cents per share 134,000 18-Jun-2016 Various share price and operational performance measures 538,000 9-Feb-2022 Various share price and operational performance measures
1,512,000
27. CONTIGENT LIABILITIES
There are no contingent liabilities that require disclosure.
28. DIVIDENDS
No dividend was paid or declared by the Company in the period since the end of the previous financial year, and up to the date of this report. The Directors do not recommend that any amount be paid by way of dividend for the financial year ended 30 June 2015. The balance of the Company’s franking account is nil (2014: Nil).
29. KEY MANAGEMENT PERSONNEL
Share, option and performance rights holdings of directors, executives and key management personnel Consolidated 2015 2014 $ $ Short-term employee benefits 1,985,499 1,577,826 Post-employment benefits 141,338 115,041 Share based payments 155,450 188,418 Total 2,282,287 1,881,285
(i) Share holdings For details of shareholdings, refer to the remuneration report section of the Directors Report (page 28 of this report). (ii) Options and performance rights holdings For details of options and performance rights holdings, refer to the remuneration report section of the Directors Report (page 28 of this report).
F
or p
erso
nal u
se o
nly
Aurelia Metals Limited
AURELIA METALS LIMITED – ANNUAL REPORT 2015 78
DIRECTORS’ DECLARATION In accordance with a resolution of the Directors of Aurelia Metals Limited, we state that:
In the opinion of the Directors:
(a) The financial statements and notes of the consolidated entity are in accordance with the Corporations Act 2001, including:
(i) Giving a true and fair view of the consolidated entity’s financial position as at 30 June 2015 and of its performance for the year ended on that date; and
(ii) Complying with Australian Accounting Standards (including the Australian Accounting Interpretations) and the Corporations Regulations 2001;
(b) The Financial Statements and notes also comply with International Financial Reporting Standards as disclosed in Note 2A (b); and
(c) There are reasonable grounds to believe that the Company will be able to pay its debts as and when they become due and payable.
(d) This declaration has been made after receiving the declarations required to be made to the Directors in accordance with section 295A of the Corporations Act 2001 for the Financial Year Ending 30 June 2015.
On behalf of the Board
Anthony Wehby Non-Executive Chairman 30 September 2015
For
per
sona
l use
onl
y

A member firm of Ernst & Young Global Limited Liability limited by a scheme approved under Professional Standards Legislation
680 George Street Sydney NSW 2000 Australia GPO Box 2646 Sydney NSW 2001
Tel: +61 2 9248 5555 Fax: +61 2 9248 5959 ey.com/au
Auditor’s Independence Declaration to the Directors of Aurelia Metals Limited
In relation to our audit of the financial report of Aurelia Metals Limited for the financial year ended 30 June 2015, to the best of my knowledge and belief, there have been no contraventions of the auditor independence requirements of the Corporations Act 2001 or any applicable code of professional conduct.
Ernst & Young
Ryan Fisk Partner Sydney 30 September 2015
AURELIA METALS LIMITED – ANNUAL REPORT 2015 79
For
per
sona
l use
onl
y

A member firm of Ernst & Young Global Limited Liability limited by a scheme approved under Professional Standards Legislation
Ernst & Young 680 George Street Sydney NSW 2000 Australia GPO Box 2646 Sydney NSW 2001
Tel: +61 2 9248 5555 Fax: +61 2 9248 5959 ey.com/au
Independent auditor's report to the members of Aurelia Metals Limited
Report on the financial report
We have audited the accompanying financial report of Aurelia Metals Limited, which comprises the consolidated statement of financial position as at 30 June 2015, the consolidated statement of comprehensive income, the consolidated statement of changes in equity and the consolidated statement of cash flows for the year then ended, notes comprising a summary of significant accounting policies and other explanatory information, and the directors' declaration of the consolidated entity comprising the company and the entities it controlled at the year's end or from time to time during the financial year.
Directors' responsibility for the financial report
The directors of the company are responsible for the preparation of the financial report that gives a true and fair view in accordance with Australian Accounting Standards and the Corporations Act 2001 and for such internal controls as the directors determine are necessary to enable the preparation of the financial report that is free from material misstatement, whether due to fraud or error. In Note 2, the directors also state, in accordance with Accounting Standard AASB 101 Presentation of Financial Statements, that the financial statements comply with International Financial Reporting Standards.
Auditor's responsibility
Our responsibility is to express an opinion on the financial report based on our audit. We conducted our audit in accordance with Australian Auditing Standards. Those standards require that we comply with relevant ethical requirements relating to audit engagements and plan and perform the audit to obtain reasonable assurance about whether the financial report is free from material misstatement.
An audit involves performing procedures to obtain audit evidence about the amounts and disclosures in the financial report. The procedures selected depend on the auditor's judgment, including the assessment of the risks of material misstatement of the financial report, whether due to fraud or error. In making those risk assessments, the auditor considers internal controls relevant to the entity's preparation and fair presentation of the financial report in order to design audit procedures that are appropriate in the circumstances, but not for the purpose of expressing an opinion on the effectiveness of the entity's internal controls. An audit also includes evaluating the appropriateness of accounting policies used and the reasonableness of accounting estimates made by the directors, as well as evaluating the overall presentation of the financial report.
We believe that the audit evidence we have obtained is sufficient and appropriate to provide a basis for our audit opinion.
Independence
In conducting our audit we have complied with the independence requirements of the Corporations Act 2001. We have given to the directors of the company a written Auditor’s Independence Declaration, a copy of which is included in the directors’ report.
80 AURELIA METALS LIMITED – ANNUAL REPORT 2015
For
per
sona
l use
onl
y
A member firm of Ernst & Young Global Limited Liability limited by a scheme approved under Professional Standards Legislation
Opinion
In our opinion:
a. the financial report of Aurelia Metals Limited is in accordance with the Corporations Act 2001,including:
i giving a true and fair view of the consolidated entity's financial position as at 30 June 2015 and of its performance for the year ended on that date; and
ii complying with Australian Accounting Standards and the Corporations Regulations 2001; and
b. the financial report also complies with International Financial Reporting Standards as disclosedin Note 2.
Emphasis of matters
Without qualifying our conclusion, we draw attention to Note 2 (a)(i) in the financial report which describes the principal conditions that raise doubt about the entity’s ability to continue as a going concern. As a result of these matters, there is significant uncertainty whether the consolidated entity will continue as a going concern, and therefore whether it will realise its assets and extinguish its liabilities in the normal course of business and at the amounts stated in the financial report. The financial report does not include any adjustments relating to the recoverability and classification of recorded asset amounts or to the amounts and classification of liabilities that might be necessary should the company not continue as a going concern.
We also draw attention to Note 2 (a)(ii) of the financial statements which describes the uncertainty relating to the outcome of the Court hearing, and the possible impacts on the classification of the entity’s non-current borrowings if the event of default is validated. The financial report does not include any adjustments that may be required if the decision of the Court results in the entity being required to repay any or all of the non-current borrowings in less than twelve months.
Report on the remuneration report
We have audited the Remuneration Report included in the directors' report for the year ended 30 June 2015. The directors of the company are responsible for the preparation and presentation of the Remuneration Report in accordance with section 300A of the Corporations Act 2001. Our responsibility is to express an opinion on the Remuneration Report, based on our audit conducted in accordance with Australian Auditing Standards.
AURELIA METALS LIMITED – ANNUAL REPORT 2015 81
F
or p
erso
nal u
se o
nly

A member firm of Ernst & Young Global Limited Liability limited by a scheme approved under Professional Standards Legislation
Opinion
In our opinion, the Remuneration Report of Aurelia Metals Limited for the year ended 30 June 2015, complies with section 300A of the Corporations Act 2001.
Ernst & Young
Ryan Fisk Partner Sydney 30 September 2015
AURELIA METALS LIMITED – ANNUAL REPORT 2015 82
For
per
sona
l use
onl
y
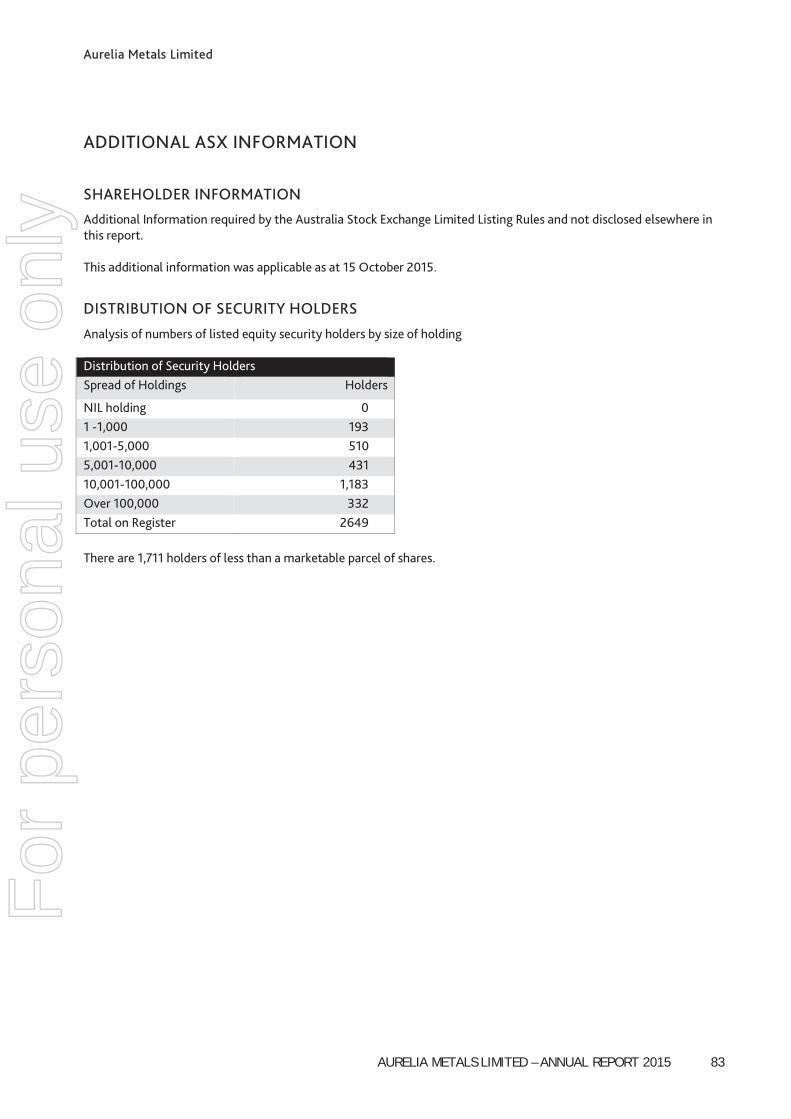
Aurelia Metals Limited
AURELIA METALS LIMITED – ANNUAL REPORT 2015 83
ADDITIONAL ASX INFORMATION
SHAREHOLDER INFORMATION
Additional Information required by the Australia Stock Exchange Limited Listing Rules and not disclosed elsewhere in this report. This additional information was applicable as at 15 October 2015.
DISTRIBUTION OF SECURITY HOLDERS
Analysis of numbers of listed equity security holders by size of holding Distribution of Security Holders Spread of Holdings Holders
NIL holding 0 1 -1,000 193 1,001-5,000 510 5,001-10,000 431 10,001-100,000 1,183 Over 100,000 332 Total on Register 2649 There are 1,711 holders of less than a marketable parcel of shares.
For
per
sona
l use
onl
y

Aurelia Metals Limited
AURELIA METALS LIMITED – ANNUAL REPORT 2015 84
AMI STATEMENT OF TOP 20 SHAREHOLDERS
HOLDER NAME SHARES PERCENTAGE OF ISSUED SHARES
1 PACIFIC ROAD CAPITAL 93,414,913 24.08 2 YUNNAN TIN AUSTRALIA 30,630,504 7.89 3 PYBAR HOLDINGS PTY LIMITED 19,438,850 5.01 4 PERSHING AUSTRALIA NOMINEES 16,560,316 4.27 5 HSBC CUSTODY NOMINEES 14,881,404 3.84 6 YUNNAN TIN (YTC) HOLDINGS PTY 12,141,905 3.13 7 GLENCORE AUSTRALIA HOLDINGS 9,390,000 2.42 8 1215 CAPITAL PTY LTD 7,219,569 1.86 9 LUJETA PTY LTD 6,000,000 1.55 10 SMIFF PTY LTD 4,167,244 1.07 11 BNP PARIBAS NOMS (NZ) LTD 3,606,359 0.93 12 JOJO ENTERPRISES PTY LTD 3,461,000 0.89 13 NINETEEN25 PTY LIMITED 3,350,000 0.86 14 MR STEPHEN CANSDELL HIRST 2,900,000 0.75 15 MR BRIAN HENRY MCCUBBING & 2,700,000 0.70 16 J P MORGAN NOMINEES AUSTRALIA 2,615,195 0.67 17 B&M JACKSON PTY LTD 2,541,045 0.65 18 PERSHING AUSTRALIA NOMINEES 2,010,249 0.52 19 MR DONALD JEFFREY SMITH & 2,000,000 0.52 20 B & R JAMES INVESTMENTS 2,000,000 0.52 TOP 20 TOTAL 241,028,553 62.13 OTHER SHAREHOLDERS 146,962,635 37.87 TOTAL ON ISSUE 387,991,188 100.00
For
per
sona
l use
onl
y

Aurelia Metals Limited
AURELIA METALS LIMITED – ANNUAL REPORT 2015 85
STATEMENT OF RESTRICTED SECURITIES
There are no Restricted Securities.
SUBSTANTIAL SHAREHOLDERS
Substantial Shareholders of the Company are as follows;
Substantial Shareholders Pacific Road Capital Management Pty Ltd ATF the YTC Managed Investment Trust
93,414,913
Glencore Australia Holdings Pty Ltd* 25,950,316 Yunnan Tin Aust TDK Resources Pty Ltd** 24,237,433
* The Holder is a member of the Glencore International Group **The Holder is a wholly owned subsidiary of Yunnan Tin Company Group Limited The number of securities disclosed above is as per substantial notices given to the Company. Substantial shareholder interests in securities may change without requiring the Holder to provide notice of the change, therefore resulting in a difference between their disclosure and other disclosures in this report.
UNQUOTED SECURITIES
Holder # Options over Ordinary Shares
Expiry Date Exercise Price
Director Options 1,600,000 29-11-2015 $0.35 Director Options 1,100,000 29-11-2015 $0.45 Performance Rights 840,000 15-03-2015 Nil Performance Rights 70,000 18-06-2016 Nil Performance Rights 490,000 09-02-2022 Nil Performance Rights 48,000 09-02-2022 Nil Performance Rights 64,000 18-06-2016 Nil Total Unlisted Securities on Issue 3,674,000
VOTING RIGHTS
The Voting Right attached to each class of equity security are as follows; Ordinary Shares Each ordinary share is entitled to one vote when a poll is called otherwise each member present at a meeting or by proxy has one vote on a show of hands. Options These securities have no voting rights.
For
per
sona
l use
onl
y

Aurelia Metals Limited
AURELIA METALS LIMITED – ANNUAL REPORT 2015 86
SCHEDULE OF TENEMENT INTERESTS Tenement Project Name Location Holder Size (km2) Expiry Date Notes
ML53 Nymagee Mine Nymagee NSW Nymagee Resources Pty Ltd 0.04867 31/12/2013 Expired, renewal pending
ML90 Nymagee Mine Nymagee NSW Nymagee Resources Pty Ltd 0.3391 31/12/2013 Expired, renewal pending
ML5295 Nymagee Mine Nymagee NSW Nymagee Resources Pty Ltd 0.003339 31/12/2013 Expired, renewal pending
ML5828 Nymagee Mine Nymagee NSW Nymagee Resources Pty Ltd 0.01538 31/12/2013 Expired, renewal pending
PLL847 Nymagee Mine Nymagee NSW Nymagee Resources Pty Ltd 0.1227 31/12/2013 Expired, renewal pending
EL4232 Nymagee Nymagee NSW Nymagee Resources Pty Ltd 14.5 16/03/2015 Expired, renewal pending
EL4458 Nymagee Mine Nymagee NSW Nymagee Resources Pty Ltd 11.6 16/09/2015
ML1686 Hera Mine Nymagee NSW Hera Resources Pty Ltd 13.079 16/05/2034
EL6162 Hera Nymagee NSW Hera Resources Pty Ltd 130 25/11/2018
EL6226 Kadungle 70km north-west of Parkes, central-west NSW
Defiance Resources Pty Ltd 43.5 5/04/2016 Being disposed of
EL6258 Doradilla 50km southeast of Bourke, north-west NSW
Stannum Pty Ltd 110.2 20/06/2017 Being disposed of
EL6673 Baldry 32km north-east of Parkes, central-west NSW
Defiance Resources Pty Ltd 69.6 4/12/2015 Being allowed to lapse
EL6699 Tallebung 70km north-west of Condobolin, central-west NSW
Stannum Pty Ltd 72.5 9/01/2017 Being disposed of
EL7447 Box Creek Nymagee NSW Defiance Resources Pty Ltd 145 1/02/2017
EL7524 Barrow 20km west of Nymagee; western NSW
Defiance Resources Pty Ltd 60.9 2/05/2017 Being disposed of
EL7529 Lyell 20km west of Nymagee; western NSW
Defiance Resources Pty Ltd 8.7 2/05/2017 Being disposed of
For
per
sona
l use
onl
y
AURELIA METALS LTD
2 CORPORATION PLACE ORANGE NSW 2800
ASX CODE: AMIABN: 37 108 476 384
PHONE: +61 2 6363 5200 FAX: +61 2 6361 4711
WWW.AURELIAMETALS.COM
AURELIA METALS LTD 2015 ANNUAL REPORT
For
per
sona
l use
onl
y