for personal use only - asx2018/09/24 · of activities in this annual report. financial review the...
TRANSCRIPT
A B N 5 8 1 3 7 1 7 6 3 9 3
A N N U A L R E P O R T
For the year ended 30 June 2018
For
per
sona
l use
onl
y

1
CO R PO RA T E D I R E C TO R Y
Directors
Mr Neil Sheather Executive Director Mr Maofeng Ding Non-Executive Director Mr Chiong Ong Tiong Non-Executive Director Mr Dale Klynhout Non-Executive Director Principal Place of Business
Suite 2, Level 13 49 York Street Sydney NSW 2000
Email: [email protected] Website: www.siburan.com.au Share Registry
Automic Registry Services Level 3 50 Holt Street Surrey Hills, NSW 2010
Telephone: 1300 288 664 www.automic.com.au Solicitors
Steinepreis Paganin Level 4, The Read Buildings 16 Milligan Street Perth WA 6000 Securities Exchange
ASX Limited Level 40, Central Park 152-158 St George’s Terrace Perth WA 6000 ASX Codes: SBU
Company Secretary
Mr Neil Sheather Registered Office
Suite 2, Level 13 49 York Street Sydney NSW 2000 Auditors
PKF Mack 5th Floor 35 Havelock Street West Perth WA 6005
Banker
Bank of Queensland 111 St George’s Terrace Perth WA 6000
For
per
sona
l use
onl
y
2
CO N T E N T S
PAGE
Corporate Directory 1
Review of Activities 3
Directors' Report 4
Financial Statements 13
Directors' Declaration 38
Independent Audit Report 39
Auditor’s Independence Letter 44
Shareholder Information 45
For
per
sona
l use
onl
y

3
R E V I E W O F A C T I V I T I E S
Ora Banda Gold Project, Kalgoorlie Goldfields, Western Australia The Ora Banda South Project, comprises five granted prospecting licences (P16/2545 – 2546, P16/2567 – 2569), is located approximately 55km northwest of Kalgoorlie- Boulder and 8km south of the Ora Banda Mining Centre, in the Coolgardie and Broad Arrow Mineral Fields on the Bardoc 1:100,000 map sheet and the Kalgoorlie 250,000 map sheet. During the year the company finalized its review of the Ora Banda tenements and applied to the WA Department of Mines to surrender the remaining tenements. The decision to surrender was based on the Board’s reluctance to commit to a further program of expenditure in the location.
Project Generation During the year the Company has reviewed numerous gold and base metal projects in WA, specifically in the Murchison region. However, as at the date of this report, none has been identified as suitable for the Company. The Company continues to actively pursue both direct and indirect opportunities in the resource space. The company is currently in discussions with a number of corporate advisory firms who specialize in the mining and exploration fields. It is the company’s intention to appoint a corporate adviser with the specific brief of identifying and securing suitable exploration tenements and or suitable established projects. Corporate Activities Mr Dale Klynhout joined the Company as a Non-Executive Director in December 2017. Mr Klynhout has extensive experience in the domestic and international capital markets, and has managed investments and operated financial licenses in both Australia and Hong Kong. Mr Larry Feng Yi Li resigned from the Company in April 2018 for personal reasons. Mr Li joined the Company in January 2017 as a Non-Executive Director. The Group suffered a net fair value loss of $94,311(2017: $1,455,140) on its financial assets investment during the year. Whilst the Company has sufficient capital at the present, it is currently in discussions with a number of corporate advisory firms on the future funding requirements for the Company.
For
per
sona
l use
onl
y

4
D I R E C TO R S ’ RE PO R T
The Directors present their report together with the consolidated financial statements of the Group comprising of Siburan Resources Limited (Siburan or the Company) and its subsidiaries (the Group or Consolidated Entity) for the year ended 30 June 2018 and the auditor’s report thereon. DIRECTORS The Directors of the Company at any time during or since the end of the financial year are: Mr Neil Sheather Executive Director/Company Secretary – Age 48, appointed: 28 July 2016 Mr Sheather is the current CEO of ASX listed financial services firm, Mejority Capital Ltd. Mr Sheather has extensive experience in retail and institutional stockbroking, capital raisings and initial public offerings in Australia and Asia. Previously he has been the managing director of Investorfirst Securities and CMC Market Stockbroking. Neil currently holds an MBA and several financial markets related post graduate qualifications. He is also a member of the Institute of Company Directors. Mr Dale Klynhout Non-Executive Director – Age 29, appointed: 11 December 2017 Mr Klynhout has 10 years’ experience in both Australian and international capital markets, structuring transactions across equities dealing, funds management and corporate finance. Dale has managed investments across various asset classes and investment teams across the Asia Pacific region as well as operated financial licences in both Australia and Hong Kong jurisdictions. For the last 5 years, Mr Klynhout has been involved in transaction generation, strategic planning and asset management for an Australian listed financial group. He holds a Master of Applied Finance and Diploma of Financial Planning. Mr Klynhout will be seeking re-election by shareholders in the 2018 annual general meeting. Mr Chiong Ong Tiong Non-Executive Director – Age 58, appointed: 7 November 2011 Mr Tiong is currently the Managing Director of Rimbunan Sawit Berhad, a company listed on the Bursa Malaysia (formerly the Kuala Lumpur Stock Exchange) and an executive director of the Rimbunan Hijau Group. He has more than 25 years in the plantation and timber industries and adds strength to the Siburan Board through his significant experience and track record of success in business. Mr Tiong graduated with a Bachelor of Law and Economics from Monash University and is a member of the Victorian and Sarawak Bar Association, CPA Australia and the Malaysian Institute of Accountants. Mr Tiong will retire by rotation and be seeking re-election by shareholders in the 2018 annual general meeting. Mr Maofeng Ding Non-Executive Director – Age 42, appointed: 8 September 2015 Mr Mao Feng Ding is a businessman who is engaged in the manufacturing and production of shoes and set up the Jinjiang City Chendai Yongfeng Shoes & Plastics Company Limited in Jinjiang, Fujian, China. Mr Larry Feng Yi Li Non-Executive Director – Age 34, appointed: 13 January 2017, resigned: 13 April 2018 Mr Li is an Australian citizen and graduated from the University of Wollongong with a degree in Accounting and Finance. He has 10 years of accounting and audit experience having worked with Ernst & Young, Shanghai where he was involved in the financial audit of several State-owned Enterprises (SOEs) such as China South Railway now called CRRC Corporation Limited and Red Star Macalline. In Australia, he has held various finance and accounting roles with several ASX listed resource and financial services companies in Melbourne.
For
per
sona
l use
onl
y
5
D I R E C TO R S ’ RE PO R T
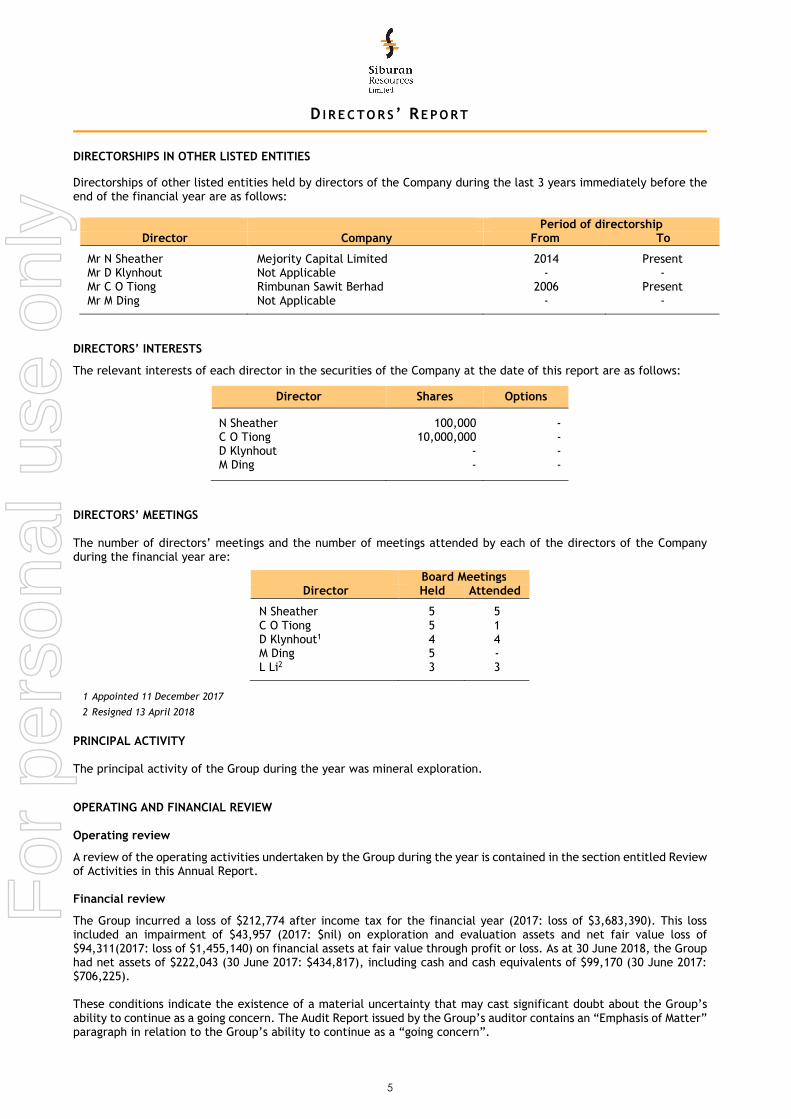
DIRECTORSHIPS IN OTHER LISTED ENTITIES Directorships of other listed entities held by directors of the Company during the last 3 years immediately before the end of the financial year are as follows:
Period of directorship Director Company From To
Mr N Sheather Mejority Capital Limited 2014 Present Mr D Klynhout Not Applicable - - Mr C O Tiong Rimbunan Sawit Berhad 2006 Present Mr M Ding Not Applicable - -
DIRECTORS’ INTERESTS
The relevant interests of each director in the securities of the Company at the date of this report are as follows:
Director Shares Options
N Sheather 100,000 - C O Tiong 10,000,000 - D Klynhout - - M Ding - -
DIRECTORS’ MEETINGS The number of directors’ meetings and the number of meetings attended by each of the directors of the Company during the financial year are:
Board Meetings Director Held Attended
N Sheather 5 5 C O Tiong 5 1 D Klynhout1 4 4 M Ding 5 - L Li2 3 3
1 Appointed 11 December 2017
2 Resigned 13 April 2018
PRINCIPAL ACTIVITY The principal activity of the Group during the year was mineral exploration. OPERATING AND FINANCIAL REVIEW Operating review
A review of the operating activities undertaken by the Group during the year is contained in the section entitled Review of Activities in this Annual Report. Financial review
The Group incurred a loss of $212,774 after income tax for the financial year (2017: loss of $3,683,390). This loss included an impairment of $43,957 (2017: $nil) on exploration and evaluation assets and net fair value loss of $94,311(2017: loss of $1,455,140) on financial assets at fair value through profit or loss. As at 30 June 2018, the Group had net assets of $222,043 (30 June 2017: $434,817), including cash and cash equivalents of $99,170 (30 June 2017: $706,225). These conditions indicate the existence of a material uncertainty that may cast significant doubt about the Group’s ability to continue as a going concern. The Audit Report issued by the Group’s auditor contains an “Emphasis of Matter” paragraph in relation to the Group’s ability to continue as a “going concern”.
For
per
sona
l use
onl
y

6
D I R E C TO R S ’ RE PO R T
OPERATING AND FINANCIAL REVIEW Financial review (continued) As outlined in Note 1 to the Financial Statements, the Directors consider there are reasonable grounds to believe that the Group will be able to continue as a going concern after consideration of the following factors: The Group continued to implement cost cutting measures during the financial year which have resulted in
significant reduction of overheads. The Directors are confident that the Group will be able to raise further capital as required.
The Directors believe that the above indicators demonstrate that the Group will be able to pay their debts as and when they fall due and to continue as a going concern. Accordingly, the Directors also believe that it is appropriate to adopt the going concern basis in the preparation of the 2018 financial report. SIGNIFICANT CHANGES IN THE STATE OF AFFAIRS The Group’s net assets decreased by $212,774 to $222,043 during the financial year, principally as a result of net impairment loss of $43,957 on exploration and evaluation assets and net fair value loss of $94,311 on financial assets at fair value through profit or loss. No shares or options were issued during the year. Total shares on issue at 30 June 2018 were 697,832,100. RESULTS The Group incurred a loss of $212,774 after income tax for the financial year (2017: loss of $3,683,390). LIKELY DEVELOPMENTS The Group will continue to pursue its principal activity of mineral exploration. DIVIDENDS No dividend has been declared or paid by the Company to the date of this report. CORPORATE GOVERNANCE The Group’s Corporate Governance Statement can be found at the Company’s website www.siburan.com.au. ENVIRONMENTAL REGULATION The Group’s exploration and mining activities are governed by a range of environmental legislation and regulations including the National Greenhouse and Energy Report Act 2007 and Mining Act 1978. As the Group is still in the development phase of its interests in exploration projects, the Group is not yet subject to the public reporting requirements of environmental legislation and regulations. To the best of the directors’ knowledge, the Group has adequate systems in place to ensure compliance with the requirements of the applicable environmental legislation and is not aware of any breach of those requirements during the financial year and up to the date of the Directors’ Report. EVENTS SUBSEQUENT TO REPORTING DATE There has not arisen in the interval between the end of the year and the date of this report any item, transaction or event of a material and unusual nature likely, in the opinion of the directors, to affect significantly the operations of the Group, the results of those operations, or the state of affairs of the Group in future financial years.
For
per
sona
l use
onl
y

7
D I R E C TO R S ’ RE PO R T
REMUNERATION REPORT This Remuneration Report outlines the remuneration arrangements of the Group in accordance with the requirements of the Corporations Act 2001 (the Act) and its regulations. This information has been audited as required by section 308(3C) of the Act. For the purposes of this report, key management personnel of the Group are defined as those persons having authority and responsibility for planning, directing and controlling the major activities of the Group, directly or indirectly, including any director (whether executive or otherwise) of the Company. In this report, the term “executive” refers to the executive directors of the Company. Key management personnel
The following were key management personnel of the Group at any time during the year and unless otherwise indicated were key management personnel for the entire year:
Name Position held
Neil Sheather Executive Director Chiong Ong Tiong Non-Executive Director Dale Klynhout Non-Executive Director (appointed 11 December 2017) Maofeng Ding Non-Executive Director Larry Feng Yi Li Non-Executive Director (resigned 13 April 2018)
The Board of Directors of the Company is responsible for determining and reviewing remuneration policies for the directors and executives. If necessary, the Board obtains independent advice on the appropriateness of remuneration packages given trends in comparable companies and in accordance with the objectives of the Company. Principles of remuneration The remuneration structures explained below are competitively set to attract, motivate and retain suitably qualified and experienced candidates, reward the achievement of strategic objectives and achieve the broader outcome of creation of value for shareholders. The remuneration structures take into account:
o the capability and experience of the key management personnel;
o the key management personnel’s ability to control the achievement of strategic objectives;
o the Group’s performance including:
the growth in share price; and
the amount of incentives within each key management person’s compensation. Given the evaluation and developmental nature of the Group’s principal activity, the overall level of compensation does not have regard to the earnings of the Group. Remuneration structure In accordance with best practice corporate governance, the structure of non-executive directors’ remuneration is clearly distinguished from that of executives. Non-executive director remuneration The Constitution and the ASX Listing Rules specify that the aggregate remuneration of non-executive directors shall be determined from time to time by a general meeting. The aggregate remuneration for all non-executive directors, last voted upon by shareholders at the 2009 General Meeting, is not to exceed $250,000 per annum. Directors’ fees cover all main board activities and membership of committees. Non-executive directors do not receive any retirement benefits, other than statutory superannuation, nor do they receive any performance related compensation. Level of non-executive directors’ fees as at the reporting date is as follows:
Name Non-executive directors’ fees (per annum)
C O Tiong $14,400 D Klynhout $14,400 M Ding $14,400
For
per
sona
l use
onl
y

8
D I R E C TO R S ’ RE PO R T
REMUNERATION REPORT (continued) Executive remuneration Remuneration for executives is normally set out in employment agreements. Executive directors may receive performance related compensation but do not receive any retirement benefits, other than statutory superannuation. The Company’s Executive Director, Mr Neil Sheather, was originally appointed as a non-executive director and received a fixed director’s fee of $14,400 per annum. Due to the size of its operations and cost cutting measurements carried out by the Group, Mr Sheather’s remuneration remained unchanged upon his appointment as executive director and as at the reporting date. As the Group’s operation grows, the Board will reassess Mr Sheather’s remuneration structure. Fixed remuneration Fixed remuneration consists of base compensation (which is calculated on a total cost basis and includes any FBT charges related to employee benefits including motor vehicles) as well as employer contributions to superannuation funds. Fixed remuneration is reviewed annually by the Board through a process that considers individual and overall performance of the Group. As noted above, the Board has access to external advice independent of management, if required. Other benefits Key management personnel may receive benefits such as travel allowances and motor vehicles and the Group pays fringe benefits tax on these benefits. Short-term incentive The Group has not set any short-term incentives (STI) for key management personnel. Long-term incentives Long-term incentives (LTI) may be provided to key management personnel in the form of options over ordinary shares of the Company. LTI are considered to promote continuity of employment and provide additional incentive to recipients to increase shareholder wealth. Options may only be issued to directors subject to approval by shareholders in general meeting. The Group has introduced a policy that prohibits employees and directors of the Group from entering into transactions that operate or are intended to operate to limit the economic risk or are designed or intended to hedge exposure to unvested Company securities. This includes entering into arrangements to hedge their exposure to LTI granted as part of their remuneration package. This policy may be enforced by requesting employees and directors to confirm compliance. Use of remuneration consultants The Board did not engage the services of a remuneration consultant during the year. Voting and comments made at the Company’s 2017 Annual General Meeting (AGM) At the 2017 AGM, more than 90% of the votes received supported the adoption of the remuneration report for the year ended 30 June 2017. The Company did not receive any specific feedback at the AGM or throughout the year on its remuneration practices.
For
per
sona
l use
onl
y
9
D I R E C TO R S ’ RE PO R T
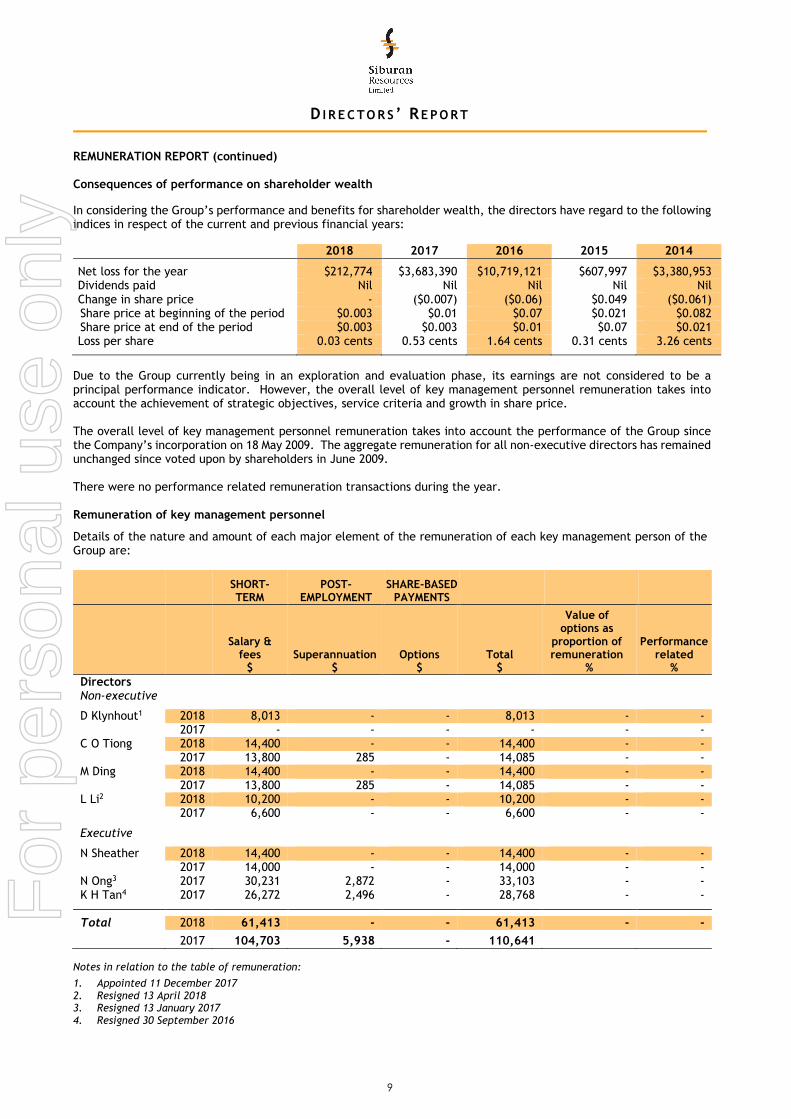
REMUNERATION REPORT (continued) Consequences of performance on shareholder wealth In considering the Group’s performance and benefits for shareholder wealth, the directors have regard to the following indices in respect of the current and previous financial years:
2018 2017 2016 2015 2014
Net loss for the year $212,774 $3,683,390 $10,719,121 $607,997 $3,380,953 Dividends paid Nil Nil Nil Nil Nil Change in share price - ($0.007) ($0.06) $0.049 ($0.061) Share price at beginning of the period $0.003 $0.01 $0.07 $0.021 $0.082 Share price at end of the period $0.003 $0.003 $0.01 $0.07 $0.021 Loss per share 0.03 cents 0.53 cents 1.64 cents 0.31 cents 3.26 cents
Due to the Group currently being in an exploration and evaluation phase, its earnings are not considered to be a principal performance indicator. However, the overall level of key management personnel remuneration takes into account the achievement of strategic objectives, service criteria and growth in share price. The overall level of key management personnel remuneration takes into account the performance of the Group since the Company’s incorporation on 18 May 2009. The aggregate remuneration for all non-executive directors has remained unchanged since voted upon by shareholders in June 2009. There were no performance related remuneration transactions during the year. Remuneration of key management personnel
Details of the nature and amount of each major element of the remuneration of each key management person of the Group are:
SHORT-TERM
POST-EMPLOYMENT
SHARE-BASED PAYMENTS
Salary & fees
$ Superannuation
$ Options
$ Total
$
Value of options as
proportion of remuneration
%
Performance related
% Directors Non-executive
D Klynhout1 2018 8,013 - - 8,013 - - 2017 - - - - - - C O Tiong 2018 14,400 - - 14,400 - - 2017 13,800 285 - 14,085 - - M Ding 2018 14,400 - - 14,400 - - 2017 13,800 285 - 14,085 - - L Li2 2018 10,200 - - 10,200 - - 2017 6,600 - - 6,600 - -
Executive
N Sheather 2018 14,400 - - 14,400 - - 2017 14,000 - - 14,000 - - N Ong3 2017 30,231 2,872 - 33,103 - - K H Tan4 2017 26,272 2,496 - 28,768 - -
Total 2018 61,413 - - 61,413 - -
2017 104,703 5,938 - 110,641 Notes in relation to the table of remuneration:
1. Appointed 11 December 2017 2. Resigned 13 April 2018 3. Resigned 13 January 2017 4. Resigned 30 September 2016
For
per
sona
l use
onl
y

10
D I R E C TO R S ’ RE PO R T
REMUNERATION REPORT (continued) Share based remuneration There were no share-based remuneration transactions during the financial year. Equity instruments held by key management personnel Share holdings The movement during the financial year in the number of ordinary shares in Siburan Resources Limited held, directly, indirectly or beneficially by each key management person, is as follows:
2018 Held at
30 June 2017 Held at date of appointment
Other changes
Held at date of resignation
Held at 30 June 2018
Directors Mr N Sheather 100,000 n/a - n/a 100,000 Mr C O Tiong 10,000,000 n/a - n/a 10,000,000 Mr D Klynhout1 n/a - - n/a - Mr M Ding - n/a - n/a - Mr L Li2 - n/a - - n/a
1. Appointed 11 December 2017 2. Resigned 13 April 2018
There were no shares granted during the reporting period as compensation. Options holdings Directors did not hold any options at the beginning or end of the financial year. This concludes the Remuneration Report, which has been audited. OPTIONS Options granted There were no options granted during or since the end of the financial year. Options exercised There were no options exercised during or since the end of the financial year. Options expired The following options expired during the year without being exercised:
Class
Expiry Date
Exercise Price
Number of Options
Listed Options 31 December 2017 $0.02 178,177,251
Unissued shares under option At the date of this report, there are no unissued shares of the Company under option.
For
per
sona
l use
onl
y

11
D I R E C TO R S ’ RE PO R T
INDEMNIFICATION AND INSURANCE OF OFFICERS Indemnification The Company has agreed to indemnify the current directors and company secretary of the Company against all liabilities to another person (other than the Company or a related body corporate) that may arise from their position as directors of the Company and its controlled entity, except where the liability arises out of conduct involving a lack of good faith. The agreement stipulates that the Company will meet the full amount of any such liabilities, including costs and expenses. Insurance The Company paid a premium during the year in respect of a director and officer liability insurance policy, insuring the directors of the Company, the company secretary, and all executive officers of the Company against a liability incurred as such a director, secretary or executive officer to the extent permitted by the Corporations Act 2001. The directors have not included details of the nature of the liabilities covered or the amount of the premium paid in respect of the directors’ and officers’ liability and legal expenses’ insurance contracts, as such disclosure is prohibited under the terms of the contract. INDEMNIFICATION AND INSURANCE OF AUDITORS
The Company has not, during or since the financial year, indemnified or agreed to indemnify the auditor of the Company or any related entity against liability incurred by the auditor. During the financial year, the Company has not paid a premium in respect of a contract to insure the auditor of the Company or any related entity. PROCEEDINGS ON BEHALF OF THE COMPANY
No person has applied to the Court under section 237 of the Corporations Act 2001 for leave to bring proceedings on behalf of the Company, or to intervene in any proceedings to which the Company is a party for the purposes of taking responsibility on behalf of the Company for all or part of those proceedings. NON-AUDIT SERVICES The Group may decide to employ the auditor on assignments additional to their statutory audit duties where the auditor’s expertise and experience with the Group are important. Details of the amounts paid or payable to the auditor (PKF Mack) for non-audit services provided during the year are set out below. The Directors are satisfied that the provision of non-audit services is compatible with the general standard of independence for auditors imposed by the Corporations Act 2001. The nature and scope of each type of non-audit service provided means that auditor independence was not compromised. During the year the following fees were paid or payable for non-audit services provided by the auditor of the Group and its related practices:
2018
$ 2017
$
Tax compliance services 1,200 1,200
Total Remuneration for non-audit services 1,200 1,200
OFFICERS OF THE COMPANY WHO ARE FORMER AUDIT PARTNERS OF PKF MACK There are no officers of the Company who are former audit partners of PKF Mack.
For
per
sona
l use
onl
y

12
AUDITOR’S INDEPENDENCE DECLARATION A copy of the auditor’s independence declaration as required under section 307C of the Corporations Act 2001 is set out on page 44 and forms part of the Director’s Report.
Signed in accordance with a resolution of the directors.
Neil Sheather
Executive Director Dated at Perth this 21st day of September 2018.
For
per
sona
l use
onl
y
13
CO N SO L I D A T E D ST A TE M E N T O F PR O F I T O R LO S S A N D OT H E R CO M P R E H E N S I VE IN CO M E
for the year ended 30 June 2018
Note 2018
$ 2017
$
Revenue and other income
Other income 6,007 - Investment income 144,869 -
Total revenue and other income 150,876 - Loss on security investments - (313,148) Employee benefit expenses (66,813) (109,742) Depreciation expenses 8 (6,817) (13,479) Occupancy expenses (6,300) (21,852) Exploration and evaluation assets written off 9 (3,448) (1,430,455) Impairment of Exploration and evaluation assets 9 (43,957) - Impairment of other assets 8 (19,165) - Fair value loss on financial assets at fair value through profit or loss 6 (94,311) (1,455,140) Foreign exchange gain/(loss) (13,146) (191,555) Other expenses (93,993) (122,176)
Results from operating activities (197,074) (3,657,547) Finance income - 510 Finance costs (15,700) (26,353)
Net finance loss (15,700) (25,843) Loss before income tax (212,774) (3,683,390) Income tax expense / (benefit) 3 - - Net loss for the year (212,774) (3,683,390)
Other comprehensive income Items that will not be reclassified to profit or loss - - Items that may be reclassified subsequently to profit or loss - - Other comprehensive income for the year, net of tax - -
Total comprehensive loss for the year (212,774) (3,683,390)
Loss per share attributable to the ordinary equity holders of the Company
Basic and diluted loss per share (cents) 16 (0.03) (0.53)
Diluted loss per share is not shown as all potential ordinary shares on issue would decrease the loss per share and are thus not considered dilutive.
The Consolidated Statement of Profit or Loss and Other Comprehensive Income is to be read in conjunction with the accompanying notes.
For
per
sona
l use
onl
y
14
CO N SO L I D A T E D ST A TE M E N T O F F I N AN C I AL PO S I T I O N
as at 30 June 2018
Note 2018
$ 2017
$ CURRENT ASSETS Cash and cash equivalents 4 99,170 706,225 Trade and other receivables 5 - 3,225 Financial assets at fair value through profit or loss 6 230,680 427,273 Other current assets 7 3,987 -
Total Current Assets 333,837 1,136,723 NON-CURRENT ASSETS Investment in Associates 14 - 10 Property, plant and equipment 8 - 25,982 Exploration and evaluation assets 9 - 23,328
Total Non-Current Assets - 49,320
TOTAL ASSETS 333,837 1,186,043
CURRENT LIABILITIES Trade and other payables 10 93,057 55,227 Loans and borrowings 11 17,359 694,621
Total Current Liabilities 110,416 749,848 NON-CURRENT LIABILITIES Loans and borrowings 11 1,378 1,378
Total Non-Current Liabilities 1,378 1,378
TOTAL LIABILITIES 111,794 751,226
NET ASSETS
222,043 434,817
EQUITY Contributed equity 12 24,537,968 24,537,968 Accumulated losses 13 (24,315,925) (24,103,151)
TOTAL EQUITY
222,043 434,817
The Consolidated Statement of Financial Position is to be read in conjunction with the accompanying notes.
For
per
sona
l use
onl
y

15
CO N SO L I D A T E D ST A TE M E N T O F CH A N G E S I N EQ U I T Y for the year ended 30 June 2018
The Consolidated Statement of Changes in Equity is to be read in conjunction with the accompanying notes.
Contributed Equity
$
Accumulated Losses
$ Total
$ Balance at 30 June 2016 24,537,968 (20,419,761) 4,118,207 Loss for the year - (3,683,390) (3,683,390) Other comprehensive income - - -
Total comprehensive loss for the year -
(3,683,390) (3,683,390)
Transactions with equity holders in their capacity as equity holders:
Shares issued - - - Transaction costs on share issues - - - Expiry of options on issue - - -
Balance at 30 June 2017 24,537,968 (24,103,151) 434,817
Balance at 30 June 2017 24,537,968 (24,103,151) 434,817 Loss for the year - (212,774) (212,774) Other comprehensive income - - -
Total comprehensive loss for the year -
(212,774) (212,774)
Transactions with equity holders in their capacity as equity holders
- - -
Balance at 30 June 2018 24,537,968 (24,315,925) 222,043
For
per
sona
l use
onl
y

16
CO N SO L I D A T E D ST A TE M E N T O F CA SH FL O W S for the year ended 30 June 2018
Note 2018
$ 2017
$
Cash flows from operating activities Cash payments in the course of operations (151,614) (235,518) Interest received - 510 Interest paid (15,701) (26,353)
Net cash (outflow) from operating activities 22 (167,315) (261,361) Cash flows from investing activities
Payments for exploration and evaluation assets - (41,448) Proceeds from sales of security investments 1,088,878 449,409 Payments for purchase of security investments (834,672) (234,747)
Net cash inflow from investing activities 254,206 173,214 Cash flows from financing activities Proceeds from borrowings 514,419 234,747 Repayment of borrowings (1,195,815) (129,745)
Net cash inflow/(outflow) from financing activities (681,396) 105,002
Net increase/(decrease) in cash and cash equivalents held (594,505) 16,855
Cash and cash equivalents at 1 July 706,225 695,411
Exchange rate fluctuation (12,550) (6,041)
Cash and cash equivalents at 30 June 4 99,170 706,225
The Consolidated Statement of Cash Flows is to be read in conjunction with the accompanying notes.
For
per
sona
l use
onl
y
17
NO T E S TO TH E CO N SO L I D A TE D F I N AN C I AL ST A TE M E N T S
1. SUMMARY OF SIGNIFICANT ACCOUNTING POLICIES Reporting entity
Siburan Resources Limited is a public company limited by shares incorporated in Australia whose shares are traded on the Australian Securities Exchange.
These consolidated financial statements comprise the Company and its subsidiaries (collectively the “Group” and individually “Group companies”). They were authorised for issue by the Board of Directors on 21 September 2018.
The nature of the operations and principal activities of the Group are described in the Directors’ Report. Basis of preparation
Statement of compliance
These general purpose financial statements have been prepared in accordance with the requirements of the Corporations Act 2001, Australian Accounting Standards and Interpretations issued by the Australian Accounting Standards Board and the Corporations Act 2001. Siburan Resources Limited is a for-profit entity for the purpose of preparing the financial statements.
The financial statements of the Group also comply with the International Financial Reporting Standards (IFRS) as issued by the International Accounting Standards Board (IASB).
Basis of measurement
The financial statements are prepared on the accruals basis and the historical cost basis, except for, where applicable, the revaluation of available-for-sale financial assets, financial assets and liabilities at fair value through profit or loss, investment properties, certain classes of property, plant and equipment and derivative financial instruments.
Going concern
The financial report has been prepared on a going concern basis which assumes realizing its assets and extinguishing its liabilities in the normal course of business.
At 30 June 2018, the Group had incurred a net loss after tax of $212,774 (2017: loss of $3,683,390) and net operating cash outflows of $167,315 (2017: $261,361) for the year then ended. The Directors consider there are reasonable grounds to believe that the Group will be able to continue as a going concern after consideration of the following factors:
The Group has continued cost cutting measures during the financial year which have resulted in significant reduction of overheads.
The Directors are confident that the Group will be able to raise further capital as required.
The Directors believe that the above indicators demonstrate that the Group will be able to pay their debts as and when they fall due and to continue as a going concern. Accordingly, the Directors also believe that it is appropriate to adopt the going concern basis in the preparation of the 2018 financial report.
In the event that the Group does not achieve the above actions, there exists significant uncertainty as to whether the Group will be able to continue as a going concern and realise its assets and extinguish its liabilities in the normal course of business. Functional and presentation currency
Items included in the financial statements of each of the Group’s entities are measured using the currency of the primary economic environment in which the entity operates (“the functional currency”). The consolidated financial statements are presented in Australian dollars (AUD), which is the Group’s functional and presentational currency. All values are rounded to the nearest dollar unless otherwise stated. New, revised or amending Accounting Standards and Interpretations adopted
The Group has adopted all of the new, revised or amending Accounting Standards and Interpretations issued by the Australian Accounting Standards Board ('AASB') that are mandatory for the current reporting period.
Any new, revised or amending Accounting Standards or Interpretations that are not yet mandatory have not been early adopted.
The adoption of these Accounting Standards and Interpretations did not have any significant impact on the financial performance or position of the Group.
For
per
sona
l use
onl
y

18
NO T E S TO TH E CO N SO L I D A TE D F I N AN C I AL ST A TE M E N T S
1. STATEMENT OF SIGNIFICANT ACCOUNTING POLICIES (continued) Significant accounting policies
The accounting policies set out below have been applied consistently to all periods presented in these financial statements, and have been applied consistently by the Group. Basis of consolidation Subsidiaries Subsidiaries are entities controlled by the Group. The group controls an entity when it is exposed to, or has rights to, variable returns from involvements with the entity and has the ability to affect those returns through its power over the entity. The financial statements of subsidiaries are included in the consolidated financial statements from the date on which control commences until the date on which control ceases. Transactions eliminated on consolidation Intra-group balances and transactions, and any unrealised income and expenses arising from intra-group transactions, are eliminated. Accounting policies of subsidiaries have been changed where necessary to ensure consistency with the policies adopted by the Group. Investments in associates (equity-accounted investee) Associates are those entities in which the Group has significant influence, but not control, over the financial and operational policies. Significant influence is presumed to exist when the Group holds between 20 and 50 per cent of the voting power of another entity. Investments in associates are accounted for using the equity method (equity-accounted investee) and are initially recognised at cost. The cost of the investment includes transaction costs. The financial statements include the Group’s share of profit or loss and other comprehensive income of equity accounted investees. After adjustments to align the accounting policies with those of the Group, from the date that significant influence commences until the date that significant influence ceases. When the Group’s share of losses exceeds its interest in an equity-accounted investee, the carrying amount of that interest, including any long-term investments that form part therefore, is reduced to zero, and the recognition of further losses is discontinued except to the extent that the Group has an obligation or has made payments on behalf of the investee. Foreign currency translation
Transactions in foreign currencies are initially recorded in the functional currency by applying the exchange rates ruling at the date of the transaction. Monetary assets and liabilities denominated in foreign currencies are retranslated at the rate of exchange ruling at the reporting date. Non-monetary items that are measured in terms of historical cost in a foreign currency are translated using the exchange rate as at the date of the initial transaction. Non-monetary items measured at fair value in a foreign currency are translated using the exchange rates at the date when the fair value was determined. Segment reporting An operating segment is a component of an entity that engages in business activities from which it may earn revenues and incur expenses, whose operating results are regularly reviewed by the Group’s chief operating decision maker to make decisions about resources to be allocated to the segment and assess its performance and for which discrete financial information is available. This includes start-up operations which are yet to earn revenues. Management will also consider other factors in determining operating segments such as the level of segment information presented to the Board of Directors. Operating segments have been identified based on the information provided to the chief operating decision makers – being the Board of Directors.
For
per
sona
l use
onl
y
19
NO T E S TO TH E CO N SO L I D A TE D F I N AN C I AL ST A TE M E N T S
1. STATEMENT OF SIGNIFICANT ACCOUNTING POLICIES (continued) Acquisition of assets
Acquisition of an asset or a group of assets (including any liabilities assumed) that does not constitute a business are accounted for as asset acquisition under which the Group measure the assets and liabilities acquired, and the corresponding increase in equity, directly, at the fair value of the assets and liabilities acquired, unless that fair value cannot be estimated reliably. Cash and cash equivalents Cash and cash equivalents in the statement of financial position comprise cash at bank and in hand and short-term deposits with an original maturity of three months or less that are readily convertible to known amounts of cash and which are subject to an insignificant risk of changes in value.
For the purposes of the Statement of Cash Flows, cash and cash equivalents consist of cash and cash equivalents as defined above. Trade and other receivables Trade and other receivables are recognised initially at fair value and subsequently at amortised cost less any impairment losses recognised. Collectability of trade receivables is reviewed on an ongoing basis. An allowance account (provision for impairment of trade receivables) is used when there is objective evidence that the Group will not be able to collect all amounts due. Investments and other financial assets
(a) Classification
The Group classifies its financial assets in the following categories: financial assets at fair value through profit or loss, loans and receivables, held-to-maturity investments, and available-for-sale financial assets.
The classification depends on the purpose for which the investments were acquired. Management determines the classification of its investments at initial recognition and, in the case of assets classified as held-to-maturity, re-evaluates this designation at the end of each reporting period.
(b) Recognition and derecognition
Regular way purchases and sales of financial assets are recognised on trade-date, the date on which the Group commits to purchase or sell the asset. Financial assets are derecognised when the rights to receive cash flows from the financial assets have expired or have been transferred and the Group has transferred substantially all the risks and rewards of ownership.
When securities classified as available-for-sale are sold, the accumulated fair value adjustments recognised in other comprehensive income are reclassified to profit or loss as gains and losses from investment securities.
(c) Measurement
At initial recognition, the Group measures a financial asset at its fair value plus, in the case of a financial asset not at fair value through profit or loss, transaction costs that are directly attributable to the acquisition of the financial asset. Transaction costs of financial assets carried at fair value through profit or loss are expensed in profit or loss.
Loans and receivables and held-to-maturity investments are subsequently carried at amortised cost using the effective interest method.
Available-for-sale financial assets and financial assets at fair value through profit or loss are subsequently carried at fair value. Gains or losses arising from changes in the fair value are recognised as follows:
for ‘financial assets at fair value through profit or loss’ – in profit or loss within other income or other expenses;
for available for sale financial assets that are monetary securities denominated in a foreign currency – translation differences related to changes in the amortised cost of the security are recognised in profit or loss and other changes in the carrying amount are recognised in other comprehensive income; and
for other monetary and non-monetary securities classified as available for sale – in other comprehensive income.
For
per
sona
l use
onl
y

20
NO T E S TO TH E CO N SO L I D A TE D F I N AN C I AL ST A TE M E N T S
1. STATEMENT OF SIGNIFICANT ACCOUNTING POLICIES (continued)
Dividends on financial assets at fair value through profit or loss and available-for-sale equity instruments are recognised in profit or loss as part of revenue from continuing operations when the Group’s right to receive payments is established.
Interest income from financial assets at fair value through profit or loss is included in the net gains (losses). Interest on available-for-sale securities calculated using the effective interest method is recognised in the income statement as part of revenue from continuing operations.
(d) Impairment
The Group assesses at the end of each reporting period whether there is objective evidence that a financial asset or group of financial assets is impaired. A financial asset or a group of financial assets is impaired and impairment losses are incurred only if there is objective evidence of impairment as a result of one or more events that occurred after the initial recognition of the asset (a ‘loss event’) and that loss event (or events) has an impact on the estimated future cash flows of the financial asset or group of financial assets that can be reliably estimated. In the case of equity investments classified as available-for-sale, a significant or prolonged decline in the fair value of the security below its cost is considered an indicator that the assets are impaired.
Impairment of non-financial assets Goodwill and intangible assets that have an indefinite useful life are not subject to amortisation and are tested annually for impairment, or more frequently if events or changes in circumstances indicate that they might be impaired. Other assets are tested for impairment whenever events or changes in circumstances indicate that the carrying amount may not be recoverable. An impairment loss is recognised for the amount by which the asset’s carrying amount exceeds its recoverable amount. The recoverable amount is the higher of an asset’s fair value less costs to sell and value in use. For the purposes of assessing impairment, assets are grouped at the lowest levels for which there are separately identifiable cash flows which are largely independent of the cash inflows from other assets or groups of assets (cash-generating units). Non-financial assets other than goodwill that suffered an impairment are reviewed for possible reversal of the impairment at the end of each reporting period. Exploration and evaluation expenditure Exploration and evaluation expenditure incurred is accumulated in respect of each identifiable area of interest. These costs are only carried forward to the extent that they are expected to be recouped through the successful development of the area or where activities in the area have not yet reached a stage that permits reasonable assessment of the existence of economically recoverable reserves. Accumulated costs in relation to an abandoned area are written off in full against profit in the year in which the decision to abandon the area is made. When production commences, the accumulated costs for the relevant area of interest are amortised over the life of the area according to the rate of depletion of the economically recoverable reserves. A regular review is undertaken of each area of interest to determine the appropriateness of continuing to carry forward costs in relation to that area of interest. Costs of site restoration are provided over the life of the facility from when exploration commences and are included in the costs of that stage. Site restoration costs include the dismantling and removal of mining plant, equipment and building structures, waste removal, and rehabilitation of the site in accordance with clauses of the mining permits. Such costs are determined using estimates of future costs, current legal requirements and technology on an undiscounted basis. Any changes in the estimates for the costs are accounted on a prospective basis. In determining the costs of site restoration, there is uncertainty regarding the nature and extent of the restoration due to community expectations and future legislation. Accordingly the costs are determined on the basis that the restoration will be completed within one year of abandoning the site. Property, plant and equipment Recognition and measurement Items of property, plant and equipment are measured at cost less accumulated depreciation and impairment losses. Cost includes expenditures that are directly attributable to the acquisition of the asset.
For
per
sona
l use
onl
y

21
NO T E S TO TH E CO N SO L I D A TE D F I N AN C I AL ST A TE M E N T S
1. STATEMENT OF SIGNIFICANT ACCOUNTING POLICIES (continued) Subsequent costs The cost of replacing part of an item of property, plant and equipment is recognised in the carrying amount of the item if it is probable that the future economic benefits embodied within the part will flow to the Group and its cost can be measured reliably. The costs of day-to-day servicing of property, plant and equipment are recognised in profit or loss as incurred. Depreciation Items of property, plant and equipment are depreciated using the diminishing value method over their estimated useful lives of each part of an item of property, plant and equipment. The depreciation rates used for each class of asset for the current period are as follows:
Furniture and fixtures 10% to 20% Plant and equipment 20% to 67% Motor vehicles 25%
Depreciation methods, useful lives and residual values are reassessed at the reporting date. Trade and other payables Liabilities are recognised for amounts to be paid in the future for goods or services received, whether or not billed to the Group. Trade accounts payable are normally settled within 60 days. They are recognised initially at their fair value and subsequently measured at amortised cost using the effective interest method. Borrowings
Loans and borrowings are initially recognised at the fair value of the consideration received, net of transaction costs. They are subsequently measured at amortised cost using the effective interest method.
Where there is an unconditional right to defer settlement of the liability for at least 12 months after the reporting date, the loans or borrowings are classified as non-current. Employee benefits Provision is made for employee benefits accumulated as a result of employees rendering services up to the reporting date. These benefits include wages and salaries, annual leave, and long service leave. Liabilities arising in respect of wages and salaries, annual leave and any other employee benefits expected to be settled within twelve months of the reporting date are measured at their nominal amounts based on remuneration rates which are expected to be paid when the liability is settled. All other employee benefit liabilities are measured at the present value of the estimated future cash outflow to be made in respect of services provided by employees up to the reporting date. In determining the present value of future cash outflows, the market yield as at the reporting date on national commercial bonds, which have terms to maturity approximating the terms of the related liability, are used. Contributed equity Ordinary shares are classified as equity. Incremental costs directly attributable to the issue of new shares are shown in equity as a deduction, net of tax, from the proceeds. Share based payments The Group measures the cost of equity-settled transactions with employees and consultants by reference to the fair value of the equity instruments at the date at which they were issued. The fair value is determined using the Black Scholes option pricing model using relevant input assumptions including the price of the underlying security, life of the equity instrument, expected volatility of the underlying security and the risk-free rate on interest. Revenue recognition Revenue represents interest received and reimbursements of exploration expenditures and is recognised to the extent that it is probable that the economic benefits will flow to the Group and can be reliably measured. Interest income is recognised as it accrues.
For
per
sona
l use
onl
y

22
NO T E S TO TH E CO N SO L I D A TE D F I N AN C I AL ST A TE M E N T S
1. STATEMENT OF SIGNIFICANT ACCOUNTING POLICIES (continued) Goods and services tax (GST) Revenues, expenses and assets are recognised net of the amount of GST except:
When the GST incurred on a purchase of goods and services is not recoverable from the taxation authority, in which case the GST is recognised as part of the cost of acquisition of the asset or as part of the expense item as applicable.
Receivables and payables, which are stated with the amount of GST included.
The net amount of GST recoverable from, or payable to, the taxation authority is included as part of receivables or payables in the statement of financial position.
Cash flows are included in the statement of cash flows on a gross basis and the GST component of cash flows arising from investing and financing activities, which is recoverable from, or payable to, the taxation authority is classified as part of operating cash flows.
Commitments and contingencies are disclosed net of the amount of GST recoverable from, or payable to, the taxation authority. Income tax Deferred income tax is provided on all temporary differences at the reporting date between the tax bases of assets and liabilities and their carrying amounts for financial reporting purposes.
Deferred income tax liabilities are recognised for all taxable temporary differences:
(a) except where the deferred income tax liability arises from the initial recognition of an asset or liability in a transaction that is not a business combination and, at the time of the transaction, affects neither the accounting profit nor taxable profit or loss; and
(b) in respect of taxable temporary differences associated with investments in subsidiaries, associates and interests in joint ventures, except where the timing of the reversal of the temporary differences can be controlled and it is probable that the temporary differences will not reverse in the foreseeable future.
Deferred income tax assets are recognised for all deductible temporary differences, carry-forward of unused tax assets and unused tax losses, to the extent that it is probable that taxable profit will be available against which the deductible temporary differences, and the carry-forward of unused tax assets and unused tax losses can be utilised:
(a) except where the deferred income tax asset relating to the deductible temporary difference arises from the initial recognition of an asset or liability in a transaction that is not a business combination and, at the time of the transaction, affects neither the accounting profit nor taxable profit or loss; and
(b) in respect of deductible temporary differences associated with investments in subsidiaries, associates and interests in joint ventures, deferred tax assets are only recognised to the extent that it is probable that the temporary differences will reverse in the foreseeable future and taxable profit will be available against which the temporary differences can be utilised.
The carrying amount of deferred income tax assets is reviewed at each reporting date and reduced to the extent that it is no longer probable that sufficient taxable profit will be available to allow all or part of the deferred income tax asset to be utilised.
Deferred income tax assets and liabilities are measured at the tax rates that are expected to apply to the year when the asset is realised or the liability is settled, based on tax rates (and tax laws) that have been enacted or substantively enacted at the reporting date.
Income taxes relating to items recognised directly in equity are recognised in equity and not in the profit or loss in the statement of profit or loss and other comprehensive income.
Siburan Resources Limited has unused tax losses. However, no deferred tax balances have been recognised, as it is considered that asset recognition criteria have not been met at this time. Leases
Operating lease payments are recognised as an expense in the statement of profit or loss and other comprehensive income on a straight-line basis over the lease term.
For
per
sona
l use
onl
y
23
NO T E S TO TH E CO N SO L I D A TE D F I N AN C I AL ST A TE M E N T S
1. STATEMENT OF SIGNIFICANT ACCOUNTING POLICIES (continued) Loss per share
Basic loss per share is calculated by dividing the net loss attributable to members of the parent entity for the reporting period by the weighted average number of ordinary shares of the Company. Fair value measurement
When an asset or liability, financial or non-financial, is measured at fair value for recognition or disclosure purposes, the fair value is based on the price that would be received to sell an asset or paid to transfer a liability in an orderly transaction between market participants at the measurement date; and assumes that the transaction will take place either: in the principle market; or in the absence of a principal market, in the most advantageous market.
Fair value is measured using the assumptions that market participants would use when pricing the asset or liability, assuming they act in their economic best interest. For non-financial assets, the fair value measurement is based on its highest and best use. Valuation techniques that are appropriate in the circumstances and for which sufficient data are available to measure fair value, are used, maximising the use of relevant observable inputs and minimising the use of unobservable inputs.
Assets and liabilities measured at fair value are classified, into three levels, using a fair value hierarchy that reflects the significance of the inputs used in making the measurements. Classifications are reviewed each reporting date and transfers between levels are determined based on a reassessment of the lowest level input that is significant to the fair value measurement.
For recurring and non-recurring fair value measurements, external valuers may be used when internal expertise is either not available or when the valuation is deemed to be significant. External valuers are selected based on market knowledge and reputation. Where there is a significant change in fair value of an asset or liability from one period to another, an analysis is undertaken, which includes a verification of the major inputs applied in the latest valuation and a comparison, where applicable, with external sources of data. Current and non-current classification
Assets and liabilities are presented in the statement of financial position based on current and non-current classification.
An asset is current when: it is expected to be realised or intended to be sold or consumed in normal operating cycle; it is held primarily for the purpose of trading; it is expected to be realised within twelve months after the reporting period; or the asset is cash or cash equivalent unless restricted from being exchanged or used to settle a liability for at least twelve months after the reporting period. All other assets are classified as non-current.
A liability is current when: it is expected to be settled in normal operating cycle; it is held primarily for the purpose of trading; it is due to be settled within twelve months after the reporting period; or there is no unconditional right to defer the settlement of the liability for at least twelve months after the reporting period. All other liabilities are classified as non-current.
Deferred tax assets and liabilities are always classified as non-current. New accounting standards and interpretations that are not yet mandatory
The following standards, amendments to standards and interpretations have been identified as those which may impact the Group in the period of initial application. They have not been applied in preparing this financial report.
(i) AASB 9 Financial Instruments and its consequential amendments
This standard and its consequential amendments are applicable to annual reporting periods beginning on or after 1 January 2018 and completes phases I and III of the IASB's project to replace IAS 39 (AASB 139) 'Financial Instruments: Recognition and Measurement'. This standard introduces new classification and measurement models for financial assets, using a single approach to determine whether a financial asset is measured at amortised cost or fair value. The accounting for financial liabilities continues to be classified and measured in accordance with AASB 139, with one exception, being that the portion of a change of fair value relating to the entity's own credit risk is to be presented in other comprehensive income unless it would create an accounting mismatch. Chapter 6 'Hedge Accounting' supersedes the general hedge accounting requirements in AASB 139 and provides a new simpler approach to hedge accounting that is intended to more closely align with risk management activities undertaken by entities when hedging financial and non-financial risks. The Group will adopt this standard and the amendments from 1 July 2018 but the impact of its adoption is yet to be assessed by the Group.
For
per
sona
l use
onl
y

24
NO T E S TO TH E CO N SO L I D A TE D F I N AN C I AL ST A TE M E N T S
1. STATEMENT OF SIGNIFICANT ACCOUNTING POLICIES (continued) (ii) AASB 15 – Revenue from contracts with customers
This standard is applicable to annual reporting periods beginning on or after 1 January 2018 and an entity will recognise revenue to depict the transfer of promised good or services to customers in an amount that reflects the consideration to which the entity expects to be entitled. This means that revenue will be recognised when control of goods or services is transferred, rather than on transfer of risks and rewards. The Group is yet to fully assess the impact of this standard.
(iii) AASB 16: Leases
This standard is applicable to annual reporting periods commencing on or after 1 January 2019. AASB 16 removes the classification of leases as either operating leases or finance leases for the lessee effectively treating all leases as finance leases. Short term leases (less than 12 months) and leases of a low value are exempt from the lease accounting requirements. Lessor accounting remains similar to current practice. The directors anticipate that the adoption of AASB 16 will not have a material impact on the Group’s revenue recognition and disclosures.
Significant accounting judgements, estimates and assumptions The preparation of the consolidated financial statements requires management to make judgements, estimates and assumptions that affect the reported amounts in the consolidated financial statements. Management continually evaluates its judgements and estimates in relation to assets, liabilities, contingent liabilities, revenue and expenses. Management bases its judgements and estimates on historical experience and on other various factors it believes to be reasonable under the circumstances, the result of which form the basis of the carrying values of assets and liabilities that are not readily apparent from other sources. Actual results may differ from these estimates. Revisions to accounting estimates are recognised in the period in which the estimate is revised and in any future periods affected. In particular, information about significant areas of estimation uncertainty and critical judgements in applying accounting policies that have the most significant effect on the amount recognised in the financial statements are outlined below: Exploration and evaluation expenditure The write-off and carrying forward of exploration acquisition costs is based on an assessment of an area of interest’s viability and/or the existence of economically recoverable reserves. Refer to Note 9 for details. Estimation of useful lives of assets
The estimation of the useful lives of assets has been based on historical experience. The condition of the assets is assessed at least once per year and considered against the remaining useful life. Adjustments to useful lives are made when considered necessary. Depreciation charges are included in Note 8. Deferred taxation
Deferred tax assets in respect of tax losses have not been brought to account as it is not considered probable that future taxable profits will be available against which they could be utilised. Refer to Note 3 for details.
2018
$ 2017
$ 2. AUDITOR’S REMUNERATION
During the year the following fees were paid or payable for services provided by the auditor of the Group and its related practices:
Audit Services PKF Mack - audit of financial report 18,550 34,015
Other Services PKF Mack - tax compliance services 1,200 1,200
19,750 35,215
For
per
sona
l use
onl
y

25
NO T E S TO TH E CO N SO L I D A TE D F I N AN C I AL ST A TE M E N T S
2018
$ 2017
$ 3. INCOME TAX
The prima facie tax payable on the operating loss is reconciled to the income tax provided in the accounts as follows:
Prima facie tax payable on operating loss before income tax at 27.5% (2017: 27.5%)
(58,513) (1,012,932)
Effect of non-deductible item - 340
Increase in deferred tax balances not brought to account 58,513 1,012,592
Income tax expense - -
The following deferred tax balances have not been recognised:
Deferred tax assets at 27.5% (2017: 27.5%):
- Carry forward revenue losses 3,050,768 3,031,058 - Carry forward foreign losses 444,006 444,006
- Unrealised FOREX losses 3,401 3,978 - Fair value on investments 25,936 21,500 - Provisions and accruals 99,265 102,565 - Impairment of assets (PPE) 5,270 -
3,628,646 3,603,107 The tax benefits of the above Deferred Tax Assets will only be obtained if:
(a) The Group derives future assessable income of a nature and of an amount sufficient to enable the benefits to be utilised;
(b) The Group continues to comply with the conditions for deductibility imposed by law; and
(c) No changes in income tax legislation adversely affect the Group in utilising the benefits.
Deferred tax liabilities at 27.5% (2017: 27.5%): - Exploration and evaluation costs - 6,415
- 6,415 The above deferred tax liabilities have not been recognised as they have given rise to the carry forward revenue losses for which the deferred tax asset has not been recognised.
4. CASH AND CASH EQUIVALENTS Cash at bank and in hand 99,170 706,225
The Group’s exposure to interest rate risk and a sensitivity analysis for financial assets and liabilities are disclosed in Note 17.
For
per
sona
l use
onl
y

26
NO T E S TO TH E CO N SO L I D A TE D F I N AN C I AL ST A TE M E N T S
2018
$ 2017
$ 5. TRADE AND OTHER RECEIVABLES
Current
Trade receivables 18,401 18,401 Allowance for impairment loss (a) (18,401) (18,401) - - Tenements bond (NZ) - 2,498 Shire rates refund - 726 - 3,225
Non-Current
Loan to associated entity 337,563 337,563 Provision for non-recovery of loan to associated entity (337,563) (337,563) - -
(a) Trade receivables are non-interest bearing and are generally on 30 day terms. A provision for impairment loss is recognised when there is objective evidence that an individual trade receivable is impaired. There was no impairment loss recognised by the Group in the current year (2017: $nil).
The Group’s exposure to credit risk related to trade and other receivables is disclosed in Note 17.
6. FINANCIAL ASSETS AT FAIR VALUE THROUGH PROFIT OR LOSS
Current Listed ordinary shares 230,680 427,273
Reconciliation of the fair values at the beginning and end of the current financial year are set out below:
Opening fair value 427,273 2,636,701 Additions 834,419 105,002 Disposals (940,239) (652,811) Foreign exchange gain/ (losses) 3,538 (206,479) Fair value losses (94,311) (1,455,140)
Closing fair value 230,680 427,273
Refer to Note 18 for further information on fair value measurement. The Group’s exposure to price risk related to financial assets at fair value through profit or loss is disclosed in Note 17.
7. OTHER CURRENT ASSETS
Prepaid director’s fee 3,987 -
3,987 -
For
per
sona
l use
onl
y

27
NO T E S TO TH E CO N SO L I D A TE D F I N AN C I AL ST A TE M E N T S
8. PROPERTY, PLANT AND EQUIPMENT
Furniture
and fixtures Plant and
equipment Total $ $ $ At 1 July 2017, net of accumulated depreciation 3,654 22,328 25,982 Additions - - - Disposals - - - Depreciation charge for the year (385) (6,432) (6,817) Impairments (3,269) (15,896) (19,165)
At 30 June 2018, net of accumulated depreciation - - -
At 30 June 2018
Cost 9,060 206,690 215,750
Accumulated depreciation & impairments (9,060) (206,690) (215,750) Net carrying amount - - -
At 1 July 2016, net of accumulated depreciation 4,084 35,377 39,461 Additions - - - Disposals - - - Depreciation charge for the year (430) (13,049) (13,479)
At 30 June 2017, net of accumulated depreciation 3,654 22,328 25,982
At 30 June 2017
Cost 9,060 206,690 215,750
Accumulated depreciation (5,406) (184,362) (189,768) Net carrying amount 3,654 22,328 25,982
2018
$ 2017
$ 9. EXPLORATION AND EVALUATION ASSETS Exploration and evaluation costs carried forward in respect of areas of
interest - 23,328
Reconciliation Carrying amount at beginning of the year 23,328 1,391,864
Exploration and evaluation 24,077 42,230 Exploration expenditure written-off (3,448) (1,430,455) Transfer from prepayments - 19,689 Impairment of exploration and evaluation assets (43,957) - Carrying amount at end of the year - 23,328
The value of the exploration and evaluation costs carried forward is dependent upon the continuance of the Group’s rights to tenure of the area of interest, the results of future exploration, and the recoupment of costs through successful development and exploitation of the areas of interest or alternatively by their sale. Impairment expenses have been recognised for both acquisition costs and capitalised exploration expenditure due to the relinquishment of various tenements which the Directors have decided to be not commercial.
For
per
sona
l use
onl
y

28
NO T E S TO TH E CO N SO L I D A TE D F I N AN C I AL ST A TE M E N T S
2018
$ 2017
$ 10. TRADE AND OTHER PAYABLES
Trade creditors 23,204 6,181 Other creditors and accruals 69,853 49,046
93,057 55,227
The carrying amount of trade and other payables approximates their fair value. The Group’s exposure to credit and liquidity risks related to trade and other payables are disclosed in Note 17.
11. LOANS AND BORROWINGS
Current Short-term margin loan 17,359 694,621
Non-current Loan from other parties 1,378 1,378
The Company had a short-term margin facility associated with its investments in a portfolio of listed ordinary shares (“Margin Facility”). The Margin Facility was an open-ended loan facility where the provider provides margin financing to the Company based on two variables: the level of collateral pledged as security and the assigned risk of the securities purchased. Each listed security is assigned an individual Loan-to-Valuation (LVR) which is the second variable in determining the size of the facility. The collateral can take the form of cash or other unencumbered listed securities. Refer Note 23 for offsetting financial assets and financial liabilities. Refer Note 24 for assets pledged as collateral for the Margin Facility. The facility was cancelled during the year. The Group’s exposure to credit and liquidity risks related to loans and borrowings are disclosed in Note 17.
12. CONTRIBUTED EQUITY
697,832,100 fully paid ordinary shares (2017: 697,832,100) 26,929,247 26,929,247 Share issue costs (2,391,279) (2,391,279) 24,537,968 24,537,968
(a) Ordinary shares No movements in ordinary share capital occurred during the year. Ordinary shares entitle the holder to participate in dividends and the proceeds from winding up of the Company in proportion to the number and amounts paid on the shares held. The fully paid ordinary shares have no par value and the Company does not have a limited amount of authorised capital.
On a show of hands every holder of ordinary securities present at a shareholder meeting in person or by proxy is, entitled to one vote, and upon a poll each share is entitled to one vote.
There is no current on-market share buy-back. (b) Unissued shares under option At the date of this report, there are no unissued ordinary shares of the Company under option.
For
per
sona
l use
onl
y

29
NO T E S TO TH E CO N SO L I D A TE D F I N AN C I AL ST A TE M E N T S
12. CONTRIBUTED EQUITY (continued)
(c) Capital management When managing capital, the Board’s objective is to ensure the entity continues as a going concern as well as to maintain optimal returns to shareholders and benefits for other stakeholders. The Board also aims to maintain a capital structure that ensures the lowest cost of capital available to the Group.
The Board is constantly adjusting the capital structure to take advantage of favourable costs of capital or high return on assets. As the market is constantly changing, management may issue new shares, sell assets to reduce debt or consider payment of dividends to shareholders.
The Board seeks to maintain a balance between the higher returns that might be possible with higher levels of borrowings and the advantages and security afforded by a sound capital position although there is no formal policy regarding gearing levels.
The Group has no formal financing and gearing policy or criteria during the year having regard to the early status of its development and low level of activity. There were no changes in the Group’s approach to capital management during the year. The Group is not subject to any externally imposed capital requirements.
2018
$ 2017
$ 13. ACCUMULATED LOSSES
Accumulated losses at the beginning of the year (24,103,151) (20,419,761) Net loss for the year (212,774) (3,683,390)
Accumulated losses at the end of the year (24,315,925) (24,103,151)
14. INVESTMENT IN ASSOCIATES Set out below are the associates of the Company as at 30 June 2018 which have been accounted under the equity method. The entities listed below have share capital consisting solely of ordinary shares, which are held directly by the Company. The country of incorporation or registration is also their principal place of business, and the proportion of ownership interest is the same as the proportion of voting rights held.
Name of entity
Place of business/country of incorporation
% of ownership interest Quoted fair value* Carrying amount
2018 2017 2018 2017 2018 2017
Siburan Engineering Pty Ltd Australia - 50% - - - $10
* Private entities – no quoted price available.
Siburan Engineering Pty Ltd was deregistered during the year.
15. COMMITMENTS AND CONTINGENCIES
Exploration project commitments The Group does not have any exploration project commitments at reporting date. 2018
$ 2017
$ Within one year - 60,629 After one year but not more than five years - 191,040 - 251,669
Contingencies
The Group does not have any contingent liabilities at reporting date.
For
per
sona
l use
onl
y
30
NO T E S TO TH E CO N SO L I D A TE D F I N AN C I AL ST A TE M E N T S
16. LOSS PER SHARE
Basic and diluted loss per share The calculation of basic loss per share at 30 June 2018 was based on the following:
2018
$ 2017
$ Loss attributable to ordinary shareholders
Net loss for the year 212,774 3,683,390
Weighted average number of ordinary shares Number Number
Balance at beginning of year 697,832,100 697,832,100 Movements during the year - -
697,832,100 697,832,100
Diluted earnings per share must be calculated where potential ordinary shares on issue are dilutive. As the potential ordinary shares on issue would decrease the loss per share in the current year, they are not considered dilutive, and not shown.
17. FINANCIAL RISK MANAGEMENT
Overview Risk management is carried out under policies set by the Board of Directors. The Board provides principles for overall risk management, as well as policies covering specific areas. The Board monitors and manages the financial risk relating to the operations of the Group. The Group’s activities include exposure to market risk, credit risk and liquidity risk. Financial risk management objectives The overall financial risk management strategy focuses on the unpredictability of the finance markets and seeks to minimise the potential adverse effects on financial performance and protect future financial security. The Group holds the following financial instruments as at 30 June:
2018
$ 2017
$ Financial assets
Cash and cash equivalents 99,170 706,225 Trade and other receivables - 3,225 Financial assets at fair value through profit or loss 230,680 427,273
329,850 1,136,723
Financial liabilities
Trade and other payables 93,057 55,227 Borrowings 18,737 695,999
111,794 751,226
For
per
sona
l use
onl
y

31
NO T E S TO TH E CO N SO L I D A TE D F I N AN C I AL ST A TE M E N T S
17. FINANCIAL RISK MANAGEMENT (continued)
Market risk Market risk is the risk that changes in market prices, such as interest rates and commodity prices will affect the Group’s income or the value of its holdings of financial instruments. The objective of market risk management is to manage and control market risk exposures within acceptable parameters, while optimising return. There were no changes in the Group’s market risk management policies from previous years. Foreign exchange risk The Group undertakes certain transactions denominated in foreign currency and is exposed to foreign currency risk through foreign exchange rate fluctuations. Foreign exchange risk arises from future commercial transactions and recognised financial assets and financial liabilities denominated in a currency that is not the entity's functional currency. The risk is measured using sensitivity analysis and cash flow forecasting. The carrying amount of the Group’s foreign currency denominated financial assets and financial liabilities at the reporting date were as follows:
Assets Liabilities
2018
$ 2017
$ 2018
$ 2017
$
New Zealand dollars 11,963 5,614 - - US dollars - - 17,359 694,621 Malaysian ringgit 230,680 542,581 - - 242,643 548,195 17,359 694,621
The Group had net asset denominated in foreign currencies of $225,284 as at 30 June 2018 (2017: net liabilities of $146,426 (assets of $548,195 less liabilities of $ 694,621)). Based on this exposure, had the Australian dollar weakened/strengthened by 10% (2017: 10%) against these foreign currencies with all other variables held constant, the Group’s net loss for the year would have been $22,528 lower/higher (2017: $14,643 higher/lower) and equity would have been $22,528 higher/lower (2017: $14,643 lower/higher). The percentage change is the expected overall volatility of the significant currencies, which is based on management’s assessment of reasonable possible fluctuations taking into consideration movements over the last 6 months each year and the spot rate at each reporting date. The actual foreign exchange loss for the year ended 30 June 2018 was $13,146 (2017: loss of $191,555). The Board does not consider the Group is materially exposed to changes in foreign exchange rates. As a result, the Group does not currently seek to mitigate its foreign currency exposures. Price risk The Group’s exposure to equity securities price risk arises from investments held by the Group and classified in the statement of financial position as financial assets at fair value through profit or loss. To manage its price risk arising from investments in equity securities, the Group diversifies its portfolio. The majority of the Group’s equity investments are publicly traded on the Bursa Malaysia (KLSE). Sensitivity A change of 10% of KLSE indexe would have increased/ (decreased) the Group’s equity and profit or loss by $23,068 (2017: $42,727). The analysis is based on the assumption that the equity indexes had increased/(decreased) by 10% with all other variables held constant, and that all the Group’s equity instruments moved in line with the indexes.
For
per
sona
l use
onl
y

32
NO T E S TO TH E CO N SO L I D A TE D F I N AN C I AL ST A TE M E N T S
17. FINANCIAL RISK MANAGEMENT (continued)
Interest rate risk
The Group’s exposure to interest rates primarily relates to the Group’s cash and short term deposits at bank. The Group manages market risk by monitoring levels of exposure to interest rate risk and assessing market forecasts for interest rates. At the reporting date the interest rate profile of the Group’s interest bearing financial instruments was:
2018
$ 2017
$ Variable rate instruments Cash at bank - 58,329 Short-term margin loans - (694,621)
Cash flow sensitivity analysis for variable rate instruments A change of 75 basis points in interest rates at reporting date would have increased/(decreased) the Group’s equity and profit or loss by nil (2017: $4,772). The Board assessed a 75 basis point movement as being reasonably possible based on short term historical movements. This analysis assumes that all other variables remain constant. Other market price risk The Group is involved in the exploration and development of mining tenements for minerals. Should the Group successfully progress to a producer, revenues associated with mineral sales, and the ability to raise funds through equity and debt, will have some dependence upon commodity prices. Credit risk Credit risk is the risk of financial loss to the Group if a counterparty to a financial instrument fails to meet its contractual obligations, and arises principally from the Group’s cash and cash equivalents and trade and other receivables.
The Group does not hold any credit derivatives to offset its credit exposure.
The credit quality of financial assets that are neither past due nor impaired can be assessed by reference to external credit rating (Standard & Poor’s) if available or to historical information about counterparty default rates:
2018 $
2017 $
Cash at bank and short-term bank deposits A-1+1 11,963 3,116 A-21 87,104 55,261 Counterparties without external credit rating – no default 103 647,848 99,170 706,225 Trade and other receivables2 Counterparties without external credit rating – no default - 3,225
- 3,225 Amounts in the above table include all trade and other receivables at reporting date that were not impaired. 1. The equivalent S&P rating of the financial assets represents that rating of the counterparty with whom the
financial asset is held rather than the rating of the financial asset itself. 2. Trade and other receivables consist of security bonds and deposits.
For
per
sona
l use
onl
y
33
NO T E S TO TH E CO N SO L I D A TE D F I N AN C I AL ST A TE M E N T S
17. FINANCIAL RISK MANAGEMENT (continued) Liquidity risk Liquidity risk arises from the financial liabilities of the Group and the Group’s subsequent ability to meet their obligations to repay their financial liabilities as and when they fall due. Ultimate responsibility for liquidity risk management rests with the Board of Directors. The Board has determined an appropriate liquidity risk management framework for the management of the Group’s short, medium and long-term funding and liquidity management requirements. The Group manages liquidity risk by maintaining adequate reserves and continuously monitoring budgeted and actual cash flows and matching the maturity profiles of financial assets, expenditure commitments and liabilities. There were no changes in the Group’s liquidity risk management policies from previous years. The following are the contractual maturities of financial liabilities on an undiscounted basis, including estimated interest payments. Cash flows for liabilities without fixed amount or timing are based on conditions existing at year end.
30 June 2018 Carrying amount Contractual cash flows 1 year 2-5 years Trade and other payables 93,057 (93,057) (93,057) - Loans and borrowings 18,737 (18,737) (17,359) (1,378) 111,794 (111,794) (110,416) (1,378)
30 June 2017 Trade and other payables 55,227 (55,227) (55,227) - Loan from related party 695,999 (695,999) (694,621) (1,378) 751,226 (751,226) (749,848) (1,378)
Fair value of financial instruments Unless otherwise stated, the carrying amounts of financial instruments reflect their fair value.
18. FAIR VALUE MEASUREMENT The fair value of financial assets and liabilities must be estimated for recognition and measurement or for disclosure purposes. AASB 7 Financial Instruments Disclosures requires disclosure of fair value measurements by level of the following fair value measurement hierarchy:
(a) quoted prices (unadjusted) in active markets for identical assets or liabilities (level 1) (b) inputs other than quoted prices included within level 1 that are observable for the asset or liability, either
directly (as prices) or indirectly (derived from prices) (level 2), and (c) inputs for the asset or liability that are not based on observable market data (unobservable inputs) (level 3). The following tables detail the Group’s assets and liabilities, measured or disclosed at fair value, using the above measurement hierarchy:
30 June 2018 Level 1 Level 2 Level 3 Total $ $ $ $ Ordinary shares at fair value through profit or loss 230,680 - - 230,680
30 June 2017 Level 1 Level 2 Level 3 Total $ $ $ $ Ordinary shares at fair value through profit or loss 427,273 - - 427,273
Valuation techniques used to determine fair value Specific valuation techniques used to value financial instruments include:
quoted market prices or dealer quotes for similar instruments, this is used for level 1 financial assets and liabilities;
discounted cash flow analysis, this is used for level 3 financial assets and liabilities.
For
per
sona
l use
onl
y

34
NO T E S TO TH E CO N SO L I D A TE D F I N AN C I AL ST A TE M E N T S
19. KEY MANAGEMENT PERSONNEL
Details of key management personnel
The following were key management personnel of the Group at any time during the year and unless otherwise indicated were key management personnel for the entire year:
Name Position held
Neil Sheather Executive Director Dale Klynhout Non-Executive Director (appointed 11 December 2017) Chiong Ong Tiong Non-Executive Director Maofeng Ding Non-Executive Director Larry Feng Yi Li Non-Executive Director (resigned 13 April 2018)
Key management personnel compensation
2018
$ 2017
$
Short-term employee benefits 62,613 104,703 Post-employment benefits - 5,938
Total compensation 62,613 110,641
Detailed remuneration disclosures are provided in the Remuneration Report on pages 7 to 10.
20. RELATED PARTY DISCLOSURES
(a) Parent entity Siburan Resources Limited is the parent entity. (b) Subsidiaries The Group’s interests in subsidiaries as at 30 June 2018 are set out below. Unless otherwise stated, the subsidiaries have share capital consisting solely of ordinary shares that are held directly by the Group, and the proportion of ownership interests held equals the voting rights held by the Group. The country of incorporation is also their principal place of business.
Name of entity
Place of business/ country of
incorporation
Ownership interest held by the Group Principal
activities 2018 2017
Premium King Investments Limited Republic of Seychelles 100% 100%
Security investments
The Company received a total return of capital of $114,422 from the subsidiaries during the year (2017: nil). (c) Key management personnel compensation Details relating to key management personnel and their remuneration are disclosed in Note 19. (d) Other transactions with related parties The Group did not have any other transactions with related parties during the year.
For
per
sona
l use
onl
y

35
NO T E S TO TH E CO N SO L I D A TE D F I N AN C I AL ST A TE M E N T S
21. SEGMENT REPORTING
The Group operates predominantly in the mineral exploration industry in Australia. For management purposes, the Group is organised into one main operating segment which involves the exploration for minerals. All of the Group’s activities are inter-related and discrete financial information is reported to the Board (Chief Operating Decision Maker) as a single segment. Accordingly, all significant operating decisions are based upon analysis of the Group as one segment. The financial results from this segment are equivalent to the financial results of the Group as a whole.
2018
$ 2017
$ 22. RECONCILIATION OF CASH FLOWS USED IN OPERATING ACTIVITIES
Cash flows used in operating activities
Loss for the year (212,774) (3,683,390) Adjustments for: Investment (income)/loss (144,869) 313,148 Depreciation 6,816 13,479
Exploration expenditure written-off - 1,430,455 Impairment of assets 42,494 - Foreign exchange losses 13,146 191,555 Fair value loss on financial assets at FVPL 94,311 1,455,140
Operating loss before changes in working capital and provisions (200,876) (279,613) Change in trade and other receivables 3,225 2,333 Change in other current assets (3,987) 13,524 Change in trade and other payables 34,323 15,993 Change in provisions - (13,598)
Net cash used in operating activities (167,315) (261,361) Non-cash investing and financing activities There were no non-cash investing and financing activities during the financial year.
23. OFFSETTING FINANCIAL ASSETS AND FINANCIAL LIABILITIES
Financial assets and liabilities are offset and the net amount reported in the Statement of Financial Position where the Group currently has a legally enforceable right to offset the recognised amounts, and there is an intention to settle on a net basis or realise the asset and settle the liability simultaneously. The following table presents the recognised financial instruments that are offset, or subject to enforceable master netting arrangements and other similar agreements but not offset, as at 30 June 2018. The column ‘net amount’ shows the impact on the Group’s Statement of Financial Position if all set-off rights were exercised.
Effects of offsetting on the Statement of
Financial Position Related amounts not offset
2018
Gross amounts
Gross amounts set off in the Statement of
Financial Position
Net amounts presented in the
Statement of Financial Position
Financial instrument collateral*
Net amounts
Financial assets Cash and cash equivalents 320,000 (320,000) - - - Financial assets at FVPL 230,680 - 230,680 - 230,680 Total 550,680 (320,000) 230,680 - 230,680 Financial liabilities Borrowings 337,359 (320,000) (17,359) - (17,359) Total 337,359 (320,000) (17,359) - (17,359)
For
per
sona
l use
onl
y
36
NO T E S TO TH E CO N SO L I D A TE D F I N AN C I AL ST A TE M E N T S
23. OFFSETTING FINANCIAL ASSETS AND FINANCIAL LIABILITIES (continued)
Effects of offsetting on the Statement of
Financial Position Related amounts not offset
2017
Gross amounts
Gross amounts set off in the Statement of
Financial Position
Net amounts presented in the
Statement of Financial Position
Financial instrument collateral*
Net amounts
Financial assets Cash and cash equivalents 532,437 - 532,437 (532,437) - Financial assets at FVPL 427,273 - 427,273 (162,184) 265,089 Total 959,710 - 959,710 (694,621) 265,089 Financial liabilities Borrowings 694,621 - 694,621 (694,621) - Total 694,621 - 694,621 (694,621) -
*The Group has pledged financial instruments as collateral against its borrowings. Refer Note 24 for further information on financial collateral pledged as security against borrowings.
24. ASSETS PLEDGED AS SECURITY The carrying amounts of assets pledged as security for borrowings are:
2018 $
2017 $
Current
Cash and cash equivalents - 532,437
Financial assets at FVPL 230,680 427,273
Total 230,680 959,710
25. PARENT ENTITY FINANCIAL INFORMATION
Set out below is the supplementary information about the parent entity.
Statement of profit or loss and other comprehensive income
Parent
2018
$ 2017
$ Loss after income tax (97,467) (3,683,390) Total comprehensive loss (97,467) (3,683,390) Statement of financial position
Total current assets 449,145 1,136,723 Total assets 449,145 1,186,043 Total current liabilities 110,416 749,848 Total liabilities 111,794 751,226 Equity
Issued capital 24,537,968 24,537,968 Retained earnings (24,200,617) (24,103,151)
Total equity 337,351 434,817
For
per
sona
l use
onl
y

37
NO T E S TO TH E CO N SO L I D A TE D F I N AN C I AL ST A TE M E N T S
25. PARENT ENTITY FINANCIAL INFORMATION (continued)
Guarantees entered into by the parent entity The parent entity did not provide any financial guarantees during the financial year (2017: nil). Contingent liabilities The parent entity had no contingent liabilities as at 30 June 2018 and 30 June 2017. Capital commitments - Property, plant and equipment The parent entity had no capital commitments for property, plant and equipment at as 30 June 2018 and 30 June 2017.
26. EVENTS SUBSEQUENT TO REPORTING DATE There has not arisen in the interval between the end of the year and the date of this report any item, transaction or event of a material and unusual nature likely to affect significantly the operations of the Group, the results of those operations, or the state of affairs of the Group in future financial years.
For
per
sona
l use
onl
y
38
D I R E C TO R S ’ DE C L A RA T I O N
In the opinion of the directors of Siburan Resources Limited: (a) the financial statements and notes set out on pages 13 to 37 are in accordance with the Corporations Act 2001,
including:
(i) giving a true and fair view of the Group’s financial position as at 30 June 2018 and of its performance, for the financial year ended on that date; and
(ii) complying with Australian Accounting Standards, the Corporations Regulations 2001 and other
mandatory professional reporting requirements; and (b) the financial report also complies with International Financial Reporting Standards as disclosed in Note 1; (c) there are reasonable grounds to believe that the Group will be able to pay its debts as and when they become
due and payable. Signed in accordance with a resolution of the directors made pursuant to section 295(5)(a) of the Corporations Act 2001.
Neil Sheather Executive Director Dated at Perth this 21st day of September 2018
For
per
sona
l use
onl
y

39
INDEPENDENT AUDITOR’S REPORT
TO THE MEMBERS OF SIBURAN RESOURCES LIMITED Report on the Financial Report
Opinion
We have audited the accompanying financial report of Siburan Resources Limited (the company), which comprises the consolidated statement of financial position as at 30 June 2018, the consolidated statement of profit or loss and other comprehensive income, the consolidated statement of changes in equity and the consolidated statement of cash flows for the year then ended, notes comprising a summary of significant accounting policies and other explanatory information, and the directors’ declaration of the company and the consolidated entity comprising the company and the entities it controlled at the year’s end or from time to time during the financial year. In our opinion the financial report of Siburan Resources Limited is in accordance with the Corporations Act 2001, including:
i) Giving a true and fair view of the consolidated entity’s financial position as at 30 June 2018
and of its performance for the year ended on that date; and
ii) Complying with Australian Accounting Standards and the Corporations Regulations 2001.
Basis for Opinion
We conducted our audit in accordance with Australian Auditing Standards. Those standards require that we comply with relevant ethical requirements relating to audit engagements and plan and perform the audit to obtain reasonable assurance about whether the financial report is free from material misstatement. Our responsibilities under those standards are further described in the Auditor’s Responsibility section of our report. We believe that the audit evidence we have obtained is sufficient and appropriate to provide a basis for our opinion.
Emphasis of Matter – Material Uncertainty Related to Going Concern
Without modifying our opinion, we draw attention to Note 1 in the financial report which indicates that the consolidated entity incurred a net loss after tax of $212,774 and net operating cash outflows of $167,315 during the year ended 30 June 2018. These conditions, along with other matters as set forth in Note 1, indicate the existence of a material uncertainty that may cast significant doubt about the company’s and consolidated entity’s ability to continue as a going concern and therefore, the company and consolidated entity may be unable to realise its assets and discharge its liabilities in the normal course of business.
The financial report of the company and consolidated entity does not include any adjustments in relation to the recoverability and classification of recorded asset amounts or to the amounts and classification of liabilities that might be necessary should the company and consolidated entity not continue as a going
concern.
Independence
We are independent of the consolidated entity in accordance with the Corporations Act 2001 and the ethical requirements of the Accounting Professional and Ethical Standards Board’s APES 110 Code of Ethics for Professional Accountants (the code) that are relevant to our audit of the financial report in Australia. We have also fulfilled our other ethical responsibilities in accordance with the Code.
For
per
sona
l use
onl
y

40
Key Audit Matters
Key audit matters are those matters that, in our professional judgement, were of most significance in our audit of the financial report of the current year. This matter is addressed in the context of our audit of the financial report as a whole, and in forming our opinion thereon, and we do not provide a separate opinion on this matter. For the matter below, our description of how our audit addressed the matter is provided in that context.
1. Carrying value of Financial Assets
Why significant How our audit addressed the key audit matter
As at 30 June 2018 the carrying value of financial assets was $230,680 (2017: $427,273), as disclosed in Note 6 and 18. The consolidated entity’s accounting policy in respect of financial assets is outlined in Note 1. Significant judgement is required:
in determining the fair value of the financial
assets in accordance with Australian
Accounting Standard AASB 139 Financial
Instruments: Recognition and Measurement
(“AASB 139”); and
in determining the correct accounting
treatment of purchases and sales in
accordance with AASB 139.
Our work included, but was not limited to, the following procedures: testing the company’s fair value calculation and
tracing the calculation inputs to supporting
documentation;
assessing the movement in the financial assets
through examination of supporting documentation;
and
assessing the appropriateness of the related
disclosures in Note 1, 6 and 18.
Other Information Other information is financial and non-financial information in the annual report of the consolidated entity which is provided in addition to the Financial Report and the Auditor’s Report. The directors are responsible for Other Information in the annual report. The Other Information we obtained prior to the date of this Auditor’s Report was the Review of Activities Report, Shareholder information, Summary of tenements and the Director’s report. The remaining Other Information is expected to be made available to us after the date of the Auditor’s Report. Our opinion on the Financial Report does not cover the Other Information and, accordingly, the auditor does not and will not express an audit opinion or any form of assurance conclusion thereon, with the exception of the Remuneration Report.
For
per
sona
l use
onl
y

41
In connection with our audit of the Financial Report, our responsibility is to read the Other Information. In doing so, we consider whether the Other Information is materially inconsistent with the Financial Report or our knowledge obtained in the audit, or otherwise appears to be materially misstated. We are required to report if we conclude that there is a material misstatement of this Other Information in the Financial Report and based on the work we have performed on the Other Information that we obtained prior
the date of this Auditor’s Report we have nothing to report. Directors’ Responsibilities for the Financial Report
The Directors of the company are responsible for the preparation of the financial report that gives a true and fair view in accordance with Australian Accounting Standards and the Corporations Act 2001 and for such internal control as the Directors determine is necessary to enable the preparation of the financial report that gives a true and fair view and is free from material misstatement, whether due to fraud or error. In Note 1, the Directors also state, in accordance with Australian Accounting Standard AASB 101 Presentation of Financial Statements, that the financial report complies with International Financial Reporting Standards. In preparing the financial report, the Directors are responsible for assessing the consolidated entity’s ability to continue as a going concern, disclosing, as applicable, matters related to going concern and using a going concern basis of accounting unless the Directors either intend to liquidate the consolidated entity or to cease operations, or have no realistic alternative but to do so.
Auditor’s Responsibilities for the Audit of the Financial Report
Our responsibility is to express an opinion on the financial report based on our audit. Our objectives are to obtain reasonable assurance about whether the financial report as a whole is free from material misstatement, whether due to fraud or error, and to issue an auditor’s report that includes our opinion. Reasonable assurance is a high level of assurance, but is not a guarantee that an audit conducted in accordance with Australian Auditing Standards will always detect a material misstatement when it exists. Misstatements can arise from fraud or error and are considered material if, individually or in aggregate, they could reasonably be expected to influence the economic decisions of users taken on the basis of this financial report. As part of an audit in accordance with Australian Auditing Standards, we exercise professional judgement and maintain professional scepticism throughout the audit. An audit involves performing procedures to obtain audit evidence about the amounts and disclosures in the
financial report. The procedures selected depend on the auditor’s judgement, including assessment of the risks of material misstatement of the financial report, whether due to fraud or error. In making those risk assessments, the auditor considers internal control relevant to the entity’s preparation of the financial report that gives a true and fair view in order to design audit procedures that are appropriate in the circumstances, but not for the purpose of expressing an opinion on the effectiveness of the entity’s internal control.
The risk of not detecting a material misstatement resulting from fraud is higher than for one resulting from error, as fraud may involve collusion, forgery, intentional omissions, misrepresentations, or the override of internal control.
For
per
sona
l use
onl
y
42
An audit also includes evaluating the appropriateness of accounting policies used and the reasonableness of accounting estimates made by the Directors, as well as evaluating the overall presentation of the financial report. We conclude on the appropriateness of the Directors’ use of the going concern basis of accounting and, based on the audit evidence obtained, whether a material uncertainty exists related to events or conditions that may cast significant doubt on the consolidated entity’s ability to continue as a going concern. If we conclude that a material uncertainty exists, we are required to draw attention in our auditor’s report to the related disclosures in the financial report or, if such disclosures are inadequate, to modify our opinion. Our conclusions are based on the audit evidence obtained up to the date of our auditor’s report. However, future events or conditions may cause the consolidated entity to cease to continue as a going concern. We evaluate the overall presentation, structure and content of the financial report, including the disclosures, and whether the financial report represents the underlying transactions and events in a manner that achieves fair presentation. We obtain sufficient appropriate audit evidence regarding the financial information of the entities or business activities within the consolidated entity to express an opinion on the financial report. We are responsible for the direction, supervision and performance of the audit. We remain solely responsible for our audit opinion. We communicate with the Directors regarding, among other matters, the planned scope and timing of the audit and significant audit findings, including any significant deficiencies in internal control that we identify during our audit. The Auditing Standards require that we comply with relevant ethical requirements relating to audit engagements. We also provide the Directors with a statement that we have complied with relevant ethical requirements regarding independence, and to communicate with them all relationships and other matters that may reasonably be thought to bear on our independence, and where applicable, related safeguards. From the matters communicated with the Directors, we determine those matters that were of most significance in the audit of the financial report of the current period and are therefore key audit matters. We describe these matters in our auditor’s report unless law or regulation precludes public disclosure about the matter or when, in extremely rare circumstances, we determine that a matter should not be communicated in our report because the adverse consequences of doing so would reasonably be expected to outweigh the
public interest benefits of such communication. Report on the Remuneration Report
We have audited the Remuneration Report included in the directors’ report for the year ended 30 June 2018.
Opinion
In our opinion, the Remuneration Report of Siburan Resources Limited for the year ended 30 June 2018, complies with section 300A of the Corporations Act 2001.
For
per
sona
l use
onl
y

43
Responsibilities
The directors of the company are responsible for the preparation and presentation of the Remuneration Report in accordance with section 300A of the Corporations Act 2001. Our responsibility is to express an opinion on the Remuneration Report, based on our audit conducted in accordance with Australian Auditing Standards.
PKF MACK
SHANE CROSS PARTNER
21 SEPTEMBER 2018 WEST PERTH WESTERN AUSTRALIA
For
per
sona
l use
onl
y

44
AUDITOR’S INDEPENDENCE DECLARATION
TO THE DIRECTORS OF SIBURAN RESOURCES LIMITED
In relation to our audit of the financial report of Siburan Resources Limited for the year ended 30 June 2018, to the best of my knowledge and belief, there have been no contraventions of the auditor independence requirements of the Corporations Act 2001 or any applicable code of professional conduct.
PKF MACK
SHANE CROSS PARTNER
21 SEPTEMBER 2018 WEST PERTH, WESTERN AUSTRALIA
For
per
sona
l use
onl
y

45
SH A RE H O L D E R IN FO RM A T I O N
Details of shares and options as at 21 September 2018: Top holders The 20 largest registered holders of each class of quoted security as at 21 September 2018 were:
Fully paid ordinary shares Name No. of Shares %
1. Citicorp Nominees Pty Ltd 443,766,500 63.59 2. Mejority Capital Limited 68,034,850 9.75 3. J P Morgan Nominees Australia Ltd 46,500,000 6.66 4. Hunan Australia Mining Pty Ltd 30,600,000 4.38 5. Mrs Serng Yee Liew 13,000,000 1.86 6. Silver Capital Pty Ltd <Noel & Sandra Ong S/F A/C> 10,705,000 1.53 7. HSBC Custody Nominees Australia Ltd 10,000,000 1.43 8. RH Resources Limited 10,000,000 1.43 9. BNP Paribas Nominees Pty Ltd <Global Prime OMNI DRP> 5,010,000 0.72 10. HRH Tunku Naquiyuddin 5,000,000 0.72 11. Bryan W & Helen J Alexander <Alexander Super Fund A/C > 4,190,000 0.60 12. Frichot Maxime 4,163,913 0.60 13. Mr Kah Hui Tan & Mrs Irene Soi Khim 3,000,000 0.43 14. Silver Capital Pty Ltd <Noel & Sandra Ong Super Fund A/C> 2,335,000 0.33 15. DBS Vickers Securities (Singapore) Pte Ltd <Client Account> 2,222,500 0.32 16. GA & AM Leaver Investments Pty Ltd <GA & AM Leaver Super Fund A/C> 2,050,699 0.29 17. Lightglow Enterprises Pty Ltd <Paloma Investments A/C> 1,856,500 0.27 18. EST Mr Trevor Neil Hay 1,381,250 0.21 19. Madam Anna Chong 1,373,050 0.21 20. Silver Capital Pty Ltd <N & S Ong Super Fund A/C> 1,210,000 0.17
666,399,262 95.50
Distribution schedules A distribution schedule of each class of quoted equity security as at 21 September 2018:
Fully paid ordinary shares Range Holders Units %
1 - 1,000 11 780 0.00 1,001 - 5,000 14 48,673 0.01 5,001 - 10,000 136 1,325,193 0.19
10,001 - 100,000 222 7,345,467 1.05 100,001 - Over 82 689,111,987 98.75
Total 465 697,832,100 100.00
F
or p
erso
nal u
se o
nly

46
SH A RE H O L D E R IN FO RM A T I O N
Substantial shareholders The names of substantial shareholders and the number of shares to which each substantial shareholder and their associates have a relevant interest, as disclosed in substantial shareholding notices given to the Company, are set out below:
Substantial shareholder Number of Shares
Union City Venture Ltd 417,360,000 Mejority Capital Limited 68,034,850 Vcap Global Incorporated 46,500,000
Restricted Securities As at 21 September 2018, the Company had no restricted securities. Unmarketable parcels Holdings less than a marketable parcel of ordinary shares (being 166,667 shares as at 21 September 2018):
Holders Units
427 18,601,416
Voting Rights The voting rights attaching to ordinary shares are: On a show of hands every member present in person or by proxy shall have one vote and upon a poll each share shall have one vote. On-Market Buy Back There is no current on-market buy-back. Principles of Good Corporate Governance and Recommendations The Board has adopted and approved the Company’s Corporate Governance Statement, which can be found on the Company’s website at www.siburan.com.au.
For
per
sona
l use
onl
y