for personal use only - asx · 3/29/2012 · final dividends interim dividends 2 cent cobalt sale...
TRANSCRIPT

29 March 2012
Manager Manager Company Announcements Office Market Information Services Section Australian Securities Exchange New Zealand Stock Exchange Level 4, 20 Bridge Street Level 2, NZX Centre, 11 Cable Street Sydney NSW 2000 Wellington New Zealand Announcement No: 08/2012 AMP Limited (ASX/NZX: AMP) (Also for cross-release to AMP Group Finance Services Limited (ASX: AQNHA & NZX: AQN010)
Part 1: Annual Report 2011 Part 2: Shareholder Review 2011 Part 3: Notice of Annual General Meeting 2012, Proxy Form and Mobile Voting Flyer
For
per
sona
l use
onl
y

Annual Report 2011
For
per
sona
l use
onl
y

Contents
1 Chairman’s foreword2 Five-year fi nancial summary3 2011 results at a glance4 Directors’ Report12 Remuneration Report30 Analysis of shareholder profi t31 Corporate Governance Statement38 Income statement39 Statement of comprehensive income40 Statement of fi nancial position41 Statement of changes in equity43 Statement of cash fl ows44 Notes to the fi nancial statements126 Directors’ declaration127 Independent auditor’s report128 Shareholder informationIBC Glossary
Annual Report 2011All amounts are in Australian dollars, unless otherwise specifi ed. The information in this report is current as at 2 March 2012.
AMP Limited ABN 49 079 354 519
A new mark for a new era
The merger between AMP and AXA’s Australian and New Zealand businesses is creating a new competitive force in fi nancial services. Together we are new AMP.
Together, we’re Australia’s favourite for advice, superannuation, and personal insurance.
To symbolise this new chapter in AMP’s history, we have introduced a new brand mark – the AMP Spark.
Named by our customers, in the face of life’s twists and turns, it represents their possibilities. At AMP, ever since we were founded in 1849, we have always believed that it’s our job to help turn those possibilities, those plans and aspirations into a better tomorrow for everyone.
The mark may be new but our enduring commitment to helping Australians and New Zealanders realise their dreams and own their tomorrows remains unchanged.F
or p
erso
nal u
se o
nly

1Chairman’s foreword
Welcome to AMP’s 2011 Annual Report In 2011, your company embarked on a journey that has made the Australian and New Zealand fi nancial services sector more competitive. Our 2011 fi nancial results demonstrate that we are making good progress, showing a new, stronger, more competitive AMP. An AMP that is reaching more customers and clients – in Australia, New Zealand and in targeted overseas markets – with more innovative products and investment capabilities.
We have achieved much of this through our merger with the Australian and New Zealand businesses of AXA Asia Pacifi c Holdings. The combination of our two great companies is creating a strong and unique platform for future growth. The merger itself is progressing well on all our key measures and, very importantly, the company is maintaining its momentum with an expanding adviser force, sales growth and faster than anticipated synergies emerging.
We have taken signifi cant steps to grow your company, while anticipating market, regulatory and demographic change. These investments are yielding results, positioning us well on our journey to build a more competitive company and fi nancial services landscape.
Dividend and capital positionYour board has declared a fi nal 2011 dividend of 14 cents per share, which will be 50 per cent franked. The dividend represents a payout ratio of 84 per cent of underlying profi t in 2011, which is within our target range of 75 to 85 per cent of underlying profi t. In the future, the target dividend payout range will be 70 to 80 per cent of underlying profi t, to fund business growth.
Your board has a bias to holding more capital rather than less, because of ongoing market volatility and ahead of anticipated changes in regulatory capital requirements. This bias stood us in very good stead in the second half of 2011 given falling investment markets. AMP remains strongly capitalised, with $1.5 billion in surplus capital above minimum regulatory requirements at 31 December 2011.
ConclusionI believe that our investment in growth and our track record of adapting to change will ensure your company can deliver strong performance for clients and shareholders.
Peter Mason Chairman
Peter Mason AMChairman
For
per
sona
l use
onl
y

2
AMP Annual Report 2011
Five-year fi nancial summary
Year ended 31 December2011
$m2010
$m2009
$m2008
$m2007
$m
Consolidated income statement1
Net premium, fee and other revenue 4,219 2,824 2,665 2,877 2,869
Investment gains (losses) 1,464 4,840 8,250 (13,843) 8,128
Profi t (loss) before income tax from continuing operations 673 881 1,228 (1,094) 1,237 Income tax (expense) credit 3 (126) (505) 1,668 (445)Profi t from discontinued operations held for sale after income tax1 – – – 6 193 Non-controlling interests 12 20 16 – –
Profi t after tax attributable to shareholders of AMP Limited 688 775 739 580 985
Consolidated statement of fi nancial position Cash and cash equivalents 4,652 3,325 2,409 2,056 2,141 Investment assets 96,972 85,120 84,171 80,641 99,150 Intangibles 4,347 919 946 939 1,005 Assets of discontinued operations held for sale1 – – – – 747 Other assets 4,319 2,241 2,304 3,114 2,266
Total assets 110,290 91,605 89,830 86,750 105,309
Borrowings and subordinated debt 12,359 11,136 12,350 12,376 11,653 Life insurance contract liabilities 24,399 17,762 18,380 19,250 20,635 Investment contract liabilities 52,940 48,579 47,239 41,510 52,357 Liabilities of discontinued operations held for sale1 – – – – 672 Other liabilities 13,695 11,130 9,227 11,497 17,978
Total liabilities 103,393 88,607 87,196 84,633 103,295
Net assets 6,897 2,998 2,634 2,117 2,014
Contributed equity 9,080 5,051 4,814 4,481 3,827 Reserves (2,534) (2,565) (2,563) (2,598) (2,446)Retained earnings 283 452 320 154 546
Total equity attributable to shareholders of AMP Limited 6,829 2,938 2,571 2,037 1,927
Non-controlling interests 68 60 63 80 87
Total equity 6,897 2,998 2,634 2,117 2,014
2011 2010 2009 2008 2007
Other fi nancial data Basic earnings per ordinary share ($ps) $0.26 $0.38 $0.37 $0.31 $0.53 Diluted earnings per ordinary share ($ps) $0.26 $0.38 $0.37 $0.31 $0.53 Dividends per ordinary share ($ps) $0.29 $0.30 $0.30 $0.40 $0.46 Number of ordinary shares (m) 2,855 2,094 2,049 1,993 1,875 Assets under management ($bn) 159 115 112 105 129
Footnote: 1 On 5 March 2008, the AMP group completed the sale of its closed reinsurance operations, Cobalt/Gordian. The sale represented a complete
exit from this business by the AMP group. For 2008 and 2007, the results of the discontinued operations are disclosed as a single item in the Consolidated income statement above. For 2007, the assets and liabilities of the discontinued operations held for sale are disclosed as separate items in the Consolidated statement of fi nancial position above.
For
per
sona
l use
onl
y

32011 results at a glance
Full year profi t$ million
Net profi t attributable to shareholders Underlying profi t
2007 2008
985
2009
580
2010
739
2011
882
810
772
760
909
775
688
Net profi t attributable to shareholders of $688 million ▼ 11%
AMP’s net profi t attributable to shareholders in 2011 was $688 million, compared with $775 million in 2010.
Underlying profi t of $909 million ▲ 20%
AMP delivered an underlying profi t of $909 million in 2011. This compares with an underlying profi t of $760 million in 2010.
These profi t fi gures include a nine-month contribution from the Australian and New Zealand businesses of AXA Asia Pacifi c Holdings which merged with AMP on 30 March 2011.
Underlying profi t is AMP’s preferred measure of profi tability as it removes merger related costs and some of the impact of investment market volatility. It is the earnings base on which the board determines the dividend payment and refl ects the underlying performance of AMP.
The main difference between the two reported numbers comes from the movements in investment markets and costs from the AXA transaction. A reconciliation of Net Profi t and Underlying Profi t can be found on pages 9 and 59.
Profi t
Dividends and payments to shareholderscents per share
1630
14
1530
1429
15 15
2010 2011
Final dividends Interim dividends
2 cent Cobalt sale Capital return
2007
21 40
2008
2246
22
4040
2009
1640
22
Final dividend of 14 cents per share
This brings the total dividend for 2011 to 29 cents per share.
The fi nal dividend will be 50 per cent franked and will be paid on 5 April 2012.
The payout ratio for the full 2011 dividend is 84 per cent of the underlying profi t from 2011, which is within AMP’s target payout range of 75–85 per cent of underlying profi t. AMP has set a new target payout range of 70–80 per cent of underlying profi t.
Dividend
For
per
sona
l use
onl
y

4
AMP Annual Report 2011
for the year ended 31 December 2011Directors’ Report
Your directors present their report on the consolidated entity consisting of AMP Limited and the entities it controlled at the end of or during the year ended 31 December 2011.
Directors’ detailsThe directors of AMP Limited during the year ended 31 December 2011 and up to the date of this report are shown below. Directors were in offi ce for this entire period, except where stated otherwise: Peter Mason (Chairman), Craig Dunn (Chief Executive Offi cer and Managing Director), Patricia Akopiantz (appointed 31 March 2011), Richard Allert (appointed 31 March 2011), Catherine Brenner, Brian Clark, Paul Fegan, Richard Grellman (retired 12 May 2011), John Palmer, Nora Scheinkestel, Peter Shergold.
Details of each director’s qualifi cations, experience and special responsibilities are set out below.
Peter Mason AMChairman BCom (Hons), MBA, Hon.DBus (UNSW), FAICD. Age 65
Peter was appointed to the AMP Limited Board in October 2003 and assumed the role of Chairman in September 2005. He is a member of the People and Remuneration Committee and the Nomination Committee.
ExperiencePeter has 40 years experience in investment banking and is currently a Senior Advisor to UBS Investment Bank. He was Chairman of JP Morgan Chase Bank in Australia from 2000–2005. Prior to this he was Chairman and Chief Executive of Schroders Australia Limited and Group Managing Director of Schroders’ investment banking businesses in the Asia Pacifi c region. He was a member of the Council of the University of New South Wales for 13 years, a Director of the Children’s Hospital in Sydney for 12 years and Chairman of the Children’s Hospital Fund for eight years. In 1995, Peter was appointed a member of the Order of Australia for his contribution to the Children’s Hospital.
Listed directorships– Director of Singapore Telecommunications Limited (appointed September 2010)– Director of David Jones Limited (appointed November 2007)
Other directorships/appointments– Director of the University of New South Wales Foundation– Director of Headspace National Youth Mental Health Foundation Limited– Chairman of the UBS Australia Foundation Pty Limited– Director of Taylors Wines Pty Ltd– Chairman of the Centre for International Finance and Regulation– Trustee of the Sydney Opera House Trust
Craig DunnChief Executive Offi cer and Managing Director BCom, FCA. Age 48
Craig was appointed Chief Executive Offi cer and Managing Director in January 2008 and is a member of the Diversity Advisory Committee. He has been a Director of AMP Life Limited since April 2002 and was appointed to The National Mutual Life Association of Australasia Limited (NMLA) Board in March 2011.
ExperiencePrior to becoming CEO, Craig was Managing Director, AMP Financial Services from 2002–2007. He joined AMP in January 2000 and has held a number of senior roles including Managing Director of AMP Bank and Director, Offi ce of the CEO.
Before joining AMP, Craig was CEO of a Malaysia-based insurance company, a joint venture of Colonial Limited. He worked for KPMG throughout Europe and in Indonesia before joining Colonial.
Listed directorshipsWithin the three years immediately before the end of the last fi nancial year, Craig served as a Director of AMP Capital Investors Limited (responsible entity of AMP Capital China Growth Fund, a managed investment scheme listed on the ASX) (2008–December 2011).
Other directorships/appointments– Advisory Board Member with the Australian Government’s Financial
Literacy Foundation– Member of the Australian Government’s Financial Services
Advisory Committee – Leaders Forum Member of the Australian Institute for Population
Ageing Research– Panel Member of the Australian Financial Centre Taskforce– Executive Member of the Australia Japan Business Co-operation Committee
For
per
sona
l use
onl
y

5
Patricia (Patty) AkopiantzDirector BA, MBA. Age 48
Patty was appointed to the AMP Limited Board and the People and Remuneration Committee in March 2011. She was appointed a Director of AMP Bank in November 2011.
ExperiencePatty has over 25 years senior management and consultancy experience, primarily in the retail and consumer industries both in Australia and overseas. Over the last 12 years, she has served on numerous boards including AXA Asia Pacifi c Holdings Limited and Coles Group Limited. In 2003, she was awarded a Centenary Medal for services to Australian society in business leadership. She has an MBA from Harvard Business School.
Listed directorshipsWithin the three years immediately before the end of the last fi nancial year, Patty served as a Director of AXA Asia Pacifi c Holdings Limited (April 2006–March 2011) and Wattyl Limited (September 2005–September 2010).
Other directorships/appointments– Director of Ausgrid– Director of the NSW State Library Foundation– Member of Chief Executive Women
Richard (Rick) Allert AODirector FCA. Age 69
Rick was appointed to the AMP Limited Board and the Audit Committee in March 2011.
ExperienceRick has over 40 years of senior business appointments including, Chairman of AXA Asia Pacifi c Holdings Limited, Chairman of Tourism Australia, Chairman of Coles Group Limited, Chairman of Southcorp Limited, Chairman of Voyages Hotels and Resorts and President of the National Heart Foundation. In 1997, Rick was appointed a member of the Order of Australia for his service to business and the community, particularly through his work with the National Heart Foundation. In 2003, Rick was awarded a Centenary Medal for service to Australian society through rail transport, business and taxation. In 2007, he was appointed an Offi cer of the Order of Australia for service to the business sector through leadership and promotion of corporate social responsibility, and to the community through involvement with and support for a range of artistic, charitable and educational organisations.
Listed directorships– Deputy Chairman of Gerard Lighting Group Limited (appointed March 2010)– Chairman of Western Desert Resources Limited (appointed January 2011)– Director of Genesee & Wyoming Inc. (appointed July 2011)
Within the three years immediately before the end of the last fi nancial year, Rick served as a Director of AXA Asia Pacifi c Holdings Limited (September 1995–March 2011, Chairman from April 2000).
Other directorships/appointments– Chairman of the Aboriginal Foundation of South Australia Inc– Director of Cavill Power Products Pty Limited– Director of Genesee & Wyoming Australia Pty Limited– Director of RG & RT Trott Pty Limited– Member of the Australian Forces Entertainment Board
Catherine BrennerDirector BEc, LLB, MBA. Age 41
Catherine was appointed to the AMP Limited Board on 16 June 2010 and is a member of the Diversity Advisory Committee. She was appointed to the AMP Life Board in May 2009 and became Chairman in May 2011. Catherine is a member (and former Chairman) of the AMP Life Audit Committee. She was appointed Chairman of The National Mutual Life Association of Australasia Limited (NMLA) Board and a member of the NMLA Audit Committee in March 2011.
ExperienceCatherine is a former Managing Director, Investment Banking at ABN AMRO where she held various senior roles. Prior to this she was a corporate lawyer.
Listed directorships– Director of Boral Limited (appointed September 2010)– Director of Coca-Cola Amatil Limited (appointed April 2008)
Within the three years immediately before the end of the last fi nancial year, Catherine served as a Director of Centennial Coal Company Limited (2005–September 2010).
Other directorships/appointments– Trustee of the Sydney Opera House Trust– Member of the Takeovers Panel– Member of Chief Executive Women
For
per
sona
l use
onl
y

Directors’ Reportcontinued
AMP Annual Report 2011
6
Brian ClarkDirector DSc. Age 63
Brian was appointed to the AMP Limited Board in January 2008. He is a member of the Nomination Committee, Diversity Advisory Committee and People and Remuneration Committee.
ExperienceBrian spent 10 years in a variety of senior executive roles at Vodafone internationally, most recently in the United Kingdom as Group Human Resources Director. He was Chief Executive Offi cer (CEO) of Vodafone’s Australian business as well as CEO of the Asia Pacifi c region, based in Tokyo. Before joining Vodafone, Brian spent three years as CEO of Telkom SA Ltd, in South Africa.
Brian has degrees in physics and mathematics from the University of Pretoria, and has completed the Advanced Management Program at the Harvard Business School.
Listed directorships– Director of Boral Limited (appointed May 2007)
Within the three years immediately before the end of the last fi nancial year, Brian served as Chairman of AMP Capital Investors Limited (responsible entity of AMP Capital China Growth Fund, a managed investment scheme listed on the ASX) (2008–December 2011).
Paul FeganDirector MBA. Age 50
Paul was appointed to the AMP Limited Board in August 2009. He was appointed to the Audit Committee in November 2009 and became Chairman of that committee in December 2010. He was appointed to the AMP Bank Board in April 2010.
ExperiencePaul has over 30 years experience in the fi nancial services industry. He was Group Managing Director, Strategy and Corporate Services with Telstra from February 2011 – January 2012 and was the Chief Executive Offi cer of St George Bank from November 2007 and Chief Executive Offi cer and Managing Director from February 2008 until its merger with Westpac Banking Corporation in December 2008. He was also a Director of St George’s funds administration subsidiary, Asgard Wealth Solutions. Prior to joining St George, Paul was based in the UK as Chief Operating Offi cer of Yorkshire Bank. He held director positions in both Yorkshire Bank and Clydesdale Bank and a series of senior appointments with National Australia Bank in Australia, the US, Hong Kong, the UK and Ireland.
John Palmer ONZMDirector BAgrSc, FNZID. Age 64
John was appointed to the AMP Limited Board in July 2007. He is Chairman of the People and Remuneration Committee. John has been a Director of the AMP Life Limited Board since May 2004. He was appointed to The National Mutual Life Association of Australasia Limited (NMLA) Board in March 2011.
ExperienceJohn has extensive experience as a director and chairman of companies in the agricultural and fi nance sectors. He has a track record of successfully leading change and reconstruction of diverse corporates in marketing, agribusiness and aviation.
In 1998 John received the Bledisloe Cup for outstanding contribution to the New Zealand fruit industry. In 1999 he was awarded with an Offi cer of the New Zealand Order of Merit (ONZM) for service to the New Zealand kiwifruit industry.
Listed directorships– Chairman of Air New Zealand Limited (appointed November 2001)
Other directorships/appointments– Chairman of Solid Energy NZ Limited– Director of Rabobank Australia Limited and Rabobank New Zealand LimitedF
or p
erso
nal u
se o
nly

7
Dr Nora ScheinkestelDirector LLB (Hons), PhD, FAICD. Age 51
Nora was appointed to the AMP Limited Board in September 2003. She is Chairman of the Nomination Committee, Chairman of the Diversity Advisory Committee, a Director of AMP Bank Limited and AMP Capital Holdings Limited and a member of the Audit Committee of each.
ExperienceNora is an experienced company director having served as Chairman and Non-executive Director of companies including Newcrest Mining Ltd, Mayne Group and Mayne Pharma Ltd, North Limited, IOOF Funds Management, Medical Benefi ts Fund of Australia Limited and various energy and water utilities. Nora was formerly a senior banking executive in international and project fi nancing. She held positions with CRA Limited, Macquarie Bank, Chase AMP Bank and Deutsche Bank. Nora’s current consulting practice assists government, corporate and institutional clients in areas such as corporate governance and project and structured fi nance. In 2003, she was awarded a Centenary Medal for services to Australian society in business leadership.
Listed directorships– Director of Orica Limited (appointed August 2006)– Director of Pacifi c Brands Limited (appointed June 2009) – Director of Telstra Corporation Limited (appointed August 2010)
Within the three years immediately before the end of the last fi nancial year, Nora served as a Director of PaperlinX Limited (2000–December 2009) and a Director of AMP Capital Investors Limited (responsible entity of AMP Capital China Growth Fund, a managed investment scheme listed on the ASX) (2004–December 2011).
Other directorships/appointments– Associate Professor at the Melbourne Business School at Melbourne University– Member of the Takeovers Panel
Professor Peter Shergold ACDirector BA (Hons), MA, PhD, FAICD. Age 65
Peter was appointed to the AMP Limited Board in May 2008. He is a member of the Audit Committee and the Diversity Advisory Committee and has been a Director of the AMP Life Limited Board since August 2008. Peter is also a member of the AMP Life Audit Committee. He was appointed to The National Mutual Life Association of Australasia Limited (NMLA) Board in March 2011 and is a member of its Audit Committee.
ExperiencePeter holds the Professorial Chair of the Centre for Social Impact, a partnership of the business schools of the University of New South Wales, Melbourne University, Swinburne University of Technology and the University of Western Australia. He is also Chancellor and Chair of the board of trustees of the University of Western Sydney.
Prior to this he served as Secretary of the Department of the Prime Minister and Cabinet for fi ve years. Peter had previously been CEO of the Aboriginal and Torres Strait Islander Commission, Public Service Commissioner, Secretary of the Department of Employment, Workplace Relations and Small Business, and Secretary of the Department of Education, Science and Training.
He was appointed a Member of the Order of Australia in 1996, awarded a Centenary Medal in 2003 and made a Companion of the Order of Australia in 2007 for public service.
Other directorships/appointments– Director of Corrs Chambers Westgarth– Chairman of QuintessenceLabs Pty Limited– Chairman of the National Centre for Vocational Education Research– Director of the General Sir John Monash Foundation– Director of the National Centre for Indigenous Excellence– Chairman of the NSW Public Service Commission Advisory Board– Deputy Chairman of the Sydney Writers’ FestivalF
or p
erso
nal u
se o
nly

Directors’ Reportcontinued
AMP Annual Report 2011
8
Attendance at board and committee meetings The table below shows details of attendance by directors of AMP Limited at meetings of boards and the committees of which they were members during the year ended 31 December 2011. The directors also attended other meetings, including management meetings and meetings of subsidiary boards or committees of which they were not a member during the year.
Board/CommitteeAMP Limited
Board meetingsAudit
CommitteeNomination Committee
People and Remuneration
Committee
Diversity Advisory
CommitteeAd hoc
committees1
Subsidiary board and
committee meetings2
Held/attended A B A B A B A B A B A B A B
Patricia Akopiantz 8 8 – – – – 4 4 – – – – 1 1
Richard Allert 8 7 4 3 – – – – – – – – – –
Catherine Brenner 12 12 – – – – – – 2 2 3 3 17 17
Brian Clark 12 11 – – 4 4 5 4 2 2 1 1 15 13
Craig Dunn 12 11 – – – – – – 2 2 3 3 19 17
Paul Fegan 12 11 6 6 – – – – – – 4 4 4 4
Richard Grellman 6 6 3 3 1 1 – – – – 3 3 9 9
Peter Mason³ 12 12 – – 4 4 5 5 – – 2 2 – –
John Palmer 12 11 – – – – 5 5 – – – – 17 16
Nora Scheinkestel 12 12 2 2 4 4 – – 2 2 – – 23 23
Peter Shergold 12 11 6 6 – – – – 2 1 – – 17 17
Footnote:Column A – indicates the number of meetings held while the director was a member of the board/committee.Column B – indicates the number of those meetings attended.1 Ad hoc committees of the board were constituted during the year in relation to fi nancial results and merger and acquisition activity.2 Subsidiary board and committee meetings include AMP Life/NMLA, AMP Bank and AMP Capital Investors/AMP Capital Holdings. Where meetings
of AMP Life/NMLA and AMP Capital Investors/AMP Capital Holdings were held concurrently, only one meeting has been recorded in the above table.3 The Chairman attended a number of Audit Committee and subsidiary board and committee meetings held during 2011 in an ex offi cio capacity.
Company secretaries’ detailsDetails of each company secretary of AMP Limited, including their qualifi cations and experience, are set out below:
Brian SalterGeneral Counsel BA, LLB (Hons), LLM (Hons), MAICD
Brian joined AMP on 1 July 2008. Before joining AMP, Brian was a partner with a major Australian law fi rm for 19 years. Brian has more than 30 years experience advising many of Australia’s leading fi nancial and wealth management companies. Brian is a member of the Legal Committee of the Australian Government’s Corporations and Markets Advisory Committee, the Law Committee of the Australian Institute of Company Directors, the Corporations Committee of the Business Law Section of the Law Council of Australia and a Director of AMP Superannuation Limited and SCECGS Redlands Limited.
Darryl MackayHead of Secretariat and Company Secretary BSc, FIAA
Darryl joined AMP in March 2011 from AXA Asia Pacifi c Holdings, where he held the roles of Company Secretary and General Manager, Group Chief Executive’s Offi ce. In his 33 years at AXA, Darryl held a range of senior roles including General Manager Group Human Resources and Deputy Chief Executive International. He is also a director of various AMP subsidiaries.
Vicki VordisCompany Secretary BEc, LLB (Hons), GradDipACG, ACIS
Vicki is a Company Secretary of AMP Life and The National Mutual Life Association of Australasia (NMLA). She joined AMP in December 2000 and held various legal roles before moving into a secretariat role in 2006. Prior to 2000, Vicki worked as a lawyer in several city law practices. She holds a graduate diploma in Applied Corporate Governance and is an Associate of Chartered Secretaries Australia.
For
per
sona
l use
onl
y

9
Principal activitiesAMP is Australia and New Zealand’s leading independent wealth management company, with a retail banking business in Australia and a growing international investment management business. It provides fi nancial advice, products and services and investment opportunities to help people and organisations build fi nancial security.
The company merged with the Australian and New Zealand businesses of AXA Asia Pacifi c Holdings Limited (AXA) in March 2011, creating a new competitive force in wealth management.
AMP today holds number one or two rankings across key market segments in Australia and New Zealand, is Australia’s largest superannuation provider and one of the largest domestic investment managers.
The company serves a diversifi ed customer base, with more than fi ve million retail customers in Australia and New Zealand and around 350 institutional clients primarily in Australia and New Zealand and increasingly Asia and Europe. AMP also has more than 6,000 employees, around 950,000 shareholders and $159 billion of assets under management.
AMP Financial ServicesAMP Financial Services provides customers in Australia and New Zealand with fi nancial advice, superannuation, retirement income and other investment products, superannuation services for businesses, income protection, disability and life insurance and selected banking products. These products and services are primarily distributed through a network of more than 4,100 aligned and employed advisers and planners in Australia and New Zealand, as well as through extensive relationships with independent fi nancial advisers.
AMP Bank has approximately 100,000 customers, a mortgage book of $11.2 billion and a deposit book of $7.2 billion.
On 31 December 2011, AMP sold its general insurance distribution business.
AMP CapitalAMP Capital is a diversifi ed investment manager, managing around $123 billion in assets for investors. Through a team of 240 investment professionals and a carefully selected global network of investment partners, AMP Capital invests in equities, fi xed interest, infrastructure, property, diversifi ed funds and multi-manager funds. AMP Capital also provides commercial, industrial and retail property management services. In addition to its well established operations in Australia and New Zealand, AMP Capital has a growing international presence with offi ces in Bahrain, China, Hong Kong, India, Japan, Luxembourg, Singapore, the United Kingdom and the United States.
On 9 December 2011, AMP Capital announced a strategic business alliance with a leading Japanese trust bank, Mitsubishi UFJ Trust and Banking Corporation (MUTB). The alliance will accelerate AMP Capital’s growth in Asia and signifi cantly expand its distribution footprint in Japan. MUTB will acquire a 15 per cent minority interest in AMP Capital Holdings Limited, the parent company of the AMP Capital group of companies, for $425 million. The transaction is expected to complete in March 2012, subject to regulatory approval.
Review of operations and resultsAMP operates in one of the largest and fastest growing wealth management markets in the world. The company is fi nancially strong, with a disciplined, prudent approach to costs and capital management. This business model is characterised by a large customer base, scale in key market segments, the largest and most qualifi ed fi nancial adviser network in Australia and New Zealand, high quality, contemporary and diverse products, platforms and investment capabilities, one of the largest investment management houses in the Asia Pacifi c region and a trusted brand.
AMP’s statutory profi t attributable to shareholders of AMP Limited for the year ended 31 December 2011 was $688 million, compared to $775 million for the previous corresponding period.
Basic earnings per share for the year ended 31 December 2011 on a statutory basis were 26.3 cents per share (2010: 37.9 cents per share) refl ecting its expanded capital base following the AXA merger.
Underlying profi t is AMP’s preferred measure of profi tability as it smooths investment market volatility to refl ect trends in the underlying business performance of AMP. Directors use underlying profi t to determine dividends. AMP’s underlying profi t for the year ended 31 December 2011 was $909 million (2010: $760 million). On an underlying basis, earnings were 34.3 cents per share (2010: 36.7 cents per share).
AMP’s performance against key performance measures was as follows:– underlying profi t $909 million including results from AXA
for the nine months from 31 March–31 December 2011.– growth measures: – AMP Financial Services net cash outfl ows were
$581 million, down from net cash infl ows of $789 million for the 12 months to 31 December 2010; AMP Capital external net cash outfl ows were $1,166 million, down from net cash infl ows of $2,618 million for the 12 months to 31 December 2010
– AMP Financial Services value of risk new business was up $107 million to $215 million for the 12 months to 31 December 2011
– 52 per cent of AMP Capital’s funds met or exceeded benchmark over the 12 months to 31 December 2011, down from 63 per cent for the 12 months to 31 December 2010
– underlying return on equity was 15.1 per cent (26.2 per cent for the 12 months to 31 December 2010) refl ecting the merger with AXA and higher capital held until changes to regulatory standards are fi nalised.
Total AMP assets under management were $159 billion at 31 December 2011, an increase of $44 billion from $115 billion at 31 December 2010.
Further information on the group’s results by business segment is provided in Note 4 of the Financial Report.
Differences between underlying profi t and statutory profi tThe 31 December 2011 underlying profi t of $909 million excludes the impact (net of any tax effect) of merger and acquisition transaction costs of $42 million, AXA integration costs of $105 million, amortisation of AXA acquired intangible assets of $75 million and other one-off gains of $4 million. Accounting mismatch losses of $19 million and annuity fair value adjustment gains of $13 million are also excluded from underlying profi t as well as a $50 million loss on market adjustments relating to investment income and a $53 million gain on market adjustments relating to risk products. A reconciliation between underlying profi t and statutory profi t is provided in Note 4 of the Financial Report.
Under Australian Accounting Standards, some assets held on behalf of the policyholders (and related tax balances) are recognised in the Financial Report at different values to the values used in the calculation of the liability to policyholders in respect of the same assets. Therefore, movements in these policyholder assets result in accounting mismatches which impact profi t attributable to shareholders. These differences have no impact on the operating earnings of the group.
The accounting mismatches arise from policyholder interests in the following:– ‘Treasury shares’ (AMP Limited shares held by the statutory
funds on behalf of policyholders) – gain of $28 million (2010: $22 million gain)
– AMP life insurance statutory funds investments in controlled entities – loss of $38 million (2010: $4 million loss)
For
per
sona
l use
onl
y

Directors’ Reportcontinued
AMP Annual Report 2011
10
– Owner-occupied properties – loss of $1 million (2010: $1 million gain), and
– AMP life insurance statutory funds superannuation products invested with AMP Bank – loss of $8 million (2010: $3 million gain).
Capital managementEquity and reserves of the AMP group attributable to shareholders increased to $6,829 million at 31 December 2011 from $2,938 million at 31 December 2010. This was primarily the result of additional share capital issued as a result of the merger with the AXA Australian and New Zealand business. The movement also refl ects additional share capital issued under the Dividend Reinvestment Plan (DRP) and profi ts to 31 December 2011, less dividends paid up to 31 December 2011 and increases in the defi ned benefi t plan liabilities.
AMP remains strongly capitalised, with $1,543 million in regulatory capital resources above minimum regulatory requirements (MRR) at 31 December 2011 ($1,482 million at 31 December 2010). This is 1.3 times Shareholder MRR (1.5 times Shareholder MRR at 31 December 2010). The MRR coverage ratio varies throughout the year due to a range of factors, including investment market movements, dividend payments and statutory profi ts.
AMP continues to take a prudent approach to capital management and is biased towards holding more capital rather than less with continuing market volatility and proposed changes to regulatory capital standards.
AMP’s fi nal 2011 dividend is 14 cents per share franked to 50 per cent. The dividend payout ratio for FY 11 is 84 per cent of underlying profi t. AMP has revised its dividend policy to a target payout ratio in the range of 70 per cent to 80 per cent and to be franked to the maximum extent possible. This guidance represents a change to past guidance (75 per cent to 85 per cent target payout ratio) refl ecting an expected increase in capital requirements to meet future business growth following the merger with AXA, increasing demand for more capital intensive products and an anticipated increase in regulatory capital requirements.
AMP will continue to offer a DRP for shareholders. For the fi nal 2011 dividend AMP will offer a discount of 1.5 per cent to DRP participants. The DRP will not be underwritten and new shares will be issued.
Political donationsAMP’s policy is that it does not make donations to political parties. AMP did not make any political donations during 2011; however, AMP did contribute $25,000 to the Menzies Research Centre and $15,000 to the Chifl ey Research Centre to assist with public policy development. These contributions are permitted under AMP’s policy.
Signifi cant changes to the state of affairsDetails of capital changes during 2011 are set out earlier in this report.
On 30 March 2011, AMP Limited completed its acquisition of AXA Asia Pacifi c Holdings Limited for the purposes of merging the Australian and New Zealand operations of both entities. The merger was effected by AMP acquiring 100 per cent of the issued shares in AXA Asia Pacifi c Holdings Limited though a contractual arrangement with its parent entity, AXA SA, and a scheme of arrangement with its minority shareholders. The contractual arrangement to acquire the shares held by AXA SA was conditional upon the approval of the scheme of arrangement with the minority shareholders of AXA Asia Pacifi c Holdings Limited which was approved by those shareholders on 2 March 2011 and subsequently approved by the Supreme Court of Victoria on 7 March 2011. AMP obtained control of AXA Asia Pacifi c Holdings Limited on 30 March 2011, which is the date that AMP acquired 100 per cent of AXA Asia Pacifi c Holdings
Limited shares and was able to appoint directors to the board. Details of the fi nancial impact of the transactions are provided in Note 3 of the Financial Report.
There have been no other signifi cant changes in the state of affairs during this fi nancial year.
Events occurring after the reporting dateAs at the date of this report, the directors are not aware of any matter or circumstance that has arisen since the end of the year that has signifi cantly affected or may signifi cantly affect the entity’s operations in future years, the results of those operations in future years, or the entity’s state of affairs in future years which is not already refl ected in this report, other than the following:– On 9 December 2011, AMP announced a strategic business
alliance with Mitsubishi UFJ Trust and Banking Corporation (MUTB) which included the sale to MUTB of a 15 per cent interest in AMP Capital Holdings Limited. The settlement date for this transaction is in March 2012 (subject to regulatory approval).
– On 16 February 2012, AMP announced a fi nal dividend on ordinary shares of 14 cents per share. Details of the fi nal dividend and dividends paid and declared during the year are disclosed in Note 19 of the Financial Report.
Likely developmentsIn the opinion of the directors, disclosure of further information about likely developments in AMP’s businesses is commercially sensitive and would likely be detrimental and result in unreasonable prejudice to the company.
The environmentAMP’s Environmental Policy guides improvements in direct environmental impacts by reducing the organisation’s use of energy, water, paper and other materials. It also outlines environmental considerations in AMP’s purchasing decisions and product design. The Environment Policy is available on AMP’s website: www.amp.com.au
AMP has an environment leadership team that drives improvements in AMP’s operational environmental performance and is chaired by the Managing Director of AMP Capital. The team has established key targets for energy use and waste recycling, and these have been endorsed by senior management. Over the past three years, initiatives have been implemented to increase the number of buildings with recycling programs, automatic PC shutdown, server virtualisation, low energy lighting, additional timers and sensors. Employee awareness and participation activities have also been introduced to help the organisation meet the key targets.
As an investor, AMP believes engagement with companies on environmental issues is an effective way to infl uence management practices for the benefi t of customers and the environment. During 2011, AMP Capital continued to be a signatory to the Carbon Disclosure Project (CDP) (www.cdproject.net). AMP was listed in the CDP 2011 ASX 200 and NZX 50 Carbon Disclosure Leadership Index and was an active participant in the Investor Group on Climate Change (www.igcc.org.au). AMP Capital is also a signatory to the United Nations Principles of Responsible Investment.
In the normal course of its business operations, AMP is subject to a range of environmental regulations, of which there have been no material breaches during the year.
AMP reports energy use and greenhouse gas emissions through compliance with the Energy Effi ciency Opportunities Act 2006(EEO Act) and the National Greenhouse and Energy Reporting Act 2007 (NGER Act).Act 2007 (NGER Act).Act 2007
Both these Acts require AMP to report on energy consumption levels. The EEO Act aims to encourage more effi cient use of energy by large energy-using businesses, while the NGER Act
For
per
sona
l use
onl
y

11
Auditor’s Independence Declaration to the Directors of AMP LimitedIn relation to our audit of the Financial Report of AMP Limited for the fi nancial year ended 31 December 2011, to the best of my knowledge and belief, there have been no contraventions of the auditor independence requirements of the Corporations Act 2001or any applicable code of professional conduct.
Ernst & Young Andrew Price Partner 16 February 2012
provides for the reporting and dissemination of information related to greenhouse gas emissions, greenhouse gas projects, energy production and energy consumption.
Reporting to the Australian Government Department of Resources, Energy and Tourism and the Australian Government Department of Climate Change and Energy Effi ciency (the responsible government bodies) is performed at an AMP Limited level, with AMP Capital making up a core component of the reporting through its property and infrastructure divisions.
AMP’s 2011 report on Energy Effi cient Opportunities is available at www.amp.com.au/socialresponsibility
Indemnifi cation and insurance of directors and offi cersUnder AMP’s Constitution, the company indemnifi es, to the extent permitted by law, all offi cers of the company (including the directors) against any liability (including the costs and expenses of defending actions for an actual or alleged liability) incurred in their capacity as an offi cer of the company.
This indemnity is not extended to current or former employees of the AMP group against liability incurred in their capacity as an employee, unless approved by the AMP Limited Board. No such indemnities have been provided during or since the end of the fi nancial year.
During the fi nancial year, the company agreed to insure all of the offi cers (including all directors) of the AMP group against
certain liabilities as permitted by the Corporations Act 2001. The insurance policy prohibits disclosure of the nature of the cover, the amount of the premium, the limit of liability and other terms.
In addition, the company and each of the directors are parties to Deeds of Indemnity and Access, as approved by the board. Those Deeds of Indemnity and Access provide that:– the directors will have access to the books of the company
for their period of offi ce and for seven years after they cease to hold offi ce
– the company indemnifi es the directors to the extent permitted by law
– the indemnity covers liabilities incurred by the directors in their capacity as offi cers of the company and of other AMP group companies
– the company will maintain directors’ and offi cers’ insurance cover for the directors to the extent permitted by law for the period of their offi ce and for seven years after they cease to hold offi ce.
Rounding In accordance with the Australian Securities and Investments Commission Class Order 98/0100, amounts in this Directors’ Report and the accompanying Financial Report have been rounded off to the nearest million Australian dollars, unless stated otherwise.
Auditor’s independence declaration to the directors of AMP LimitedThe directors have obtained an independence declaration from the company’s auditor, Ernst & Young for the year ended 31 December 2011.
Non-audit servicesThe Audit Committee has reviewed details of the amounts paid or payable for non-audit services provided to the AMP group of companies during the year ended 31 December 2011, by the company’s auditor, Ernst & Young.
The Committee is satisfi ed that the provision of those non-audit services by the auditor is compatible with the general standard of independence for auditors imposed by the Corporations Act and did not compromise the auditor independence requirements of the Corporations Act for the following reasons:– all non-audit assignments were approved in accordance with the process set out in the AMP Charter of Audit Independence– no non-audit assignments were carried out which were specifi cally excluded by the AMP Charter of Audit Independence – the level of fees for non-audit services amounted to $1,187,000 or 8 per cent of total audit fees (refer to Note 34 of the
Financial Report for further details).
Remuneration disclosuresThe remuneration arrangements for AMP directors and senior executives are outlined in the Remuneration Report which forms part of the Directors’ Report for the year ended 31 December 2011.
Directors’ and senior executives’ interests in AMP Limited shares, performance rights and options are also set out in the Remuneration Report on the following pages.
Ernst & Young Centre680 George StreetSydney NSW 2000 AustraliaGPO Box 2646 Sydney NSW 2001
Tel: +61 2 9248 5555Fax: +61 2 9248 5959www.ey.com/au
Liability limited by a scheme approved under Professional Standards Legislation
For
per
sona
l use
onl
y

AMP Annual Report 2011
12Directors’ Report for the year ended 31 December 2011 continuedRemuneration Report
Remuneration Report (Audited)The directors are pleased to present this year’s Remuneration Report, which is divided into the following sections:
1 Overview2 Remuneration strategy and governance3 Remuneration structure in 20114 The link between company performance and remuneration5 Remuneration for nominated executives in 20116 Contractual arrangements for nominated executives7 Non-executive director remuneration
1 Overview1.1 Remuneration strategy and structureAMP’s remuneration strategy is to align remuneration with the creation of value for shareholders by attracting and retaining employees who will contribute to AMP’s success and motivating them to achieve outstanding performance against AMP’s business objectives.
The key components of the 2011 remuneration structure were as follows:
Employee group Fixed remuneration Short-term incentives (STI)1 or Profi t Share2
Long-term incentives (LTI)
Other equity arrangements
Non-executive directors
Board fees, committee fees and superannuation
None None 26% of fees required to be taken as shares
Nominated executives3
Annual base salary and superannuation (base salary includes salary-sacrifi ced benefi ts and fringe benefi ts tax thereon)
Annual cash-based awards dependent on individual, business unit and company performance assessed against fi nancial and non-fi nancial measures
Performance rights: rights to AMP Limited shares subject to a three-year relative total shareholder return (TSR) vesting hurdle
Minimum shareholding required
STI Deferral: deferral of 40% of the STI into rights to AMP Limited shares subject to a two-year service condition
Other senior leaders Performance rights and/or share rights: selected employees received performance rights (as above) and/or rights to AMP Limited shares that are subject to a three-year service condition
STI Deferral: selected senior leaders defer 40% of their STI into rights to AMP Limited shares subject to a two-year service condition
Other employees None STI Match: selected employees receive rights to AMP Limited shares valued at an additional 50% of their STI, subject to a two-year service condition
Footnote:1 A limited number of investment management and sales employees also participated in tailored business unit plans, which are based on
individual/team fi nancial measures and delivered in cash, AMP Limited equity or AMP investment products.2 The Managing Director of AMP Capital and his direct reports participated in the AMP Capital Enterprise Profi t Share plan (Profi t Share) as
outlined in section 3.2.3.3 The nominated executives are the Chief Executive Offi cer (CEO) of AMP Limited and his direct reports as listed in section 1.2.
Key Management PersonnelFor the purpose of this Remuneration Report and AASB 124 Related Party Disclosures (refer to Note 33 in Notes to the Financial Statements), Key Management Personnel (KMP) are people who have authority and responsibility for planning, directing and controlling the activities of the AMP group. They include the Chief Executive Offi cer (CEO) of AMP Limited and his direct reports (collectively the ‘nominated executives’) and the non-executive directors of the AMP Limited Board.
The individuals disclosed in this report were KMP for the full fi nancial year, with the exception of: – Richard Allert and Patricia Akopiantz, who were appointed as non-executive directors on 31 March 2011 following the merger
of AMP and the Australian and New Zealand businesses of AXA Asia Pacifi c Holdings, and – Richard Grellman, who retired from the board at the May 2011 Annual General Meeting.
Paul Leaming, the Chief Financial Offi cer, retired on 31 December 2011 and was thus a KMP for the full fi nancial year. Colin Storrie was appointed to the position of Chief Financial Offi cer, effective from 1 January 2012. Colin was previously Deputy Chief Financial Offi cer and Group Treasurer of AMP Limited.
For
per
sona
l use
onl
y

13
In addition to remuneration disclosures for KMP, the Corporations Act 2001 requires disclosure of remuneration details for the fi ve ‘company executives’ and fi ve ‘relevant group executives’ who received the highest remuneration during the year.
The directors note that the nominated executives include the fi ve highest-paid executives of the AMP group and AMP Limited.
1.2 2011 remuneration outcomes for the nominated executivesThe table below sets out the cash and other benefi ts actually received by the nominated executives in 2011. Included are fi xed remuneration (inclusive of superannuation) and the non-deferred portion of the short-term incentive (STI Cash)/Profi t Share earned for the fi nancial year. With the exception of Lee Barnett, no actual income was earned from the vesting of share awards during the year. Accounting values for unvested share awards are shown in section 5.1 in accordance with statutory disclosure requirements.
Actual share income
Name
Fixed remuneration
$’000Cash STI
$’000Total cash
$’000
STI deferral vested during
2011 $’000
LTI/Other vested
during 2011$’000
2011 total remuneration
$’0002010 total
$’000
Craig Dunn 1,664 1,344 3,008 – – 3,008 3,360
Craig Meller 1,030 798 1,828 – – 1,828 2,245
Stephen Dunne 1,030 863 1,893 – – 1,893 1,850
Paul Leaming1 1,002 564 1,566 – – 1,566 1,770
Brian Salter 753 450 1,203 – – 1,203 1,467
Lee Barnett 747 465 1,212 – 13 1,213 1,343
Paul Sainsbury 650 426 1,076 – – 1,076 n/a2
Matthew Percival 552 345 897 – – 897 1,163
Fiona Wardlaw 625 390 1,015 – – 1,015 1,055
Jonathan Deane 513 330 843 – – 843 900
Total 8,566 5,975 14,541 – 1 14,542 15,153
Footnote:1 On his retirement (31 December 2011), Paul Leaming was paid $0.5m in accrued annual leave and long-service leave. This amount is not
included above as it did not form part of his 2011 remuneration rather, it was the payment of leave he had accrued throughout his 14 years’ service at AMP.
2 Paul Sainsbury was appointed as Integration Director on 1 January 2011 but was not a KMP in 2010.3 This amount represents the value of matching shares that vested during 2011 as a result of participation in the Employee Share Acquisition
Plan (see section 3.4.2).
The total remuneration received by the nominated executives for 2011 was consistent with 2010. While their fi xed remuneration (and thus the STI and LTI opportunity) increased to ensure their earning potential remained competitive with the market, the variable amount actually received for 2011 performance, as a percentage of opportunity, continued to be lower than historical levels. This was due to AMP’s fi nancial and share price performance in 2011 being lower than the targets agreed with the board.
Fixed remuneration Following two years of salary freezes for non-award staff, salary reviews were undertaken in April 2011. A market review was conducted in accordance with the process described in section 3.1. The board considered the following factors when it approved remuneration increases for the nominated executives: – The market data for comparable roles (refer to section 2.2).– The scope and complexity of each role. For all of the nominated executives, this had increased
following the merger of AMP with the Australian and New Zealand businesses of AXA Asia Pacifi c Holdings.
– The individual’s capability, performance and criticality to AMP.
In light of the current climate in the fi nancial services sector, it is anticipated that fi xed remuneration for the nominated executives will not increase in 2012.
Short-term incentive (STI)
STI opportunity increased, but the amount received by the executives in 2011 decreased. STI opportunity is expressed as a percentage of fi xed remuneration. Thus, when fi xed remuneration increased, so did the STI opportunity. However, as described in section 4.2, STI amounts paid decreased as a percentage of opportunity, with the nominated executives receiving 60% of their maximum STI opportunity on average (65% in 2010). Additionally, as 40% of the STI is now subject to deferral, the cash amount the nominated executives received on completion of the fi nancial year was less than in 2010.
Long-term incentive (LTI)
The performance period for the 2008 LTI completed in July 2011. The performance rights issued under the 2008 LTI lapsed as the total shareholder return (TSR) hurdle was not met.
For
per
sona
l use
onl
y

Directors’ Reportcontinued
AMP Annual Report 2011
14
1.3 Initiatives to enhance the effectiveness of AMP’s remuneration approachAs part of AMP’s commitment to ensuring remuneration supports the creation of value for AMP shareholders, the People and Remuneration Committee (PRC) commissioned an extensive review of AMP’s remuneration framework and practices in late 2009. Following the review, the board endorsed priorities for change and a three-phased approach to enhancing the effectiveness of AMP’s remuneration approach:
Phase 1 Formalise the AMP Limited Board’s and the PRC’s role in remuneration governance in line with Australian Prudential Regulation Authority requirements
Implemented in 2010
Phase 2 Design and implement a remuneration framework that complies with prudential regulation and supports business objectives
Implemented in 2011
Phase 3 Review the AMP group performance management approach and short-term incentive plan to ensure it continues to be aligned to business strategy
Implementation in 2012
1.4 Key changes to remuneration approach in 2011Remuneration framework changesAs part of the Phase 2 remuneration framework review, the following changes were implemented in 2011:– A mechanism was introduced to reduce the AMP group STI pool (potentially to zero) if AMP management acts outside board-
approved levels for risk. This was introduced to align employee rewards with AMP’s performance against its enterprise risk management framework.
– Employees who can infl uence AMP’s fi nancial soundness, or who are responsible for protecting AMP’s fi nancial soundness (including all of the nominated executives), are now required to defer 40 per cent of their STI into equity. STI Deferral is awarded as rights to receive AMP Limited shares (share rights) and vest two years after the STI Cash is paid. Vesting of deferred STI is subject to ongoing employment, compliance with AMP policies and the board’s discretion.
– In most parts of the business, participation in the AMP LTI plan is now restricted to senior leaders (such as the nominated executives). High-potential employees at a middle management level are, instead, now eligible to be nominated for a new equity plan, the STI Match plan. This provides an award of share rights to the value of 50 per cent of the individual’s STI for the previous year. As the STI Match is based on the STI (refer to section 3.2.2), it rewards the aspects of business outcomes that participants can directly infl uence. Further, because it is awarded in share rights that are restricted for a further two years after the initial STI performance year, the STI Match enhances shareholder alignment and employee retention.
Other initiatives– AMP Capital: the Managing Director of AMP Capital (AMP Capital MD) and his management team participated in a new
incentive plan in 2011, the AMP Capital Enterprise Profi t Share plan (Profi t Share), which provides participants with a share of AMP Capital’s adjusted pre-tax profi t. The AMP Capital MD participates in Profi t Share in lieu of participating in the AMP group STI plan, while his direct reports participate in lieu of participating in the STI and LTI plans. Profi t Share was introduced to support AMP Capital’s objective of strengthening its position as an integrated, sustainable and profi table investment management house. The award is partially delivered in share rights.
– AXA merger: following AMP’s merger with the Australian and New Zealand businesses of AXA Asia Pacifi c Holdings, it was determined that the merged business would continue to adopt the AMP remuneration strategy and policy. Consequently, no changes to AMP’s remuneration approach described in this Remuneration Report were made in 2011 as a result of the AMP/AXA integration.
1.5 Anticipated changes to remuneration approach in 2012Phase 3 of the remuneration framework review was to review AMP’s STI plan. As AMP and AXA had different performance management systems in place, the scheduled review of the STI plan was broadened to include a review of the performance management approach for the merged business. Following the review, a decision was made to introduce a new performance management system, called AMP Performance Leadership, which will be used for the 2012 performance assessments. While there will be refi nements to the way performance objectives are set and the way the outcomes are used to determine an individual’s STI, no signifi cant changes are anticipated to the way the STI pool is determined (section 3.2.2).
It is anticipated that in 2012, the annual LTI award for senior leaders, including the nominated executives, will be made in June with a performance period of 1 March 2012–28 February 2015 rather than the previous September timing. This timing enables performance to be measured based on the return delivered to shareholders between the 2011 full year results announcement and the 2014 full year results announcement. The CEO’s LTI will still be subject to shareholder approval at the 2012 Annual General Meeting.
Additionally, membership of the Profi t Share plan will be expanded in 2012 to other senior leaders who form part of the AMP Capital Executive Council.F
or p
erso
nal u
se o
nly

15
2 Remuneration strategy and governance2.1 The role of remuneration in supporting business strategyAMP’s remuneration strategy is to align remuneration with the creation of value for shareholders, as illustrated below.
AMP’s remuneration strategy
Attract, motivate and retain employees who will contribute to AMP’s success
Drive outstanding performance against business objectives
Support AMP’s desired culture and risk appetite
Create value for shareholders
AMP has a comprehensive remuneration policy which outlines the responsibilities of the board, PRC and management in maintaining alignment with the remuneration strategy. Of particular note, the policy requires that remuneration arrangements are simple, practical and supported by a governance framework that avoids confl icts of interest, defi nes clear accountabilities and ensures that proper checks and balances are in place. Where an external perspective is needed, the PRC requests market practice, regulatory and governance input from its external board remuneration advisor, PricewaterhouseCoopers.
2.2 Remuneration valueAMP generally positions fi xed remuneration at the median (i.e. the 50th percentile) of the market. When determining the relevant ‘market’ for each role, AMP considers companies from which AMP sources talent and to whom it could potentially lose talent. For the nominated executives, AMP sources data for Australian listed companies of comparable size to AMP, both within the fi nancial services sector and across the general market. Within that market, AMP looks at roles in the same area of expertise, with similar seniority and responsibility to the relevant individual.
Variable remuneration aims to provide the nominated executives with comparable remuneration to their peers in other companies for equivalent performance. Total remuneration above the market median can be realised through the achievement of ‘stretch’ performance targets.
2.3 Remuneration mixAll of the nominated executives have a signifi cant component of their total remuneration linked to performance. As illustrated below, using the STI at midpoint (the STI midpoint is halfway between the minimum outcome of 0 per cent and the maximum outcome, as shown in section 4.2). The STI and LTI are ‘at risk’ remuneration and will only be paid if specifi ed performance standards are met.
LTI 32% 36% Fixed remuneration
CEO
LTI 38%
19%
12%
31%
STI Cash
STI Deferral
Fixed remuneration
Other nominated executives*
19% 13%STI Cash STI Deferral
* As detailed in section 1.4 the AMP Capital MD participates in the Profi t Share plan instead of AMP’s STI plan. As such his STI opportunity is uncapped.
For
per
sona
l use
onl
y

Directors’ Reportcontinued
AMP Annual Report 2011
16
3 Remuneration structure in 2011During 2011, remuneration for the nominated executives and other senior leaders comprised four key components:
Variable or ‘at risk’ remuneration
LTI Annual grant of rights to AMP Limited shares subject to a three-year relative total shareholder return (TSR) performance hurdle
Deferred equity
STI Deferral Portion of STI delivered in rights to AMP Limited shares subject to a two-year service condition and possible forfeiture
STI Cash Annual cash award based on individual, business unit and company performance against fi nancial and non-fi nancial measures
Cash
Fixed or ‘guaranteed’ remuneration
Fixed remuneration Total fi xed remuneration package including superannuation, salary sacrifi ced benefi ts and fringe benefi ts tax thereon
Less senior employees were generally eligible for fi xed remuneration and STI Cash only. However, high-potential employees at a middle management level were also eligible to receive an equity award under AMP’s STI Match plan.
3.1 Fixed remunerationFixed remuneration at AMP is expressed as an annual salary package and is generally targeted at the median of the market (refer to section 2.2 for more detail). From this amount, AMP deducts the required superannuation contributions and any additional superannuation contributions or salary-sacrifi ced benefi ts at the employee’s election. Any fringe benefi ts tax incurred by AMP in providing benefi ts is on-charged to the employee.
Fixed remuneration for the nominated executives is reviewed by the PRC and approved by the AMP Limited Board annually (but not necessarily increased), with consideration to: – market remuneration ranges for the role– the individual’s capability, performance and criticality to AMP– the available budget for remuneration increases across the organisation.
3.2 Short-term incentivesAMP’s short-term incentive (STI) plans provide the nominated executives and other permanent employees with rewards for annual performance against measures set at the beginning of the performance period. The nominated executives participate in the following plans:– CEO: CEO STI plan (refer to section 3.2.1)– direct reports to the CEO (other than the AMP Capital MD): AMP group STI plan (refer to section 3.2.2)– AMP Capital MD: AMP Capital Profi t Share plan (refer to section 3.2.3).
Other permanent employees participate in the AMP group STI plan and/or Targeted Incentive Plans (TIP).1
3.2.1 CEO STI planThe CEO’s maximum STI opportunity is 200 per cent of fi xed remuneration. To determine the annual STI award, the PRC assesses the performance of the CEO against objectives set and approved by the board at the start of each year. The PRC then recommends an STI payment to the board for approval.
In 2011, the CEO’s award was based on the measures and weightings provided below, which were selected to reward the CEO for performance that would drive sustainable growth in shareholder value. For more detail on the AMP group measures, refer to section 3.2.2.
Financial: weighting 60% Non-fi nancial: weighting 40%
– Underlying profi t after tax– Underlying return on equity– Value of cash fl ows– Investment performance
– AXA integration– Risk management– Stakeholder relationships– Talent – Leadership and culture– Growth
Footnote:1 Targeted incentive plans provide those employees who have a direct ability to infl uence fi nancial performance with market competitive
rewards linked to individual/team-based fi nancial measures. Only plans that adhere to the AMP remuneration policy (refer to section 2.1) and contain risk-management protocols are approved.
3.2.2 AMP group STI planThe nominated executives and other permanent employees earn STI awards based on the achievement of AMP’s group-wide measures and personal objectives. Information on the STI opportunity for the nominated executives is provided in section 4.2.
For
per
sona
l use
onl
y

17
STI poolThe size of the AMP group’s STI pool which is available for distribution each year is determined by the board. To make this determination, the board assesses AMP’s performance against fi nancial and non-fi nancial measures approved by the board at the start of each year. The CEO then distributes the pool among business units and AMP group functions based on their contribution to AMP’s performance.
Group-wide measuresThe following AMP group-wide measures were used in 2011 to determine the size of the STI pool (the ‘STI scorecard’). These measures were chosen because they align with the company’s strategy and objectives, as approved by the board, and provide an overall view of performance.
Financial measures: weighting 60% Non-fi nancial measures: weighting 40%
Measures – Underlying profi t after tax– Underlying return on equity– Growth in funds under management– Revenue– Investment performance
– AXA integration– Growth (e.g. market share, strategic
acquisitions, service/product ratings)– People (e.g. leadership and cultural objectives)– Risk management (e.g. regulatory
response, capital adequacy and liquidity)– External standing (e.g. stakeholder
management)
Link to strategy – These fi nancial measures are key drivers of shareholder value
– Stretch targets for these measures are set to drive upper quartile returns (i.e. to be in the top 25% of the top 50 industrials companies in the S&P/ASX 100 Index)
– These measures are key indicators of the sustainability of fi nancial results
The STI pool is calculated based on performance against the above STI scorecard and is then adjusted downwards if AMP management operates outside board-approved risk appetite levels. The risk adjustment can be anywhere from 0–100 per cent. The board also has the discretion to consider the quality of AMP’s fi nancial results, business leadership and the realisation of strategic opportunities in determining the fi nal STI pool.
Individual performance objectivesIndividual performance agreements are set at the start of each year and are designed to focus employees on activities that will drive the achievement of AMP’s strategic objectives in a manner relevant to their role. Performance agreements for the nominated executives typically include some or all of the AMP group measures (refer to group-wide measures above) and additional business unit/individual measures. Risk management and people measures apply to all of the nominated executives. Additionally, all employees are measured on the extent to which they exhibit the ‘AMP behaviours’. These are the behaviours AMP has identifi ed as critical to driving business performance and growth.
Performance objectives for the nominated executives are agreed with the CEO and approved by the board. The board also approves individual performance objectives for individuals with the ability to impact AMP’s fi nancial soundness (specifi ed individuals). At the end of the fi nancial year, the CEO recommends STI payments for his direct reports and other specifi ed individuals based on their performance against the agreed measures, for board approval.
For employees below this level, individual performance is assessed by the employee’s immediate manager and is calibrated against the performance of their peers to determine the individual’s STI payment. Recommendations are signed off by the CEO and General Manager, Human Resources to ensure group-wide consistency and quality control.
STI Deferral planThe nominated executives and selected other senior leaders who can infl uence AMP’s fi nancial stability participate in the AMP STI Deferral plan. The plan was introduced in 2011 and requires that 40 per cent of participants’ STI awards be delivered in rights to AMP shares (share rights). The share rights convert to AMP Limited shares (i.e. vest) after a two-year deferral period. Vesting is subject to ongoing employment, compliance with AMP policies and the board’s discretion. The 2011 STI Deferral awards will be granted in April 2012, following the release of AMP’s full-year fi nancial results and calculation of 2011 STI outcomes. As the plan is new in 2011, no share rights have been granted under the plan as at the date of this report. The hedging prohibition policy described in section 3.3.1 also applies to STI Deferral awards.
STI Match planFor each given year, high potential employees at a middle management level are eligible to be nominated to participate in the STI Match plan, which provides an award of share rights to the value of 50 per cent of the individual’s STI. The STI Match award is provided in addition to the STI Cash opportunity, to help motivate and retain participants. Employees at this level are no longer eligible to participate in long-term incentive plans, for which participation is now limited to the nominated executives and other senior leaders (refer to section 3.3). As the STI Match is based on the STI, the number of share rights awarded to the participant depends on the individual’s contribution to company performance during the fi nancial year.
As with the STI Deferral plan, STI Match share rights convert to AMP Limited shares (i.e. vest) after a two-year deferral period. Vesting is subject to ongoing employment, compliance with AMP policies and the board’s discretion. The 2011 STI Match awards will be granted in April 2012, following the release of AMP’s full-year fi nancial results and calculation of 2011 STI outcomes. As the plan is new in 2011, no share rights have been granted under the plan as at the date of this report. The hedging prohibition policy described in section 3.3.1 also applies to STI Match awards.
For
per
sona
l use
onl
y

Directors’ Reportcontinued
AMP Annual Report 2011
18
3.2.3 AMP Capital Enterprise Profi t Share plan (Profi t Share)In 2011, the Managing Director of AMP Capital (AMP Capital MD) and his management team participated in Profi t Share, a new incentive plan. Eligibility for Profi t Share replaced eligibility to participate in both the AMP group STI plan and the AMP LTI plan effective from 2011 onwards. However, the AMP Capital MD remains eligible to participate in the LTI plan because of his ability as a nominated executive to infl uence shareholder outcomes (as detailed in section 3.3, the ultimate value of LTI is based on value delivered to shareholders over a three-year period).
Profi t Share provides participants with a share of AMP Capital’s adjusted pre-tax profi t as defi ned in the AMP Limited Investor Report. The percentage of profi t that is notionally contributed to the profi t share pool is agreed at the beginning of each year. At the end of the year, the board has the discretion to adjust this percentage up or downwards to recognise non-fi nancial performance, changes in market conditions and/or broader fi nancial factors such as AMP’s capacity to pay. The board also has the discretion to adjust the Profi t Share pool downwards if AMP Capital Management operates outside board-approved risk appetite levels (as per the AMP group STI plan). Allocation to individuals is at the discretion of the board, with consideration to the individual’s performance against their annual fi nancial and non-fi nancial objectives. The award is delivered partly in cash at the end of the fi nancial year (60 per cent of the award), with the remainder deferred into share rights, which vest two years subsequently (40 per cent of the award). The deferred portion is delivered through the AMP group STI Deferral plan (described in Section 3.2.2).
In 2012, membership of this plan will be expanded to other AMP Capital senior leaders who form part of the AMP Capital Executive Council.
3.3 Long-term incentivesAMP’s Long Term Incentive (LTI) plan provides the nominated executives and selected senior leaders with rewards delivered in equity if conditions are met over a three-year period. LTI awards are granted annually, which provides ongoing benefi ts to participants for increasing shareholder value. The nominated executives and selected other senior leaders receive their LTI in the form of performance rights, which are subject to a relative total shareholder return (TSR) hurdle (refer to section 3.3.2). Other participants may take a portion or all of their LTI in share rights, which are subject to their ongoing service (refer to section 3.3.3).
3.3.1 Terms applying to performance rights and share rights granted in 2011Determining the value of the award and the number of securitiesParticipation in the LTI and the value of awards is recommended by the PRC for approval by the board (and by shareholders in the case of the award to the CEO). When recommending the value of awards for each participant, the PRC, on advice from the CEO, considers the recipient’s seniority, infl uence on AMP’s long-term performance and contribution to AMP over the past 12 months or more. The number of securities is calculated by dividing the value of the award by the fair value of the LTI instrument, which is based on the 90-day average closing share price prior to the month in which grants are made. Fair values are discounted for the value of foregone dividends and, in the case of performance rights, the risk of performance conditions not being met.
HedgingAMP policy prohibits employees from entering into any hedging arrangement in relation to any vested or unvested shares, options, share rights or performance rights in any AMP share plan. Breaches of this policy will lead to forfeiture of the relevant award. In accepting equity awards, participants are required to agree that they will not enter into any hedging arrangements in relation to the award.
Treatment of LTI on cessation of employment and change of controlTypically, unvested LTI awards lapse at the end of the employee’s notice period if the participant resigns from AMP or their employment is terminated for misconduct or inadequate performance. In other cases, such as retirement and redundancy, LTI awards may be retained by the participant with vesting continuing to be subject to the same vesting conditions as if they had remained in AMP employment. In the event that AMP is subject to a takeover or change of control, outstanding LTI awards typically vest.
Commencing from the LTI award made in 2011, the board has the discretion to determine an alternative treatment on cessation of employment and change of control (i.e. to determine that the LTI awards would lapse, be retained or vest when they would not have otherwise), if deemed appropriate in the light of specifi c circumstances.
Source of sharesThe shares to satisfy LTI awards are acquired on-market, so that the issue of LTIs does not dilute the value of AMP Limited shares.
3.3.2 Performance rightsA performance right is a right to acquire one fully paid ordinary share in AMP Limited after a three-year performance period for no consideration (i.e. a share option with a zero exercise price), provided a specifi c performance hurdle is met. The nominated executives are required to take their full LTI in performance rights. Other LTI participants elect to take a portion of their LTI in performance rights, which offer the opportunity for greater reward if the performance hurdles are met. Performance rights are awarded at no cost to the participant.
Performance hurdleVesting of performance rights is dependent on AMP’s TSR1 performance relative to a comparator group of Australian listed companies over a three-year performance period. The comparator group for grants made during 2011 (and for all historical grants that were subject to performance testing during 2011) was the top 50 industrials companies in the S&P/ASX 100 Index (based on market capitalisation rank) as defi ned at the start of the relevant performance period. The performance testing period and TSR comparator group companies for grants subject to performance testing during 2011 are provided in the following table.
Footnote:1 Total shareholder return (TSR) measures the benefi t delivered to shareholders over the given period, which includes dividend payments, capital
returns and movement in the share price.
For
per
sona
l use
onl
y

19
Plan 2011 executive award
2011 CEO award
2010 annual award
2009 annual award
2008 annual award
Grant date 9 September 2011 9 June 2011 8 September 2010 12 March 20101 19 September 2008
Performance period
1 August 2011–31 July 2014
1 May 2011–30 April 2014
1 August 2010–31 July 2013
1 August 2009–31 July 2012
1 August 2008–31 July 2011
Comparator group
AGL Energy Ltd, Amcor Ltd, AMP Ltd, ANZ Banking Group Ltd, ASX Ltd, Boral Ltd, Brambles Ltd, CFS Retail Property Trust, Coca-Cola Amatil Ltd, Commonwealth Bank of Australia, Computershare Ltd, Crown Ltd, CSL Ltd, Dexus Property Group (previously known as DB Reef Trust), Fairfax Media Ltd, Foster’s Group Ltd, GPT Group, Incitec Pivot Ltd, Insurance Australia Group Ltd, Leighton Holdings Ltd, Lend Lease Corporation Ltd, MAP Group (previously known as Macquarie Airports), Macquarie Group Limited (previously known as Macquarie Bank Ltd), Metcash Ltd, Mirvac Group, National Australia Bank Ltd, News Corporation, Orica Ltd, Qantas Airways Ltd, QBE Insurance Group Ltd, Sonic Healthcare Ltd, StockIand, Suncorp-Metway Ltd, Tatts Group Ltd, Telstra Corporation Ltd, Toll Holdings Ltd, Transurban Group, Wesfarmers Ltd, Westfi eld Group, Westpac Banking Corporation, Woolworths Ltd
plus for the 2011 executive award
Asciano Group, Bendigo and Adelaide Bank Ltd, APA Group, Cochlear Ltd, Echo Entertainment Group Ltd, Goodman Group, QR National Ltd, Ramsay Healthcare Ltd, Resmed Inc, Westfi eld Retail Trust
plus for the 2011 CEO award
Asciano Group, Bendigo and Adelaide Bank Ltd, Cochlear Ltd, Goodman Group, Ramsay Healthcare Ltd, Resmed Inc, Tabcorp Holdings Ltd
plus for the 2010 annual award
Asciano Group, Bendigo and Adelaide Bank Ltd, Cochlear Ltd, Goodman Group, James Hardie Industries SE, Tabcorp Holdings Ltd, Telecom Corporation of New Zealand Ltd
The following companies are no longer listed, but were originally included: AXA Asia Pacifi c Holdings Ltd, Intoll Group (previously Macquarie Infrastructure Group)
plus for the 2009 annual award
Asciano Group, Cochlear Ltd, CSR Ltd, David Jones Ltd, Tabcorp Holdings Ltd, Telecom Corporation of New Zealand Ltd
The following companies are no longer listed, but were originally included: AXA Asia Pacifi c Holdings Ltd, Intoll Group (previously Macquarie Infrastructure Group), Lion Nathan Ltd
plus for the 2008 annual award
Bendigo and Adelaide Bank Ltd, Boart Longyear Ltd, Goodman Group, Tabcorp Holdings Ltd, Telecom Corporation of New Zealand Ltd
The following companies are no longer listed, but were originally included: AXA Asia Pacifi c Holdings Ltd, Intoll Group (previously Macquarie Infrastructure Group), Lion Nathan Ltd, St George Bank Ltd
Footnote:1 The later than usual grant timing was a result of pending changes to taxation rules. To ensure continuity in long-term performance assessment,
the vesting conditions were applied from August 2009.
The performance hurdle was chosen because it requires participants to outperform major ASX listed companies before the awards generate any value. The PRC reviewed the performance hurdle and determined that relative TSR continues to be the most appropriate measure of long-term shareholder value creation.
Vesting scheduleThe proportion of performance rights that vest for each of the above grants was/will be determined according to the vesting schedule depicted below.
% of performance rights that vest
AMP’s TSR ranking against the comparator group
50th percentile
50%
100%
75th percentile
For
per
sona
l use
onl
y

Directors’ Reportcontinued
AMP Annual Report 2011
20
At the end of the performance period, an independent external consultant provides the PRC with AMP’s TSR ranking against the comparator group. The PRC then determines the number of performance rights, if any, that vest, with reference to the vesting schedule shown in the diagram on the previous page. There is no subsequent performance retesting. Consequently, any awards that do not vest at the end of the vesting period are forfeited.
Conversion to sharesIf the awards vest, they are automatically converted to shares on behalf of participants. Upon conversion, participants become entitled to shareholder benefi ts, including dividends and voting rights.
3.3.3 Share rights AMP also awards share rights under the LTI plan. LTI share rights are used to recognise senior leaders who contribute signifi cantly to AMP’s overall business success, but have a reduced ability to infl uence the creation of shareholder value compared to the nominated executives. LTI share rights are rights to acquire one fully paid ordinary share in AMP Limited after a three-year vesting period subject to ongoing service. Share rights are awarded at no cost to the participant and do not carry dividend entitlements. As this program is a means of recognising and retaining employees, no performance hurdles apply during the vesting period other than continued service.
In prior years, AMP awarded restricted shares instead of share rights. A restricted share is an ordinary AMP share that has a holding lock in place until a three-year vesting period ends. During this time, the holder is eligible to receive dividends, but is unable to sell, transfer or hedge their award.
3.3.4 Legacy plans – AMP Capital Associates Plan The AMP Capital Associates Plan (CAPs) was formerly offered to selected senior leaders in AMP Capital, including Stephen Dunne, the Managing Director.
Under the plan, participants acquired deferred purchase agreements (known as ‘CAP units’) with AMP Capital Holdings Limited. Participants used their own money to purchase CAP units and were able to borrow money through AMP Bank, on full commercial terms, in order to fund their investment. CAP units allowed participants to share in AMP Capital’s performance through annual cash and bonus distributions and capital appreciation (or depreciation).
As reported in 2010, the last offer under CAPs was made in January 2009. In 2011 it was determined that CAPs be closed completely and that individual participants be offered cash compensation in order to extinguish all outstanding rights under the plan. The amount to be received per CAPs unit was calculated based on an arm’s length value. All participants, including Stephen Dunne, accepted the compensation offer and received payments in December 2011.
3.4 Other equity arrangements3.4.1 Executive minimum shareholding requirementIn 2006, the PRC introduced guidelines outlining the minimum number of AMP shares the nominated executives are expected to hold. The guidelines were introduced to strengthen the alignment between the interests of the nominated executives and shareholders in the long-term performance of AMP. The nominated executives were expected to establish and maintain the following minimum shareholdings by 2011 (or within fi ve years of appointment if appointed after 2006):– CEO: 300,000 shares– direct reports to the CEO: 60,000 shares.
Share rights allocated to nominated executives as a result of STI Deferral will be included in balances for the purpose of minimum shareholding requirements. The table below summarises the movements in the holdings of shares in AMP Limited held by the nominated executives and their personally related entities over the reporting period.
Name
Date by which minimum holding
must be metHolding at 1 Jan 2011
Granted as remuneration
during the period
Received on exercise of performance
rights or options Other changes1Holding at
31 Dec 2011
Craig Dunn Jan 2013 558,497 – – – 558,497
Craig Meller Oct 2012 96,207 – – – 96,207
Stephen Dunne Jul 2011 209,396 – – – 209,396
Paul Leaming Jul 2011 208,257 – – – 208,257
Brian Salter Jul 2013 11,220 – – 10,758 21,978
Lee Barnett Jul 2011 52,978 200 – – 53,178
Paul Sainsbury Dec 2015 19,192 – – 736 19,928
Matthew Percival Jul 2011 45,000 – – – 45,000
Fiona Wardlaw Aug 2013 26,259 – – 35,035 61,294
Jonathan Deane Jan 2013 93,583 – – – 93,583
Footnote:1 Other changes represent individuals’ purchases and sales made during the period or participation in the AMP Dividend Reinvestment Plan.
For
per
sona
l use
onl
y

21
With the exception of Lee Barnett and Matthew Percival, all nominated executives who have passed the date by which they must acquire their minimum holdings have acquired the necessary number of shares. Whilst the shareholding targets were not reached by Lee Barnett and Matthew Percival, their 2011 short-term incentive deferrals (into AMP Limited share rights) in March will result in both satisfying the requirement. The minimum shareholding requirement will next be tested on 31 December 2012.
3.4.2 Employee Share Acquisition PlanFrom time to time, AMP has provided employees (including the nominated executives) with the opportunity to become shareholders in AMP through the Employee Share Acquisition Plan (ESAP), typically by way of salary sacrifi cing their fi xed remuneration or STI to acquire shares. Depending on the terms of the particular award, participants may be entitled to receive matching shares for shares acquired under the ESAP (e.g. the most recent awards provided one free share for every 10 shares acquired via salary sacrifi ce). Additionally, AMP can provide employees with free shares under the ESAP. Where the awards are acquired at no cost to the participant, service-based conditions must be met for the participant to receive their full entitlement. The plan was suspended midway through 2009 in Australia due to the changes to the taxation treatment of employee share plan awards. Accordingly, no awards were made under this plan in 2010 or 2011. The plan continues to operate in New Zealand.
4 The link between company performance and remuneration4.1 Company performance and short-term incentive expenditureThe following table shows how STI outcomes compared to AMP’s fi nancial results over the past fi ve years. The STI pool for 2011 is higher than it was in 2010 because of the increase in AMP’s headcount following AMP’s merger with the Australian and New Zealand businesses of AXA Asia Pacifi c Holdings. The STI pool was a similar percentage of underlying profi t, because AMP’s performance in 2011 was consistent with 2010, relative to the targets agreed with the board. STI outcomes and company results are not expected to be perfectly correlated as AMP’s STI performance assessment involves a broader consideration of AMP’s progress in generating future value for shareholders (e.g. non-fi nancial performance and fi nancial results relative to the targets set by the board and shareholder expectations). Shareholders should note that AMP’s merger with the Australian and New Zealand businesses of AXA Asia Pacifi c Holdings is refl ected in the 2011 results.
2007 2008 2009 2010 2011
Underlying profi t ($m) 882 810 772 760 909
Operating earnings ($m) 770 737 701 686 792
Underlying return on equity 38% 39% 32% 26% 15.1%
STI pool ($m) 94 43 72 62 89
STI pool as % of underlying profi t 11% 5% 9% 8% 9.8%
Average STI as % of maximum opportunity for the nominated executives
75% 39% 67% 65% 60%
The chart below illustrates that the impact of company performance on the STI pool was particularly pronounced in 2008, when the STI pool decreased to 5 per cent of underlying profi t.
Company performance ($m) STI pool ($m)
2007
Underlying profit
2008 2009 2010 2011
200
400
600
800
1,000
20
40
60
80
100
STI pool Operating earnings
Watch the scale!1 = (0.5 or 0.05)–10
The sharp decrease in 2008 arose because the STI fi nancial targets for that year were set prior to the onset of the global fi nancial crisis and thus the targets were based on AMP achieving profi t and earnings growth. The 2008 fi nancial results were lower than in 2007 and signifi cantly lower than the targets agreed with the board, and consequently, the STI pool decreased signifi cantly. In 2009, in light of the diffi cult market conditions, fi nancial targets were decreased so as to be stretching, but still achievable. When those targets were achieved, the STI pool increased to 9 per cent of profi t.
For
per
sona
l use
onl
y

Directors’ Reportcontinued
AMP Annual Report 2011
22
4.2 Company performance and 2011 STI outcomes for the nominated executivesThe following table shows STI opportunities for each nominated executive (as a percentage of fi xed remuneration) and the proportions of STI opportunity awarded and forfeited during 2011. The proportions awarded are inclusive of the 40 per cent which is deferred (refer to section 3.2.2). On average, the nominated executives were awarded 60 per cent of their maximum opportunity. The 2011 STI outcomes for the nominated executives were typically lower than in 2010 (when the average percentage awarded was 65 per cent), which is consistent with the movements in AMP’s performance discussed in section 4.1. The differing percentages ‘awarded’ refl ect each nominated executive’s relative contribution to AMP’s 2011 fi nancial and non-fi nancial performance (as measured against their respective 2011 performance objectives). As the STI is an ‘at risk’ component of remuneration, any STI not earned (40 per cent of opportunity on average) was not awarded.
Executive PositionMaximum STI
opportunity Awarded Not
awarded
Craig Dunn Chief Executive Offi cer and Managing Director 200% 64% 36%
Craig Meller Managing Director, AMP Financial Services 200% 62% 38%
Stephen Dunne Managing Director, AMP Capital n/a1 67% 33%
Paul Leaming Chief Financial Offi cer 175% 52% 48%
Brian Salter General Counsel and Company Secretary 175% 56% 44%
Lee Barnett Chief Information Offi cer 175% 58% 42%
Paul Sainsbury Integration Director 175% 62% 38%
Matthew Percival General Manager, Public Affairs 175% 58% 42%
Fiona Wardlaw General Manager, Human Resources 175% 58% 42%
Jonathan Deane General Manager, Strategy 175% 60% 40%
Average 60% 40%
Footnote:1 The AMP Capital MD has STI opportunity delivered under the AMP Capital Enterprise Profi t Share plan (refer to section 3.2.3) and this
opportunity is uncapped. For comparative purposes his Profi t Share award has been notionally assessed against a 200 per cent opportunity.
4.3 Company performance and long-term incentive vesting Performance rights awarded to nominated executives are subject to a total shareholder return (TSR) hurdle whereby AMP’s TSR must be equal to or greater than the median TSR of the top 50 industrials companies in the S&P/ASX 100 Index (refer to section 3.3.2 for more detail).
The table below illustrates how LTI outcomes for the nominated executives are linked to shareholder returns. For each LTI grant made during the last fi ve years, the table provides the relevant performance period, and for all completed performance periods:– AMP’s TSR for that period (absolute and relative to the specifi ed comparator group for the relevant LTI award), and– details of whether the award vested.
Year Award Performance period for the LTI grantAMP’s TSR for
that period1
AMP’s ranking relative to the LTI
comparator groupVesting status at
31 December 2010
2007 Executive award 1 Aug 2007–31 Jul 2010 –35.51% 42nd Lapsed
2008 CEO award 1 Jan 2008–31 Dec 2010 –38.06% 33rd Lapsed
Executive award 1 Aug 2008–31 Jul 2011 –16.31% 32nd Lapsed
2009 Annual award 1 Aug 2009–31 Jul 2012 Performance period not complete
2010 Annual award 1 Aug 2010–31 Jul 2013 Performance period not complete
2011 CEO award 1 May 2011–30 Apr 2014 Performance period not complete
Executive award 1 Aug 2011–31 Jul 2014 Performance period not complete
Footnote:1 TSR was calculated as the growth in share price (using the ASX adjusted price series) plus dividend payments and capital returns over the period.
As shown above, performance rights issued under the 2007 and 2008 LTI offers lapsed as the TSR hurdle was not met. As the 2006 award did not vest either, the LTI has not delivered any value to the nominated executives since the 2005 awards vested in 2008. This is consistent with long-term shareholder outcomes during the relevant performance periods.
For
per
sona
l use
onl
y

23
5 Remuneration for the nominated executives in 20115.1 Accounting value of 2011 remunerationThe following table shows the remuneration details for the nominated executives for the year ended 31 December 2011. The Share-based payments shown below are not amounts actually received by nominated executives during the year, but accounting values for unvested share awards, these values are a statutory disclosure requirement.
Short-term employee benefi ts
Post-employment
benefi ts Share-based payments1
Other long-term benefi ts Termination payments
Executive
Cash salary $’000
Short-term
incentive $’000
Other short-term
benefi ts $’000
Super-annuation
benefi ts $’000
Subtotal $’000
Options and performance
rights2
$’000
Matching and
restricted shares3
$’000
Cash distributions
on equity plans4
$’000
Cash-based
payments5
$’000
Share-based
payments6
$’000
Grand total
$’000
Craig Dunn Managing Director and CEO
20112010
1,648 1,385
1,344 1,960
––
1615
3,008 3,360
2,370 2,109
––
––
––
––
5,378 5,469
Craig Meller Managing Director, AMP Financial Services
20112010
1,014910
7981,320
––
1615
1,8282,245
971916
––
––
––
––
2,7993,161
Stephen DunneManaging Director, AMP Capital
20112010
1,014 910
863925
––
1615
1,8931,850
971912
––
–48
––
––
2,8602,770
Paul LeamingChief Financial Offi cer
20112010
986915
564840
––
1615
1,5661,770
962933
––
––
503–
1,191–
4,2222,703
Brian SalterGeneral Counsel and Company Secretary
20112010
730685
450760
––
2322
1,2031,467
724576
––
––
––
––
1,9272,043
Lee Barnett Chief Information Offi cer
20112010
731678
465650
––
1615
1,2121,343
717690
––
––
––
––
1,9292,033
Paul SainsburyIntegration Director7
2011 634 426 – 16 1,076 407 – – – – 1,483
Matthew PercivalGeneral Manager, Public Affairs
20112010
536498
345650
––
1615
8971,163
531518
––
––
––
––
1,4281,681
Fiona Wardlaw General Manager, Human Resources
20112010
609565
390475
––
1615
1,0151,055
600478
132
––
––
––
1,6161,565
Jonathan DeaneGeneral Manager, Strategy
20112010
497460
330425
––
1615
843900
492423
––
––
––
––
1,3351,323
2011 total 2011 8,399 5,975 – 167 14,541 8,745 1 –4 503 1,191 24,977
2010 total 2010 7,006 8,005 – 142 15,153 7,555 32 8 – – 22,748
Footnote: 1 All share-based payments are equity-settled as per the relevant Australian Accounting Standard (AASB 2 Share-based Payment). 2 The fair value of share rights and performance rights has been calculated as at the grant date by external consultants using Monte Carlo
simulation techniques. Fair value has been discounted for the probability of not meeting the performance hurdles. The value of the award made in any year is amortised over the vesting period.
3 The fair value of restricted shares has been determined using the share price of AMP ordinary shares on the grant date. Under the Employee Share Acquisition Plan (ESAP) participating employees may receive matching shares at the end of the specifi ed vesting period. The employee has no right to dividends on these matching shares until after they are granted. Each matching share has been valued by external consultants as the face value of an AMP ordinary share at grant date less the present value of the expected dividends (not received). The value of the award made in any year is amortised over the vesting period.
4 The fair value of the bonus distribution in the AMP Capital Associates Plan has been determined as being 10% of the capital value of each tranche of CAP units as at the most recent valuation date. The value of the bonus distribution is amortised over the vesting period.
5 Cash-based termination payments comprise contractual payments paid to Paul Leaming on his retirement, such as entitlements to accrued leave.6 Share-based termination payments represent the portion of performance rights granted to Paul Leaming in 2009, 2010 and 2011 that would
have been amortised in future years had he not retired. While the performance rights remain subject to the original vesting period and performance conditions (i.e. they did not vest in 2011 and may not vest in future years), accounting regulations require all future liabilities to be expensed at the time of departure.
7 Paul Sainsbury was appointed as Integration Director on 1 January 2011 and was not a KMP in 2010.
For
per
sona
l use
onl
y

Directors’ Reportcontinued
AMP Annual Report 2011
24
5.2 Performance rights holdings The table below summarises the movements, by number, in the nominated executives’ holdings of performance rights granted by AMP Limited, for the year ended 31 December 2011. For details of the fair valuation methodology, refer to Note 26 to the fi nancial statements.
Name Grant date
Fair value per
performance right
Market price on
exercise1Holding at 1 Jan 2011
Rights granted in
2011
Rights exercised in
20111
Rights lapsed in
2011Holding at
31 Dec 2011
Vested2 and exercisable at
31 Dec 2011
Craig Dunn 6/06/08 19/09/08 12/03/10 8/09/10 9/06/11
$3.56 $3.81 $3.53 $2.50 $2.39
– – – – –
102,914 586,593 777,778 697,675
–
–– – –
729,167
– – – – –
102,914 586,593
– – –
– –
777,778 697,675 729,167
– – – – –
Total 2,164,960 729,167 – 689,507 2,204,620 –
Craig Meller 19/09/0812/03/108/09/109/09/11
$3.81$3.53$2.50$1.92
––––
258,380342,593307,309
–
–––
400,376
––––
258,380–––
–342,593307,309400,376
––––
Total 908,282 400,376 – 258,380 1,050,278 –
Stephen Dunne 19/09/0812/03/108/09/109/09/11
$3.81$3.53$2.50$1.92
––––
258,380342,593307,309
–
–––
400,376
––––
258,380–––
–342,593307,309400,376
––––
Total 908,282 400,376 – 258,380 1,050,278 –
Paul Leaming 19/09/0812/03/108/09/109/09/11
$3.81$3.53$2.50$1.92
––––
259,777344,445308,971
–
–––
327,538
––––
259,777–––
–344,445308,971327,538
––––
Total 913,193 327,538 – 259,777 980,954 –
Brian Salter 19/09/08 12/03/10 8/09/10 9/09/11
$3.81 $3.53 $2.50 $1.92
––––
195,531259,260232,559
–
–––
246,053
––––
195,531–––
–259,260232,559246,053
––––
Total 687,350 246,053 – 195,531 737,872 –
Lee Barnett 19/09/08 12/03/10 8/09/10 9/09/11
$3.81 $3.53 $2.50 $1.92
––––
193,576256,667230,233
–
–––
244,455
––––
193,576–––
–256,667230,233244,455
––––
Total 680,476 244,455 – 193,576 731,355 –
Paul Sainsbury 19/09/08 12/03/10 8/09/10 9/09/11
$3.81 $3.53 $2.50 $1.92
––––
83,799 148,149 132,891
–
–––
207,707
––––
83,799–––
–148,149132,891207,707
––––
Total 364,839 207,707 – 83,799 488,747 –
Matthew Percival 19/09/0812/03/108/09/109/09/11
$3.81$3.53$2.50$1.92
––––
143,297190,000170,432
–
–––
180,546
––––
143,297–––
–190,000170,432180,546
––––
Total 503,729 180,546 – 143,297 540,978 –
Fiona Wardlaw 19/09/0812/03/108/09/109/09/11
$3.81$3.53$2.50$1.92
––––
162,012214,815192,692
–
–––
204,512
––––
162,012–––
–214,815192,692204,512
––––
Total 569,519 204,512 – 162,012 612,019 –
Jonathan Deane 19/09/0812/03/108/09/109/09/11
$3.81$3.53$2.50$1.92
––––
132,682175,926157,808
–
–––
167,764
––––
132,682–––
–175,926157,808167,764
––––
Total 466,416 167,764 – 132,682 501,498 –
Footnote:1 None of the nominated executives exercised performance rights during 2011.2 No performance rights vested during 2011.
For
per
sona
l use
onl
y
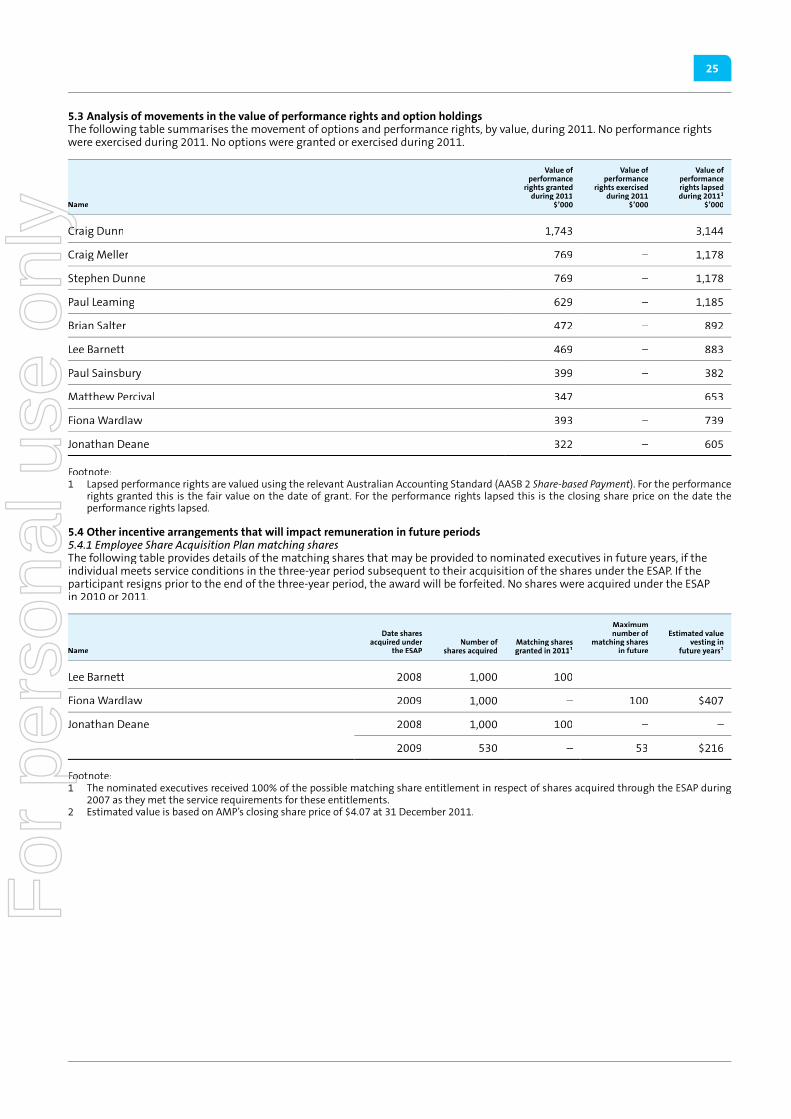
25
5.3 Analysis of movements in the value of performance rights and option holdings The following table summarises the movement of options and performance rights, by value, during 2011. No performance rights were exercised during 2011. No options were granted or exercised during 2011.
Name
Value of performance
rights granted during 2011
$’000
Value of performance
rights exercised during 2011
$’000
Value of performance rights lapsed during 20111
$’000
Craig Dunn 1,743 – 3,144
Craig Meller 769 – 1,178
Stephen Dunne 769 – 1,178
Paul Leaming 629 – 1,185
Brian Salter 472 – 892
Lee Barnett 469 – 883
Paul Sainsbury 399 – 382
Matthew Percival 347 – 653
Fiona Wardlaw 393 – 739
Jonathan Deane 322 – 605
Footnote:1 Lapsed performance rights are valued using the relevant Australian Accounting Standard (AASB 2 Share-based Payment). For the performance
rights granted this is the fair value on the date of grant. For the performance rights lapsed this is the closing share price on the date the performance rights lapsed.
5.4 Other incentive arrangements that will impact remuneration in future periods5.4.1 Employee Share Acquisition Plan matching shares The following table provides details of the matching shares that may be provided to nominated executives in future years, if the individual meets service conditions in the three-year period subsequent to their acquisition of the shares under the ESAP. If the participant resigns prior to the end of the three-year period, the award will be forfeited. No shares were acquired under the ESAP in 2010 or 2011.
Name
Date shares acquired under
the ESAPNumber of
shares acquiredMatching shares granted in 20111
Maximum number of
matching shares in future
Estimated value vesting in
future years2
Lee Barnett 2008 1,000 100 – –
Fiona Wardlaw 2009 1,000 – 100 $407
Jonathan Deane 2008 1,000 100 – –
2009 530 – 53 $216
Footnote:1 The nominated executives received 100% of the possible matching share entitlement in respect of shares acquired through the ESAP during
2007 as they met the service requirements for these entitlements.2 Estimated value is based on AMP’s closing share price of $4.07 at 31 December 2011.
For
per
sona
l use
onl
y

Directors’ Reportcontinued
AMP Annual Report 2011
26
6 Contractual arrangements for the nominated executivesThe table below provides a summary of the key contractual terms agreed with the nominated executives.
Contract term CEO contract Other nominated executives
Length of contract Open-ended Open-ended
Notice period – Employment may be terminated at any time by AMP giving 12 months’ notice or by Craig Dunn giving six months’ notice.
– AMP may terminate Craig Dunn’s employment immediately in certain events, including serious misconduct and material breach of contract.
– In each case AMP may pay the fi xed remuneration for the balance of any notice period in order to bring an earlier end to his employment.
As for CEO, except: – Most of the other nominated executives may
terminate immediately if there is a material adverse change in their role.
– AMP is required to give some longer-serving nominated executives six months’ notice if it wishes to terminate for poor performance.
Employee benefi ts not forming part of fi xed remuneration (refer to section 3.1)
Not applicable Some longer-serving nominated executives are entitled to up to $7,500 annually in reimbursement for taxation, legal or fi nancial planning advice.
Entitlements on termination
– Accrued fi xed salary and statutory entitlements.
– Pro-rata STI may be paid for the period since the last 1 January except in case of misconduct or breach of contract. Where provided, the STI is pro-rated for time served and calculated based on performance to the date of termination.
– Unvested LTI performance rights may be allowed to continue in the relevant LTI plan in the case of death, disablement, redundancy or notice without cause by AMP. In this case the awards will continue to be subject to the original performance hurdles and performance periods.
– In the case of termination by AMP, or termination due to death, disablement or a material change in circumstances, the most recent LTI award at the time of termination will be reduced pro-rata if 12 months have not passed since the award was granted.
– Vested performance rights will be retained on cessation of employment except in the case of serious misconduct or breach of contract.
As for CEO, except: – Some longer serving nominated executives
are entitled to 50% of their maximum annual STI opportunity for the balance of the notice period on redundancy or termination by AMP without cause.
– For contracts agreed after 1 January 2010 the above entitlement was removed, as the payment of such amounts would result in termination payments above the threshold requiring shareholder approval.
– The most recent LTI award at the time of termination does not lapse pro-rata for time served (in the case of termination by AMP, termination due to death, disablement or a material change in circumstances).
Post-employment restraint
Craig Dunn is contractually restrained from entering employment with a competitor for six months, and has a 12 months’ restraint on solicitation of AMP clients and employees.
– Most of the other nominated executives are not restricted from entering employment with a competitor.
– Restraints on solicitation of AMP clients and employees is either for 6 or 12 months.
Effective 2010, employment contracts issued to newly appointed employees (including any new nominated executives) provide that an employee’s termination entitlements are limited to amounts not requiring shareholder approval under the Corporations Act (i.e. their termination payments are capped at one year’s base salary as defi ned for the purpose of section 200B of the Corporations Act).
For
per
sona
l use
onl
y

27
7 Non-executive director remuneration7.1 PhilosophyFees paid to non-executive directors of the AMP Limited Board are determined by the Nomination Committee with regard to advice provided by AMP remuneration specialists and the Nomination Committee’s appointed external remuneration adviser. Factors taken into consideration include: – the level of fees paid to board members of other Australian corporations– the complexity of AMP’s operations – the responsibilities and workload requirements of board members.
In order to maintain their independence, no proportion of non-executive directors’ remuneration is linked to performance.
7.2 StructureDuring 2011, non-executive director remuneration comprised three components.
Benefi ts Superannuation and expense allowance
Fees Committee and subsidiary board fees
AMP Limited Board fees
These fees and benefi ts are subject to the maximum non-executive director fee pool which increased to $3.85m following approval at the Annual General Meeting in May 2011.
7.2.1 AMP Limited Board feesDuring 2011, the Nomination Committee instructed its external remuneration adviser to conduct a market review of non-executive director fees, having regard to the factors in section 7.1 above and that fees have not increased since 2008. As a result of that review, the annual base fee for a non-executive director was increased from $160,000 to $170,000.
The base fees provided to each director, effective as at 1 April 2011 are as follows:
ChairmanOther non-executive
directors
Base fee (excluding superannuation) 2011 $585,000 $170,000
The AMP Limited Board Chairman receives an overall fee in relation to regular duties. No additional fees are paid for his membership of board committees or subsidiary boards, or for his attendance at board meetings or meetings of board committees of which he is not a member. An extra fee may be paid for additional board duties. Board fees are not paid to the CEO as responsibilities regarding board membership are considered to be part of the CEO’s normal employment conditions.
7.2.2 Committee and subsidiary board fees Individual non-executive directors are paid additional fees for duties associated with membership of board sub-committees, membership of AMP subsidiary boards and for duties associated with due diligence committees or other special purpose committees. The 2011 fees (excluding superannuation) are presented below, effective as at 1 April 2011:
Board/committee chairman
Board/committee member
Audit Committee $42,000 $21,000
Nomination Committee $15,000 $7,500
People and Remuneration Committee $36,750 $18,350
AMP Life Board1 $158,000 $98,000
AMP Life Audit Committee $28,750 $17,250
AMP Capital Investors Limited Board2 $110,000 $70,000
AMP Capital Investors Audit Committee $25,000 $15,000
AMP Bank Board $80,000 $50,000
AMP Bank Audit Committee $25,000 $15,000
Footnote:1 The fees shown for AMP Life are the combined fees for AMP Life Limited and the National Mutual Life Association of Australasia Limited and
have increased from 2010 to refl ect the increased duties of this board. Committee and subsidiary board membership details are provided in the Corporate Governance Statement.
2 The AMP Capital Investors Board was restructured in December 2011. The non-executive directors retired and the remaining board comprises four executive directors.
For
per
sona
l use
onl
y

Directors’ Reportcontinued
AMP Annual Report 2011
28
7.2.3 Benefi ts Benefi ts provided to directors are as follows:– Superannuation: Superannuation contributions totalling 9 per cent of total fees are paid in addition to fees and allowances.
Directors may also elect to salary-sacrifi ce their fees into superannuation.– Expense allowance: An annual expense allowance of $6,000 is paid to each director, except the Chairman, for incidental expenses
related to the business of the company. – Retirement benefi ts: AMP ceased providing retirement benefi ts to directors in March 2003 and entitlements were frozen at that
time. Richard Grellman, who was the only remaining director appointed to the board prior to March 2003, received his frozen retirement allowance in May 2011 on his retirement from the board.
7.3 AMP Non-Executive Directors’ Share Plan (NED Share Plan)A minimum of 26 per cent of non-executive directors’ fees must be taken in the form of AMP shares which are held in the Non-Executive Directors’ Share Plan (NED Share Plan) for 10 years or until the director resigns from the AMP Limited Board, unless otherwise withdrawn with the approval of the People and Remuneration Committee. There are no performance hurdles attached to this plan, as non-executive directors use part of their fees to acquire these shares.
Non-executive directors do not participate in any other equity plans.
ShareholdingsThe following table summarises the movements in AMP Limited shares held by the non-executive directors and their personally related entities during 2011.
Non-executive directorHolding at 1 Jan 2011
Purchased through the NED
Share Plan Other changes1Holding at
31 Dec 2011
Peter Mason 414,811 30,901 28,986 474,698
Patricia Akopiantz2 5,116 5,730 – 10,846
Richard Allert2 59,120 5,730 2,387 67,237
Catherine Brenner 27,634 8,983 1,688 38,305
Brian Clark 32,482 8,982 2,477 43,941
Paul Fegan 14,505 8,982 – 23,487
John Palmer 49,621 8,983 3,634 62,238
Nora Scheinkestel 96,472 8,983 6,798 112,253
Peter Shergold 22,031 8,983 1,770 32,784
Richard Grellman3 58,425 3,541 1,677 63,643
Footnote:1 Includes the purchase and sale of shares “on market” and participation in the Dividend Reinvestment Plan.2 The opening holdings for Patricia Akopiantz and Richard Allert are as at 30 March 2011, the date they were appointed to the AMP Limited Board. 3 Richard Grellman retired from the AMP Limited Board on 12 May 2011. The closing holding is at 9 June 2011 following the non-executive
director share plan purchase relating to his May fees.
For
per
sona
l use
onl
y

29
7.4 Accounting value of 2011 non-executive director remuneration The table below shows the remuneration details for the non-executive directors of AMP Limited for 2011.
Short-term benefi ts
Post-employment
benefi ts
AMP Limited Board and
committee fees1
$’000
Fees for other group boards1
$’000
Other short-term benefi ts
$’000
Additional board duties2
$’000
Non-monetary benefi ts
$’000Superannuation
$’000Total
$’000
Peter Mason Chairman
20112010
576550
––
––
10030
––
1615
692595
Patricia Akopiantz3
Non-executive director20112010
141–
5–
4–
––
––
14–
164–
Richard Allert3
Non-executive director20112010
143–
––
4–
15–
––
13–
175–
Catherine Brenner4
Non-executive director20112010
17287
153102
63
55–
––
3317
419209
Brian ClarkNon-executive director
20112010
198182
125123
66
––
––
3028
359339
Paul FeganNon-executive director
20112010
209177
5038
66
5520
––
2722
347263
Richard Grellman5
Non-executive director20112010
69205
62164
26
4020
––
1636
189431
John PalmerNon-executive director
20112010
204194
10998
66
15–
––
2927
363325
Nora ScheinkestelNon-executive director
20112010
193190
150143
66
––
––
3131
380370
Peter ShergoldNon-executive director
20112010
192175
10885
66
30–
––
2824
364290
Total for 2011 2,097 762 46 310 – 237 3,452
Total for 2010 1,760 753 39 70 – 200 2,822
Footnote:1 Details of the non-executive directors’ committee memberships and directorships of subsidiary boards are provided in the Corporate
Governance Statement.2 Relates to additional work performed as part of the AXA transaction.3 Patricia Akopiantz and Richard Allert were appointed to the AMP Limited Board on 30 March 2011.4 Catherine Brenner was appointed to the AMP Limited Board on 16 June 2010. The remuneration shown above includes fees paid to her as a
Director of AMP Life Limited from 1 January 2010.5 In addition to the amounts shown, Richard Grellman received his frozen retirement allowance of $240,340 upon his retirement from the AMP
Limited Board on 12 May 2011.
Signed in accordance with a resolution of the directors.
Peter Mason Craig DunnChairman Chief Executive Offi cer and Managing DirectorSydney, 16 February 2012
For
per
sona
l use
onl
y

30
AMP Annual Report 2011
for the year ended 31 December 2011Analysis of shareholder profi t
This table shows an analysis of the source of profi t after income tax attributable to shareholders of AMP Limited.
All amounts are after income tax2011
$m2010
$m
AMP Financial Services 766 639 AMP Capital 83 87
Business unit operating earnings 849 726
Group Offi ce costs (57) (40)
Total operating earnings 792 686
Underlying investment income 183 130 Interest expense on corporate debt (82) (72)AMP Limited tax loss recognition 16 16
Underlying profi t 909 760
Market adjustment – investment income (50) (5)Market adjustment – annuity fair value 13 22 Market adjustment – risk products 53 (7)Loan hedge revaluations 3 1 Other items 1 (2)
Profi t after income tax before AXA merger related adjustments and accounting mismatches 929 769
Merger and acquisition transaction costs (42) (16)AXA integration costs (105) – Amortisation of AXA acquired intangibles (75) – Accounting mismatches (19) 22
Profi t attributable to shareholders of AMP Limited 688 775
For
per
sona
l use
onl
y

312011 Corporate Governance Statement
Approach to corporate governanceAMP has a set of values that recognise the group’s responsibilities to all its stakeholders, including shareholders, customers, employees, planners, business partners and the community.
The AMP Limited Board places great importance on the highest standards of governance and periodically reviews its governance practices to address AMP’s obligations as a responsible corporate citizen.
In accordance with the ASX Corporate Governance Principles and Recommendations (ASX Recommendations), AMP has posted copies of its governance practices (including copies of relevant policies and terms of reference) in the corporate governance section of its website: www.amp.com.au. The AMP Limited Board believes that AMP’s governance practices were consistent with all of the ASX Recommendations during 2011.
Role of the AMP Limited Board and management(ASX Recommendation 1.1)Lay solid foundations for management and oversight
The AMP Limited BoardThe AMP Limited Board is responsible to AMP’s shareholders for the overall governance and performance of the AMP group.
The board primarily represents the long-term interests of shareholders by bringing informed and independent judgement in:– providing strategic direction to AMP through constructive
engagement with senior management in the development, execution and modifi cation of AMP’s strategy and in approving AMP’s strategic plan
– approving major business initiatives within the AMP group– guiding and monitoring the businesses of the companies
within the AMP group– appointing the Managing Director and Chief Executive
Offi cer (CEO), the Chief Financial Offi cer (CFO) and the Company Secretary
– monitoring the CEO’s performance– providing advice and counsel to senior management
of the AMP group– approving succession plans for the CEO and reviewing
the succession planning policy and approach for the direct reports of the CEO and for critical business roles
– approving AMP group’s talent management strategy, including seeking to encourage diversity on the boards of AMP and its key operating subsidiaries and in senior management
– approving remuneration policies and practices, including the total remuneration package, performance objectives and performance appraisal for the CEO, the direct reports of the CEO and other persons whose individual activities may, in the People and Remuneration Committee’s opinion, affect the AMP group’s fi nancial soundness or that of its key operating subsidiaries
– overseeing and approving AMP group’s governance model, including monitoring and overseeing the work of the boards of the key operating subsidiaries and monitoring the implementation by those boards of the policies and decisions of the AMP Limited Board
– seeking to ensure the effectiveness of the boards of AMP and its key operating subsidiaries; approving the remuneration (following the recommendation of the Nomination Committee) for AMP and key operating subsidiary non-executive directors
– reviewing and approving policies that seek to ensure the AMP group’s businesses are conducted ethically
– reporting to AMP shareholders
– considering AMP shareholders’ views on the management and direction of the AMP group
– considering the interests of all stakeholders in the AMP group, including its shareholders, customers and clients, business partners, employees and the wider community
– approving policies that seek to ensure AMP group’s compliance with its legal and regulatory obligations
– reviewing and approving AMP group’s strategic risk management and seeking to ensure appropriate group-wide compliance and risk frameworks are in place
– approving major decisions concerning the fi nancial capital of the AMP group
– monitoring the AMP group’s fi nancial results– determining dividends– approving the half and full-year fi nancial results
for the AMP group– approving releases to the Australian Securities
Exchange (ASX) on major matters– approving the delegation of powers to the CEO and
senior management.
ManagementThe CEO is responsible for the overall management and fi nancial performance of the AMP group. The CEO manages the organisation in accordance with the strategy, plans, risk appetite and policies approved by the board.
AMP Limited Board composition and size(ASX Recommendations 2.1, 2.2, 2.3, 2.4 and 2.5)Structure the board to add value
The AMP Constitution provides for the minimum and maximum number of directors on the board. The board is made up of a majority of independent non-executive directors and has only one executive director, the CEO. The Chairman of the board is non-executive and independent of the role of the CEO.
AMP’s Constitution is available on AMP’s website. Biographical details setting out the skills, experience and expertise of, and period of offi ce held by, each of the directors in offi ce at the date of this report are set out in the Directors’ Report.
Appointment of directorsNominations of directors, recommended by the Nomination Committee, are considered by the board.
The Nomination Committee considers a wide base of potential directors, taking into account the range of skills and experience required in relation to the:– current composition of the board– need for independence– desirability of achieving diversity on the AMP board– strategic direction of the AMP group– geographic spread and mix of AMP’s businesses.
From time to time, the Nomination Committee uses external consultants to assist in its considerations. A copy of the Nomination Committee terms of reference is available on AMP’s website.
Director independenceIt is important that the board operates independently of executive management. The board has considered the criteria for director independence set out in Box 2.1 of the ASX Recommendations and considers each of the non-executive directors to be independent of management. This means they do not have any business interest or other relationship that could materially interfere with the exercise of their independent judgement and their ability to act in the best interests of the company.
AMP also includes independent directors on the boards of key operating subsidiaries.
For
per
sona
l use
onl
y

32
AMP Annual Report 2011
continued2011 Corporate Governance Statement
Chairman’s appointment and responsibilitiesThe Chairman is appointed by and from the non-executive directors of the board.
The Chairman:– provides appropriate leadership to the board and the
AMP group– facilitates board discussions– maintains a regular dialogue and mentor relationship
with the CEO– monitors board performance– guides and promotes the ongoing effectiveness and
development of the board and individual directors.
Conduct of AMP Limited Board businessThe board normally holds around 10 formal board meetings each year and will also meet whenever necessary to carry out its responsibilities.
When conducting board business, directors will question, request information, raise any issue which is of concern to them, canvass fully all aspects of any issue confronting AMP and vote on any resolution according to their own judgement. Directors keep confi dential all board discussions, deliberations and decisions except where decisions are required to be disclosed publicly.
Access to informationDirectors are able to access members of senior management from time to time to request relevant information.
Directors are entitled to seek independent advice on AMP-related matters at AMP’s expense. Directors must ensure the costs are reasonable and must advise the Chairman before the advice is sought. Any advice received must be made available to the rest of the board unless otherwise agreed by the Chairman or the board.
Code of Conduct(ASX Recommendation 3.1)Promote ethical and responsible decision-making
The AMP Limited Board has adopted a Code of Conduct outlining the standards of personal and corporate behaviour required of all directors, offi cers and employees of the AMP group. This Code reinforces an already strong ethical culture for the benefi t of all stakeholders.
A copy of the Code of Conduct is provided to all directors and employees on joining AMP.
AMP’s Code of Conduct is available on AMP’s website.
Confl icts of interestDirectors are required to monitor and disclose any potential confl ict of interest that may arise. Directors must:– disclose to the Chairman any actual or potential confl icts
of interest that may exist as soon as the situation arises– take necessary and reasonable steps to resolve any
confl ict of interest– comply with the Corporations Act 2001 requirements
about disclosing interests and restrictions on voting.
Any proposed non-AMP Limited Board or executive appointments being considered by directors must be discussed with the Chairman. Directors must advise AMP of such appointments to other companies as soon as possible after the appointment is made.
The same requirement exists for related party transactions, other than those occurring on an arm’s length basis. Such a proposed related party transaction should be reported in writing to the Company Secretary and, where appropriate, raised for consideration at the next board meeting. In the meantime, the director concerned should not commit to the transaction.
Trading PolicyAMP’s Trading Policy sets out AMP’s policy regarding insider trading and the trading in AMP securities by directors and employees.
AMP’s Trading Policy aims to:– protect stakeholders’ interests at all times– ensure directors and employees do not use any information
they possess for personal advantage, or to the detriment of AMP
– ensure directors and employees comply with insider trading provisions of the Corporations Act 2001.
Trading in AMP securities by directors, executives and certain employees (Designated Persons) is restricted to the following trading windows:– 30-day period beginning on the second day after
the release of AMP’s interim and annual results– 30-day period beginning on the second day after
the AMP Annual General Meeting (AGM)– period commencing on the day after the issue of a
prospectus offering AMP securities (or a document containing equivalent information) and ending on the day the offer closes
– any additional period designated by the board from time to time, whether for a particular person or purpose (such as participation in an employee incentive scheme offer) or general purposes (for example, during a period of enhanced disclosure).
However, Designated Persons may acquire AMP securities under any share plan (such as the Employee Share Acquisition Plan or the Non-Executive Directors’ Share Plan, or any successor or similar plans), on a monthly or other regular basis, outside the trading windows referred to above. These securities are acquired in accordance with a fi xed purchase program under the terms of the share plan.
Trading in AMP securities, during or outside the formal trading windows, is subject to the overriding prohibition on trading while in the possession of inside information.
Breaches of this policy will be treated seriously and may lead to disciplinary action being taken against the employee, including dismissal.
AMP’s Trading Policy is available on AMP’s website.
AMP Limited Board committeesThe board has established committees to consider certain matters. The Chairman of each committee reports on any matter of substance at the next full board meeting.
There are currently three standing committees:– Nomination Committee– People and Remuneration Committee– Audit Committee.
Other committees may be formed from time to time, as required. Each committee has its own terms of reference, approved by the board and reviewed annually.
The Chairman and CEO attend committee meetings where appropriate. Board and committee attendance records, membership and a summary of the high level duties of the board committees are shown in the Directors’ Report.
The terms of reference for all committees are available on AMP’s website.
Nomination Committee(ASX Recommendations 2.4 and 2.5)
The Nomination Committee supports and advises the AMP Limited Board on board matters including policies, performance, remuneration, composition, fi tness and propriety of directors and the board (as required by APRA) and succession planning.
For
per
sona
l use
onl
y

33
This includes identifying, evaluating and recommending candidates to the board, having regard to relevant expertise, skills, personal attributes, diversity, current board size, availability and tenure of directors, the requisite business needs and time commitments required. The Nomination Committee also oversees and recommends to the AMP board the appointment of non-executive directors to the boards of key operating subsidiaries and other appointments.
The Nomination Committee is responsible for reviewing the remuneration of non-executive directors on the AMP Limited Board and on boards of key operating subsidiaries.
Board performance assessmentThe Chairman of the Nomination Committee will, on an annual basis, facilitate, either directly or through a third party, a discussion and evaluation of the AMP Limited Board’s performance. This will include discussions both collectively and individually about:– the AMP group as a whole– the board’s role, processes and performance– the skills and experience of directors individually
and the board collectively– board group dynamics– any other relevant issues.
Each director’s performance is reviewed by the Chairman and the board annually and prior to any director standing for re-election at a general meeting of the company. The review is conducted either directly or through a third party. The board (excluding the Chairman), either directly or through a third party, will conduct a formal review of the Chairman’s performance every two years. All committees of the AMP Limited Board as well as the boards, the individual directors and committees of key operating subsidiaries regularly review their own performance.
Retirement of directorsDirectors may not hold offi ce for more than three years since last elected or re-elected at an AGM. A director appointed by the board to fi ll a casual vacancy or as an addition to the existing directors will hold offi ce until the next AGM when that director is required to stand for election. This election will be in addition to any rotational retirements.
The CEO, who is also a director on the board, is not subject to retirement by rotation and is not to be taken into account in determining the retirement by rotation of directors.
A director who holds any executive offi ce with AMP (including the CEO) ceases to be a director when they no longer hold their executive offi ce. The tenure of non-executive directors will generally be no longer than nine years. A non-executive director can continue to hold offi ce after a nine-year term provided they are re-elected by shareholders at every subsequent AGM.
Amendments to provisions in the Constitution governing the retirement of directors will be considered by shareholders at the 2012 AGM.
People and Remuneration Committee(ASX Recommendations 1.2, 8.1, 8.2 and 8.3)Remunerate fairly and responsibly
The People and Remuneration Committee advises the board on the effectiveness, integrity and legal compliance of AMP’s remuneration policy, plans and practices. Each year the committee also reviews and reports on remuneration by gender, considering appropriate strategies to promote diversity. Other key responsibilities include annually reviewing and recommending to the board the AMP group short-term incentive pools, the total remuneration package, performance objectives and performance appraisal for the CEO, direct reports of the CEO and other persons whose individual activities may, in the People and Remuneration Committee’s opinion, affect the fi nancial soundness of the AMP group and its key operating subsidiaries.
Committees
AMP Limited Board
Nomination Committee People and Remuneration Committee Audit Committee
Chairman: Nora Scheinkestel
Members: Brian Clark, Peter Mason
Duties:– policies, performance, remuneration,
composition, fi tness and propriety of directors and the board (as required by APRA) and succession planning
– recommendations to the AMP Board on the appointment of non-executive directors to key operating subsidiaries
Chairman: John Palmer
Members: Patty Akopiantz, Brian Clark, Peter Mason
Duties:– succession planning policy
and approach– talent management strategy
and approach– changes to the remuneration policy– AMP group short-term incentive
pools and performance measures– any signifi cant changes to the terms
of existing share incentive plans and new share plans
– the total remuneration package, performance objectives and performance appraisals for the CEO, the direct reports of the CEO and other persons whose individual activities may, in the People and Remuneration Committee’s opinion, affect the fi nancial soundness of the AMP group
Chairman: Paul Fegan
Members: Rick Allert, Peter Shergold
Duties:– AMP’s business relationship with, and
independence of, the external auditor – the reliability and appropriateness of
disclosure of the fi nancial statements – oversight of the framework of risk
management including compliance, internal controls and the assurance provided by external audit
– the adequacy of the AMP group professional risks insurance programF
or p
erso
nal u
se o
nly

AMP Annual Report 2011
34continued2011 Corporate Governance Statement
During 2011, performance evaluations for key executives were carried out in accordance with the process disclosed in the 2011 Remuneration Report. The People and Remuneration Committee engages external consultants as and when required to assist it in fulfi lling its responsibilities.
The People and Remuneration Committee is comprised of three independent directors and is chaired by a director who is not the chairman of the AMP Limited Board.
Non-executive directors’ and executives’ remunerationComprehensive information on AMP’s remuneration policies and practices is contained in the Remuneration Report.
Audit Committee(ASX Recommendations 4.1, 4.2, 4.3, 7.1, 7.2 and 7.3)Safeguard integrity in fi nancial reportingRecognise and manage risk
The primary function of the Audit Committee is to review and provide recommendations to the board in regard to:– the business relationship with, and the independence
of, the external auditor, including all aspects of fi nancial reporting and auditing
– the reliability and appropriateness of disclosure of the fi nancial statements and related external fi nancial communications
– the oversight of the framework of risk management including compliance, internal controls and the assurance provided by internal audit
– the adequacy of the AMP group professional risks insurance program, including directors’ and offi cers’ professional indemnity insurance cover.
The Audit Committee is comprised of three independent directors and is chaired by a director who is not the chairman of the AMP Limited Board.
Risk managementThe AMP Limited Board has overall responsibility for establishing a system of risk management and internal compliance and control across the business and for monitoring and reviewing its effectiveness. It also has responsibility for approving the risk appetite of the AMP group and the risk management policies to support that appetite, and seeking to ensure these are implemented.
The main risk categories that AMP takes into consideration are:– strategic risk– operational risk (including compliance risk)– fi nancial and market risk (including fi nancial reporting)– product and insurance risk.
Environmental and sustainability risks, to the extent to which they are relevant, are addressed by AMP’s Corporate Responsibility Plan.
While the board is responsible for risk management, specifi c responsibility for the monitoring and evaluation of the effectiveness of risk management and the internal control environment has been delegated to the Audit Committee. The Audit Committee also oversees AMP’s accounting policies, reporting practices and production of fi nancial statements and monitors the application of appropriate management controls. It considers internal and external audit reports and reviews AMP’s procedures and internal controls in order to monitor fi nancial risks and major operational risks.
Risk and compliance processes and reporting procedures provide assurance to the board and Audit Committee that the preparation of the fi nancial statements and the control systems underlying them are adequate.
The Audit Committee is supported by the risk management structures which exist throughout the organisation, including the Group Asset and Liability Committee, the Group Risk and Compliance Committee and business unit risk committees. The Audit Committee relies on the work of the audit committees of key operating subsidiaries on risk and compliance matters relating to those subsidiaries. The risk management framework enables the business to identify and assess risks and controls, respond promptly and appropriately and continue to monitor risks and issues as they evolve. Risk and compliance information is reported quarterly to the Audit Committee, or more regularly if required.
AMP’s risk management structures and procedures are continually being enhanced or updated. In addition, the internal audit function provides independent and objective assurance to the board that risks are being managed effectively across the group.
The Risk Management Policy is available on AMP’s website.
Material business risksAMP manages risks across all four main risk categories. Management engages in a regular process to review risks and how they are being managed.
The board has received and considered management’s report on the material business risks for the year ended 31 December 2011.
ComplianceCompliance is a key element of risk management. The board has overall responsibility for the establishment of processes to manage compliance with the laws, regulations, contracts, industry codes, internal standards and policies applicable to AMP’s operations and for monitoring and reviewing their effectiveness.
As required by the Corporations Act 2001, Australian fi nancial services’ licensed entities have adopted individually-tailored confl ict of interest policies.
While the board is responsible for AMP’s compliance framework, specifi c responsibility for the monitoring of compliance has been delegated to the Audit Committee. The Audit Committee oversees the system of compliance that has been implemented across AMP’s businesses. The system covers a broad range of legal requirements, duties and responsibilities. Any compliance issues or incidents are reported quarterly to the Audit Committee, or more urgently if required.
CEO and CFO assuranceThe board receives regular reports about the fi nancial condition and operational results of AMP and its controlled entities. The board has received and considered the annual certifi cation from the CEO and the CFO in accordance with ASX Recommendation 7.3 and s.295A of the Corporations Act 2001, stating that:– the fi nancial statements present a true and fair view of
the AMP group’s fi nancial position and performance and are in accordance with the relevant accounting standards
– the risk management and internal control systems are sound, appropriate and operating effectively in all material respects in relation to fi nancial reporting risks.
The enhancement of the risk management and internal control systems is the subject of ongoing attention and effort. Where internal control defi ciencies are identifi ed during the year, additional tests of procedures or tests of resulting account balances included in the fi nancial statements are undertaken to confi rm there has been no material impact on the fi nancial statements.
For
per
sona
l use
onl
y

35
Auditor independenceThe independence of the external auditor is of particular importance to shareholders and the board. The board has adopted a Charter of Audit Independence, which covers the following key points:– the rotation of the senior audit partner– the annual confi rmation by the auditor that it has satisfi ed
all professional regulations relating to auditor independence– the reporting on the levels of audit and non-audit fees– the specifi c exclusion of the audit fi rm from work which
may give rise to a confl ict.
In accordance with the Corporations Act 2001 and based on the advice of the Audit Committee, the directors have satisfi ed themselves that the provision of non-audit services during the year by the auditors, Ernst & Young, is compatible with the general standard of independence for auditors imposed by the Corporations Act 2001.
Corporate responsibility at AMPAMP was founded on a promise, “to be a sure friend in uncertain times”.
This promise will be kept by delivering on AMP’s responsibilities in a balanced way, to all stakeholders – that is, shareholders, customers, employees, planners, business partners and the community in general.
AMP contributes to the long-term sustainability of its business and to the communities that it serves by using its expertise to:– help its customers build superannuation and investments
for tomorrow– encourage good corporate governance– limit its environmental impact.
For nearly 20 years, AMP has invested directly in the community through the AMP Foundation.
Helping customers build superannuation and investments for tomorrowAMP’s core business purpose is to help its customers and clients to “own their tomorrows” by delivering the right balance of security and performance. One of the key ways AMP achieves this is by providing its customers with the fi nancial advice, products and services they need to build and protect superannuation and investments for the future, through AMP’s online tools, published research and participation in public conversations. AMP also shares experiences and insights with the government and local community to ensure the regulatory approach provides incentives for long-term superannuation and investments within an effi cient and competitive fi nancial services market and an informed community.
Encouraging good corporate governanceAMP believes there is a clear link between an organisation’s environmental and social impacts, ethical practices, the quality of its corporate governance and its long-term business success.
Through AMP Capital, AMP is a signifi cant investor in the Australian and New Zealand markets on behalf of its customers. This position is used to improve corporate governance standards across the business sector through participation in policy forums and public dialogue, proxy voting and active engagement with the management of companies in which AMP invests.
Minimising AMP’s environmental impactsAMP helps to safeguard its future and that of its communities by actively reducing the group’s impact on the environment. This is done by using energy, water and paper resources effi ciently and setting performance goals for recycling, energy use and greenhouse gas emissions.
AMP Capital, as a major commercial property manager, is an active participant in industry initiatives designed to better understand and minimise environmental impacts and to set best-practice benchmarks. It continues to work closely with tenants across its portfolio to increase energy effi ciency in the buildings it owns and manages. This includes those buildings tenanted by AMP.
Diversity(ASX Recommendations 3.2, 3.3 and 3.4)Promote ethical and responsible decision-making
For AMP, diversity is not a program or initiative: AMP wants to create a competitive advantage by identifying and seeking to overcome unconscious bias that will help the group respond to the diverse needs of its employees, customers, shareholders, business partners and communities.
As one of the founding members of the Diversity Council of Australia, AMP understands the importance of diversity in its workplace. AMP was pleased to be recognised as an Employer of Choice for Women by the Equal Opportunity for Women in the Workplace Agency (EOWA) in 2011.
In 2010, AMP established a Diversity Advisory Board Committee to guide its diversity strategy. The Diversity Advisory Committee is chaired by Nora Scheinkestel and consists of three other non-executive directors – Catherine Brenner, Brian Clark and Peter Shergold – and the CEO, Craig Dunn. The Diversity Advisory Committee reviews and reports on the proportion of women and men across all levels of AMP and annually reviews the progress towards the goals set out below, which have been approved by the board.
A copy of AMP’s Diversity, Equal Opportunity and Workplace Harassment Policy is available on AMP’s website.
AMP is committed to creating a culture where all employees are encouraged to demonstrate diversity of thought and experience and where individual differences are valued and respected. Included below are specifi c details about AMP’s gender diversity.
Currently three of the 10 AMP Limited Board members are female, which is in line with AMP’s target of women representing 30 per cent of the board. 54 per cent of AMP employees and two of the 11 members of the CEO’s leadership team are female. AMP recognises that although the group has taken some steps to increase gender diversity, this is an area of continuous improvement for our organisation.
AMP’s goals are:– to increase the number of women in senior executive
positions to 35 per cent by 2015 (at the end of 2011, women held 17 per cent of senior executive positions)
– to increase the number of women in middle management positions to 43 per cent by 2015 (at the end of 2011, women held 38 per cent of middle management positions).
To facilitate career progression through the organisation AMP:– offers a range of development and networking programs– offers a range of mentoring programs (in 2011 more than
half the participants were women)– runs a graduate program (in 2011 49 per cent of the
intake were women, this is increasing to 50 per cent in 2012)
– offers leadership development programs on unconscious biases
– is committed to ensuring there is pay parity across the organisation.
For
per
sona
l use
onl
y

AMP Annual Report 2011
36continued2011 Corporate Governance Statement
As one of the fi rst private sector employers in Australia to offer paid parental leave, AMP has long championed programs to help employees manage their work and home commitments. AMP currently offers:– 14 weeks’ paid parental leave– a formal program to help parents stay informed and
connected to the business while on parental leave– a sponsored child care centre in Sydney– onsite carers’ rooms to assist parents who have
returned to work– fl exible work arrangements– a leave purchase scheme.
AMP continues to enrich the programs that are offered to all employees, because the group believes it is what it does today that will help its customers, employees, shareholders, business partners and communities “own their tomorrows”.
Communication with shareholders(ASX Recommendations 5.1 and 6.1)Timely and balanced disclosureRespect the rights of shareholders
AMP is committed to transparency and quality in its communication to shareholders. The group’s approach to communicating with shareholders and fi nancial markets is set out in AMP’s Market Disclosure Policy. Information is communicated to shareholders through the distribution of the Annual Report, Shareholder Review and other communications as required. All signifi cant information is posted on AMP’s website as soon as it is disclosed to the ASX.
The guiding principle of the policy is that AMP must immediately notify the market via an announcement to the ASX of any information concerning AMP that a reasonable person would expect to have a ‘material’ effect on the price or value of AMP securities. The policy permits exceptions to immediate notifi cation in accordance with the ASX Listing Rules.
AMP’s Market Disclosure Committee ensures that company announcements:– are made in a timely manner
– are factual– are expressed in a clear and objective manner that
allows investors to assess the impact of the information when making investment decisions
– do not omit material information.
Shareholders can elect to receive all communications electronically or not receive some communication materials by contacting AMP’s share registry or visiting AMP’s website.
AMP’s Market Disclosure Policy is available on AMP’s website.
Annual General Meeting All shareholders are encouraged to attend and/or participate in AMP’s AGM. The meeting is webcast live or shareholders can attend in person or send a proxy as their representative. Online completion and lodgement of the proxy form is also available for all shareholders prior to the meeting. AMP Directors and senior management attend the meeting, along with a representative from the external auditor.
Full details of the 2012 AGM are included in the 2012 Notice of Meeting and are available on AMP’s website.
Comparison of NZX and ASX corporate governance rulesAs an overseas listed issuer, AMP is deemed to satisfy and comply with the New Zealand Stock Exchange (NZX) Listing Rules so long as it remains listed on the ASX. The only NZX requirements applicable to AMP are to give the NZX the same information and notices it is required to give to the ASX and to include a statement (referred to below) in its Annual Report.
Some material differences may exist between the corporate governance rules and principles of the ASX and NZX. This may arise because the relevant matters are mandatory under the NZX Corporate Governance Rules but are only best practice recommendations under the ASX Corporate Governance Rules (requiring disclosure of non-compliance in the Annual Report).
Further information about the ASX Corporate Governance Principles and Recommendations may be obtained from the ASX website: www.asx.com.au/about/corporate_governance/index.htm
For
per
sona
l use
onl
y

for the year ended 31 December 201137Financial Report
Table of contents
Income statement 38Statement of comprehensive income 39Statement of fi nancial position 40Statement of changes in equity 41Statement of cash fl ows 43Notes to the fi nancial statements 441. Basis of preparation and summary of signifi cant accounting policies 442. Signifi cant accounting judgements, estimates and assumptions 543. Merger with the Australian and New Zealand businesses
of AXA Asia Pacifi c Holdings Limited 554. Segment information 575. Income 606. Investment gains and (losses) 607. Expenses 618. Income tax 629. Receivables 6310. Inventories and other assets 6411. Investments in fi nancial assets and other fi nancial liabilities 6412. Investment property 6513. Property, plant and equipment 6614. Intangibles 6715. Payables 6916. Provisions 6917. Borrowings 7018. Subordinated debt 7019. Dividends 7120. Contributed equity 7221. Life insurance contracts 7322. Other life insurance and investment contract disclosures 8223. Risk management and fi nancial instruments information 8524. Capital management 9825. Notes to Statement of cash fl ows 10026. Earnings per share 10227. Superannuation funds 10228. Share-based payments 10629. Group controlled entity holdings 11130. Associates 11931. Forward investments, leasing and other commitments 12132. Contingent liabilities 12133. Related-party disclosures 12234. Auditors’ remuneration 12535. Events occurring after reporting date 125Directors’ declaration 126Independent auditor’s report to the members of AMP Limited 127
For
per
sona
l use
onl
y

for the year ended 31 December 2011
AMP Financial Report 2011
38 Income statement
Consolidated Parent
Note2011
$m2010
$m2011
$m2010
$m
Income and expenses of shareholders, policyholders, external unitholders and non-controlling interests1 Life insurance premium and related revenue 5 1,877 1,100 – – Fee revenue 5 1,962 1,430 16 11 Other revenue 5 380 294 – – Investment gains and (losses) 6 1,464 4,840 283 376 Life insurance claims and related expenses 7 (1,790) (1,289) – – Operating expenses 7 (3,425) (2,270) (16) (11)Finance costs 7 (917) (889) – – Share of profi t or (loss) of associates accounted for using the equity method 4 6 – – Movement in external unitholder liabilities 225 (284) – – Change in policyholder liabilities – life insurance contracts 25 202 – – – investment contracts 868 (2,259) – – Income tax (expense) credit 8 3 (126) 69 16
Profi t for the year 676 755 352 392
Profi t for the year attributable to shareholders of AMP Limited 688 775 352 392 Profi t (loss) for the year attributable to non-controlling interests (12) (20) – –
Profi t for the year 676 755 352 392
Footnote: 1 Income and expenses include amounts attributable to shareholders’ interests, policyholders’ interests in the life entities’ statutory funds,
external unitholders’ interests and non-controlling interests. Amounts included in respect of the life entities’ statutory funds have a substantial impact on most of the consolidated Income statement lines, especially Investment gains and (losses) and Income tax (expense) credit. In general, policyholders’ interests in the transactions for the period are attributed to them in the lines Change in policyholder liabilities.
Consolidated
Note2011cents
2010cents
Earnings per share for profi t attributable to ordinary equity holders of AMP Limited Basic 26 26.3 37.9 Diluted 26 26.2 37.7
For
per
sona
l use
onl
y

for the year ended 31 December 201139Statement of comprehensive income
Consolidated Parent
2011$m
2010$m
2011$m
2010$m
Profi t for the year 676 755 352 392
Other comprehensive income for the year recognised in retained earnings Defi ned benefi t plans1 – actuarial gains and (losses) (177) (15) – – – income tax (expense) credit 53 4 – –
(124) (11) – –
Other comprehensive income for the year recognised in reserves Cash fl ow hedges2 – gains and (losses) in fair value of cash fl ow hedges (34) (12) – – – income tax (expense) credit 11 4 – – – transferred to profi t for the year 16 32 – – – transferred to profi t for the year – income tax (expense) credit (5) (10) – –
(12) 14 – –
Owner-occupied property revaluation – gains (losses) in valuation of owner-occupied property 9 (1) – – – income tax (expense) credit (1) – – –
8 (1) – –
Exchange difference on translation of foreign operations – exchange gains (losses) 3 (21) – – – transferred to profi t for the year 2 – – – – transferred to profi t for the year – income tax (expense) credit – – – –
5 (21) – –
Revaluation of hedge of net investments – gains and (losses) in fair value of hedge of net investments 3 3 – – – income tax (expense) credit – (1) – (1) – – – – transferred to profi t for the year – gross – (4) – – – transferred to profi t for the year – income tax (expense) credit – 1 – –
3 (1) – –
Total comprehensive income for the year 556 735 352 392
Total comprehensive income for the year attributable to shareholders of AMP Limited 568 755 352 392 Total comprehensive income (loss) for the year attributable to non-controlling interests (12) (20) – –
Total comprehensive income for the year 556 735 352 392
Footnote: 1 Actuarial gains and (losses) are determined in accordance with AASB 119 Employee Benefi ts. This is not the same as the calculation methods
used to determine the funding requirements for the plans. Refer to Note 1(dd) and Note 27.2 Cash fl ow hedge movements are predominantly in respect of interest rate swaps used to manage AMP Bank’s interest rate risk on its fi xed rate
mortgage portfolio which is effectively hedged.
For
per
sona
l use
onl
y

AMP Financial Report 2011
40as at 31 December 2011Statement of fi nancial position
Consolidated Parent
Note2011
$m2010
$m2011
$m2010
$m
Assets Cash and cash equivalents 25 4,652 3,325 1 2 Receivables 9 2,221 887 3 99 Current tax assets 248 8 – – Inventories and other assets 10 276 312 – – Investments in fi nancial assets measured at fair value through profi t or loss 11 76,528 66,974 – – Investments in fi nancial assets measured at amortised cost 11 12,905 10,935 767 836 Investment properties 12 7,424 7,122 – – Investments in associates accounted for using the equity method 30 115 89 – – Property, plant and equipment 13 479 452 – – Deferred tax assets 8 1,095 582 333 66 Intangibles 14 4,347 919 – – Investments in controlled entities 11 – – 10,807 7,072
Total assets of shareholders of AMP Limited, policyholders, external unitholders and non-controlling interests 110,290 91,605 11,911 8,075
Liabilities Payables 15 1,932 1,033 98 1 Current tax liabilities 86 203 180 148 Provisions 16 556 253 3 4 Other fi nancial liabilities 11 2,604 3,062 – – Borrowings 17 11,410 10,791 – – Subordinated debt 18 949 345 – – Deferred tax liabilities 8 923 620 – – External unitholder liabilities 7,224 5,892 – – Life insurance contract liabilities 21 24,399 17,762 – – Investment contract liabilities 22 52,940 48,579 – – Defi ned benefi t plan liabilities 27 370 67 – –
Total liabilities of shareholders of AMP Limited, policyholders, external unitholders and non-controlling interests 103,393 88,607 281 153
Net assets of shareholders of AMP Limited and non-controlling interests 6,897 2,998 11,630 7,922
Equity1 Contributed equity 20 9,080 5,051 9,297 5,209 Reserves (2,534) (2,565) 10 6 Retained earnings 283 452 2,323 2,707
Total equity of shareholders of AMP Limited 6,829 2,938 11,630 7,922 Non-controlling interests 68 60 – –
Total equity of shareholders of AMP Limited and non-controlling interests 6,897 2,998 11,630 7,922
Footnote: 1 Further information on Equity is provided in the Statement of changes in equity on page 41.
For
per
sona
l use
onl
y

for the year ended 31 December 201141Statement of changes in equity
Equity attributable to shareholders of AMP Limited
Consolidated
Contributed equity
$m
Equity contribution
reserve1
$m
Share-based
payment reserve2
$m
Cash fl ow hedge
reserve3
$m
Owner occupied property
revaluation reserve4
$m
Foreigncurrency
translation reserve5
$m
Hedge of net
investment reserve6
$m
Demerger loss
reserve7
$m
Retained earnings
$m
Total shareholder
equity $m
Non-controlling
interest $m
Total equity
$m
2011
Balance at the beginning of the year 5,051 1,019 8 (5) 66 (69) 1 (3,585) 452 2,938 60 2,998
Profi t (Loss) for the year – – – – – – – – 688 688 (12) 676
Other comprehensive income – – – (12) 8 5 3 – (124) (120) – (120)
Total comprehensive income – – – (12) 8 5 3 – 564 568 (12) 556
Share-based payment expense – – 28 – – – – – – 28 – 28
Share purchases – – (1) – – – – – – (1) – (1)
Net sale/(purchase) of ‘treasury shares’ (59) – – – – – – – (8) (67) – (67)
Dividends paid8 – – – – – – – – (736) (736) – (736)
Dividends paid on ‘treasury shares’8 – – – – – – – – 11 11 – 11
New capital from shares issued9 4,088 – – – – – – – – 4,088 – 4,088
Non-controlling interest recognised on acquisition of controlled entities – – – – – – – – – – 20 20
Balance at the end of the year 9,080 1,019 35 (17) 74 (64) 4 (3,585) 283 6,829 68 6,897
2010
Balance at the beginning of the year 4,814 1,019 1 (19) 67 (48) 2 (3,585) 320 2,571 63 2,634
Profi t (Loss) for the year – – – – – – – – 775 775 (20) 755
Other comprehensive income – – – 14 (1) (21) (1) – (11) (20) – (20)
Total comprehensive income – – – 14 (1) (21) (1) – 764 755 (20) 735
Share-based payment expense – – 23 – – – – – – 23 – 23
Share purchases – – (16) – – – – – – (16) – (16)
Net sale/(purchase) of ‘treasury shares’ (15) – – – – – – – – (15) – (15)
Dividends paid8 – – – – – – – – (639) (639) – (639)
Dividends paid on ‘treasury shares’8 – – – – – – – – 7 7 – 7
New capital from shares issued9 252 – – – – – – – – 252 – 252
Non-controlling interest on sales and acquisitions – – – – – – – – – – 17 17
Balance at the end of the year 5,051 1,019 8 (5) 66 (69) 1 (3,585) 452 2,938 60 2,998
For
per
sona
l use
onl
y

for the year ended 31 December 2011 continued
AMP Financial Report 2011
42 Statement of changes in equity
AMP Limited parent
Contributed equity
$m
Share-based payment reserve2
$m
Retained earnings
$m
Total shareholder
equity$m
2011 Balance at the beginning of the year 5,209 6 2,707 7,922Profi t – – 352 352 Other comprehensive income – – – –
Total comprehensive income – – 352 352Share-based payment expense – 4 – 4 Dividends paid8 – – (736) (736)New capital from shares issued9 4,088 – – 4,088
Balance at the end of the year 9,297 10 2,323 11,630
2010 Balance at the beginning of the year 4,957 2 2,954 7,913 Profi t – – 392 392 Other comprehensive income – – – –
Total comprehensive income – – 392 392 Share-based payment expense – 4 – 4 Dividends paid8 – – (639) (639)New capital from shares issued9 252 – – 252
Balance at the end of the year 5,209 6 2,707 7,922
Footnote: 1 There has been no movement in the Equity contribution reserve established in 2003 to recognise the additional loss on the demerger of AMP’s
UK operations in December 2003. This loss was the difference between the pro-forma loss on demerger based upon directors’ valuation of the UK operations and the estimated net assets to be demerged, and the market-based fair value of the UK operations based upon the share price of the restructured UK operations on listing and the actual net assets of the UK operations on demerger.
2 The Share-based payment reserve represents the cumulative expense recognised in relation to equity-settled share-based payments less the cost of shares purchased and transferred to share-based payments recipients upon vesting.
3 The Cash fl ow hedge reserve represents the cumulative impact of changes in the fair value of derivatives designated as cash fl ow hedges which are effective for hedge accounting. Hedge gains and losses are transferred to the Income statement when they are deemed ineffective or upon realisation of the cash fl ow.
4 The Owner-occupied property revaluation reserve represents cumulative valuation gains and losses on owner-occupied property required to be recognised in equity.
5 Exchange differences arising on translation of foreign controlled entities within the AMP group are recognised in Foreign currency translation reserve. Exchange gains and losses are transferred to the Income statement upon realisation of the investment in the foreign controlled entity.
6 The Hedge of net investment reserve refl ects gains and losses on effective hedges of net investments in foreign operations. Hedge gains and losses are transferred to the Income statement when they are deemed ineffective or upon realisation of the investment in the foreign controlled entity.
7 There has been no movement in the Demerger loss reserve established in 2003 to recognise the transfer from shareholders’ retained earnings of the total loss on the demerger of AMP’s UK operations in December 2003.
8 Dividends paid includes the dividends paid on ‘treasury shares’. Dividends paid on ‘treasury shares’ are required to be excluded from the consolidated fi nancial statements by adjusting retained earnings.
9 Shares issued under dividend reinvestment plan $286m (2010: $252m). Shares issued to minority shareholders of AXA Asia Pacifi c Holdings Limited on the acquisition of the company $3,802m.
For
per
sona
l use
onl
y

for the year ended 31 December 201143Statement of cash fl ows
Consolidated Parent
Note2011
$m2010
$m2011
$m2010
$m
Cash fl ows from operating activities 25 Cash receipts in the course of operations 16,295 12,491 17 16 Interest and other items of a similar nature received 2,595 2,041 3 2 Dividends and distributions received 3,072 2,193 280 374 Cash payments in the course of operations (17,225) (13,640) – (8)Finance costs (850) (756) – –Income tax refunded/(paid) (333) 135 13 4
Cash fl ows from operating activities 3,554 2,464 313 388
Cash fl ows from investing activities Net proceeds from sale of/(payments to acquire): – investment property (64) 74 – –– investments in fi nancial assets2 (5,290) (141) – –Loan to controlled entities – – 205 –Acquisition of AXA Asia Pacifi c Holdings Limited3 1,673 – – –Payments to acquire other subsidiaries and other businesses net of cash acquired4 – (19) – –Proceeds from disposal of subsidiaries and other businesses1 – 297 – –Payments to option holders in AXA APH Limited – – (69) –
Cash fl ows from (used in) investing activities (3,681) 211 136 –
Cash fl ows from fi nancing activities Proceeds from borrowings – non-Banking operations 931 1,264 – –Net movement in deposits from customers 1,189 514 – –Repayment of borrowings – non-Banking operations (1,221) (1,944) – –Net movement in borrowings – Banking operations (370) (578) – –Proceeds from issue of subordinated debt 600 – – –Dividends paid5 (440) (380) (450) (387)
Cash fl ows from (used in) fi nancing activities 689 (1,124) (450) (387)
Net increase (decrease) in cash and cash equivalents 562 1,551 (1) 1 Cash and cash equivalents at the beginning of the year 8,168 6,631 2 1 Effect of exchange rate changes on cash and cash equivalents 6 (14) – –
Cash and cash equivalents at the end of the year 8,736 8,168 1 2
Footnote: 1 Proceeds of $297m in 2010 is in respect of the disposal of trusts and operating businesses controlled by the life entities’ statutory funds
which carry out business operations unrelated to the core wealth management operations of the AMP group, net of cash disposed of (refer to Note 25(d)).
2 Net proceeds from the sale of/(payments to acquire) investments in fi nancial assets comprise: (i) purchases and sales of fi nancial assets measured at fair value through profi t or loss held by the AMP life insurance entities’ statutory funds and controlled entities of the AMP life insurance entities’ statutory funds largely refl ecting policyholder investment decisions during the period; (ii) loans and advances made (net of repayments) and purchases of fi nancial assets (net of maturities) during the period by AMP Bank.
3 The net cash fl ows from the acquisition of AXA Asia Pacifi c Holdings Limited comprise $2,164m cash and cash equivalents held by AXA Asia Pacifi c Holdings Limited group at acquisition date less cash consideration paid of $491m. The cash consideration paid consists of $455m for AMP’s share of the cash paid to minority shareholders, $69m paid to rights holders less $33m adjustment payments received from AXA SA prior to reporting date. A further $1,970m of cash consideration paid to minority shareholders was funded by AXA SA. See Note 3 for further details.
4 Payments to acquire other subsidiaries and other businesses did not have a material impact on the composition of the AMP group.5 The dividends paid amount is presented net of dividend reinvestment plan and dividends on ‘treasury shares’. See Statement of changes in
equity for further information.
For
per
sona
l use
onl
y

for the year ended 31 December 2011
AMP Financial Report 2011
44 Notes to the fi nancial statements
The consolidated economic entity (the AMP group) comprises AMP Limited (the parent entity), a company limited by shares, and incorporated and domiciled in Australia, and all entities that it controlled during the period and at the reporting date.
(a) Basis of preparation This general purpose Financial Report has been prepared in accordance with Australian Accounting Standards, other authoritative pronouncements of the Australian Accounting Standards Board (AASB), and the Corporations Act 2001. The Financial Report also complies with International Financial Reporting Standards as issued by the International Accounting Standards Board.
The signifi cant accounting policies adopted in the preparation of the Financial Report are set out below. These policies have been consistently applied to the current year and comparative period, unless otherwise stated.
The AMP group is predominantly a wealth management business conducting operations through registered life insurance companies (AMP life insurance entities) and other entities. Where permitted under accounting standards, the assets and liabilities associated with life insurance contracts and investment contracts are generally measured on a fair value basis and other assets and liabilities are generally measured on a historical cost basis.
Assets and liabilities have been presented on the face of the Statement of fi nancial position in decreasing order of liquidity and do not distinguish between current and non-current items. The majority of the assets of the AMP group are investment assets held to back investment contract and life insurance contract liabilities. Although the amount of those assets which may be realised and those liabilities which may be settled within 12 months of the reporting date are not always known, estimates of amounts expected to be recovered or settled (a) no more than 12 months after the reporting date, and (b) more than 12 months after the reporting date, have been provided in footnotes to the relevant notes.
Changes in accounting policySince 1 January 2011, the AMP group has adopted a number of Australian Accounting Standards and Interpretations which are mandatory for annual periods beginning on or after 1 January 2011. Adoption of these Standards and Interpretations has not had any material effect on the fi nancial position or performance of the AMP group.
The main standards adopted since 1 January 2011 were:
– AASB 2010-3 Amendments to Australian Accounting Standards arising from the Annual Improvements Projectand AASB 2010-4 Further amendments to Australian Accounting Standards arising from the Annual Improvements Project. These standards make a series of minor amendments to various accounting standards. Some changes to the disclosures relating to the credit risk of fi nancial instruments have been made as a result of these amended standards.
– Revised AASB 124 Related Party Disclosures. This revised standard includes some minor modifi cations to the defi nition of a related party which has resulted in no change to the transactions and balances which are required to be disclosed in the Notes to the fi nancial statements.
Australian Accounting Standards issued but not yet effectiveA number of new accounting standards and amendments have been issued but are not yet effective. The AMP group has not elected to early adopt any of these new standards or amendments in this Financial Report. These new standards and amendments, when applied in future periods, are not expected to have a material impact on the fi nancial position or performance of the AMP group other than the following:
– AASB 9 Financial Instruments. This standard makes signifi cant changes to the way fi nancial assets are classifi ed for the purpose of determining their measurement basis and also to the amounts relating to fair value changes which are to be taken directly to equity. AASB 9 is mandatory for adoption by the AMP group in the year ending 31 December 2013. The fi nancial impact to the AMP group of adopting AASB 9 has not yet been quantifi ed.
– AASB 10 Consolidated Financial Statements, AASB 11 Joint Arrangements, AASB 12 Disclosure of Interests in Other Entities, revised AASB 127 Separate Financial Statements, revised AASB 128 Investments in Associates and Joint Ventures and AASB 2011-7 Amendments to Australian Accounting Standards arising from the Consolidation and Joint Arrangements Standards. These standards change the criteria for determining which entities are to be consolidated and which entities are to be accounted for using the equity method in preparing consolidated accounts and the required disclosures in relation to such entities. Each of these standards is mandatory for adoption by the AMP group in the year ending 31 December 2013. The fi nancial impact on the AMP group of adopting these standards has not yet been quantifi ed.
– AASB 13 Fair Value Measurement. This standard centralises the defi nition and guidance for calculating fair values where required to be applied by various other accounting standards and removes some minor inconsistencies that previously existed between the guidance for determining fair value in these standards. The new standard requires quantitative and qualitative disclosures of all fair value measurements. AASB 13 is mandatory for adoption by the AMP group in the year ending 31 December 2013. The fi nancial impact on the AMP group of adopting AASB 13 has not yet been quantifi ed.
– Revised AASB 119 Employee Benefi ts. Under the current AASB 119, an amount is recognised in profi t or loss for the expected earnings on the assets of AMP group’s defi ned benefi t funds, with any difference between the expected return and the actual return taken directly to equity. Under the revised AASB 119, the amount recognised in profi t or loss will be determined using a risk free rate rather than expected earnings. The revised AASB 119 is mandatory for adoption by the AMP group in the year ending 31 December 2013. The fi nancial impact on the AMP group of adopting the revised AASB 119 has not yet been quantifi ed.
– Revised AASB 101 Presentation of Financial Statements. The revised AASB 101 requires items in the Statement of comprehensive income to be segregated between those that will be eventually realised in the Income statement in future periods and those that will not. The revised AASB 101 is mandatory for adoption by the AMP group in the year ending 31 December 2013. The changes to AASB 101 relate to presentation only and are not expected to have a fi nancial impact on the AMP group.
Change in presentation of the Income statementIn prior periods, the Income statement included disclosure of the impact of accounting mismatches on Profi t for the year attributable to the shareholders of AMP Limited. In accordance with ASIC regulatory guide RG 230 Disclosing non-IFRS fi nancial information, this information is no longer presented in the Income statement.
Change in presentation of the Statement of fi nancial positionThe Statement of fi nancial position has been enhanced to show on a gross basis the collateral held by the life entities’ statutory funds and their controlled entities in relation to debt security repurchase agreements and the liability to return this collateral on settlement.
1. Basis of preparation and summary of signifi cant accounting policies
For
per
sona
l use
onl
y

45
1. Basis of preparation and summary of signifi cant accounting policies continued
As in prior periods, securities subject to repurchase agreements are not derecognised from the Statement of fi nancial position as the risk and rewards of ownership remain within the investment portfolio. However, collateral received from the counterparty and the liability to return this collateral is now presented on a gross basis in the Statement of fi nancial position.
This change has resulted in the following changes to the amounts presented in the fi nancial statements:
– an increase in Cash and cash equivalents in the Statement of fi nancial position of $174m (2010: $167m)
– an increase in Investments in fi nancial assets measured at fair value through profi t or loss in the Statement of fi nancial position of $1,275m (2010: $2,177m)
– an increase in Other fi nancial liabilities in the Statement of fi nancial position of $1,449m (2010: $2,344m)
– an increase in the net payments to acquire investments in fi nancial assets in the Statement of cash fl ows of $895m (2010: $825m decrease in net payments to acquire investments in fi nancial assets)
– an increase in Cash and cash equivalents at the beginning of the period in the Statement of cash fl ows of $2,344m (2010: $1,519m)
– an increase in Cash and cash equivalents at the end of the period in the Statement of cash fl ows of $1,449m (2010: $2,344m).
There is no change to reported net assets, profi t or earnings per share. Comparatives have been restated to be consistent with current year disclosures.
(b) Principles of consolidation The fi nancial statements consolidate the fi nancial information of controlled entities. Control is determined as the power to govern the fi nancial and operating policies of an entity so as to obtain benefi ts from its activities. The majority of the AMP life insurance entities’ investments are held through controlling interests in a number of unit trusts and companies.
The fi nancial information for controlled entities is prepared for the same reporting date as the parent entity, using consistent accounting policies. Where dissimilar accounting policies may exist, adjustments are made to bring these into line.
Consolidation principles require the total amounts of each underlying asset, liability, income and expense of the controlled entities to be recognised in the consolidated fi nancial statements. When a controlled unit trust is consolidated, the share of the unitholder liability attributable to the AMP group is eliminated but amounts due to external unitholders remain as liabilities in the consolidated Statement of fi nancial position. The share of the net assets of controlled companies attributable to non-controlling interests is disclosed as a separate line item in the Statement of fi nancial position. In the Income statement, the profi t or loss of the AMP group is allocated between profi t or loss attributable to non-controlling interests and profi t or loss attributable to the parent entity.
Controlled entities acquired are accounted for using the acquisition method of accounting. Information from the fi nancial statements of controlled entities is included from the date the parent entity obtains control until such time as control ceases. Where the AMP group ceases to control an entity, the consolidated fi nancial statements include the results for the part of the reporting period during which the parent entity had control.
During the year, AMP group acquired AXA Asia Pacifi c Holdings Limited. Information in relation to this transaction is set out in
Note 3. 2011 consolidated revenues and expenses include a nine-month contribution from the AXA Asia Pacifi c Holdings Limited group. 2010 comparatives do not include any revenues and expenses from AXA Asia Pacifi c Holdings Limited group.
Most other acquisitions and disposals of controlled entities are in relation to unit trusts with underlying net assets typically comprising investment assets and cash. The consideration for acquisitions or disposals refl ects the fair value of the investment assets at the date of the transactions after taking into account non-controlling interests.
All inter-company balances and transactions are eliminated in full, including unrealised profi ts arising from intra-group transactions.
Consolidation impact of investments of the AMP life insurance entitiesAMP life insurance entities conduct wealth management business through separate life statutory funds. Income, expenses, assets and liabilities attributable to policyholders within the life statutory funds are consolidated into the AMP group fi nancial statements, along with those attributable to the shareholders of the parent entity.
The majority of the AMP life entities’ statutory funds’ investments are held through controlling interests in a number of unit trusts and companies. These investment assets are held on behalf of policyholders and the AMP life entities’ statutory funds recognise a liability to the policyholders valued as described in Note 1(s) for Life insurance contract liabilities, and Note 1(t) for Investment contract liabilities. In certain cases, the amount of the net assets of the controlled entities recognised in the consolidated fi nancial statements may not match the valuation of the relevant liability to the policyholder which results in certain policyholder asset movements impacting the profi t attributable to shareholders of AMP Limited.
Certain controlled entities of the AMP life insurance entities’ statutory funds are operating companies which carry out business operations unrelated to the core wealth management operations of the AMP group.
Securitisation vehiclesThe banking operation of the AMP group sells mortgage loans to securitisation vehicles (also referred to as special purpose entities) through its loan securitisation program. These securitisation vehicles are controlled by the AMP group and are therefore consolidated.
(c) Accounting for wealth management and life insurance business
The accounting treatment of certain transactions in this Financial Report varies depending on the nature of the contract underlying the transactions. The two major contract classifi cations relevant to the wealth management and insurance business of the AMP group are investment contracts and life insurance contracts.
For the purposes of this Financial Report, holders of investment contracts or life insurance contracts are collectively and individually referred to as policyholders.
Investment contractsThe majority of the business of the AMP life insurance entities relates to wealth management products such as savings, investment-linked and retirement income policies. The nature of this business is that the AMP life insurance entities receive deposits from policyholders and those funds are invested on behalf of the policyholders. With the exception of fi xed retirement income policies, the resulting liability to policyholders is linked to the performance and value of the assets that back those liabilities.
For
per
sona
l use
onl
y

Notes to the fi nancial statements
AMP Financial Report 2011
for the year ended 31 December 2011 continued46
1. Basis of preparation and summary of signifi cant accounting policies continued
For fi xed retirement income policies, the resulting liability is linked to the fair value of the fi xed retirement income payments and associated management services.
Under Australian Accounting Standards such contracts are defi ned as life investment contracts and described as investment contracts throughout this Financial Report.
Life insurance contractsAMP life insurance entities also issue contracts that transfer signifi cant insurance risk from the policyholder, covering death, disability or longevity of the insured. In addition, there are some policies that are similar to investment contracts, but the timing of the vesting of the profi t attributable to the policyholders is at the discretion of the AMP life insurance entities. These policies are referred to as discretionary participating contracts.
Under Australian Accounting Standards, such contracts are defi ned as life insurance contracts.
Assets measurement basisAssets backing investment contract and life insurance contract liabilities are measured on a basis that is consistent with the measurement of the liabilities, to the extent permitted under Australian Accounting Standards.
Investment contract liabilities are measured at fair value as described in Note 1(t) and life insurance contract liabilities are measured as described in Note 1(s). Assets backing such liabilities are measured at fair value, to the extent permitted under Australian Accounting Standards. Realised and unrealised gains and losses arising from changes in the fair value are recognised in the Income statement, to the extent permitted under Australian Accounting Standards. The accounting policies for individual asset classes, and any restrictions on application of fair value, are described later in Note 1.
All assets that back investment contract liabilities and life insurance contract liabilities are included within the AMP life entities’ statutory funds and, as such, are separately identifi able.
(d) Cash and cash equivalentsCash and cash equivalents comprise cash on hand that is available on demand and deposits that are held at call with fi nancial institutions. Cash and cash equivalents are measured at fair value, being the principal amount. For the purpose of the Statement of cash fl ows, cash also includes other highly liquid investments not subject to signifi cant risk of change in value, with short periods to maturity, net of outstanding bank overdrafts. Bank overdrafts are shown within Borrowings in the Statement of fi nancial position.
(e) ReceivablesReceivables that back investment contract liabilities and life insurance contract liabilities are fi nancial assets and are measured at fair value. Reinsurance and other recoveries are discounted to present value. Receivables that do not back investment contract and life insurance contract liabilities are measured at nominal amounts due, less any allowance for doubtful debts. An allowance for doubtful debts is recognised when collection of the full amount is no longer probable. Bad debts are written off as incurred. Given the short-term nature of most receivables, the recoverable amount approximates fair value.
(f) InventoriesAssets held for sale in the ordinary course of business, in the process of production for such sale or in the form of materials or supplies to be consumed in the production process or in the rendering of services are classifi ed as inventories.
Inventories are measured at the lower of cost and net realisable value. Net realisable value is the estimated selling price in the ordinary course of business, less estimated costs necessary to make the sale.
(g) Investments in fi nancial assetsInvestments in fi nancial assets measured at fair value through profi t or lossInvestments in fi nancial assets designated on initial recognition as fi nancial assets measured at fair value through profi t or loss are initially recognised at fair value determined as the purchase cost of the asset, exclusive of any transaction costs. Any realised and unrealised gains or losses arising from subsequent measurement at fair value are recognised in the Income statement in the period in which they arise.
Subsequent to initial recognition, fair value of investments measured at fair value through profi t or loss is determined as follows:
– The fair value of equity securities in an active market and listed managed investment schemes refl ects the quoted bid price at the reporting date. In the case of equity securities and listed managed investment schemes where there is no active market, a fair value is established using valuation techniques including the use of recent arm’s length transactions, references to other instruments that are substantially the same, discounted cash fl ow analysis and option pricing models.
– The fair value of listed debt securities refl ects the bid price at the reporting date. Listed debt securities that are not frequently traded are valued by discounting estimated recoverable amounts. The fair value of unlisted debt securities is estimated using interest rate yields obtainable on comparable listed investments. The fair value of loans is determined by discounting the estimated recoverable amount using prevailing interest rates.
– The fair value of investments in unlisted managed investment schemes is determined on the basis of published redemption prices of those managed investment schemes at the reporting date.
– The fair value of derivative fi nancial assets is determined in accordance with the policy set out in Note 1(q).
There is no reduction for realisation costs in determining the fair value of fi nancial assets measured at fair value through profi t or loss.
Investments in fi nancial assets measured at amortised costInvestments in fi nancial assets measured at amortised cost are mainly assets of AMP Bank. Loans, advances and other receivables which arise when AMP Bank provides money directly to a customer with no intention of trading the fi nancial assets and loans and advances to advisers are measured at amortised cost. All other debt securities held by AMP Bank are classifi ed as held to maturity investments. Held to maturity investments are non-derivative assets with fi xed or determinable payments and fi xed maturities that management has the positive intention and ability to hold to maturity.
Investments in fi nancial assets measured at amortised cost are initially recognised at fair value plus transaction costs that are directly attributable to the acquisition or issue of the fi nancial asset. These assets are subsequently recognised at amortised cost using the effective interest rate method.
Investments in controlled entitiesInvestments by the parent entity in controlled entities are measured at cost (which, in the case of the investment in AMP Group Holdings Limited, was determined as net asset value on demutualisation) less any accumulated impairment losses.
(h) Investments in associates accounted for using the equity method
Associated entities are defi ned as those entities over which the AMP group has signifi cant infl uence but there is no capacity
For
per
sona
l use
onl
y

47
1. Basis of preparation and summary of signifi cant accounting policies continued
to control. Investments in associates, other than those backing investment contract and life insurance contract liabilities, are initially measured at cost plus any excess of the fair value of AMP’s share of identifi able assets and liabilities above cost at acquisition date subsequently adjusted for AMP group’s share of post-acquisition profi t or loss and movements in reserves net of any impairment. AMP group’s share of profi t or loss of associates is included in the consolidated Income statement. Any dividend or distribution received from associates is accounted for as a reduction in carrying value of the associate.
Investments in associates held to back life insurance or life investment contracts are exempt from the requirement to apply equity accounting and have been designated on initial recognition as fi nancial assets measured at fair value through profi t or loss.
(i) Investment propertyInvestment property is held to earn revenue from rentals and/or for the purposes of capital appreciation. Investment property includes all directly held freehold and leasehold properties but excludes owner-occupied properties. See Note 1( j). There are no property interests held under operating leases accounted for as investment property.
Investment property is initially recognised at cost, including transaction costs. Subsequent to initial recognition, investment property is measured at fair value.
Changes in value of investment property are taken directly to the Income statement and may comprise changes in the fair value from revaluation of investment property, and fair value adjustments in relation to:
– the straight-lining of fi xed rental income
– tenant incentives including rent free periods, landlord and tenant owned fi t-out contributions, and
– capitalised leasing fees.
The process adopted to determine fair values for investment properties is set out in Note 12.
( j) Property, plant and equipmentOwner-occupied propertyUnder Australian Accounting Standards, where the whole or a signifi cant portion of a property owned by the AMP group is held for use by the AMP group in the production or supply of goods or services, or for administrative purposes, that property is classifi ed for accounting purposes as owner-occupied property within Property, plant and equipment in the Statement of fi nancial position.
Owner-occupied property is initially recognised at cost, including transaction costs. It is subsequently measured at the revalued amount, being its fair value at the date of the revaluation, less any subsequent accumulated depreciation and accumulated impairment losses. Fair value is determined on the same basis as investment property in Note 12.
When a revaluation increases the carrying value of a property, the increase is recognised directly in Other comprehensive income through the owner-occupied property revaluation reserve. However, an increase is recognised in the Income statement to the extent that the amount reverses a revaluation decrease of the same asset previously recognised in the Income statement. When the carrying value of an asset is decreased as a result of a revaluation, the decrease is recognised in the Income statement. However, any decrease is recognised in the owner-occupied property revaluation reserve to the extent that it reverses a balance existing in the reserve in respect of that asset.
Gains or losses on disposals are measured as the difference between proceeds and the carrying amount and are recognised
in the Income statement. The balance of the owner-occupied property revaluation reserve, in respect of a property disposed of, is transferred to retained earnings.
Each part of an owner-occupied property, except land, that is signifi cant in relation to the total property is depreciated on a systematic basis over the useful life of the asset, being a period not exceeding 40 years.
To the extent any owner-occupied property is held by the life entities’ statutory funds, the amounts recognised for the asset in the consolidated fi nancial statements may not match the valuation of the relevant liability to the policyholder which results in certain policyholder asset movements impacting the profi t attributable to shareholders of AMP Limited.
Plant and equipmentPlant and equipment is initially measured at cost, including transaction costs. It is subsequently measured at cost less any subsequent accumulated depreciation and accumulated impairment losses. The written down amount approximates fair value.
Each item of plant and equipment is depreciated on a systematic basis over the useful life of the asset of 3–10 years.
Leasehold improvementsLeasehold improvements are recognised as an asset only when it is probable that future economic benefi ts associated with the asset will fl ow to AMP group and the cost of the item can be reliably measured.
(k) Intangible assetsGoodwillWhen the aggregate of the fair value of the consideration transferred in a business combination, the recognised amount of any non-controlling interest and the fair value of any previously held equity interest in the acquiree exceeds the fair value of the identifi able assets acquired and liabilities assumed, the excess is recognised as goodwill. Subsequently, goodwill is measured at cost less any accumulated impairment losses.
Goodwill is not subject to amortisation but is tested for impairment annually or more frequently if events or changes in circumstances indicate that the carrying value may be impaired. For the purposes of assessing impairment of goodwill, assets are grouped at the lowest levels for which there are separately identifi able cash fl ows (cash-generating units). Impairment is determined by assessing the recoverable amount of the cash-generating unit to which the goodwill relates. Where the recoverable amount of the cash-generating unit is less than the carrying amount of the assets, including goodwill, an impairment loss is recognised in the Income statement.
Capitalised costsCosts are capitalised and carried forward only where the costs relate to the creation of an asset with expected future economic benefi ts which are capable of reliable measurement. Otherwise, all costs are recognised as expenses in the period in which they are incurred. Capitalised costs are amortised over the estimated useful life of the asset, commencing at the time the asset is fi rst put into use or held ready for use (whichever is the earlier). The useful lives of such assets generally do not exceed fi ve years, however a useful life of up to seven years has been applied to some capitalised costs relating to IT systems development projects where AMP group expects benefi ts to fl ow over a longer period.
Management rights Rights to receive fees for asset management services acquired either directly or as part of a business combination are recognised as an intangible asset when they can be separately identifi ed and reliably measured and it is probable that the expected benefi ts will fl ow to the AMP group.
For
per
sona
l use
onl
y

Notes to the fi nancial statements
AMP Financial Report 2011
for the year ended 31 December 2011 continued48
1. Basis of preparation and summary of signifi cant accounting policies continued
Management rights are initially measured at cost. Management rights have been assessed to have an indefi nite useful life where the contractual rights to manage the assets have no fi xed term. These management rights are not amortised but are tested for impairment annually or more frequently if events or changes in circumstances indicate that the carrying value may be impaired. Where management rights are subject to contractual terms, the useful life is determined to be the contractual term and the asset is amortised over that period. These assets are also reviewed at each reporting period for indicators of impairment.
Value of in-force businessAn intangible asset is recognised in a business combination for the fair value of future business arising from the existing contractual arrangements of the acquired businesses with its customers. The value of in-force business is measured initially at fair value and is subsequently amortised over its useful life. Value of in-force business has a useful life of 10 years for wealth management and distribution business and 20 years for wealth protection and mature business.
Distribution networksAn intangible asset is also recognised in a business combination for the fair value of the existing contractual distribution arrangements of the acquired entity. Distribution networks intangibles are also recognised where AMP group acquires customer lists or other distribution related rights other than through a business combination. Distribution networks are measured initially at fair value and subsequently amortised over their useful lives of 3 to 15 years.
Other intangible assetsOther intangible assets comprise:
– amounts recognised in a business combination for the value of the software assets of the acquired entity where it is expected that future economic benefi ts will be derived. Software is recognised initially at fair value and is subsequently amortised over its useful life. Software has a useful life of 2 to 4 years. Software maintenance costs are expensed as incurred, and
– acquired customer relationships recognised as a result of business combinations and when they can be separately identifi ed, reliably measured and it is probable that expected benefi ts will fl ow to the AMP group. These intangible assets are initially measured at cost and are subsequently amortised over the estimated useful life of each asset.
(l) Impairment of assetsAssets measured at fair value, where changes in value are refl ected in the Income statement, are not subject to impairment testing. As a result, fi nancial assets, other than investments in fi nancial assets measured at amortised cost, and investment properties, are not subject to impairment testing. Other assets such as property, plant and equipment, goodwill and other intangibles, investments in associates accounted for using the equity method and investments in fi nancial assets measured at amortised cost are subject to impairment testing.
Assets that have indefi nite useful lives, such as goodwill, are not subject to amortisation but are tested at least annually for impairment. Assets that are subject to amortisation are reviewed for impairment whenever events or changes in circumstances indicate that the carrying amount may not be recoverable.
Any impairment loss, being the amount by which the carrying amount of an asset exceeds its recoverable amount, is recognised in the Income statement. The recoverable amount is the higher of an asset’s fair value less costs to sell and its value in use.
(m) TaxesTax consolidationAMP Limited and its wholly-owned controlled entities which are Australian domiciled companies comprise a tax-consolidated group of which AMP Limited is the head entity. The implementation date for the tax-consolidated group was 30 June 2003.
AXA Asia Pacifi c Holdings Limited and each of its wholly owned Australian domiciled corporate entities joined the AMP Limited tax consolidated group on 30 March 2011.
Under tax consolidation, AMP Limited, as head entity, assumes the following balances from entities within the tax-consolidated group:
– current tax balances arising from external transactions recognised by entities in the tax-consolidated group, occurring after the implementation date, and
– deferred tax assets arising from unused tax losses and unused tax credits recognised by entities in the tax-consolidated group.
A tax funding agreement has been entered into by the head entity and the controlled entities in the tax-consolidated group. Entities in the tax-consolidated group continue to be responsible, by the operation of the tax funding agreement, for funding tax payments required to be made by the head entity arising from underlying transactions of the controlled entities. Controlled entities make (receive) contributions to (from) the head entity for the balances assumed by the head entity, as described above. The contributions are calculated in accordance with the tax funding agreement. The contributions are payable as set out in the agreement and refl ect the timing of AMP Limited’s obligations to make payments to the Australian Taxation Offi ce.
Assets and liabilities which arise as a result of balances transferred from entities within the tax-consolidated group to the head entity are recognised as related-party balances receivable and payable in the Statement of fi nancial position of AMP Limited. The recoverability of balances arising from the tax funding arrangements is based on the ability of the tax-consolidated group to utilise the amounts recognised by the head entity.
Income tax expenseIncome tax expense/credit is the tax payable on taxable income for the current period based on the income tax rate for each jurisdiction and adjusted for changes in deferred tax assets and liabilities attributable to:
– temporary differences between the tax bases of assets and liabilities and their Statement of fi nancial position carrying amounts
– unused tax losses, and
– the impact of changes in the amounts of deferred tax assets and liabilities arising from changes in tax rates or in the manner in which these balances are expected to be realised.
Adjustments to income tax expense/credit are also made for any differences between the amounts paid or expected to be paid in relation to prior periods and the amounts provided for these periods at the start of the current period.
Any tax impact on income and expense items that are recognised directly in equity is also recognised directly in equity.
Income tax for investment contracts and life insurance contracts businessThe income tax expense recognised in the Income statement of AMP group which arises in respect of AMP life insurance entities refl ects tax imposed on shareholders as well as policyholders.
For
per
sona
l use
onl
y

49
1. Basis of preparation and summary of signifi cant accounting policies continued
Investment contracts and life insurance contracts liabilities are established in Australia net, and in New Zealand gross, of the policyholders’ share of any current tax payable and deferred tax balances of the AMP group.
Arrangements made with some superannuation funds result in the AMP life insurance entities making payments to the Australian Taxation Offi ce in relation to contributions tax arising in those funds. The amounts paid are recognised as a decrease in investment contract liabilities and not included in income tax expense.
Deferred taxDeferred tax assets and liabilities are recognised for temporary differences at the tax rates which are expected to apply when the assets are recovered or liabilities are settled, based on those tax rates which are enacted or substantively enacted for each jurisdiction.
The relevant tax rates are applied to the cumulative amounts of deductible and taxable temporary differences to measure the deferred tax asset or liability. An exception is made for certain temporary differences arising from the initial recognition of an asset or a liability. No deferred tax asset or liability is recognised in relation to these temporary differences if they arose in a transaction, other than a business combination, that at the time of the transaction did not affect either accounting profi t or taxable profi t or loss.
Deferred tax assets are recognised for deductible temporary differences and unused tax losses only if it is probable that future taxable amounts will be available to utilise those temporary differences and losses.
Deferred tax assets and liabilities are not recognised for temporary differences between the carrying amount and tax bases of investments in controlled entities where the parent entity is able to control the timing of the reversal of the temporary differences and it is probable that the differences will not reverse in the foreseeable future.
Deferred tax, including amounts in respect of investment contracts and life insurance contracts, is not discounted to present value.
Goods and services taxThe AMP group operates across a number of tax jurisdictions and offers products and services that may be subject to various forms of goods and services tax (GST) imposed by local tax authorities.
All income, expenses and assets are recognised net of any GST paid, except where they relate to products and services which are input taxed for GST purposes or where the GST incurred is not recoverable from the relevant tax authorities. In such circumstances, the GST paid is recognised as part of the cost of acquisition of the assets or as part of the relevant expense.
Receivables and payables are recorded with the amount of GST included. The net amount of GST recoverable from or payable to the tax authorities is included as either a receivable or payable in the Statement of fi nancial position.
Cash fl ows are reported on a gross basis refl ecting any GST paid or collected. The GST component of cash fl ows arising from investing or fi nancing activities which are recoverable from, or payable to, local tax authorities are classifi ed as Operating cash fl ows.
(n) PayablesPayables that back investment contract and life insurance contract liabilities are fi nancial liabilities and are measured at fair value. Other payables are measured at the nominal amount payable. Given the short-term nature of most payables, the nominal amount approximates fair value.
(o) ProvisionsProvisions are recognised when:
– the AMP group has a present obligation (legal or constructive) as a result of a past event
– it is probable that an outfl ow of resources embodying economic benefi ts will be required to settle the obligation, and
– a reliable estimate can be made of the amount of the obligation.
Where the AMP group expects some or all of a provision to be reimbursed, for example under an insurance contract, the reimbursement is recognised as a separate asset but only when the reimbursement is virtually certain. The expense relating to any provision is presented in the Income statement net of any reimbursement.
Provisions are measured at the present value of management’s best estimate of the expenditure required to settle the present obligation at the reporting date. For provisions other than employee entitlements the discount rate used to determine the present value refl ects current market assessments of the time value of money and the risks specifi c to the liability.
Employee entitlementsLiabilities arising in respect of salaries and wages, annual leave and any other employee entitlements expected to be settled within 12 months of the reporting date are measured at their nominal amounts. All other employee entitlements are measured at the present value of the estimated future cash outfl ows to be made in respect of services provided by employees up to the reporting date. In determining the present value of future cash outfl ows, discount rates used are based on the interest rates attaching to government securities which have terms to maturity approximating the terms of the related liability.
RestructuringA restructuring provision is only recognised when it is probable that future costs will be incurred in respect of a fundamental reorganisation or change in focus of the business of the AMP group. A provision is recognised when the AMP group is demonstrably committed to the expenditure and a reliable estimate of the costs involved can be made. The provision is measured as the best estimate of the incremental, direct expenditures to be incurred as a result of the restructure and does not include costs associated with the ongoing activities of the AMP group.
(p) Borrowings and subordinated debt All borrowings and subordinated debt are fi nancial liabilities and are initially recognised at fair value. In the case of borrowings and subordinated debt which are subsequently measured at amortised cost, initial fair value is calculated net of directly attributable transaction costs. For borrowings and subordinated debt which are subsequently measured at fair value through profi t or loss, directly attributable transaction costs are expensed.
Borrowings and subordinated debt, other than those held by controlled entities of the AMP life insurance entities’ statutory funds, are subsequently measured at amortised cost. Any difference between the proceeds (net of transaction costs) and the redemption amount is recognised in the Income statement over the period of the contract using the effective interest rate method. It is AMP’s policy to hedge currency and interest rate risk arising on issued bonds and subordinated debt. When fair value hedge accounting is applied to borrowings and subordinated debt, the carrying values of borrowings and subordinated debt are adjusted for changes in fair value for the period that the fair value hedge relationship remains effective. See Note 1(q).
For
per
sona
l use
onl
y

Notes to the fi nancial statements
AMP Financial Report 2011
for the year ended 31 December 2011 continued50
1. Basis of preparation and summary of signifi cant accounting policies continued
Borrowings of controlled trusts of the AMP life insurance entities’ statutory funds are measured at amortised cost for the purpose of determining the unit price of that trust, these borrowings are also measured at amortised cost in this Financial Report with any difference between the proceeds (net of transaction costs) and the redemption amount recognised in the Income statement over the period of the contract using the effective interest rate method.
(q) Derivative fi nancial assets, derivative fi nancial liabilities and hedging
The AMP group is exposed to changes in interest rates and foreign exchange rates as well as movements in the fair value of investment guarantees for the North product. To mitigate the risks arising from these exposures, the AMP group uses derivative fi nancial instruments such as cross-currency and interest rate swaps, forward rate agreements, futures, options and foreign currency contracts. Derivative fi nancial instruments are also used to gain exposure to various markets for asset and liability management purposes.
Derivatives are initially recognised at fair value on the date on which a derivative contract is entered into and are subsequently remeasured to their fair value at the end of each reporting period. All derivatives are recognised as assets when their fair value is positive and as liabilities when their fair value is negative.
The method of recognising the movement in fair value depends on whether the derivative is designated as a hedging instrument and, if so, the nature of the item being hedged. The AMP group designates a hedge as either:
– a hedge of the fair value of recognised assets or liabilities or a fi rm commitment (fair value hedge)
– a hedge of highly probable forecast transactions (cash fl ow hedge), or
– a hedge of a net investment in a foreign operation (net investment hedge).
AMP group documents the relationship between hedging instruments and hedged items at inception of the transaction, as well as the AMP group’s risk management and strategy for undertaking various hedge transactions. The AMP group also documents its assessment of whether the derivatives used in hedging transactions have been, and will continue to be, highly effective in offsetting changes in fair values or cash fl ows of hedged items. This assessment is carried out both at hedge inception and on an ongoing basis.
Accounting for hedges(i) Fair value hedges: – changes in the fair value of derivatives that are
designated and qualify as fair value hedges are recorded in the Income statement together with any changes in the fair value of the hedged asset or liability that are attributable to the hedged risk
– if a hedge no longer meets the criteria for hedge accounting, the adjustment to the carrying amount of a hedged item, for which the effective interest method is used, is amortised to the Income statement over the period to maturity.
(ii) Cash fl ow hedges: – the effective portion of changes in the fair value of
derivatives that are designated and qualify as cash fl ow hedges is recognised in equity in the cash fl ow hedge reserve. The balance of the cash fl ow hedge reserve in relation to each particular hedge is transferred to the Income statement in the period when the hedged item affects profi t or loss
– the gain or loss relating to any ineffective portion of a hedge is recognised immediately in the Income statement
– hedge accounting is discontinued when a hedging instrument expires or is sold or terminated, or when a hedge no longer meets the criteria for hedge accounting. The cumulative gain or loss existing in equity at that time remains in equity and is recognised when the forecast transaction is ultimately recognised in the Income statement
– when a forecast transaction is no longer expected to occur, the cumulative gain or loss that was reported in equity is immediately transferred to the Income statement.
(iii) Net investment hedges: – Hedges of a net investment in a foreign operation,
including a hedge of a monetary item that is accounted for as part of the net investment, are accounted for in a similar way to cash fl ow hedges. Gains and losses on the hedging instrument relating to the effective portion of the hedge are recognised directly in equity (including related tax impacts) while any gains or losses relating to the ineffective portion of the hedge are recognised in profi t or loss. On disposal of the foreign operation, the cumulative value of any such gains or losses recognised directly in equity is transferred to the Income statement.
Derivatives that do not qualify for hedge accountingCertain derivative fi nancial instruments do not qualify for hedge accounting. Changes in the fair value of any derivative fi nancial instrument that does not qualify for hedge accounting are recognised in the Income statement in the period in which they arise.
Fair value estimation The fair value of fi nancial instruments traded in active markets (such as publicly traded derivatives) is based on quoted market prices at the reporting date. The quoted market price used is the current bid price; the quoted market price for fi nancial liabilities is the current offer price.
The fair value of fi nancial instruments not traded in an active market (for example, over-the-counter derivatives) is determined using valuation techniques. Valuation techniques include net present value techniques, option pricing models, discounted cash-fl ow methods and comparison to quoted market prices or dealer quotes for similar instruments.
(r) Recognition and derecognition of fi nancial assets and liabilities
Financial assets and fi nancial liabilities are recognised at the date the AMP group becomes a party to the contractual provisions of the instrument. Financial assets are derecognised when the contractual rights to the cash fl ows from the fi nancial assets expire, or are transferred. A transfer occurs when substantially all the risks and rewards of ownership of the fi nancial asset are passed to an unrelated third party. Financial liabilities are derecognised when the obligation specifi ed in the contract is discharged, cancelled or expires.
(s) Life insurance contract liabilities The fi nancial reporting methodology used to determine the fair value of life insurance contract liabilities is referred to as Margin on Services (MoS).
Under MoS, the excess of premium received over claims and expenses (the margin) is recognised over the life of the contract in a manner that refl ects the pattern of risk accepted from the policyholder (the service). The movement in life insurance contract liabilities recognised in the Income statement refl ects the planned release of this margin.
For
per
sona
l use
onl
y

51
1. Basis of preparation and summary of signifi cant accounting policies continued
Life insurance contract liabilities are usually determined using a projection method, whereby estimates of policy cash fl ows (premiums, benefi ts, expenses and profi t margins to be released in future periods) are projected into the future. The liability is calculated as the net present value of these projected cash fl ows using best-estimate assumptions about the future. When the benefi ts under a life insurance contract are linked to the assets backing it, the discount rate applied is based on the expected future earnings rate of those assets. Where the benefi ts are not linked to the performance of the backing assets, a risk-free discount rate is used. The risk-free discount rate is determined by the Appointed Actuary based on the Commonwealth Government bond rate or the inter-bank zero coupon mid swap rates depending on the nature, structure and terms of the contract liabilities.
An accumulation method may be used if it produces results that are not materially different from those produced by a projection method. A modifi ed accumulation method is used for some discretionary participating business, where the life insurance liability is the accumulation of amounts invested by policyholders, less fees specifi ed in the policy, plus investment earnings and vested benefi ts, adjusted to allow for the fact that crediting rates are determined by reference to investment income over a period of greater than one year. The accumulation method may be adjusted to the extent that acquisition expenses are to be recovered from future margins between fees and expenses.
Allocation of operating profi t and unvested policyholder benefi tsThe operating profi t arising from discretionary participating contracts is allocated between shareholders and participating policyholders by applying the MoS principles in accordance with the Life Insurance Act 1995 (Life Act).
Once profi t is allocated to participating policyholders it can only be distributed to these policyholders. Any distribution of this profi t to shareholders is only allowed for overseas business with specifi c approval of the regulators.
Profi t allocated to participating policyholders is recognised in the Income statement as an increase in policy liabilities. Both the element of this profi t that has not yet been allocated to specifi c policyholders (i.e. unvested) and that which has been allocated to specifi c policyholders by way of bonus distributions (i.e. vested) are included within life insurance contract liabilities.
Bonus distributions to participating policyholders are merely a change in the nature of the liability from unvested to vested and, as such, do not alter the amount of profi t attributable to shareholders.
The principles of allocation of the profi t arising from discretionary participating business determined under the Life Act and MoS are as follows:Life Act and MoS are as follows:Life Act
(i) Investment income (net of tax and investment expenses) on retained earnings in respect of discretionary participating business is allocated between policyholders and shareholders in proportion to the balances of policyholders’ and shareholders’ retained earnings, being 80:20.
(ii) Other MoS profi ts arising from discretionary participating business (excluding the additional tax attributable to shareholders in respect of Australian superannuation business) are allocated 80 per cent to policyholders and 20 per cent to shareholders, with the following exceptions:
– the profi t arising from New Zealand corporate superannuation business is apportioned such that shareholders are allocated 15 per cent of the profi t allocated to policyholders
– the profi t arising in respect of Preservation Superannuation Account business is allocated 92.5 per cent to policyholders and 7.5 per cent to shareholders.
(iii) Additional tax on taxable income to shareholders in respect of Australian superannuation business is allocated to shareholders only.
(iv) All profi ts arising from non-participating business, including net investment returns on shareholder capital and retained earnings in life entities’ statutory funds (excluding retained earnings dealt with in (i) above) are allocated to shareholders.
Allocation of expenses within the AMP life insurance entities’ statutory fundsAll operating expenses relating to the life insurance contract and investment contract activities are apportioned between acquisition, maintenance and investment management expenses. Expenses which are directly attributable to an individual life insurance contract or investment contract or product are allocated directly to a particular expense category, fund, class of business and product line as appropriate.
Where expenses are not directly attributable, they are appropriately apportioned, according to detailed expense analysis, with due regard for the objective in incurring that expense and the outcome achieved. The apportionment basis has been made in accordance with Actuarial Standards and on an equitable basis to the different classes of business in accordance with the Life Act.
The costs apportioned to life insurance contracts are included in the determination of margin described above.
Investment management expenses of the AMP life insurance entities’ statutory funds are classifi ed as other operating expenses. See Note 1(aa).
(t) Investment contract liabilitiesAn investment contract consists of a fi nancial instrument and an investment management services element, both of which are measured at fair value. With the exception of fi xed retirement-income policies, the resulting liability to policyholders is closely linked to the performance and value of the assets (after tax) that back those liabilities. The fair value of such liabilities is therefore the same as the fair value of those assets (after tax) charged to the policyholders except where this is an accounting mismatch.
For fi xed retirement-income policies, the fi nancial instrument element of the liability is the fair value of the fi xed retirement-income payments, being their net present value using a risk-free discount rate. The fair value of the associated management services element is the net present value, using a fair value discount rate, of all expenses associated with the provision of services and any profi t margins thereon. The risk-free discount rate is determined by the Appointed Actuary based on the Commonwealth Government bond rate or the inter-bank zero coupon mid swap rates, depending on the nature, structure and terms of the contract liabilities.
(u) Contributed equityIssued capitalIssued capital in respect of ordinary shares is recognised as the fair value of consideration received by the parent entity. Incremental costs directly attributable to the issue of certain new shares are recognised in equity as a deduction, net of tax, from the proceeds.
Treasury sharesThe Australian Securities and Investments Commission (ASIC) has granted relief from restrictions in the Corporations Act 2001to allow AMP’s life insurance entities to hold and trade shares in AMP Limited as part of the policyholder funds’ investment activities. These shares (defi ned by Australian Accounting Standards as treasury shares) are held on behalf of policyholders and, as a result, the life entities’ statutory funds also recognise a corresponding liability to policyholders.
For
per
sona
l use
onl
y

Notes to the fi nancial statements
AMP Financial Report 2011
for the year ended 31 December 2011 continued52
1. Basis of preparation and summary of signifi cant accounting policies continued
Under Australian Accounting Standards, the AMP group cannot recognise ‘treasury shares’ in the consolidated Statement of fi nancial position. These assets, plus any corresponding Income statement fair value movement on the assets and dividend income, are eliminated when the life entities’ statutory funds are consolidated into the AMP group. The cost of the investment in the shares is deducted to arrive at the amount of contributed equity.
However, the corresponding investment contract and life insurance contract liabilities, and related Income statement change in the liabilities, remain on consolidation. At the AMP group consolidated level, this mismatch results in policyholder asset movements impacting the profi t attributable to shareholders of AMP Limited.
(v) Foreign currency transactionsFunctional and presentation currencyThe consolidated Financial Report is presented in Australian dollars (the presentation currency). Items included in the fi nancial statements for each of the AMP group entities are measured using the currency of the primary economic environment in which the entity operates (the functional currency). The functional currency of the parent entity is Australian dollars.
Transactions and balancesIncome and expense items denominated in a currency other than the functional currency are translated at the spot exchange rate at the date of the transaction. Monetary assets and liabilities denominated in foreign currencies are translated at the rate of exchange ruling at the reporting date, with exchange gains and losses recognised in the Income statement.
Non-monetary items measured at fair value in a foreign currency are translated using the exchange rates at the date when the fair value was determined.
Translation of controlled entitiesWhere the functional currency of a controlled entity is not the presentation currency, the transactions and balances of that entity are translated as follows:
– income and expenses are translated at average exchange rates, unless this is not a reasonable approximation of the cumulative effect of the rates prevailing on the transaction dates. In this case, income and expenses are translated at the dates of the transactions
– assets and liabilities are translated at the closing rate at the reporting date, and
– all resulting exchange differences are recognised as a separate component of equity in the foreign currency translation reserve.
When a foreign operation is sold, the cumulative amount in the foreign currency translation reserve relating to that operation is recognised in the Income statement as part of the gain or loss on sale. If a portion of the operation is sold, the proportionate share of the cumulative amount is recognised.
(w) Insurance premium and related revenueLife insurance contractsLife insurance contract premiums are separated into their revenue and deposit components. Premium amounts earned by bearing insurance risks are recognised as revenue. Other premium amounts received, which are in the nature of deposits, are recognised as an increase in life insurance contract liabilities.
Premiums with no due date or fi xed amount are recognised on a cash-received basis. Premiums with a regular due date are recognised on an accruals basis. Unpaid premiums are only recognised during the days of grace or where secured by the
surrender value of the life insurance contract and are reported as outstanding premiums and classifi ed as receivables in the Statement of fi nancial position.
Investment contractsThere is no premium revenue in respect of investment contracts. Amounts received from policyholders in respect of investment contracts comprise:
– origination fees, advice fees and ongoing investment management fees. See Note 1(x), and
– amounts credited directly to investment contract liabilities. See Note 1(t).
(x) Fee and other revenue Fees are charged to customers in connection with investment contracts and other fi nancial services contracts. Revenue is recognised as services are provided. In some cases, services are provided at the inception of the contract, while other services are performed over the life of the contract.
An investment contract consists of a fi nancial instrument and an investment-management services element. The payment by the policyholder includes the amount to fund the fi nancial instrument and a fee for the origination of the contract. In many cases, that origination fee is based on amounts paid to fi nancial planners for providing initial advice. The fi nancial instrument is classifi ed as an investment contract and is measured at fair value. See Note 1(t).
The revenue that can be attributed to the origination service is recognised at inception. Any amounts paid to fi nancial planners is also recognised as an expense at that time. See Note 1(aa).
Fees for ongoing investment management services and other services provided are charged on a regular basis, usually daily, and are recognised as the service is provided.
Fees charged for performing a signifi cant act in relation to funds managed by the AMP group are recognised as revenue when that act has been completed.
(y) Investment gains or lossesDividend and interest income is recognised in the Income statement on an accruals basis when the AMP group obtains control of the right to receive the revenue.
Net realised and unrealised gains and losses include realised gains and losses being the change in value between the previously reported value and the amount received on sale of the asset, and unrealised gains and losses being changes in the fair value of fi nancial assets and investment property recognised in the period.
Rents raised are on terms in accordance with individual leases, however, they are generally due on the fi rst day of each month.
Certain tenant allowances that are classifi ed as lease incentives such as rent-free periods, fi t-outs and upfront payments are capitalised and amortised over the term of the lease. The aggregate cost of incentives is recognised as a reduction to revenue from rent over the lease term.
(z) Insurance claims and related expenseLife insurance contractsLife insurance contract claims are separated into their expense and withdrawal components. The component that relates to the bearing of risks is treated as an expense. Other claim amounts, which are in the nature of withdrawals, are recognised as a decrease in life insurance contract liabilities.
Claims are recognised when the liability to the policyholder under the life insurance contract has been established or upon notifi cation of the insured event, depending on the type of claim.
For
per
sona
l use
onl
y
53
1. Basis of preparation and summary of signifi cant accounting policies continued
Investment contractsThere is no claims expense in respect of investment contracts. Amounts paid to policyholders in respect of investment contracts are withdrawals and are recognised as a decrease in investment contract liabilities. See Note 1(t).
(aa) Operating expensesAll operating expenses, other than those allocated to life insurance contracts, see Note 1(s), are expensed as incurred.
Expenses of controlled entities of the life entities’ statutory funds represent the business costs of those entities and are consolidated into the results of the AMP group.
The majority of investment contracts issued result in payments to external service and advice providers. Where the amount paid equates to a fee charged to policyholders for the provision of advice, the amount is expensed either at inception or over the period of the contract consistent with the basis for recognising the fee revenue on the respective contracts. See Note 1(t).
Operating lease paymentsOperating lease payments are recognised as an expense in the Income statement on a straight-line basis over the lease term or other systematic basis representative of the patterns of the benefi ts obtained. Operating incentives are recognised as a liability when received and subsequently reduced by allocating lease payments between rental expense and reduction of the liability.
(bb) Finance costs Finance costs include:
(i) Borrowing costs: – interest on bank overdrafts, borrowings and
subordinated debt – amortisation of discounts or premiums related
to borrowings.
(ii) Exchange differences arising from foreign currency borrowings to the extent that they are regarded as an adjustment to interest costs.
(iii) Changes in the fair value of derivative hedges together with any change in the fair value of the hedged asset or liabilities that are designated and qualify as fair value hedges, foreign exchange gains and losses and other fi nancing related amounts. The accounting policy for derivatives is set out in Note 1(q).
Borrowing costs are recognised as expenses when incurred.
(cc) Share-based paymentsThe AMP group issues performance rights, restricted shares and other equity instruments to employees as a form of equity-settled share-based compensation. Equity-settled share-based compensation to employees is considered to be an expense in respect of the services received and is recognised in the Income statement over the vesting period of the instrument with a corresponding amount in the share-based payment reserve within equity.
The expense is based on the fair value of each grant, measured at the date of the grant. For performance rights and similar instruments the fair value is determined by an external valuer. The fair value calculation takes into consideration a number of factors, including the likelihood of achieving market-based vesting conditions such as total shareholder return. The fair value determined at grant date is not altered over the vesting period. Non-market vesting conditions are included in assumptions about the number of instruments that are expected to vest. At each reporting date, the AMP group reviews its estimates of the number of instruments that are expected to vest. Any changes to the original estimates are recognised in the Income statement and the share-based payment reserve, over the remaining vesting period.
Where the terms of an equity-settled share-based payment are modifi ed and the expense increases as a result of the modifi cation, the increase is recognised over the remaining vesting period. When a modifi cation reduces the expense, there is no adjustment and the pre-modifi cation cost continues to be recognised.
Expenses for awards that do not ultimately vest are reversed in the period in which the instrument lapses, except for awards where vesting is conditional upon a market condition, in which case no reversal is recognised.
When instruments vest, shares are purchased on-market and transferred to the employee. The cost of the purchase is recognised in the share-based payments reserve.
(dd) Superannuation funds The AMP group operates superannuation funds that provide benefi ts for employees and their dependants on resignation, retirement, disability or death of the employee. The funds have both defi ned contribution and defi ned benefi t sections, refer to Note 27 for further information on the funds.
The contributions paid and payable by AMP group to defi ned contributions funds are recognised in the Income statement as an operating expense when they fall due. Prepaid contributions are recognised as an asset to the extent that a cash refund or a reduction in the future payments is available.
For the defi ned-benefi t sections of superannuation funds operated by the AMP group, the AMP group recognises the net defi cit or surplus position of each fund in the Statement of fi nancial position as defi ned by AASB 119 Employee Benefi ts. This does not represent an assessment of the funds’ funding positions. The defi cit or surplus is measured as the difference between the fair value of the funds’ assets and the discounted defi ned-benefi t obligations of the funds, using discount rates based on the interest rates of government securities which have terms to maturity approximating the terms of the obligations. The defi ned-benefi t obligation is calculated annually, with half-yearly reviews, by independent actuaries.
After taking into account any contributions paid into the defi ned-benefi ts funds during the period, movements in the net surplus or defi cit of each fund, except actuarial gains and losses, are recognised in the Income statement. Actuarial gains and losses arising from experience adjustments and changes in actuarial assumptions over the period are recognised (net of tax), directly in Other comprehensive income.
Contributions paid into defi ned-benefi t funds are recognised as reductions in the defi cit.
(ee) Earnings per shareBasic earnings per share is calculated by dividing the consolidated profi t attributable to shareholders of AMP Limited, by the weighted average number of ordinary shares outstanding during the period. The weighted average number of ‘treasury shares’ held during the period is deducted in calculating the weighted average number of ordinary shares outstanding.
Diluted earnings per share is calculated by dividing the profi t used in the determination of basic earnings per share by the weighted average number of shares outstanding during the period adjusted for potential ordinary shares considered to be dilutive. Potential ordinary shares are contracts such as options and performance rights that may entitle the holder to ordinary shares. These potential ordinary shares are considered dilutive when their conversion into ordinary shares would be likely to cause a reduction in earnings per share. The weighted average number of ‘treasury shares’ held during the period is deducted in calculating the weighted average number of ordinary shares outstanding for diluted earnings per share.
For
per
sona
l use
onl
y

Notes to the fi nancial statements
AMP Financial Report 2011
for the year ended 31 December 2011 continued54
2. Signifi cant accounting judgements, estimates and assumptions
The making of judgements, estimates and assumptions is a necessary part of the fi nancial reporting process and these judgements, estimates and assumptions can have a signifi cant effect on the reported amounts in the fi nancial statements. Estimates and assumptions are determined based on information available to management at the time of preparing the fi nancial report and actual results may differ from these estimates and assumptions. Had different estimates and assumptions been adopted, this may have had a signifi cant impact on the fi nancial statements. Signifi cant accounting judgements, estimates and assumptions are re-evaluated at each reporting period in the light of historical experience and changes to reasonable expectations of future events. Signifi cant accounting judgements, estimates and assumptions include but are not limited to:
(a) ConsolidationEntities are included within the consolidated fi nancial statements of AMP group where AMP Limited has control of these entities, being the power to govern the fi nancial and operating policies of an entity so as to obtain benefi ts from its activities. Judgement is applied by management in assessing whether control exists, and in particular whether the rights held by AMP Limited amount to being the power to govern the fi nancial and operating policies of those entities and whether AMP Limited is able to use such power to obtain benefi ts from the activities of the entities.
(b) Fair value of investments in fi nancial assetsThe AMP group measures investments in fi nancial assets, other than those held by AMP Bank and loans and advances to advisers, at fair value through profi t or loss. Where available, quoted market prices for the same or similar instruments are used to determine fair value. Where there is no market price available for an instrument, a valuation technique is used. Management applies judgement in selecting valuation techniques and setting valuation assumptions and inputs. Further detail on the determination of fair value of fi nancial instruments is set out in Note 23.
(c) Fair values of investment properties and owner occupied property
The AMP group measures investment properties at fair value through profi t or loss. Owner occupied property is measured at fair value at last valuation date less subsequent depreciation. The valuation of investment properties and owner occupied property requires judgement to be applied in selecting appropriate valuation techniques and setting valuation assumptions. The AMP group engages independent registered valuers to value each of its investment properties on a rolling annual basis. Further detail on the determination of fair values of investment properties is set out in Note 12.
(d) Acquired intangible assetsSubject to some exceptions, accounting standards require the assets and liabilities of businesses acquired through a business combination to be measured at their acquisition date fair values. Management applies judgement in selecting valuation techniques and setting valuation assumptions to determine the acquisition date fair values and to estimate the useful lives of these assets. Note 3 provides details of intangible assets acquired through business combinations during the period.
(e) Goodwill Goodwill is required to be allocated to cash-generating units and tested for impairment on an annual basis. Management applies judgement in determining cash-generating units and allocating the goodwill arising from business combinations to these cash-generating units. Impairment is assessed annually
by determining the recoverable amount of each cash generating unit which has a goodwill balance. Management applies judgement in selecting valuation techniques and setting valuation assumptions to determine the recoverable amount. Note 14 sets out further information on the impairment testing of goodwill.
(f) TaxThe AMP group is subject to taxes in Australia and other jurisdictions where it has operations. The application of tax law to the specifi c circumstances and transactions of the AMP group requires the exercise of judgement by management. The tax treatments adopted by management in preparing the fi nancial statements may be impacted by changes in legislation and interpretations or be subject to challenge by tax authorities.
Judgement is also applied by management in determining the extent to which the recovery of carried forward tax losses is probable for the purpose of meeting the criteria for recognition as deferred tax assets. Note 8 sets out information on carried forward tax losses for which a deferred tax asset has not been recognised.
(g) ProvisionsA provision is recognised for items where AMP group has a present obligation arising from a past event, it is probable that an outfl ow of economic resources will be required to settle the obligation and a reliable estimate can be made of the amount of the obligation. The provision is measured as the best estimate of the expenditure required to settle the present obligation. Management applies judgement in assessing whether a particular item satisfi es the above criteria and in determining the best estimate. Note 16 sets out further information on provisions and Note 32 provides information on contingent liabilities.
(h) Insurance contract liabilitiesThe measurement of insurance contract liabilities is determined using the Margin on Services (MoS) methodology. The determination of the liability amounts involves judgement in selecting the valuation methods and profi t carriers for each type of business and setting valuation assumptions. The determination is subjective and relatively small changes in assumptions may have a signifi cant impact on the reported profi t. The appointed actuary of each of the life entities is responsible for these judgements and assumptions. Further detail on the determination of insurance contract liabilities is set out in Note 21.
(i) Investment contract liabilitiesInvestment contract liabilities are measured at fair value. For the majority of contracts, the fair value is determined based on published unit prices and does not generally require the exercise of judgement. For fi xed income products and the North capital guarantee, fair value is determined using valuation models. Judgement is applied in selecting the valuation model and setting the valuation assumptions. Further details on investment contract liabilities are set out in Note 22.
( j) Defi ned benefi t plan liabilitiesThe defi ned benefi t plan liabilities of AMP group is measured as the difference, for each fund, of the fair value of the fund’s assets and the actuarially determined present value of the obligation to fund members. The determination of the fair value of the fund’s assets is subject to the judgements, estimates and assumptions discussed at (b) above. The calculation of the obligation to fund members requires judgement to be applied in the setting of actuarial assumptions. Further detail on the determination of defi ned benefi t plan liabilities is set out in Note 27.
For
per
sona
l use
onl
y

55
3. Merger with the Australian and New Zealand businesses of AXA Asia Pacifi c Holdings Limited
On 30 March 2011, AMP Limited completed its acquisition of AXA Asia Pacifi c Holdings Limited for the purposes of merging the Australian and New Zealand operations of both entities. The merger was effected by AMP acquiring 100 per cent of the issued shares in AXA Asia Pacifi c Holdings Limited though a contractual arrangement with its parent entity, AXA SA, and a scheme of arrangement with its minority shareholders. The contractual arrangement to acquire the shares held by AXA SA was conditional upon the approval of the scheme of arrangement with the minority shareholders of AXA Asia Pacifi c Holdings Limited which was approved by those shareholders on 2 March 2011 and subsequently approved by the Supreme Court of Victoria on 7 March 2011. AMP obtained control of AXA Asia Pacifi c Holdings Limited on 30 March 2011, which is the date that AMP acquired 100 per cent of AXA Asia Pacifi c Holdings Limited shares and was able to appoint directors to the Board.
The principal activity of AXA Asia Pacifi c Holdings Limited is wealth management.
Details of the purchase consideration are set out below:
$m
Cash consideration paid to minority shareholders of AXA Asia Pacifi c Holdings Limited 2,425 AMP Limited shares issued to minority shareholders of AXA Asia Pacifi c Holdings Limited2 3,803 Consideration paid to AXA SA 7,144 Payment to AXA Asia Pacifi c Holdings Limited rights holders 69
Total purchase consideration1 13,441
Footnote:1 Amounts presented in the table above differ to those published in the 30 June 2011 half-year fi nancial report as the disclosure at that time
was provisional.2 695,262,564 AMP Limited shares at $5.47 per share, being the last traded price on the ASX on 30 March 2011.
The Asian subsidiaries of AXA Asia Pacifi c Holdings Limited and its ownership interests in joint ventures with AllianceBernstein LP were sold on 31 March 2011 and 1 April 2011 for $9,159m. There was no gain or loss recognised by AMP group on the sale of these businesses.
For
per
sona
l use
onl
y

Notes to the fi nancial statementsfor the year ended 31 December 2011 continued
AMP Financial Report 2011
56
3. Merger with the Australian and New Zealand businesses of AXA Asia Pacifi c Holdings Limited continued
Details of the fair value of the identifi able assets and liabilities acquired and goodwill are set out below:
Recognised values on
acquisition1
$m
Sale of disposal
groups and repayment of AXA SA debt3
$m
Net amounts recognised for Australian and
New Zealand businesses
acquired1
$m
Assets Cash and cash equivalents 949 – 949 Receivables2 947 – 947 Current tax assets 8 – 8 Inventories and other assets 12 – 12 Investments in fi nancial assets measured at fair value through profi t or loss 12,962 – 12,962 Investments in fi nancial assets measured at amortised cost 10 – 10 Investments in associates accounted for using the equity method 22 – 22 Investment property 11 – 11 Property, plant and equipment 22 – 22 Deferred tax asset 525 – 525 Intangible assets 1,380 – 1,380 Assets of disposal groups3 20,730 (20,730) –
Total assets 37,578 (20,730) 16,848
Liabilities Payables 517 – 517 Current tax liabilities 11 – 11 Provisions 306 – 306 Derivative fi nancial liabilities 34 – 34 Borrowings 383 (383) – Subordinated debt 280 (280) – Deferred tax liabilities 398 – 398 External unitholder liabilities 310 – 310 Life insurance contract liabilities 6,840 – 6,840 Investment contract liabilities 6,131 – 6,131 Defi ned benefi t plan liability 149 – 149 Liabilities of disposal groups3 10,908 (10,908) –
Total liabilities 26,267 (11,571) 14,696
Net assets 11,311 (9,159) 2,152 Non-controlling interests (10) – (10)
Net identifi able assets and liabilities attributable to AMP Limited 11,301 (9,159) 2,142
Goodwill recognised on acquisition 2,140 – 2,140
Footnote: 1 Amounts presented in the table above differ to those published in the 30 June 2011 half-year fi nancial report as the disclosure at that time
was provisional.2 The carrying amount of receivables approximates the gross contractual amount. There are no contractual amounts at acquisition date which
are not expected to be fully recovered.3 Disposal groups consist of AXA Asia Pacific Holdings Limited’s Asian businesses and its ownership interests in joint ventures with
AllianceBernstein LP. These disposal groups were sold through a series of transactions on 31 March 2011 and 1 April 2011.
For
per
sona
l use
onl
y

57
3. Merger with the Australian and New Zealand businesses of AXA Asia Pacifi c Holdings Limited continued
Acquisition related costsAcquisition related costs of $34m (2010: $16m) were incurred in relation to the merger transaction. These costs have been included in other operating expenses in the period in which they were incurred.
Contingent liabilitiesThere were no material contingent liabilities recognised at acquisition date.
Identifi able intangiblesThe fair value of identifi able intangible assets recognised on acquisition consists of the value of in-force business of $1,191m, distribution networks of $95m and software of $94m. These assets will be amortised on a straight-line basis over their remaining useful lives which have been estimated as follows:– value of in-force business – 10 to 20 years– distribution networks – 10 years– software – 2 to 4 years.
GoodwillGoodwill arose in the business combination as the difference between the consideration paid and the fair value of net assets, identifi able intangible assets and contingent liabilities acquired. The goodwill balance is attributed to the skills and talent of the acquired business workforce, the benefi t of expected head offi ce and operational synergies, revenue growth and future market developments. These benefi ts are not recognised separately from goodwill as the future economic benefi ts arising from them cannot be measured reliably or they are not capable of being separated from the AMP group and sold, transferred, licensed, rented or exchanged either individually or together with any related contracts. Goodwill is not expected to be deductible for tax purposes.
Contribution to AMP group resultsAXA Asia Pacifi c Holdings Limited contributed $50m for the period from 30 March 2011 to 31 December 2011, to the AMP group consolidated statutory profi t for the year ended 31 December 2011. This contribution includes the amortisation of the acquired intangible assets and therefore it does not equal the profi t for AXA Asia Pacifi c Holdings Limited on a standalone basis.
If the merger had occurred on 1 January 2011, AMP group revenue would have been $7,427m for the year and net profi t would have been $838m. This pro-forma fi nancial information uses AXA Asia Pacifi c Holdings Limited data for the period ended 31 December 2011 and represents the historical statutory profi t of AXA Asia Pacifi c Holdings Limited. It includes the results of the Asian businesses for the period 1 January 2011 to the dates of their disposal on 31 March 2011 and 1 April 2011 in accordance with the contractual arrangements for the merger.
4. Segment information(a) Segments – backgroundOperating segments have been identifi ed based on separate fi nancial information that is regularly reviewed by the Chief operating decision maker (CODM). The term CODM refers to the function performed by the Chief Executive Offi cer and his immediate team, as a team, in assessing performance and determining the allocation of resources. The operating segments are identifi ed according to the nature of profi t generated and services provided. Segment information in this Note is reported separately for each operating segment. AMP group evaluates the performance of segments on a post-tax operating earnings basis.
Segment information is not reported for activities of AMP group offi ce companies as it is not the function of these departments to earn revenue and any revenues earned are only incidental to the activities of the AMP group.
Asset segment information has not been disclosed because the balances are not provided to the CODM for the purposes of evaluating segment performance and deciding the allocation of resources to segments.
(b) Description of segmentsAMP Financial ServicesAMP Financial Services provides a range of products and services to customers in Australia and New Zealand. These products and services are primarily distributed through self-employed fi nancial planners and advisers aligned with AMP Financial Services. AMP Financial Services is reported as four separate divisions:
– Contemporary Wealth Management (CWM) – Financial planning services (including owned advice businesses), platform administration, unit-linked superannuation, retirement income and managed investment products business. Superannuation products include personal and employer sponsored plans. CWM includes the North product and platform and AMP Bank, which is a direct Australian bank offering residential mortgages, deposits, transactional banking and white-labelled credit cards.
– Contemporary Wealth Protection (CWP) – Includes personal and group term, disability and income protection insurance products. Products can be bundled with a superannuation product or held independently of a superannuation contract.
– Mature – A business comprising products which are mainly in run-off. Closed products include whole of life, endowment, investment linked, investment account, RSA, annuities and personal superannuation. The only open products in Mature are the AXA branded Guaranteed Savings Account (GSA) and AMP branded Eligible Rollover Fund (ERF).
– AMP Financial Services New Zealand (AFS NZ)– AMP Financial Services New Zealand (AFS NZ)– – A risk insurance business and mature book (traditional participating business), with a growing KiwiSaver, unit-linked superannuation and managed investment business.
AMP CapitalAMP Capital is AMP’s wholly-owned diversifi ed investment manager. It manages investments across all the major asset classes including equities, fi xed interest, infrastructure, property, diversifi ed funds and multi-manager funds. AMP Capital also provides commercial, industrial and retail property management services. It provides investment management services through in-house investment professionals and a carefully selected global network of investment partners.
In addition to its well established reputation in Australia and New Zealand, AMP Capital has a strong and growing international presence with offi ces in Beijing, London, Delhi, Singapore, Tokyo, New York, Hong Kong, Luxembourg and Bahrain, allowing it to source competitive offshore opportunities. Following the merger with AXA in March 2011, AMP Capital includes the retail and wholesale unit trust business through National Mutual Funds Management and ipac investment services. AMP Capital also includes funds managed by AXA Global Investors, a New Zealand based asset manager.
In December 2011, AMP Capital announced a strategic business alliance with Mitsubishi UFJ Trust and Banking Corporation (MUTB). MUTB will acquire a 15 per cent minority interest in AMP Capital and AMP Capital will no longer be wholly-owned by AMP.
For
per
sona
l use
onl
y

Notes to the fi nancial statementsfor the year ended 31 December 2011 continued
AMP Financial Report 2011
58
4. Segment information continued
CWM$m
CWP2
$m
Australian Mature2
$mAFS NZ2
$m
AMP Capital3
$m
Total operating segments
$m
(c) Segment profi t
2011Segment profi t after income tax1 322 215 153 76 83 849
Other segment information4
External customer revenue 1,383 215 153 76 220 2,047Intersegment revenue5 90 – – – 206 296Income tax expense 138 92 66 30 26 352Depreciation and amortisation 60 8 – 4 8 80
2010 Segment profi t after income tax1 303 138 140 58 87 726
Other segment information4 External customer revenue 1,067 138 140 58 226 1,629Intersegment revenue5 85 – – – 172 257Income tax expense 130 59 60 25 29 303Depreciation and amortisation 30 6 – – 6 42
Footnote: 1 Segment profi t after income tax differs from Profi t attributable to shareholders of AMP Limited due to the exclusion of the following items: i) Group offi ce costs. ii) Investment return on shareholder assets invested in income producing investment assets. iii) Interest expense on AMP corporate debt. iv) The effects of non-recurring items such as: merger and acquisition transaction costs, AXA integration costs, recognition of prior year tax
deductions and other one-off and non-recurring costs. These items do not refl ect the underlying operating performance of the operating segments.
v) Accounting mismatches, market adjustments – annuity fair value and risk products and amortisation of AXA acquired intangible assets.2 Statutory reporting revenue for Australian Contemporary Wealth Protection, Australian Mature and AMP Financial Services New Zealand
includes premium and investment gains and losses. However, for segment reporting, external customer revenue is operating earnings which represents gross revenue less claims, expenses, movement in insurance contract liabilities and tax relating to those segments.
3 AMP Capital segment revenue is reported net of external investment manager fees paid in respect of certain assets under management.4 Other segment information excludes revenue, expenses and tax relating to assets backing policyholder liabilities.5 Intersegment revenue represents operating revenue between segments priced on an arm’s length basis.
For
per
sona
l use
onl
y

59
4. Segment information continued
2011$m
2010$m
(d) Reconciliation of segment profi t after taxAustralian Contemporary Wealth Management 322 303 Australian Contemporary Wealth Protection 215 138 Australian Mature 153 140 New Zealand 76 58
AMP Financial Services 766 639 AMP Capital 83 87
BU operating earnings 849 726 Group Offi ce costs (57) (40)
Total operating earnings 792 686 Underlying investment income1 183 130 Interest expense on corporate debt (82) (72)AMP Limited tax loss recognition 16 16
Underlying profi t 909 760 Market adjustment – investment income1 (50) (5)Market adjustment – annuity fair value2 13 22 Market adjustment – risk products3 53 (7)Loan hedge revaluations 3 1 Other items4 1 (2)
Profi t after income tax before AXA merger related adjustments and accounting mismatches 929 769
M&A transaction costs (42) (16)AXA integration costs (105) –Amortisation of AXA acquired intangible assets (75) –Accounting mismatches5 (19) 22
Net profi t attributable to shareholders of AMP Limited 688 775
(e) Reconciliation of segment revenueTotal segment revenue 2,343 1,886 Add revenue excluded from segment revenue – Investment gains and (losses) – shareholders and policyholders (excluding AMP Bank interest revenue) 612 4,000 – Revenue of investment entities controlled by the life entities’ statutory funds which carry out business
operations unrelated to the core wealth management operations of the AMP group 270 277 – Other revenue 110 17
Add back expenses netted against segment revenue – Claims, expenses, movement in insurance contract liabilities and tax relating to
Australian Contemporary Wealth Protection, Australian Mature and AFS NZ businesses 1,433 764 – Interest expense related to AMP Bank 685 705 – External investment manager and advisor fees paid in respect of certain assets under management 526 272
Remove intersegment revenue (296) (257)
Total revenue6 5,683 7,664
Footnote: 1 Underlying investment income consists of investment income on shareholder assets invested in income producing investment assets
(as opposed to income producing operating assets) normalised in order to bring greater clarity to the results by eliminating the impact of short-term market volatility on underlying performance. Underlying performance is based on long-term expected returns for each asset class. Market adjustment – investment income is the excess (shortfall) between the underlying investment income and the actual return on shareholder assets invested in income producing investment assets.
2 Market adjustment – annuity fair value relates to the net impact of investment markets on AMP’s annuity portfolio.3 Market adjustment – risk products relates to the net impact of changes in market economic assumptions (bond yields and CPI) on the valuation
of risk insurance liabilities. For AXA, this also includes the impact of changes in the market value of equities up until June 2011. Equities were removed from backing the asset allocation in June 2011 following the merger.
4 Other items include one-off and non-recurring revenues and costs. FY 11 other items includes the profi t on sale of AMP’s general insurance distribution business and one-off tax benefi ts, offset by one-off and non-recurring costs. Non-recurring costs include restructuring and redundancy costs that are not related to the AXA merger and tax adjustments associated with proposed changes to tax deductions on rights to future income.
5 Under Australian Accounting Standards, some assets held on behalf of the policyholders (and related tax balances) are recognised in the Financial Report at different values to the values used in the calculation of the liability to policyholders in respect of the same assets. Therefore, movements in these policyholder assets result in accounting mismatches which impact profi t attributable to shareholders. These differences have no impact on the operating earnings of the AMP group.
6 Revenue as per the Income statement of $5,683m (2010: $7,664m) comprises Premiums and related revenue $1,877m (2010: $1,100m), Fee revenue $1,962m (2010: $1,430m), Other revenue $380m (2010: $294m) and Investment gains and (losses) gains of $1,464m (2010: gains of $4,840m).
For
per
sona
l use
onl
y

Notes to the fi nancial statementsfor the year ended 31 December 2011 continued
AMP Financial Report 2011
60
5. Income
Consolidated Parent
2011$m
2010$m
2011$m
2010$m
(a) Life insurance premium and related revenue Life insurance contract premium revenue 1,786 1,051 – –Reinsurance recoveries 91 49 – –
Total life insurance premium and related revenue 1,877 1,100 – –
(b) Fee revenue Investment management and origination fees 1,517 1,252 – –Financial advisory fees 433 165 – –Banking business fees 12 13 – –Service fees – subsidiaries – – 16 11
Total fee revenue1 1,962 1,430 16 11
(c) Other revenue Defi ned benefi t plan income 2 1 – –Other revenue2 378 293 – –
Total other revenue 380 294 – –
Footnote: 1 Total consolidated fee revenue includes fee income from trust and fi duciary activities that result in the holding or investing of assets on behalf
of individuals, trusts, retirement benefi t plans, and other institutions, with the exception of $12m (2010: $13m) fees from banking operations, which are fees from fi nancial assets that are not measured at fair value through profi t or loss.
2 Other revenue includes trading revenue of investment entities controlled by the life entities’ statutory funds which carry out business operations unrelated to the core wealth management operations of the AMP group.
6. Investment gains and (losses)
Consolidated Parent
2011$m
2010$m
2011$m
2010$m
Investment gains and (losses) Interest1 2,586 2,074 3 2 Dividends and distributions – subsidiaries – – 280 374 – associated entities not equity accounted 261 47 – –– other entities 3,192 2,354 – –Rental income 676 744 – –Net realised and unrealised gains and (losses)2 (5,294) (379) – –Other investment income 43 – – –
Total investment gains and (losses) 1,464 4,840 283 376
Footnote: 1 Interest includes interest income from fi nancial assets designated at fair value through profi t or loss upon initial recognition, with the
exception of $820m (2010: $702m) interest income from held to maturity investments and loans and advances in banking operations, which are measured at amortised cost.
2 Net realised and unrealised gains and losses include net gains and losses on fi nancial assets and fi nancial liabilities designated at fair value through profi t or loss upon initial recognition.
For
per
sona
l use
onl
y

61
7. Expenses
Consolidated Parent
2011$m
2010$m
2011$m
2010$m
(a) Life insurance claims and related expenses Life insurance contract claims and related expenses (1,714) (1,241) – –Outwards reinsurance expense (76) (48) – –
Total life insurance claims and related expenses (1,790) (1,289) – –
(b) Operating expenses Commission and advisory fee-for-service expense (911) (524) – –Investment management expenses (247) (202) – –Fee expense on banking business (10) (10) – –
Fee and commission expenses1 (1,168) (736) – –
Wages and salaries (869) (568) (6) (5)Contributions to defi ned contribution plans (62) (52) – –Defi ned benefi t fund expense (9) – – –Share-based payments expense (26) (23) (4) (4)Other staff costs (139) (43) (1) (1)
Staff and related expenses (1,105) (686) (11) (10)
Occupancy and other property related expenses (103) (76) – –Direct property expenses2 (179) (186) – –Information technology and communication (209) (122) – –Professional fees (150) (80) – –Advertising and marketing (50) (38) – –Travel and entertainment (38) (24) – –Impairment of intangibles (29) (19) – –Amortisation of intangibles (163) (61) – –Depreciation of property, plant and equipment (37) (41) – –Other expenses3 (194) (201) (5) (1)
Other operating expenses (1,152) (848) (5) (1)
Total operating expenses (3,425) (2,270) (16) (11)
(c) Finance costs Interest expense on borrowings and subordinated debt (807) (789) – –Other fi nance costs (110) (100) – –
Total fi nance costs (917) (889) – –
Footnote: 1 Fee and commission expenses include (a) Fee expenses from trust and other fi duciary activities that result in the holding or investing of assets
on behalf of individuals, trusts, retirement benefi t plans, and other institutions (b) $10m (2010: $10m) fee expense on banking business, which are fees from fi nancial liabilities that are not measured at fair value through profi t or loss.
2 Direct property expenses relate to investment properties which generate rental income.3 Other expenses include trading expenses of investment entities controlled by the life entities’ statutory funds which carry out business
operations unrelated to the core wealth management operations of the AMP group.
For
per
sona
l use
onl
y

Notes to the fi nancial statementsfor the year ended 31 December 2011 continued
AMP Financial Report 2011
62
8. Income tax
Consolidated Parent
2011$m
2010$m
2011$m
2010$m
(a) Analysis of income tax (expense) credit Current tax (expense) credit (405) (207) 4 2 Increase (decrease) in deferred tax assets 300 (4) 43 17 (Increase) decrease in deferred tax liabilities 139 32 – –Over (under) provided in previous years including amounts attributable to policyholders (31) 48 22 (3)Effect of change in overseas tax rate – 5 – –
Income tax (expense) credit 3 (126) 69 16
(b) Relationship between income tax expense and accounting profi tThe following table provides a reconciliation of differences between prima facie tax calculated as 30 per cent of the profi t before income tax for the year and the actual income tax expense recognised in the Income statement for the year. The income tax expense amount refl ects the impact of both income tax attributable to shareholders as well as income tax attributable to policyholders.
In respect of income tax expense attributable to shareholders, the tax rate which applies in Australia is 30 per cent (2010: 30 per cent).
From 1 January 2011 the company tax rate for New Zealand changed from 30 per cent to 28 per cent. There are certain differences between the amounts of income and expenses recognised in the fi nancial statements and the amounts recognised for income tax purposes.
Income tax attributable to policyholders is based on investment income allocated to policyholders less expenses deductible against that investment income. The impact of the tax is charged against policyholder liabilities. A number of different tax rate regimes apply to policyholders. In Australia, certain classes of policyholder life insurance income and superannuation earnings are taxed at 15 per cent, and certain classes of income on some annuity business are tax-exempt. The rate applicable to New Zealand life insurance business during the year was 28 per cent (2010: 30 per cent).
Consolidated Parent
2011$m
2010$m
2011$m
2010$m
Profi t before income tax 673 881 283 376 Policyholder tax (expense) credit recognised as part of the change in policyholder liabilities in determining profi t before tax 265 62 – –
Profi t before income tax excluding tax charged to policyholders 938 943 283 376
Prima facie tax at the rate of 30% (281) (283) (85) (113)
Tax effect of differences between amounts of income and expenses recognised for accounting and the amounts deductible/taxable in calculating taxable income: – Shareholder impact of par-business tax treatment 24 21 – –– Non-deductible expenses (39) (19) (1) (1)– Non-taxable income 16 20 – –– Tax offsets and credits 17 9 – –– Dividend income from controlled entities – – 84 112 – Other items (11) (3) 3 3 Over (under) provided in previous years after excluding amounts attributable to policyholders1 (33) 43 22 (2)Benefi t arising from previously unrecognised tax losses 41 19 46 17 Differences in overseas tax rates 4 (1) – –Effect of change in overseas tax rates – 6 – –
Income tax (expense) credit attributable to shareholders (262) (188) 69 16 Income tax (expense) credit attributable to policyholders 265 62 – –
Income tax (expense) credit per Income statement 3 (126) 69 16
Footnote: 1 The over provision in 2010 mainly relates to additional deductions claimed in relation to SMPs and IMAs as a result of changes in taxation
legislation actually enacted in 2010. The recoverability of these amounts was reassessed in light of developments during 2011 and the deductions have been derecognised.
For
per
sona
l use
onl
y

63
8. Income tax continued
Consolidated Parent
2011$m
2010$m
2011$m
2010$m
(c) Analysis of deferred tax assets Expenses deductible and income recognisable in future years 350 106 1 1 Unrealised movements on borrowings and derivatives 55 44 – –Unrealised investment losses 273 65 – –Losses available for offset against future taxable income 356 331 329 62 Other 61 36 3 3
Total deferred tax assets 1,095 582 333 66
(d) Analysis of deferred tax liabilities Unrealised investment gains 274 414 – –Unrealised movements on borrowings and derivatives 62 46 – –Other 587 160 – –
Total deferred tax liabilities 923 620 – –
(e) Amounts recognised directly in equity Deferred income tax (expense) related to items taken directly to equity during the current period 58 (2) – –
(f) Unused tax losses and deductible temporary differences not recognised Revenue losses 116 129 104 115 Capital losses 560 358 477 358
9. Receivables
Consolidated Parent
2011$m
2010$m
2011$m
2010$m
Investment income receivable 193 107 – –Investment sales and margin accounts receivable 689 104 – –Life insurance contract premiums receivable 355 271 – –Reinsurance and other recoveries receivable 11 8 – –Reinsurers’ share of life insurance contract liabilities 477 65 – –Trade debtors 309 193 1 4 Other receivables – subsidiaries – tax related amounts – – – 95 – other entities 187 139 2 –
Total receivables1 2,221 887 3 99
Footnote: 1 $455m (2010: $85m) of total consolidated receivables is expected to be recovered more than 12 months from reporting date.
For
per
sona
l use
onl
y

Notes to the fi nancial statementsfor the year ended 31 December 2011 continued
AMP Financial Report 2011
64
10. Inventories and other assets
Consolidated Parent
2011$m
2010$m
2011$m
2010$m
Inventories1 202 275 – –Prepayments 71 28 – –Other assets2 3 9 – –
Total inventories and other assets3 276 312 – –
Footnote: 1 Inventories include inventories and development properties of investment entities controlled by the life entities’ statutory funds which carry
out business operations unrelated to the core wealth management operations of the AMP group and fi nancial planning registers held for resale in the ordinary course of business.
2 Other assets are assets of investment entities controlled by the life entities’ statutory funds which carry out business operations unrelated to the core wealth management operations of the AMP group.
3 $12m (2010: $140m) of inventories and other assets is expected to be recovered more than 12 months from the reporting date.
11. Investments in fi nancial assets and other fi nancial liabilities
Consolidated Parent
2011$m
2010$m
2011$m
2010$m
Investments in fi nancial assets measured at fair value through profi t or loss1 Equity securities and listed managed investment schemes 32,223 32,130 – –Debt securities2 29,082 22,808 – –Investments in unlisted managed investment schemes 12,793 9,921 – –Derivative fi nancial assets 2,251 1,873 – –Other fi nancial assets3 179 242 – –
Total investments in fi nancial assets measured at fair value through profi t or loss 76,528 66,974 – –
Investments in fi nancial assets measured at amortised cost Loans and advances – to subsidiaries – – 767 836 Loans and advances4 11,254 10,202 – –Debt securities – held to maturity 1,651 733 – –
Total investments in fi nancial assets measured at amortised cost 12,905 10,935 767 836
Investments in controlled entities5 – – 10,807 7,072
Other fi nancial liabilities Derivative fi nancial liabilities 1,155 718 – –Collateral deposits held6 1,449 2,344 – –
Total other fi nancial liabilities 2,604 3,062 – –
Footnote: 1 Investments measured at fair value through profi t or loss are mainly assets of the life entities’ statutory funds and controlled entities of the
life entities’ statutory funds.2 Included within debt securities are assets held to back the liability for collateral deposits held in respect of debt security repurchase
arrangements entered into by the life entities’ statutory funds and the controlled entities of the life entities’ statutory funds.3 Other fi nancial assets include investments of the life entities’ statutory funds and controlled entities of the life entities’ statutory funds.4 Loans and advances include securitised assets of $4,900m (2010: $4,953m) after allowing for amortisation of the initial assets securitised.
During the year, loans of $1,402m (2010: $402m) were transferred into securitisation vehicles.5 During the year the parent entity subscribed to additional capital in AMP Group Holdings Limited of $3,700m in connection with the acquisition
of AXA Asia Pacifi c Holdings Limited and additional capital in AMP Bank Limited of $35m.6 Collateral deposits held represents the obligation to repay collateral held in respect of debt security repurchase arrangements entered into by
the life entities’ statutory funds and the controlled entities of the life entities’ statutory funds.
For
per
sona
l use
onl
y

65
12. Investment property
Consolidated Parent
2011$m
2010$m
2011$m
2010$m
Investment property Directly held 7,424 7,122 – –
Total investment property 7,424 7,122 – –
Movements in investment property Balance at the beginning of the year 7,122 7,832 – –Additions – subsequent expenditure recognised in carrying amount 85 123 – –Acquisitions (disposal) through business combinations1 11 (835) – –Disposals1 (21) (197) – –Net gains (losses) from fair value adjustments 176 290 – –Foreign currency exchange differences 2 (12) – –Transfer from inventories 49 4 – –Transfer (to) inventories – (83) – –
Balance at the end of the year2 7,424 7,122 – –
Footnote: 1 Additions (disposals) through business combinations relate to the assets included on acquisition of AXA APH (2010: mainly to transactions of
investment entities in which the life entities’ statutory funds hold a controlling equity interest).2 Investment property of $1,362m (2010: $1,418m) held by controlled entities of the statutory funds of AMP Life has been provided as security
against borrowings of these controlled entities of the life entities’ statutory funds.
Valuation of investment propertyInvestment property is measured at fair value at each reporting date. Fair value represents the amount at which the assets could be exchanged between a knowledgeable willing buyer and a knowledgeable willing seller in an arm’s length transaction.
Fair values of the AMP group’s properties are determined by independent registered valuers who have appropriate registered professional qualifi cations and recent experience in the location and category of the property being valued.
The fair value appraisals are obtained on a rolling annual basis. The valuation schedule may be altered when a property is either undergoing or being appraised for redevelopment, refurbishment or sale, or is experiencing other changes in assets or tenant profi les which may signifi cantly impact value: or when there have been signifi cant changes in the property market and broader economy such as updates to comparable property sales which may have an impact on the individual asset values. The carrying value of each investment property is assessed at reporting date, to ensure there has been no material change to the fair value since the valuation date.
The valuers apply ‘comparable sales analysis’ and the ‘capitalised income approach’ by reference to annual net market income, comparable capitalisation rates and other property-specifi c adjustments as well as discounted cash fl ow analysis where the expected net cash fl ows are discounted to their present value using a market determined risk adjusted discount rate. The fair value of investment property does not refl ect future capital expenditure that will improve or enhance the property.
Consolidated Parent
2011$m
2010$m
2011$m
2010$m
Primary assumptions used in valuing investment property Capitalisation rates 6.00%–10.25% 6.25%–9.75% – –Market determined, risk adjusted discount rate 9.00%–13.00% 7.00%–10.35% – –
For
per
sona
l use
onl
y

Notes to the fi nancial statementsfor the year ended 31 December 2011 continued
AMP Financial Report 2011
66
13. Property, plant and equipment
Consolidated
Owner- occupied
property1
$m
Leasehold improvements
$m
Plant and equipment2
$mTotal
$m
2011Property, plant and equipment Gross carrying amount 311 74 322 707Less: accumulated depreciation and impairment losses – (60) (168) (228)
Property, plant and equipment at written down value 311 14 154 479
Movements in property, plant and equipment Balance at the beginning of the year 301 15 136 452Additions – through direct acquisitions – 5 24 29 – subsequent expenditure recognised in carrying amount 4 – – 4 Acquisitions through business combinations – – 22 22 Increases (decreases) from revaluations recognised directly in equity 9 – – 9Depreciation expense for the year (3) (6) (28) (37)
Balance at the end of the year 311 14 154 479
2010 Property, plant and equipment Gross carrying amount 301 72 300 673 Less: accumulated depreciation and impairment losses – (57) (164) (221)
Property, plant and equipment at written down value 301 15 136 452
Movements in property, plant and equipment Balance at the beginning of the year 301 20 154 475 Additions – through direct acquisitions – – 18 18 – subsequent expenditure recognised in carrying amount 4 1 – 5 Disposals – – (3) (3)Increases (decreases) from revaluations recognised directly in equity (1) – – (1)Depreciation expense for the year (3) (6) (32) (41)Foreign currency exchange differences – – (1) (1)
Balance at the end of the year 301 15 136 452
Footnote: 1 Owner-occupied property is measured at fair value; had the asset been measured at historic cost the amortised carrying value would have
been $200m (2010: $199m).2 Plant and equipment includes operating assets of investment entities controlled by the life entities’ statutory funds which carry out business
operations unrelated to the core wealth management operations of the AMP group.
For
per
sona
l use
onl
y

67
14. Intangibles
ConsolidatedGoodwill1
$m
Capitalised costs
$m
Management rights
$m
Value of in-force
business$m
Distribution networks
$m
Other intangibles
$mTotal
$m
2011 Intangibles Gross carrying amount 2,919 571 16 1,191 138 161 4,996Less: accumulated amortisation and/or impairment losses (104) (400) (1) (77) (10) (57) (649)
Intangibles at written down value 2,815 171 15 1,114 128 104 4,347
Movements in intangibles Balance at the beginning of the year 702 162 20 – – 35 919Additions (reductions) through acquisitions (disposal) of controlled entities2 2,140 – – 1,191 95 94 3,520 Additions through separate acquisition 2 – – – 43 1 46Additions through internal development – 61 – – – – 61 Disposals – – (5) – – – (5)Amortisation expense for the year3 – (50) – (77) (10) (26) (163)Impairment losses4 (29) – – – – – (29)Foreign currency exchange differences – – – – – – –Other movements – (2) – – – – (2)
Balance at the end of the year 2,815 171 15 1,114 128 104 4,347
2010 Intangibles Gross carrying amount 777 512 22 – – 66 1,377 Less: accumulated amortisation and/or impairment losses (75) (350) (2) – – (31) (458)
Intangibles at written down value 702 162 20 – – 35 919
Movements in intangibles Balance at the beginning of the year 730 159 20 – – 37 946 Additions (reductions) through acquisitions (disposal) of controlled entities and other businesses2 (9) – – – – – (9)Additions through separate acquisition – – – – – 3 3 Additions through internal development – 64 – – – – 64 Amortisation expense for the year3 – (51) – – – (10) (61)Impairment losses4 (19) – – – – – (19)Foreign currency exchange differences – – (1) – – – (1)Other movements – (10) 1 – – 5 (4)
Balance at the end of the year 702 162 20 – – 35 919
Footnote: 1 Total goodwill comprises amounts attributable to shareholders of $2,659m (2010: $517m) and attributable to policyholders of $156m
(2010: $185m).2 Additions arose from the purchase of AXA Asia Pacifi c Holdings Limited (refer to Note 3). Disposal of goodwill during 2010 relates to the sale
of an operating business of controlled entities of the life entities’ statutory funds.3 Amortisation expense for the year is included in Operating expenses in the Income statement.4 Impairment of goodwill relates to goodwill of controlled entities of the life entities’ statutory funds, which carry out business operations
unrelated to the core wealth management operations of the AMP group.
For
per
sona
l use
onl
y

Notes to the fi nancial statementsfor the year ended 31 December 2011 continued
AMP Financial Report 2011
68
14. Intangibles continued
Impairment testing of goodwillGoodwill includes balances attributable to shareholders and balances attributable to policyholders in investment entities controlled by the life entities’ statutory funds.
Goodwill attributable to shareholders$2,659m (2010: $517m) of the goodwill is attributable to shareholders and arose from the acquisition of AXA APH in the current year and a previous Life Act Part 9 transfer of life insurance business into the statutory funds of AMP Life. Life Act Part 9 transfer of life insurance business into the statutory funds of AMP Life. Life Act
Each of the businesses acquired included activities conducted in the same business units already operated by AMP. Those business units are Australian Contemporary Wealth Management (CWM), Australian Contemporary Wealth Protection (CWP), Australian Mature, AMP Financial Services New Zealand and AMP Capital and those business units are identifi ed as the cash-generating units for the purpose of assessing goodwill impairment.
For the purposes of impairment testing, the amount is allocated to the cash-generating units as follows:– Australian CWM – goodwill attributable: $1,390m (2010: $387m);– Australian CWP – goodwill attributable: $668m (2010: $65m);– Australian Mature – goodwill attributable: $350m (2010: $65m);– AMP Financial Services New Zealand – goodwill attributable $172m (2010: nil); and– AMP Capital – goodwill attributable $79m (2010: nil).
AMP Capital has other intangible assets of $15m (2010: $20m) with an indefi nite useful life. There were no other intangible assets with indefi nite useful lives allocated to these cash-generating units.
The method used for goodwill impairment testing is ‘fair value less costs to sell’. For each cash-generating unit other than AMP Capital the recoverable amount is determined as the sum of the value of in-force business plus the value of one year’s new business times a multiplier. The recoverable amount for the AMP Capital cash-generating unit is determined based on an observable market price.
Assumptions applied in estimating the value of in-force business and the value of one year’s new business are consistent with the best estimate assumptions used in calculating the policy liabilities of AMP’s life insurance entities except the value of in-force and new business calculation includes a risk discount rate. Note 1(s) and Note 21 provide extensive details with respect to the assumptions, management’s approach to determining the values assigned to each key assumption and their consistency with past experience and external sources of information. Note 1(s) discloses that premium and claim amounts are estimated over the expected life of the in-force policies which varies depending on the nature of the product. Note 21 provides details of discontinuance rates used for projections and the fact that future maintenance and investment expenses are based on unit costs derived from budgeted amounts for the following year and increased in future years for expected rates of infl ation. The value of in-force and new business calculation uses a risk discount rate based on the zero coupon government bond curve of 3.5 per cent–4.6 per cent in Australia (2010: 5.6 per cent) and 2.5 per cent–4.1 per cent in New Zealand (2010: 5.7 per cent) plus a 3 per cent margin (2010: 3 per cent).
The conclusion from the goodwill impairment testing is that there has been no impairment to the amount of the goodwill recognised and there is no reasonably possible change in key assumptions that could cause the carrying amount to exceed the recoverable amount.
Goodwill attributable to policyholdersThe policyholder goodwill has arisen on acquisitions of operating subsidiaries controlled by the life entities’ statutory funds, which carry out business operations unrelated to the core wealth management operations of the AMP group. The goodwill represents the future value of cash fl ows expected to be derived from those operating subsidiaries.
The individual goodwill components are not signifi cant in comparison with the total carrying amount of goodwill attributable to policyholders and therefore impairment testing was carried out on the aggregate carrying amount. Impairment testing resulted in an impairment of $29m recognised during the year ended 31 December 2011 (31 December 2010: $19m) as a result of a decline in projected future cash fl ows in underlying operating subsidiaries controlled by the life entities’ statutory funds. At reporting date, there is no reasonably possible change in key assumptions that could cause the carrying amount to exceed the recoverable amount.
Impairment testing of these goodwill balances is based on each asset’s value in use, calculated as the present value of forecast future cash fl ows from those assets using discount rates of between 12.8 per cent and 16.2 per cent (2010: 13 per cent and 16.8 per cent).
The forecast cash fl ows used in the impairment testing for operating subsidiaries are based on assumptions as to the level of profi tability for each business over the forecast period.
Forecasts for the following 12 months have in each case been extrapolated based on terminal value growth rates of between 3 per cent and 5 per cent per annum (2010: 0–5 per cent per annum). The projected revenues are based on the businesses in their current condition. The assumptions do not include the effects of any future restructuring to which the entity is not yet committed or as a result of future cash outfl ows by the entity that will improve or enhance the entity’s performance.
Shareholders have no direct exposure to movements in goodwill attributable to policyholders. However, due to the impact of the accounting for investments in controlled entities of the life entities’ statutory funds (see Note 1(b)), policyholder asset movements (including goodwill) can impact the net profi t after tax attributable to shareholders. Any impact is temporary in nature, reversing no later than the point at which AMP group ceases to control the investments.F
or p
erso
nal u
se o
nly

69
15. Payables
Consolidated Parent
2011$m
2010$m
2011$m
2010$m
Investment purchases and margin accounts payable 551 66 – –Life insurance and investment contracts in process of settlement 349 181 – –Accrued expenses 112 91 – –Interest payable 34 41 – –Trade creditors 237 80 – –Other payables – subsidiaries – – 97 –– other entities 649 574 1 1
Total payables1,2 1,932 1,033 98 1
Footnote: 1 Total payables include payables of investment entities controlled by the life entities’ statutory funds which carry out business operations
unrelated to the core wealth management operations of the AMP group.2 $45m (2010: $26m) of Total payables of the AMP group is expected to be settled more than 12 months from the reporting date and nil (2010: nil)
of Total payables of the parent is expected to be settled more than 12 months from reporting date.
16. Provisions
Consolidated Parent
2011$m
2010$m
2011$m
2010$m
(a) Provisions Employee entitlements 267 172 3 4 Restructuring 50 2 – –Other 239 79 – –
Total provisions 556 253 3 4
Employee
entitlements1
$m
Restructuring provisions2
$mOther3
$mTotal
$m
(b) Movements in provisions – consolidated Balance at the beginning of the year 172 2 79 253 Additions (reductions) through acquisitions (disposal) of controlled entities 63 55 188 306Additional provisions made during the year 253 56 125 434 Unused amounts reversed during the year (2) (3) (61) (66)Provisions used during the year (219) (60) (92) (371)
Balance at the end of the year 267 50 239 556
(c) Movements in provisions – parent Balance at the beginning of the year 4 – – 4 Additional provisions made during the year 2 – – 2 Unused amounts reversed during the year 1 – – 1 Provisions used during the year (4) – – (4)
Balance at the end of the year 3 – – 3
Footnote: 1 Provisions for employee entitlements are in respect of amounts accumulated as a result of employees rendering services up to the reporting
date. These entitlements include salaries, wages, bonuses, annual leave and long service leave, but exclude share-based payments. $15m (2010: $6m) of the consolidated balance is expected to be settled more than 12 months from the reporting date. $2m (2010: $1m) of the parent balance is expected to be settled more than 12 months from the reporting date.
2 Restructuring provisions are recognised in respect of programs that materially change the scope of the business or the manner in which the business is conducted. $4m (2010: nil) is expected to be settled more than 12 months from the reporting date.
3 Other provisions are in respect of probable outgoings on data quality and integrity projects, settlements, and various other operational provisions. $26m (2010: $5m) is expected to be settled more than 12 months from the reporting date.
For
per
sona
l use
onl
y

Notes to the fi nancial statementsfor the year ended 31 December 2011 continued
AMP Financial Report 2011
70
17. Borrowings
Consolidated Parent
2011$m
2010$m
2011$m
2010$m
Bank overdrafts 4 – – – Bank loans 850 962 – – Bonds and notes 6,228 6,687 – – Deposits1 4,271 3,082 – – Other borrowings 57 60 – –
Total borrowings2 11,410 10,791 – –
Footnote: 1 Deposits mainly comprise at call retail cash on deposit and retail term deposits at variable interest rates within the AMP Bank.2 Total borrowings comprise amounts to fund: i) Corporate and other shareholder activities of AMP group $594m (2010: $764m). Of this balance, $204m (2010: $353m) is expected to be
settled more than 12 months from the reporting date. ii) AMP Bank and securitisation trusts borrowings $9,277m (2010: $8,369m). Of this balance $4,204m (2010: $3,852m) is expected to be
settled more than 12 months from the reporting date. iii) Statutory fund borrowings and borrowings within controlled entities of AMP Life are $1,539m (2010: $1,658m). Of this balance $1,182m
(2010: $1,045m) is expected to be settled more than 12 months from the reporting date.
18. Subordinated debt
Consolidated Parent
2011$m
2010$m
2011$m
2010$m
6.875% GBP Subordinated Guaranteed Bonds (maturity 2022) 63 56 – –Floating Rate Subordinated Unsecured Notes (fi rst call date 2016, maturity 2021)1,2 599 – – –A$ AMP Notes (fi rst call date 2014, maturity 2019)3 199 202 – –NZ$ AMP Notes (fi rst call date 2014, maturity 2019)3 88 87 – –
Total subordinated debt4 949 345 – –
Footnote: 1 During the year, new subordinated debt of $600m was issued. The balance is after deduction of capitalised borrowing costs.2 In the event that AMP does not call the subordinated debt at the fi rst call date the note holders have the right to exchange the notes for AMP
shares at a small discount to volume weighted average price at that time.3 In the event that AMP does not call the subordinated debt at the fi rst call date the note holders have the right to an interest margin 150%
higher than that at issue.4 Subordinated debt amounts are to fund corporate activities of AMP group. All of this balance (2010: all) is expected to be settled more than
12 months from the reporting date.
For
per
sona
l use
onl
y

71
19. Dividends
Consolidated Parent
2011$m
2010$m
2011$m
2010$m
Final dividends paid 2010 fi nal dividend paid in 2011: 15 cents per ordinary share franked to 60% (2009 fi nal dividend paid in 2010: 16 cents per ordinary share franked to 50%) 314 328 314 328
Interim dividends paid 2011: 15 cents per ordinary share franked to 30% (2010: 15 cents per ordinary share franked to 60%) 422 311 422 311
Total dividends paid1,2 736 639 736 639
Final dividends proposed but not recognised2 2011: 14 cents per ordinary share franked to 50% 400 n/a 400 n/a
Consolidated Parent
2011$m
2010$m
2011$m
2010$m
Dividend franking account3,4 Franking credits available to shareholders of AMP Limited (at 30%) 165 123 165 123
Footnote: 1 Total dividends paid includes dividends paid on ‘treasury shares’. See Statement of changes in equity for further information regarding the
impact of ‘treasury shares’ on dividends paid and retained earnings.2 All dividends are franked at a tax rate of 30 per cent.3 The franking credits available to shareholders are based on the balance of the dividend franking account at the reporting date adjusted for: a) franking credits that will arise from the payment of the current tax liability b) franking debits that will arise from the payment of dividends recognised as a liability at the year end c) franking credits that will arise from the receipt of dividends recognised as receivables by the tax consolidated group at the year end d) franking credits that the entity may be prevented from distributing in subsequent years.4 The company’s ability to utilise the franking account credits depends on meeting Corporations Act requirements to declare dividends.
The impact of the proposed dividend will be to reduce the balance of the franking credit account by $85m.
For
per
sona
l use
onl
y

Notes to the fi nancial statementsfor the year ended 31 December 2011 continued
AMP Financial Report 2011
72
20. Contributed equity
Consolidated Parent
2011$m
2010$m
2011$m
2010$m
Movements in issued capital Balance at the beginning of the year 5,209 4,957 5,209 4,957 695,262,564 shares issued for acquisition of AXA Asia Pacifi c Holdings Limited1 3,802 – 3,802 –64,986,020 (2010: 45,779,038) shares issued under dividend reinvestment plan2 286 252 286 252
Balance at the end of the year 9,297 5,209 9,297 5,209
Total issued capital 2,854,672,784 (2010: 2,094,424,200) ordinary shares fully paid 9,297 5,209 9,297 5,209
Movements in ‘treasury shares’ Balance at the beginning of the year (158) (143) – –1,907,975 (increase) arising from acquisition of AXA Asia Pacifi c Holdings Limited (10) – – –38,745,543 (increase) decrease due to purchases less sales during the year (49) (15) – –
Balance at the end of the year (217) (158) – –
Total treasury shares 40,653,518 (2010: 26,375,450) treasury shares (217) (158) – –
Total contributed equity 2,814,019,266 (2010: 2,068,048,750) ordinary shares fully paid3,4 9,080 5,051 9,297 5,209
Holders of ordinary shares have the right to receive dividends as declared and, in the event of the winding up of the company, to participate in the proceeds from the sale of all surplus assets in proportion to the number of and amounts paid up on shares held. Fully paid ordinary shares carry the right to one vote per share. Ordinary shares have no par value.
Footnote: 1 Shares issued to minority shareholders of AXA Asia Pacifi c Holdings Limited for the acquisition of its business recognised at fair value of
$3,803m less deduction for costs of issue $1m – refer to Note 3 for further details.2 Under the terms of the Dividend Reinvestment Plan (DRP), shareholders may elect to have all or part of their dividend entitlements satisfi ed by
the issue of new shares rather than being paid cash. Shares were issued under the DRP for the 2010 fi nal dividend (paid in April 2011) at $5.34 per share, 2011 interim dividend (paid in October 2011) at $3.91 per share.
3 Of the ordinary shares on issue by AMP Limited, AMP’s life insurance entities hold 38,901,250 (2010: 26,375,450) shares on behalf of policyholders. ASIC has granted relief from restrictions in the Corporations Act 2001 to allow AMP’s life insurance entities to hold and trade shares in AMP Limited as part of the policyholder funds’ investment activities. The cost of the investment in these ‘treasury shares’ is refl ected as a deduction from total contributed equity.
4 Of the ordinary shares 1,752,268 are held by a controlled entity of AXA Asia Pacifi c Holdings Limited.
For
per
sona
l use
onl
y

73
21. Life insurance contracts
The AMP group’s life insurance related activities are conducted through two registered life insurance companies, AMP Life Limited (AMP Life) and, from 30 March 2011, The National Mutual Life Association of Australasia Limited (NMLA).
(a) Assumptions and methodology applied in the valuation of life insurance contract liabilities Life insurance contract liabilities, and hence the net profi t from life insurance contracts, are calculated by applying the principles of Margin on Services (MoS). Refer to Note 1(s) for a description of MoS and the methods for calculating life insurance contract liabilities.
The methods and profi t carriers used to calculate life insurance contract liabilities for particular policy types are as follows:
Business type Method Profi t carriers (for business valued using projection method)
AMP Life
Conventional Projection Bonuses
Investment account Modifi ed accumulation n/a
Risk (lump sum) Projection/accumulation Expected premiums
Risk (income benefi ts) Projection/accumulation Expected claims
Participating allocated annuities Accumulation/modifi ed accumulation n/a
Life annuities Projection Annuity payments
NMLA
Traditional participating Projection Bonuses
Traditional non-participating Projection Claim payments
Investment account (excl. large group plans) Projection Account balance
Investment account (large group plans) Accumulation n/a
Individual lump sum insurance Projection Premium income
Individual disability income Projection Claim payments
Group lump sum insurance Accumulation n/a
Group disability income Accumulation n/a
Life annuities Projection Annuity payments
For
per
sona
l use
onl
y

Notes to the fi nancial statementsfor the year ended 31 December 2011 continued
AMP Financial Report 2011
74
21. Life insurance contracts continued
Key assumptions used in the calculation of life insurance contract liabilities are as follows:
(i) Risk-free discount rates Except where benefi ts are contractually linked to the performance of the assets held, a risk-free discount rate based on current observable, objective rates that relate to the nature, structure and term of the future obligations is used. The rates are determined as shown in the following table1.
31 December 2011 31 December 2010
Business type Basis Australia New Zealand Australia New Zealand
AMP Life
Retail risk (other than income protection open claims)
10-year government bond rate n/a n/a 5.6% 6.0%
Zero coupon government bond curve
3.2%–4.6% 2.5%–4.1% n/a n/a
Group and retail risk (income protection open claims)
2-year government bond rate n/a n/a 5.2% n/a
10-year government bond rate (+30bps for NZ 2011)
n/a 4.1% n/a 6.0%
Zero coupon government bond curve (+55bps for Aus 2011)
3.8%–5.2% n/a n/a n/a
Life annuities Non-CPI Zero coupon inter-bank swap curve n/a n/a 4.9%–6.3% 3.1%–6.0%
Zero coupon government bond curve (+70bps for Aus and +40bps for NZ)
3.8%–5.1% 2.8%–4.8% n/a n/a
CPI Commonwealth Indexed Bond curve (+20bps for 2010 and +70bps for Aus and +40bps for NZ 2011)
1.5%–2.2% 1.3% 2.8%–3.0% 2.8%
NMLA
Retail risk (other than income protection open claims)
Risk-free yield curve 3.2%–4.6% 2.5%–4.1% n/a n/a
Income protection Open claims
Risk-free yield curve (+55bps for Aus and +30 bps for NZ)
3.7%–5.1% 2.8%–4.4% n/a n/a
Group risk Open claims
Risk-free yield curve (+55bps for Aus and +30bps for NZ)
3.7%–5.1% 2.8%–4.4% n/a n/a
Life annuities Zero coupon government bond yield curve + 40bps
n/a 2.9%–4.5% n/a n/a
Footnote:1 The basis of the risk-free discount rates for risk products has changed from a single bond rate to a bond curve during 2011 as part of the
alignment of economic assumptions used by AMP Life and NMLA.
For
per
sona
l use
onl
y

75
21. Life insurance contracts continued
(ii) Participating business discount ratesWhere benefi ts are contractually linked to the performance of the assets held, as is the case for participating business, a discount rate based on the expected market return on backing assets is used. The assumed earning rates for backing assets for participating business are largely driven by long-term (e.g. 10-year) government bond yields. The 10-year government bond yields used at the relevant valuation dates are as shown below.
Assumed earning rates for each asset sector are determined by adding to the bond yield various risk premia which refl ect the relative differences in expected future earning rates for different asset sectors. For products backed by mixed portfolio assets, the assumption varies with the proportion of each asset sector backing the product. The risk premia applicable at the valuation date are shown in the table below.
10-year government bonds
Local equities
International equities Property
Fixed interest Cash
Australia 31 December 2011 AMP Life 3.7% 4.5% 3.5% 2.5% 0.8% (0.5%) NMLA 3.7% 4.5% 3.5% 2.5% 0.8% (0.5%)31 December 2010 AMP Life 5.6% 4.1% 2.5% 2.0% 0.5% (0.5%)
New Zealand 31 December 2011 AMP Life 3.8% 4.5% 3.5% 2.5% 0.8% (0.5%) NMLA 3.8% 4.5% 3.5% 2.5% 0.8% (0.5%)31 December 2010 AMP Life 6.0% 4.5% 2.5% 2.0% 0.5% (0.5%)
The risk premia for local equities includes allowance for imputation credits. The risk premia for fi xed interest refl ects credit ratings of the portfolio held.
The averages of the asset mixes assumed for the purpose of setting future investment assumptions for participating business at the valuation date are as shown in the table below for each life company. These asset mixes are not necessarily the same as the actual asset mix at the valuation date as they refl ect long-term assumptions.
Equities PropertyFixed
interest Cash
Australia 31 December 2011 AMP Life 30% 11% 39% 20% NMLA 37% 13% 35% 15%31 December 2010 AMP Life 30% 11% 39% 20%
New Zealand 31 December 2011 AMP Life 40% 17% 37% 6% NMLA 48% 2% 40% 10%31 December 2010 AMP Life 40% 17% 37% 6%
Where an assumption used is net of tax, the tax on investment income is allowed for at rates appropriate to the class of business and asset sector, including any allowance for imputation credits on equity income. For this purpose, the total return for each asset sector is split between income and capital gains. The actual split has varied at each valuation date as the total return has varied.
(iii) Future participating benefi tsFor participating business, the total value of future bonuses (and the associated shareholder’s profi t margin) included in life insurance contract liabilities is the amount supported by the value of the supporting assets, after allowing for the assumed future experience. The pattern of bonuses and shareholders’ profi t margin assumed to emerge in each future year depends on the assumed relationship between reversionary bonuses (or interest credits) and terminal bonuses. This relationship is set to refl ect the philosophy underlying actual bonus declarations.
Actual bonus declarations are determined to refl ect, over time, the investment returns of the particular fund and other factors in the emerging experience and management of the business. These factors include:– allowance for an appropriate degree of benefi t smoothing– reasonable expectations of policyholders– equity between generations of policyholders applied across different classes and types of business– ongoing solvency and capital adequacy.
Given the many factors involved, the range of bonus structures and rates for participating business is extremely diverse.For
per
sona
l use
onl
y

Notes to the fi nancial statementsfor the year ended 31 December 2011 continued
AMP Financial Report 2011
76
21. Life insurance contracts continued
Typical supportable bonus rates on major product lines are as follows for AMP Life and NMLA (31 December 2010 AMP Life in parentheses).
Bonus on sum insured Bonus on existing bonuses
Reversionary bonus Australia 0.2%–1.4% (0.7%–1.6%) 0.4%–2.0% (1.1%–2.3 %)New Zealand 0.3%–0.5% (0.8%–1.1%) 0.3%–0.5% (0.8%–1.1%)
Terminal bonusThe terminal bonus scales are complex and vary by duration, product line, class of business and country for AMP Life and NMLA.
Crediting rates (investment account)Australia 1.5%–9.8% (3.10%–10.3%) New Zealand 2.4%–5.5% (3.3%–5.5%)
(iv) Future maintenance and investment expenses Unit maintenance costs are based on budgeted expenses in the year following the reporting date (including GST, as appropriate, and excluding one-off expenses). For future years, these are increased for infl ation as described in (v) below. These expenses include fees charged to the life statutory funds by service companies in AMP Life and NMLA. Unit costs vary by product line and class of business based on an apportionment that is supported by expense analyses.
Future investment expenses are based on the fees currently charged by the asset managers.
(v) Infl ation and indexationBenefi ts and premiums under many regular premium policies are automatically indexed by the published consumer price index (CPI). Assumed future take-up of these indexation options is based on AMP Life and NMLA’s own experience with the annual CPI rates derived from the difference between long-term government bonds and indexed government bonds.
The assumptions for expense infl ation have regard to these rates, recent expense performance, AMP Life and NMLA’s current plans and the terms of the relevant service company agreement, as appropriate.
The assumed annual infl ation and indexation rates at the valuation date are:
Australia New Zealand
31 December 2011 AMP Life and NMLA 2.6% CPI, 3.0% Expenses 2.5% CPI, 3.0% Expenses31 December 2010 AMP Life 2.9% CPI, 3.0% Expenses 3.3% CPI, 3.0% Expenses
(vi) Bases of taxationThe bases of taxation (including deductibility of expenses) are assumed to continue in accordance with legislation current at the valuation date.
(vii) Voluntary discontinuanceAssumptions for the incidence of withdrawals, paid ups and premium dormancy are primarily based on investigations of AMP Life and NMLA’s own experiences over the past three years. These rates are based upon the assessed global rate for each of the individual products (or product groups) and then, where appropriate, further adjusted for duration, smoker status, age attained or short-term market and business effects. Given the variety of infl uences affecting discontinuance for different product groups, the range of voluntary discontinuance rates across AMP Life and NMLA are extremely diverse.
Future rates of discontinuance for the major classes of life insurance contracts are assumed to be as shown in the table below.
31 December 2011 31 December 2010
Business type Life company Australia New Zealand Australia New Zealand
Conventional AMP Life 2.1%–3.0% 1.3% -2.5% 2.1%–3.0% 1.3%–2.5% NMLA 3.6%–4.1% 4.2%–4.9% n/a n/a
Investment account NMLA 5.2%–23.9% 7.0%–8.0% n/a n/a
Individual risk NMLA 8.0%–8.9% 10.3%–10.6% n/a n/a
Individual IP NMLA 8.0%–9.4% 10.3%–10.6% n/a n/a
Retail risk AMP Life 10.5%–11.0% 10.5%–12.0% 10.5%–11.0% 10.5%–12.0%
FLS risk business (ultimate rate) AMP Life 7.5%–9.0% n/a 7.5%–9.0% n/a
For
per
sona
l use
onl
y

77
21. Life insurance contracts continued
(viii) Surrender valuesThe surrender bases assumed for calculating surrender values are those current at the reporting date. There have been no changes to the bases during the year (or the prior year) that would materially affect the valuation results.
(ix) Mortality and morbidity Standard mortality tables, based on national or industry-wide data, are used (e.g. IA95-97, IM(F)L00, IA90-92 and PN80 in Australia and New Zealand). These are then adjusted by factors that take account of AMP Life and NMLA’s own experiences, primarily over the past three years. For annuity business, adjustment is also made for mortality improvements prior to and after the valuation date.
Rates of mortality assumed at 31 December 2011 for AMP Life are unchanged from those assumed at 31 December 2010 in Australia and New Zealand, except for:– Australian conventional business – reduced from 75 per cent to 67.5 per cent of IA95-97– annuitant mortality – base mortality table (prior to amendment for some specifi c AMP experience) changed from IM80/IF80
to IM00/IF00.
Typical mortality assumptions, in aggregate, are as follows:
Conventional – % of IA95-97 (AMP Life)
Conventional – % of IA90-92 (NMLA)
Term – % of IA95-97 (AMP Life)
FLS Risk – % of IA95-97 (AMP Life)
Individual – % of IA90-92 (NMLA)
Male Female Male Female Male Female Male Female Male Female
Risk products Australia 67.5% 67.5% 60% 68% 63% 63% 63% 63% 60% 60%–64%New Zealand 73% 73% 81% 95% 63% 63% 63% 63% 68% 60%–77%
AMP Life NMLA
Male – % of IML00* Female – % of IFL00* Male – % of PNML00 Female – % of PNFL00
Annuities Australia and New Zealand 95% 80% 80% 80%
For disability income business, the claim assumptions are currently based on IAD89-93, which is derived from Australian experience. It is adjusted for AMP Life and NMLA’s experience, with the adjustment dependent on age, sex, waiting period, occupation, smoking status and claim duration. Incidence and termination rates have both changed for Australia and New Zealand from those at 31 December 2010 for AMP Life.
Typical morbidity assumptions, in aggregate, are as follows:
Incidence rates – % of IAD89-93
(AMP Life)
Incidence rates – % of IAD89-93
(NMLA)
Termination rates (ultimate) –
% of IAD89-93(AMP Life)
Termination rates (ultimate) –
% of IAD89-93 (NMLA)
Income protection Australia 87% 60%–253% 94% 18%–235%New Zealand 60% 30%–312% 90% 66%–172%
For trauma cover, standard tables are not available and so assumptions are mostly based on Australian population statistics, with adjustment for smoking status as well as AMP Life and NMLA’s recent claim experiences. Assumptions at 31 December 2011 are unchanged from those used at 31 December 2010 for AMP Life.
The Actuarial tables used were as follows:
IA95-97 A mortality table developed by the Institute of Actuaries of Australia based on Australian insured lives experience from 1995–1997.
IA90-92 A mortality table developed by the Institute of Actuaries of Australia based on Australian insured lives experience from 1990–1992.
IML00*/IFL00* IML00 and IFL00 are mortality tables developed by the Institute of Actuaries and the Faculty of Actuaries based on United Kingdom annuitant lives experience from 1999–2002. The tables refer to male and female lives respectively and incorporate factors that allow for mortality improvements since the date of the investigation.
IML00* and IFL00* are these published tables amended for some specifi c AMP experience.
PNML/PNFL The UK 00 series tables represent the latest annuitant/pensioner experience and therefore replace the 80 series tables, which are based on experience from 1979 to 1982. Pensioner tables are used given that the NZ annuitants did not voluntarily obtain annuities as they received one automatically from their pension plan.
IAD89-93 A disability table developed by the Institute of Actuaries of Australia based on the Australian disability income experience for the period 1989–1993.
For
per
sona
l use
onl
y

Notes to the fi nancial statementsfor the year ended 31 December 2011 continued
AMP Financial Report 2011
78
21. Life insurance contracts continued
(x) Impact of changes in assumptions Under MoS, for life insurance contracts valuations using the projection method, changes in actuarial assumptions are recognised by adjusting the value of future profi t margins in life insurance contract liabilities. Future profi t margins are released over future periods.
Changes in actuarial assumptions do not include market related changes in discount rates such as changes in benchmark market yields caused by changes in investment markets and economic conditions. These are refl ected in both life insurance contract liabilities and asset values at the reporting date.
The impact on future profi t margins of changes in actuarial assumptions from 31 December 2010 to 31 December 2011 (AMP Life) and from 30 March 2011 to 31 December 2011 (NMLA) in respect of life insurance contracts (excluding new business contracts which are measured using assumptions at reporting date) is as shown in the table below for the two life companies.
AMP Life
1 January 2011–31 December 2011
NMLA
31 March 2011–31 December 2011
Assumption change
Change in future profi t
margins$m
Change in life insurance
contract liabilities$m
Change in shareholders’
profi t and equity$m
Change in future profi t
margins$m
Change in life insurance
contract liabilities$m
Change in shareholders’
profi t and equity$m
Non-market related changes to discount rates1 (111) 1 1 (30) – –Mortality and morbidity (32) – – – – –Discontinuance rates – – – – 1 (1)Maintenance expenses (11) – – 34 (1) 1Other assumptions2 32 – – 2 (1) (12)
Footnote:1 The change in future profi t margins for AMP Life refl ects the impact of moving the risk discount rate from the 10-year government bond rate
to zero coupon government bond curve as per Note 21(i).2 Other assumptions changes for AMP Life include the impact of actual and planned premium rate changes.
In most cases, the overall amount of life insurance contract liabilities and the current period profi t are not affected by changes in assumptions. However, where in the case of a particular related product group, the changes in assumptions at the end of a period eliminate any future profi t margins for the related product group, and results in negative future profi t margins, this negative balance is recognised as a loss in the current period. If the changes in assumptions in a period are favourable for a product group currently in loss recognition, then the previously recognised losses are reversed in the period.
(b) Insurance risk sensitivity analysis – life insurance contractsFor life insurance contracts that are accounted for under MoS, amounts of liabilities, income or expense recognised in the period are unlikely to be sensitive to changes in variables even if those changes may have an impact on future profi t margins.
This table shows information about the sensitivity of life insurance contract liabilities for AMP Life and NMLA, current shareholder period profi t after income tax, and equity, to a number of possible changes in assumptions relating to insurance risk.
Change in life insurance contract liabilities
Change in shareholder profi t after income tax, and equity
Variable Change in variable
Gross of reinsurance
$m
Net of reinsurance
$m
Gross of reinsurance
$m
Net of reinsurance
$m
AMP LifeMortality 10% increase in mortality rates (1) (1) 1 1Annuitant mortality 50% increase in the rate of mortality improvement 1 1 (1) (1)Morbidity – lump sum disablement 20% increase in lump sum disablement rates – – – –Morbidity – disability income 10% increase in incidence rates – – – –Morbidity – disability income 10% decrease in recovery rates – – – –Discontinuance rates 10% increase in discontinuance rates – – – –Maintenance expenses 10% increase in maintenance expenses – – – –
NMLAMortality1 10% increase in mortality rates – – – –Annuitant mortality1 50% increase in the rate of mortality improvement – – – –Morbidity – lump sum disablement1 20% increase in lump sum disablement rates – – – –Morbidity – disability income1 10% increase in incidence rates 112 110 (78) (77)Morbidity – disability income1 10% decrease in recovery rates 215 202 (151) (141)Discontinuance rates1 10% increase in discontinuance rates 22 21 (15) (15)Maintenance expenses1 10% increase in maintenance expenses 25 25 (18) (18)
Footnote:1 At 31 December 2011, changes in actuarial assumptions have fully absorbed future profi t margins on NMLA’s disability income products.
Any further adverse change to assumptions for these products would therefore be recognised as a loss in the Income statement for the period. Any improvement in the assumptions for these products would be recognised initially as a reversal of the previously recognised loss.
For
per
sona
l use
onl
y
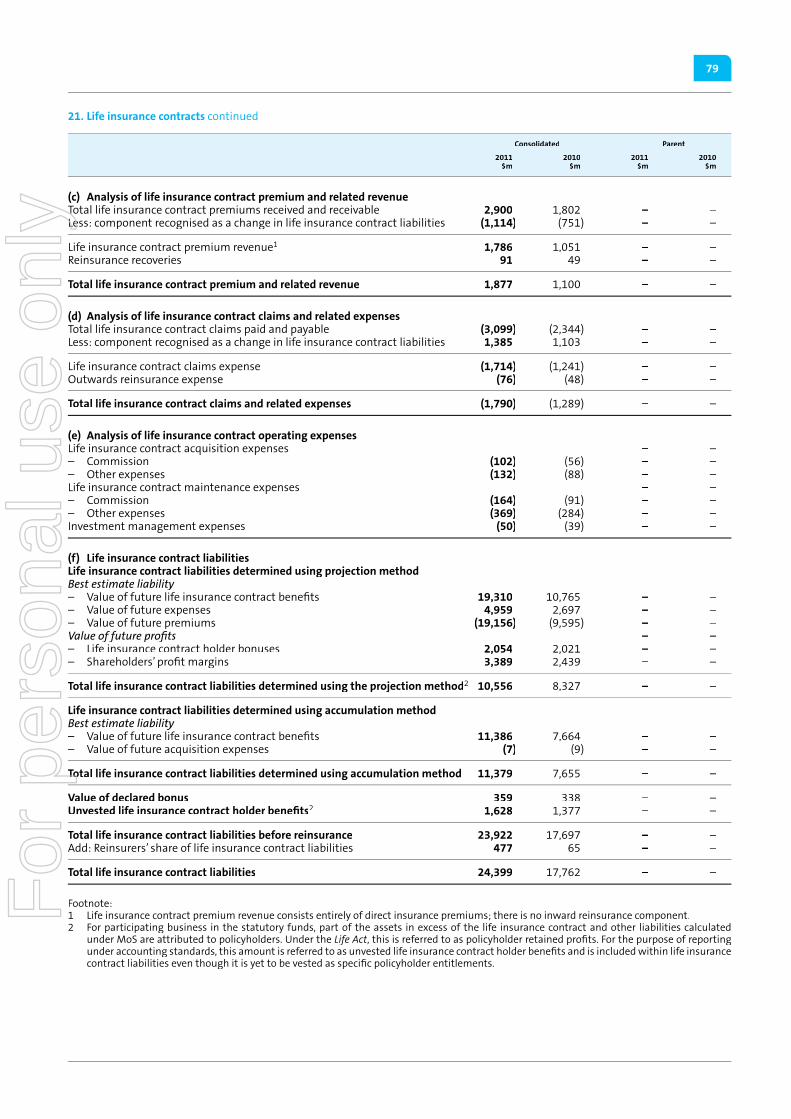
79
21. Life insurance contracts continued
Consolidated Parent
2011$m
2010$m
2011$m
2010$m
(c) Analysis of life insurance contract premium and related revenue Total life insurance contract premiums received and receivable 2,900 1,802 – –Less: component recognised as a change in life insurance contract liabilities (1,114) (751) – –
Life insurance contract premium revenue1 1,786 1,051 – –Reinsurance recoveries 91 49 – –
Total life insurance contract premium and related revenue 1,877 1,100 – –
(d) Analysis of life insurance contract claims and related expenses Total life insurance contract claims paid and payable (3,099) (2,344) – –Less: component recognised as a change in life insurance contract liabilities 1,385 1,103 – –
Life insurance contract claims expense (1,714) (1,241) – –Outwards reinsurance expense (76) (48) – –
Total life insurance contract claims and related expenses (1,790) (1,289) – –
(e) Analysis of life insurance contract operating expenses Life insurance contract acquisition expenses – –– Commission (102) (56) – –– Other expenses (132) (88) – –Life insurance contract maintenance expenses – –– Commission (164) (91) – –– Other expenses (369) (284) – –Investment management expenses (50) (39) – –
(f) Life insurance contract liabilities Life insurance contract liabilities determined using projection method Best estimate liability – Value of future life insurance contract benefi ts 19,310 10,765 – –– Value of future expenses 4,959 2,697 – –– Value of future premiums (19,156) (9,595) – –Value of future profi ts – –– Life insurance contract holder bonuses 2,054 2,021 – –– Shareholders’ profi t margins 3,389 2,439 – –
Total life insurance contract liabilities determined using the projection method2 10,556 8,327 – –
Life insurance contract liabilities determined using accumulation method Best estimate liability – Value of future life insurance contract benefi ts 11,386 7,664 – –– Value of future acquisition expenses (7) (9) – –
Total life insurance contract liabilities determined using accumulation method 11,379 7,655 – –
Value of declared bonus 359 338 – –Unvested life insurance contract holder benefi ts2 1,628 1,377 – –
Total life insurance contract liabilities before reinsurance 23,922 17,697 – –Add: Reinsurers’ share of life insurance contract liabilities 477 65 – –
Total life insurance contract liabilities 24,399 17,762 – –
Footnote: 1 Life insurance contract premium revenue consists entirely of direct insurance premiums; there is no inward reinsurance component.2 For participating business in the statutory funds, part of the assets in excess of the life insurance contract and other liabilities calculated
under MoS are attributed to policyholders. Under the Life Act, this is referred to as policyholder retained profi ts. For the purpose of reporting under accounting standards, this amount is referred to as unvested life insurance contract holder benefi ts and is included within life insurance contract liabilities even though it is yet to be vested as specifi c policyholder entitlements.
For
per
sona
l use
onl
y

Notes to the fi nancial statementsfor the year ended 31 December 2011 continued
AMP Financial Report 2011
80
21. Life insurance contracts continued
Consolidated Parent
2011$m
2010$m
2011$m
2010$m
(g) Reconciliation of changes in life insurance contract liabilities Total life insurance contract liabilities at the beginning of the year 17,762 18,380 – –Additions through the acquisition of the AXA APH Australia and New Zealand businesses 6,840 – – –Change in life insurance contract liabilities recognised in the Income statement (25) (202) – –Premiums recognised as an increase in life insurance contract liabilities 1,114 751 – –Claims recognised as a decrease in life insurance contract liabilities (1,385) (1,103) – –Change in reinsurers share of life insurance contract liabilities 69 21 – –Foreign exchange adjustment 24 (85) – –
Total life insurance contract liabilities at the end of the year 24,399 17,762 – –
(h) Life insurance risk The life insurance activities of AMP Life and NMLA involve a number of non-fi nancial risks concerned with the pricing, acceptance and management of the mortality, morbidity and longevity risks accepted from policyholders, often in conjunction with the provision of wealth management products.
The design of products carrying insurance risk is managed to ensure that policy wording and promotional materials are clear, unambiguous and do not leave AMP Life and NMLA open to claims from causes that were not anticipated. Product prices are set through a process of fi nancial analysis, including review of previous AMP Life and NMLA and industry experience and specifi c product design features. The variability inherent in insurance risk including concentration risks is managed by having a large geographically diverse portfolio of individual risks, underwriting and the use of reinsurance.
Underwriting is managed through a dedicated underwriting department, with formal underwriting limits and appropriate training and development of underwriting staff. Individual policies carrying insurance risk are underwritten on their merits and are generally not issued without having been examined and underwritten individually. Individual policies which are transferred from a group scheme are generally issued without underwriting. Group risk insurance policies meeting certain criteria are underwritten on the merits of the employee group as a whole.
Claims are managed through a dedicated claims management team, with formal claims acceptance limits and appropriate training and development of staff to ensure payment of all genuine claims. Claims experience is assessed regularly and appropriate actuarial reserves are established to refl ect up-to-date experience and any anticipated future events. This includes reserves for claims incurred but not yet reported.
AMP Life and NMLA reinsure (cede) to specialist reinsurance companies a proportion of its portfolio or certain types of insurance risk, including catastrophe. This serves primarily to:– reduce the net liability on large individual risks– obtain greater diversifi cation of insurance risks – provide protection against large losses.
The specialist reinsurance companies are regulated by APRA or industry regulators in other jurisdictions and have strong credit ratings from A– to AA+.
For
per
sona
l use
onl
y

81
21. Life insurance contracts continued
Terms and conditions of life insurance contractsThe nature of the terms of the life insurance contracts written by AMP Life and NMLA is such that certain external variables can be identifi ed on which related cash fl ows for claim payments depend. The table below provides an overview of the key variables upon which the timing and uncertainty of future cash fl ows of the various life insurance contracts issued by AMP Life and NMLA depend.
Type of contract Detail of contract workings Nature of compensation for claimsKey variables affecting future cash fl ows
Non-participating life insurance contracts with fi xed and guaranteed terms (term life and disability and yearly renewable)
These policies provide guaranteed benefi ts, which are paid on the death or ill-health, that are fi xed and not at the discretion of the Life Company. Premium rates for yearly renewable business are not guaranteed and may be changed at Life Company’s discretion for the portfolio as a whole.
Benefi ts, defi ned by the insurance contract, are not directly affected by the performance of underlying assets or the performance of any associated investment contracts as a whole.
Mortality, morbidity, lapses, expenses and market earning rates on assets backing the liabilities.
Life annuity contracts In exchange for an initial single premium, these policies provide a guaranteed regular income for the life of the insured.
The amount of the guaranteed regular income is set at inception of the policy including any indexation.
Longevity, expenses and market earning rates on assets backing the liabilities.
Conventional life insurance contracts with discretionary participating benefi ts (endowment and whole of life)
These policies combine life insurance and savings. The policyholder pays a regular premium and receives the specifi ed sum assured plus any accruing bonuses on death or maturity. The sum insured is specifi ed at inception and guaranteed. Reversionary bonuses are added annually, which once added (vested) are guaranteed. A further terminal bonus may be added on surrender, death or maturity.
Benefi ts arising from the discretionary bonuses are based on the performance of a specifi ed pool of contracts and the assets supporting these contracts.
Market earning rates on assets backing the liabilities, interest rates, lapses, expenses, and mortality.
AMP Life Investment account contracts with discretionary participating features
The gross value of premiums received is invested in the investment account with fees and premiums for any associated insurance cover being deducted from the account balance. Interest is credited regularly.
The payment of the account balance is generally guaranteed, although it may be subject to certain penalties on early surrender or limited adjustment in adverse markets. Operating profi t arising from these contracts is allocated between the policyholders and shareholders in accordance with the Life Act. The amount allocated to policyholders is held as an unvested policy liability until it is distributed to specifi c policyholders as interest credits.
Fees, lapses, expenses and market earning rates on the assets backing the liabilities, interest rates.
NMLA Investment account contracts with discretionary participating features
The gross value of premiums received is invested in a unitised pool of assets. Fees and premiums for any associated insurance cover are deducted from the account balance when due. Interest is credited and is guaranteed to be at least zero (after fees).
Payment of the account balance is generally guaranteed. Penalties may apply on early surrender particularly in adverse markets. Bonuses are credited to the account balance based on the performance of assets supporting these contracts.
Fees, discontinuance rates, expenses and investment returns on the assets backing the liabilities.
(i) Liquidity risk and future net cash outfl owsThe table below shows the estimated timing of future net cash outfl ows resulting from insurance contract liabilities. This includes estimated future surrenders, death/disability claims and maturity benefi ts, offset by expected future premiums or contributions and reinsurance recoveries. All values are discounted to the reporting date using the assumed future investment earning rate for each product.
Total AMP Life and NMLA
Up to 1 year
$m
1 to 5 years
$m
Over 5 years
$mTotal
$m
2011 1,029 2,532 7,453 11,0142010 (AMP Life only) 903 2,416 5,420 8,739
For
per
sona
l use
onl
y

Notes to the fi nancial statementsfor the year ended 31 December 2011 continued
AMP Financial Report 2011
82
22. Other life insurance and investment contract disclosures
Consolidated
2011$m
2010$m
(a) Analysis of life insurance and investment contract profi t Components of profi t related to life insurance and investment contract liabilities: – Planned margins of revenues over expenses released 478 410 – Profi ts (losses) arising from difference between actual and assumed experience 114 18 – Capitalised (losses) reversals 2 1
Profi t related to life insurance and investment contract liabilities 594 429 Attributable to: – Life insurance contracts 438 254 – Investment contracts 156 175
Investment earnings on assets in excess of life insurance and investment contract liabilities 113 90
(b) AMP life insurance entities statutory fundsAMP Life and NMLA conduct investment linked and non-investment linked business. For investment linked business, deposits are received from policyholders, the funds are invested on behalf of the policyholders and the resulting liability to policyholders is linked to the performance and value of the assets that back those liabilities.
The Life Act requires the life insurance business of AMP Life and NMLA to be conducted within life statutory funds. AMP Life has Life Act requires the life insurance business of AMP Life and NMLA to be conducted within life statutory funds. AMP Life has Life Actthree statutory funds: No. 1 fund includes AMP Life’s Australia and New Zealand non-investment linked business and a minor amount of investment linked business undertaken by AMP Life’s New Zealand Branch; No. 2 and No. 3 funds include all AMP Life’s investment linked business conducted in Australia. NMLA has six statutory funds:
No. 1 fund Australia Capital guaranteed ordinary business (whole of life, endowment, term, investment account and income protection).
New Zealand All business (whole of life, endowment, term, investment account, income protection, individual and group investment-linked and immediate annuities).
No. 2 fund Australia Investment-linked superannuation business (individual and group investment-linked and deferred annuities).
No. 3 fund Taiwan All business (individual whole of life, endowment, term and group life).
No. 4 fund Australia Capital guaranteed superannuation business (whole of life, endowment, individual and group investment account and group life).
No. 5 fund Australia Investment-linked ordinary business (individual investment-linked).
No. 6 fund Australia All business (immediate and deferred annuities).
Investments held in the life statutory funds can only be used in accordance with the relevant regulatory restrictions imposed under the Life Act and associated rules and regulations. The main restrictions are that the assets in a life statutory fund can only be used Life Act and associated rules and regulations. The main restrictions are that the assets in a life statutory fund can only be used Life Actto meet the liabilities and expenses of that life statutory fund, to acquire investments to further the business of the life statutory fund or as distributions provided solvency, capital adequacy and other regulatory requirements are met. See further details about solvency and capital adequacy in Note 22(d).
For
per
sona
l use
onl
y

83
22. Other life insurance and investment contract disclosures continued
Australian Accounting Standards require the income, expenses, assets and liabilities in the fi nancial statements of AMP Life and NMLA to include amounts attributable to policyholders in investment linked and non-investment linked business of the life statutory funds. The following table shows a summary of the balances in the life statutory funds disaggregated between non-investment linked and investment linked business:
2011
AMP Life and NMLA
2010
AMP Life only
Non-investment linked
$m
Investment linked
$m
Total life entities’ statutory funds
$m
Non-investment linked
$m
Investment linked
$m
Total life entities’ statutory funds
$m
Assets of life entities’ statutory funds
Net assets of life entities’ statutory funds attributable to policyholders and shareholders 30,943 49,613 80,556 21,927 46,434 68,361
Attributable to policyholders Life insurance contract liabilities 24,399 – 24,399 17,762 – 17,762 Investment contract liabilities 3,728 49,131 52,859 2,562 46,017 48,579
28,127 49,131 77,258 20,324 46,017 66,341
Attributable to shareholders 2,816 482 3,298 1,603 417 2,020
The net assets of life statutory funds attributable to shareholders represent the interests of shareholders including funds required to meet regulatory requirements as well as further amounts of shareholder funds in excess of regulatory requirements.
Impact of the life statutory funds amounts on the AMP group consolidated fi nancial statementsTo the extent that investments by the life statutory funds are held through wholly or partly owned controlled entities of the life statutory funds, the balances of those controlled entities are consolidated by AMP Life and NMLA and therefore become part of the consolidated balances of this AMP group Financial Report. The consolidated balances include 100 per cent of the underlying investments in fi nancial assets, investment property, and other net operating assets of the controlled entities of the life statutory funds. Most of the controlled entities are unit trusts and the share of the consolidated profi t and net assets of those trusts attributable to unitholders other than the AMP Life statutory funds is recognised in the consolidated income statement as Movement in external unitholder liabilities and in the consolidated Statement of fi nancial position as External unitholder liabilities.
The following table shows a summary of the consolidated balances of the life statutory funds and the entities controlled by the life statutory funds:
Life entities’ statutory funds
consolidated
2011$m
2010$m
Income statementInsurance premium and related revenue 1,877 1,100 Fee revenue 944 862 Other revenue 326 257 Investment gains and (losses) 629 4,053 Insurance claims and related expenses (1,790) (1,289)Operating expenses including fi nance costs (2,450) (1,970)Movement in external unitholder liabilities 196 (317)Change in life insurance contract liabilities 25 202 Change in investment contract liabilities 931 (2,259)Income tax (expense) credit (34) (144)
Profi t 654 495
Assets Cash and cash equivalents 7,128 5,233 Investments in fi nancial assets measured at fair value through profi t or loss 76,349 64,399 Investment property 7,734 7,423 Other assets 3,480 1,622
Total assets of policyholders, shareholders and non-controlling interests 94,691 78,677
Liabilities Life insurance contract liabilities 24,399 17,762 Investment contract liabilities 52,859 48,579 Other liabilities 6,173 3,829 External unitholder liabilities 7,902 6,386
Total liabilities of policyholders, shareholders and non-controlling interests 91,333 76,556
Net assets 3,358 2,121
For
per
sona
l use
onl
y

Notes to the fi nancial statementsfor the year ended 31 December 2011 continued
AMP Financial Report 2011
84
22. Other life insurance and investment contract disclosures continued
Consolidated
2011$m
2010$m
(c) Capital guarantees
Life insurance contracts with a discretionary participating feature – Amount of the liabilities that relate to guarantees 19,840 13,758
Investment linked contracts – Amount of the liabilities subject to investment performance guarantees 1,232 1,101
Other life insurance contracts with a guaranteed termination value – Current termination value 169 131
(d) Solvency and capital adequacy Registered life insurance entities are required to hold prudential reserves, over and above their life insurance contract and investment contract liabilities, as a buffer against adverse experience and poor investment returns. These prudential reserving requirements are specifi ed by the Life Act and accompanying prudential standards. AMP Life and NMLA hold additional amounts Life Act and accompanying prudential standards. AMP Life and NMLA hold additional amounts Life Actof reserves to provide a higher level of security for policyholder benefi ts than would be achieved by holding the statutory minimum.
Under the Life Act, there are two requirements for each life statutory fund in each life company:– the solvency requirement; and– the capital adequacy requirement.
Solvency requirementsThe solvency requirement is the absolute minimum that must be satisfi ed for the business to be allowed to continue to operate. Its purpose is to ensure, as far as practicable, that at any time the fund will be able to meet all existing life insurance contract liabilities, investment contract liabilities and other liabilities as they become due.
The Appointed Actuaries of AMP Life and NMLA have confi rmed that the available assets of each life statutory fund have exceeded the solvency reserve required at all times during the reporting period. Across all the life statutory funds, the excess assets, expressed as a percentage of the solvency reserve, at 31 December 2011 were 62 per cent for AMP Life and 100 per cent for NMLA (31 December 2010: 71 per cent for AMP Life).
Capital adequacy requirementsThe capital adequacy requirement is a separate requirement (usually higher) that must be satisfi ed for each life entity to be allowed to make distributions to its shareholders and to operate without regulatory intervention. Its purpose is to ensure, as far as practicable, that there is suffi cient capital in each life statutory fund for the continued conduct of the life insurance business, including writing new business, in a way which is in the interests of policyholders and in accordance with the Life Act.
The Appointed Actuaries of AMP Life and NMLA have confi rmed that the available assets of each life statutory fund have exceeded the capital adequacy reserve required at all times during the reporting period. For this purpose, the capital adequacy reserve is defi ned as the solvency reserve, plus the difference between the capital adequacy requirement and the solvency requirement. Across all the life statutory funds, the excess assets expressed as a percentage of the capital adequacy reserve, as at 31 December 2011, was 34 per cent for AMP Life and 27 per cent for NMLA (31 December 2010: 36 per cent for AMP Life).
(e) Actuarial information Mr Rocco Mangano, as the Appointed Actuary of AMP Life and Mr Daniel Shuttleworth, as the Appointed Actuary of NMLA, are satisfi ed as to the accuracy of the data used in the valuations in the Financial Report and in the tables in this Note and Note 21.
The liabilities to policyholders (being the sum of the life insurance contract and investment contract liabilities, including any asset or liability arising in respect of the management services element of an investment contract) and solvency reserves have been determined at the reporting date in accordance with the Life Act.
(f) Amounts which may be recovered or settled within 12 months after the reporting date Based on assumptions as to likely withdrawal patterns of the various product groups, it is estimated that approximately $16,627m (2010: $9,764m) of policy liabilities may be settled within 12 months of the reporting date.
For
per
sona
l use
onl
y

85
23. Risk management and fi nancial instruments information
Financial Risk Management The principal objective of the AMP Group Financial Risk Management Framework (FRM Framework) is to ensure the existence of a robust structure for identifying, assessing, measuring, managing and escalating risks. The FRM Framework operates under the AMP group risk appetite statement that includes consideration of risk to capital and risk to earnings.
FRM in the AMP group is managed in accordance with policies set by the AMP Limited Board (the Board). These policies are set out in the FRM Framework and this provides a structure for managing fi nancial risks including delegations, escalations and reporting. The FRM Framework also outlines AMP group’s FRM objectives and identifi es organisational responsibilities for the implementation of the FRM Framework. In addition, the FRM Framework provides an overview of each of the key fi nancial risks including the nature of the risks, objectives in seeking to manage the risks, the key policy variables for the management of the risks and the business unit responsibility for managing and reporting the risks.
The Board has ultimate responsibility for risk management and governance, including ensuring that an appropriate risk framework and appetite is in place and that it is operating effectively. This includes approval of the FRM Framework and its sub-policies, the shareholder capital investment strategy, capital and fi nancing plans, approval of transactions outside the FRM Framework and setting the fi nancial risk appetite. The AMP Limited Audit Committee (AMP AC) ensures the existence of effective FRM policies and procedures, and oversight of the execution of the FRM Framework. The AMP Life, AMP Capital and AMP Bank Audit Committees are delegated this responsibility for the elements specifi c to their respective businesses.
Executive Committees oversee the management and monitoring of fi nancial risks and capital management. These Committees include Group Asset and Liability Committee (Group ALCO) for AMP group, AFS ALCO for both AMP Life and National Mutual Life Association of Australasia (NMLA), Bank ALCO for AMP Bank and the Financial Risk and Capital Committee (FRCC) for AMP Capital. The Debt Committee, a sub-committee of Group ALCO, also reviews and monitors debt fi nancing risk across the AMP group. These Executive Committees report to the respective Audit Committees and Boards.
AMP group Treasury (Group Treasury) is responsible for the execution of the FRM Framework and capital and fi nancing plans in compliance with Board approved targets and limits. Group Treasury is also responsible for the execution of the approved investment strategy for AMP shareholder capital, for analysis and reporting of fi nancial risks and capital position to Group ALCO, AMP AC and the Board, and monitoring compliance with the FRM Framework in relation to FRM and for identifying and reporting breaches of policy to Group ALCO, relevant Audit Committees and the Board.
Internal Audit checks for compliance with the FRM Framework as part of its ongoing audit cycle. Internal Audit is required to review the effectiveness of the FRM Framework and report to the AMP AC.
The directors and boards of AMP Limited controlled operating entities are required to comply with the Board approved risk appetite. The AMP Limited controlled operating entities are also responsible for approving policyholder asset and liability strategy (in the case of AMP Life and NMLA), allocating subsidiary shareholder capital investment and for reporting to the AMP AC and Group ALCO on fi nancial risks.
The Appointed Actuaries are responsible for reporting to the AMP Life Board, NMLA Board, AMP AC, Group ALCO, AFS ALCO, as well as externally to APRA on the fi nancial condition of AMP Life and NMLA including solvency, capital adequacy and target surplus. The Appointed Actuaries are also responsible for giving advice to AMP Life and NMLA on distribution of profi ts, premium rates, charges, policy conditions and reinsurance arrangements. The Life Insurance Act (Life Act) also imposes obligations on Appointed Actuaries to bring to the attention of AMP Life, NMLA, or in some circumstances, APRA, any matter that the Appointed Actuaries believe requires action to avoid prejudice to the interests of policyholders.
Information about the capital management activities within the AMP group, including the relationship with regulatory requirements on the regulated entities, is provided in Note 24.
(a) Risks and mitigationFor the purposes of the FRM Framework, risk management involves decisions made about the allocation of investment assets across asset classes and/or markets and includes the management of risks within these asset classes.
Financial risk in the AMP group is managed by reference to the probability of loss relative to expected income over a one-year time horizon at a 90 per cent confi dence level (Profi t at risk). In respect of investments held in the shareholder fund and in the life statutory funds, the loss tolerance over the discretionary investments is set at a low level because AMP has equity market exposure in its businesses (for example through fees on Assets Under Management).
The risk appetite of the AMP group includes an allocation of risk to the Seed pool. The Seed pool is designed to assist business growth through the acquisition of assets to create investment products for clients and grow AMP Capital’s assets under management. The AMP group seeks to generate future revenues from the subsequent on-sale of these assets to clients through new or existing funds.
Financial risks arising in the AMP group include market risk (investment risk, interest rate risk, foreign exchange risk, currency risk, property risk, and equity price risk); liquidity and refi nancing risk; and credit risk. These risks are managed according to the FRM Framework including through the use of derivative fi nancial instruments such as cross-currency and interest rate swaps, forward rate agreements, futures, options and foreign currency contracts to hedge risk exposures arising from changes in interest rates and foreign exchange rates.
Market risk is the risk that the fair value or future cash fl ows of a fi nancial instrument will fl uctuate due to movements in the fi nancial markets. These movements include foreign exchange rates, interest rates, credit spreads, equity prices or property prices. Market risk in the AMP group arises from the management of insurance contracts and investment of shareholder capital including investments in equities, property, interest bearing investments and corporate debt.
For
per
sona
l use
onl
y

Notes to the fi nancial statementsfor the year ended 31 December 2011 continued
AMP Financial Report 2011
86
23. Risk management and fi nancial instruments information continued
(b) Market risk sensitivity analysisThe paragraphs below include sensitivity analysis tables showing how the profi t after tax and equity would have been impacted by changes in market risk variables including interest rate risk and currency risk as defi ned in AASB 7 Financial Instruments: Disclosures. They show the direct impact on the profi t after tax or equity of a reasonably possible change in factors which affect the carrying value of fi nancial assets and fi nancial liabilities held at the end of the reporting period.
The sensitivity is required to show the impact of a reasonably possible change in market rate (it is not intended to illustrate a remote, worst case, stress test scenario nor does it represent a forecast. In addition it does not include the impact of any mitigating management actions) over the period to the subsequent reporting date. The categories of risks faced and methods used for deriving sensitivity information did not change from previous periods.
There is no market risk relating to any fi nancial instruments of the parent. All comments and analysis in the remainder of this Note relate to the AMP group.
(i) Interest rate riskInterest rate risk is the risk of an impact on AMP group’s profi t after tax and equity from movements in market interest rates, including changes in the absolute levels of interest rates, the shape of the yield curve, the margin between different yield curves and the volatility of interest rates.
Interest rate risk arises from interest bearing fi nancial assets and fi nancial liabilities in various activities of the AMP group. Management of those risks is decentralised according to the activity. Details are as follows:
– AMP group’s long-term borrowings and subordinated debt– AMP group’s long-term borrowings and subordinated debt– – Interest rate risk arises in relation to long-term borrowings and AMP group’s long-term borrowings and subordinated debt – Interest rate risk arises in relation to long-term borrowings and AMP group’s long-term borrowings and subordinated debtsubordinated debt raised through a combination of Australian dollar, New Zealand dollar, pound sterling and euro denominated fi xed-rate and fl oating-rate facilities. The foreign denominated debt is converted to fl oating-rate Australian dollars through cross-currency swaps. Interest rate risk is managed by entering fl oating-to-fi xed interest rate swaps, which have the effect of converting borrowings from fl oating rates to fi xed rates. Under the interest rate swaps, the AMP group agrees with other parties to exchange, at specifi ed intervals (mainly quarterly), the difference between fi xed contract rates and fl oating-rate interest amounts calculated by reference to the agreed notional principal amounts.
AMP group policy is to maintain between 40–60 per cent of borrowings and subordinated debt at fi xed rates. This can be altered with Group ALCO approval to hedge other interest rate exposures across the group. At the reporting date, 57 per cent (2010: 56 per cent) of the AMP group’s borrowings and subordinated debt were effectively at fi xed rates.
Group Treasury may also, subject to Group ALCO approval, enter into interest rate derivative exposures to hedge other enterprise-wide interest rate exposures.
– AMP Life and NMLA– AMP Life and NMLA– – As discussed in Note 1(b), AMP Life and NMLA conduct their wealth management and life insurance business through separate life statutory funds. Investment assets of the life statutory funds including interest-bearing fi nancial assets are held to back investment contract liabilities, life insurance contract liabilities, retained profi ts and capital.
The interest rate risk of AMP Life and NMLA which impacts shareholders arises in respect of fi nancial assets and liabilities held in the shareholder fund and in the life statutory funds. A risk arises to the extent that there is an economic mismatch between the timing of payments to life policyholders and the duration of the assets held in the life statutory funds to back the policyholder liabilities. Where a liability in respect of investment contracts is directly linked to the value of the assets (where applicable, net of related liabilities) held to back that liability (investment-linked business), there is no residual interest rate exposure which would impact shareholders.
Management of various risks associated with investments undertaken by life statutory funds and the life shareholder fund, such as interest rate risk is subject to the relevant regulatory requirements governed by the Life Act. AMP Life and NMLA is required to satisfy solvency requirements, including holding statutory reserves to cater for interest rate risk to the extent that assets are not matched against liabilities.
AMP Life and NMLA manage interest rate and other market risks pursuant to an asset and liability management policy that has regard to policyholder expectations and risks to the AMP Life and NMLA Board’s target surplus philosophy for both capital adequacy and solvency as advised by the Appointed Actuaries.
– AMP Bank– AMP Bank– – Interest rate risk arises in AMP Bank from mismatches of repricing terms (for example, a three-year fi xed rate loan funded with a 90-day term deposit – term risk) and variable rate short-term repricing bases (basis risk). AMP Bank uses natural offsets, interest rate swaps and basis swaps to hedge the mismatches within exposure limits. Group Treasury manages the interest rate exposure in AMP Bank by maintaining a position, which is generally neutral, within the limits delegated and approved by the AMP Bank Board.
For
per
sona
l use
onl
y

87
23. Risk management and fi nancial instruments information continued
Interest rate risk sensitivity analysisThis analysis demonstrates the impact of a 100 basis point change in Australian and International interest rates, with all other variables held constant, on profi t after tax and equity. It is assumed that all underlying exposures and related hedges are included in the sensitivity analysis, that the 100 basis point change occurs as at the reporting date and that there are concurrent movements in interest rates and parallel shifts in the yield curves. The impact on equity includes both the impact on profi t after tax as well as the impact of amounts that would be taken directly to equity in respect of the portion of changes in the fair value of derivatives that qualify as cash fl ow hedges for hedge accounting. A sensitivity level of 100 basis points is determined considering the range of interest rates applicable to interest bearing fi nancial assets and fi nancial liabilities in the AMP group.
2011 2010
Impact on profi t after tax
Impact on equity
Impact on profi t after tax
Impact on equity
Change in variables
Increase (decrease)
$m
Increase (decrease)
$m
Increase (decrease)
$m
Increase (decrease)
$m
+100 basis points (9) 2 (10) 4 –100 basis points 30 20 11 (3)
(ii) Currency risk Currency risk is the risk of an impact on AMP group’s profi t after tax and equity from movements in foreign exchange rates. Changes in value would occur in respect of translating the AMP group’s capital invested in overseas operations into Australian dollars at reporting date (translation risk) or from foreign exchange rate movements on specifi c cash fl ow transactions (transaction risk).
Other than where the impact would be immaterial, corporate debt is typically converted to Australian dollars through cross-currency swaps, individual investment assets in shareholder capital (excluding the international equities portfolio attributable to shareholders within the life Statutory Fund No. 1 fund) and in the Seed pool are hedged, and expected foreign currency receipts and payments are hedged once the value and timing of the expected cash fl ow is known. Subject to Group ALCO approval, Group Treasury may allow for natural hedging of foreign exchange risk through unhedged foreign currency borrowings, or enter into discretionary foreign exchange transactions to hedge enterprise-wide exposures.
AMP group does not hedge the capital invested in overseas operations (other than foreign Seed pool investments), thereby accepting the foreign currency translation risk on invested capital.
Currency risk sensitivity analysisThis analysis demonstrates the impact of a 10 per cent movement of currency rates against the Australian dollar, with all other variables held constant, on the profi t after tax and equity due to changes in fair value of currency sensitive monetary assets and liabilities at the reporting date. It is assumed that the 10 per cent change occurs as at the reporting date. A sensitivity level of 10 per cent is determined considering the range of currency exposures in the AMP group.
2011 2010
Impact on profi t after tax
Impact on equity
Impact on profi t after tax
Impact on equity
Change in variables
Increase (decrease)
$m
Increase (decrease)
$m
Increase (decrease)
$m
Increase (decrease)
$m
10% depreciation of AUD 3 3 8 8 10% appreciation of AUD (3) (3) (8) (8)
For
per
sona
l use
onl
y

Notes to the fi nancial statementsfor the year ended 31 December 2011 continued
AMP Financial Report 2011
88
23. Risk management and fi nancial instruments information continued
(iii) Equity price riskEquity price risk is the risk of an impact on AMP group’s profi t after tax and equity from movements in equity prices. The AMP group measures equity securities at fair value through profi t or loss. Group Treasury may, with Group ALCO approval, use equity exposures or equity futures or options to hedge other enterprise-wide equity exposures.
Equity price risk sensitivity analysisThe analysis demonstrates the impact of a 10 per cent movement in Australian and International equities held at the reporting date. This sensitivity analysis has been performed to assess the direct risk of holding equity instruments. Any potential indirect impact on fees from AMP group’s investment linked business is not included. A sensitivity level of 10 per cent is determined considering the widely spread portfolios held by the AMP group and the range of movements in equity markets for the periods.
2011 2010
Impact on profi t after tax
Impact on equity
Impact on profi t after tax
Impact on equity
Increase (decrease)
$m
Increase (decrease)
$m
Increase (decrease)
$m
Increase (decrease)
$m
10% increase in Australian equities 16 16 9 910% increase in International equities 3 3 8 8
10% decrease in Australian equities (9) (9) (9) (9)10% decrease in International equities (3) (3) (8) (8)
(c) Liquidity and refi nancing risk Liquidity risk is the risk that the AMP group is not able to meet its debt obligations or other cash outfl ows as they fall due because of an inability to liquidate assets or obtain adequate funding when required. Refi nancing risk, a sub-set of liquidity risk, is the risk that the maturity profi le of existing debt is such that it would be diffi cult to refi nance (or rollover) maturing debt, or there is excessive exposure to potentially unfavourable market conditions at any given time.
To ensure that the AMP group has suffi cient funds available, in the form of cash, liquid assets, borrowing capacity and un-drawn committed funding facilities to meet its liquidity requirements, Group Treasury maintains a defi ned surplus of cash plus six months of debt maturities to mitigate refi nancing risk, satisfy regulatory requirements and protect against liquidity shocks in accordance with the liquidity risk management policy approved by the AMP Limited Board.
At 31 December 2011, no breaches existed in relation to external bank loans owing by entities controlled by the life statutory funds.
However, at 31 December 2010, the carrying amount of loans in breach was $267m, of which formal waivers from fi nanciers had been obtained for loans of $144m. During the 2011 fi nancial year, waivers were obtained for all loans in breach at and subsequent to 31 December 2010 and were subsequently resolved either through renegotiation of the terms of the loans or by improved fi nancial performance within the relevant entity, such that no breaches exist at 31 December 2011. Financiers of loans owing by controlled entities of the life statutory funds do not have legal recourse beyond the operating subsidiary borrower and there is no direct effect on any other AMP group debt.
For
per
sona
l use
onl
y

89
23. Risk management and fi nancial instruments information continued
The following table summarises the maturity profi les of AMP group’s undiscounted fi nancial liabilities and off-balance sheet items at the reporting date. The maturity profi les are based on contractual undiscounted repayment obligations. Repayments that are subject to notice are treated as if notice were to be given immediately.
Maturity profi les of undiscounted fi nancial liabilities and off balance sheet items
Up to 1year or
no term$m
1 to 5 years
$m
Over 5years
$mOther2
$mTotal
$m
2011Non-derivative fi nancial liabilities1 Payables (1,900) (32) – – (1,932)Borrowings (6,020) (4,350) (1,791) – (12,161)Subordinated debt (76) (1,094) (115) – (1,285)Investment contract liabilities (1,251) (1,126) (1,825) (49,364) (53,566)External unitholder liabilities – – – (7,224) (7,224)
Derivative fi nancial instruments Cross currency swaps – Outfl ows (423) (421) (209) – (1,053)– Infl ows 340 324 745 – 1,409 Interest rate swaps (9) 9 13 – 13
Off balance sheet items Loan commitments4 (1,649) – – – (1,649)
Total undiscounted fi nancial liabilities and off balance sheet items3 (10,988) (6,690) (3,182) (56,588) (77,448)
2010 Non-derivative fi nancial liabilities1 Payables (1,007) (26) – – (1,033)Borrowings (5,978) (6,503) – – (12,481)Subordinated debt (36) (385) (94) – (515)Investment contract liabilities (749) (946) (1,463) (46,017) (49,175)External unitholder liabilities – – – (5,892) (5,892)
Derivative fi nancial instruments Cross currency swaps – Outfl ows (63) (1,076) (123) – (1,262)– Infl ows 23 843 62 – 928 Interest rate swaps (19) (7) 16 – (10)
Off balance sheet items Loan commitments (1,425) – – – (1,425)
Total undiscounted fi nancial liabilities and off balance sheet items3 (9,254) (8,100) (1,602) (51,909) (70,865)
Footnote: 1 The table provides maturity analysis of AMP group fi nancial liabilities including fi nancial liabilities of controlled entities of the life entities’
statutory funds and non-linked investment contracts including term annuities. 2 Investment contract liabilities of $49,364m (2010: $46,107m) are liabilities to policyholders for investment linked business linked to the
performance and value of assets that back those liabilities. If all those policyholders claimed their funds, there may be some delays in settling the liability as assets are liquidated, but the shareholder has no direct exposure to any liquidity risk. External unitholder liabilities all relate to controlled entities of the life entities’ statutory funds and would only be paid when the corresponding assets are realised.
3 Estimated net cash outfl ow profi le of life insurance contract liabilities, disclosed in Note 21, are excluded from the above table.4 Loan commitments relate to commitments to provide credit to customers of AMP Bank.
For
per
sona
l use
onl
y

Notes to the fi nancial statementsfor the year ended 31 December 2011 continued
AMP Financial Report 2011
90
23. Risk management and fi nancial instruments information continued
(d) Credit riskCredit risk includes both settlement credit exposures and traded credit exposures. Credit default risk is the risk of an adverse impact on results and asset values relative to expectations due to a counterparty failing to meet their contractual commitments in full and on time (obligator’s non-payment of a debt). Traded credit risk is the risk of an adverse impact on results and asset values relative to expectations due to changes in the value of a traded fi nancial instrument as a result of changes in credit risk on that instrument.
The AMP Concentration Risk Policy sets out the assessment and determination of what constitutes credit risk. The policy has set exposure limits for each counterparty and credit rating. Compliance with this policy is monitored and exposures and breaches are reported to senior management and the AMP AC through the weekly and quarterly FRM Report.
Credit risk management is decentralised in business units within the AMP group; however, credit risk directly and indirectly (i.e. in the participating business) impacting shareholder capital is measured and managed by Group Treasury by aggregating risk from credit exposures taken in business units as detailed below.
– AMP Life and NMLA– AMP Life and NMLA– – Credit risk on the invested fi xed income portfolios in the AMP Life and NMLA statutory funds is managed by the AMP Capital Investors Risk and Compliance Committee (AMP Capital Investors R&C) and reported to the fund managers, within specifi ed credit criteria in the mandate approved by the AMP Life and NMLA Boards. The shareholder portion of credit risk in AMP Life and NMLA is reported to Group ALCO by Group Treasury.
– AMP Capital Investors– AMP Capital Investors– – Credit risk on fi xed income portfolios managed by AMP Capital Investors (consistent with interest rate and foreign currency risk) is managed by the AMP Capital Investors R&C Committee and reported to the fi xed income desk. This credit risk arises as part of a broader portfolio of investments under investment mandates with AMP Capital and, when relating directly to shareholder funds, is included in the aggregation by Group Treasury and reported to Group ALCO.
– AMP Bank– AMP Bank– – Credit risk arising in AMP Bank as part of lending activities and management of liquidity is managed as prescribed by AMP Bank’s Risk Management Systems Description (RMSD) and reported to AMP Bank ALCO monthly. Exposures relating directly to shareholder funds are included in the aggregation by Group Treasury and reported to Group ALCO.
(i) Management of credit risk concentrationConcentration of credit risk arises when a number of fi nancial instruments or contracts are entered into with the same counterparty or where a number of counterparties are engaged in similar business activities that would cause their ability to meet contractual obligations to be similarly affected by changes in economic or other conditions. Concentration of credit risk is managed through both aggregate credit rating limits and individual counterparty limits, which are determined predominantly on the basis of the counterparty’s credit rating.
At reporting date, there is no specifi c concentration of credit risk with a single counterparty arising from the use of fi nancial instruments, other than the normal clearing-house exposures associated with dealings through recognised exchanges.
The counterparties to non-exchange traded contracts, at the time of entering those contracts, are limited to companies with investment grade credit (BBB– or greater). The credit risks associated with these counterparties are assessed under the same management policies as applied to direct investments in AMP group’s portfolio.
Compliance is monitored and exposures and breaches are reported to senior management and the AMP AC through the weekly and quarterly FRM Report.
(ii) Exposure to credit riskAMP group’s maximum exposure to credit risk on recognised fi nancial assets, without taking account of any collateral or other credit enhancements as at the reporting date was $36,164m (2010: $32,591m). This amount includes (i) secured loans held by banking operations, (ii) fi nancial assets of investment linked business in AMP Life and NMLA where the liability to policyholders is linked to the performance and value of the assets that back those liabilities and consequently there is no exposure to shareholders, and (iii) other items arising in the course of operations which are managed by the respective business units. AMP Bank also has loan commitments at reporting date of $1,629m (2010: $1,425m).
The exposures on the interest bearing securities and cash equivalents which impact the AMP group’s capital position are managed by Group Treasury within limits set by the AMP Concentration Risk Policy. The following table provides information regarding the credit risk exposures for those items according to the credit rating of the counterparties.
2011$m
2010$m
AAA 4,770 4,582AA– to AA+ 10,423 5,384A– to A+ 4,101 2,558BBB– to BBB+ 1,556 1,732BB+ and below 185 220
Total fi nancial assets with credit risk exposure monitored by AMP Treasury 21,035 14,476For
per
sona
l use
onl
y

91
23. Risk management and fi nancial instruments information continued
(iii) Credit risk of the loan portfolio in AMP BankAMP Bank is predominantly a lender for residential properties – both owner occupied and for investment. In every case AMP Bank completes a credit assessment, which includes a cost of living allowance and requires valuation of the proposed security property by a qualifi ed independent valuer. About 44 per cent of AMP Bank’s residential loan portfolio is securitised and all loans in securitisation vehicles are mortgage insured thereby further mitigating the risk. AMP Bank’s Credit Committee and Board oversee trends in lending exposures and compliance with concentration limits as a further basis of limiting lending risk. AMP Bank secures its loan portfolio with mortgages over relevant properties and as a result manages credit risk on its loan portfolio by loan to value ratio (LVR). The LVR is calculated by dividing the total loan amount by the lower of AMP Bank’s approved valuation amount or the purchase price. Loans with LVR greater than 80 per cent are fully mortgage insured. The potential credit exposure to the loan mortgage insurers has been assessed to be minimal due to a stable historical relationship with AMP Bank and minimal level of historic claims rejections and reductions. The minimum credit rating for the loans and lender mortgage insurers is AA– or above under Standard & Poor’s rating. The average LVR of AMP Bank’s loan portfolio for existing and new business is set out in the following table:
LVR
Existing business
2011
New business
2011
Existing business
2010
New business
2010
0–50 26% 10% 28% 10%51–60 11% 8% 13% 7%61–70 15% 12% 15% 11%71–80 34% 51% 33% 56%81–90 11% 16% 9% 13%91–95 2% 2% 1% 3%> 95 1% 1% 1% –
(iv) Past due but not impaired fi nancial assetsThe following table provides an ageing analysis of fi nancial assets that are past due as at reporting date but not impaired. No disclosures are required for the parent entity as the parent entity does not have any fi nancial assets that are past due but not impaired at reporting date.
Past due but not impaired
Less than 31 days
$m
31 to 60 days
$m
61 to 90 days
$m
More than 91 days
$mTotal
$m
2011Receivables – Trade debtors 10 3 3 6 22– Other receivables 2 – – 5 7 Debt securities – Loans and advances 343 28 4 16 391
Total1 355 31 7 27 420
2010Receivables – Reinsurance and other recoveries receivable 1 – – – 1 – Trade debtors 6 1 1 6 14 – Other receivables 1 – 1 2 4 Debt securities – Loans and advances 338 20 14 30 402
Total1 346 21 16 38 421
Footnote: 1 For investment-linked business in AMP Life and NMLA, the liability to policyholders is linked to the performance and value of the assets that
back those liabilities. The shareholder has no direct exposure to any credit risk in those assets. Therefore, the tables in this section do not show the past due fi nancial assets backing investment-linked business in AMP Life.F
or p
erso
nal u
se o
nly

Notes to the fi nancial statementsfor the year ended 31 December 2011 continued
AMP Financial Report 2011
92
23. Risk management and fi nancial instruments information continued
(v) Adjustment for own credit risk in the determination of the fair value of life investment contract policy liabilitiesThe fair value of non-investment linked investment contract liabilities includes the following allowance for the credit risk that an external party would ascribe to an amount due from AMP Life and NMLA:
2011$m
2010$m
Cumulative adjustment 27 19Change during the period 8 4
The adjustment has been determined as the difference between the fair value recognised and an amount calculated on the same basis using a risk-free interest rate in place of the fair value discount rate.
(vi) Impaired fi nancial assets and impairment assessmentAMP Bank has impaired loans of $4m (2010: $4m) at the reporting date. AMP Bank provides specifi c provision and collective impairment loan loss provisions against these impaired loans.
The AMP Bank Credit Committee reviews the portfolio for provisioning at least quarterly. The review considers:– current provisioning amount– portfolio growth and performance – for both on and off balance sheet exposures– current arrears position and specifi c loan provisions– current and forecast state of economy, interest rate movements etc.
It also makes recommendations to the AMP Bank Board and Audit Committee.
(vii) Collective impairment loan loss provisionThe collective impairment loan loss provision methodology is a statistically based model that removes subjectivity from the provisioning process and makes the provision refl ective of historical loss performance.
The model utilises historical losses incurred by AMP Bank and researches external data sources to develop a series of probability of default and loss, given default factors that can be applied to loans and advances in arrears. The model also includes the ability to apply a management overlay if it is deemed that the economic environment is not representative of historical loss performance.
The model is reviewed quarterly and specifi c factors are formally validated every six months and reported to the AMP Bank Audit Committee.
(viii) Specifi c provisionThe specifi c provision is created when there is clear evidence that AMP Bank will suffer a loss with little chance of recovery and the amount of the loss is measurable. This provision is reviewed quarterly and recommendations are made to the AMP Bank Audit Committee.
(ix) CollateralAMP Life enters into debt security repurchase agreements and part of the agreement includes the receipt of collateral which is required to be returned to the counterparty on settlement. As at 31 December 2011 the collateral held by AMP includes Cash and cash equivalents of $174m (2010: $167m) and Debt securities of $1,275m (2010: $2,177m).
AMP Bank uses residential property as collateral against its loans to customers. AMP Bank may take control of the collateral in the event the customer defaults.
(e) Derivative fi nancial instrumentsDerivative fi nancial instruments are measured at fair value in the Statement of fi nancial position as assets and liabilities. Asset and liability values on individual transactions are only netted if the transactions are with the same counterparty and the cash fl ows will be settled on a net basis. Changes in values of derivative fi nancial instruments are recognised in the Income statement unless they qualify as effective cash fl ow hedges or net investment hedges for accounting purposes, as set out in Note 1(q).
(i) Derivative transactions undertaken by AMP life insurance entities as part of life insurance operationsThe AMP group uses derivative fi nancial instruments including fi nancial futures, forward foreign exchange contracts, exchange traded and other options and forward rate agreements to hedge the impact of market movements on the value of assets in the investment portfolios, and to effect a change in the asset mix of investment portfolios.
In respect of the risks associated with the use of derivative fi nancial instruments, price risk is controlled by exposure limits, which are subject to monitoring and review. Foreign exchange hedges are monitored on a regular basis to ensure they are effective in the reduction of price risk.
(ii) Derivative transactions undertaken in relation to the North product capital guaranteeAMP group supports the North product (North) which enables clients to invest their superannuation, pension and ordinary savings in a range of managed funds, with part or all of the total value of the investments guaranteed. The North guarantees are either term-based capital guarantees or provide a guaranteed level of income throughout the life of a client’s retirement. At 31 December 2011 $1.26 billion (2010: nil) of funds under management were invested subject to the North guarantees. A fair value of $82m (2010: nil) was recorded for the North guarantee liability at 31 December 2011.
Hedging techniques are used to protect the AMP group against changes in the expected guarantee claim payments from market movements. AMP group also has the ability to review the periodic charge for new and existing clients. To the extent that the fair value of the guarantee is based on assumptions that may not be borne out in practice and that the hedge instruments used are not a perfect match for the expected guarantee payments, there is a residual risk that deviations from these assumptions may result in a profi t or loss to shareholders.
For
per
sona
l use
onl
y

93
23. Risk management and fi nancial instruments information continued
Hedging of the North Capital guarantee is performed based on the ‘economic value’ of the guarantee. The ‘economic value’ is consistent with the accounting fair value except that the calculation of accounting fair value applies a minimum liability, on a contract by contract basis, of the amount that would be payable on demand at reporting date, whereas the ‘economic value’ does not include this minimum. The difference in the movement of accounting fair value and the movement in the ‘economic value’ of the guarantee also results in a profi t or loss to the shareholder.
(iii) Other derivative transactions undertaken by non-life insurance controlled entitiesAMP Treasury and AMP Bank use derivative fi nancial instruments to hedge fi nancial risk from movements in interest rates and foreign exchange rates. Swaps, forwards, futures and options in the interest rate and foreign exchange markets may be used. A description of each of these derivatives is given below.
– Swaps – a swap transaction obliges the two parties to the contract to exchange a series of cash fl ows at specifi ed payment or settlement dates. Swap transactions undertaken by the AMP group include interest rate swaps, which involve the contractual exchange of fi xed and fl oating interest rate payments in a single currency based on a notional amount and a reference rate (for example BBSW), and cross-currency swaps which involve the exchange of interest payments based on two different currency principal balances and reference interest rates, and generally also entail exchange of principal amounts at the start and/or end of the contract.
– Forward and futures contracts – these are agreements between two parties establishing a contractual interest rate on a notional principal over a specifi ed period, commencing at a future date. Forward contracts are tailor made agreements that are transacted between counterparties in the over-the-counter market (OTC), whereas futures are standardised contracts transacted on regulated exchanges.
– Options – an option contract gives the option buyer the right, but not the obligation, to buy or sell a specifi ed amount of a given commodity or fi nancial instrument at a specifi ed price during a certain period or on a specifi c date. The seller of the option contract is obliged to perform if the holder exercises the right contained therein. Options may be traded OTC or on a regulated exchange.
(iv) Risk relating to derivative fi nancial instrumentsThe market risk of derivatives is managed and controlled as an integral part of the fi nancial risk of the AMP group. The credit risk of derivatives is also managed in the context of the AMP group’s overall credit risk policies.
(f) Accounting for hedgesThe accounting treatment of hedge transactions varies according to the nature of the instrument hedged and whether the hedge qualifi es for hedge accounting.
Derivative transactions may qualify either as fair value hedges or cash fl ow hedges or hedges of net investments in foreign operations. The AMP group’s accounting policies for derivatives designated and accounted for as hedging instruments are explained in Note 1(q), where terms used in the following section are also explained.
The AMP group also enters into derivative transactions that provide economic hedges but do not meet the requirements for hedge accounting treatment.
(i) Derivative instruments accounted for as fair value hedgesFair value hedges are used to protect against changes in the fair value of fi nancial assets and fi nancial liabilities due to movements in exchange rates and interest rates.
During 2011, the AMP group recognised a net gain of $1m (2010: $97m net loss) on hedging instruments. The net loss on hedged items attributable to the hedged risks amounted to $2m (2010: $102m net gain).
(ii) Derivative instruments accounted for as cash fl ow hedgesThe AMP group is exposed to variability in future interest cash fl ows on non-trading assets and liabilities which bear interest at fi xed and variable rates. The AMP group uses interest rate swaps and cash fl ow hedges to manage interest rate risks.
The following schedule shows, as at reporting date the periods when the hedged cash fl ows are expected to occur and when they are expected to affect profi t and loss:
0–1 year$m
1–2 years$m
2–3 years$m
3–4 years$m
4–5 years$m
2011 Cash infl ows 98 52 24 7 2Cash outfl ows (114) (62) (23) (6) (2)
Net cash infl ow/(outfl ow) (16) (10) 1 1 –
2010 Cash infl ows 105 50 32 7 –Cash outfl ows (115) (54) (30) (6) –
Net cash infl ow/(outfl ow) (10) (4) 2 1 –
Nil (2010: nil) was recognised in the Income statement due to hedge ineffectiveness from cash fl ow hedges.
For
per
sona
l use
onl
y

Notes to the fi nancial statementsfor the year ended 31 December 2011 continued
AMP Financial Report 2011
94
23. Risk management and fi nancial instruments information continued
(iii) Hedges of net investments in foreign operations AMP group hedges its exposure to changes in exchange rates on the value of its foreign currency denominated Seed pool investments. Gains or losses on effective Seed pool hedges are transferred to equity to offset any gains or losses on translation of the net investment in foreign operations.
AMP group recognised a profi t of nil (2010: nil) due to the ineffective portion of hedges relating to investments in Seed pool foreign operations.
(g) Fair valuesThe following table summarises the carrying amounts and fair values of those fi nancial assets and liabilities not presented on the Statement of fi nancial position at fair value. Bid prices are used to estimate the fair value of assets, whereas offer prices are applied for liabilities.
Carrying amount
2011$m
Aggregate fair value
2011$m
Carrying amount
2010$m
Aggregate fair value
2010$m
Financial assets Debt securities – Held to maturity 1,651 1,504 733 843 Loans and advances 11,254 11,174 10,202 9,851
Total fi nancial assets 12,905 12,678 10,935 10,694
Financial liabilities Bank loans 850 850 962 1,694 Bonds and notes 6,228 6,462 6,687 7,702 Deposits 4,271 4,271 3,082 2,525 Subordinated Floating Rate Note 949 1,061 345 380 Other borrowings 57 57 60 173
Total fi nancial liabilities 12,355 12,701 11,136 12,474
Fair value is the amount for which an asset could be exchanged, or a liability settled, between knowledgeable, willing parties in an arm’s length transaction.
(i) Debt securities The estimated fair value of loans and interest bearing securities represents the discounted amount of estimated future cash fl ows expected to be received, based on the maturity profi le of the loans and interest bearing securities. As the loans are unlisted, the discount rates applied are based on the yield curve appropriate to the remaining term of the loans.
The loans may be measured at an amount in excess of fair value due to fl uctuations on fi xed rate loans. As the fl uctuations in fair value do not represent a permanent diminution and the carrying amounts of the loans are recorded at recoverable amounts after assessing impairment, it is not appropriate to restate their carrying amount.
(ii) Borrowings Borrowings comprise domestic commercial paper, drawn liquidity facilities and various fl oating-rate and medium-term notes. The fair values of borrowings are predominantly hedged by derivative instruments – mainly cross-currency and interest rate swaps. The estimated fair value of borrowings is determined with reference to quoted market prices. For borrowings where quoted market prices are not available, a discounted cash fl ow model is used, based on a current yield curve appropriate for the remaining term to maturity.
(iii) Subordinated debtSubordinated debt comprises listed securities and their fair value is determined with reference to the actual quoted market prices at reporting date. The fair value of subordinated debt is predominantly hedged by derivative instruments – mainly cross-currency and interest rate swaps.
For
per
sona
l use
onl
y

95
23. Risk management and fi nancial instruments information continued
(h) Fair value measuresFinancial instruments measured at fair value are categorised under a three level hierarchy, refl ecting the availability of observable market inputs when estimating the fair value. If different levels of inputs are used to measure a fi nancial instrument’s fair value, the classifi cation within the hierarchy is based on the lowest level input that is signifi cant to the fair value measurement. The three levels are:
Level 1: Valued by reference to quoted prices in active markets for identical assets or liabilities. These quoted prices represent actual and regularly occurring market transactions on an arm’s length basis.
Level 2: Valued using inputs other than quoted prices included within Level 1 that are observable for the asset or liability, either directly (as prices) or indirectly (derived from prices), including: quoted prices in active markets for similar assets or liabilities, quoted prices in markets in which there are few transactions for identical or similar assets or liabilities, and other inputs that are not quoted prices but are observable for the asset or liability, for example interest rate yield curves observable at commonly quoted intervals, currency rates, option volatilities, credit risks, and default rates.
Level 3: Valued in whole or in part using valuation techniques or models that are based on unobservable inputs that are neither supported by prices from observable current market transactions in the same instrument nor based on available market data. Unobservable inputs are determined based on the best information available, which might include the AMP group’s own data, refl ecting the AMP group’s own estimates about the assumptions that market participants would use in pricing the asset or liability. Valuation techniques are used to the extent that observable inputs are not available, and include estimates about the timing of cash fl ows, discount rates, earnings multiples and other inputs.
The following table shows an analysis of fi nancial instruments measured at fair value by each level of the fair value hierarchy:
Level 1$m
Level 2$m
Level 3$m
Total fair value$m
2011Assets Equity securities and listed managed investment schemes 31,474 12 737 32,223Debt securities 1,130 27,641 311 29,082 Investments in unlisted managed investment schemes – 12,001 792 12,793 Derivative fi nancial assets 283 1,968 – 2,251 Other fi nancial assets – 179 – 179
Total fi nancial assets 32,887 41,801 1,840 76,528
Liabilities Derivative fi nancial liabilities 54 1,101 – 1,155Collateral deposits held 1,449 – – 1,449Investment contract liabilities – 3,065 49,875 52,940
Total fi nancial liabilities 1,503 4,166 49,875 55,544
2010Assets Equity securities and listed managed investment schemes 31,255 216 659 32,130 Debt securities – 20,403 228 20,631 Investments in unlisted managed investment schemes – 9,580 341 9,921 Derivative fi nancial assets 232 1,641 – 1,873 Other fi nancial assets 72 170 – 242
Total fi nancial assets 31,559 32,010 1,228 64,797
Liabilities Derivative fi nancial liabilities 50 668 – 718 Collateral deposits held 2,344 – – 2,344 Investment contract liabilities – 1,995 46,584 48,579
Total fi nancial liabilities 2,394 2,663 46,584 51,641
For
per
sona
l use
onl
y

Notes to the fi nancial statementsfor the year ended 31 December 2011 continued
AMP Financial Report 2011
96
23. Risk management and fi nancial instruments information continued
The following table shows a reconciliation of the movement in the fair value of fi nancial instruments categorised within Level 3 between the beginning and the end of the reporting date:
Balance at the
beginning of the period
$m
Balance on acquisition
of AXA$m
FX gains or losses
$m
Total gains/losses
$m
Purchases/deposits
$m
Sales/withdrawals
$m
Net transfers in/(out)
$m
Balance at the end
of the period
$m
Total gains and losses on
assets and liabilities held
at reporting date
$m
2011Assets
Equity securities and listed managed investment schemes 659 41 – 28 43 (12) (22) 737 28
Debt securities 228 85 – (6) 27 (60) 37 311 (6)
Investments in unlisted managed investment schemes 341 240 – 15 117 (74) 153 792 15
Total fi nancial assets 1,228 366 – 37 187 (146) 168 1,840 37
Liabilities
Investment contract liabilities 46,584 6,116 6 (1,734) 9,221 (10,304) (14) 49,875 1,535
Total fi nancial liabilities 46,584 6,116 6 (1,734) 9,221 (10,304) (14) 49,875 1,535
2010 Assets
Equity securities and listed managed investment schemes 691 – – (16) 29 (25) (20) 659 (16)
Debt securities 346 – – 46 26 (178) (12) 228 46
Investments in unlisted managed investment schemes 342 – – (71) 69 (19) 20 341 (71)
Derivative fi nancial assets 10 – – – – – (10) – –
Total fi nancial assets 1,389 – – (41) 124 (222) (22) 1,228 (41)
Liabilities
Investment contract liabilities 45,506 – (6) 1,342 7,585 (7,843) – 46,584 1,320
Total fi nancial liabilities 45,506 – (6) 1,342 7,585 (7,843) – 46,584 1,320
For
per
sona
l use
onl
y

97
23. Risk management and fi nancial instruments information continued
The following table shows the sensitivity of the fair value of Level 3 instruments to changes in key assumptions:
Effect of reasonably possible alternative assumptions1
Carrying amount
$m(+)
$m(–)
$m
2011Assets Equity securities and listed managed investment schemes 737 41 (17)Debt securities 311 – –Investments in unlisted managed investment schemes 792 – –
1,840 41 (17)
Liabilities Investment contract liabilities 49,875 9 (9)
49,875 9 (9)
2010Assets Equity securities and listed managed investment schemes 659 20 (20)Debt securities 228 – – Investments in unlisted managed investment schemes 341 – –
1,228 20 (20)
Liabilities Investment contract liabilities 48,646 (10) 10
48,646 (10) 10
Footnote: 1 The sensitivity has been calculated by changing key inputs such as discount rates and earnings multiples by a reasonably possible amount.
For
per
sona
l use
onl
y

Notes to the fi nancial statementsfor the year ended 31 December 2011 continued
AMP Financial Report 2011
98
24. Capital management
The AMP group holds capital to protect customers, creditors and shareholders against unexpected losses to a level that is consistent with AMP’s risk appetite.
The AMP group’s capital resources include ordinary equity and interest-bearing liabilities. The AMP group excludes interest-bearing liabilities of its banking subsidiary, AMP Bank Limited, and controlled investment subsidiaries and trusts from the AMP group capital resources. Included within interest-bearing liabilities are subordinated debt and other instruments that would qualify as regulatory capital under Australian Prudential Regulation Authority (APRA) standards.
The AMP group makes adjustments to the statutory shareholder equity. Under Australian Accounting Standards, some assets held on behalf of the policyholders (and related tax balances) are recognised in the Financial Report at different values to the values used in the calculation of the liability to policyholders in respect of the same assets. Therefore, movements in these policyholder assets result in accounting mismatches which impact profi t attributable to shareholders. Mismatch items include:– treasury shares (AMP Limited shares held by the statutory funds on behalf of policyholders)– AMP life insurance statutory funds’ investments in controlled entities– other – owner-occupied properties and AMP Life statutory funds’ superannuation products invested in AMP Bank assets.
Adjustments are also made relating to cash fl ow hedge reserves.
The table below shows the AMP group’s current capital resources at reporting date:
2011$m
2010$m
AMP statutory equity attributable to shareholders of AMP Limited 6,829 2,938Accounting mismatch items and cash fl ow hedge reserves 185 108
AMP shareholder equity 7,014 3,046Subordinated debt1 879 279Senior debt1 657 607
Total AMP capital resources 8,550 3,932
Footnote:1 Amounts shown for subordinated debt and senior debt are the amounts to be repaid on maturity. Amounts recognised in the Statement of
fi nancial position in respect of these debts are measured at amortised cost using the effective interest rate method.
The AMP group assesses the adequacy of its capital requirements against regulatory capital requirements. The AMP group’s capital management strategy forms part of the AMP group’s broader strategic planning process.
In addition to managing the level of capital resources, the AMP group also attempts to optimise the mix of capital resources to minimise the cost of capital and maximise shareholder value.
A number of the operating entities within the AMP group of companies are regulated. The AMP group of companies includes an authorised deposit-taking institution, life insurance companies and approved superannuation trustees all regulated by APRA. A number of companies also hold Australian Financial Services Licences.
The minimum regulatory capital requirements (MRR) is the amount of capital required by each of AMP’s regulated businesses to meet their capital requirements as set by the appropriate regulator. The main requirements are as follows:– AMP Life Limited and The National Mutual Life Association of Australasia Limited – solvency, capital adequacy and management
capital requirements as specifi ed under the Life Act and APRA Life Insurance Prudential StandardsLife Act and APRA Life Insurance Prudential StandardsLife Act– AMP Bank Limited – capital requirements as specifi ed under APRA Banking Prudential Standards– AMP Capital Investors Limited – capital and liquidity requirements under its Australian Financial Services Licence– National Mutual Funds Management Limited – capital and liquidity requirements as specifi ed under its Australian Financial
Services Licence, and an amount of capital for the risks associated with the North guarantee.
For
per
sona
l use
onl
y

99
24. Capital management continued
All the AMP group regulated entities have at all times during the current and prior fi nancial year complied with the externally imposed capital requirements to which they are subject.
AMP holds a level of capital above its MRR. At reporting date the regulatory capital resources above MRR were $1,543m (2010: $1,482m), or 1.3 times Shareholder MRR (2010: 1.5 times). The Shareholder MRR coverage ratio will vary throughout the year due to investment market movements, dividend payments and the retention of profi ts.
AMP’s regulated businesses each target a level of capital equal to MRR plus a target surplus. The AMP Life Statutory Funds and The National Mutual Life Association Statutory Funds target surplus is set by reference to a probability of breaching regulatory capital requirements. This is a two tiered test where the target surplus is set as the greater of the amount required for a:– 1 per cent probability of breaching solvency over one year– 10 per cent probability of breaching capital adequacy over one year.
AMP Bank’s target surplus refl ects an additional 0.75 per cent of risk-weighted assets above the APRA minimum requirements.
AMP Capital’s target surplus is set to cover the Seed pool investment risk and operational risks.
Other components of AMP’s target surplus include amounts relating to the North guarantee, Group Offi ce investment risks, defi ned benefi t fund mismatch risks, and operational risks.
The APRA life and general insurance prudential review aims to align the capital framework of APRA-regulated life and general insurance companies. APRA expects to issue fi nal standards in May 2012, which are likely to take effect from 1 January 2013. AMP has commenced an assessment of the impact of these draft prudential standards on its regulatory capital position. While the assessment is still ongoing, it is expected that there will be an increase in minimum regulatory capital requirements. With ongoing disciplined capital management, supplemented by the capital benefi t of the MUTB business alliance ($380m), which is scheduled to complete in March 2012 (subject to regulatory approval), AMP expects to continue to maintain a strong surplus to minimum regulatory capital requirements.
ASIC has completed its review of minimum capital requirements imposed on responsible entities of registered managed investment schemes under the AFSL regime. These changes will be effective from 1 November 2012.
The Reserve Bank of New Zealand has fi nalised new New Zealand Solvency Standards for New Zealand life insurance companies. AMP is likely to be exempt from most aspects of these proposals on the basis of its compliance with APRA solvency standards.
Other regulatory capital reviews underway include:– APRA development of a supervision framework for conglomerate groups. A further update on these proposals is expected
in 2012.– Basel Committee on Banking Supervision review of global banking supervision (Basel III) and APRA revisions to Australian
banking standards.– Introduction of APRA prudential standards for Superannuation Funds. The prudential standards are expected to be completed
during 2012 and commence in 2013.
AMP continues to maintain a prudent approach to capital.
For
per
sona
l use
onl
y

Notes to the fi nancial statementsfor the year ended 31 December 2011 continued
AMP Financial Report 2011
100
25. Notes to Statement of cash fl ows
Consolidated Parent
2011$m
2010$m
2011$m
2010$m
(a) Reconciliation of the net profi t after income tax to cash fl ows from operating activities Net profi t after income tax 676 755 352 391 Depreciation of operating assets 37 41 – –Amortisation and impairment of intangibles 192 80 – –Investment gains and losses and movements in external unitholder liabilities 3,211 1,072 – –Dividend and distribution income reinvested (252) (239) – –Share-based payments 27 23 – –Decrease (increase) in receivables, intangibles and other assets 18 (153) 95 (89)(Decrease) increase in net policy liabilities (1,973) 722 – –(Decrease) increase in income tax balances (567) 250 (235) 247 (Decrease) increase in other payables and provisions 2,185 (87) 101 (161)
Cash fl ows from (used in) operating activities 3,554 2,464 313 388
(b) Reconciliation of cash Comprises: Cash on hand 3,797 1,724 1 2 Cash on deposit 855 1,601 – –Bank overdrafts (included in Borrowings) (4) – – –Short-term bills and notes (included in Debt securities) 4,088 4,843 – –
Balance at the end of the period 8,736 8,168 1 2
(c) Financing arrangements (i) Overdraft facilities Bank overdraft facility available 379 381 – –
(ii) Loan facilities In addition to facilities arranged through bond and note issues (refer Notes 17 and 18), fi nancing facilities are provided through bank loans under normal commercial terms and conditions. Available 2,939 2,407 – –Used (941) (1,035) – –
Unused 1,998 1,372 – –
(iii) Bond and note funding programs Available 14,272 13,470 – –Used (7,358) (7,612) – –
Unused 6,914 5,858 – –
For
per
sona
l use
onl
y

101
25. Notes to Statement of cash fl ows continued
(d) Disposal of controlled entitiesOperating entitiesOn 31 December 2011, AMP group disposed of its 100 per cent interest in the shares of AMP General Insurance Distribution Limited, and AMP group ceased to consolidate the entity from that date. AMP group did not continue to hold any ownership interest following the disposal.
A gain on sale of $38m was recognised and is included in investment gains and (losses) in the Income statement. Cash consideration of $39m was received in January 2012.
The impact of ceasing to control AMP General Insurance Distribution Limited in the consolidated Statement of fi nancial position is as follows:
ItemImpact in 2011
$m
Cash and cash equivalents (1)Receivables 37Deferred tax assets (1)Payables (1)Provisions (2)
There were no signifi cant disposals of controlled operating entities during 2010.
Controlled entities of AMP life insurance entities’ statutory funds In the course of normal operating investment activities, the AMP life insurance entities’ statutory funds acquire equity interests in entities which, in some cases, result in AMP holding a controlling interest in the investee entity.
Most acquisitions and disposals of controlled entities are in relation to unit trusts with underlying net assets typically comprising investment assets including cash. The consideration for acquisitions or disposals refl ects the fair value of the investment assets at the date of the transactions after taking into account minority interests.
Certain controlled entities of the life entities’ statutory funds are operating companies which carry out business operations unrelated to the core wealth management operations of the AMP group.
There were no signifi cant disposals of controlled entities of AMP life insurance entities’ statutory funds in 2011.
During 2010, AMP group’s interest in the AMP Shopping Centre Fund, a controlled entity of the AMP life insurance entities’ statutory funds, was diluted due to an issue of units to the external unitholders by the AMP Shopping Centre Fund, resulting in AMP group ceasing to control this entity. AMP Shopping Centre Fund has signifi cant assets and liabilities other than investment assets and cash. AMP continued to hold a non-controlling interest in the AMP Shopping Centre Fund.
The impact of ceasing to control the AMP Shopping Centre Fund was a reduction of the following assets and liabilities in the consolidated Statement of fi nancial position:
ItemImpact in 2010
$m
Cash and cash equivalents (18)Receivables (21)Inventories and other assets (1)Investments in fi nancial assets measured at fair value through profi t or loss (299)Investment property (824)Payables and provisions (30)Derivative fi nancial liabilities (16)Borrowings (375)External unitholder liabilities (742)
There was no consideration received by AMP group on loss of control of this entity.
For
per
sona
l use
onl
y

Notes to the fi nancial statementsfor the year ended 31 December 2011 continued
AMP Financial Report 2011
102
26. Earnings per share
(a) Classifi cation of equity securitiesOrdinary shares have been included in the calculation of basic earnings per share.
In accordance with AASB 133 Earnings per Share, options over unissued ordinary shares and performance rights have been classifi ed as potential ordinary shares and have been considered in the calculation of diluted earnings per share. As all options were out of the money for 2011 and 2010, they have been determined not to be dilutive for those periods. Performance rights have been determined to be dilutive in 2011 and 2010. Although performance rights have been determined to be dilutive in accordance with AASB 133 Earnings per Share, if these instruments vest and are exercised, it is AMP’s policy to buy AMP shares ‘on-market’ so there will be no dilutive effect on the value of AMP shares.
Since the end of the year and up to the date of the report, no performance rights have been issued, no performance rights have been exercised, and 36,112 performance rights have lapsed. During the same period no share rights have been issued, no share rights have been exercised, and 7,143 share rights have lapsed. There have been no movements in the number of shares on issue.
Of the ordinary shares on issue, AMP’s life insurance entities (wholly-owned controlled entities) hold 38,901,250 (2010: 26,375,450) shares in AMP Limited on behalf of policyholders. ASIC has granted relief from restrictions in the Corporations Act 2001 to allow AMP’s life insurance entities to hold and trade shares in AMP Limited as part of the policyholder funds’ investment activities. In determining the weighted average number of ordinary shares used in the calculation of earnings per share, a reduction is made for the average number of shares held by AMP’s life insurance entities in AMP Limited during the period.
Of the ordinary shares 1,752,268 are held by a controlled entity of AXA Asia Pacifi c Holdings Limited.
Consolidated
2011million shares
2010million shares
(b) Weighted average number of ordinary shares used Weighted average number of ordinary shares used in calculation of basic earnings per share 2,613 2,046 Add: potential ordinary shares considered dilutive 16 12 Weighted average number of ordinary shares used in calculation of diluted earnings per share 2,629 2,058
$m $m
(c) Level of earnings used Basic 688 775 Diluted 688 775
cents cents
(d) Earnings per share Basic 26.3 37.9 Diluted 26.2 37.7
27. Superannuation funds
AMP contributes to funded employer-sponsored superannuation funds that exist to provide benefi ts for employees and their dependants on resignation, retirement, disability or death of the employee. The funds consist of both defi ned contribution sections and defi ned benefi t sections.
The defi ned contribution sections receive fi xed contributions from AMP group companies and the group’s legal obligation is limited to these contributions. The defi ned benefi t sections provide members with a choice of lump sum benefi ts or pension benefi ts based on years of membership and fi nal salary. New employees are only offered defi ned contribution style benefi ts.
The disclosures in this Note relate only to the defi ned benefi t sections of the plans.
The following tables summarise the components of the net amount recognised in the Income statement, Statement of comprehensive income, the movements in the defi ned benefi t obligation and plan assets and the net amounts recognised in the consolidated Statement of fi nancial position for the defi ned benefi t funds, determined in accordance with AASB 119 Employee Benefi ts.
However, for the purposes of recommending contributions to the defi ned benefi t funds, fund actuaries consider the positions of the funds as measured under AAS25 Financial Reporting by Superannuation Plans (Australia) and Professional Standard Number 2 Actuarial Reporting for Superannuation Schemes (New Zealand) both of which determine the funds’ liabilities according to different measurement rules than those in AASB 119, largely due to the use of different discount rates in valuing benefi ts. Refer to Note 27(g) for impacts on funding the AMP defi ned benefi ts funds.
For
per
sona
l use
onl
y

103
27. Superannuation funds continued
Consolidated
2011$m
2010$m
(a) Defi ned benefi t plan income (expense) Current service cost (11) (1)Interest cost (35) (18)Expected return on plan assets1,2 39 20
Total defi ned benefi t plan income (expense) (7) 1
(b) Movements in defi ned benefi t obligation Balance at the beginning of the period (341) (345)Balance on acquisition of controlled entity (524) – Current service cost (11) (1)Interest cost (35) (18)Contributions by plan participants (1) – Actuarial gains and losses3 (113) (4)Foreign currency exchange rate changes (5) 8 Benefi ts paid 42 19
Balance at the end of the period (988) (341)
(c) Movement in fair value of plan assets Balance at the beginning of the period 274 289 Balance on acquisition of controlled entity 375 – Expected return on plan assets 39 20 Actuarial gains and losses (64) (11)Foreign currency exchange rate changes 4 (8)Employer contributions 31 3 Contributions by plan participants 1 – Benefi ts paid (42) (19)
Balance at the end of the period 618 274
(d) Defi ned benefi t (liability) asset Present value of wholly funded defi ned benefi t obligations (988) (341)Less: Fair value of plan assets 618 274
Defi ned benefi t (liability) asset recognised on the Statement of fi nancial position4 (370) (67)
Movement in defi ned benefi t (liability) asset (Defi cit) surplus at the beginning of the period (67) (56)Plus: Balance on acquisition of controlled entity (149) – Plus: Total income (expenses) recognised in income (7) 1 Plus: Employer contributions 31 3 Plus: Foreign currency exchange rate changes (1) – Plus: Actuarial gains (losses) recognised in Other comprehensive income5 (177) (15)
Defi ned benefi t (liability) asset recognised at the end of the period (370) (67)
Footnote: 1 The expected return on plan assets is determined at the beginning of the period, and is based on fi nancial modelling of expected real returns for
each of the major asset classes, combined with the price infl ation assumption to arrive at a nominal value for expected returns on plan assets.2 The actual return on fund assets for the period was a gain of $25m (2010: $9m gain).3 As explained in Note 1(dd), actuarial gains and losses are recognised directly in Other comprehensive income.4 The defi ned benefi t liability is measured in accordance with the requirements of AASB 119 Employee Benefi ts and does not represent a
current obligation to provide additional funding to the plans. For the purposes of recommending contributions to the defi ned benefi t funds, fund actuaries consider the positions of the funds as measured under AAS25 Financial Reporting by Superannuation Plans (Australia) and Professional Standard Number 2 Actuarial Reporting for Superannuation Schemes (New Zealand) both of which determine the funds’ liabilities according to different measurement rules than those in AASB 119, largely due to the use of different discount rates in valuing benefi ts. Refer to Note 27(g) for impacts on funding the AMP defi ned benefi ts funds.
5 The cumulative amount of the net actuarial gains recognised in the Statement of comprehensive income is a $162m loss (2010: $15m gain).
For
per
sona
l use
onl
y

Notes to the fi nancial statementsfor the year ended 31 December 2011 continued
AMP Financial Report 2011
104
27. Superannuation funds continued
Consolidated
2011$m
2010$m
2009$m
2008$m
(e) Historical analysis of defi ned benefi t (defi cit) surplusAMP Australian defi ned benefi t (liability) asset Present value of wholly funded defi ned benefi t obligations (372) (317) (312) (362)Less: Fair value of plan assets 239 260 267 251
Net defi ned benefi t (liability) asset recognised in the Statement of fi nancial position (133) (57) (45) (111)
Actuarial gains and (losses) arising on plan liabilities (54) (4) 47 (24)Actuarial gains and (losses) arising on plan assets (24) (10) 17 (107)
AXA Australian defi ned benefi t (liability) asset Present value of wholly funded defi ned benefi t obligations (458) – – – Less: Fair value of plan assets 305 – – –
Net defi ned benefi t (liability) asset recognised in the Statement of fi nancial position (153) – – –
Actuarial gains and (losses) arising on plan liabilities (36) – – – Actuarial gains and (losses) arising on plan assets (34) – – –
AMP New Zealand defi ned benefi t (liability) asset Present value of wholly funded defi ned benefi t obligations (30) (24) (33) (31)Less: Fair value of plan assets 15 14 22 22
Net defi ned benefi t (liability) asset recognised in the Statement of fi nancial position (15) (10) (11) (9)
Actuarial gains and (losses) arising on plan liabilities (4) – (3) 1 Actuarial gains and (losses) arising on plan assets (2) (1) – (7)
AXA New Zealand defi ned benefi t (liability) asset Present value of wholly funded defi ned benefi t obligations (128) – – – Less: Fair value of plan assets 59 – – –
Net defi ned benefi t (liability) asset recognised in the Statement of fi nancial position (69) – – –
Actuarial gains and (losses) arising on plan liabilities (19) – – – Actuarial gains and (losses) arising on plan assets (4) – – –
(f) Principal actuarial assumptionsThe following table sets out the principal actuarial assumptions used as at the reporting date in measuring the defi ned benefi t obligations of the Australian and New Zealand defi ned benefi t funds:
AMP AXA
Australia New Zealand Australia New Zealand
2011 2010 2011 2010 2011 2011
Discount rate 2.9%–6.2% 5.5% 1.7%–2.9% 4.2% 2.9%–6.2% 1.7%–2.9%Expected return on assets (before tax) 8.0% 7.8% 8.3% 9.0% 8.0% 8.3%Expected rate of pension increases 2.5% 2.5% 1.9% 2.2% 2.5% 2.5%Expected rate of salary increases 4.0% 4.0% 4.0% n/a 3.5% 4.0%Proportion of benefi ts expected to be taken as pensions 60.0% 60.0% n/a n/a 90% for
pre-1995 members
60% for post-1994 members
75.0%
For
per
sona
l use
onl
y

105
27. Superannuation funds continued
(g) Arrangements for employer contributions for funding defi ned benefi t fundsFunding methods and current recommendations – AMP AustraliaThe AMP Australian defi ned benefi t fund’s funding policy is intended to fully cover benefi ts by the time they become payable. The method of funding adopted is the attained age normal method. This funding method aims to spread the cost of future benefi ts for current members evenly over their future working lifetimes.
The economic assumptions used to determine the current contribution recommendations are the same as the actuarial assumptions in Note 27(f), except for the discount rate which is assumed to be 8.5 per cent (before tax) for the purposes of determining accrued benefi ts.
As at the most recent actuarial valuation, 31 March 2011, the fund actuary did not identify any defi cit for funding purposes and no additional contributions are required. As at the date of this report, the fund actuary has not indicated any change to this position.
Funding methods and current recommendations – AXA AustraliaThe AXA Australian defi ned benefi t fund’s funding policy is intended to fully cover benefi ts by the time they become payable. The method of funding adopted is the attained age normal method. This funding method aims to spread the cost of future benefi ts for current members evenly over their future working lifetimes.
The economic assumptions used to determine the current contribution recommendations are the same as the actuarial assumptions in Note 27(f), except for the discount rate which is assumed to be 7.4 per cent (before tax) for the purposes of determining accrued benefi ts.
AMP has adopted the fund actuaries’ recommendation that AMP makes additional contributions of $30m per annum, until another review is conducted in 2012. As at the date of the most recent actuarial valuation on 30 June 2010, the accrued benefi ts exceeded the fair value of plan assets by $20m.
Funding methods and current recommendations – AMP New ZealandThe AMP New Zealand defi ned benefi t fund’s funding policy is intended to fully cover benefi ts by the time they become payable. The main group of benefi ts is pension rights of retired members and their spouses. The retirement benefi ts of active members are valued on a simplifi ed actuarial projection basis as they are not material to the valuation of the fund.
AMP has adopted the fund actuary’s recommendation for AMP to make additional contributions of $2m per annum until the fi nancial position of the Plan is suffi ciently improved.
Funding methods and current recommendations – AXA New ZealandThe AXA New Zealand defi ned benefi t fund’s funding policy is intended to fully cover benefi ts by the time they become payable. The main group of benefi ts is pension rights of retired members and their spouses. The retirement benefi ts of active members are valued on a simplifi ed actuarial projection basis as they are not material to the valuation of the fund.
AMP has adopted the fund actuaries’ recommendation that AMP makes additional contributions of $3m per annum. The actuaries of the plan recommended that the funding remain at the current levels.
(h) Allocation of assetsThe asset allocations of the defi ned benefi t funds are shown in the following table:
AMP AXA
Australia1 New Zealand1 Australia1 New Zealand1
2011 2010 2011 2010 2011 2011
Equity 59% 61% 59% 63% 57% 38%Property 18% 10% 11% 12% 5% 7%Fixed interest 14% 22% 23% 20% 25% 49%Cash 3% 5% 7% 5% 1% 6%Other 6% 2% 0% 0% 12% 0%
Footnote: 1 The investment assets of the plans may at times include either direct or indirect investments in AMP Limited shares. These investments are
part of normal investment mandates within the plans and are not signifi cant in relation to total plan assets. The plans do not hold any other assets which are occupied or used by AMP group.
For
per
sona
l use
onl
y

Notes to the fi nancial statementsfor the year ended 31 December 2011 continued
AMP Financial Report 2011
106
28. Share-based payments
(a) Summary of AMP’s share-based payment plansAMP has a number of employee share-based payment plans. Share-based payments place employees participating in those plans (participants) in the position of the shareholder, and in doing so, reward employees for the generation of value to shareholders. Information on plans which AMP currently offers is provided below.
Additionally, details have been provided regarding the Employee Option Plan. This plan is no longer offered to employees, but is included in the details below as awards made in 2001 expired during the year. The option plans were discontinued to simplify the range of long-term incentive plans offered to employees.
The following table shows the expense recorded for AMP share-based payment plans during the year:
Consolidated
2011$’000
2010$’000
Plans currently offered Performance rights 14,500 14,266 Share rights 1,331 – Restricted shares 9,271 8,589 Employee share acquisition plan – matching shares 115 103
Total share-based payments expense 25,217 22,958
(b) Performance rightsPlan descriptionThe CEO and his direct reports, as well as selected senior executives, are required to take their long-term incentives (LTI) awards in the form of performance rights. This is to ensure that those executives who are most directly able to infl uence company performance are appropriately aligned with the interests of shareholders. All other LTI participants are provided with a degree of choice over whether their LTI grant is composed of performance rights, share rights or a combination of the two.
A performance right is a right to acquire one fully paid ordinary share in AMP Limited after a three-year performance period at no cost to the participant, provided a specifi c performance hurdle is met. Prior to conversion into shares (vesting), performance rights holders do not receive dividends or have other shareholder benefi ts (including any voting rights).
AMP has, from time to time, offered share bonus rights to employees in overseas domiciles when it is not possible or tax-effi cient to grant performance rights. The terms and conditions of the share bonus rights are identical to the terms and conditions of the performance rights, except settlement is in cash rather than equity instruments.
The performance hurdleThe number of performance rights that vest is determined by a vesting schedule based on the performance of AMP relative to a comparator group of listed Australian companies over a three-year performance period.
The performance measure is AMP’s total shareholder return (TSR) relative to the top 50 industrials companies in the S&P/ASX 100 Index as at the start of the performance period. In order for any awards to vest, AMP’s TSR must be at or above the median of the comparator group; for this level of performance 50 per cent of the awards vest. The proportion of awards vesting increases on a straight-line basis until performance at the 75th percentile of the comparator group, at which point the awards vest in full. The performance hurdle and vesting schedule were chosen because they require participants to outperform AMP’s key competitors for shareholder funds before the awards generate any value.
At the end of the performance period, an independent external consultant provides the People and Remuneration Committee (PRC) with AMP’s TSR ranking against the comparator group. The PRC then determines the number of performance rights that vest, if any, by applying this data to the vesting schedule. If the performance hurdle is not achieved, the performance rights lapse immediately without opportunity to re-test performance at a later stage.
Exercising performance rightsIf the awards vest, they are automatically exercised on behalf of the participant (i.e. converted to shares). Upon exercise, participants become entitled to shareholder benefi ts, including dividends and voting rights. For performance rights issued from 2008 to 2010, if performance rights are not automatically exercised on the participants’ behalf, the participant has two years from the end of the performance period to exercise vested awards. When performance rights are exercised, the AMP shares needed to satisfy the awards are bought on market through an independent third party, so that there is no dilutionary effect on the value of existing AMP shares.
Treatment of performance rights on ceasing employment and change of controlTypically, unvested performance rights lapse if the participant resigns from AMP or is terminated for misconduct or inadequate performance. In other cases, such as retirement and redundancy, performance rights may be retained by the participant with vesting continuing to be subject to the same vesting conditions as if they had remained in AMP employment. In the event that AMP is subject to a takeover change of control, unvested performance rights typically vest. F
or p
erso
nal u
se o
nly

107
28. Share-based payments continued
Commencing from the performance rights granted in September 2011, the board has the discretion to determine an alternative treatment on cessation of employment and change of control (i.e. to determine that the performance rights lapse, are retained or vest when they would not have otherwise), if deemed appropriate in the light of the specifi c circumstances.
Plan valuationThe fair value of performance rights has been calculated as at the grant date, by external consultants using a simulation technique known as a ‘Monte Carlo simulation’. Fair value has been discounted for the probability of not meeting the TSR performance hurdles.
In determining the share-based payments expense, the number of instruments expected to vest has been adjusted to refl ect the number of employees expected to remain with AMP until the end of the performance period.
For the purposes of the valuation it is assumed performance rights are exercised as soon they have vested. Assumptions regarding the dividend yield and volatility have been estimated based on AMP’s actual historic dividend yield and volatility over an appropriate period.
The following table shows the factors which were considered in determining the independent fair value of the performance rights granted during 2011 and the comparative period (2010):
Grant dateShare price
Contractual life
Dividend yield Volatility
Risk-free rate
Performance hurdle
discount Fair
value
09/09/2011 $4.15 2.9 years 5.9% 34% 3.7% 54% $1.9209/06/2011 $4.88 2.8 years 5.5% 36% 4.8% 51% $2.3909/06/2011 $4.88 2.1 years 5.5% 36% 4.8% 55% $2.1908/09/2010 $5.04 2.9 years 5.2% 39% 4.5% 50% $2.5012/03/2010 $6.13 2.4 years 5.3% 39% 4.9% 42% $3.53
The following table shows the movements during the period of all performance rights:
Grant date Exercise periodExercise
priceBalance at 1 Jan 2011
Exercised during
the year
Granted during
the year
Lapsed during
the yearBalance at
31 Dec 20111
06/06/2008 01/01/2011–31/12/2012 Nil 102,914 – – 102,914 –19/09/2008 01/08/2011–31/07/2013 Nil 4,227,729 – – 4,227,729 –20/03/2009 01/08/2011–31/07/2013 Nil 18,116 – – 18,116 –12/03/2010 01/08/2012–31/07/2014 Nil 4,951,880 – – 72,594 4,879,286 08/09/2010 01/08/2013–31/07/2015 Nil 4,148,304 – – 33,972 4,114,332 09/06/2011 01/08/2013–31/07/2015 Nil – – 88,040 – 88,040 09/06/2011 01/05/2014–30/04/2016 Nil – – 729,167 – 729,167 09/09/2011 n/a2 Nil – – 5,759,283 4,762 5,754,521
Total 13,448,943 – 6,576,490 4,460,087 15,565,346
Footnote: 1 The weighted average remaining contractual life of performance rights outstanding at the end of the period is 1.7 years.2 The share rights granted on 9 September 2011 have no exercise period as they are automatically exercised upon vesting.
From the end of the fi nancial year and up to the date of this report, no performance rights have been issued, no performance rights have been exercised, and 36,112 performance rights have lapsed. Of the performance rights outstanding at the end of the period, none have vested or become exercisable.
(c) Share rightsPlan descriptionAs described above, LTI participants below the CEO and his direct reports may be eligible to take some of their award in share rights.
A share right is a right to acquire one fully paid ordinary share in AMP Limited after a specifi ed service period at no cost to the participant, provided a specifi c service condition is met. The service period is typically three years, but may vary where the share rights are awarded to retain an employee for a critical period. Prior to conversion into shares (vesting), share rights holders do not receive dividends or have other shareholder benefi ts (including any voting rights).
As this program is designed as a means of recognising and retaining employees, no performance hurdles apply, other than continued service for the duration of the three-year holding lock.
AMP has, from time to time, offered share bonus rights without performance conditions to employees in overseas domiciles when it is not possible or tax-effi cient to grant share rights or restricted shares. The terms and conditions of the share bonus rights are identical to the terms and conditions of the share rights, except settlement is in cash rather than equity instruments.
For
per
sona
l use
onl
y

Notes to the fi nancial statementsfor the year ended 31 December 2011 continued
AMP Financial Report 2011
108
28. Share-based payments continued
Exercising share rightsIf the awards vest, they are automatically exercised on behalf of the participant (i.e. converted to shares). Upon exercise, participants become entitled to shareholder benefi ts, including dividends and voting rights. When share rights are exercised, the AMP shares needed to satisfy the awards are bought on-market through an independent third party, so that there is no dilutionary effect on the value of existing AMP shares.
Treatment of share rights on ceasing employment and change of controlTypically, unvested share rights lapse if the participant resigns from AMP or is terminated for misconduct or inadequate performance. In other cases, such as retirement and redundancy, the participant typically retains their share rights at the board’s discretion. In the event that AMP is subject to a takeover change of control, treatment of unvested share rights is subject to the board’s discretion.
Plan valuationThe fair value of share rights has been calculated as at the grant date, by external consultants using a ‘discounted cash fl ow’ methodology. Fair value has been discounted for the present value of dividends expected to be paid during the vesting period to which the participant is not entitled.
In determining the share-based payments expense, the number of instruments expected to vest has been adjusted to refl ect the number of employees expected to remain with AMP until the end of the performance period.
For the purposes of the valuation it is assumed share rights are exercised as soon they have vested. Assumptions regarding the dividend yield have been estimated based on AMP’s actual historic dividend yield over an appropriate period.
The following table shows the factors which were considered in determining the independent fair value of the share rights granted during 2011 and the comparative period (2010). Included in this table are the share bonus rights granted to overseas executives to mimic restricted share awards (disclosed under the heading of ‘restricted shares’ in prior year Annual Reports). Share bonus rights without performance conditions have terms that are identical to share rights, except that they are settled in cash rather than equity instruments.
Grant dateShare price
Contractual life
Dividend yield
Dividend discount
Fair value
09/09/2011 $4.15 2.9 years 5.9% 16% $3.5009/09/2011 $4.15 2.0 years 5.9% 11% $3.6908/09/2010 $5.04 2.9 years 5.2% 14% $4.3408/09/2010 $5.04 2.0 years 5.2% 10% $4.5628/05/2010 $5.65 1.9 years 5.3% 9% $5.1312/03/2010 $6.13 2.4 years 5.3% 12% $5.4012/03/2010 $6.13 2.0 years 5.3% 10% $5.53
The following table shows the movement in share rights (and share bonus rights without performance conditions) outstanding during the year.
Grant date Exercise periodExercise
priceBalance at 1 Jan 2011
Exercised during
the year
Granted during
the year
Lapsed during
the yearBalance at
31 Dec 20111
19/09/2008 01/08/2011–31/07/2013 Nil 218,458 – – 218,458 –12/03/2010 23/02/2012–22/02/2014 Nil 41,867 – – – 41,86712/03/2010 01/08/2012–31/07/2014 Nil 212,155 – – – 212,15528/05/2010 22/03/2012–21/03/2014 Nil 35,211 – – – 35,21108/09/2010 16/08/2012–15/08/2014 Nil 20,791 – – 20,791 –08/09/2010 01/08/2013–31/07/2015 Nil 123,217 – – 7,642 115,57509/09/2011 n/a2 Nil – – 35,630 – 35,63009/09/2011 n/a2 Nil – – 2,791,895 6,216 2,785,679
Total 651,699 – 2,827,525 253,107 3,226,117
Footnote:1 The weighted average remaining contractual life of performance rights outstanding at the end of the period is 2.3 years.2 The share rights granted on 9 September 2011 have no exercise period as they are automatically exercised upon vesting.
From the end of the fi nancial year and up to the date of this report, no share rights have been issued, no share rights have been exercised, and 7,143 share rights have lapsed. Of the share rights outstanding at the end of the period, none have vested or become exercisable.
For
per
sona
l use
onl
y

109
28. Share-based payments continued
(d) Restricted sharesPlan descriptionFrom time to time, AMP awards restricted shares to retain critical employees. Additionally, prior to 2011, Australian LTI participants were eligible to take some of their award in restricted shares (rather than share rights).
A ‘restricted share’ is an ordinary AMP share that has a holding lock in place until the specifi ed vesting period ends. The vesting period is typically three years, but may vary where the restricted shares are awarded to retain an employee for a critical period. During this time, the holder is eligible for dividends, but is unable to sell, transfer or hedge their award.
As this program is designed as a means of recognising and retaining employees, no performance hurdles apply, other than continued service for the duration of the three-year holding lock. If the individual resigns from AMP (or employment is terminated for misconduct or inadequate performance) during the holding period, the shares are forfeited.
In cases such as retirement and redundancy, the individual retains their restricted shares; however the holding lock remains in place until the end of the three-year vesting period. Restricted shares are bought on market and granted at no cost to employees.
Plan valuationThe fair value of restricted shares has been determined as the market price of AMP ordinary shares on the grant date. As employees holding restricted shares are entitled to dividend payments, no adjustment has been made to the fair value in respect of future dividend payments. In determining the share-based payments expense for the period, the number of instruments expected to vest has been adjusted to refl ect the number of employees expected to remain with AMP until the end of the vesting period.
The following table shows the number of restricted shares that were granted during 2011 and the comparative period (2010), and the fair value per instrument of restricted shares as at the grant date.
Grant date Number granted Weighted average fair value
09/09/2011 221,725 $4.1509/06/2011 39,416 $4.8808/09/2010 1,235,923 $5.0228/05/2010 160,264 $5.6012/03/2010 1,611,289 $6.14
AMP offers share bonus rights to employees in overseas domiciles where it was not possible or tax-effi cient to grant restricted shares. The terms and conditions of the share bonus rights are identical to the terms and conditions of the restricted shares except the share bonus rights are not entitled to dividends and settlement is in cash rather than equity instruments.
(e) Employee Share Acquisition PlanPlan descriptionFrom time to time, AMP has provided employees and executives with the opportunity to become shareholders in AMP through the Employee Share Acquisition Plan (ESAP), typically by way of salary sacrifi cing their fi xed remuneration or short-term incentive to acquire shares. Depending on the terms of the particular award, participants may be entitled to receive matching shares for shares acquired under the ESAP (e.g. the most recent awards provided one free share for every 10 shares acquired via salary sacrifi ce). Additionally, AMP can provide employees with free shares under the ESAP. Where the awards are acquired at no cost to the participant, service-based conditions must be met for the participant to receive their full entitlement. There are no performance hurdles applying to the plan as it is primarily designed to encourage employee share ownership.
The plan was suspended midway through 2009 in Australia due to the changes to the taxation treatment of employee share plan awards. Consequently, no shares were acquired by Australian employees under the ESAP plan in 2010 or 2011. The plan continues to operate in New Zealand.
If applicable, matching shares are bought on market through an independent third party.
Participants who cease to be employed within the AMP group within the three-year holding period may lose their entitlement to some or all of their matching shares or free shares, depending on the reason for leaving the company. To receive the maximum entitlement, participants must be employed by AMP for the whole three-year period.
Plan valuationAll awards made during 2011 and the comparative year (2010) were offers to salary sacrifi ce to acquire shares, with matching shares awarded on a one-for-ten basis after a three-year vesting period. Each matching share has been valued by external consultants as the face value of an AMP ordinary share at the date the salary sacrifi ce shares were acquired, less the present value of the expected dividends (to which the participant is not entitled until the end of the vesting period). The number of matching shares expected to be granted is estimated based on the average number of shares held in the ESAP by each employee at the beginning of each year. In determining the share-based payments expense for the period, the number of matching shares expected to be granted has been adjusted to refl ect the number of employees expected to remain with AMP until the end of the three-year vesting period.
The following table shows the number of matching shares expected to be granted based on the shares purchased by employees under the ESAP during the current period and the comparative period, and the fair value.
For
per
sona
l use
onl
y

Notes to the fi nancial statementsfor the year ended 31 December 2011 continued
AMP Financial Report 2011
110
28. Share-based payments continued
Grant dateEstimated number of
matching shares to be granted Weighted average fair value
2011 – various 652 $3.982010 – various 762 $4.90
2006 and 2007 capital returnsShareholders approved capital returns of 40 cents per share at the AMP Limited Annual General Meetings in 2006 and 2007.
To compensate for the resulting reduction in the value of entitlements to matching shares, ESAP participants are entitled to be paid 40 cents per vested matching share for each matching share entitlement held in the ESAP prior to the relevant capital return date (and for each capital return). In 2011, a cash payment of 40 cents per vested matching share (up to a maximum of 100 shares) was paid to each ESAP participant in relation to the 2007 capital return (i.e. matching shares on ESAP acquisitions from 1 January 2007 to the May 2007 capital return date).
(f) Employee and Executive Option PlanPlan descriptionIn the past, employees and executives were granted options to purchase AMP shares, subject to various performance hurdles. The last options to be awarded under this plan were granted under the Employee Option Plan in 2001. The performance period for the 2011 Options was completed in 2004 and they remained exercisable until 2011.
The table below shows options issued under the Employee Option Plan that were exercisable during 2011.
Grant date Exercise periodExercise
price1Balance at 1 Jan 2011
Exercised during
the year
Granted during
the year
Lapsed during
the yearBalance at
31 Dec 20112
Employee Option Plan 21/07/2001 21/07/2004–20/07/2011 $14.75 431,455 – – 431,455 – 15/12/2001 15/12/2004–14/12/2011 $12.89 1,294 – – 1,294 –
Total 432,749 – – 432,749 –
Footnote: 1 The exercise prices shown in this column became effective on 17 May 2007. To compensate for the impact of the 2007 capital return of
40 cents per share the exercise prices of outstanding options were reduced by 40 cents per share in accordance with ASX listing rules.2 The weighted average remaining contractual life of options outstanding at the end of the period is 1.3 years.
Since the end of the fi nancial year and up to 15 February, no employee options have been granted. Thus there are nil options on issue at 15 February 2012.
2006 and 2007 capital returnIn accordance with the ASX Listing Rules and the rules of the plan, the exercise prices of outstanding options were reduced by 40 cents per option following the 2006 and 2007 capital returns of 40 cents per share to shareholders. The terms and conditions of the options were not altered as a result of the capital returns as the reduction in exercise prices occurred under their original terms.
For
per
sona
l use
onl
y

111
29. Group controlled entity holdings
% Holdings
Name of entity Country of incorporation Share type Footnote 2011 2010
140 St Georges Terrace Pty Limited Australia Ord 100 100255 George Street Investment A Pty Ltd Australia Ord 100 100255 George Street Investment B Pty Ltd Australia Ord 100 10035 Ocean Keys Pty Limited Australia Ord 100 100Abbey Capital Real Estate Pty Limited Australia Ord 100 100Accountants Resourcing (Australia) Pty Ltd Australia Ord 1 100 –ACIT Finance Pty Limited Australia Ord 1 100 –ACN 100 509 993 Pty Ltd Australia Ord 1 100 –ACPP Industrial Pty Ltd Australia Ord 100 100ACPP Offi ce Pty Ltd Australia Ord 100 100ACPP Retail Pty Ltd Australia Ord 100 100AdviceFirst Limited New Zealand Ord 1 67 –Adviser Resourcing Pty Ltd Australia Ord 1 100 –Aged Care Investment Services No. 1 Pty Limited Australia Ord 100 100Aged Care Investment Services No. 2 Pty Limited Australia Ord 100 100Allmarg Corporation Limited New Zealand Ord, Pref 100 100AMP (UK) Finance Services Plc United Kingdom Ord 100 100AMP ASAL Pty Ltd Australia Ord 100 100AMP Australian Financial Services Holdings Limited Australia Ord 2 – 100AMP Bank Limited Australia Ord 100 100AMP Capital (International Finance No. 1) SA Luxembourg Ord, MRPS 2 – 100AMP Capital (International Finance No. 2) SA Luxembourg Ord, MRPS 2 – 100AMP Capital AB Holdings Pty Limited Australia Ord 100 100AMP Capital Advisors India Private Limited India Ord 100 100AMP Capital Bayfair Pty Limited Australia Ord 100 100AMP Capital Core Infrastructure Pty Limited Australia Ord 1 100 –AMP Capital Finance Limited Australia Ord 100 100AMP Capital Global Property Securities Pty Limited Australia Ord 2 – 100AMP Capital Holdings Limited Australia Ord 100 100AMP Capital Investments No. 2 Limited New Zealand Ord A & B, Pref 100 100AMP Capital Investments No. 8 Limited New Zealand Ord A & B, Pref 100 100AMP Capital Investments No 11 Limited New Zealand Ord A & B 100 100AMP Capital Investments No. 14 Limited New Zealand Ord A & B, Pref 100 100AMP Capital Investors (Hong Kong) Limited Hong Kong Ord 100 100AMP Capital Investors (Jersey No. 2) Limited Jersey Ord 1 100 –AMP Capital Investors (Luxembourg No. 3) S.à r.l. Luxembourg Ord 100 100AMP Capital Investors (Luxembourg No. 4) S.à r.l. Luxembourg Ord 100 100AMP Capital Investors (Luxembourg No. 5) S.à r.l. Luxembourg Ord 100 100AMP Capital Investors (Luxembourg No. 6) S.à r.l. Luxembourg Ord 100 100AMP Capital Investors (Luxembourg) S.a.r.l. Luxembourg Ord 100 100AMP Capital Investors (New Zealand) Limited New Zealand Ord 100 100AMP Capital Investors (Property Funds Management Jersey) Limited Jersey Ord 100 100AMP Capital Investors (Singapore) Private Property Trust Limited [formerly AMP Capital Investors (Singapore) REIT Management Limited] Singapore Ord 100 100AMP Capital Investors (Singapore) Pte Ltd Singapore Ord 100 100AMP Capital Investors (UK) Limited United Kingdom Ord 100 100AMP Capital Investors (US) Limited USA Ord 100 100AMP Capital Investors Advisory (Beijing) Limited China Ord 100 100AMP Capital Investors International Holdings Limited Australia Ord 100 100AMP Capital Investors Japan Japan Ord 100 100AMP Capital Investors KK Japan Ord 100 100AMP Capital Investors Limited Australia Ord 100 100AMP Capital Investors Property Japan KK Japan Ord 100 100AMP Capital Investors Real Estate Pty Limited Australia Ord 100 100AMP Capital Lifestyle Limited Australia Ord 100 100AMP Capital Offi ce & Industrial (Singapore) Pte Limited Singapore Ord 100 100AMP Capital Offi ce and Industrial Pty Limited Australia Ord 100 100AMP Capital Palms Pty Limited Australia Ord 100 100AMP Capital Property Nominees Ltd Australia Ord 100 100AMP Capital Shopping Centres Pty Limited Australia Ord 100 100AMP CMBS No. 1 Pty Limited Australia Ord 100 100AMP CMBS No. 2 Pty Limited Australia Ord 100 100AMP Crossroads Pty Limited Australia Ord 100 100AMP Custodian Services (NZ) Limited New Zealand Ord 100 100
For
per
sona
l use
onl
y

Notes to the fi nancial statementsfor the year ended 31 December 2011 continued
AMP Financial Report 2011
112
29. Group controlled entity holdings continued
% Holdings
Name of entity Country of incorporation Share type Footnote 2011 2010
AMP Davidson Road Pty Limited Australia Ord 100 100AMP Finance Limited Australia Ord 100 100AMP Finance Services Limited Australia Ord 100 100AMP Financial Investment Group Holdings Limited Australia Ord 100 100AMP Financial Planning Pty Limited Australia Ord 100 100AMP Financial Services Holdings Limited Australia Ord 100 100AMP GBS Limited Australia Fixed 100 100AMP GDPF Pty Limited Australia Ord 100 100AMP GI Distribution Pty Limited Australia Ord 2 – 100AMP Global Property Investments Pty Ltd Australia Ord 100 100AMP Group Finance Services Limited Australia Ord 100 100AMP Group Holdings Limited Australia Ord 100 100AMP Group Services Limited Australia Ord 100 100AMP Holdings Limited Australia Ord A, Ord B, Red Pref B Class 100 100AMP Insurance Investment Holdings Pty Limited Australia Ord 100 100AMP Investment Management (NZ) Limited New Zealand Ord 100 100AMP Investment Services No. 2 Pty Limited Australia Ord 100 100AMP Investment Services Pty Limited Australia Ord 100 100AMP Investments Chile Limitada Chile Ord 2 – 100AMP Lending Services Limited Australia Ord 100 100AMP Life (NZ) Investments Holdings Limited New Zealand Ord 100 100AMP Life (NZ) Investments Limited New Zealand Ord 100 100AMP Life Limited Australia Ord 100 100AMP Macquarie Holding Pty Limited Australia Ord 100 100AMP Macquarie Pty Limited Australia Ord 100 100AMP NZ Carpark Limited New Zealand Ord 100 100AMP Pacifi c Fair Pty Limited Australia Ord 100 100AMP Personal Investment Services Limited Australia Ord 100 100AMP Planner Register Company Pty Limited Australia Ord 100 100AMP Private Capital Funds Holdings Limited New Zealand Ord, Pref 100 100AMP Private Capital New Zealand Limited New Zealand Ord 100 100AMP Private Capital No. 2 Pty Limited Australia Ord 100 100AMP Private Capital Pty Limited Australia Ord 100 100AMP Private Investments Pty Limited Australia Ord 100 100AMP Private Wealth Management Pty Limited Australia Ord 100 100AMP Property Investments (Qld) Pty. Ltd. Australia Ord 100 100AMP Remuneration Reward Plans Nominees Pty. Limited Australia Ord 100 100AMP Riverside Plaza Pty Limited Australia Ord 100 100AMP Royal Randwick Pty Limited Australia Ord 100 100AMP Services (NZ) Limited New Zealand Ord 100 100AMP Services Holdings Limited Australia Ord 100 100AMP Services Limited Australia Ord 100 100AMP SMSF Holding Co Limited Australia Ord 100 100AMP SMSF Investments Pty Limited Australia Ord 1 100 –AMP Superannuation (NZ) Limited New Zealand Ord 100 100AMP Superannuation Limited Australia Ord 100 100AMP Warringah Mall Pty Ltd Australia Ord 100 100AMP/ERGO Mortgage and Savings Limited New Zealand Ord 100 100Arrive Wealth Management Limited Australia Ord 100 100Arrow Systems Pty Limited Australia Ord 100 100Arthur Ellis & Co. Limited New Zealand Ord 2 – 100Associated Planners Financial Services Pty Ltd Australia Ord 1 95 –Associated Planners Strategic Finance Pty Ltd Australia Ord 1 95 –Assure Funds Management Limited New Zealand Ord 1,2 – –Assure New Zealand Limited New Zealand Ord 1,2 – –Assure Nominees Limited New Zealand Ord 1 100 –Auburn Mega Mall Pty Limited Australia Ord 100 100Australian Mutual Provident Society Pty Limited Australia Ord 100 100Australian Securities Administration Limited Australia Ord 100 100AWOF New Zealand Offi ce Pty Limited Australia Ord 100 100AXA (Guangzhou) Software Development and Services Company Limited China Ord 1,2 – –AXA (Hong Kong) Life Insurance Company Limited Hong Kong Ord 1,2 – –AXA APH Executive Plan (Australia) Pty Ltd Australia Ord 1 100 –
For
per
sona
l use
onl
y

113
29. Group controlled entity holdings continued
% Holdings
Name of entity Country of incorporation Share type Footnote 2011 2010
AXA APH GESP Deferred (Australia) Pty Ltd Australia Ord 1 100 –AXA APH GESP Exempt (Australia) Pty Ltd Australia Ord 1 100 –AXA Asia Pacifi c Finance Limited Australia Ord 1 100 –AXA Asia Pacifi c Holdings Limited Australia Ord 1 100 –AXA Australia Staff Superannuation Pty Ltd Australia Ord 1 100 –AXA China Region (Bermuda) Limited Bermuda Ord 1,2 – –AXA China Region Insurance Company (Bermuda) Limited Bermuda Ord 1,2 – –AXA China Region Insurance Company Limited Hong Kong Ord 1,2 – –AXA China Region Investment Services Limited Hong Kong Ord 1,2 – –AXA China Region Limited Bermuda Ord 1,2 – –AXA China Region Trustee Limited Hong Kong Ord 1,2 – –AXA Financial Planning Limited Australia Ord 1 100 –AXA Financial Services (Singapore) Pte Ltd Singapore Ord 1,2 – –AXA Financial Services Holdings Limited Bermuda Ord 1,2 – –AXA Financial Services Trustee Limited Hong Kong Ord 1,2 – –AXA Funds Management Pty Ltd Australia Ord 1 100 –AXA Hong Kong Finance Limited Hong Kong Ord 1 100 –AXA India Holdings Limited Mauritius Ord 1,2 – –AXA Life Insurance Singapore Pte Ltd Singapore Ord 1,2 – –AXA New Zealand Finance Pty Ltd Australia Ord 1 100 –AXA New Zealand HJV Limited New Zealand Ord 1 100 –AXA New Zealand Limited New Zealand Ord 1 100 –AXA New Zealand Nominees Limited New Zealand Ord 1 100 –AXA Partners Limited Hong Kong Ord 1,2 – –AXA Wealth Management (HK) Limited Hong Kong Ord 1,2 – –AXA Wealth Management Limited New Zealand Ord 1 100 –AXA Wealth Management Singapore Pte Ltd Singapore Ord 1,2 – –BMRI Financial Services Pty Ltd Australia Ord 1 100 –Carter Bax Pty Ltd Australia Ord 1 100 –CBD Financial Planning Pty Limited Australia Ord 100 100Charter Financial Planning Limited Australia Ord 1 100 –Client Portfolio Administration Limited New Zealand Ord 1,2 – –Client Reserve Limited New Zealand Ord 1 100 –Clientcare Financial Planning Pty Ltd Australia Ord 1 100 –Collins Place No. 2 Pty Ltd Australia Ord 100 100Collins Place Pty Limited Australia Ord 100 100Datrix Limited United Kingdom Ord 1,2 – –Detura Limited British Virgin IsIands Ord 1,2 – –Didus Pty Limited Australia Ord 1 100 –Donaghys Australia Pty Limited New Zealand Ord, Redem Pref 58 50Donaghys Industries Limited New Zealand Ord 58 50Donaghys International Limited New Zealand Ord, Pref 58 50Donaghys Limited New Zealand Ord A & B 58 50Donaghys Pty Limited New Zealand Ord A, B & E 58 50Enemelay Investments Pty Ltd Australia Ord 1 100 –Financial Composure Pty Ltd Australia Ord 1 95 –Financially Yours Holdings Pty Ltd Australia Ord 1 80 –Financially Yours Pty Ltd Australia Ord 1 80 –First Quest Capital Pty Ltd Australia Ord 1 95 –Focus Property Services Pty Limited Australia Ord 56 98Foundation Wealth Advisers Pty Ltd Australia Ord 1 57 –Garrisons (Rosny) Pty Ltd Australia Ord 1 100 –Genesys Group Holdings Pty Ltd Australia Ord 1 100 –Genesys Group Pty Ltd Australia Ord 1 95 –Genesys Holdings Limited Australia Ord 1 95 –Genesys Kew Pty Ltd Australia Ord 1 100 –Genesys Wealth Advisers (WA) Pty Ltd Australia Ord 1 100 –Genesys Wealth Advisers Ltd Australia Ord 1 95 –Glendenning Pty Limited Australia Ord 100 100GWM Spicers Limited New Zealand Ord 1 100 –Hillross Alliances Limited Australia Ord 100 100Hillross Financial Services Limited Australia Ord 100 100Hillross Innisfail Pty Limited Australia Ord 100 100Hillross Wealth Management Centre Canberra Pty Limited Australia Ord 2 – 50Hillross Wealth Management Centre Melbourne Pty Limited Australia Ord 100 100Hindmarsh Square Financial Services Pty Ltd Australia Ord 1 100 –
For
per
sona
l use
onl
y

Notes to the fi nancial statementsfor the year ended 31 December 2011 continued
AMP Financial Report 2011
114
29. Group controlled entity holdings continued
% Holdings
Name of entity Country of incorporation Share type Footnote 2011 2010
Hindmarsh Square Wealth Advisers Pty Ltd Australia Ord 1 72 –Honeysuckle 231 Pty Limited Australia Ord 60 60Hospital Car Parking Holdings Limited New Zealand Ord 100 100Hospital Car Parking Limited New Zealand Ord 100 100INSSA Pty Limited Australia Ord 100 100Integrity Financial Advice Network Company Limited Hong Kong Ord 1,2 – –Integrity Financial Advice Network Holdings Limited Cayman Islands Ord 1,2 – –Integrity Independent Risk & Financial Solutions Company Limited China Ord 1,2 – –Integrity Independent Risk & Financial Solutions Holdings Limited New Zealand Ord 1,2 – –Integrity Partnership Limited Cayman Islands Ord 1,2 – –Inversiones Mineras Los Andes Limitada Chile Ord 2 – 100ipac Asset Management Limited Australia Ord 1 100 –ipac Financial Care Pty Ltd Australia Ord 1 67 –ipac Financial Planning Hong Kong Limited China Ord 1,2 – –ipac Financial Planning Taiwan Ltd Taiwan Ord 1,2 – –ipac Group Services Pty Limited Australia Ord 1 100 –ipac Portfolio Management (Dublin) Ltd Ireland Ord 1,2 – –ipac Portfolio Management Limited Australia Ord 1 100 –ipac Securities Limited Australia Ord 1 100 –ipac Taxation Services Pty Ltd Australia Ord 1 75 –Jeminex Pty Limited Australia Ord 51 51John Coombes & Company Pty Ltd Australia Ord 1 55 –Kent Street Pty Limited Australia Ord 100 100Kiwi Kat Limited New Zealand Ord 70 70KiwiPlus Limited New Zealand Ord 1 100 –Knox City Shopping Centre Investments (No. 2) Pty Limited Australia Ord 100 100Kramar Holdings Pty Limited Australia Ord 78 78Lidomain Pty Ltd Australia Ord 1 100 –LifeFX Pty Ltd Australia Ord 1 100 –Lindwall Group Pty Ltd Australia Ord 1 100 –Marrickville Metro Shopping Centre Pty Limited Australia Ord 100 100Monitor Money Corporation Pty Ltd Australia Ord 1 100 –Mortgage Backed Bonds Limited New Zealand Ord 1 100 –Mowla Pty. Ltd. Australia Ord 100 100Multiport Pty Ltd Australia Ord 1 100 –Multiport Resources Pty Ltd Australia Ord 1 100 –National Mutual Assets Management (New Zealand) Limited New Zealand Ord 1,2 – –National Mutual Corporate Superannuation Services Limited New Zealand Ord 1,2 – –National Mutual CPS Management Limited New Zealand Ord 1 100 –National Mutual Funds Management (Global) Limited Australia Ord 1 100 –National Mutual Funds Management Limited Australia Ord 1 100 –National Mutual Funds Management NZ Limited New Zealand Ord 1,2 – –National Mutual International Pty Limited Australia Ord 1,2 – –National Mutual Leasing NZ Limited New Zealand Ord 1 100 –National Mutual Life Nominees Limited Australia Ord 1 100 –National Mutual Superannuation Master Trustee Limited New Zealand Ord 1 100 –Network Financial Services Limited Hong Kong Ord 1,2 – –NM Computer Services Pty Ltd Australia Ord 1 100 –NM Rural Enterprises Pty Ltd Australia Ord 1 100 –NM Superannuation Pty Ltd Australia Ord 1 100 –NMMT Limited Australia Ord 1 100 –Northstar Lending Pty Ltd Australia Ord 1 100 –Omega (Australia) Pty Limited Australia Ord 100 100Pajoda Investments Pty Ltd Australia Ord 1 55 –Parkside Investorplus Solutions Pty Ltd Australia Ord 1 100 –PHFT Finance Pty Limited Australia Ord 100 100PPS Lifestyle Solutions Pty Ltd Australia Ord 1 100 –PremierOne Mortgage Advice Pty Limited Australia Ord 100 100Principal Healthcare Finance No. 2 Pty Limited Australia Ord 100 100Principal Healthcare Finance Pty Limited Australia Ord 100 100Principal Healthcare Holdings Pty Limited Australia Ord 100 100Priority One Agency Services Pty Ltd Australia Ord 100 100Priority One Financial Services Limited Australia Ord 100 100Private Wealth Managers Pty Ltd Australia Ord 1 100 –
For
per
sona
l use
onl
y

115
29. Group controlled entity holdings continued
% Holdings
Name of entity Country of incorporation Share type Footnote 2011 2010
PT.AXA Asset Management Indonesia Indonesia Ord 1,2 – –PT.AXA Financial Indonesia Indonesia Ord 1,2 – –PT.AXA Life Indonesia Indonesia Ord 1,2 – –PT.AXA Services Indonesia Indonesia Ord 1,2 – –PT.Indonesia Emas Parkasa Indonesia Ord 1,2 – –PT.Kotak Biru Investama Indonesia Ord 1,2 – –PT.Kotak Biru Konsultama Indonesia Ord 1,2 – –Quadrant Securities Pty Ltd Australia Ord 1 95 –Quantum Financial Solutions Limited New Zealand Ord 1 100 –Quay Mining (No. 2) Limited Bermuda Ord, Red Pref 100 100Quay Mining Pty Limited Australia Ord 100 100Resourcing Services SDN BHD Malaysia Ord 1 80 –Roost 2007 Limited New Zealand Ord 100 100Scrabster Bay Pty Limited Australia Ord 100 100SG (Aust) Holdings Pty Ltd Australia Ord 1 100 –SG Holdings Limited New Zealand Ord 1 100 –Silverton Securities Pty Ltd Australia Ord 1 100 –SMSF Advice Pty Ltd Australia Ord 1 100 –Solar Risk Pty Ltd Australia Ord 1 100 –Spicers Portfolio Management Limited New Zealand Ord 1 100 –SPP No. 1 (Alexandra Canal) Pty Limited Australia Ord 86 86SPP No. 1 (Cowes) Pty Limited Australia Ord 86 86SPP No. 1 (H) Pty Limited Australia Ord 86 86SPP No. 1 (Hawthorn) Pty Limited Australia Ord 86 86SPP No. 1 (Mona Vale) Pty Limited Australia Ord 86 86SPP No. 1 (Mornington) Pty Limited Australia Ord 86 86SPP No. 1 (Mt. Waverley Financing) Pty Limited Australia Ord 86 86SPP No. 1 (Mt. Waverley) Pty Limited Australia Ord 86 86SPP No. 1 (Newcastle) Pty Limited Australia Ord 86 86SPP No. 1 (North Melbourne) Pty Limited Australia Ord 86 86SPP No. 1 (Pakenham) Pty Limited Australia Ord 86 86SPP No. 1 (Point Cook) Pty Limited Australia Ord 86 86SPP No. 1 (Port Melbourne) Pty Limited Australia Ord 86 86SPP No. 1 (Q Stores) Pty Limited Australia Ord 86 86SPP No. 1 (Rosebery) Pty Limited Australia Ord 86 86SPP No. 1 Holdings Pty Limited Australia Ord 86 86SPP No. 3A Investments Pty Limited Australia Ord 100 100Stephenson & Watt Pty Ltd Australia Ord 1 100 –Sterling Portfolio Management Limited New Zealand Ord 1 100 –Sterrey Financial Planning Pty Ltd Australia Ord 1 98 –Strategic Planning Partners Pty Ltd Australia Ord 1 100 –Strategic Wealth Solutions Pty Ltd Australia Ord 1 100 –Sugarland Shopping Centre Pty Limited Australia Ord 100 100Sunshine West Development Pty Limited Australia Ord 75 75Sunshine West Income Pty Limited Australia Ord 100 100Suwarraow Pty Ltd Australia Ord 1 100 –Swiss Privilege Limited Hong Kong Ord 1,2 – –Synergy Capital Management Pty Ltd Australia Ord 1 95 –TFS Financial Planning Pty Ltd Australia Ord 1 100 –The India Infrastructure Fund LLC Mauritius Red Pref 100 100The National Mutual Life Association of Australasia Limited Australia Ord 1 100 –TM Fallback Options Pty Ltd Australia Ord 1 100 –TM Securities Pty Ltd Australia Ord 1 100 –TOA Pty Ltd Australia Ord 100 100Tynan Mackenzie Holdings Pty Ltd Australia Ord 1 73 –Tynan Mackenzie Pty Ltd Australia Ord 1 98 –United Equipment Holdings Pty Limited Australia Ord 60 53Walker Lawrence & Associates Pty Ltd Australia Ord 1 100 –Waterfront Place (No. 2) Pty. Ltd. Australia Ord 100 100Waterfront Place (No. 3) Pty. Ltd. Australia Ord 100 100Wealth Management Maritius Holdings Limited Mauritius Ord 1,2 – –Wilsanik Pty Ltd Australia Ord 1 100 –
Footnote: 1 Controlling interest acquired in 2011. 2 Controlling interest lost in 2011.
For
per
sona
l use
onl
y
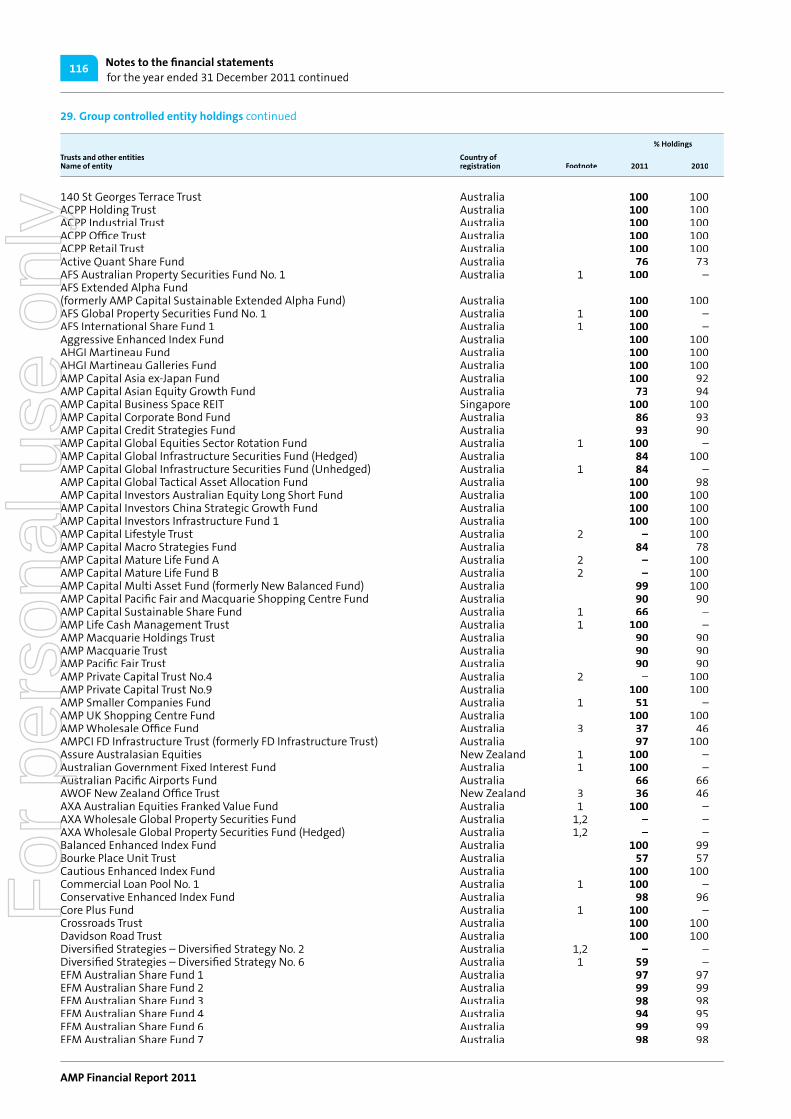
Notes to the fi nancial statementsfor the year ended 31 December 2011 continued
AMP Financial Report 2011
116
29. Group controlled entity holdings continued
% Holdings
Trusts and other entitiesName of entity
Country of registration Footnote 2011 2010
140 St Georges Terrace Trust Australia 100 100 ACPP Holding Trust Australia 100 100 ACPP Industrial Trust Australia 100 100 ACPP Offi ce Trust Australia 100 100 ACPP Retail Trust Australia 100 100 Active Quant Share Fund Australia 76 73 AFS Australian Property Securities Fund No. 1 Australia 1 100 –AFS Extended Alpha Fund (formerly AMP Capital Sustainable Extended Alpha Fund) Australia 100 100 AFS Global Property Securities Fund No. 1 Australia 1 100 –AFS International Share Fund 1 Australia 1 100 –Aggressive Enhanced Index Fund Australia 100 100 AHGI Martineau Fund Australia 100 100 AHGI Martineau Galleries Fund Australia 100 100 AMP Capital Asia ex-Japan Fund Australia 100 92 AMP Capital Asian Equity Growth Fund Australia 73 94 AMP Capital Business Space REIT Singapore 100 100 AMP Capital Corporate Bond Fund Australia 86 93 AMP Capital Credit Strategies Fund Australia 93 90 AMP Capital Global Equities Sector Rotation Fund Australia 1 100 –AMP Capital Global Infrastructure Securities Fund (Hedged) Australia 84 100 AMP Capital Global Infrastructure Securities Fund (Unhedged) Australia 1 84 –AMP Capital Global Tactical Asset Allocation Fund Australia 100 98 AMP Capital Investors Australian Equity Long Short Fund Australia 100 100 AMP Capital Investors China Strategic Growth Fund Australia 100 100 AMP Capital Investors Infrastructure Fund 1 Australia 100 100 AMP Capital Lifestyle Trust Australia 2 – 100 AMP Capital Macro Strategies Fund Australia 84 78 AMP Capital Mature Life Fund A Australia 2 – 100 AMP Capital Mature Life Fund B Australia 2 – 100 AMP Capital Multi Asset Fund (formerly New Balanced Fund) Australia 99 100 AMP Capital Pacifi c Fair and Macquarie Shopping Centre Fund Australia 90 90 AMP Capital Sustainable Share Fund Australia 1 66 –AMP Life Cash Management Trust Australia 1 100 –AMP Macquarie Holdings Trust Australia 90 90 AMP Macquarie Trust Australia 90 90 AMP Pacifi c Fair Trust Australia 90 90 AMP Private Capital Trust No.4 Australia 2 – 100 AMP Private Capital Trust No.9 Australia 100 100 AMP Smaller Companies Fund Australia 1 51 –AMP UK Shopping Centre Fund Australia 100 100 AMP Wholesale Offi ce Fund Australia 3 37 46 AMPCI FD Infrastructure Trust (formerly FD Infrastructure Trust) Australia 97 100 Assure Australasian Equities New Zealand 1 100 –Australian Government Fixed Interest Fund Australia 1 100 –Australian Pacifi c Airports Fund Australia 66 66 AWOF New Zealand Offi ce Trust New Zealand 3 36 46 AXA Australian Equities Franked Value Fund Australia 1 100 –AXA Wholesale Global Property Securities Fund Australia 1,2 – –AXA Wholesale Global Property Securities Fund (Hedged) Australia 1,2 – –Balanced Enhanced Index Fund Australia 100 99 Bourke Place Unit Trust Australia 57 57 Cautious Enhanced Index Fund Australia 100 100 Commercial Loan Pool No. 1 Australia 1 100 –Conservative Enhanced Index Fund Australia 98 96 Core Plus Fund Australia 1 100 –Crossroads Trust Australia 100 100 Davidson Road Trust Australia 100 100 Diversifi ed Strategies – Diversifi ed Strategy No. 2 Australia 1,2 – –Diversifi ed Strategies – Diversifi ed Strategy No. 6 Australia 1 59 –EFM Australian Share Fund 1 Australia 97 97 EFM Australian Share Fund 2 Australia 99 99 EFM Australian Share Fund 3 Australia 98 98 EFM Australian Share Fund 4 Australia 94 95 EFM Australian Share Fund 6 Australia 99 99 EFM Australian Share Fund 7 Australia 98 98
For
per
sona
l use
onl
y

117
29. Group controlled entity holdings continued
% Holdings
Trusts and other entitiesName of entity
Country of registration Footnote 2011 2010
EFM Fixed Interest Fund 2 Australia 97 97 EFM Fixed Interest Fund 3 Australia 96 97 EFM Fixed Interest Fund 4 Australia 94 94 EFM Infrastructure Fund 1 Australia 96 97 EFM International Share Fund 3 Australia 97 97 EFM International Share Fund 5 Australia 97 97 EFM International Share Fund 7 Australia 92 92 EFM Listed Property Fund 1 Australia 96 96 Emerging Market Fund Australia 1 98 –Enhanced Index International Share Fund Australia 82 82 Enhanced Index Share Fund Australia 90 84 FD Australian Share Fund 1 Australia 97 97 FD Australian Share Fund 3 Australia 93 93 FD Global Property Securities Fund 1 Australia 94 94 FD International Bond Fund 3 Australia 89 96 FD International Share Fund 1 Australia 95 95 FD International Share Fund 3 Australia 99 99 FD International Share Fund 4 Australia 97 96 Floating Rate Income Fund Australia 97 98 Future Directions Australian Bond Fund Australia 96 98 Future Directions Asia ex Japan Fund Australia 74 82 Future Directions Australian Share Fund Australia 94 94 Future Directions Australian Small Companies Fund Australia 89 94 Future Directions Balanced Fund Australia 98 98 Future Directions Conservative Fund Australia 94 94 Future Directions Core International Share Fund 2 Australia 58 72 Future Directions Credit Opportunities Fund Australia 97 100 Future Directions Enhanced Index Australian Share Fund Australia 97 100 Future Directions Enhanced Index Global Property Securities Fund Australia 96 100 Future Directions Enhanced Index International Bond Fund Australia 81 82 Future Directions Enhanced Index International Share Fund Australia 2 – 96 Future Directions Geared Australian Share Fund Australia 92 91 Future Directions Growth Fund Australia 96 95 Future Directions Hedged Core International Share Fund Australia 63 76 Future Directions High Growth Fund Australia 95 94 Future Directions Infl ation Linked Bond Fund Australia 97 100 Future Directions Infrastructure Fund Australia 97 100 Future Directions International Bond Fund Australia 93 96 Future Directions International Share Fund Australia 57 92 Future Directions Moderately Conservative Fund Australia 95 93 Future Directions Opportunistic Fund Australia 97 100 Future Directions Private Equity Fund 1A Australia 97 100 Future Directions Private Equity Fund 1B Australia 100 100 Future Directions Private Equity Fund 2A Australia 97 100 Future Directions Private Equity Fund 2B Australia 100 100 Future Directions Private Equity Fund 3A Australia 100 100 Future Directions Private Equity Fund 3B Australia 100 100 Future Directions Property (Feeder) Fund Australia 96 98 Future Directions Total Return Fund Australia 97 99 Future Directions Emerging Markets Share Fund Australia 1 51 –Global Credit Fund Australia 1 100 –Global Credit Strategies Fund Australia 87 87 Global Government Fixed Interest Fund Australia 1 100 –Global Growth Opportunities Fund Australia 96 96 Global Listed Infrastructure Fund Australia 100 100 Goldman Sachs Commodity Index Light Energy – E92 Portfolio Australia 96 95 International Bond Fund Australia 91 93 Kent Street Investment Trust Australia 100 100 Kent Street Unit Trust Australia 100 100 Loftus Street Trust Australia 3 36 46 Macquarie Balanced Growth Fund Australia 78 68 Managed Treasury Fund Australia 76 77 Moderately Aggressive Enhanced Index Fund Australia 100 100 Moderately Conservative Enhanced Index Fund Australia 100 100 Monash House Trust Australia 100 100 Multi-Manager Portfolio – Australian Property Australia 1 100 –
For
per
sona
l use
onl
y

Notes to the fi nancial statementsfor the year ended 31 December 2011 continued
AMP Financial Report 2011
118
29. Group controlled entity holdings continued
% Holdings
Trusts and other entitiesName of entity
Country of registration Footnote 2011 2010
Multi-Manager Portfolio – Australian Shares Australia 1 100 –Multi-Manager Portfolio – Balanced Australia 1 100 –Multi-Manager Portfolio – Growth Australia 1 100 –Multi-Manager Portfolio – High Growth Australia 1 100 –Multi-Manager Portfolio – International Shares Australia 1 100 –Multi-Manager Portfolio – International Shares Hedged Australia 1 100 –Multi-Manager Portfolio – Secure Australia 1 100 –Multi-Manager Portfolio – Secure Growth Australia 1 100 –NMFM Managed Stable Fund Australia 1,2 – –NMFM Superannuation Fund Australia 1,2 – –Principal Healthcare Holdings Trust Australia 100 100 Private Equity Fund IIIA Australia 94 94 Private Equity Fund IIIB Australia 94 94 Progress 2004–2 Trust Australia 2 – 100 Progress 2005–1 Trust Australia 100 100 Progress 2005–2 Trust Australia 100 100 Progress 2006–1 Trust Australia 100 100 Progress 2007–1G Trust Australia 100 100 Progress 2008–1R Trust Australia 100 100 Progress 2009–1Trust Australia 100 100 Progress 2010–1Trust Australia 100 100 Progress 2011–1Trust Australia 1 100 –Progress Warehouse Trust No1 Australia 100 100 Progress Warehouse Trust No2 Australia 100 100 Responsible Investment Leaders Conservative Fund Australia 94 92 Responsible Investment Leaders Growth Fund Australia 96 96 Responsible Investment Leaders High Growth Fund Australia 100 100 Riverside Plaza Trust Australia 100 100 Select Property Portfolio No. 1 Australia 86 86 Short Term Credit Fund Australia 1 100 –Student Housing Accommodation Growth Trust 2 Australia 2 – 100 Sydney Cove Trust Australia 100 100 The Glendenning Trust Australia 100 100 The Pinnacle Fund Australia 99 99 Warringah Mall Trust Australia 67 67 Wholesale Australian Bond Fund Australia 93 92 Wholesale Australian Diversifi ed Property Security Fund Australia 1,2 – –Wholesale Australian Equity Industrials Fund Australia 1 77 –Wholesale Australian Equity Style Blend Fund Australia 1,2 – –Wholesale Core Australian Equity Growth Fund Australia 1 100 –Wholesale Core Australian Equity Value Fund Australia 1 100 –Wholesale Credit Fund Australia 1 99 –Wholesale Global Diversifi ed Yield Fund Australia 1 99 –Wholesale Global Equity – Growth Fund Australia 1 79 –Wholesale Global Equity – Growth Fund (Hedged) Australia 1 100 –Wholesale Global Equity – Index Fund (Hedged) Australia 1 100 –Wholesale Global Equity – Index Fund (Unhedged) Australia 1 100 –Wholesale Global Equity – Value Fund (Hedged) Australia 1 100 –
Footnote: 1 Controlling interest acquired in 2011. 2 Controlling interest lost in 2011. 3 Not more than 50 per cent holding, but consolidated because AMP retains control over the operating functions.
For
per
sona
l use
onl
y

119
30. Associates
(a) Investments in associates accounted for using the equity method
Ownership interest Carrying amount
Principal activities2011
%2010
%2011
$m2010
$mCountry of
incorporation
AIMS AMP Capital Industrial REIT2,3 Industrial property trust 14 16 58 61 Singapore
AIMS AMP Capital Property Management Ltd Property management 50 50 4 4 Singapore
AIMS AMP Capital Industrial REIT Management Ltd Investment management 50 50 4 4 Singapore
AMP Capital Brookfi elds Limited Investment management 50 50 7 8 Australia
Australian Financial Risk Management Pty Ltd1 Provision of risk insurance advice 40 – 3 – Australia
IMB Financial Planning Limited1 Provision of fi nancial services 50 – 3 – Australia
PSK Financial Services Group Pty Ltd1 Provision of fi nancial services 24 – 7 – Australia
Super IQ Pty Limited (formerly Super CEO Pty Ltd) Investment management 49 49 5 8 Australia
Treysta Wealth Management Pty Ltd1 Provision of fi nancial services 41 – 4 – Australia
Other (each less than $3m) 20 4
Total investments in associates accounted for using the equity method 115 89
Footnote:1 Became an associate entity during 2011. 2 The value of AMP’s investment in AIMS AMP Capital Industrial REIT based on published quoted prices as at 31 December 2011 is $45m
(31 December 2010: $53m).3 The combination of the 14 per cent investment in AIMS AMP Capital Industrial REIT and the joint control of the manager companies is
considered to represent signifi cant infl uence by AMP.
Aggregated fi nancial information extracted from the fi nancial statements of associates accounted for using the equity method
2011$m
2010$m
Assets 773 595Liabilities 241 187Revenues 203 49Expenses – including tax 136 34Profi t 66 15
Share of contingent liabilities incurred in relation to associates accounted for using the equity method nil nil
For
per
sona
l use
onl
y

Notes to the fi nancial statementsfor the year ended 31 December 2011 continued
AMP Financial Report 2011
120
30. Associates continued
(b) Investments in associates held by the life entities’ statutory funds measured at fair value through profi t or loss1
Ownership interest Carrying amount
Principal activity22011
%2010
%2011
$m2010
$m
Companies2
Diversifi ed Commercial Backed Investment inMortgage Securities Pty Ltd mortgage securities 43 43 29 97
Gove Aluminium Finance Aluminium smelting 30 30 138 125
Others (each less than $20m) Various 14 12
Total investments held by the AMP life insurance entities’ statutory funds in associated companies 181 234
Unit trusts
AIF Equity Units Investment trusts 43 46 96 101
AMP Capital Strategic NZ Shares Fund Investment trusts 32 32 126 126
AMP Capital China Growth Fund Investment trusts 38 37 81 101
AMP Equity Trust Investment trusts 42 41 181 230
AMP Capital Property Portfolio Investment trusts 38 38 229 261
AMP Capital Shopping Centre Fund Investment trusts 37 46 642 725
AMP Small Companies Trust (Class C)4 Investment trusts – 46 – 118
AMP Investments World Index Fund Investment trusts 46 46 51 67
AMPCI RIL Australian Share Fund Class C3 Investment trusts 24 0 61 –
Australian Pacifi c Airports Fund 3 C Class3 Investment trusts 36 0 64 –
Darling Park Property Trust Investment trusts 50 50 231 223
Esplanade Property Trust3 Investment trusts 50 – 158 –
Future Directions International Small Companies Class C3 Investment trusts 40 – 137 –
Global Property Securities Fund Investment trusts 27 23 268 381
Infrastructure Equity Fund Investment trusts 29 28 190 113
Marrickville Metro Trust Investment trusts 50 50 82 78
Property Income Fund Investment trusts 35 38 216 215
Responsible Investments Leader Balanced Fund Investment trusts 42 28 212 236
Strategic Infrastructure Trust Europe Investment trusts 34 27 146 117
Sugarland Shopping Centre Trust Investment trusts 50 50 51 49
Sustainable Futures Australia Share Fund4 Investment trusts – 45 – 589
Value Plus Australia Share Fund Investment trusts 25 23 51 61
Wholesale Cash Management Trust3 Investment trusts 33 – 139 –
Wholesale Global Equity Value Fund3 Investment trusts 33 – 74 –
Others (each less than $50m) Investment trusts Various 164 235
Total investments held by the AMP life insurance entities’ statutory funds in associated companies 3,650 4,026
Footnote: 1 Investments in associated entities that back investment contract and life insurance contract liabilities are treated as fi nancial assets and are
measured at fair value. Refer to Note 1(g).2 In the course of normal operating investment activities, the life statutory funds hold investments in various operating businesses. Investments
in associated entities refl ect investments where the life statutory funds hold between a 20 per cent and 50 per cent equity interest.3 Trust became an associated entity during 2011. 4 Trust ceased being an associated entity during 2011.
For
per
sona
l use
onl
y

121
31. Forward investments, leasing and other commitments
Consolidated Parent
2011$m
2010$m
2011$m
2010$m
Forward investments – callable at any time Uncalled capital on shares in relation to:1 – associated entities 44 46 – –– other entities 15 17 – –Uncalled capital on units in relation to:1 – associated unit trusts 25 17 – –– other unit trusts 7 3 – –
Total forward investments 91 83 – –
Operating lease commitments (non-cancellable) Due within one year 46 45 – –Due within one year to fi ve years 166 117 – –Due later than fi ve years 134 21 – –
Total operating lease commitments 346 183 – –
Other commitments2 Due within one year 28 2 – –Due within one year to fi ve years 89 1 – –Due later than fi ve years 64 – – –
Total other commitments 181 3 – –
Footnote: 1 Uncalled capital represents a commitment to make further capital contributions for shares, units in trusts and certain private capital
investments held within the life entities’ statutory funds.2 Amounts disclosed exclude loan commitments of AMP Bank which are set out in Note 23(c).
32. Contingent liabilities
The AMP group and the parent entity from time to time may incur obligations arising from litigation or various types of contracts entered into in the normal course of business; including guarantees issued by the parent for performance obligations to controlled entities in the AMP group.
The parent entity has entered into deeds to provide capital maintenance and liquidity support to AMP Bank Limited. At the reporting date the likelihood of any outfl ow in settlement of these obligations is considered to be remote.
Where it is determined that the disclosure of information in relation to a contingent liability can be expected to prejudice seriously the position of the AMP group (or its insurers) in a dispute, accounting standards allow AMP group not to disclose such information and it is AMP group’s policy that such information is not to be disclosed in this Note.
At the reporting date there were no other material contingent liabilities where the probability of any outfl ow in settlement was greater than remote.
For
per
sona
l use
onl
y

Notes to the fi nancial statementsfor the year ended 31 December 2011 continued
AMP Financial Report 2011
122
33. Related-party disclosures
(a) Key management personnel (KMP) detailsAASB 124 Related Party Disclosures defi nes key management personnel as including all non-executive directors (NEDs), the Chief Executive Offi cer (CEO) and other persons having authority and responsibility for planning, directing and controlling the activities of the entity (group executives). The following non-executive directors, CEO and group executives of AMP Limited held offi ce during the year:
Chairman Peter Mason
Chief Executive Offi cer Craig Dunnand Managing Director
Non-executive directors Patricia Akopiantz (appointed 31 March 2011) Richard Allert (appointed 31 March 2011) Catherine Brenner Brian Clark Paul Fegan Richard Grellman (resigned 12 May 2011) John Palmer Nora Scheinkestel Peter Shergold
Executives Lee Barnett Chief Information Offi cer Jonathan Deane Director, Group Strategy Stephen Dunne Managing Director, AMP Capital Paul Leaming (retired 31 December 2011) Chief Financial Offi cer Craig Meller Managing Director, AMP Financial Services Matthew Percival General Manager, Public Affairs Brian Salter General Counsel Paul Sainsbury Integration Director Fiona Wardlaw General Manager, Human Resources
(b) Performance rights and options holdings of key management personnelThe following table summarises the holdings of performance rights and options granted to the executive key management personnel.
Name
Holding at 1 Jan 11 or
appointment Granted Exercised Lapsed
Holding at 31 Dec 11 or resignation
Vested and exercisable
at 31 Dec 11
Lee Barnett 680,476 244,455 – 193,576 731,355 – Jonathan Deane 466,416 167,764 – 132,682 501,498 – Craig Dunn 2,164,960 729,167 – 689,507 2,204,620 – Stephen Dunne 908,282 400,376 – 258,380 1,050,278 – Paul Leaming 913,193 327,538 – 259,777 980,954 – Craig Meller 908,282 400,376 – 258,380 1,050,278 – Matthew Percival 503,729 180,546 – 143,297 540,978 – Paul Sainsbury 364,839 207,707 – 83,799 488,747 – Brian Salter 687,350 246,053 – 195,531 737,872 – Fiona Wardlaw 569,519 204,512 – 162,012 612,019 –
For
per
sona
l use
onl
y

123
33. Related-party disclosures continued
(c) Shareholdings of key management personnel The following table summarises the movements in holdings of shares in AMP Limited held by the key management personnel and their personally related entities:
Name
Holding at 1 Jan 11 or
appointment
Granted as remuneration
during the period
Received on exercise of
performance rights or options
Purchased through
AMP NEDs Share Plan
Other changes1
Holding at 31 Dec 11 or
retirement or resignation
Non-executive directors Patricia Akopiantz 5,116 – – 5,730 – 10,846 Richard Allert 59,120 – – 5,730 2,387 67,237Catherine Brenner 27,634 – – 8,983 1,688 38,305Brian Clark 32,482 – – 8,982 2,477 43,941Paul Fegan 14,505 – – 8,982 – 23,487 Richard Grellman 58,425 – – 3,541 1,677 63,643Peter Mason 414,811 – – 30,901 28,986 474,698 John Palmer 49,621 – – 8,983 3,634 62,238Nora Scheinkestel 96,472 – – 8,983 6,798 112,253Peter Shergold 22,031 – – 8,983 1,770 32,784
Executives Lee Barnett 52,978 200 – – – 53,178Jonathan Deane 93,583 – – – – 93,583Craig Dunn 558,497 – – – – 558,497 Stephen Dunne 209,396 – – – – 209,396Paul Leaming 208,257 – – – – 208,257 Craig Meller 96,207 – – – – 96,207 Matthew Percival 45,000 – – – – 45,000Paul Sainsbury 19,192 – – – 736 19,928Brian Salter 11,220 – – – 10,758 21,978Fiona Wardlaw 26,259 – – – 35,035 61,294
Footnote: 1 Other changes include the purchases and sales of shares on market by key management personnel and their related parties and participation
in the Dividend Reinvestment Plan.
Remuneration of key management personnelThe following table provides a total of the remuneration received by the key management personnel. For further details regarding remuneration of key management personnel see the Remuneration Report which forms part of the Directors’ Report:
Short-term benefi ts
$’000
Post- employment
benefi ts$’000
Share-based payments
$’000
Other long-term
benefi ts$’000
Termination benefi ts
$’000Total
$’000
Non-executive directors1
2011 3,215 237 – – – 3,4522010 2,622 200 – – – 2,822
As disclosed in 20102 2,622 200 – – – 2,822
Key management personnel excluding non-executive directors 2011 14,374 167 8,746 (4) 1,694 24,9772010 15,011 142 7,587 8 – 22,748
As disclosed in 20102 15,011 142 7,587 8 – 22,748
All key management personnel 20113 17,589 404 8,746 (4) 1,694 28,42920103 17,633 342 7,587 8 – 25,570
As disclosed in 20102 17,633 342 7,587 8 – 25,570
Footnote: 1 Non-executive directors are not entitled to short-term incentive payments. Short-term benefi ts only include fees and allowances.2 This represents the amount paid to those individuals considered key management personnel and disclosed as such in the 2010 Financial Report.3 These amounts represent the total remuneration paid to the key management personnel listed in Note 33(a) for 2011 and 2010.
For
per
sona
l use
onl
y

Notes to the fi nancial statementsfor the year ended 31 December 2011 continued
AMP Financial Report 2011
124
33. Related-party disclosures continued
(d) Transactions with key management personnelDuring the year, key management personnel and their personally related entities have entered into transactions with the parent entity or its subsidiaries. All such transactions have occurred within a normal employee, customer or supplier relationship on terms and conditions no more favourable than those that it is reasonable to expect AMP would have adopted if dealing at arm’s length with an unrelated individual. These transactions include:– normal personal banking with AMP Bank Limited including the provision of credit cards– the purchase of AMP insurance and investment products– fi nancial investment services.
Information about such transactions does not have the potential to affect adversely decisions about the allocation of scarce resources made by users of this Financial Report, or the discharge of accountability by the specifi ed executives or specifi ed directors.
The following tables provide details of loans made to key management personnel and their related parties by AMP or any of its subsidiaries:
Balance at 1 Jan 11
$’000Written off
$’000
Net advances (repayments)
$’000
Balance at 31 Dec 11
$’000
Interest charged
$’000
Interest not charged
$’000Number in group
Key management personnel and their related parties1 8,252 – (2,193) 6,059 549 – 7
Individuals and their related parties with loans above $100,000 during reporting period
Balance at 1 Jan 11
$’000Written off
$’000
Net advances (repayments)
$’000
Balance at 31 Dec 11
$’000
Interest charged
$’000
Interest not charged
$’000
Highest indebtedness
in period$’000
Craig Dunn 1,030 – (338) 692 53 – 1,037 Lee Barnett 561 – (517) 44 28 – 574 Jonathan Deane 750 – – 543 43 – 751 Stephen Dunne 1,005 – – – 73 – 1,006 Paul Leaming 125 – 750 875 55 – 865 Craig Meller 2,450 – (419) 2,031 161 – 2,549 Paul Sainsbury 2,331 – – 1,874 136 – 2,339
Footnote: 1 All loans to key management personnel and their related parties are provided by AMP Bank and are on similar terms and conditions generally
available to other employees within the group. No guarantees are given or received in relation to these loans.
For
per
sona
l use
onl
y

125
34. Auditors’ remuneration
Consolidated Parent
2011$’000
2010$’000
2011$’000
2010$’000
Amounts received or due and receivable by Auditors of AMP Limited for:
Audit services Audit or review of fi nancial statements 10,966 8,956 140 140 Other audit services1 1,932 1,709 – –
Total audit service fees 12,898 10,665 140 140
Non-audit services Assurance related services – Other assurances services2 645 546 – –Other non-audit services – Transaction support 50 312 – –– Tax and compliance advice 7 55 – –– Other services3 485 432 – –
Total non-audit services 1,187 1,345 – –
Total amounts received or due and receivable by Auditors of AMP Limited4,5 14,085 12,010 140 140
Footnote: 1 Other audit services includes fees for reviews of the full-year and half-year Investor Reports, compliance audits and other audit procedures
performed for vehicles controlled by AMP life insurance entities’ statutory funds and those managed by AMP Capital.2 Other assurance services include fees for fund prospectus reviews, AMP Bank securitisation opinions and other procedures performed for
investment vehicles owned by the AMP Life entities’ statutory funds. 3 Other non-audit services includes fees for the review of AMP and AXA systems and processes.4 Includes fees paid to Ernst & Young affi liates overseas.5 Periodically, the AMP group gains control of entities whose incumbent auditor is an audit fi rm other than Ernst & Young. In addition to the
audit fees paid to Ernst & Young for auditing the AMP group, immaterial audit fees are also paid to these non-Ernst & Young audit fi rms in relation to the audit of those periodically controlled entities. The non-Ernst & Young audit fi rms are also independently contracted to provide other services to other controlled entities of the AMP group, unrelated to their audit work.
35. Events occurring after reporting date
As at the date of this report, the directors are not aware of any matter or circumstance that has arisen since the end of the year that has signifi cantly affected or may signifi cantly affect the entity’s operations in future years; the results of those operations in future years; or the entity’s state of affairs in future years which is not already refl ected in this report, other than the following:
– On 9 December 2011, AMP announced that it had entered into a strategic alliance with Mitsubishi UFJ Trust and Banking Corporation (MUTB) which included the sale to MUTB of a 15 per cent interest in the AMP Capital business. Settlement date for this transaction is in March 2012 (subject to receipt of necessary regulatory approvals).
– On 16 February 2012, AMP announced a fi nal dividend on ordinary shares of 14 cents per share.
For
per
sona
l use
onl
y

AMP Financial Report 2011
126for the year ended 31 December 2011
In accordance with a resolution of the directors of AMP Limited, for the purposes of Section 295(4) of the Corporations Act 2001, the directors declare that:(a) in the opinion of the directors there are reasonable grounds to believe that the company will be able to pay its debts as and
when they become due and payable (b) in the opinion of the directors the fi nancial statements and the notes are in accordance with the Corporations Act 2001,
including Section 296 (compliance with accounting standards) and Section 297 (true and fair view)(c) the notes to the fi nancial statements include an explicit and unreserved statement of compliance with the International
Financial Reporting Standards as discussed in Note 1(a) (d) the directors have been given the declarations required by Section 295A of the Corporations Act 2001.
Peter Mason Craig DunnChairman Chief Executive Offi cer and Managing Director
Sydney, 16 February 2012
Directors’ declarationF
or p
erso
nal u
se o
nly

127
Ernst & Young Centre680 George StreetSydney NSW 2000 AustraliaGPO Box 2646 Sydney NSW 2001
Tel: +61 2 9248 5555Fax: +61 2 9248 5959www.ey.com/au
Report on the fi nancial reportWe have audited the accompanying fi nancial report of AMP Limited, which comprises the statements of fi nancial position as at 31 December 2011, the income statements, the statements of comprehensive income, the statements of changes in equity and the statements of cash fl ows for the year then ended, notes comprising a summary of signifi cant accounting policies and other explanatory information, and the directors’ declaration of the company and the consolidated entity comprising the company and the entities it controlled at the year’s end or from time to time during the fi nancial year.
Directors’ responsibility for the fi nancial reportThe directors of the company are responsible for the preparation of the fi nancial report that gives a true and fair view in accordance with Australian Accounting Standards and the Corporations Act 2001 and for such internal controls as the directors determine are necessary to enable the preparation of the fi nancial report that is free from material misstatement, whether due to fraud or error. In Note 1, the directors also state, in accordance with Accounting Standard AASB 101 Presentation of Financial Statements, that the fi nancial statements comply with International Financial Reporting Standards.
Auditor’s responsibilityOur responsibility is to express an opinion on the fi nancial report based on our audit. We conducted our audit in accordance with Australian Auditing Standards. Those standards require that we comply with relevant ethical requirements relating to audit engagements and plan and perform the audit to obtain reasonable assurance about whether the fi nancial report is free from material misstatement.
An audit involves performing procedures to obtain audit evidence about the amounts and disclosures in the fi nancial report. The procedures selected depend on the auditor’s judgment, including the assessment of the risks of material misstatement of the fi nancial report, whether due to fraud or error. In making those risk assessments, the auditor considers internal controls relevant to the entity’s preparation and fair presentation of the fi nancial report in order to design audit procedures that are appropriate in the circumstances, but not for the purpose of expressing an opinion on the effectiveness of the entity’s internal controls. An audit also includes evaluating the appropriateness of accounting policies used and the reasonableness of accounting estimates made by the directors, as well as evaluating the overall presentation of the fi nancial report.
We believe that the audit evidence we have obtained is suffi cient and appropriate to provide a basis for our audit opinion.
IndependenceIn conducting our audit we have complied with the independence requirements of the Corporations Act 2001. We have given to the directors of the company a written Auditor’s Independence Declaration, a copy of which is included in the directors’ report.
OpinionIn our opinion:a. the fi nancial report of AMP Limited is in accordance with the Corporations Act 2001, including: i giving a true and fair view of the company’s and consolidated entity’s fi nancial positions as at 31 December 2011 and of
their performance for the year ended on that date; and ii complying with Australian Accounting Standards and the Corporations Regulations 2001; andb. the fi nancial report also complies with International Financial Reporting Standards as disclosed in Note 1.
Report on the remuneration reportWe have audited the remuneration report included in the directors’ report for the year ended 31 December 2011. The directors of the company are responsible for the preparation and presentation of the remuneration report in accordance with section 300A of the Corporations Act 2001. Our responsibility is to express an opinion on the remuneration report, based on our audit conducted in accordance with Australian Auditing Standards.
OpinionIn our opinion, the remuneration report of AMP Limited for the year ended 31 December 2011 complies with section 300A of the Corporations Act 2001.
Ernst & Young Andrew Price Partner, Sydney
16 February 2012
Independent auditor’s report to the members of AMP Limited
Liability limited by a scheme approved under Professional Standards Legislation
For
per
sona
l use
onl
y

128
AMP Annual Report 2011
Shareholder information
Distribution of shareholdings as at 23 February 2012
Range Number of holders Ordinary shares held % of issued capital
1–1,000 690,190 283,781,695 9.931,001–5,000 225,592 458,323,907 16.065,001–10,000 21,918 155,255,152 5.4410,001–200,000 11,159 247,695,077 8.68200,001 and over 178 1,709,616,953 59.89
Total 949,037 2,854,672,784 100.00
The total number of shareholders holding less than a marketable parcel of 118 shares is 57,612.
Twenty largest shareholdings as at 23 February 2012
Rank Name Ordinary shares held % of issued capital
1 HSBC Custody Nominees (Australia) Limited 529,111,259 18.542 National Nominees Limited 355,016,116 12.453 JP Morgan Nominees Australia Limited 350,827,257 12.304 Citicorp Nominees Pty Limited 101,197,689 3.545 JP Morgan Nominees Australia Limited <Cash Income A/C> 45,155,484 1.586 Citicorp Nominees Pty Limited <Colonial First State Inv A/C> 30,356,974 1.067 Cogent Nominees Pty Limited 28,882,686 1.018 AMP Life Limited 26,401,160 0.929 HSBC Custody Nominees (Australia) Limited – GSCO ECA 19,752,421 0.6910 Australian Foundation Investment Company Limited 18,590,947 0.6511 UBS Wealth Management Australia Nominees Pty Ltd 12,438,918 0.4412 Argo Investments Limited 12,231,674 0.4313 Australian Reward Investment Alliance 10,494,115 0.3714 Cogent Nominees Pty Limited <SMP Accounts> 10,349,216 0.3615 M F Custodians Ltd 7,493,077 0.2616 RBC Dexia Investor Services Australia Nominees Pty Limited 6,959,851 0.2417 UBS Nominees Pty Ltd 6,232,500 0.2218 Queensland Investment Corporation 5,812,060 0.2019 Djerriwarrh Investments Limited 5,642,616 0.2020 Navigator Australia Ltd <MLC Investment Sett A/C> 4,116,843 0.14
Total 1,587,062,863 55.60
Substantial shareholdersThe Company has received no substantial shareholding notices.
Total number of holders of ordinary shares and their voting rightsAs at 23 February 2012, the share capital of AMP Limited consisted of 2,854,672,784 ordinary shares held by 949,037 shareholders. The voting rights attached to the shares are that each registered holder of shares present in person (or by proxy, attorney or representative) at a meeting of shareholders has one vote on a vote taken by a show of hands, and one vote for each fully paid share held on a vote taken at a poll.
Total number of options over unissued shares and option holdersAs at 23 February 2012, AMP Limited had no options on issue over unissued ordinary shares in AMP Limited.
Stock exchange listingsAMP Limited is listed on the Australian Securities Exchange and on the New Zealand Stock Exchange.
Restricted securitiesThere are no restricted securities on issue.
Buy-backThere is no current on-market buy-back.
For
per
sona
l use
onl
y

Glossary
Closed productsProducts within AMP’s Mature business that are not open to new customers.
Contingent liabilitiesA situation existing at reporting date, where past events have led to a possible obligation the outcome of which depends on uncertain future events, or an obligation where the outcome is not suffi ciently probable or reliably measurable to warrant recognising the liability at this reporting date.
Controllable costsCosts that AMP incurs in running its business. Controllable costs include operational and project costs and exclude variable costs, provision for bad and doubtful debts and interest on corporate debt.
DemergerAMP’s demerger on 23 December 2003 created separate businesses; AMP in Australasia and Henderson Group in the United Kingdom.
Earnings per share (EPS)Each EPS calculation represents the relevant profi t amount divided by the weighted average number of shares on issue during the year.
Embedded value (EV)A calculation relating to the AMP Financial Services business, other than AMP Bank, of the economic value of the shareholder capital in the business and the future shareholder profi ts expected to emerge from the business currently in-force (expressed in today’s dollars).
Franked dividendsDividends paid which have franking credits attached. The franking credits represent the income tax paid by the company paying the dividend, which can be used as a tax credit by Australian resident shareholders receiving the dividend.
Investment performanceA measure of how well we manage funds on behalf of our customers. The percentage of assets managed by AMP which met or exceeded their respective benchmarks.
Long-term incentive (LTI)A long-term incentive is an award primarily provided in the form of performance rights or share rights, to align an executive’s interest with the interests of shareholders. Long-term incentives at AMP are subject to a performance hurdle and/or a service requirement.
Operating earningsTotal operating earnings are the shareholder profi ts that relate to the performance of AMP’s operating units (AMP Financial Services, AMP Capital and group offi ce). Operating earnings exclude investment earnings on shareholder capital and certain one-off items.
OptionA right to acquire an AMP share at a pre-determined price during an exercise period, subject to meeting performance hurdles. AMP has not offered options under its Employee or Executive Option Plans since 2002.
Performance rightThis is a form of executive remuneration designed to reward long-term performance. Selected executives are granted performance rights. Each performance right is a right to acquire one AMP share after a three-year performance period, as long as a specifi c performance hurdle is met.
Restricted shareThis is a form of executive remuneration designed to reward long-term performance. Selected executives are granted restricted shares. A restricted share is an ordinary AMP share that has a holding lock in place until a three-year vesting period ends.
Short-term incentive (STI)A cash-based payment based on performance during the year against pre-defi ned business objectives aligned to company strategy.
Underlying investment incomeUnderlying investment income is based on long-term expected rates of return. Actual investment income can be higher or lower than the long-term rate from year to year.
Underlying profi tUnderlying profi t (which removes merger related costs and some of the effect of investment market volatility) is calculated by aggregating operating earnings, interest expense on corporate debt, recognition of tax losses and underlying investment income.
Underlying return on equity (RoE)A measure of the return a company makes on shareholder equity. RoE for the year is calculated as underlying profi t divided by average monthly shareholder equity during the year.
Value of new business (VNB)A measure relating to the AMP Financial Services business, other than AMP Bank, of the future shareholder profi ts (expressed in today’s dollars) expected to emerge from new business written over the period, net of the cost of providing supporting capital.
VestingRemuneration term defi ning the point at which the required performance hurdles have been met and a fi nancial benefi t may be realised by the recipient.
AMP is committed to actively reducing its impact on the environment and has printed this document on paper derived from certifi ed well managed forests and manufactured by an ISO 14001 certifi ed mill. The document has also been printed at an FSC accredited printer.
For
per
sona
l use
onl
y

Need help? Contact the AMP Share Registry
Email [email protected] www.amp.com.au/shareholdercentre
Australia AMP Share Registry Reply Paid 2980 MELBOURNE VIC 8060 Phone 1300 654 442 Fax 1300 301 721
New Zealand AMP Share RegistryPO Box 91543 Victoria Street West AUCKLAND 1142
Phone 0800 448 062 Fax 09 448 8787
Other countries AMP Share Registry GPO Box 2980 MELBOURNE VIC 3001 AUSTRALIA Phone +613 9415 4051 Fax +612 8234 5002
Registered offi ce Level 24, 33 Alfred Street of AMP Limited Sydney NSW 2000, Australia Phone +612 9257 5000 Fax +612 9257 7178
AMP Limited is incorporated and domiciled in Australia.Company Secretary: Darryl Mackay N
S124
7 03
/12
For
per
sona
l use
onl
y