for personal use only - asx · above. this represents a 29% increase on fy15 underlying trading...
TRANSCRIPT

For
per
sona
l use
onl
y

For
per
sona
l use
onl
y

1 2016 Annual Report
2016 in summary
Transitioning resources business from construction to maintenance phase
Acquisition of Datatel provides scalable telecommunications platform
Targeting further acquisitions to deliver sector and geographical diversification
Fully franked dividend 2.7 cents per share
Underlying trading NPAT $5.4m*
Net cash $41.8m
Revenue $207.6m
*Underlying trading NPAT excludes acquisition costs of $0.3m after tax
For
per
sona
l use
onl
y

2 2016 Annual Report
About SCEE
SCEE is a leading contractor providing specialised electrical, instrumentation and communications services in Australia and overseas.Delivering life-of-project electrical infrastructure, construction and support services to our blue-chip customers for more than 35 years.
We have a strong reputation for safety and excellence, which is supported by our first class business systems.
Our expertise and capacity enables us to undertake complex large-scale projects in harsh and remote environments.
Committed to our people with a strong focus on training and development, our track-record and collaborative, flexible approach has seen us continually expand our operations.
SCEE was established in 1978 and is listed on the Australian Securities Exchange under the code SXE.
Expanded Capabilities
SCEE has expanded into the data, communications and telecommunications sectors with the strategic acquisition of electrical and communications specialist Datatel in June 2016.
This means we are able to offer a more diversified range of electrical, communications and maintenance services for both our long term and new clients, in the Australian private and public sectors and overseas.
E&I Construction
E&I Infrastructure
E&I Services
Oil & Gas and Mining
Industrial, Utilities and Infrastructure
Telecommunications and Data Centres
Communications
Commercial, Education and Health
Our extended range of services now includes:
We deliver projects across a range of industries including:
For
per
sona
l use
onl
y

3 2016 Annual Report
At SCEE, our values are integral to the organisation and act as internal drivers. They shape how we conduct our business on a daily basis and ultimately drive our success.
Safety It’s in everything we do.
Quality Exceeding customer expectations through continuous improvement.
Reliability We are dependable and consistently deliver high quality services.
Trust Entrust and empower our
team to take ownership.
Loyalty We believe in harmonious relationships and building these through integrity and mutual respect.
Our Values
For
per
sona
l use
onl
y

4 2016 Annual Report
In the resources sector we successfully completed projects at CITIC Pacific Sino Iron, Roy Hill and TAN Burrup and we continue to perform LNG construction works. We also have a number of sustaining capital and maintenance framework agreements in place with key clients which we expect to underpin the transition to a sustainable resources business as the market continues its move from the capital to the maintenance phase.
At the end of June we completed the acquisition of Datatel, a leading telecommunications contractor. The acquisition provides us with an immediate and scalable entry into the sector as the National Broadband Network rollout gathers pace. We have also been successful in securing work in the utilities, industrial and transport infrastructure sectors.
Whilst exceptional client service remains our hallmark, we pride ourselves on our unrelenting focus on safety, with 2016 marking SCEE’s twelfth consecutive LTI-free year in Australia.
ResultsI am pleased to report that the Company has delivered an underlying trading net profit after tax of $5.4m. Statutory NPAT was $5.1m after absorbing Datatel acquisition costs of $0.3m after tax.
The Company continues to maintain a strong balance sheet and ended the financial year 2016 with cash on hand of
$41.8m and no debt. This provides us with ongoing financial capacity to target future strategic growth opportunities.
Additional discussion of the current year result is provided in the Managing Director’s Review on the following pages.
The Board has declared a fully franked final dividend of 1.35 cents per share which maintains the full year dividend payment at the same absolute level as for the three prior years of 2.7 cents per share.
OutlookThe completion of our large iron ore construction projects during the second half of the year has resulted in lower activity levels as we move into the new financial year. However, we continue to win work and have recently secured a number of strategically significant awards which, combined with our existing framework agreements, will see activity increase over the coming months.
The Board is committed to targeting further expansion and diversification and, in this context, management continues to evaluate potential acquisition opportunities.
We remain focused on ensuring that the Company’s overhead base is at an appropriate level to deliver our work safely and cost effectively, whilst retaining the capacity to accommodate the anticipated future growth.
Chairman’s Message
Dear Shareholders,The 2016 financial year has seen SCEE achieve a number of significant milestones which progress the delivery of the Board’s strategy of responding to changes in the resources sector and growing the business through expansion into adjacent and complementary sectors.
For
per
sona
l use
onl
y

5 2016 Annual Report
The Board of DirectorsIn January 2016 we welcomed Graeme Dunn as Managing Director and Chief Executive Officer. Graeme’s extensive experience across multiple sectors makes him ideally suited to driving our strategic initiatives. I would also like to take this opportunity to acknowledge the efforts of Chris Douglass, SCEE’s Chief Financial Officer, during his time as Interim Managing Director and CEO.
As we move through a period of transition for SCEE, the Board of Directors will continue to work closely with Graeme and his management team in implementing our growth strategy.
On behalf of the Board I would like to thank you our shareholders, our clients and, in particular, our employees for your ongoing support.
Derek ParkinChairmanF
or p
erso
nal u
se o
nly

6 2016 Annual Report
Managing Director’s Review
This has been achieved in the year in which the last expansion projects for the time being in the Australian iron ore sector were completed. The resources sector is continuing to move from the capex phase to a sustaining capital and maintenance phase and we have taken actions that will help us better meet clients’ changing needs in this market which will allow us to maintain a sustainable resources business.
We have also actioned a number of strategic diversification initiatives, including organic entry into new sectors and the acquisition of Datatel, a leading telecommunications contractor, which provides immediate entry into a market offering significant growth opportunities across Australia.
We have continued to manage our cost base through significant efficiency initiatives to ensure that it remains appropriately sized to support our activity.
Operating and Financial ReviewRevenue for the year was $207.6m, down 13.7% on prior year underlying trading revenue2. The Datatel acquisition was completed on 29 June 2016 and made no contribution to FY16 trading results.
Activity in the first half of the year was high as a result of contributions from construction projects at CITIC Pacific Sino Iron, Samsung Roy Hill and Tecnicas Reunidas TAN Burrup. These projects were successfully completed and closed out during the second half of the year. Throughout the year we continued to perform work on BHP Billiton Iron Ore Sustaining Capital projects, Rio Tinto Iron Ore Electrical Infrastructure Replacement and Bechtel Australia Pacific LNG at Curtis Island. We also performed works for Western Power under their Major Works Panel as well as a number of jobs for industrial clients.
I am pleased to report that we completed our 2016 operations without suffering a Lost Time Injury (LTI). This marks our twelfth consecutive year LTI free in Australia.
Gross margins for the year were 16.1% compared to underlying trading gross margins of 14.8%3 in FY15 and were driven by our strong performance on the larger lump sum construction contracts that completed during the year.
Underlying trading overheads for the year were $21.4m after adjusting for $0.4m of costs relating to the Datatel acquisition, down $0.9m against underlying trading overheads4 in the prior year. Cost control remains a priority and a streamlining of the organisation structure towards the end of the year combined with various productivity initiatives, such as growing assistance from our new Philippines Support Centre, is expected to result in further efficiency gains in FY17.
Dear Shareholders,I am pleased to report that SCEE delivered an underlying trading net profit after tax of $5.4m1 for the 2016 financial year, a 29% increase on the underlying trading NPAT in the prior year.
For
per
sona
l use
onl
y
7 2016 Annual Report
Depreciation expense decreased by 30% to $4.8m as a result of a combination of the asset rationalisations in FY15 and lower capex spend in more recent years.
Underlying trading NPAT for the year was $5.4m after adjusting for the Datatel acquisition costs noted above. This represents a 29% increase on FY15 underlying trading NPAT of $4.2m5.
We maintained a strong balance sheet throughout the year and at 30 June 2016 we had cash of $41.8m and no debt. This has been achieved after absorbing cash outflows of $6.6m to complete the Datatel acquisition.
The acquisition has resulted in the recognition of additional goodwill of $12.3m and an $8.7m non-current liability for the payment of deferred consideration which represents our assessment of the fair value of future earn-out payments which will be paid under the terms of the Share Purchase Agreement. Approximately $2.5m of net assets were acquired and these have been included in the 30 June balance sheet.
The Board has declared a fully franked final dividend for the year of 1.35 cents per share taking the full year dividend to 2.7 cents per share. The franking account balance at 30 June 2016 was $18.5m.
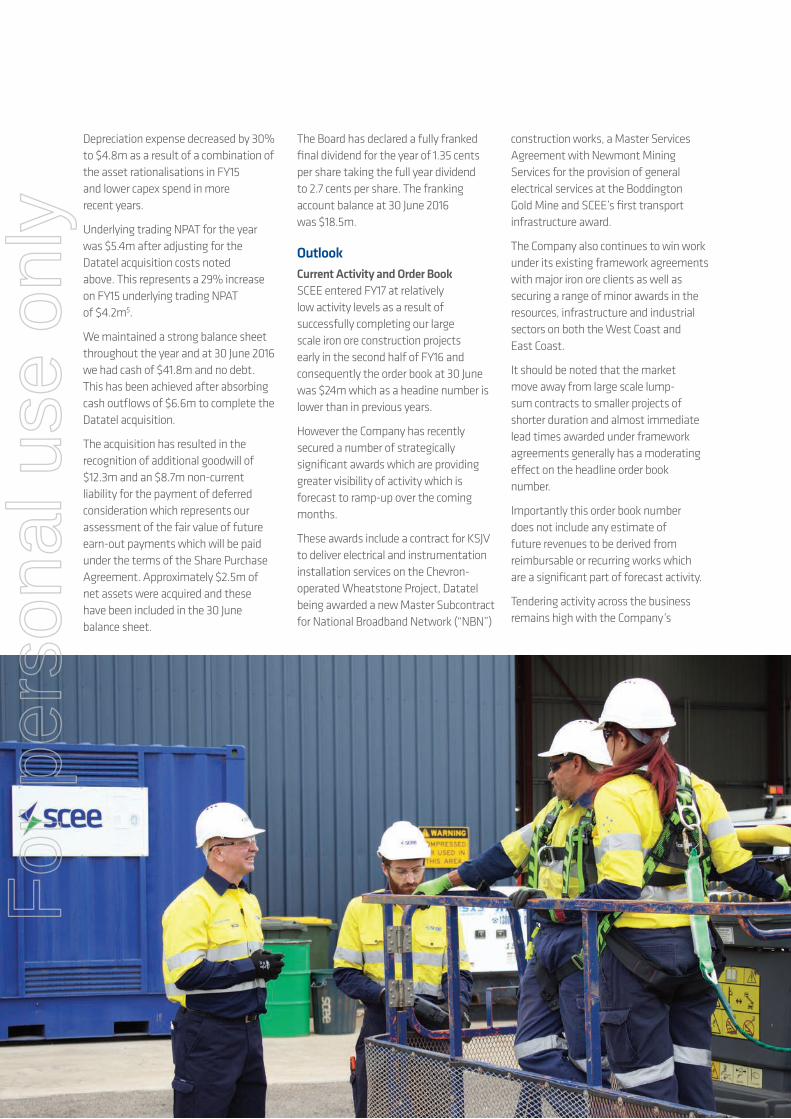
OutlookCurrent Activity and Order Book SCEE entered FY17 at relatively low activity levels as a result of successfully completing our large scale iron ore construction projects early in the second half of FY16 and consequently the order book at 30 June was $24m which as a headine number is lower than in previous years.
However the Company has recently secured a number of strategically significant awards which are providing greater visibility of activity which is forecast to ramp-up over the coming months.
These awards include a contract for KSJV to deliver electrical and instrumentation installation services on the Chevron-operated Wheatstone Project, Datatel being awarded a new Master Subcontract for National Broadband Network (“NBN”)
construction works, a Master Services Agreement with Newmont Mining Services for the provision of general electrical services at the Boddington Gold Mine and SCEE’s first transport infrastructure award.
The Company also continues to win work under its existing framework agreements with major iron ore clients as well as securing a range of minor awards in the resources, infrastructure and industrial sectors on both the West Coast and East Coast.
It should be noted that the market move away from large scale lump-sum contracts to smaller projects of shorter duration and almost immediate lead times awarded under framework agreements generally has a moderating effect on the headline order book number.
Importantly this order book number does not include any estimate of future revenues to be derived from reimbursable or recurring works which are a significant part of forecast activity.
Tendering activity across the business remains high with the Company’s
For
per
sona
l use
onl
y
8 2016 Annual Report
diversification into new sectors resulting in a broader pool of work being targeted.
MarketsConditions in the resources sector are expected to remain relatively stable in the near term and we are starting to see some larger capital projects return to our medium term pipeline from expenditure to maintain iron ore production levels and new investment in certain commodities.
In mining we continue to perform work in the iron ore, gold and copper markets and we have ongoing LNG construction work which we expect to carry on through FY17. We have the capability and capacity to perform large scale international work and will tender strategically appropriate opportunities as they arise.
The NBN roll-out will continue to ramp up significantly. In addition wireless networks and data providers are also investing heavily in their capacity and technology driving forecast construction spend across the Australian telecommunications sector of over $30bn by 2019. The acquisition of Datatel gives SCEE immediate market entry into the sector and a platform which can be used to achieve national expansion.
Datatel also brings an opportunity to leverage their presence in the education, health and commercial sectors, where they perform electrical services works, and to increase SCEE’s service offering to existing clients.
In the utilities sector SCEE continues to perform works for Western Power under their Major Works Panel and we have the capability to expand our offering to other utilities providers.
SCEE has a history of successfully delivering large scale construction projects in the resources sector and these skills are transferable to other sectors where we have identified a significant pipeline of opportunity. In the transport infrastructure sector there is over $100bn forecast construction spend in Australia by 2019 while social and commercial infrastructure has forecast construction
spend of over $80bn in the same period. Our first award in the transport infrastructure sector allows us to start this transfer.
StrategySCEE primarily sees itself as an electrical contractor. The Board’s strategic objective is to create shareholder value by:
• Transitioning to a sustainable resources business through exposure to sustaining capital and maintenance markets; and
• Growing through expansion into adjacent and complementary sectors and new geographies.
As the resources sector shifts from the capex phase to a sustaining capital and maintenance phase it is essential that we align with this change in order to continue our long term relationships with our major clients. We have a number of key framework agreements in place and expect activity to increase as the year progresses. We have established regional offices in key locations and continue to evaluate opportunities to expand our service offering to clients.
Our ongoing LNG construction work is expected to significantly support our performance while this transition occurs.
Having completed the acquisition of Datatel at the end of the year we will focus on driving profitable growth from the business as it expands nationally.
Management is continuing to invest significant effort into investigating further acquisition opportunities aligned with achieving sector and geographical expansion in the markets discussed above.
Conclusion2016 has seen SCEE deliver a solid trading result in competitive market conditions and perform some important strategic actions that will stand us in good stead to grow in future years.
We have progressed the transition of our resources business so that it remains
sustainable into the market change from construction to the maintenance phase.
We are now active in a diverse range of sectors, both organically and via the acquisition of Datatel, and continue to evaluate other acquisition opportunities that would further broaden our geographic and sector footprint.
We enter 2017 with a strong balance sheet capable of supporting these growth initiatives.
I would like to take this opportunity to thank SCEE’s management and staff for their commitment and hard work during the year and our shareholders for their continued support.
Graeme DunnManaging Director
Notes1 Underlying trading NPAT for the year ended 30 June 2016 excludes costs relating to the acquisition of Datatel during the year of $0.3m after tax.2 Statutory revenue for the year ended 30 June 2015 of $238.3m included $2.3m of claims write downs which have been excluded from underlying trading revenue.3 Statutory gross profit for the year ended 30 June 2015 of $33.0m included the $2.3m of claims write downs noted above and $0.3m of inventory write downs which have both been excluded from the calculation of underlying trading gross margin.4 Overheads for the year ended 30 June 2015 included $1.1m of organisational restructuring costs which have been excluded from the calculation of underlying trading overheads.5 Statutory NPAT loss for the year ended 30 June 2015 of $9.8m included $2.3m of claims write downs, $0.3m of inventory write downs noted above, $2.3m of organisational restructuring costs, $1.3m of lease provisions, $1.4m of asset write-downs, $8.4m of goodwill impairment and $2.0m tax benefit relating from these items. All of these have been excluded from underlying trading NPAT.
For
per
sona
l use
onl
y

9 2016 Annual Report
2016 has seen SCEE deliver a solid trading result in competitive market conditions
and perform some important strategic actions that will stand us in good stead to
grow in future years.
9 2016 Annual Report
For
per
sona
l use
onl
y

10 2016 Annual Report
Your Directors submit their report for Southern Cross Electrical Engineering Limited (“SCEE” or “the Company”) for the year ended 30 June 2016.
DirectorsThe names and details of the Company’s Directors in office during the financial year and until the date of this report are as follows. Directors were in office for this entire period unless otherwise stated.
Derek Parkin OAMIndependent Chairman and Non-Executive Director
Derek is a Fellow of the Institute of Chartered Accountants Australia and New Zealand (CAANZ) and a Fellow of the Australian Institute of Company Directors.
He is currently Professor of Accounting at the University of Notre Dame Australia, having previously been an assurance partner with Arthur Andersen and Ernst & Young. Derek’s accounting experience has spanned some 40 years and four continents, primarily in the public company environment.
Derek is a past national Board member of the ICAA and has served on a number of the ICAA’s national and state advisory committees. In 2011, he was a recipient of the ICAA’s prestigious Meritorious Service Award.
Derek’s non-executive directorships to date have been in the non-listed sphere, principally in the oil & gas and manufacturing sectors. He has also chaired a number of advisory committees in both the government and not-for-profit sectors.
Derek is the Chairman of the Audit and Risk Management Committee and a member of the Nomination and Remuneration Committee.
Derek was awarded the Medal of the Order of Australia in the 2015 Australia Day honours list. The award recognised Derek’s service to accountancy through a range of professional, academic, business and advisory roles.
Left to right: Graeme Dunn, Gianfranco Tomasi, Simon Buchhorn, Karl Paganin and Derek Parkin
Directors’ report
For
per
sona
l use
onl
y

11 2016 Annual Report
Graeme DunnManaging Director and Chief Executive Officer (appointed 18 January 2016) Graeme was appointed as Chief Executive Officer and Managing Director on 18 January 2016.
Graeme has over 25 years’ international experience in heavy civil infrastructure, mining, oil & gas and building projects. Graeme’s strong technical knowledge, coupled with his extensive executive management experience, has seen him hold senior management positions throughout Australasia and the Middle East.
Graeme has a Bachelor of Civil Engineering from the University of Sydney, an MBA from the University of Southern Queensland and has recently completed the Senior Executive Program from the London School of Business. He is also a graduate of the Australian Institute of Company Directors in Australia.
Gianfranco Tomasi AMNon-Executive Director Frank is the founder of the Company. He was the Chairman of SCEE from 1978 until he retired from that role in March 2011.
Frank has over 40 years experience in the electrical construction industry. Prior to founding SCEE he worked at Transfield from 1968 to 1978, serving as the National Manager Electrical Department from 1971 to 1978.
Frank holds an Electrical Engineering Certificate (NSW) and is a Fellow of the Australian Institute of Company Directors.
Frank is a member of the Nomination and Remuneration Committee.
Frank was awarded the Order of Australia in the 2013 Australia Day Honours list. The award recognised Frank’s service to business through leadership roles in the electrical contracting industry and his contribution to the community.
Simon BuchhornNon-Executive Director Simon has a comprehensive understanding of SCEE’s operations having been employed by the Company for over 30 years prior to retiring in 2014.
During this time he worked in a number of key positions across the business including over 6 years as Chief Operating Officer and a period as interim Chief Executive Officer. He was also the General Manager of SCEE’s LNG focussed Joint Venture KSJV.
Simon brings to the Board significant experience in contract delivery and operational performance both domestically and internationally.
Simon is a member of the Audit and Risk Management Committee.
Karl PaganinIndependent Non-Executive Director Karl has 15 years of senior executive experience in Investment Banking, specialising in transaction structuring, equity capital markets, mergers and acquisitions and providing strategic management advice to listed public companies. Prior to that, Karl was Director of Major Projects and Senior Legal Counsel for Heytesbury Pty Ltd (the private company of the Holmes a Court family) which was the proprietor o f John Holland Group Pty Ltd.
Karl is the Chairman of the Nomination and Remuneration Committee and a member of the Audit and Risk Management Committee.
Karl is also a Non-Executive Director of ASX listed OTOC Limited and Vice Chairman of Autism West Support Inc. a not for profit charity supporting families affected by autism.
Chris DouglassInterim Managing Director and Chief Executive Officer (resigned 18 January 2016).
Details provided in next column.
Company Secretaries
Chris Douglass Chris is the Company’s Chief Financial Officer and Joint Company Secretary. Chris served as Interim Managing Director and Chief Executive Officer from March 2015 until January 2016.
Prior to joining SCEE in 2011 Chris was the Chief Financial Officer at Pacific Energy Ltd and has previously held a number of senior finance roles with Clough Ltd.
Chris, a Chartered Accountant and member of the Governance Institute of Australia, commenced his finance career with Deloitte. Prior to his time with Deloitte, Chris qualified and practiced as a solicitor in London.
Colin Harper Colin is a Chartered Accountant with over 15 years experience in public company finance. Colin is also a member of the Governance Institute of Australia.
Prior to joining SCEE in 2012 Colin was the Chief Financial Officer and Company Secretary of FAR Limited and previously worked for Ernst & Young in both Australia and the UK.
For
per
sona
l use
onl
y
12 2016 Annual Report
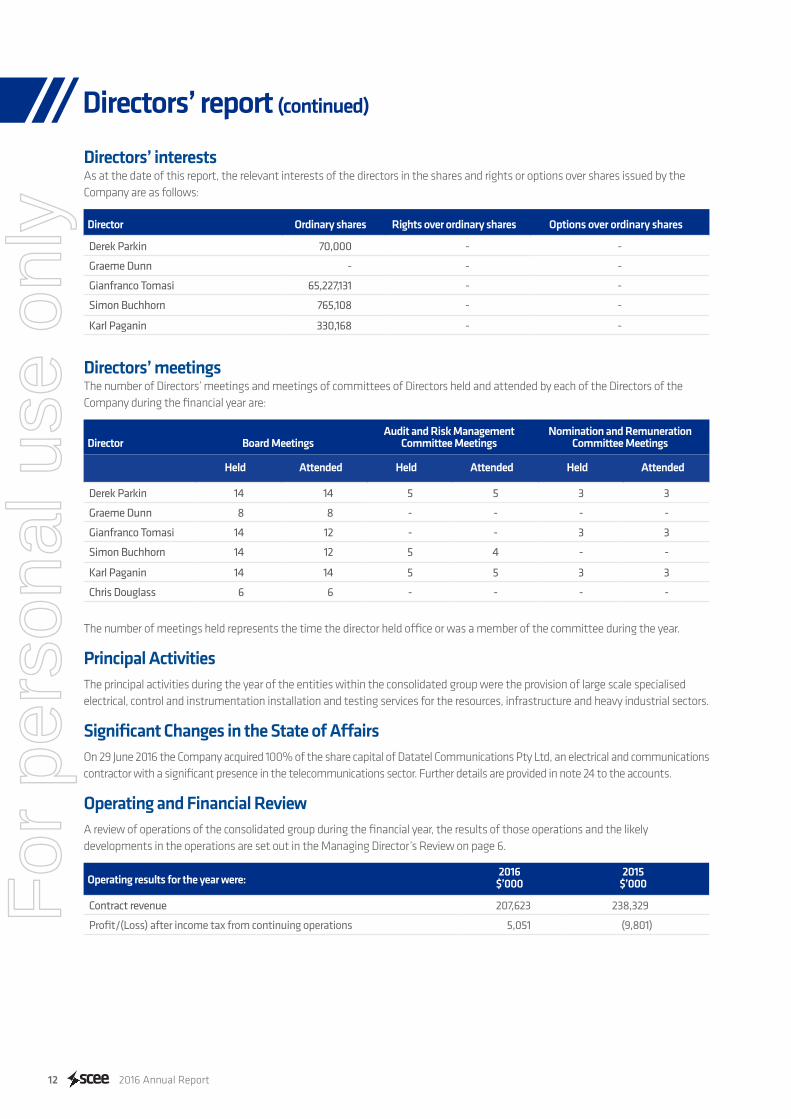
Directors’ interestsAs at the date of this report, the relevant interests of the directors in the shares and rights or options over shares issued by the Company are as follows:
Director Ordinary shares Rights over ordinary shares Options over ordinary shares
Derek Parkin 70,000 - -
Graeme Dunn - - -
Gianfranco Tomasi 65,227,131 - -
Simon Buchhorn 765,108 - -
Karl Paganin 330,168 - -
Directors’ meetingsThe number of Directors’ meetings and meetings of committees of Directors held and attended by each of the Directors of the Company during the financial year are:
Director Board MeetingsAudit and Risk Management
Committee MeetingsNomination and Remuneration
Committee Meetings
Held Attended Held Attended Held Attended
Derek Parkin 14 14 5 5 3 3
Graeme Dunn 8 8 - - - -
Gianfranco Tomasi 14 12 - - 3 3
Simon Buchhorn 14 12 5 4 - -
Karl Paganin 14 14 5 5 3 3
Chris Douglass 6 6 - - - -
The number of meetings held represents the time the director held office or was a member of the committee during the year.
Principal ActivitiesThe principal activities during the year of the entities within the consolidated group were the provision of large scale specialised electrical, control and instrumentation installation and testing services for the resources, infrastructure and heavy industrial sectors.
Significant Changes in the State of Affairs On 29 June 2016 the Company acquired 100% of the share capital of Datatel Communications Pty Ltd, an electrical and communications contractor with a significant presence in the telecommunications sector. Further details are provided in note 24 to the accounts.
Operating and Financial ReviewA review of operations of the consolidated group during the financial year, the results of those operations and the likely developments in the operations are set out in the Managing Director’s Review on page 6.
Operating results for the year were:2016
$’0002015
$’000
Contract revenue 207,623 238,329
Profit/(Loss) after income tax from continuing operations 5,051 (9,801)
Directors’ report (continued)
For
per
sona
l use
onl
y

13 2016 Annual Report
Directors’ report (continued)
Dividends
Cents per shareTotal amount
$’000
Declared and paid during the period (fully franked at 30%)
Final franked dividend for 2015 2.70c 4,272
Interim franked dividend for 2016 1.35c 2,136
Declared after balance date and not recognised as a liability (fully franked at 30%)
Final franked dividend for 2016 1.35c 2,152
Significant Events after Balance Sheet DateThere are no matters or circumstances that have arisen since the end of the financial year which significantly affected or may significantly affect the operations of the consolidated entity, the results of those operations, or the state of affairs of the consolidated entity in subsequent financial years.
Likely Developments and Expected ResultsOther than as referred to in this report, further information as to the likely developments in the operations of the consolidated entity would, in the opinion of the directors, be likely to result in unreasonable prejudice to the consolidated entity.
Environmental Regulation The operations of the Group are subject to the environmental regulations that apply to our clients. During 2016 the Group complied with the regulations.
Share Options and Performance RightsAt the date of this report there are no unissued ordinary shares of the Company under options.
During the reporting period, no shares were issued from the exercise of options or performance rights previously granted as remuneration.
Further details are contained in note 26 to the accounts.
Indemnification and Insurance of Directors and OfficersDuring or since the end of the financial year, the Company has paid premiums in respect of a contract insuring all the directors of the Company against a liability incurred in their role as directors of the Company, except where:
a) the liability arises out of conduct involving a wilful breach of duty; or
b) there has been a contravention of Sections 182 or 183 of the Corporations Act 2001.
The total amount of insurance contract premiums paid was $71,016 (2015: $72,492).
For
per
sona
l use
onl
y

14 2016 Annual Report
Directors’ report (continued)
Proceedings on Behalf of CompanyNo person has applied for leave of Court to bring proceedings on behalf of the Company or intervene in any proceedings to which the Company is a party for the purpose of taking responsibility on behalf of the Company for all or any part of those proceedings.
The Company was not a party to any such proceedings during the year.
Non-audit ServicesThe Board of Directors is satisfied that the provision of non-audit services during the year was compatible with the general standard of independence for auditors imposed by the Corporations Act 2001. The directors are satisfied that such services will not compromise the external auditor’s independence for the following reasons:
• all non-audit services are reviewed and approved by the Audit and Risk Management Committee prior to commencement to ensure they do not adversely affect the integrity and objectivity of the auditor; and
• the nature of the services provided do not compromise the general principles relating to auditor independence in accordance with APES 110: Code of Ethics for Professional Accountants set by the Accounting Professional and Ethical Standards Board.
Auditor’s Independence DeclarationThe lead auditor’s independence declaration is set out on page xx and forms part of the Directors’ report for the financial year ended 30 June 2016.
Remuneration ReportThe Remuneration Report is set out on pages 15 to 22 and forms part of this report.
Rounding offThe Company is of a kind referred to in ASIC Class Order 2016/191 dated 24 March 2016 and in accordance with that Class Order, amounts in the consolidated financial statements and directors’ report have been rounded off to the nearest thousand dollars, unless otherwise stated.
Signed in accordance with a resolution of the directors.
Derek ParkinChairman23 August 2016
For
per
sona
l use
onl
y

15 2016 Annual Report
This Remuneration Report outlines the Director and executive remuneration arrangements of the Group in accordance with the requirements of the Corporations Act 2001 and its Regulations. For the purposes of this report Key Management Personnel (KMP) of the Group are defined as those persons having authority and responsibility for planning, directing and controlling the major activities of the Company and the Group, directly or indirectly, including any Director (whether executive or otherwise) of the parent Company.
Nomination and Remuneration CommitteeThe Nomination and Remuneration Committee of the Board of Directors is responsible for determining and reviewing remuneration arrangements for the directors and executives.
The Nomination and Remuneration Committee assesses the appropriateness of the nature and amount of remuneration of executives on a periodic basis by reference to relevant employment market conditions with the overall objective of ensuring maximum stakeholder benefit from the retention of a high quality, high performing director and executive team.
Remuneration StructureIn accordance with best practice corporate governance, the structure of executive and non-executive remuneration is separate and distinct.
Executive RemunerationObjectiveThe Group aims to reward executives with a level and mix of remuneration commensurate with their position and responsibilities within the Group so as to:
• attract, motivate and retain highly skilled executives;
• reward executives for Group, business and individual performance against targets set by reference to appropriate benchmarks;
• align the interests of executives with those of shareholders; and
• ensure remuneration is competitive by market standards.
StructureThe Company has entered into contracts of employment with the Managing Director and the executives. These contracts contain the following key elements:
• Fixed remuneration;
• Variable remuneration - Short term incentive (“STI”); and
• Variable remuneration - Long term incentive (“LTI”).
The nature, amount and proportion of remuneration that is performance related for each executive is set out in Table 1.
Fixed Remuneration Executives are given the opportunity to receive their fixed remuneration in a variety of forms including cash and fringe benefits such as motor vehicles. It is intended that the manner of payment chosen will be optimal for the recipient without undue cost for the Group.
Fixed remuneration is reviewed annually by the Nomination and Remuneration Committee. There are no guaranteed base pay increases for any executive. For the 2017 financial year the Board has accepted management’s recommendation that pay levels are held at existing levels other than in exceptional circumstances.
Remuneration report - audited
For
per
sona
l use
onl
y

16 2016 Annual Report
Variable Remuneration – Short Term Incentive (STI)The objective of the STI program is to link the achievement of the Group’s operational targets with the remuneration received by the executives charged with meeting those targets. The total potential STI available is set at a level so as to provide sufficient incentive to the executive to achieve the operational targets and such that the cost to the Group is reasonable in the circumstances.
Actual STI payments granted to each executive depend on the extent to which specific targets as set at the beginning of the financial year are met. The targets consist of a number of Key Performance Indicators (“KPIs”) covering both financial and non-financial measures of performance.
For the year ended 30 June 2016, the financial KPIs accounted for 70% of the executive team’s STI and set specific profit and order book targets.
The non-financial KPIs comprised the achievement of strategic objectives. The strategic objectives were chosen to align with the key drivers for the short term success of the business and provide a framework for delivering long term value.
The assessment of performance against KPIs is based on the audited financial results for the company. For each component of the STI against a KPI no award is made where performance falls below the minimum threshold for that KPI. The Nomination and Remuneration Committee recommends the STI to be paid to the individuals for approval by the Board.
Variable Remuneration – Long Term Incentive (LTI)The objective of the LTI plan is to retain and reward the members of the executive management team in a manner which aligns this element of remuneration with the creation of shareholder wealth.
LTI grants to executives are delivered at the discretion of the Nomination and Remuneration Committee in the form of performance rights or share options under the Senior Management Long Term Incentive Plan.
The Key Performance Indicators (“KPIs”) used to measure performance for these incentives are earnings per share growth and absolute total shareholder return. These KPIs are measured over a three year performance period and were chosen because they are aligned to shareholder wealth creation.
Non-Executive Director RemunerationObjectiveThe Board seeks to set aggregate remuneration at a level that provides the Group with the ability to attract and retain Non-Executive Directors of the highest calibre, whilst incurring a cost that is acceptable to shareholders.
StructureThe Constitution and the ASX Listing Rules specify that the aggregate remuneration of Non-Executive Directors shall be determined from time to time by a general meeting. The aggregate remuneration as approved by shareholders at the annual general meeting held on 26 November 2008 is $600,000 per year.
The Non-Executive Director fee structure is reviewed annually. The Board considers external market surveys as well as the fees paid to Non-Executive Directors of comparable companies in our sector when undertaking the annual review process.
The annual fee paid to the Chairman of the Board is $110,000. The fee paid to other Non-Executive Directors is $80,000 per annum. No additional fees are paid to Directors who sit on Board Committees.
Directors also receive superannuation at the statutory rate in addition to their Director and Committee fees.
The Non-Executive Directors do not receive retirement benefits, nor do they participate in any incentive programs.
The remuneration paid to Non-Executive Directors is detailed in Table 1 of this report.
Remuneration report - audited (continued)
For
per
sona
l use
onl
y

17 2016 Annual Report
Consequences of performance on shareholder wealthIn considering the impact of the Group’s performance on shareholder wealth and the related rewards earned by executives, the Nomination and Remuneration Committee had regard to the following measures over the years below:
2016 2015 2014 2013 2012
$’000 $’000 $’000 $’000 $’000
Profit/(loss) attributable to owners of the company 5,051 (9,801) 7,723 17,341 13,708
Dividends declared and paid during the year 6,408 4,361 4,361 3,633 -
Change in share price 87% (38%) (42%) (31%) 43%
Return on capital employed 8% (10%) 10% 24% 21%
Remuneration report - audited (continued)
For
per
sona
l use
onl
y

18 2016 Annual Report
Tabl
e 1 R
emun
erat
ion
of K
ey M
anag
emen
t Per
sonn
elDe
tails
of t
he n
atur
e an
d am
ount
of e
ach
maj
or e
lem
ent o
f rem
uner
atio
n of
eac
h di
rect
or o
f the
Com
pany
and
eac
h of
the
nam
ed C
ompa
ny e
xecu
tives
who
are
key
m
anag
emen
t per
sonn
el a
re:
Shor
t-te
rmPo
st-
empl
oym
ent
Shar
e-ba
sed
paym
ents
Not
eSa
lary
& fe
es
$
STI c
ash
bonu
s (A)
$
Non
-m
onet
ary
bene
fits
$To
tal
$
Supe
rann
uatio
n be
nefit
s $
Term
inat
ion
bene
fits
$
Optio
ns an
d rig
hts (
B)
$To
tal
$
Non
-Exe
cutiv
e Dire
ctor
s
Dere
k Pa
rkin
, Cha
irman
2016
110,
000
--
110,
000
10,5
00-
-12
0,50
01
2015
92,5
42-
-92
,542
8,79
1-
-10
1,333
Gian
franc
o To
mas
i20
1680
,000
--
80,0
007,6
00-
-87
,600
2015
86,76
4-
-86
,764
8,24
3-
-95
,007
Sim
on B
uchh
orn
2016
80,0
00-
-80
,000
7,600
--
87,6
002
2015
11,11
8-
-11
,118
--
-11
,118
Karl
Paga
nin
2016
80,0
00-
-80
,000
7,600
--
87,6
003
2015
6,00
0-
-6,
000
570
--
6,57
0Jo
hn C
oope
r20
16-
--
--
--
-4
2015
113,
505
--
113,
505
10,78
3-
-12
4,28
8Pe
ter F
orbe
s20
16-
--
--
--
-4
2015
85,12
8-
-85
,128
8,08
7-
-93
,215
Jack
Ham
ilton
2016
--
--
--
--
420
1582
,110
--
82,11
07,8
00-
-89
,910
Exec
utiv
e Dire
ctor
sGr
aem
e Du
nn5
2016
262,
307
--
262,
307
12,6
92-
-27
4,99
920
15-
--
--
--
-Si
mon
Hig
h20
16-
--
--
--
-6
2015
684,
931
--
684,
931
35,0
0072
9,40
1(2
00,4
60)
1,248
,872
Exec
utiv
esCh
ris D
ougl
ass –
Chi
ef F
inan
cial O
ffice
r7
2016
473,
269
--
473,
269
30,0
00-
135,
920
639,1
897
2015
368,
654
--
368,
654
24,5
51-
37,3
6443
0,56
9An
dy O
zolin
s – C
hief
Ope
ratin
g Offi
cer
2016
414,
423
--
414,
423
35,0
00-
60,9
3251
0,35
58
2015
347,7
21-
-34
7,721
30,9
87-
29,0
5640
7,764
Tota
l 201
61,4
99,9
99-
-1,4
99,9
9911
0,99
2-
196,
852
1,807
,843
Tota
l 201
51,8
78,4
73-
-1,8
78,4
7313
4,81
272
9,40
1(13
4,04
0)2,
608,
646
Remuneration report - audited (continued)
1. Ap
poin
ted
Chai
rman
6 M
ay 2
015.
2.
Appo
inte
d 6
May
201
5.3.
Ap
poin
ted
4 Ju
ne 2
015.
4.
Resi
gned
5 M
ay 2
015.
5.
Appo
inte
d 18
Janu
ary
2016
.6.
Re
sign
ed 2
7 Mar
ch 2
015.
7. Se
rved
as
inte
rim C
EO a
nd M
anag
ing
Dire
ctor
from
30
Mar
ch 2
015
to 18
Janu
ary
2016
. 8.
Ap
poin
ted
12 A
ugus
t 201
4.
For
per
sona
l use
onl
y

19 2016 Annual Report
Notes in relation to the table of directors’ and executive officers’ remunerationA. The STI bonus is for the amount that vested in the financial year based on achievement of personal goals and satisfaction
of specified performance criteria which was set out for the previous financial year. The amount is finally determined after performance reviews are completed and approved by the Nomination and Remuneration Committee.
B. The fair value of the options and performance rights with market related vesting conditions were valued using a Monte Carlo simulation model. The use of a Monte Carlo Simulation model simulates multiple future price projections for both SCEE shares and the shares of the peer group against which they are tested. The options and performance rights with non-market related vesting conditions were valued using the Black-Scholes option model. The values derived from these models are allocated to each reporting period evenly over the period from grant date to vesting date. The amount recognised as an expense is adjusted to reflect the number of awards for which the related service and non-market performance conditions are expected to be met, such that the amount ultimately recognised as an expense is based on the number of awards that meet the related service and non-market performance conditions at the vesting date. The value disclosed is the fair value of the options and performance rights recognised in this reporting period.
Employment ContractsAll executives have non-fixed term employment contracts. The company may terminate the employment contract by providing the other party notice as follows:
Executive Notice PeriodGraeme Dunn 6 months
Chris Douglass 6 months
Andy Ozolins 6 months
The Group retains the right to terminate a contract immediately by making a payment in lieu of the notice period. An executive may be terminated immediately for a breach of their employment conditions. Upon termination the executive is entitled to receive their accrued annual leave and long service leave together with any superannuation benefits. There are no other termination payment entitlements.
Options and rights over equity instrumentsThe movement during the reporting period in the number of options and rights over ordinary shares in Southern Cross Electrical Engineering Limited held, directly, indirectly or beneficially, by each key management person, including their related parties, is as follows:
Performance Rights over equity instruments
ExecutiveHeld at
1 July 2015Granted as
remuneration Exercised Forfeited
Held at30 June
2016
Vested during the
year
Vested and exercisable
at 30 June
2016
Graeme Dunn - - - - - - -
Chris Douglass 647,239 975,000 - (120,724) 1,501,515 - -
Andy Ozolins 260,204 425,000 - - 685,204 - -
907,443 1,400,000 - (120,724) 2,186,719 - -
Subsequent to 30 June 2016 it was determined that the vesting conditions in respect of the 2014 performance rights held by Mr Douglass have not been met and 184,678 performance rights have been forfeited.
Remuneration report - audited (continued)
For
per
sona
l use
onl
y

20 2016 Annual Report
Remuneration report - audited (continued)
Performance rights granted as remuneration in 2016During the period performance rights over ordinary shares in the company were granted as remuneration to KMP. These performance rights will vest subject to the meeting of performance set out below. Details on performance rights that were granted during the period are as follows:
Executive Number Grant date
Fair value per performance right at grant
date ($)
Exercise price per
performance right ($) Vesting Date Expiry Date
Chris Douglass1 487,500 16/11/15 0.30 0.00 30 June 2018 30 June 2019
Chris Douglass2 487,500 16/11/15 0.15 0.00 30 June 2018 30 June 2019
Andy Ozolins1 212,500 16/11/15 0.30 0.00 30 June 2018 30 June 2019
Andy Ozolins2 212,500 16/11/15 0.15 0.00 30 June 2018 30 June 2019
1,400,000
1. Performance rights granted with EPS growth as the vesting condition2. Performance rights granted with Absolute TSR as the vesting condition
Up to 100% of the allocated performance rights may vest, subject to the achievement of the performance conditions as set out below. The key terms of the performance rights are:
• To be performance tested over a three year period from 1 July 2015 to 30 June 2018 (“Performance Period”);
• No performance rights will vest until 30 June 2018;
• Performance testing criteria are 50% against Absolute Total Shareholder Return (“TSR”) performance, and 50% against Earnings Per Share (“EPS”) performance; and
• Expiry on the 4th anniversary of the grant date unless an earlier lapsing date applies
The TSR formula is:
((Share Price at Test Date – Share Price at Start Date) + (Dividends Reinvested))/Share Price at Start Date
TSR will be assessed against targets for threshold performance of 18.5% per annum compounded over the Performance Period and for stretch performance of 26.5% per annum compounded over the Performance Period. The vesting schedule is as follows for TSR performance over the Performance Period:
Less than 18.5% per annum compounded 0% vesting
18.5% per annum compounded 50% vesting
Between 18.5% and 26.5% per annum compounded Pro-rata vesting between 50% and 100%
At or above 26.5% per annum compounded 100% vesting
For
per
sona
l use
onl
y

21 2016 Annual Report
Remuneration report - audited (continued)
EPS will be assessed against targets for threshold performance of 2.8 cents per share in the 2018 financial year and for stretch performance of 3.6 cents per share in the 2018 financial year. The vesting schedule is as follows for EPS performance in the 2018 financial year:
Less than 2.8 cents per share 0% vesting
2.8 cents per share 50% vesting
Between 2.8 and 3.6 cents per share Pro-rata vesting between 50% and 100%
At or above 3.6 cents per share 100% vesting
Once the performance measurement calculation has been finalised the company will allot and issue the equivalent number of shares at nil consideration on the basis of one ordinary share per vested performance right for all performance rights exercised.
Where a participant ceases employment prior to the vesting of their share options or performance rights, the share options or performance rights are forfeited unless in the event of retirement, permanent disablement or death the Board, at their at their absolute discretion, waive the exercise and vesting conditions associated with the performance rights or allow the performance rights to continue to be assessed over the original performance assessment period. In the event of a change of control of the Company, all options and performance rights that have not lapsed may be exercised.
Details of equity incentives affecting current and future remunerationDetails of the vesting profiles of the rights and options held by each key management person are as follows:
Executive Instrument Number Grant date% vested in
year% forfeited in
year Vesting DateExpiry Date
(A)
Chris Douglass 2013 Rights 120,724 25 September 2012 - 100% 30 June 2015 30 June 2016
2014 Rights 184,678 8 October 2013 - - 30 June 2016 30 June 2017
2015 Rights 341,837 4 November 2014 - - 30 June 2017 30 June 2018
2016 Rights 975,000 16 November 2015 - - 30 June 2018 30 June 2019
Andy Ozolins 2015 Rights 260,204 4 November 2014 - - 30 June 2017 30 June 2018
2016 Rights 425,000 16 November 2015 - - 30 June 2018 30 June 2019
A. Performance rights are performance tested following completion of the performance period, which ends on the vesting date. Subsequent to 30 June 2016 it has been determined that the vesting conditions in respect of the 2014 performance rights have not been met and all 2014 performance rights have been forfeited.
For
per
sona
l use
onl
y

22 2016 Annual Report
Remuneration report - audited (continued)
Movements in sharesThe movement during the reporting period in the number of ordinary shares in Southern Cross Electrical Engineering Limited held, directly, indirectly or beneficially, by each key management person, including their related parties, is as follows
Ordinary sharesHeld at 30 June 2015 Purchases
Net change other
Held at 30 June 2016
Directors
Derek Parkin 70,000 - - 70,000
Graeme Dunn - - - -
Gianfranco Tomasi 65,227,131 - - 65,227,131
Simon Buchhorn 765,108 - - 765,108
Karl Paganin 22,668 307,500 - 330,168
Executives
Chris Douglass - - - -
Andy Ozolins - - - -
Transactions with key management personnelThe Group has entered into rental agreements over the following properties:
• F & A Tomasi Superannuation Fund owns the properties at 41 and 44 Macedonia St, Naval Base WA, which are leased to Southern Cross Electrical Engineering Limited.
• G & A Tomasi own the properties at 45, 47, 49 & 51 Macedonia Street, Naval Base WA which are leased to Southern Cross Electrical Engineering Limited.
• Frank Tomasi Nominees Pty Ltd owns the property at 43 Hope Valley Road, Naval Base WA, which was leased to Southern Cross Electrical Engineering Limited.
Gianfranco Tomasi and spouse are sole directors of Frank Tomasi Nominees Pty Ltd and are the sole shareholders. Frank Tomasi Nominees Pty Ltd as trustee for the Frank Tomasi Family Trust is a major shareholder of Southern Cross Electrical Engineering Ltd.
Under the terms of each of the above property leases, the rent payable is subject to an annual review. This review adjusts the annual rent by the movement in the consumer price index. At the completion of every third year the annual rent is subject to a market review.
The rental payments made above are all at normal market rates and were reviewed by an independent valuer in July 2014 except for 41 Macedonia Street which is due to be reviewed in October 2016.
Total rent paid by SCEE in the 2016 financial year in respect of the above agreements was $828,000.
For
per
sona
l use
onl
y

23 2016 Annual Report
Consolidated Statement of Comprehensive IncomeFor the year ending 30 June 2016
Note2016
$’0002015
$’000
Contract revenue 4 207,623 238,329
Contract expenses (174,208) (205,319)
Gross profit 33,415 33,010
Other income/(expense) 5 146 (1,025)
Employee benefits expenses 6 (14,466) (15,886)
Occupancy expenses (1,826) (1,817)
Administration expenses (4,504) (4,651)
Other expenses (980) (982)
Depreciation expense 9 (4,798) (6,817)
Amortisation of customer contract intangibles 9 - (75)
Restructuring and impairment expenses 7 - (10,984)
Profit/(loss) from operations 6,987 (9,227)
Finance income 8 791 846
Finance expenses 8 (582) (988)
Net finance income/(expense) 8 209 (142)
Profit/(loss) before tax 7,196 (9,369)
Income tax expense 10 (2,145) (432)
Profit/(loss) from continuing operations attributableto owners of the company 5,051 (9,801)
Total comprehensive income
Items that are or may be reclassified to the profit and loss:
Foreign currency translation (loss)/gain for foreign operations (442) 297
Other comprehensive (loss)/income net of income tax (442) 297
Total comprehensive income/(loss) 4,609 (9,504)
Total comprehensive income/(loss) attributable to:
Owners of the Company 4,609 (9,504)
Earnings per share:Basic earnings/(loss) per share (cents) 11 3.19 (6.12)
Diluted earnings/(loss) per share (cents) 11 3.15 (6.12)
The above statement of comprehensive income should be read in conjunction with the accompanying notes.For
per
sona
l use
onl
y

24 2016 Annual Report
Consolidated Balance SheetFor the year ending 30 June 2016
As at 30 June 2015 Note2016
$’0002015
$’000
Assets
Current assets
Cash and cash equivalents 12 41,833 44,550
Trade and other receivables 13 21,550 34,064
Inventories 14 2,379 2,947
Construction work in progress 15 9,229 8,556
Prepayments 667 987
Assets held for sale - 909
Tax receivable 3,267 -
Total current assets 78,925 92,013
Non-current assets
Trade and other receivables 13 478 -
Property, plant and equipment 16 21,183 22,863
Intangible assets 17 21,082 8,784
Total non-current assets 42,743 31,647
Total assets 121,668 123,660
Liabilities
Current liabilities
Trade and other payables 18 18,089 21,961
Unearned revenue 19 1,387 3,163
Provisions 20 4,844 6,005
Tax payable - 3,257
Total current liabilities 24,320 34,386
Non-current liabilities
Deferred acquisition consideration 24 8,659 -
Provisions 20 324 353
Deferred tax liability 10 684 223
Total non-current liabilities 9,667 576
Total liabilities 33,987 34,962
Net assets 87,681 88,698
Equity
Share capital 21 56,656 56,036
Reserves 422 702
Retained earnings 30,603 31,960
Total equity 87,681 88,698
The above balance sheet should be read in conjunction with the accompanying notes.For
per
sona
l use
onl
y

25 2016 Annual Report
Consolidated Statement of Changes of EquityFor the year ending 30 June 2016
Share Capital
Retained Earnings
Share Based
Payments Reserve
Translation Reserve Total Equity
$’000 $’000 $’000 $’000 $’000
Balance as at 1 July 2014 57,578 46,122 1,328 (775) 104,253
Total comprehensive income for the period
Loss for the period - (9,801) - - (9,801)
Foreign currency translation gain - - - 297 297
Total comprehensive income - (9,801) - 297 (9,504)
Transactions with owners, recorded directly in equity
Dividends to equity holders - (4,361) - - (4,361)
Buyback of shares (1,542) - - - (1,542)
Cost of share-based payments - - (148) - (148)
Total transactions with owners (1,542) (4,361) (148) - (6,051)
Balance as at 30 June 2015 56,036 31,960 1,180 (478) 88,698
Share Capital
Retained Earnings
Share Based
Payments Reserve
Translation Reserve Total Equity
$’000 $’000 $’000 $’000 $’000
Balance as at 1 July 2015 56,036 31,960 1,180 (478) 88,698
Total comprehensive income for the period
Profit for the period - 5,051 - - 5,051
Foreign currency translation loss - - - (442) (442)
Total comprehensive income - 5,051 - (442) 4,609
Transactions with owners, recorded directly in equity
Dividends to equity holders - (6,408) - - (6,408)
Issue of ordinary shares 620 - - - 620
Cost of share-based payments - - 162 - 162
Total transactions with owners 620 (6,408) 162 - (5,626)
Balance as at 30 June 2016 56,656 30,603 1,342 (920) 87,681
The above statement of changes in equity should be read in conjunction with the accompanying notes.
For
per
sona
l use
onl
y

26 2016 Annual Report
Consolidated Statement of Cash FlowsFor the year ending 30 June 2016
Note2016
$’0002015
$’000
Cash flows from operating activities
Cash receipts from customers 238,872 254,855
Cash paid to suppliers and employees (218,244) (232,039)
Interest received 791 846
Interest paid (582) (988)
Income taxes paid (8,538) (5,681)
Net cash from operating activities 27 12,299 16,993
Cash flows from investing activities
Acquisition of subsidiary, net of cash acquired 24 (5,577) -
Loans to related parties (981) -
Proceeds from the sale of assets 518 273
Acquisition of property, plant and equipment 16 (2,125) (2,284)
Net cash (used in) investing activities (8,165) (2,011)
Cash flows from financing activities
Repayment of borrowings - (2,695)
Dividends paid 21 (6,408) (4,361)
Share buy back 21 - (1,542)
Net cash (used in) financing activities (6,408) (8,598)
Net increase/(decrease) in cash and cash equivalents (2,274) 6,384
Cash and cash equivalents at beginning of period 44,550 37,869
Effect of exchange rate fluctuations on cash held (443) 297
Cash and cash equivalents at 30 June 12 41,833 44,550
The above cash flow statement should be read in conjunction with the accompanying notes.
For
per
sona
l use
onl
y

27 2016 Annual Report
Index to Notes to the Financial Statements
1. Reporting entity 28
2. Basis of preparation 28
3. Segment reporting 30
4. Contract revenue 30
5. Other income/(expense) 31
6. Employee benefits expenses 31
7. Restructuring and impairment expenses 31
8. Finance income and expenses 31
9. Depreciation and amortisation expenses 32
10. Income tax expense 32
11. Earnings per share 33
12. Cash and cash equivalents 34
13. Trade and other receivables 35
14. Inventories 35
15. Construction work in progress 35
16. Property, plant and equipment 36
17. Intangible assets – goodwill and customer contracts 37
18. Trade and other payables 38
19. Unearned revenue 38
20. Provisions 38
21. Capital and reserves 39
22. Financial instruments 40
23. Investments in subsidiaries 43
24. Business Combinations 43
25. Interest in joint operations 45
26. Share-based payments 46
27. Reconciliation of cash flows from operating activities 49
28. Commitments 50
29. Contingencies 50
30. Subsequent events 50
31. Auditor’s remuneration 50
32. Parent entity disclosures 51
33. Related parties 51
34. Significant accounting policies 53
35. Determination of fair values 63
For
per
sona
l use
onl
y

28 2016 Annual Report
Notes to the Financial StatementsFor the year ending 30 June 2016
1. Reporting EntitySouthern Cross Electrical Engineering Limited (“the Company”, “the parent”) is a company incorporated and domiciled in Australia. The Company’s shares are publicly traded on the Australian Stock Exchange.
The consolidated financial statements for the year ended 30 June 2016 comprise the Company and its subsidiaries (together referred to as the “Group” and individually as “Group entities”). The Group is a for-profit entity and the nature of the operations and principal activities of the Group are described in the Directors’ Report.
2. Basis of Preparation
(a) Statement of complianceThe consolidated financial report is a general purpose financial report which has been prepared in accordance with Australian Accounting Standards (“AASBs”) (including Australian Accounting Interpretations) adopted by the Australian Accounting Standards Board (AASB) and the Corporations Act 2001. The consolidated financial report of the Group complies with International Financial Reporting Standards (IFRSs) and interpretations adopted by the International Accounting Standards Board (IASB). A listing of new standards and interpretations not yet adopted is included in note 34(v).
These financial statements have been rounded to the nearest thousand dollars where permitted by ASIC Class Order 2016/191 dated 24 March 2016.
The consolidated financial statements were authorised for issue by the Board of Directors on 23 August 2016.
(b) Basis of measurementThe consolidated financial statements have been prepared on the historical cost basis except as set out below:
• Share-based payment arrangements are measured at fair value.
• Assets and liabilities acquired in a business combination are initially recognised at fair value.
The methods used to measure fair values are discussed further in note 35.
(c) Functional and presentation currencyi. Functional and presentation currency
Both the functional and presentation currency of Southern Cross Electrical Engineering Limited and its Australian subsidiaries are Australian dollars ($). The functional currency for the Peruvian subsidiary is Neuvos Soles. Overseas functional currencies are translated to the presentation currency (see below).
ii. Transactions and balancesTransactions in foreign currencies are initially recorded in the functional currency by applying the exchange rates ruling at the date of the transaction. Monetary assets and liabilities denominated in foreign currencies are translated at the rate of exchange ruling at the balance sheet date.
Non-monetary items that are measured in terms of historical cost in a foreign currency are translated using the exchange rate as at the date of the initial transaction. Non-monetary items measured at fair value in a foreign currency are translated using the exchange rates at the date when the fair value was determined.
iii. Translation of Group Entities functional currency to presentation currencyThe results of the overseas subsidiaries are translated into Australian Dollars as at the date of each transaction. Assets and liabilities are translated at exchange rates prevailing at balance sheet date.
Exchange variations resulting from the translation are recognised in other comprehensive income and presented in the foreign currency translation reserve in equity.F
or p
erso
nal u
se o
nly

29 2016 Annual Report
2. Basis of Preparation (continued)
(d) Use of estimates and judgementsThe preparation of financial statements in conformity with AASBs requires management to make judgements, estimates and assumptions that affect the application of accounting policies and the reported amounts of assets, liabilities, income and expenses. Actual results may differ from these estimates.
Estimates and underlying assumptions are reviewed on an ongoing basis. Revisions to accounting estimates are recognised in the period in which the estimate is revised and in any future periods affected. Information about accounting estimates is included in the following notes:
• Note 17 – revoverable amount for testing goodwill
• Note 24 – business combinations
• Note 26 – measurement of share based payments.Critical judgements in applying accounting policies that have the most significant effect on the amounts recognised in the financial statements relate to contract revenue (notes 34(n)(i) and 4) and contract work in progress (notes 34(i)) and 15).
Revenue from construction contracts is recognised using the percentage of completion method. Judgement is exercised in determining the stage of completion of the contract and in reliably estimating the total contract revenue and contract costs to completion. The stage of contract completion is generally measured by reference to physical completion. An assessment of total labour hours and other costs incurred to date as a percentage of estimated total costs for each contract is used if it is an appropriate proxy for physical completion. Task lists and milestones are also used to calculate or confirm the percentage of completion if appropriate.
The key judgement in determining revenue from construction contracts is estimating the unapproved variations and claims to be included in project forecast revenue. The Company uses its best estimate and its expertise to determine the value included supported by qualified external experts where necessary. The outcome of the events which are the subject of these judgements are by nature uncertain such that final positions resolved with clients can differ materially from original estimates.
Details of the Group’s accounting policies are included in notes 34 and 35.
Notes to the Financial StatementsFor the year ending 30 June 2016
For
per
sona
l use
onl
y

30 2016 Annual Report
Notes to the Financial StatementsFor the year ending 30 June 2016
3. Segment reportingRevenue is principally derived by the Group from the provision of electrical and instrumentation services to the resources, energy and infrastructure sectors.
The Group has branded itself into the following three operating divisions: SCEE Construction, SCEE Infrastructure and SCEE Services. For the year ended 30 June 2016, the Construction division contributed revenue of $127.6 million (2015: $123.9 million), the Infrastructure division contributed revenue of $21.7 million (2015: $45.7 million) and the Services division contributed revenue of $58.3 million (2015: $68.7 million). Excluded from these amounts is $2.8 million (2015: $5.8 million) of inter-entity revenue, which is eliminated on consolidation. The divisions are exposed to similar operational risks and rewards and are only divisions for the purposes of addressing target market opportunities and facilitating appropriate project management structures.
The directors believe that the aggregation of the operating divisions for segment reporting purposes is appropriate as they:
• have similar economic characteristics;
• perform similar services using similar business processes;
• provide their services to a similar client base;
• have a centralised pool of shared assets and services; and
• operate in similar regulatory environments.
All divisions have therefore been aggregated to form one operating segment.
In presenting information on the basis of geographical segments, segment revenue is based on the geographical location of customers. Segment assets are based on the geographical location of the assets.
2016 2015
RevenueNon-current
assets RevenueNon-current
assets
$’000 $’000 $’000 $’000
Australia 207,509 42,450 237,964 31,299
South America and Caribbean 114 293 365 348
207,623 42,743 238,329 31,647
Revenues from the three largest customers of the Group’s Australian segment generated respectively $73 million, $26 million and $21 million of the Group’s total revenue (2015: $176 million generated from the three largest customers).
4. Contract Revenue
2016 2015
$’000 $’000
Contract revenue 207,623 238,329
For
per
sona
l use
onl
y

31 2016 Annual Report
5. Other income/(expense)
2016 2015
$’000 $’000
Net loss on sale/write-off of non-current assets (77) (1,219)
Foreign exchange gain 33 16
Other 190 178
146 (1,025)
6. Employee benefits expenses
Note 2016 2015
$’000 $’000
Remuneration, bonuses and on-costs (13,016) (14,405)
Superannuation contributions (879) (1,232)
Amounts provided for employee entitlements (409) (397)
Share-based payments expense 26 (162) 148
(14,466) (15,886)
The above employee benefits expenses do not include employee benefits expenses recorded within contract expenses. Employee benefits included in contract expenses were $143.0m (2014: $111.7m).
7. Restructuring and impairment expenses
Note 2016 2015
$’000 $’000
Impairment of goodwill and intangible assets 17 - (8,390)
Onerous Lease Provision - (498)
Asset write-downs - (944)
Other restructuring expenses - (1,152)
- (10,984)
8. Finance income and expenses
2016 2015
$’000 $’000
Interest income on bank deposits 791 846
Finance income 791 846
Interest expense on bank borrowings 25 (29)
Finance charges payable under finance lease - (142)
Bank charges (400) (548)
Bank guarantee fees (207) (269)
Finance expenses (582) (988)
Net finance income/(expenses) 209 (142)
Notes to the Financial StatementsFor the year ending 30 June 2016
For
per
sona
l use
onl
y

32 2016 Annual Report
Notes to the Financial StatementsFor the year ending 30 June 2016
9. Depreciation and amortisation expenses
2016 2015
$’000 $’000
Buildings (17) (14)
Leasehold improvements (178) (247)
Plant and equipment (2,288) (2,557)
Motor vehicles (1,250) (1,523)
Office furniture and equipment (1,065) (2,476)
(4,798) (6,817)
Amortisation of customer contract intangibles - (75)
10. Income tax expense
2016 2015
$’000 $’000
(a) Income Statement
Current tax expense
Current period (2,098) (6,774)
(Under)/over provision from prior year 331 (47)
(1,767) (6,821)
Deferred tax expense
Origination and reversal of temporary differences (378) 6,389
Income tax expense reported in the income statement (2,145) (432)
(b) Reconciliation between tax expense and pre-tax accounting profit
Accounting profit/(loss) before income tax 7,196 (9,369)
Income tax (expense)/credit using the Company’s domestic tax rate of 30% (2015: 30%)
(2,159) 2,811
Goodwill impairment - (2,517)
Tax losses of foreign operations not recognised (164) (165)
Research and development 193 (526)
Share based payments (49) 45
Amortisation of Intangibles - (23)
Other 34 (57)
Income tax expense reported in the income statement (2,145) (432)
The applicable effective tax rates are: 29.8% (4.6%)For
per
sona
l use
onl
y

33 2016 Annual Report
Notes to the Financial StatementsFor the year ending 30 June 2016
10. Income tax expense (continued)
Deferred tax assets and liabilities
Movement recognised in Movement recognised inBalance Sheet Income Statement Equity
2016 2015 2016 2015 2016 2015$’000 $’000 $’000 $’000 $’000 $’000
Deferred tax liabilities
Retentions (104) - 2 (164) (102) -
Work in progress (2,769) (2,640) (18) (6,033) (147) -
Property, plant and equipment (23) (23) - - - -
(2,896) (2,663) (16) (6,197) (249) -
Deferred tax assets
Provision for onerous lease 49 149 101 (149) - -
Provision assets held for sale value - 134 134 (134) - -
Provision for doubtful debt 13 - (1) - 12 -
Accruals 81 59 (23) (12) - -
Employee benefits 1,798 1,934 290 89 154 -
Property, plant and equipment 59 19 (40) 9 - -
Other 212 144 (68) - - -
Borrowing costs - 1 1 5 - -
2,212 2,440 394 (192) 166 -
Net deferred tax assets/(liabilities) (684) (223) 378 (6,389) (83) -
Unrecognised deferred tax assets At 30 June 2016, there was a deferred tax benefit of $3.6 million (2015: $3.6 million) for tax loss incurred in the Cruz Del Sur Ingenieria Electra (Peru) S.A. subsidiary which was not recognised because it is not probable that future taxable profit will be available against which the Group can use the benefits therefrom. These tax losses do not have a an expiry date.
11. Earnings per shareBasic earnings per shareThe calculation of basic earnings per share at 30 June 2016 was based on the profit attributable to ordinary shareholders of $5,051,000 (2015: loss; ($9,801,000)) and a weighted average number of ordinary shares outstanding of 158,213,701 (2015: 160,080,407), calculated as follows:
Profit/(loss) attributable to ordinary shareholders
2016 2015
$’000 $’000
Profit/(loss) for the period 5,051 (9,801)
Weighted average number of ordinary shares
Note 2016 2015
Issued ordinary shares at 1 July 21 158,210,370 161,523,130
Effective new balance resulting from share issue/buy back in the year 3,331 (1,442,723)
Weighted average number of ordinary shares at 30 June 158,213,701 160,080,407
For
per
sona
l use
onl
y

34 2016 Annual Report
Notes to the Financial StatementsFor the year ending 30 June 2016
11. Earnings per share (continued)
Diluted earnings per shareThe calculation of diluted earnings per share at 30 June 2016 was based on the profit attributable to ordinary shareholders of $5,051,000 (2015: loss; ($9,801,000)) and a weighted average number of ordinary shares outstanding after adjustment for the effects of all dilutive potential ordinary shares of 158,213,701 (2015: 160,080,407), calculated as follows:
Profit attributable to ordinary shareholders (diluted)
Note 2016 2015
$’000 $’000
Profit for the period 5,051 (9,801)
Weighted average number of ordinary shares (diluted)
Note 2016 2015
Weighted average number of ordinary shares for basic earnings per share 158,213,701 160,080,407
Effect of dilution:
Contingently issuable shares - Datatel acquisition 14,039
Share options and performance rights on issue 2,174,804 -
Weighted average number of ordinary shares at 30 June 160,402,544 160,080,407
12. Cash and cash equivalentsNote 2016 2015
$’000 $’000
Bank balances 3,998 2,873
Short term deposits 37,835 41,677
Cash and cash equivalents in the statement of cash flows 41,833 44,550
The effective interest rate on cash and cash equivalents was 1.8% (2015: 2.5%); these deposits are either at call or on short term deposit.
For
per
sona
l use
onl
y

35 2016 Annual Report
Notes to the Financial StatementsFor the year ending 30 June 2016
13. Trade and other receivablesNote 2016 2015
$’000 $’000
Current
Trade receivables 21,203 34,064
Retentions 347 -
21,550 34,064
Non-current
Loans to vendors 478 -
Trade receivables are non-interest bearing and are generally on 30 day terms. A provision for impairment loss has not been recognised due to the collection record of the counterparties with whom the Group transacts.
Non-current receivables represent loans made in relation to the acquisition in Datatel Communications Pty Ltd, future earn out payments.
14. Inventories
Note 2016 2015
$’000 $’000
Raw materials and consumables 2,379 2,947
15. Construction work in progress
Note 2016 2015
$’000 $’000
Costs incurred to date 156,262 114,840
Recognised profit 34,655 19,649
Progress billings (181,688) (125,933)
Construction work in progress 9,229 8,556
Work in progress represents the gross unbilled amount expected to be collected from customers for contract work performed to date. Cost includes all expenditure related directly to specific projects. Recognised profit is based on the percentage completion method and is determined using the costs incurred to date and the total forecast contract costs.
For
per
sona
l use
onl
y

36 2016 Annual Report
Notes to the Financial StatementsFor the year ending 30 June 2016
16. Property, plant and equipment
Land and Buildings
Leasehold Improvements
Plant and equipment
Motor Vehicles
Office Furniture
and Equipment Total
$’000 $’000 $’000 $’000 $’000 $’000
Cost Balance at 1 July 2014 916 3,341 23,153 14,824 11,396 53,630
Additions - 17 993 26 1,248 2,284
Disposals/write-downs - (898) (292) (1,130) (2,395) (4,715)
Reclassification to assets held for sale (671) - (1,516) (479) - (2,666)
Exchange differences - - 72 - 4 76
Balance at 30 June 2015 245 2,460 22,410 13,241 10,253 48,609
Balance at 1 July 2015 245 2,460 22,410 13,241 10,253 48,609
Additions - - 720 715 690 2,125
Disposals - (6) (1,243) (419) (930) (2,598)
Acquisitions - - 307 933 166 1,406
Reclassification from assets held for sale 671 - (5) - - 666
Exchange differences - - (79) - - (79)
Balance at 30 June 2016 916 2,454 22,110 14,470 10,179 50,129
Depreciation and impairment losses
Balance at 1 July 2014 (102) (1,048) (10,646) (6,737) (4,356) (22,889)
Depreciation for the year (14) (247) (2,557) (1,523) (2,476) (6,817)
Disposals/write-downs - 403 257 1,004 1,061 2,725
Reclassification to assets held for sale 115 - 801 393 - 1,309
Exchange differences - - (74) - - (74)
Balance at 30 June 2015 (1) (892) (12,219) (6,863) (5,771) (25,746)
Balance at 1 July 2015 (1) (892) (12,219) (6,863) (5,771) (25,746)
Depreciation for the year (17) (178) (2,288) (1,250) (1,065) (4,798)
Disposals 2 1,228 310 930 2,470
Acquisitions - - (113) (508) (105) (726)
Reclassification from assets held for sale (115) - (54) - - (169)
Exchange differences - - 23 - - 23
Balance at 30 June 2016 (133) (1,068) (13,423) (8,311) (6,011) (28,946)
Carrying amounts
At 1 July 2014 814 2,293 12,507 8,087 7,040 30,741
At 30 June 2015 244 1,568 10,191 6,378 4,482 22,863
At 1 July 2015 244 1,568 10,191 6,378 4,482 22,863
At 30 June 2016 783 1,386 8,687 6,159 4,168 21,183
For
per
sona
l use
onl
y

37 2016 Annual Report
Notes to the Financial StatementsFor the year ending 30 June 2016
17. Intangible assets – goodwill and customer contractsReconciliation of carrying amount
NoteGoodwill
$’000
Customer Contracts
$’000Total $’000
Balance as at 1 July 2014 17,174 1,811 18,985
Acquisitions through business combinations - - -
Balance as at 30 June 2015 17,174 1,811 18,985
Balance as at 1 July 2015 17,174 1,811 18,985
Acquisitions through business combinations 24 12,298 - 12,298
Balance as at 30 June 2016 29,472 1,811 31,283
Amortisation and impairment losses
Balance as at 1 July 2014 - (1,736) (1,736)
Impairment loss (8,390) - (8,390)
Amortisation - (75) (75)
Balance as at 30 June 2015 (8,390) (1,811) (10,201)
Balance as at 1 July 2015 (8,390) (1,811) (10,201)
Amortisation - - -
Balance as at 30 June 2016 (8,390) (1,811) (10,201)
Carrying amounts
At 1 July 2014 17,174 75 17,249
At 30 June 2015 8,784 - 8,784
At 1 July 2015 8,784 - 8,784
At 30 June 2016 21,082 - 21,082
Impairment testing for cash-generating units containing goodwillFor the purpose of impairment testing, goodwill is allocated to the Group’s operating divisions which represent the lowest level within the Group at which goodwill is monitored for internal management purposes.
The aggregate carrying amounts of goodwill allocated to each unit are as follows:
2016 2015
$’000 $’000
Infrastructure 3,306 3,306
Services 5,478 5,478
Datatel 12,298 -
21,082 8,784
The recoverable amount of the above cash generating units (“CGUs”) was based on their value in use with the exception of Datatel in which the Group has applied the fair value less costs to sell method given the acquisition’s close proximity to the reporting date. The group performed its annual impairment test in June 2016. The carrying amount of the CGUs was determined to be lower than their recoverable amounts and therefore no impairment charge has been recognised.
For
per
sona
l use
onl
y

38 2016 Annual Report
Notes to the Financial StatementsFor the year ending 30 June 2016
17. Intangible assets – goodwill and customer contracts (continued)
Value in use was determined by discounting the future cash flows generated from the continuing operations of the CGU. Five years of cash flows were included in the discounted cash flow models together with a terminal value reflecting a long term growth rate of 2.5% (2015: 2.5%). The calculation of value in use was based on the following key assumptions:
• Cash flows were projected based on past experience, actual operating results and independent research on the markets in which the CGUs operate.
• EBITDA for 2017 is based on the board approved budget with EBITDA for 2018 – 2021 based on management forecasts. The anticipated annual revenue growth included in the cash flow projections has been based on growth rates that have been estimated by management. The margins included in the projected cash flow are the same rate that has been achieved by projects commencing in 2016.
• A post-tax discount rate of 11.02% (2015: 12.15%) was applied. This discount rate was estimated based on past experience and industry average weighted cost of capital.
18. Trade and other payables2016 2015
$’000 $’000
Current
Trade payables 5,896 6,541
Accrued expenses 10,913 12,965
Goods and services tax payable 1,280 2,455
18,089 21,961
Due to the short-term nature of these payables, their carrying value is assumed to approximate their fair value.
The Group’s exposure to currency and liquidity risk related to trade and other payables is disclosed in note 22.
19. Unearned revenue2016 2015
$’000 $’000
Current
Unearned revenue 1,387 3,163
1,387 3,163
Unearned revenue arises when the Group has invoiced the client in advance of performing the contracted services.
20. Provisions2016 2015
$’000 $’000
Current
Annual leave 4,053 4,760
Long service leave 629 747
Onerous Lease 162 498
4,844 6,005
Non-current
Long service leave 324 353
A provision has been recognised for employee entitlements relating to long service leave. In calculating the present value of future cash flows in respect of long service leave, the probability of long service leave being taken is based on historical data. The measurement and recognition accounting policy relating to employee benefits have been included in note 34(k) to this report.
For
per
sona
l use
onl
y

39 2016 Annual Report
Notes to the Financial StatementsFor the year ending 30 June 2016
21. Capital and reservesShare capital
2016 2015
Number $’000 Number $’000
Ordinary shares
Issued and fully paid 159,426,058 56,656 158,210,370 56,036
Movements in shares on issue
Balance at the beginning of the financial year 158,210,370 56,036 161,523,130 57,578
Share issue/buy back 1,215,688 620 (3,312,760) (1,542)
Balance at the end of the financial year 159,426,058 56,656 158,210,370 56,036
The Company does not have authorised capital or par value in respect of its issued shares. All shares have voting right and rights to dividends.
Translation reserveThe translation reserve comprises all foreign currency differences arising from the translation of the financial statements of foreign operations.
Share based payments reserveThe share based payments reserve records the fair value of share based payments provided to employees.
DividendsDividends recognised in the current year by the Group are:
Cents per share
Total amount $’000 Franked
Date ofpayment
2016
Final 2015 ordinary 2.70 4,272 Franked 13th October 2015
Interim 2016 ordinary 1.35 2,136 Franked 12th April 2016
Total amount 6,408
2015
Final 2014 ordinary 2.70 4,361 Franked 14th October 2014
Total amount 4,361
Franked dividends declared or paid during the year were franked at the tax rate of 30%.
Declared after end of yearAfter the balance sheet date a dividend of 1.35 cents per share in the amount of $2,152 million was proposed by the directors. The dividend has not been provided in the financial statements.
Company
2016 2015
$’000 $’000
Franking account balance 18,469 12,013
The above available amounts are based on the balance of the dividend franking account at year-end adjusted for:
a) franking credits that will arise from the payment of the current tax liabilities; and
b) franking debits that will arise from the payment of dividends recognised as a liability at the year end.
The ability to utilise the franking credits is dependent upon there being sufficient available profits to declare dividends.
For
per
sona
l use
onl
y

40 2016 Annual Report
Notes to the Financial StatementsFor the year ending 30 June 2016
22. Financial instrumentsOverviewThe Group has exposure to the following risks from their use of financial instruments:
• Credit risk• Liquidity risk• Market risk
This note presents information about the Group’s exposure to each of the above risks, their objectives, policies and processes for measuring and managing risks, and the management of capital. Further quantitative disclosures are included throughout this financial report.
The Board of Directors has overall responsibility for the establishment and oversight of the risk management framework. The Board has established an Audit and Risk Management Committee, which is responsible for overseeing how management monitors risk and for reviewing the adequacy of the risk management framework in relation to the risks faced by the Group. The committee reports regularly to the Board of Directors on its activities.
Risk management policies are established to identify and analyse the risks faced by the Group, to set appropriate risk limits and controls and to monitor risks and adherence to limits. Risk management policies and systems are reviewed regularly to reflect changes in market conditions and the Group’s activities. The Group, through its training and management standards and procedures, aims to develop a disciplined and constructive control environment in which all employees understand their roles and obligations in relation to the management and mitigation of these risks.
Credit riskCredit risk is the risk of financial loss to the Group if a customer or counterparty to a financial instrument fails to meet its contractual obligations, and arises principally from the Group’s receivables from customers.
Exposure to credit riskThe carrying amount of the Group’s financial assets represents the maximum credit exposure. The Group’s maximum exposure to credit risk at the reporting date was:
Carrying amount
2016$’000
2015$’000
Cash and cash equivalents 41,833 44,550
Trade and other receivables 21,550 34,064
Loans to vendors 478 -
63,861 78,614
CashThe Group’s cash and cash equivalents are held with major banks and financial institutions.
Trade and other receivablesThe Group’s exposure to credit risk is influenced mainly by the individual characteristics of each customer. The demographics of the Group’s customer base, including the default risk of the industry and country, in which customers operate, has less of an influence on credit risk. Approximately 59 percent (2015: 50 percent) of the Group’s trade receivables are attributable to transactions with three major customers. Geographically, the concentration of credit risk is within Australia and, by industry, the concentration is within the mining, and oil and gas industry.
When entering into new customer contracts for service, the Group only enters into contracts with reputable companies. Management monitors the Group’s exposure on a monthly basis.
In the last five years no provision for impairment loss has been recognised against the customers with whom the Group transacts. In monitoring customer credit risk, customers are grouped according to their credit characteristics, including whether they are an individual or legal entity, aging profile, maturity and existence of previous financial difficulties.
The Group does not require collateral in respect of trade and other receivables.
The Group has not established an allowance for impairment that represents their estimate of incurred losses in respect of trade and other receivables as it not considered necessary based on the payment history of its client base.
For
per
sona
l use
onl
y

41 2016 Annual Report
Notes to the Financial StatementsFor the year ending 30 June 2016
22. Financial instruments (continued)The Group’s maximum exposure to credit risk for trade receivables at the reporting date by geographic region was:
Carrying amount
2016 2015
$’000 $’000
Australia 21,370 34,009
South America and Caribbean 180 55
21,550 34,064
Impairment lossesThe ageing of the Group’s trade receivables at the reporting date was:
Gross Impairment Gross Impairment
2016 $’000
2016 $’000
2015 $’000
2015 $’000
Not past due 17,130 - 26,458 -
Past due 0-30 days 2,879 - 6,909 -
Past due 30-60 days 547 - 120 -
Past due 60 days and less than 1 year 933 - 577 -
More than 1 year 61 - - -
21,550 - 34,064 -
Based on historic default rates, the Group believes no impairment allowance is necessary in respect of trade receivables as the customers have a good credit history with the Group.
Credit terms with two major customers were renegotiated to 45 and 60 days respectively.
Liquidity riskLiquidity risk is the risk that the Group will not be able to meet its financial obligations as they fall due. The Group’s approach to managing liquidity is to ensure, as far as possible, that it will always have sufficient liquidity to meet its liabilities when due, under both normal and stressed conditions, without incurring unacceptable losses or risking damage to the Group’s reputation.
The Group uses project costing to assess the cash flows required for each project currently underway and entered into. Management monitors cash flow using rolling forecasts and annual budgets that are monitored at a Board level on a monthly basis.
The following are the contractual maturities of financial liabilities, including estimated interest payments and excluding the impact of netting agreements:
Carrying amount
Contractual cash flows
6 mths or less 6-12 mths 1-2 years 2-5 years
More than 5 years
$’000 $’000 $’000 $’000 $’000 $’000 $’000
30 June 2016
Non-derivative financial liabilities
Trade and other payables 18,089 18,089 18,089 - - - -
Deferred consideration 8,659 8,659 - - 2,374 3,212 3,073
26,748 26,748 18,089 - 2,374 3,212 3,073
30 June 2015
Non-derivative financial liabilities
Trade and other payables 21,961 21,961 21,961 - - - -
21,961 21,961 21,961 - - - -
For
per
sona
l use
onl
y

42 2016 Annual Report
Notes to the Financial StatementsFor the year ending 30 June 2016
22. Financial instruments (continued)
Market RiskMarket risk is the risk that changes in market prices, such as foreign exchange rates, interest rates and equity prices will affect the Group’s income or the value of its holdings of financial instruments. The objective of market risk management is to manage and control market risk exposures within acceptable parameters, while optimising the return.
Currency riskThe Group is exposed to currency risk on sales, purchases and borrowings that are denominated in a currency other than the functional currency in which they are measured. The Group has no material currency risk exposures at 30 June 2016 or 30 June 2015.
In respect of other monetary assets and liabilities denominated in foreign currencies, the Group ensures that its net exposure is kept to an acceptable level by buying or selling foreign currencies at spot rates when necessary to address short-term imbalances.
Interest rate risk
ProfileAt the reporting date the interest rate profile of the Company’s and the Group’s interest-bearing financial instruments was:
Carrying amount
2016 2015
$’000 $’000
Variable rate instruments
Financial assets 42,311 44,550
Fair value sensitivity analysis for fixed rate instrumentsThe Group does not account for any fixed rate financial assets and liabilities at fair value through profit or loss. Therefore a change in interest rates at the reporting date would not affect profit or loss.
Cash flow sensitivity analysis for variable rate instrumentsA change of 100 basis points in interest rates at the reporting date would have increased (decreased) equity and profit or loss by the amounts shown below. This analysis assumes that all other variables, in particular foreign currency rates, remain constant. The analysis is performed on the same basis for 2016.
Profit or loss Equity
100bp increase $’000
100bp decrease $’000
100bp increase $’000
100bp decrease $’000
30 June 2016
Variable rate instruments 708 (708) - -
Cash flow sensitivity (net) 708 (708) - -
30 June 2015
Variable rate instruments 671 (671) - -
Cash flow sensitivity (net) 671 (671) - -For
per
sona
l use
onl
y

43 2016 Annual Report
Notes to the Financial StatementsFor the year ending 30 June 2016
22. Financial instruments (continued)
Fair values
Fair values versus carrying amountsThe fair values of financial assets and liabilities materially equates to the carrying values shown in the balance sheet.
Other Price RiskThe Group is not directly exposed to any other price risk.
Capital ManagementThe Board’s policy is to maintain a strong capital base so as to maintain investor, creditor and market confidence and to sustain future development of the business. The Board of Directors has not implemented a formal capital management policy however they have implemented a dividend policy.
The Group intends to make an annual distribution to shareholders in the form of fully franked dividends, subject to the Group’s financial results in a given year, general business and financial conditions, the Group’s taxation position, its working capital and future capital expenditure requirements, the availability of sufficient franking credits and any other factors the Board considers relevant.
There were no changes in the Group’s approach to capital management during the year.
The Group is not subject to externally imposed capital requirements.
23. Investments in subsidiariesThe consolidated financial statements include the financial statements of Southern Cross Electrical Engineering Ltd and the subsidiaries listed in the following table.
Country of Incorporation Equity Interest (%)
2016 2015
Cruz Del Sur Ingeniería Electra (Peru) S.A Peru 100 100
Southern Cross Electrical Engineering (WA) Pty Ltd Australia 100 100
Southern Cross Electrical Engineering Tanzania Pty Ltd Tanzania 100 100
Southern Cross Electrical Engineering Ghana Pty Ltd Ghana 100 100
K.J. Johnson & Co. Pty Ltd Australia 100 100
FMC Corporation Pty Ltd Australia 100 100
Southern Cross Electrical Engineering (Australia) Pty Ltd Australia 100 100
Hazquip Industries Pty Ltd Australia 100 100
Datatel Communications Pty Ltd Australia 100 -
24. Business combinationsOn 29 June 2016 Southern Cross Electrical Engineering Ltd acquired 100% of Datatel Communications Pty Ltd. Datatel is an award winning electrical and communications contractor with a significant presence in the telecommunications and infrastructure sectors in Western Australia. The acquisition forms part of SCEE’s strategy of growth through expansion into adjacent and complementary sectors and new geographies and provides SCEE with a scalable platform to enter the telecommunications sector. F
or p
erso
nal u
se o
nly

44 2016 Annual Report
Notes to the Financial StatementsFor the year ending 30 June 2016
24. Business combinations (continued)
Consideration transferred$’000
Cash 5,580
Issued shares (i) 620
Contingent consideration arrangement (ii) 8,659
14,859
(i) Issue of 1,215,688 shares were made at the market value of the shares at the time of issue
(ii) The Group has agreed to pay the selling shareholders additional consideration of up to $10,966,000 subject to Datatel’s future earnings before interest, tax, depreciation and amortisation (EBITDA) exceeding the following targets:
• $1,400,000 payable on achieving at least $3,100,000 EBITDA in the financial year ended 30 June 2017;• $1,033,000 payable on achieving at least $3,100,000 EBITDA in the financial year ended 30 June 2018;• $1,033,000 payable on achieving at least $3,100,000 EBITDA in the financial year ended 30 June 2019; and• 33% of EBITDA above $3,100,000 in each of the financial years ended 30 June 2017, 30 June 2018 and 30 June 2019 capped at
$2,500,000 in any individual financial year.
The contingent consideration of $8,659,000 recognised at acquisition date represents the fair value of expected future payments based on the Directors’ assessment of the expected achievement of these earn out targets.
Acquisition-related costs amounting to $399,385 (2015: Nil) have been excluded from the consideration transferred and have been recognised as an expense in the year, within ‘administration expenses’ line item in the statement of comprehensive income.
Assets acquired and liabilities assumed at the date of acquisitionThe fair values of the identifiable assets and liabilities of Datatel Communications Pty Ltd as at the date of acquisition were:
Fair value recognised
$’000
Cash and cash equivalents 3
Trade and other receivables 5,400
Work in progress 488
Prepayments 239
Property, plant and equipment 680
Trade and other payables (2,975)
Provisions (441)
Tax payable (247)
Deferred tax liability (83)
3,064
Less: Excess working capital acquired (503)
Net identifiable assets / liabilities acquired 2,561
Goodwill arising on acquisitionFair value
recognised $’000
Consideration 14,859
Less: fair value of identifiable net assets / liabilities acquired (2,561)
Goodwill arising on acquisition 12,298
For
per
sona
l use
onl
y

45 2016 Annual Report
Notes to the Financial StatementsFor the year ending 30 June 2016
24. Business combinations (continued)
Fair values measured on a provisional basisThe initial accounting for the acquisition of Datatel has only been provisionally determined at the end of the reporting period.
Net cash outflow on acquisition of subsidiary$’000
Consideration paid in cash 5,580
Less: cash and cash equivalents balances acquired (3)
Net cash flow on acquisition (5,577)
Impact of acquisition on the result of the GroupThere is a nil contribution in the year to the profit before tax.
Had the business combination been effected at 1 July 2015, the revenue of the Group from continuing operations would have been $231 million and the net profit before tax for the year from continuing operations would have been $6.6 million.
25. Interest in joint operationsThe Group has a 50% interest in KSJV Unincorporated and KSJV Australia Pty Ltd, of which the principal activity is to deliver electrical, instrumentation and telecommunication works to onshore processing elements of the region’s LNG projects. These joint arrangements are accounted for as joint operations.
The Group’s share of the underlying assets and liabilities as at 30 June 2016 and 2015 and revenues and expenses of the joint operations for the year 30 June 2016 and 2015, which are proportionally consolidated in the consolidated financial statements, is as follows:
2016 $’000
2015 $’000
Share of the joint operations’ statement of financial position:
Current assets 2,669 4,400
Current liabilities (631) (1,540)
Non-current liabilities (875) (1,158)
Equity 1,163 1,702
Share of the joint operations’ revenue and profit:
Revenue 17,749 37,558
Contract expenses (16,103) (32,852)
Other expenses (785) (714)
Profit before tax 861 3,992
Income tax expense (258) (1,198)
Profit for the year from continuing operations 603 2,794
The joint operations have no contingent liabilities or capital commitments as at 30 June 2016 and 30 June 2015.For
per
sona
l use
onl
y

46 2016 Annual Report
Notes to the Financial StatementsFor the year ending 30 June 2016
26. Share-based payments(a) Expense recognised in profit or lossShare based payments expenses for the year comprises:
2016 $’000
2015 $’000
2016 Performance Rights (i) 120 -
2015 Performance Rights (ii) 51 110
2014 Performance Rights (iii) (9) (203)
2013 Performance Rights - (55)
162 (148)
The amount recognised is adjusted to reflect the number of awards for which the related service and non-market performance conditions are expected to be met, such that the amount ultimately recognised is based on the number of awards that meet the related service and non-market performance conditions at the vesting date.
(i) 2016 Performance RightsDuring the year Performance Rights were offered to key management personnel and senior management under the terms of the Senior Management Long Term Incentive Plan. The terms and conditions of the Performance Rights are as follows. All Performance Rights are to be settled by the physical delivery of shares.
Grant date / employees entitledNumber of
instruments Vesting conditions Contractual life
Performance rights issued to senior management on 16 November 2015
194,978 Employed on 30 June 2018 and exceed performance hurdles
32 months
Performance rights issued to key management on 16 November 2015
1,400,000 Employed on 30 June 2018 and exceed performance hurdles
32 months
Total /performance rights 1,594,978
Up to 100% of the allocated performance rights may vest, subject to the achievement of the performance conditions as set out below. The key terms of the performance rights are:
• To be performance tested over a three year period from 1 July 2015 to 30 June 2018 (“Performance Period”);
• No performance rights will vest until 30 June 2018;
• Performance testing criteria are 50% against Absolute Total Shareholder Return (“TSR”) performance, and 50% against Earnings Per Share (“EPS”) performance; and
• Expiry on the 4th anniversary of the grant date unless an earlier lapsing date applies
The TSR formula is:((Share Price at Test Date – Share Price at Start Date) + (Dividends Reinvested))/Share Price at Start Date
TSR will be assessed against targets for threshold performance of 18.5% per annum compounded over the Performance Period and for stretch performance of 26.5% per annum compounded over the Performance Period. The vesting schedule is as follows for TSR performance over the Performance Period:
Less than 18.5% per annum compounded 0% vesting
18.5% per annum compounded 50% vesting
Between 18.5% and 26.5% per annum compounded Pro-rata vesting between 50% and 100%
At or above 26.5% per annum compounded 100% vesting
For
per
sona
l use
onl
y

47 2016 Annual Report
Notes to the Financial StatementsFor the year ending 30 June 2016
26. Share-based payments(i) 2016 Performance Rights (continued)EPS will be assessed against targets for threshold performance of 2.8 cents per share at the end of the Performance Period and for stretch performance of 3.6 cents per share at the end of the Performance Period. The vesting schedule is as follows for EPS performance at the end of the Performance Period:
Less than 2.8 cents per share 0% vesting
2.8 cents per share 50% vesting
Between 2.8 and 3.6 cents per share Pro-rata vesting between 50% and 100%
At or above 3.6 cents per share 100% vesting
Once the performance measurement calculation has been finalised the company will allot and issue the equivalent number of shares at nil consideration on the basis of one ordinary share per vested performance right for all performance rights exercised.
During the year nil 2016 performance rights were forfeited.
(ii) 2015 Performance RightsThere were 985,701 2015 Performance Rights on issue at 1 July 2015. No 2015 Performance Rights were granted, none vested and 264,286 were forfeited during the year.
The 2015 Performance Rights will be performance tested over a three-year period from 1 July 2014 to 30 June 2017. The hurdles used to determine performance are Relative Total Shareholder Return (TSR) and Earnings per Share (EPS) performance.
TSR will be assessed against targets for threshold performance of 8% per annum compounded over the Performance Period and for stretch performance of 15% per annum compounded over the Performance Period. The vesting schedule is as follows for TSR performance over the Performance Period:
Less than 8% per annum compounded 0% vesting
8% per annum compounded 50% vesting
Between 8% and 15% per annum compounded Pro-rata vesting between 50% and 100%
At or above 15% per annum compounded 100% vesting
EPS will be assessed against targets for threshold performance of 5.7 cents per share at the end of the Performance Period and for stretch performance of 7.3 cents per share at the end of the Performance Period. The vesting schedule is as follows for EPS performance at the end of the Performance Period:
Less than 5.7 cents per share 0% vesting
5.7 cents per share 50% vesting
Between 5.7 and 7.3 cents per share Pro-rata vesting between 50% and 100%
At or above 7.3 cents per share 100% vesting
For
per
sona
l use
onl
y

48 2016 Annual Report
Notes to the Financial StatementsFor the year ending 30 June 2016
26. Share-based payments(iii) 2014 Performance RightsThere were 387,812 2014 Performance Rights on issue at 1 July 2015. No 2014 Performance Rights were granted, none vested and 68,593 were forfeited during the year
The 2014 Performance Rights were performance tested over a three-year period from 1 July 2013 to 30 June 2016. The hurdles used to determine performance are Relative Total Shareholder Return (TSR) and Earnings per Share (EPS) performance.
TSR will be assessed against targets for threshold performance of 12% per annum compounded over the Performance Period and for stretch performance of 15% per annum compounded over the Performance Period. The vesting schedule is as follows for TSR performance over the Performance Period:
Less than 12% per annum compounded 0% vesting
12% per annum compounded 50% vesting
Between 12% and 15% per annum compounded Pro-rata vesting between 50% and 100%
At or above 15% per annum compounded 100% vesting
EPS will be assessed against targets for threshold performance of 17 cents per share at the end of the Performance Period and for stretch performance of 22 cents per share at the end of the Performance Period. The vesting schedule is as follows for EPS performance at the end of the Performance Period:
Less than 17 cents per share 0% vesting
17 cents per share 50% vesting
Between 17 and 22 cents per share Pro-rata vesting between 50% and 100%
At or above 22 cents per share 100% vesting
(b) Measurement of fair values The fair value of the TSR Performance Rights has been measured using the Monte-Carlo simulation. The EPS Performance Rights has been measured using the Binomial tree methodology.
The inputs used in the measurement of the fair values at grant date were as follows:
The performance rights issued were granted in one tranche as follows:
2016 2015
Grant date 16 November 2015 4 November 2014
Vesting date 30 June 2018 30 June 2017
Share price at grant date $0.35 $0.49
Expected life 2.6 years 2.6 years
Volatility 45% 2.45%
Risk free interest rate 2.04% 2.54%
Dividend yield 5.7% 5.40%
Fair value of TSR component $0.15 $0.25
Fair value of EPS component $0.30 $0.42For
per
sona
l use
onl
y

49 2016 Annual Report
Notes to the Financial StatementsFor the year ending 30 June 2016
26. Share-based payments (continued)
(c) Reconciliation of outstanding performance rightsThe number and weighted average exercise prices of performance rights under the programmes were as follows:
2016 2015
Number of rights Number of rights
Outstanding at 1 July 1,629,552 2,914,382
Granted during the year 1,594,978 2,120,941
Forfeited during the year (588,918) (3,405,771)
Outstanding at 30 June 2,635,612 1,629,552
Vested and exercisable at 30 June - -
Subsequent to 30 June 2016 it has been determined that the vesting conditions in respect of the 2014 Performance rights have not been met and 319,219 performance rights included as outstanding above will be forfeited.
27. Reconciliation of cash flows from operating activities
2016 2015
$’000 $’000
Cash flows from operating activities
(Loss)/profit for the year 5,051 (9,801)
Adjustments for:
Depreciation and amortisation 4,798 6,892
(Profit)/Loss on sale of property, plant and equipment 77 1,715
Impairment expense - 8,390
Equity-settled share-based payment transactions 162 (148)
(Increase)/decrease in assets:
Trade and other receivables 18,154 (5,603)
Income tax receivable (3,267) -
Work in progress (185) 20,354
Inventories 568 (298)
Prepayments 320 (301)
Increase/(decrease) in liabilities:
Trade and other payables (6,846) (2,008)
Unearned revenue (1,776) 2,030
Provisions and employee benefits (1,631) 1,020
Income tax payable (3,504) 1,140
Deferred income tax 378 (6,389)
Net cash from operating activities 12,299 16,993For
per
sona
l use
onl
y

50 2016 Annual Report
Notes to the Financial StatementsFor the year ending 30 June 2016
28. CommitmentsLeasing commitments
Operating lease commitments – as lesseeThe Group has entered into commercial property and motor vehicle leases. These leases have an average life of 2 years remaining with the property leases containing options to renew at the end of the initial term. Future minimum rentals payable under non-cancellable operating leases as at 30 June 2016 are:
2016 2015
$’000 $’000
Within one year 1,535 1,038
After one but no more than five years 2,778 2,199
After more than five years 1 458
Total minimum lease payments 4,314 3,695
Under the terms of the property leases, the rent payable is subject to annual review. This review adjusts the annual rent by the movement in the consumer price index. At the end of every third year annual rent is subject to a market review.
29. ContingenciesThe directors are of the opinion that provisions are not required in respect of these matters, as it is not probable that a future sacrifice of economic benefits will be required or the amount is not capable of reliable measurement.
2016 2015
$’000 $’000
Bank Guarantees 11,919 20,143
Surety Bonds 7,544 8,493
Total bank guarantee facilities at 30 June 2016 were $40 million and the unused portion was $28.1 million. This facility is subject to annual review. Total surety bonds facilities at 30 June 2016 were $20 million and the unused portion was $12.5 million. This facility is subject to annual review. Both facilities are set to mature on 31 August 2017. It is management’s intention to renew these facilities at a level appropriate to support the ongoing business of the Group.
30. Subsequent eventsThere are no matters or circumstances that have arisen since the end of the financial year which significantly affected or may significantly affect the operations of the consolidated entity, the results of those operations, or the state of affairs of the consolidated entity in subsequent financial years.
31. Auditor’s remuneration
2016 2015
$’000 $’000
Remuneration of KPMG Australia as the auditor of the parent entity for:
- Auditing or reviewing the financial report 201,800 200,000
- All other services - 105,984
201,800 305,984For
per
sona
l use
onl
y

51 2016 Annual Report
Notes to the Financial StatementsFor the year ending 30 June 2016
32. Parent entity disclosuresAs at, and throughout, the financial year ending 30 June 2016 the parent company of the Consolidated entity was Southern Cross Electrical Engineering Limited.
Company
2016 $’000
2015 $’000
Result of the parent entity
Profit/(loss) for the period 4,669 (12,390)
Total comprehensive income/(loss) for the period 4,669 (12,390)
Financial position of parent entity at year end
Current assets 65,200 81,512
Total assets 119,697 123,605
Current liabilities 26,729 34,125
Total liabilities 38,354 41,305
Total equity of the parent entity comprising:
Share capital 56,656 56,036
Reserves 919 757
Retained earnings 23,768 25,507
Total Equity 81,343 82,300
Parent entity contingencies:
The parent entity has commitments and contingent liabilities which are included in note 28 and 29. At 30 June 2016 there were in existence guarantees of performance of a subsidiary.
33. Related parties Transactions with key management personnel
(i) Key management personnel compensationKey management personnel compensation comprised the following:
2016 2015
$’000 $’000
Short-term employee benefits 1,500 1,878
Post-employment benefits 102 135
Termination benefits - 729
Share-based payments 197 (134)
1,799 2,608
Compensation of the Group’s key management personnel includes salaries and non-cash benefits made up of a short term incentive and long term incentive scheme (see note 26 (i)).
For
per
sona
l use
onl
y

52 2016 Annual Report
Notes to the Financial StatementsFor the year ending 30 June 2016
33. Related parties (continued)
(ii) Key management personnel transactionsDirectors of the Company control 40.9% of the voting shares of the Company.
The aggregate value of transactions and outstanding balances related to key management personnel and entities over which they have control or significant influence were as follows:
Transactions value year ended 30 June
2016 $’000
2015 $’000
Other related parties
Gianfranco Tomasi Rental expense 828 834
The Group has entered into rental agreements over the following properties:
• F & A Tomasi Superannuation Fund owns the properties at 41 and 44 Macedonia St, Naval Base WA, which are leased to Southern Cross Electrical Engineering Limited.
• G & A Tomasi own the properties at 45, 47, 49 & 51 Macedonia Street, Naval Base WA which are leased to Southern Cross Electrical Engineering Limited.
• Frank Tomasi Nominees Pty Ltd owns the property at 43 Hope Valley Road, Naval Base WA, which was leased to Southern Cross Electrical Engineering Limited.
Gianfranco Tomasi and spouse are sole directors of Frank Tomasi Nominees Pty Ltd and are the sole shareholders. Frank Tomasi Nominees Pty Ltd as trustee for the Frank Tomasi Family Trust is a major shareholder of Southern Cross Electrical Engineering Ltd.
Under the terms of each of the above property leases, the rent payable is subject to an annual review. This review adjusts the annual rent by the movement in the consumer price index. At the completion of every third year the annual rent is subject to a market review.
The rental payments made above are all at normal market rates. Hope Valley Road was reviewed by independent valuation in July 2014 and 41 and 45-51 Macedonia Street are due to be reviewed in October 2016.
For
per
sona
l use
onl
y

53 2016 Annual Report
Notes to the Financial StatementsFor the year ending 30 June 2016
34. Significant accounting policies Except as described below the accounting policies applied by the Group in this financial report are the same as those applied by the Group in its consolidated financial report as at and for the year ended 30 June 2015.
The Group has adopted the following new standards and amendments to standards, including any consequential amendments to other standards, with a date of initial application 1 July 2015.
AASB 2013-9 Amendments to Australian Accounting Standards – Conceptual Framework, Materiality and Financial Instruments
AASB 2014-1 Part A – Annual improvements 2010-2012 Cycle
AASB 2014-1 Part A – Annual improvements 2011-2013 Cycle
The application of these amendments does not have any material impact on the disclosures or the amounts recognised in the Group’s consolidated financial statements.
(a) Basis of consolidation
(i) SubsidiariesSubsidiaries are entities controlled by the Group. The group controls an entity when it is exposed to, or has rights to, variable returns from its involvement with the entity and has the ability to affect these returns through power over the entity. The financial statements of subsidiaries are included in the consolidated financial statements from the date that control commences until the date control ceases. The accounting policies of subsidiaries have been changed when necessary to align them with the policies adopted by the Group.
(ii) Interest in a joint ventureThe Group has interests in joint arrangements which are classified as joint operations, which are jointly controlled entities, whereby the ventures have a contractual arrangement that establishes joint control over the economic activity of the entities. The Group recognises its interest in the joint operations using the proportionate consolidation method. The Group combines its proportionate share of each of the assets, liabilities, income and expenses which are accounted for by separately recognising the Group’s share of underlying assets and liabilities of the joint venture with similar items, line by line, in its consolidated financial statements.
(iii) Transactions eliminated on consolidationIntra-group balances and any unrealised income and expenses arising from intra-group transactions are eliminated in preparing the consolidated financial statements. Unrealised gains arising from transactions with equity accounted investees are eliminated against the investments to the extent of the Group’s interest in the investee. Unrealised losses are eliminated in the same way as unrealised gains, but only to the extent that there is no evidence of impairment.
(b) Foreign currency
(i) Foreign currency transactionsTransactions in foreign currencies are translated to the respective functional currencies of Group entities at exchange rates at the dates of the transactions. Monetary assets and liabilities denominated in foreign currencies at the reporting date are retranslated to the functional currency at the foreign exchange rate at that date. The foreign currency gain or loss on monetary items is the difference between amortised cost in the functional currency at the beginning of the period, adjusted for effective interest and payments during the period, and the amortised cost in foreign currency translated at the exchange rate at the end of the period. Non-monetary assets and liabilities denominated in foreign currencies that are measured at fair value are retranslated to the functional currency at the exchange rate at the date that the fair value was determined. Foreign currency differences arising on retranslation are recognised in profit or loss.F
or p
erso
nal u
se o
nly

54 2016 Annual Report
Notes to the Financial StatementsFor the year ending 30 June 2016
34. Significant accounting policies (continued)
(ii) Foreign operationsThe assets and liabilities of foreign operations, including goodwill and fair value adjustments arising on acquisition, are translated to Australian dollars at exchange rates at the reporting date. Income and expenses of foreign operations are translated to Australian dollars at exchange rates at the dates of the transactions.
Foreign currency differences are recognised in other comprehensive income and presented in the foreign currency translation reserve. When a foreign operation is disposed of, in part or in full, the relevant amount in the foreign currency translation reserve is transferred to profit or loss.
Foreign exchange gains and losses arising from a monetary item receivable from or payable to a foreign operation, the settlement of which is neither planned nor likely in the foreseeable future, are considered to form part of a net investment in a foreign operation and are recognised in other comprehensive income and presented in the foreign currency translation reserve in equity.
(c) Cash and cash equivalentsCash and cash equivalents in the balance sheet comprise cash at bank and on hand and short term deposits with an original maturity of three months or less that are readily convertible to known amounts of cash and which are subject to an insignificant risk of changes in fair value.
For the purposes of the Statement of Cash Flows, cash and cash equivalents consist of cash and cash equivalents as defined above, net of outstanding bank overdrafts.
(d) Financial instruments
(i) Non-derivative financial assetsThe Group initially recognises loans and receivables and deposits on the date that they are originated. All other financial assets (including assets designated at fair value through profit or loss) are recognised initially on the trade date at which the Group becomes a party to the contractual provisions of the instrument.
The Group derecognises a financial asset when the contractual rights to the cash flows from the asset expire, or it transfers the rights to receive the contractual cash flows on the financial asset in a transaction in which substantially all the risks and rewards of ownership of the financial asset are transferred. Any interest in transferred financial assets that is created or retained by the Group is recognised as a separate asset or liability.
Financial assets and liabilities are offset and the net amount presented in the balance sheet when, and only when, the Group has a legal right to offset the amounts and intends either to settle on a net basis or to realise the asset and settle the liability simultaneously.
Financial liabilities are recognised initially at fair value plus any directly attributable transaction costs. Subsequent to initial recognition, these financial liabilities are measured at amortised cost using the effective interest rate method.
The Group has the following non-derivative financial assets:
• Loans and receivables.
• Cash and cash equivalents.
• Loans and receivables
• Loans and receivables are non-derivative financial assets with fixed or determinable payments that are not quoted in an active market. Such assets are recognised initially at fair value plus any directly attributable transaction costs. Subsequent to initial recognition loans and receivables are measured at amortised cost using the effective interest method, less any impairment losses.
• Loans and receivables comprise trade and other receivables (see note 13).
For
per
sona
l use
onl
y

55 2016 Annual Report
Notes to the Financial StatementsFor the year ending 30 June 2016
34. Significant accounting policies (continued)
(ii) Non-derivative financial liabilitiesFinancial liabilities are recognised initially on the trade date at which the Group becomes party to the contractual provisions of the instrument. The Group derecognises a financial liability when its contractual obligations are discharged or cancelled or expire. Financial assets and liabilities are offset and the net amount presented in the balance sheet when, and only when, the Group has a legal right to offset the amounts and intends either to settle on a net basis or to realise the asset and settle the liability simultaneously.
Financial liabilities are recognised initially at fair value plus any directly attributable transaction costs. Subsequent to initial recognition, these financial liabilities are measured at amortised cost using the effective interest rate method.
The Group’s non-derivative financial liabilities comprise Loans and borrowings and Trade and other payables.
(iii) Share capitalOrdinary shares
Ordinary shares are classified as equity. Incremental costs directly attributable to the issue of ordinary shares and share options are recognised as a deduction from equity, net of any tax effects.
(e) Property, plant and equipment
(i) Recognition and measurementItems of property, plant and equipment are measured at cost less accumulated depreciation and accumulated impairment losses.
Cost includes expenditure that is directly attributable to the acquisition of the asset. The cost of self-constructed assets includes the cost of materials and direct labour, any other costs directly attributable to bringing the asset to a working condition for its intended use, and the costs of dismantling and removing the items and restoring the site on which they are located. Purchased software that is integral to the functionality of the related equipment is capitalised as part of that equipment. Borrowing costs related to the acquisition or construction of qualifying assets are recognised as part of the asset.
When parts of an item of property, plant and equipment have different useful lives, they are accounted for as separate items of property, plant and equipment.
Gains and losses on disposal of an item of property, plant and equipment are determined by comparing the proceeds from disposal with the carrying amount of property, plant and equipment and are recognised net within “other income” in profit or loss.
(ii) Subsequent costs The cost of replacing part of an item of property, plant and equipment is recognised in the carrying amount of the item if it is probable that the future economic benefits embodied within the part will flow to the Group and its cost can be measured reliably. The carrying amount of the replaced part is derecognised. The costs of the day-to-day servicing of property, plant and equipment are recognised in profit or loss as incurred.
For
per
sona
l use
onl
y

56 2016 Annual Report
Notes to the Financial StatementsFor the year ending 30 June 2016
34. Significant accounting policies (continued)
(iii) Depreciation Depreciation is calculated over the depreciable amount, which is the cost of an asset, or other amount substituted for cost, less its residual value.
Depreciation is recognised in profit or loss on a diminishing value basis over the estimated useful life of each part of an item of property, plant and equipment, since this most closely reflects the expected pattern of consumption of the future economic benefits embodied in the asset.
Leased assets are depreciated over the shorter of the lease term and their useful lives unless it is reasonably certain that the Group will obtain ownership by the end of the lease term. Land is not depreciated.
The estimated useful lives for the current and comparative periods are as follows:
Buildings 40 years
Leasehold improvements 6 – 38 years
Plant and equipment 2 – 20 years
Motor vehicles 2 – 10 years
Office furniture and fittings 2 – 10 years
Depreciation methods, useful lives and residual values are reviewed at each reporting date.
(f) Intangible assets
(i) GoodwillGoodwill is measured at cost less accumulated impairment losses. The Group measures goodwill at the acquisition date as:
• the fair value of the consideration transferred; plus
• the recognised amount of any non-controlling interests in the acquiree; plus if the business combination is achieved in stages, the fair value of the existing equity interest in the acquiree; less
• the net recognised amount (generally fair value) of the identifiable assets acquired and liabilities assumed.
(ii) Other intangible assetsOther intangible assets that are acquired by the Group and have finite useful lives are measured at cost less accumulated amortisation and accumulated impairment losses.
(iii) Subsequent expenditureSubsequent expenditure is capitalised only when it increases the future economic benefits embodied in the specific asset to which it relates. All other expenditure including expenditure on internally generated goodwill and brands is recognised in profit or loss as incurred.
(iv) AmortisationAmortisation is calculated over the cost of the asset, or another amount substituted for cost, less its residual value.
Amortisation is recognised in profit or loss on a straight-line basis over the estimated useful lives of intangible assets, other than goodwill, from the date that they are available for use, since this most closely reflects the expected pattern of consumption of the future economic benefits embodied in the asset. The estimated useful lives for the current period are as follows:
2016 2015• Customer contracts 1 – 5 years 1 – 5 years
Amortisation methods, useful lives and residual values are reviewed at each financial year-end and adjusted if appropriate.
For
per
sona
l use
onl
y

57 2016 Annual Report
Notes to the Financial StatementsFor the year ending 30 June 2016
34. Significant accounting policies (continued)
(g) Leased assetsLeases in terms of which the Group assumes substantially all the risks and rewards of ownership are classified as finance leases. Upon initial recognition the leased asset is measured at an amount equal to the lower of its fair value and the net present value of the minimum lease payments. Subsequent to initial recognition, the asset is accounted for in accordance with the accounting policy applicable to that asset.
Other leases are operating leases and are not recognised in the Group’s Balance Sheet.
(h) InventoriesInventories are measured at the lower of cost and net realisable value. The cost of inventories is based on the first-in first-out principle, and includes expenditure incurred in acquiring the inventories, production or conversion costs and other costs incurred in bringing them to their existing location and condition. In the case of work in progress, cost includes an appropriate share of production overheads based on normal operating capacity.
Net realisable value is the estimated selling price in the ordinary course of business, less the estimated costs of completion and selling expenses.
(i) Construction work in progress Construction work in progress represents the gross unbilled amount expected to be collected from customers for contract work performed to date. It is measured at cost plus profit recognised to date (see note 34(n)(i)) less progress billings and recognised losses. Cost includes all expenditure related directly to specific projects and an allocation of fixed and variable overheads incurred in the Group’s contract activities based on normal operating capacity.
If payments received from customers exceed the income recognised, then the difference is presented as deferred income in the balance sheet.
(j) Assets held for saleNon-current assets, or disposal groups comprising assets and liabilities, are classified as held-for-sale if it is highly probable that they will be recovered primarily through sale rather than through continuing use.
Such assets, or disposal groups, are generally measured at the lower of their carrying amount and fair value less costs to sell. Any impairment loss on a disposal group is allocated first to goodwill, and then to the remaining assets and liabilities on a pro rata basis, except that no loss is allocated to inventories, financial assets, deferred tax assets and employee benefit assets which continue to be measured in accordance with the Group’s other accounting policies. Impairment losses on initial classification as held-for-sale and subsequent gains and losses on re-measurement are recognised in profit or loss.
Once classified as held-for-sale, intangible assets and property, plant and equipment are no longer amortised or depreciated, and any equity-accounted investee is no longer equity accounted.
(k) Impairment
(i) Financial assetsA financial asset not carried at fair value through the profit or loss is assessed at each reporting date to determine whether there is objective evidence that it is impaired. A financial asset is impaired if objective evidence indicates that a loss event has occurred after the initial recognition of the asset, and that the loss event had a negative effect on the estimated future cash flows of the asset that can be estimated reliably.
Objective evidence that a financial asset (including equity securities) is impaired can include default or delinquency by a debtor, restructuring of an amount due to the Group on terms that the Group would not consider otherwise, indications that a debtor or issuer will enter bankruptcy, the disappearance of an active market for a security. In addition, for an investment in an equity security, a significant or prolonged decline in its fair value below its cost is objective evidence of impairment.
The Group considers evidence of impairment for receivables at both a specific asset level and collective level. All individually significant receivables are assessed for specific impairment. All individually significant receivables found not to be specifically impaired are then collectively assessed for any impairment that has been incurred but not yet identified. Receivables that are not individually significant are collectively assessed for impairment by grouping together receivables with similar risk characteristics.
For
per
sona
l use
onl
y
58 2016 Annual Report
Notes to the Financial StatementsFor the year ending 30 June 2016
34. Significant accounting policies (continued)In assessing collective impairment the Group uses historical trends of the probability of default, timing of recoveries and the amount of loss incurred, adjusted for management’s judgement as to whether current economic and credit conditions are such that actual losses are likely to be greater or less than suggested by historical trends.
An impairment loss in respect of a financial asset measured at amortised cost is calculated as the difference between its carrying amount and the present value of the estimated future cash flows, discounted at the original effective interest rate. Losses are recognised in profit or loss and reflected in an allowance account against receivables. When a subsequent event causes the amount of impairment loss to decrease, the decrease in impairment loss is reversed through profit or loss.
(ii) Non-financial assetsThe carrying amounts of the Group’s non-financial assets, other than inventories and deferred tax assets, are reviewed at each reporting date to determine whether there is any indication of impairment. If any such indication exists, then the asset’s recoverable amount is estimated. For goodwill the recoverable amount is estimated each year at the same time.
The recoverable amount of an asset or cash-generating unit is the greater of its value in use and its fair value less costs to sell. In assessing value in use, the estimated future cash flows are discounted to their present value using a pre-tax discount rate that reflects current market assessments of the time value of money and the risks specific to the asset. For the purpose of impairment testing, assets are grouped together into the smallest group of assets that generates cash inflows from continuing use that are largely independent of the cash inflows of other assets or groups of assets (the “cash-generating unit”). The goodwill acquired in a business combination, for the purpose of impairment testing, is allocated to cash-generating units that are expected to benefit from the synergies of the combination.
The Group’s corporate assets do not generate separate cash inflows. If there is an indication that a corporate asset may be impaired, then the recoverable amount is determined for the CGU to which the corporate asset belongs.
An impairment loss is recognised if the carrying amount of an asset or its cash-generating unit exceeds its recoverable amount. Impairment losses are recognised in profit or loss. Impairment losses recognised in respect of cash-generating units are allocated first to reduce the carrying amount of any goodwill allocated to the units and then to reduce the carrying amount of the other assets in the unit (group of units) on a pro rata basis.
An impairment loss in respect of goodwill is not reversed. In respect of other assets, impairment losses recognised in prior periods are assessed at each reporting date for any indications that the loss has decreased or no longer exists. An impairment loss is reversed if there has been a change in the estimates used to determine the recoverable amount. An impairment loss is reversed only to the extent that the asset’s carrying amount does not exceed the carrying amount that would have been determined, net of depreciation or amortisation, if no impairment loss had been recognised.
(l) Employee benefits
(i) Long-term benefitsThe Group’s net obligation in respect of long-term employee benefits is the amount of future benefit that employees have earned in return for their service in the current and prior periods plus related on costs; that benefit is discounted to determine its present value, and the fair value of any related assets is deducted. The discount rate is the yield at the reporting date on high quality corporate bonds or government bonds that have maturity dates approximating the terms of the Group’s obligations and that are denominated in the same currency in which the benefits are expected to be paid. The calculation is performed using the Projected Unit Credit method.
For
per
sona
l use
onl
y

59 2016 Annual Report
Notes to the Financial StatementsFor the year ending 30 June 2016
34. Significant accounting policies (continued)
(ii) Termination benefitsTermination benefits are recognised as an expense when the Group is demonstrably committed, without realistic possibility of withdrawal, to a formal detailed plan to either terminate employment before the normal retirement date or to provide termination benefits as a result of an offer made to encourage voluntary redundancy. Termination benefits for voluntary redundancies are recognised as an expense if the Group has made an offer encouraging voluntary redundancy, it is probable that the offer will be accepted, and the number of acceptances can be estimated reliably.
(iii) Short-term benefitsShort-term employee benefit obligations are measured on an undiscounted basis and are expensed as the related service is provided.
A liability is recognised for the amount expected to be paid under short-term cash bonus or profit-sharing plans if the Group has a present legal or constructive obligation to pay this amount as a result of past service provided by the employee and the obligation can be estimated reliably.
(iv) Share-based payment transactionsThe fair value of performance rights and share options granted to employees is recognised at grant date as an employee expense, with a corresponding increase in equity, over the period that the employees become unconditionally entitled to the performance rights and share options. The amount recognised as an expense is adjusted to reflect the number of awards for which the related service and non-market performance conditions are expected to be met, such that the amount ultimately recognised as an expense is based on the number of awards that meet the related service and non-market performance conditions at the vesting date.
(m) ProvisionsA provision is recognised if, as a result of a past event, the Group has a present legal or constructive obligation that can be estimated reliably, and it is probable that an outflow of economic benefits will be required to settle the obligation. Provisions are determined by discounting the expected future cash flows at a pre-tax rate that reflects current market assessments of the time value of money and the risks specific to the liability. The unwinding of the discount is recognised as finance cost.
(n) Revenue Revenue is recognised and measured at the fair value of the consideration received or receivable to the extent it is probable that the economic benefits will flow to the Group and the revenue can be reliably measured. The following specific recognition criteria must also be met before revenue is recognised:
(i) Construction contractsContract revenue includes the initial amount agreed in the contract plus any variations in contract work, claims and incentive payments to the extent that it is probable that they will result in revenue and can be measured reliably. As soon as the outcome of a construction contract can be estimated reliably, contract revenue is recognised in profit or loss in proportion to the stage of completion of the contract. Contract expenses are recognised as incurred unless they create an asset related to future contract activity.
The stage of completion is assessed by reference to surveys of work performed. When the outcome of a construction contract cannot be estimated reliably, contract revenue is recognised only to the extent of contract costs incurred that are likely to be recoverable. An expected loss on a contract is recognised immediately in profit or loss.
(ii) ServicesRevenue from services rendered is recognised in profit or loss in proportion to the stage of completion of the transaction at the reporting date. The stage of completion is assessed by reference to surveys of work performed.
All revenue is stated net of the amount of goods and services tax (GST).
For
per
sona
l use
onl
y

60 2016 Annual Report
Notes to the Financial StatementsFor the year ending 30 June 2016
34. Significant accounting policies (continued)
(o) Lease paymentsPayments made under operating leases are recognised in profit or loss on a straight-line basis over the term of the lease. Lease incentives received are recognised as an integral part of the total expense, over the term of the lease.
Minimum lease payments made under finance leases are apportioned between the finance expense and the reduction of the outstanding liability. The finance expense is allocated to each period during the lease term so as to produce a constant periodic rate of interest on the remaining balance of the liability.
(p) Finance income and expensesFinance income comprises interest income on funds invested and dividend income. Interest income is recognised as it accrues in profit or loss, using the effective interest method. Dividend income is recognised in profit or loss on the date that the Group’s right to receive payment is established, which in the case of quoted securities is the ex-dividend date.
Finance expenses comprise interest expense on borrowings, bank charges and lease payments. Borrowing costs that are not directly attributable to the acquisition, construction or production of a qualifying asset are recognised in profit or loss using the effective interest rate method.
Foreign currency gains and losses are reported on a net basis.
(q) Income tax Income tax expense comprises current and deferred tax. Income tax expense is recognised in profit or loss except to the extent that it relates to items recognised directly in equity, in which case it is recognised in equity. Current tax is the expected tax payable on the taxable income for the year, using tax rates enacted or substantively enacted at the reporting date, and any adjustment to tax payable in respect of previous years.
Deferred tax is recognised using the balance sheet method, providing for temporary differences between the carrying amounts of assets and liabilities for financial reporting purposes and the amounts used for taxation purposes. Deferred tax is not recognised for the following temporary differences: the initial recognition of assets or liabilities in a transaction that is not a business combination and that affects neither accounting nor taxable profit, and differences relating to investments in subsidiaries and jointly controlled entities to the extent that it is probable that they will not reverse in the foreseeable future. In addition, deferred tax is not recognised for taxable temporary differences arising on the initial recognition of goodwill. Deferred tax is measured at the tax rates that are expected to be applied to the temporary differences when they reverse, based on the laws that have been enacted or substantively enacted by the reporting date. Deferred tax assets and liabilities are offset if there is a legally enforceable right to offset current tax liabilities and assets and they relate to income taxes levied by the same tax authority on the same taxable entity, or on different tax entities, but they intend to settle current tax liabilities and assets on a net basis or their tax assets and liabilities will be realised simultaneously.
A deferred tax asset is recognised to the extent that it is probable that future taxable profits will be available against which the temporary difference can be utilised. Deferred tax assets are reviewed at each reporting date and are reduced to the extent that it is no longer probable that the related tax benefit will be realised.
Additional income taxes that arise from the distribution of dividends are recognised at the same time as the liability to pay the related dividend is recognised.
(r) Goods and services taxRevenue, expenses and assets are recognised net of the amount of goods and services tax (GST), except where the amount of GST incurred is not recoverable from the taxation authority. In these circumstances, the GST is recognised as part of the cost of acquisition of the asset or as part of the expense.
Receivables and payables are stated with the amount of GST included. The net amount of GST recoverable from, or payable to, the ATO is included as a current asset or liability in the balance sheet.
Cash flows are included in the statement of cash flows on a gross basis. The GST components of cash flows arising from investing and financing activities which are recoverable from, or payable to, the ATO are classified as operating cash flows.
For
per
sona
l use
onl
y

61 2016 Annual Report
Notes to the Financial StatementsFor the year ending 30 June 2016
34. Significant accounting policies (continued)
(s) Earnings per shareThe Group presents basic and diluted earnings per share (EPS) data for its ordinary shares. Basic EPS is calculated by dividing the profit or loss attributable to ordinary shareholders of the Company by the weighted average number of ordinary shares outstanding during the period. Diluted EPS is determined by adjusting the profit or loss attributable to ordinary shareholders and the weighted average number of ordinary shares outstanding for the effects of all dilutive potential ordinary shares, which comprise performance rights and share options granted to employees.
(t) Segment reportingAn operating segment is a component of the Group that engages in business activities from which it may earn revenues and incur expenses, including revenues and expenses that relate to transactions with any of the Group’s components. All operating segments’ operating results are reviewed regularly by the Group’s Managing Director to make decisions about resources to be allocated to the segment and assess its performance, and for which discrete financial information is available.
Segment results that are reported to the Managing Director include items directly attributable to a segment as well as those that can be allocated on a reasonable basis.
Segment capital expenditure is the total cost incurred during the period to acquire property, plant and equipment, and intangible assets other than goodwill.
(u) Financial guaranteesFinancial guarantee contracts are initially measured at their fair values and subsequently measured at the higher of:
- the amount of obligation under the contract, as determined in accordance with AASB 137 Provisions, Contingent Liabilities and Contingent Assets; and
- the amount recognised initially less cumulative amortisation recognised in accordance with AASB 118 Revenue. The fair value of financial guarantee contracts has been assessed using a probability weighted discounted cash flow approach. The probability has been based on:
- the likelihood of the guaranteed party defaulting in a year period;
- the proportion of the exposure that is not expected to be recovered due to the guaranteed party defaulting; and
- the maximum loss exposed if the guaranteed party were to default.
(v) Business combinationsAcquisitions of businesses are accounted for using the acquisition method. The consideration transferred in a business combination is measured at fair value which is calculated as the sum of the acquisition-date fair values of assets transferred by the Group, liabilities incurred by the Group to the former owners of the acquiree and the equity instruments issued by the Group in exchange for control of the acquiree. Acquisition-related costs are recognised in profit or loss as incurred.
At the acquisition date, the identifiable assets acquired and the liabilities assumed are recognised at their fair value at the acquisition date, except that:
- deferred tax assets or liabilities and liabilities or assets related to employee benefit arrangements are recognised and measured in accordance with AASB 112 ‘Income Taxes’ and AASB 119 ‘Employee Benefits’ respectively;
- liabilities or equity instruments related to share-based payment arrangements of the acquiree or share-based payment arrangements of the Group entered into to replace share-based payment arrangements of the acquiree are measured in accordance with AASB 2 ‘Share-based Payment’ at the acquisition date; and
- assets (or disposal groups) that are classified as held for sale in accordance with AASB 5 ‘Non-current Assets Held for Sale and Discontinued Operations’ are measured in accordance with that Standard.
Goodwill is measured as the excess of the sum of the consideration transferred, the amount of any non-controlling interests in the acquiree, and the fair value of the acquirer’s previously held equity interest in the acquiree (if any) over the net of the acquisition-date amounts of the identifiable assets acquired and the liabilities assumed. If, after reassessment, the net of the acquisition-date amounts of the identifiable assets acquired and liabilities assumed exceeds the sum of the consideration transferred, the amount of any non-controlling interests in the acquiree and the fair value of the acquirer’s previously held interest in the acquiree (if any), the excess is recognised immediately in profit or loss as a bargain purchase gain.
For
per
sona
l use
onl
y

62 2016 Annual Report
Notes to the Financial StatementsFor the year ending 30 June 2016
34. Significant accounting policies (continued)
(w) Business combinations (continued)Non-controlling interests that are present ownership interests and entitle their holders to a proportionate share of the entity’s net assets in the event of liquidation may be initially measured either at fair value or at the non-controlling interests’ proportionate share of the recognised amounts of the acquiree’s identifiable net assets. The choice of measurement basis is made on a transaction-by-transaction basis. Other types of non-controlling interests are measured at fair value or, when applicable, on the basis specified in another Standard.
Where the consideration transferred by the Group in a business combination includes assets or liabilities resulting from a contingent consideration arrangement, the contingent consideration is measured at its acquisition-date fair value. Changes in the fair value of the contingent consideration that qualify as measurement period adjustments are adjusted retrospectively, with corresponding adjustments against goodwill. Measurement period adjustments are adjustments that arise from additional information obtained during the ‘measurement period’ (which cannot exceed one year from the acquisition date) about facts and circumstances that existed at the acquisition date.
The subsequent accounting for changes in the fair value of contingent consideration that do not qualify as measurement period adjustments depends on how the contingent consideration is classified. Contingent consideration that is classified as equity is not remeasured at subsequent reporting dates and its subsequent settlement is accounted for within equity. Contingent consideration that is classified as an asset or liability is remeasured at subsequent reporting dates in accordance with AASB 139 ‘Financial Instruments: Recognition and Measurement’, or AASB 137 ‘Provisions, Contingent Liabilities and Contingent Assets’, as appropriate, with the corresponding gain or loss being recognised in profit or loss.
Where a business combination is achieved in stages, the Group’s previously held equity interest in the acquiree is remeasured to fair value at the acquisition date (i.e. the date when the Group attains control) and the resulting gain or loss, if any, is recognised in profit or loss. Amounts arising from interests in the acquiree prior to the acquisition date that have previously been recognised in other comprehensive income are reclassified to profit or loss where such treatment would be appropriate if that interest were disposed of.
If the initial accounting for a business combination is incomplete by the end of the reporting period in which the combination occurs, the Group reports provisional amounts for the items for which the accounting is incomplete. Those provisional amounts are adjusted during the measurement period (see above), or additional assets or liabilities are recognised, to reflect new information obtained about facts and circumstances that existed as of the acquisition date that, if known, would have affected the amounts recognised as of that date.
(x) New standards and interpretations issued but not yet effectiveA number of new standards, amendments to standards and interpretations are effective for annual reporting periods beginning after 1 July 2016, and have not been applied in preparing these consolidated financial statements. There are a number which are expected to have a significant effect on the consolidated financial statements of the Group.
AASB 9 Financial Instruments will become mandatory for the Group’s 2018 consolidated financial statements and could change the classification and measurement of financial assets.
AASB 15 Revenue from Contracts with Customers will become mandatory for the Group’s 2018 consolidated financial statements and introduces a single revenue recognition model based on the transfer of good and services and the consideration expected to be received for that transfer.
AASB 16 Leases, will become mandatory for the Group’s 2019 consolidated financial statements and will require entities to recognise all leases except those that are short term (<12 Months).
The Group does not plan to adopt any of these standards early and the extent of the impact has not been determined.For
per
sona
l use
onl
y

63 2016 Annual Report
Notes to the Financial StatementsFor the year ending 30 June 2016
35. Determination of fair valuesA number of the Group’s accounting policies and disclosures require the determination of fair value, for both financial and non-financial assets and liabilities. Fair values have been determined for measurement and / or disclosure purposes based on the following methods. Where applicable, further information about the assumptions made in determining fair values is disclosed in the notes specific to that asset or liability.
(i) Property, plant and equipmentThe fair value of property, plant and equipment recognised as a result of a business combination is the estimated amount for which a property could be exchanged on the date of acquisition between a willing buyer and a willing seller in an arm’s length transaction after proper marketing wherein the parties had each acted knowledgeably, prudently and without compulsion. The fair value of items of plant, equipment, fixtures and fittings is based on the quoted market prices for similar items.
(ii) InventoriesThe fair value of inventories acquired in a business combination is determined based on its estimated selling price in the ordinary course of business less the estimated costs of completion and sale, and a reasonable profit margin based on the effort required to complete and sell the inventories.
(iii) Trade and other receivablesThe fair value of trade and other receivables acquired in a business combination, excluding construction work in progress, but including service concession receivables, is estimated as the present value of future cash flows, discounted at the market rate of interest at the reporting date.
(iv) Non-derivative financial liabilitiesFair value, which is determined for disclosure purposes, is calculated based on the present value of future principal and interest cash flows, discounted at the market rate of interest at the reporting date. For finance leases the market rate of interest is determined by reference to similar lease agreements.
(v) Share-based payment transactionsThe fair value of employee performance rights and share options is measured using an appropriate pricing model. Measurement inputs include share price on measurement date, exercise price of the instrument, expected volatility (based on weighted average historic volatility adjusted for changes expected due to publicly available information), weighted average expected life of the instruments (based on historical experience and general holder behaviour), expected dividends, and the risk-free interest rate (based on government bonds). Service and non-market performance conditions attached to the transactions are not taken into account in determining fair value.
For
per
sona
l use
onl
y

64 2016 Annual Report
Directors’ declaration
1. In the opinion of the directors of Southern Cross Electrical Engineering Limited (the “Company”):
a. The consolidated financial statements and notes, and the Remuneration Report in the Directors’ Report, are in accordance with the Corporations Act 2001, including:
i. giving a true and fair view of the Group’s financial position as at 30 June 2016 and of its performance for the financial year ended on that date; and
ii. complying with Australian Accounting Standards (including the Australian Accounting Interpretations) and the Corporations Regulations 2001;
b. the financial report also complies with International Financial Reporting Standards as disclosed in note 2(a),
c. there are reasonable grounds to believe that the Company will be able to pay its debts as and when they become due and payable.
2. The directors have been given the declarations required by Section 295A of the Corporations Act 2001 from the managing director and chief financial officer for the financial year ended 30 June 2016.
This declaration is made in accordance with a resolution of the Board of Directors.
Signed in accordance with a resolution of the directors:
Derek ParkinChairman23 August 2016
For
per
sona
l use
onl
y

65 2016 Annual Report
Independent audit report to the members of Southern Cross Electrical Engineering Limited
For
per
sona
l use
onl
y

66 2016 Annual Report
Independent audit report to the members of Southern Cross Electrical Engineering Limited
For
per
sona
l use
onl
y

67 2016 Annual Report
Lead auditor’s independence declaration under Section 307C of the Corporations Act 2001
For
per
sona
l use
onl
y

68 2016 Annual Report
ASX additional informationAdditional information required by the ASX Limited Listing Rules and not disclosed elsewhere in this report is set out below. The information is current at 16 August 2016.
Distribution of equity security holders
Number of equity security holders
Category Ordinary sharesOptions/
Performance rights1 - 1,000 172 -1,001 - 5,000 369 -5,001 - 10,000 222 -10,001 - 100,000 416 -100,001 and over 62 3
1,241 3 The number of shareholders holding less than a marketable parcel of ordinary shares is 134.
Twenty largest shareholders
NameNumber of
ordinary shares % of issued
capital
FRANK TOMASI NOMINEES PTY LTD <FRANK TOMASI FAMILY A/C> 61,664,027 38.68CITICORP NOMINEES PTY LIMITED 18,134,951 11.38RBC INVESTOR SERVICES AUSTRALIA PTY LIMITED <VFA A/C> 14,259,814 8.94ZERO NOMINEES PTY LTD 8,000,000 5.02UBS NOMINEES PTY LTD 7,600,000 4.77
J P MORGAN NOMINEES AUSTRALIA LIMITED 3,763,833 2.36
NATIONAL NOMINEES LIMITED 2,941,375 1.84
CITICORP NOMINEES PTY LIMITED <COLONIAL FIRST STATE INV A/C> 2,404,797 1.51
GHISA PTY LTD 2,063,104 1.29
CARMAN SUPER PTY LTD <M & B CARMAN SUPER FUND A/C> 2,000,000 1.25
OFFSHORE ELECTRICAL SERVICES PTY LTD 1,500,000 0.94
HSBC CUSTODY NOMINEES (AUSTRALIA) LIMITED 1,448,952 0.91
BNP PARIBAS NOMINEES PTY LTD <AGENCY LENDING DRP A/C> 1,318,612 0.83
MR ANDREW MCKENZIE + MRS CATHERINE MCKENZIE <A W MCKENZIE SUPER FUND A/C> 1,216,616 0.76
CHEMCO SUPERANNUATION FUND PTY LTD <CHEMCO SUPER FUND NO 2 A/C> 1,200,000 0.75
MR RAYMOND JOHN WISE 1,076,846 0.68
CHEMCO SUPERANNUATION FUND PTY LTD <CHEMCO SUPER FUND NO 2 A/C> 830,000 0.52
BOND STREET CUSTODIANS LIMITED <RSALTE - D44396 A/C> 800,000 0.50
BUCHHORN PTY LTD <S&K BUCHHORN FAMILY S/F A/C> 765,108 0.48
MR WAYNE JOHN HOGAN + MS ANGELA PATRICE HOGAN <HOGAN FAMILY A/C> 607,844 0.38
133,595,879 83.80
Substantial shareholdersThe number of shares held by substantial shareholders and their associates are set out below:
Shareholder Number % of issued capitalGianfranco Tomasi 65,227,131 40.9%Commonwealth Bank of Australia 17,088,922 10.7%Wilson Asset Management Group 12,748,327 8.0%
For
per
sona
l use
onl
y
For
per
sona
l use
onl
y

For
per
sona
l use
onl
y