for personal use only - asx · annual dividend payout of 7.7 cents per share (fully franked)...
TRANSCRIPT

ANNUAL REPORT 2017
For
per
sona
l use
onl
y

For
per
sona
l use
onl
y

ANNUAL REPORT 2017 CONTENTS
1 . PERFORMANCE HIGHLIGHTS . . . . . . . . . . . . . . . . . . . . . . . . . . . . . . . . . . . . . . . . . . . . . . . . . . 4
2 . CHAIRMAN’S REPORT . . . . . . . . . . . . . . . . . . . . . . . . . . . . . . . . . . . . . . . . . . . . . . . . . . . . . . . . . . . . 9
3 . CEO’S REPORT . . . . . . . . . . . . . . . . . . . . . . . . . . . . . . . . . . . . . . . . . . . . . . . . . . . . . . . . . . . . . . . . . . . 12
4 . EXECUTIVE TEAM. . . . . . . . . . . . . . . . . . . . . . . . . . . . . . . . . . . . . . . . . . . . . . . . . . . . . . . . . . . . . . . 15
5. DIRECTORS’ REPORT . . . . . . . . . . . . . . . . . . . . . . . . . . . . . . . . . . . . . . . . . . . . . . . . . . . . . . . . . . . 19
i . About Us . . . . . . . . . . . . . . . . . . . . . . . . . . . . . . . . . . . . . . . . . . . . . . . . . . . . . . . . . . . . . . . . . . . . 20
i i . Bus iness St ra tegy . . . . . . . . . . . . . . . . . . . . . . . . . . . . . . . . . . . . . . . . . . . . . . . . . . . . . . . 21
i i i . In format ion on D i rec tors . . . . . . . . . . . . . . . . . . . . . . . . . . . . . . . . . . . . . . . . . . . . . . 22
iv. Rev iew of Operat ions - Group Per formance . . . . . . . . . . . . . . . . . . . . 25
v. Rev iew of Operat ions - Segment Per formance . . . . . . . . . . . . . . . . 34
v i . Remunerat ion Repor t . . . . . . . . . . . . . . . . . . . . . . . . . . . . . . . . . . . . . . . . . . . . . . . . . . . 37
v i i . Other In format ion . . . . . . . . . . . . . . . . . . . . . . . . . . . . . . . . . . . . . . . . . . . . . . . . . . . . . . . 60
6. CORPORATE GOVERNANCE STATEMENT. . . . . . . . . . . . . . . . . . . . . . . . . . . . . . . . . . 62
7. SUSTAINABIL ITY REPORT . . . . . . . . . . . . . . . . . . . . . . . . . . . . . . . . . . . . . . . . . . . . . . . . . . . . . 64
8. AUDITOR’S INDEPENDENCE DECLARATION . . . . . . . . . . . . . . . . . . . . . . . . . . . . . 68
9. ANNUAL F INANCIAL STATEMENTS . . . . . . . . . . . . . . . . . . . . . . . . . . . . . . . . . . . . . . . . . 69
10. DIRECTORS’ DECLARATION . . . . . . . . . . . . . . . . . . . . . . . . . . . . . . . . . . . . . . . . . . . . . . . . . 125
11 . INDEPENDENT AUDITOR’S REPORT . . . . . . . . . . . . . . . . . . . . . . . . . . . . . . . . . . . . . . . 126
12 . SHAREHOLDER INFORMATION . . . . . . . . . . . . . . . . . . . . . . . . . . . . . . . . . . . . . . . . . . . . . 134
13 . CORPORATE DIRECTORY . . . . . . . . . . . . . . . . . . . . . . . . . . . . . . . . . . . . . . . . . . . . . . . . . . . . . 136
About this report The 2017 Annual Report is a full report on FlexiGroup’s operational and financial performance for the financial year ended 30 June 2017.
In this report unless otherwise stated references to ‘FlexiGroup’ the ‘Group’, ‘we’, ‘us’ and ‘our’ refer to FlexiGroup Limited, listed on the ASX as FXL.
FLEXIGROUP ANNUAL REPORT 2017 3
For
per
sona
l use
onl
y

PERFORMANCE H IGHL IGHTS
FLEXIGROUP ANNUAL REPORT 2017 4
RESULTS IN LINE WITH GUIDANCE WHILE REFOCUSING THE BUSINESS AND INVESTING FOR GROWTH.
Cards an Exciting Growth Engine
55%Growth in Australia Cards receivables to $483m while the first full year of NZ Cards delivered consistent profit growth, further projected in FY18
New Funding Line for Australia Cards, with capital contribution reduced by 33%
7.7cAnnual dividend payout of 7.7 cents per share (fully franked)
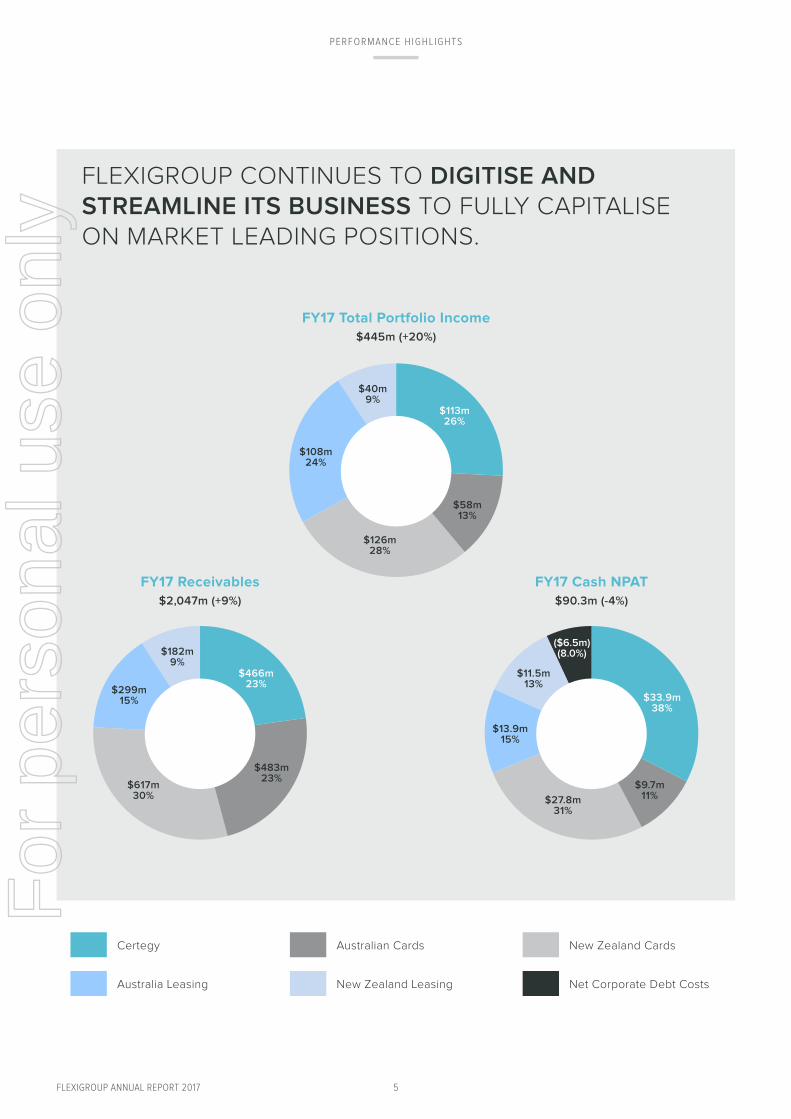
$2,047mClosing Receivables, growth of 9%
20%Growth in Portfolio Income to $445m
$90.3mCash NPAT - A solid result within guidance. Reported Statutory NPAT growth of 74% to $87.4m.
54%Volume growth to $1,949m Substantially driven by Cards businesses, including full year of NZ Cards acquisition
For
per
sona
l use
onl
y
FLEXIGROUP ANNUAL REPORT 2017
PERFORMANCE H IGHL IGHTS
5
FLEXIGROUP CONTINUES TO DIGITISE AND STREAMLINE ITS BUSINESS TO FULLY CAPITALISE ON MARKET LEADING POSITIONS.
FY17 Receivables$2,047m (+9%)
$466m 23%
$483m 23%
$617m 30%
$299m 15%
$182m 9%
FY17 Total Portfolio Income$445m (+20%)
$113m 26%
$58m 13%
$126m 28%
$108m 24%
$40m 9%
FY17 Cash NPAT$90.3m (-4%)
$33.9m 38%
($6.5m) (8.0%)
$9.7m 11%$27.8m
31%
$13.9m 15%
$11.5m 13%
Certegy Australian Cards New Zealand Cards
Australia Leasing
New Zealand Leasing Net Corporate Debt Costs
For
per
sona
l use
onl
y
6FLEXIGROUP ANNUAL REPORT 2017
PERFORMANCE H IGHL IGHTS
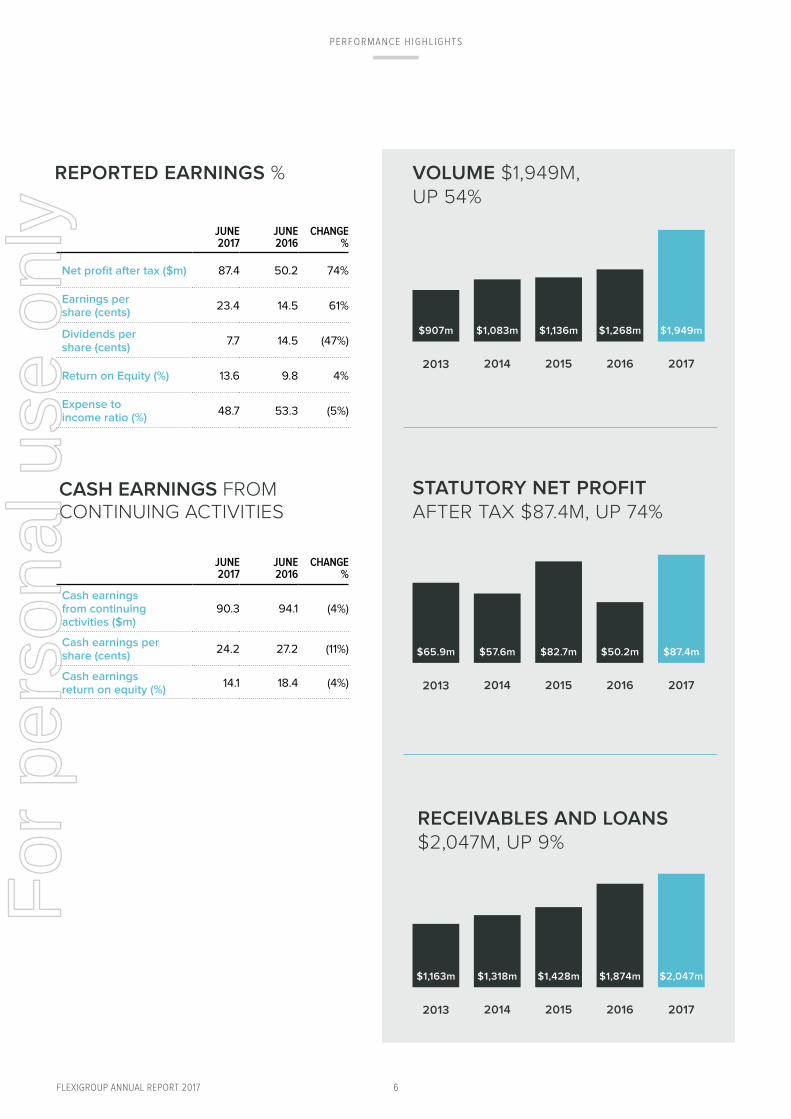
2013
$65.9m
2017
$87.4m
2016
$50.2m
2015
$82.7m
2014
$57.6m
2013
$907m
2017
$1,949m
2016
$1,268m
2015
$1,136m
2014
$1,083m
STATUTORY NET PROFIT AFTER TAX $87.4M, UP 74%
VOLUME $1,949M, UP 54%
2013
$1,163m
2017
$2,047m
2016
$1,874m
2015
$1,428m
2014
$1,318m
RECEIVABLES AND LOANS $2,047M, UP 9%
JUNE 2017
JUNE 2016
CHANGE %
Net profit after tax ($m) 87.4 50.2 74%
Earnings per share (cents)
23.4 14.5 61%
Dividends per share (cents)
7.7 14.5 (47%)
Return on Equity (%) 13.6 9.8 4%
Expense to income ratio (%)
48.7 53.3 (5%)
JUNE 2017
JUNE 2016
CHANGE %
Cash earnings from continuing activities ($m)
90.3 94.1 (4%)
Cash earnings per share (cents)
24.2 27.2 (11%)
Cash earnings return on equity (%)
14.1 18.4 (4%)
CASH EARNINGS FROM CONTINUING ACTIVITIES
REPORTED EARNINGS %
For
per
sona
l use
onl
y

7FLEXIGROUP ANNUAL REPORT 2017
PERFORMANCE H IGHL IGHTS
2013
24.0%
2017
14.1%
2016
18.4%
2015
22.7%
2014
22.7%
2013
$72.1m
2017
$90.3m
2016
$94.1m
2015
$90.1m
2014
$85.0m
2013
25.10
2017
24.20
2016
27.20
2015
28.70
2014
28.00
2013
14.50
2017
7.70
2016
14.50
2015
17.75
2014
16.50
CASH EARNINGS $90.3M, DOWN 4%
DIVIDENDS PER SHARE 7.70 CENTS, DOWN 47%
CASH EARNINGS PER SHARE 24.2 CENTS, DOWN 11%
CASH EARNINGS ROE 14.1%, DOWN 4%
For
per
sona
l use
onl
y
FLEXIGROUP ANNUAL REPORT 2017
CHAIRMAN’S & CEO’S REPORT
8FLEXIGROUP ANNUAL REPORT 2017
For
per
sona
l use
onl
y

FLEXIGROUP ANNUAL REPORT 2017
CHAIRMAN’S REPORT
CHAIRMAN’S REPORT
FlexiGroup’s aim is to provide customers and
suppliers with seamless payment solutions.
Our mantra of “fast, convenient, easy” describes
how we facilitate finance for countless assets
and services. Under Symon Brewis-Weston’s
leadership, the 2017 financial year has seen the
Group make progress towards achieving this.
2017 has been an important transitional year
for the Group as we undertook significant
restructuring and simplification of systems
and processes to improve the customer
experience. This period has also seen the
launch of new products and services that offer
a complementary and unrivalled product suite
across the AU/NZ Consumer finance sector.
9
For
per
sona
l use
onl
y

10FLEXIGROUP ANNUAL REPORT 2017
INVESTING FOR GROWTH
In his report Symon will detail the steps taken by his team, over the past 12 months, to refocus the business while continuing to invest for growth. Our Australian cards business has performed strongly across all key metrics including 55% growth in receivables to $483 million.
Our Cash NPAT from continuing operations of $90.3 million was slightly down on last year as a result of the rapid growth in our interest free cards business, investments in new product development, shift in Australia leasing portfolio mix and higher interest expense on corporate debt due to higher average debt. The Australia cards receivables growth is expected to translate into higher profits in FY19 as these interest free balances convert into interest bearing.
With continued growth forecast in card origination and usage across all major retailers, particularly Flight Centre, we are well positioned to achieve $1 billion receivables and $35 million Cash NPAT by FY20 for the Australian cards business.
Our 2017 Statutory NPAT from continuing operations was $87.4 million, an increase of 74% year on year. We declared a fully franked final dividend of 3.85c per share, which together with the interim dividend brings our total dividend for FY17 to 7.7c per share. While this is a reduction relative to previous years, it has enabled us to reinvest back into our growing cards business while also strengthening our balance sheet and reducing the Group’s leverage.
The year included the first full year of performance from our New Zealand cards business. With a large seller network of over 13,000 merchants, New Zealand cards delivered solid profits which were in line with expectations. Through the year we invested in management, sales and marketing teams which re-invigorated growth. We also introduced a proprietary, modern and mobile-friendly cards technology platform which provides FlexiGroup with a unique opportunity to expand our market in New Zealand.
Following a thorough evaluation of our Commercial Leasing business during the year, we identified areas for improvement and a number of new opportunities. While good progress has been made so far we expect this repositioning to continue into FY18.
A significant opportunity for the Commercial Leasing business is the Managed Services product offering across both Australia and New Zealand. We believe that this offering represents a market leading opportunity for FlexiGroup in both countries. During FY17 we signed a partnership agreement with Lenovo, the global IT equipment and service solutions provider.
Certegy performed in line with expectations and, with 14,000+ retail relationships, its underlying business remains strong. However, further investment is required to maintain its market leadership – this includes entering new market segments and launching new products. Importantly, we believe that digitising the process – and therefore simplifying and consolidating the front and back end of the platform – will increase retailer take up as well as enhancing overall customer experience.
In February 2017, we announced the partnership with Australia’s second largest dental group. The rollout of this solution occurred in the second half of FY17 and was well received by our vendor partners. As a result of this successful rollout we have had a number of discussions with other large scale dental practices aspiring to offer similar products.
The much awaited Australian launch of our micro payment offering, Oxipay, occurred in July, followed by the New Zealand launch in August. Initially launched as an online offering, this sub-$1,000 payment solution is currently being offered in store in Australia and New Zealand with 549 retailers already signed up. Oxipay further deepens our relationship with retailers by offering a full suite of payment solutions. In addition to which we can use Oxipay as a low cost customer acquisition tool to leverage products from Certegy and our cards business. Oxipay now means that FlexiGroup is able to offer an unrivalled product offering from $1 to $30,000.
CHAIRMAN’S REPORT
For
per
sona
l use
onl
y

FLEXIGROUP ANNUAL REPORT 2017 11
CHAIRMAN’S REPORT
In Ireland we successfully launched our Flexi-Fi point of sale installment product in June 2017. This new proprietary IT platform and product offering was developed in-house by FlexiGroup in less than six months. In the first 8 weeks Flexi-Fi had already signed strategic relationships with 15 national retailers across 60 stores – a significant pipeline of new opportunities. This is a clear demonstration of FlexiGroup’s evolution into a tech smart, nimble business.
Corporate Governance & Risk
During 2017 steps were taken to enhance the Group’s corporate governance framework including the restructure of our internal Audit and Risk Compliance Committee and Group Asset & Liabilities Committee.
In addition, in December 2016, we welcomed two new highly-qualified independent Directors – Christine Christian who was CEO and latterly Chairman of Dun & Bradstreet Australia and New Zealand, and Jodie Leonard who held senior commercial and marketing positions in listed companies as well as a strong portfolio of directorships.
Since their appointment, Christine and Jodie’s combined skills and experience in financial services, risk management and digital marketing have proven to be invaluable. I am grateful to them for their insight and commitment to FlexiGroup thus far.
Over the past 18 months we have constructively engaged with our primary regulators, with regard to legislative and regulatory change. As a Board, we regard proactive management of legislative and regulative changes as one of our key competitive strengths.
Outlook
The FlexiGroup team and I are excited about the promising strong growth opportunities across our entire portfolio. We continue to digitise and streamline our business to fully capitalise on our market leading position.
While our primary focus is on the delivery of profitable organic growth from our existing portfolio, the Board of Directors and Executive management team will continue to consider value accretive opportunities if we believe they are the right fit for FlexiGroup and its shareholders.
The outlook for financial year 2018 (FY18) estimates Cash NPAT between $85-90 million.
Andrew Abercrombie
Chairman
For
per
sona
l use
onl
y

12FLEXIGROUP ANNUAL REPORT 2017
CEO’S REPORT
CEO’S REPORT
2017 was a transformational year for our Group as we continued to digitise and streamline to fully capitalise on our market leading positions in point of sale consumer and commercial finance.
2017 saw us make changes to our core platforms and processes, focusing on underperforming units and investing for growth.
Why was this needed? We believe that successful businesses must continually change. One of our biggest challenges is to anticipate and facilitate that change while at the same time retaining our core values. For us, the customer is central to everything we do, without them we wouldn’t exist. We strive to disrupt the model of traditional lending through the delivery of innovative and tailored financial solutions which meet our customers’ needs around the world, giving them choices they would not otherwise have.
With a new Executive management team embedded, I believe we have the right team in the right positions to drive the business forward and to deliver growth for you, our shareholders.
For
per
sona
l use
onl
y

13FLEXIGROUP ANNUAL REPORT 2017
CEO’S REPORT
Group Performance
At the end of the year we reported solid financial results of $90.3 million Cash NPAT. These results were in line with our guidance. We were pleased with the result, in particular given the investments we made during the year to refocus the business on growth.
In February, we announced the rebasing of our Dividend Policy. We chose to do this to support the growth in our cards business in Australia. We have also announced a more efficient funding structure for this business. This will materially reduce our cash requirements in the future.
In addition to our cards business, there is also strong growth in our Commercial Leasing businesses which have tremendous new opportunities in managed services and subscription models as they capture the emerging trend to “everything as a service”.
I would like to highlight some of the progress we have made during the year in some key areas.
High Growth Cards Business
The exceptional growth in our Cards businesses resulted in our Group volume growing 54% to $1,949 million and our closing receivables growing 9% to $2,047 million.
In New Zealand, investments were made early in the year, in the management, sales and marketing teams which have started to reinvigorate growth.
Our Australian Cards portfolio is growing strongly. While we saw receivables growth across all major retailers, during FY17 we launched our Flight Centre partnership and have seen a particularly strong take up. We continue to work closely with Flight Centre, and other partners, to grow card user numbers.
A key indicator which is very positive for us is that customers are increasingly using their cards for everyday spend, with the average card spend in Australia up 14% year on year. 4,000 customers now use our cards to make purchases everyday. There is a similarly positive story in New Zealand where the average card spend is up 9% year on year.
To capitalise on this strong growth, during FY18, we expect to launch a new Australian card. We have already signed an agreement with MasterCard as our new scheme partner for this global card and we look forward to announcing more details in due course.
New Products
In July 2017 we launched Oxipay in Australia, followed soon after with the launch of Oxipay in New Zealand in August 2017. Oxipay has been developed in-house as an online micro-payment (<$1,000) solution. It is targeted towards the increasing trend of millennials to buy now and pay later. It is a strong customer acquisition tool and has deepened our retailer relationships as FlexiGroup now offers a full suite of payment solutions, delivering increased uptake of the Oxipay offering.
We will continue investing in Oxipay building scale and profitability and leveraging the cross sell opportunity for Certegy and our cards businesses.
Another new offering which we are very proud of is our digital finance offering, Flexi-Fi, which was launched in Ireland in June. This is a business, born digital, and designed and developed in-house within 6 months. Within the first 8 weeks of launch we had 15 retailers across 60 stores signed up to offer the product to customers.
An exciting aspect of Flexi-Fi’s dynamic offering is its seamless digital solution. Following feedback from retailers and customers we understand that digitisation drives retailer take-up and now significantly improves customer experience.
For
per
sona
l use
onl
y

14FLEXIGROUP ANNUAL REPORT 2017
CEO’S REPORT
Realising Further Value in Certegy
Certegy was a major focus during the year and as a result of what has been achieved we are increasingly confident in the outlook for this business. We have identified the need for further investment in Certegy, as we move towards a digitised front end.
During the year we have identified and commenced work on the following:
• Increasing our penetration in high value, high margin retail categories;
• Deepening our penetration in professional services, including dental and home improvement;
• Digitising our VIP program, underpinned by vastly improved data analytics; and
• Using data to make more informed customer and sales decisions.
We will be leveraging the rich data we collect to supply valuable insights to retailers. While we have a substantial customer base totalling approx. 1.6 million customers, we will be looking to increase this through cross sell opportunities from our Cards businesses, as well as Oxipay.
I am confident there remains huge potential for Certegy and the investment we make during FY18 will return the Certegy business to growth in FY19.
Everything as a service
We continue to significantly invest in our Commercial Leasing businesses in Australia and New Zealand where market trends are creating opportunities. These include the current disruptive trend away from incumbent banks towards more SME Direct business lending.
We are growing our offering in branded finance programs in Australia and New Zealand where Flexi Commercial has a proven track record.
In addition to this our move towards offering a managed services product has generated substantial interest in the market. This move follows the recent trend within the market towards everything as a service, “XaaS”. Our excellent work in this area has enabled us to capitalise as first movers in the market, and we have signed several relationships with global IT equipment and service solution venders.
A Positive Outlook
FlexiGroup has growth opportunities across its entire portfolio. Significant growth will continue in the Group’s cards businesses. The commercial businesses have tremendous opportunities in managed services and subscription models as it captures the emerging trend to “XaaS”. Investment in Certegy during FY18 will return the business to growth in FY19. In addition, investments in OxiPay and Flexi-Fi demonstrate that FlexiGroup can be as tech smart and contemporary. While providing market leading originating services at Point of Sale, FlexiGroup’s sizeable distribution, funding capability and proven portfolio and asset management skills ensure that the business is set for long term sustainable growth.
The Group has a strong investment plan in FY18 with a small increase in capex to $28-31 million to deliver regulatory, strategic and growth initiatives.
Final Word
I would personally like to thank all of our team members at FlexiGroup, whose considerable and continuing efforts and whose focus on innovation and customer service excellence have created a bright future for FlexiGroup.
Symon Brewis-Weston
Group CEO
For
per
sona
l use
onl
y

15FLEXIGROUP ANNUAL REPORT 2017
EXECUTIVE TEAM
15FLEXIGROUP ANNUAL REPORT 2017
For
per
sona
l use
onl
y

16FLEXIGROUP ANNUAL REPORT 2017
Symon Brewis-Weston has extensive international financial services experience and a deep understanding of consumer and business markets in Asia-Pacific. Prior to joining FlexiGroup in 2016, Symon was Chief Executive Officer of Sovereign, New Zealand’s largest life insurance provider. Symon has also held several senior leadership positions with Commonwealth Bank of Australia over 15 years, including Executive General Manager of Corporate Financial Services, Executive General Manager for Local
SYMON BREWIS-WESTON
Chief Executive Officer
Business Banking, six years leading CBA’s Indonesian operations, and in China where he worked on developing the Group’s Chinese banking strategy.
Symon received the United Nations Women’s Empowerment Principles CEO Leadership Award in 2015 for his commitment to workplace diversity and community engagement.
Prior to joining FlexiGroup in January 2017, Ross was Group Treasurer at Latitude Financial Services where he was responsible for creating a treasury function, including ground breaking funding programmes, interest rate and FX risk management and governance forums reporting to the Board of Directors.
Ross has over 20 years of international financial services experience. He has held senior finance management roles in large and complex global financial institutions covering finance, treasury, M&A and capital markets with Royal Bank of Scotland Group plc, Westpac Banking Corporation and Barclays PLC in both London and Sydney.
ROSS AUCUTT
Chief Financial Officer
EXECUTIVE TEAM
Verity joined FlexiGroup in 2016 to lead the sales organisation for Leasing and Cards across Consumer businesses in Australia.
Prior to joining Flexigroup Verity was General Manager of the Banking Specialists at the Commonwealth Bank of Australia, leading over 140 specialists across Asset Finance, Trade Finance, Receivables Finance and Transaction Banking nationally.
VERITY GILPIN
General Manager Consumer Sales
She has over 16 years of senior management experience in business development, corporate restructure, accounting and finance with GE Commercial Finance, Ernst & Young and Deutsche Bank both in Australia and the U.K.
For
per
sona
l use
onl
y

17FLEXIGROUP ANNUAL REPORT 2017
EXECUTIVE TEAM
Ken has over 17 years’ experience in financial services. Prior to joining FlexiGroup Ken was a director and shareholder of Interlease, one of Australia’s largest and oldest independent financer brokers, specialising in originating and arranging structured plant and equipment finance for private and public companies. Ken has arranged and structured finance for a range of small to large companies for a wide range of manufacturing equipment.
Jane has 15 years’ experience in Human Resources. Prior to moving to FlexiGroup in early 2013, Jane worked in Telstra where she partnered with Senior Leaders across a broad range of functions including Customer Service, Professional and Managed Services, Sales and HR Operations.
KEN RICHARDS
General Manager - Commercial
JANE MISKELL
Group Head of HR
Ken was a director of Standard Finance Limited, a boutique finance company and has served on the board of Metro Quarry Group. Ken also held positions with Foster’s Group over 10 years, with roles in Treasury, M&A and Logistics.
Jane has extensive experience in change management and organisational design, business integrations, talent management and employee engagement strategies.
Chris joined the FlexiGroup team in April 2017 as CEO of FlexiGroup NZ. He brings a strong marketing, sales and innovation background to FlexiGroup. Previous roles include more than three years as Sovereign’s chief marketing officer, where Chris undertook a number of significant developments, including establishing an online sales channel, customer engagement programmes, and data analytics functions.
CHRIS LAMERS
Chief Executive Officer, NZ
He was previously with Loyalty New Zealand (Fly Buys), first as head of marketing, then as head of customer engagement (incorporating marketing and sales) and lastly as interim CEO.
In that time, he re-launched the Fly Buys brand, developed and launched a partnership with Air NZ Airpoints, and led the implementation of marketing strategies that grew both membership numbers and revenue while reducing marketing costs.
For
per
sona
l use
onl
y

18FLEXIGROUP ANNUAL REPORT 2017
Matt joined FlexiGroup in September 2013, bringing more than 15 years’ private practice and in-house legal experience in banking and finance with a focus on small- and large-ticket asset finance transactions. Prior to joining FlexiGroup, Matt held roles in private-practice environments with leading domestic and international law firms.
MATT BEAMAN
Group General Counsel
Matt was the Chief Legal Counsel for CIT Group Asia-Pacific from 2005–2009. From October 2009, Matt was Deputy General Counsel of Lloyds Banking Group Australia (Lloyds International) and was elevated to the position of General Counsel in March 2012.
Karl has over 25 years’ global experience in the Chartered Accountancy, Consulting and Financial Services industries. Prior to joining Flexigroup, Karl held senior management risk roles in the Commonwealth Bank of Australia and Westpac Banking Corporation where he was a regular presenter to the Financial Services Regulators, the Australian Bankers Association and the boards of the banks on the challenges facing consumers, small and medium
KARL TURNER
Group Chief Risk Officer
sized businesses and how financial services providers can assist meet these customers’ needs.
Karl has extensive experience in risk management (credit, conduct, operational, compliance and market), governance, leadership, strategic thinking, new business development and end to end product development.
EXECUTIVE TEAM
Peter is responsible for developing and executing the Company’s Business Strategy. Leading the execution of M&A integrations and digital technology implementation, his work is integral to increasing our online digital capabilities, bringing on new products & services, transforming our operational processes, and enhancing the scalability of our core business platforms.
PETER LIRANTZIS
Chief Operating Officer
Peter has extensive experience in banking, insurance, finance, telecommunications, marketing and government industries. He has held senior management positions in Westpac Banking Corporation, Insurance Australia Group and Tourism Australia.
For
per
sona
l use
onl
y

DIRECTORS’ REPORT
19FLEXIGROUP ANNUAL REPORT 2017
For
per
sona
l use
onl
y

20FLEXIGROUP ANNUAL REPORT 2017
DIRECTORS’ REPORT
Your Directors present their report on the consolidated entity (referred to hereafter as the “Group” or “FlexiGroup”) consisting of FlexiGroup Limited (“the Company”) and the entities it controlled at the end of, or during, the year ended 30 June 2017.
Principal activities The principal activities during the year continued to be the provision of:
• Consumer revolving finance and cards
• Lease and rental financing services; and
• No interest ever loans.
Key developments (incorporating significant changes in the state of affairs)During the year, there were no key developments that affected the principal activities of the Group.
ABOUT US FlexiGroup is a diversified financial services group providing a range of innovative finance products and seamless payment solutions for home, personal and commercial use.
Through a network of over 40,000 merchant, retail and online partners within Australia, New Zealand and Ireland FlexiGroup is the market leader in Point of Sale consumer and commercial finance.
CARDS
LEASING
CERTEGY
• Retail point of sale Interest Free Cards• Visa card used for everyday
retail purchases• Key segments; major furniture retailers,
travel and home improvement
• Leasing point of sale, SME and Vendor program
• Key segments: technology retailers, OEM vendors
• Retail point of sale Interest Free Cards• Mastercard subsequently used for
everyday retail purchases• Key segments; major retailers,
jewelery, technology, furniture and travel
• Leasing point of sale, SME and Education
• Key segments: education and government sectors, technology vendors
• Retail and homeowner “No Interest Ever” payment plan
• Key segments include domestic solar, home improvement and high margin retail
• 1.5 million customers have used our product
Certegy has 14,000+ retail relationships Oxipay launched in Australia in July 2017 and NZ in August 2017 and already has 550 retailers signed up
Australia
Our 5 key business units Key facts at end of June 2017
Australia
New Zealand
New Zealand
$483 million in
receivables
$617 million in
receivables
$299 million in
receivables
$182 million in
receivables
$466 million in
receivables
Ongoing growth in cards customer numbers and usage
NZ’s largest seller network of over 13,000 merchants
For
per
sona
l use
onl
y

21FLEXIGROUP ANNUAL REPORT 2017
PRIORITY KEY INITIATIVES DUE DATE
BUSINESS STRATEGYSix key strategic priorities identified for driving Cash NPAT
• Simplify and consolidate front and back end platforms
• Move to two core consumer operating platforms across AU & NZ
• Invest in CRM and data analytics technology• End to end digitisation of Certegy and
consumer leasing
• Centralise marketing to leverage investment & capability
• Create one Australian consumer sales team, leveraging deep retailer relationships
• Target growth of existing book• Centralise data management
• New AU Mastercard launch• Certegy – Entering professional services,
home services, dental and many segments • Commercial – Managed services and
subscription models
• Oxipay is a low cost customer acquisition engine
• Build CRM capability and expertise• Drive product cross sell to generate incremental
income
• Digitise front and back end• Leverage trans Tasman relationships• Rollout Managed Services offering
• Appoint new board director• Drive project governance• Ensure ordered roll out of all new initiatives
DIGITISE Q3-Q4’18
Q2’18 Q2’18 ONGOING Q3’18
Q3’18 ONGOING ONGOING
Q3’18 ONGOING ONGOING
Q2’18 ONGOING ONGOING
Q4’18
CONSOLIDATION OF CONSUMER BUSINESS
ENTER NEW SEGMENTS & LAUNCH NEW PRODUCTS
BUILD CROSS SELL CAPABILITY
REFOCUS COMMERCIAL AND LEASING
EMBED STRONGER GOVERNANCE
DIRECTORS’ REPORT
For
per
sona
l use
onl
y

22FLEXIGROUP ANNUAL REPORT 2017
Andrew became a Director and Chief Executive Officer of the original Flexirent business in 1991. He was appointed a Director of the listed Company at the time of the IPO in November 2006. Andrew is an experienced commercial and tax lawyer and was a founding partner in a legal firm operating in Sydney and Melbourne. Following several years in property investment and tax consulting, he co-founded the Flexirent business in 1991 and was CEO until 2003. Andrew remained on the Board as a director and was subsequently appointed as Chairman on 10 August 2015.
Special responsibilities: Chairman of the Nomination Committee and member of the Remuneration Committee
Interests in shares and options: 90,766,593 ordinary shares in FlexiGroup
Symon commenced as CEO of FlexiGroup in February 2016. Prior to joining FlexiGroup, Symon worked in banking for 20 years, 15 years of which were in senior leadership positions at the Commonwealth Bank of Australia (CBA). Symon was Chief Executive Officer of Sovereign, a subsidiary of CBA for 3 years. Prior to that, he was Executive General Manager of Corporate Financial Services at CBA. Symon is a member of the board of The Hunger Project and was awarded the United Nations Women’s Empowerment Principles CEO Leadership Award in 2015 for his commitment to workplace diversity and community engagement.
Special responsibilities: Chief Executive Officer, Managing Director and Member of the Risk & Compliance Committee
Interests in shares and options: 50,852 ordinary shares in FlexiGroup
Christine was appointed as a Director of the Company in December 2016. Christine is a leading Australian business executive with more than 30 years’ experience in financial services, investment, private equity, credit risk and digital media including executive and advisory roles in Australia, China, India and the United States. Christine currently is Chair of Kirwood Capital and holds board roles with Members Equity Bank Limited, Powerlinx Inc.(NY), Lonsec Fiscal Holdings Pty Ltd and the Victorian Managed Insurance Authority. Christine is Deputy President of the State Library of Victoria and a board member of the Cranlana Programme and Council member of La Trobe University.
Special responsibilities: Chair of the Risk & Compliance Committee
Interests in shares and options: None
ANDREW ABERCROMBIE(AGE 61 )
Founding Director, Chairman, Non-Independent, Non-Executive
BEc, LLB, MBA
SYMON BREWIS-WESTON(AGE 48 )
Non-Independent, Executive, Chief Executive Officer
B.Ec. (Hons), M.Ap.Fin. AICD
CHRISTINE CHRISTIAN (AGE 59 )
Independent, Non-Executive BA, AICD
DIRECTORS’ REPORT
INFORMATION ON DIRECTORS
For
per
sona
l use
onl
y

23FLEXIGROUP ANNUAL REPORT 2017
Raj was appointed as a Director in the Company in November 2006. Raj is currently a partner of Equity Partners. Rajeev has over 20 years’ venture capital and private equity experience and has been a Director of a number of listed and unlisted portfolio companies. During his career in venture capital and private equity, Rajeev has invested in over 25 companies across a diverse range of industries including financial services; consumer goods; industrial businesses; manufacturing and technology centric businesses.
Special responsibilities: Chair of the Remuneration Committee, Member of the Audit, Risk & Compliance and Nomination Committees.
Interests in shares and options: 275,371 ordinary shares in FlexiGroup
Jodie was appointed as a Director of the Company in December 2016. She is a professional Non-Executive Director and currently sits on the board of the Royal Automobile Club of Victoria (RACV) Limited and Beyond Bank Australia and Chairs the Beyond Bank Australia Foundation. Jodie has over 25 years’ experience in strategic marketing and corporate strategy in ASX, NYSE and FTSE listed companies both locally and internationally. Her experience spans the finance, media, sport/entertainment, travel, telecommunications, consumer goods and professional services industries. She has worked in blue chip organisations including General Electric, the Nine Network, British Airways, Telstra, Colgate Palmolive and Unilever.
Special responsibilities: Member of the Audit and Remuneration Committee
Interests in shares and options: 3,560 ordinary shares in FlexiGroup
John was appointed a Director of the Company in November 2006. John was the Finance Director and Chief Financial Officer of a major retailer for 12 years. John has over 40 years’ experience as a chartered accountant and has extensive experience in mergers and acquisitions, strategy, international expansion, property and taxation.
Other current directorships: Slater & Gordon Limited
Former directorships in last three years: Super Retail Group Limited
Special responsibilities: Chair of the Audit Committee, Member of the Nomination and Remuneration Committee
Interests in shares and options: 147,470 ordinary shares in FlexiGroup
RAJEEV DHAWAN (AGE 51 )
Independent, Non-Executive BCom, ACA, MBA
JODIE LEONARD (AGE 50 )
Independent, Non-Executive B.Bus, AICD, FAMI, CPM
R JOHN SKIPPEN(AGE 69 )
Independent, Non-Executive ACA, AICD
DIRECTORS’ REPORT
INFORMATION ON DIRECTORS
For
per
sona
l use
onl
y

24FLEXIGROUP ANNUAL REPORT 2017
INFORMATION ON DIRECTORS
Company secretariesMatt Beaman LLB (Hons), B.Comm, was appointed as Company Secretary on 22 February 2016 and he resigned from this position effective 22 November 2016. Matt continues in the role of Group General Counsel of FlexiGroup which he has held since joining the company in September 2013. Matt brings 20 years’ private practice and in-house legal experience in banking and finance with a focus on small and large-ticket asset finance transactions. Prior to joining FlexiGroup, Matt held roles in private-practice environments with leading domestic and international law firms. Matt was the Chief Legal Counsel for CIT Group Asia-Pacific from 2005–2009. From October 2009, Matt was Deputy General Counsel of Lloyds Banking Group Australia (Lloyds International)
and was elevated to the position of General Counsel in March 2012.
Melissa Robinson LLB, B.Sc, ICSA was appointed as Company Secretary on 22 November 2016 after joining FlexiGroup in October 2016 as Senior Legal Counsel and Group Company Secretary. Melissa brings more than 15 years’ in house and private practice legal, corporate governance and company secretarial experience primarily in financial services and funds management. Prior to joining FlexiGroup, Melissa held company secretarial and legal roles with ASX listed entities Macquarie Group Limited and Challenger Limited and with a leading domestic law firm.
MEETINGS OF DIRECTORS
FlexiGroup
Board meetings
Audit & Risk Committee***
Audit Committee
Risk & Compliance Committee
Nomination Committee*
Remuneration Committee**
A B A B A B A B A B A B
A Abercrombie 13 13 + + + + + + 1 1 5 4
S Brewis-Weston 13 13 + + + + 3 2 + + + +
R Dhawan 13 13 2 2 1 1 3 3 1 1 5 5
R J Skippen 13 13 2 2 1 1 + + 1 1 5 4
J Leonard 8 8 + + 1 1 + + + + + +
C Christian 8 7 + + + + 3 3 + + + +
A Number of meetings held during the time the Director held office or was a member of the committee during the year.
B Number of meetings attended.
+ Not a member of the relevant committee.
* A number of additional informal meetings have been held with external recruitment firms and prospective candidates for Director during the year.
** A number of additional informal meetings have been held with external remuneration advisory firms, management and human resources during the year.
*** During the Reporting Period the Board resolved to institute a separate Audit Committee and Risk & Compliance Committee commencing from November 2016. During the Reporting Period the composition of the Audit Committee was as follows: Chair: John Skippen; Member: Rajeev Dhawan and Jodie Leonard (from 1 December 2016). Andrew Abercrombie, Symon Brewis-Weston and Christine Christian (from 1 December 2016) also attend meetings of the Audit Committee.
DIRECTORS’ REPORT
For
per
sona
l use
onl
y
25FLEXIGROUP ANNUAL REPORT 2017
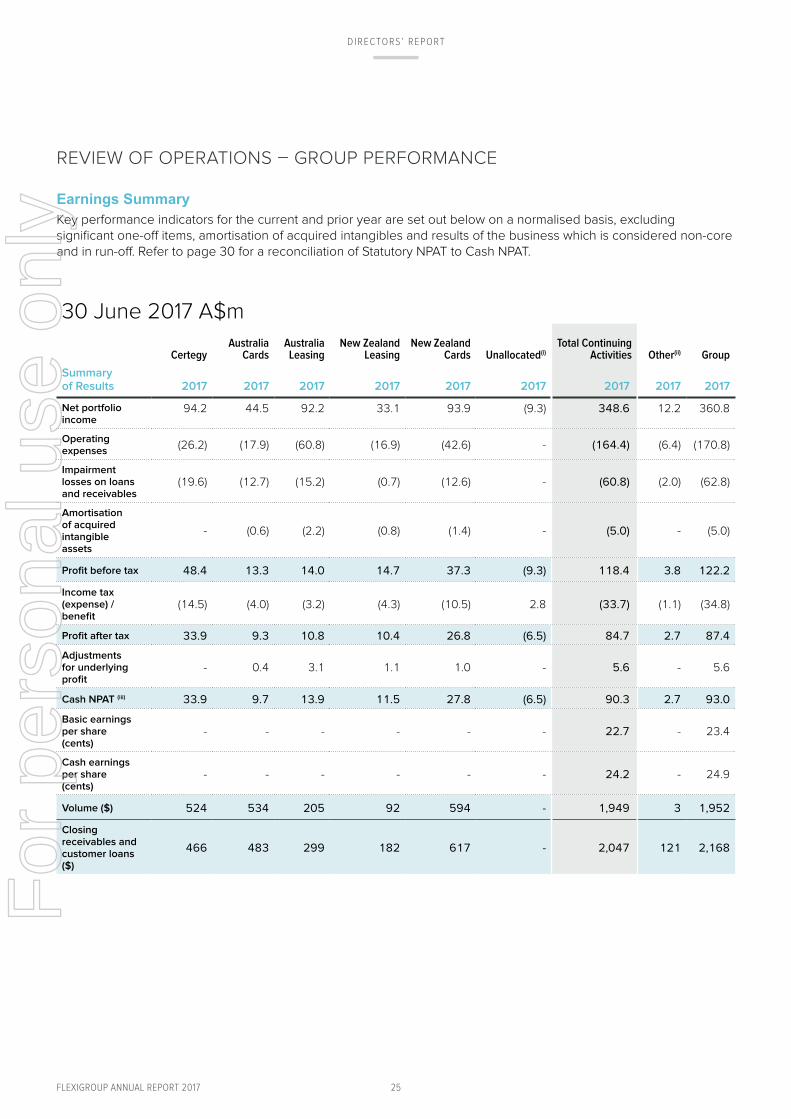
REVIEW OF OPERATIONS – GROUP PERFORMANCE
Earnings SummaryKey performance indicators for the current and prior year are set out below on a normalised basis, excluding significant one-off items, amortisation of acquired intangibles and results of the business which is considered non-core and in run-off. Refer to page 30 for a reconciliation of Statutory NPAT to Cash NPAT.
30 June 2017 A$m
CertegyAustralia
CardsAustralia Leasing
New Zealand Leasing
New Zealand Cards Unallocated(i)
Total Continuing Activities Other(ii) Group
Summary of Results 2017 2017 2017 2017 2017 2017 2017 2017 2017
Net portfolio income
94.2 44.5 92.2 33.1 93.9 (9.3) 348.6 12.2 360.8
Operating expenses
(26.2) (17.9) (60.8) (16.9) (42.6) - (164.4) (6.4) (170.8)
Impairment losses on loans and receivables
(19.6) (12.7) (15.2) (0.7) (12.6) - (60.8) (2.0) (62.8)
Amortisation of acquired intangible assets
- (0.6) (2.2) (0.8) (1.4) - (5.0) - (5.0)
Profit before tax 48.4 13.3 14.0 14.7 37.3 (9.3) 118.4 3.8 122.2
Income tax (expense) / benefit
(14.5) (4.0) (3.2) (4.3) (10.5) 2.8 (33.7) (1.1) (34.8)
Profit after tax 33.9 9.3 10.8 10.4 26.8 (6.5) 84.7 2.7 87.4
Adjustments for underlying profit
- 0.4 3.1 1.1 1.0 - 5.6 - 5.6
Cash NPAT (iii) 33.9 9.7 13.9 11.5 27.8 (6.5) 90.3 2.7 93.0
Basic earnings per share (cents)
- - - - - - 22.7 - 23.4
Cash earnings per share (cents)
- - - - - - 24.2 - 24.9
Volume ($) 524 534 205 92 594 - 1,949 3 1,952
Closing receivables and customer loans ($)
466 483 299 182 617 - 2,047 121 2,168
DIRECTORS’ REPORT
For
per
sona
l use
onl
y

26FLEXIGROUP ANNUAL REPORT 2017
30 June 2016 A$m
CertegyAustralia
CardsAustralia Leasing
New Zealand Leasing
New Zealand Cards Unallocated(i)
Total Continuing Activities Other(ii) Group
Summary of Results 2016 2016 2016 2016 2016 2016 2016 2016 2016
Net portfolio income
97.3 39.4 106.2 31.0 29.5 (4.0) 299.4 18.0 317.4
Operating expenses
(27.1) (10.9) (81.5) (14.6) (13.1) - (147.2) (10.3) (157.5)
Impairment losses on loans and receivables
(19.9) (8.5) (17.6) (1.2) (4.0) - (51.2) (27.4) (78.6)
Amortisation of acquired intangible assets
- (0.7) (8.1) (0.9) (1.9) - (11.6) - (11.6)
Profit before tax 50.3 19.3 (1.0) 14.3 10.5 (4.0) 89.4 (19.7) 69.7
Income tax (expense) / benefit
(15.1) (5.9) 0.8 (3.5) (2.9) 1.2 (25.4) 5.9 (19.5)
Profit after tax 35.2 13.4 (0.2) 10.8 7.6 (2.8) 64.0 (13.8) 50.2
Adjustments for underlying profit
0.2 0.6 26.7 0.9 1.7 - 30.1 16.7 46.8
Cash NPAT (iii) 35.4 14.0 26.5 11.7 9.3 (2.8) 94.1 2.9 97.0
Basic earnings per share (cents)
- - - - - - 18.5 - 14.5
Cash earnings per share (cents)
- - - - - - 27.2 - 28.0
Volume ($) 535 332 164 101 136 - 1,268 82 1,350
Closing receivables and customer loans ($)
470 311 272 201 620 - 1,874 220 2,094
(i) Unallocated relates to net corporate debt interest.(ii) Other relates to the results of the Enterprise business that is in run-off. The Group does not take the result of this business into account in
assessing underlying performance.(iii) Cash NPAT reflects the reported net profit after tax adjusted for items highlighted in Cash NPAT to Statutory NPAT reconciliation on page 30. The
analysis of results below is based on Cash NPAT to align the information provided to users of financial reports to the way the Directors view the business and to assist better understanding of the Group’s performance. The Directors believe that Cash NPAT is the most appropriate measure of maintainable earnings of the Group and therefore best reflects the core drivers and ongoing influences upon those earnings. Cash NPAT is used by the Directors for purposes of providing market guidance to shareholders and the market, and is calculated on a consistent basis each year.
DIRECTORS’ REPORT
For
per
sona
l use
onl
y

27FLEXIGROUP ANNUAL REPORT 2017
Performance SummaryCash NPAT from continuing activities of $90.3m; represents a 4% decline compared with $94.1m in the prior corresponding year. Net receivables increased to $2,047m, representing a 9% increase from $1,874m in the prior corresponding year. Cash EPS of 24.2c represents a 11% decline from 27.2c compared to prior corresponding year. The decline in Cash EPS is due to an increase in weighted average number of shares held during the year following the capital raising in November 2015, and the decrease in Cash NPAT. Below is the continuing operations Cash NPAT reconciliation from prior year and an analysis of the movements.
35.4 33.9
14.09.7
26.5
13.9
11.7
11.5
9.3
27.8
(2.8)
1.5 0.2 4.3 18.5 12.6 3.7
(6.5)
$m
FY16 NZ LeasingAU Cards Net Corporate Debt Costs
Certegy NZ CardsAU Leasing FY17
FY16 $94.1m
(Continuing Operations)
FY17 $90.3m
(Continuing Operations)
DIRECTORS’ REPORT
For
per
sona
l use
onl
y

28FLEXIGROUP ANNUAL REPORT 2017
• Certegy delivered a $33.9m Cash NPAT, a decrease in profit by $1.5m compared to the prior corresponding year. The decrease was driven primarily by increased competition and some margin compression, reduced volume and an increase in both the average term and average contract value, resulting in net portfolio income declining from $97.3m to $94.2m.
• Australia Cards delivered a $9.7m Cash NPAT, a $4.3m decrease compared to the prior corresponding year. There is a lag in growing profits due to rapid growth in interest free balances (+55%). The increase in funding costs on initial interest free balances as new customers are acquired and a portfolio driven increase in losses contributed to the profit decline. This business is in a good position to grow significantly in the future as the receivables portfolio mix rebalances between interest and non-interest bearing.
• Australia Leasing performance shows a Cash NPAT of $13.9m, a decrease of $12.6m (48%). The decline is resulting from a shift in receivables mix towards lower yielding; higher quality commercial assets which has temporarily impacted short term profitability. Furthermore, changes to the Consumer lease product to improve customer value has affected short-term profitability, however is delivering improved levels of customer engagement and driving higher rates of repeat business. In addition, segment profitability has been impacted by ongoing investment in product development initiatives in commercial managed services, Oxipay and Ireland (which form part of Australia Leasing segment) that are aimed at setting the Group up for future organic growth.
• New Zealand Leasing performance is stable with a minor decline of $0.2m, despite the 9% reduction in both volume and receivables during the year. This was underpinned by increased revenue and a decrease in impairments, offset by an increase in operating expenses to support new business initiatives.
• New Zealand Cards shows an increase of $18.5m, driven primarily by the 12 months contribution of NZ Cards to Group results, compared to the 4 months in the prior corresponding year. Receivables are stable compared to prior year, and the business is primed for strong growth going into the future.
• Net corporate debt interest expense increased by $3.7m in current year, driving Group profits lower compared to the prior period. This is due to the higher average corporate debt in current year due to the debt funding of the acquisition of Fisher & Paykel Finance on 28 February 2016.
DIRECTORS’ REPORT
For
per
sona
l use
onl
y

29FLEXIGROUP ANNUAL REPORT 2017
Group Profit and Loss
A$m June 2017 June 2016 Change %
Total portfolio income 462.8 396.4 17%
Interest expense (102.0) (79.0) 29%
Net portfolio income 360.8 317.4 14%
Receivables and customer loan impairment expenses (62.8) (78.6) (20%)
Depreciation and amortisation expenses (16.2) (14.3) 13%
Operating and other expenses (159.6) (154.8) 3%
Profit before income tax 122.2 69.7 75%
Income tax expense (34.8) (19.5) 78%
Profit after income tax 87.4 50.2 74%
Total portfolio incomeTotal portfolio income increased 17% to $462.8m, mainly due to the full year contribution from New Zealand Cards. The 55% increase in the Australia Cards portfolio also resulted in increased fee income. The Australian Leasing business is increasingly showing a rebalance from high yielding consumer to lower yielding commercial business, resulting in a drag in segment revenue.
Interest expenseInterest expense increased 29% to $102.0m, driven by the full year contribution from New Zealand Cards, increase in interest on corporate debt due to increased average borrowings and increased funding costs to support the growth in the Australia Cards business. The Group is focused on managing funding costs, with the newly established Australia Cards funding structure expected to result in cost of funds savings in FY18 and beyond.
Impairment losses on loans and receivablesThe 20% decrease in impairment losses compared to prior year reflects the impact of FY16 one-off impairments in the Enterprise portfolio that is currently in run-off. Excluding this one-off provision, impairment expenses from continuing operations increased by 16%, reflecting increased impairment losses in the Australia Cards and New Zealand Cards businesses, driven by portfolio growth and a full year contribution respectively. The Group continues to focus on strategies to proactively manage losses, as demonstrated by the decline in losses in Australia Leasing and the stabilisation in the Certegy segment. Overall impairment cost as a percentage of average net receivables has dropped from 3.5% to 2.9%.
Depreciation and amortisationDepreciation and amortisation has increased 13% due to the full year contribution from New Zealand Cards and the impact of prior year capital projects that went live in FY17.
Operating expensesOperating expenses increased 3%; this includes the full year contribution from New Zealand Cards offset by certain one-off costs of $33.5m in the prior year. Significant investment has also been made in developing and launching new products and on boarding new merchants.
DIRECTORS’ REPORT
For
per
sona
l use
onl
y

30FLEXIGROUP ANNUAL REPORT 2017
Reconciliation of Statutory Profit to Cash NPAT
A$m June 2017 June 2016
Statutory profit after tax 87.4 50.2
NON-CASH ITEMS
Amortisation of acquired intangible assets 4.2 3.7
Other adjustments 1.4 43.1
Total non-cash items 5.6 46.8
Group Cash NPAT 93.0 97.0
Discontinued operations (2.7) (2.9)
Cash NPAT from continuing operations
90.3 94.1
Non-cash items are excluded from cash profit, which is management’s and the Directors’ preferred measure of the Group’s financial performance, as they tend to be non-recurring in nature and are not considered to be representative of the Group’s ongoing financial performance. The impacts of these items on the Group’s statutory profit are outlined below and are treated consistently with the prior year.
Amortisation of acquired intangiblesThe acquisition of companies over the years has resulted in the recognition of intangible assets that are amortised over their useful life ranging from 3 to 27 years. The amortisation of these intangible assets is treated as a non-cash item because it does not affect cash distributions available to shareholders. During the year, $4.2m post tax has been amortised to the income statement (2016: $3.7m).
Other adjustmentsOther adjustments in the current year relates to the share of equity accounted losses relating to the Group’s investment in Kikka. In the prior year, the one-off items related to impairment losses in the Enterprise business of $16.7m, business acquisition costs of $5.6m and impairment of goodwill and software of $20.8m.
Discontinued operationsEffective 1 July 2016, the Enterprise business, which previously formed part of the Australia Leasing segment was discontinued and placed in run-off. The results of that business are considered non-core and do not form part of Group maintainable cash earnings. Prior year comparatives have been restated to reflect the discontinuance.
Group Balance Sheet A$m June 2017 June 2016
Cash and cash equivalents 167.3 174.4
Receivables and customer loans(1) 2,165.9 2,079.0
Other assets 13.1 23.2
Current tax receivable 3.8 3.3
Goodwill 321.4 298.9
Other intangible assets 114.4 100.8
Total assets 2,785.9 2,679.6
Payables 50.3 49.1
Borrowings 2,007.7 1,948.5
Other liabilities 30.9 42.3
Current and deferred tax liabilities
25.2 27.3
Total liabilities 2,114.1 2,067.2
Equity 671.8 612.4
Gearing(2) 53% 67%
ROE(3) 14% 19%
(1) Includes other debtors and the Other non-core segment receivables as disclosed in the statutory accounts.
(2) Gearing is recourse (corporate) borrowings as a percentage of equity excluding intangible assets.
(3) Calculated based on Cash NPAT as a percentage of average equity.
Receivables and customer loansReceivables and customer loans (including other debtors) increased by 4% to $2,165.9m compared to June 2016 driven primarily by the growth in customer loans. Customer loans before bad debts has increased by $166.5m, underpinned by 55% growth in the Australia Cards business. The receivables for New Zealand Cards and Certegy segments have remained consistent with the prior year. The strong growth in customer loans has been partially offset by the decline in the receivables portfolio, mainly due to the run-off in the Enterprise portfolio.
Goodwill The increase in goodwill resulted from a $15.2m fair value adjustment relating to the FY16 Fisher and Paykel Finance acquisition. The acquisition of Take Home Layby contributed $1.0m and $1.9m relates to the reclassification of Think Office Technology goodwill from disposal group held for sale to assets held for use. The movement in exchange rates resulted in a $4.4m increase in goodwill relating to the New Zealand businesses.
DIRECTORS’ REPORT
For
per
sona
l use
onl
y

31FLEXIGROUP ANNUAL REPORT 2017
Other intangible assetsOther intangible assets include merchant and customer relationships, brand names and software. These are amortised over the useful life ranging from 3 to 27 years. The increase resulted from a combination of project capital expenditure, the recognition of intangible assets through fair valuation of Fisher and Paykel Finance net assets and the acquisition of Take Home Layby merchant relationships.
PayablesPayables include trade creditors, interest accruals, GST payable and sales incentive accruals. Balances have remained consistent with the prior year, reflecting the similar nature and timing of payments within the business.
Borrowings Borrowings have increased by 3% to $2,007.7m, driven by the funding requirements to support the growth in the Australia Cards business. On 30 June 2017, the Group secured a new facility to fund both the existing and future Australia Cards business and manage cost of funds. The cash release from the refinancing was utilised to pay down the corporate debt borrowings.
Other liabilitiesOther liabilities include provisions, derivative financial instruments and deferred and contingent consideration payable. The decrease in other liabilities is mainly from the decrease in fair value of derivative financial instruments, which has decreased $7.1m, as a result of changes in the swap rate compared to the prior corresponding year.
Current and deferred tax liabilitiesTax balances are stable compared to prior year, with the decrease in net tax liabilities attributable to an overpayment of tax in Australia as a result of year end reconciliation.
FundingFlexiGroup maintains a conservative funding strategy; to retain committed funding facilities for all scale businesses, combined with an active debt capital markets presence. The Group currently has revolving wholesale debt facilities in place with Australian Deposit Taking Institutions, large international banks, plus numerous institutional investors in its various Asset Backed Securities (ABS) program.
During the 2017 financial year, the Group completed the $265.0m Flexi ABS Trust 2017-1 securitisation in February 2017 and a new $550m facility to fund both the existing Australia Cards business and future growth. The new facility was secured on significantly improved terms and has an expiry date of June 2020.
At balance sheet date, the Group had $2,607.0m of wholesale debt facilities, with $703.2m undrawn and no indications that facilities will not be extended. The majority of the wholesale debt facilities ($2,217.3m) have no bullet repayment on maturity, with outstanding balances repaying in line with receivables and customer loans if availability periods were not to be extended. These facilities are secured against underlying pools of receivables and customer loans. The remaining wholesale debt facilities either have a soft bullet or have sufficient lead-time for re-extension when approaching maturity.
The Group’s $177.5m (2016: $187.5m) of corporate debt facilities were drawn to $126.2m (2016: $142.0m) at balance date. These facilities are secured by the assets of the Group, and with a maturity date in 2020.
GearingThe reduction in recourse corporate debt gearing to 53% (June 2016: 67%) is driven by repayment of corporate borrowings during the period through excess funds generated from operating activities and cash release from refinancing of the Australia Cards funding facilities.
The Group continues to optimise its capital structure to maximise shareholder value. The Group will continue to pay down recourse corporate debt with proceeds from operating activities.
Return on equity (‘ROE’)ROE of 14% (June 2016: 19%) has reduced primarily due to additional capital requirements to support the growth in Australia Cards, the impact of discontinued businesses during the period and the reshaping of profit pool to cards compared to leasing. The Group expects long term ROE to increase as customer loans growth in Australia Cards mature into interest bearing.
DIRECTORS’ REPORT
For
per
sona
l use
onl
y

32FLEXIGROUP ANNUAL REPORT 2017
Group Statement of Cash Flows
A$m June 2017 June 2016 Change
NPAT 87.4 50.2 74%
Impairment loss on receivables and customer loans 62.8 78.6 (20%)
Depreciation and amortisation expenses 16.2 14.3 13%
Impairment of goodwill and other intangible assets - 26.1 (100%)
Changes in operating assets and liabilities (6.8) (26.4) (74%)
Other non-cash movements 1.4 4.6 (70%)
Operating cash flow 161.0 147.4 9%
Consolidated cash flow
A$m June 2017 June 2016 Change
Operating cash flow 161.0 147.4 9%
Capex (24.6) (24.2) 2%
Acquisitions and divestments (7.6) (187.1) (96%)
Changes in customer loans and receivables (159.0) (58.0) 174%
Investing cash flow (191.2) (269.3) (29%)
Proceeds from equity raising - net of transaction costs - 144.4 (100%)
Drawdown of corporate borrowings 135.0 239.0 (44%)
Repayment of corporate borrowings (150.8) (142.0) 6%
Net movement in non-recourse borrowings 75.9 (21.4) (455%)
Dividends and share based payments (36.9) (55.2) (33%)
Financing cash flow 23.2 164.8 (86%)
Net (decrease) / increase in cash (7.0) 42.9 (116%)
Cash inflows from operating activities are up on prior year, with an increase of 9% to $161.0m (2016: $147.4m). The increase in cash inflows from operating activities is mainly from the full year contribution of New Zealand Cards as well as improved working capital management practices across the Group, as reflected by an improvement in changes in operating net assets.
Cash outflows from investing activities decreased by 29% to $191.2m (2016: $269.3m). There is significant increase in net investment in loans and receivables, driven by increased volume in both Australia and New Zealand Cards businesses. Capital expenditure remains relatively constant compared with prior year. In prior year, acquisitions and divestments were significant due to the Fisher and Paykel Finance acquisition.
Cash inflows from financing activities decreased 86% to $23.2m (2016: $164.8m), due to the non-recurrence of equity and debt capital raised to fund the acquisition of FlexiCards. Of particular note is the decrease in dividends paid, driven by a change in dividend policy. This change resulted in a reduced payout ratio to allow the Group to channel funds towards funding business growth and investment.
DIRECTORS’ REPORT
For
per
sona
l use
onl
y

33FLEXIGROUP ANNUAL REPORT 2017
Shareholder returns YEAR ENDED 30 JUNE
2017 2016 2015 2014 2013 2012
TSR (3%) (16%) (14%) (26%) 92% 18%
Dividends per share (cents) 7.70 14.50 17.75 16.50 14.50 12.50
Cash EPS (cents) 24.90 28.00 28.70 27.10 24.30 21.50
Share price (high) $2.58 $3.12 $4.00 $4.99 $4.74 $2.65
Share price (low) $1.55 $1.71 $2.70 $2.98 $2.55 $1.60
Share price (close) $1.83 $1.74 $2.91 $3.17 $4.36 $2.60
Earnings per share2017 2016
cents cents
Basic earnings per share 23.4 14.5
Diluted earnings per share 23.4 14.5
Cash earnings per share 24.9 28.0
Dividends on ordinary shares 2017 2016
cents $m cents $m
Final dividend for the year - payable October
3.85 14.40 7.25 27.0
Dividends paid during the year
Interim dividend for the year - paid in April 3.85 14.30 7.25 27.0
Final dividend for 2016 (PY: 2015) - paid in October
7.25 27.00 9.00 27.3
Total dividends paid during the year 11.10 41.30 16.25 54.3
Total dividends declared for the financial year 7.70 28.70 14.50 54.0
DividendsThe decrease in the dividends paid in FY17 was a result of a change to our dividend policy. The dividend has been rebased from 50%-60% of Cash NPAT to 30%-40% with effect from 1H17. The change in the dividend policy also saw the Dividend Reinvestment Plan commencing with the FY17 interim dividend though not applicable to the final dividend. The reset of the dividend policy ensures that the growth of the business can be sustainably funded.
The final dividend for 2017 has a record date of 8 September 2017 and is expected to be paid on 13 October 2017.
DIRECTORS’ REPORT
For
per
sona
l use
onl
y

34
REVIEW OF OPERATIONS - SEGMENT PERFORMANCE
FlexiGroup’s business consists of five core operating segments. The Enterprise business, which was put in run-off at the end of FY16, no longer forms part of core operations and is classified as Other, and not reported as part of core maintainable cash earnings. Interest on acquisition debt obtained to fund the acquisition of Fisher and Paykel Finance is unallocated but forms part of maintainable cash earnings.
Segment Summary
A$m June 2017 June 2016 Change %
Certegy 33.9 35.4 (4%)
Australia Cards 9.7 14.0 (31%)
Australia Leasing 13.9 26.5 (48%)
NZ Leasing 11.5 11.7 (2%)
NZ Cards 27.8 9.3 199%
Unallocated(1) (6.5) (2.8) 132%
Total Cash NPAT from continuing operations
90.3 94.1 (4%)
(1) Unallocated relates to net corporate debt interest.
Segment Analysis
Certegy
A$m June 2017 June 2016 Change %
Net portfolio income 94.2 97.3 (3%)
Operating expenses (26.2) (27.1) (3%)
Impairment losses on customer loans
(19.6) (19.9) (2%)
Volume 524.0 535.0 (2%)
Closing customer loans 466.0 470.0 (1%)
Cash NPAT 33.9 35.4 (4%)
Cash NPAT of $33.9m represents a 4% decrease compared to the prior corresponding year. The decrease is driven by:
• Increase in average deal size and decrease in number of written contracts, impacting on both fee and interest income.
• Operating expenses decreased by 3% to $26.2m due to focus on cost management to address declining revenue.
• Impairment losses decreased by 2% to $19.6m, reflecting the continuous improvements in our customer collections capability.
Australia Cards
A$m June 2017 June 2016 Change %
Net portfolio income 44.5 39.4 13%
Operating expenses (17.9) (10.9) 64%
Impairment losses on customer loans
(12.7) (8.5) 49%
Volume 534.0 332.0 61%
Closing customer loans
483.0 311.0 55%
Cash NPAT 9.7 14.0 (31%)
Australia Cards’ Cash NPAT of $9.7m represents a decrease of 31% compared to the prior corresponding year.
• Net portfolio income grew at 13%, slower than volume and receivables growth of 61% and 55% respectively. This is due to the time lag between origination and the generation of interest income due to the initial non-interest bearing nature of the portfolio.
• Impairment losses increased by $4.2m pre-tax reflecting the growth in the loans portfolio, leading to a drag in profits. However, when expressed as a percentage of average net loans, losses remained steady at 3%, which is in line with the prior corresponding year.
• Operating expenses increased by 64% to $17.9m primarily driven by increased headcount to support Cards growth, the size of receivables and the increase in new business volumes.
DIRECTORS’ REPORT
34FLEXIGROUP ANNUAL REPORT 2017
For
per
sona
l use
onl
y
35
Australia Leasing
A$m June 2017 June 2016 Change %
Net portfolio income 92.2 106.2 (13%)
Operating expenses (60.8) (81.5) (25%)
Impairment losses on receivables
(15.2) (17.6) (14%)
Volume 205.0 164.0 25%
Closing receivables 299.0 272.0 10%
Cash NPAT 13.9 26.5 (48%)
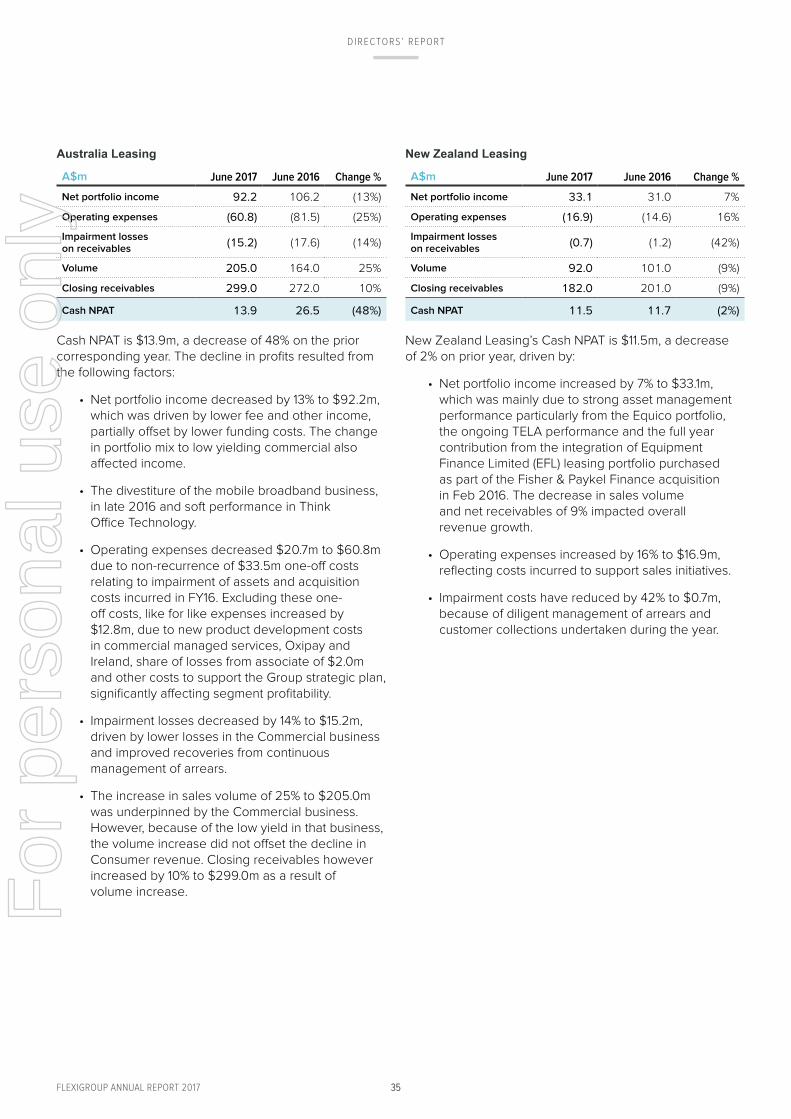
Cash NPAT is $13.9m, a decrease of 48% on the prior corresponding year. The decline in profits resulted from the following factors:
• Net portfolio income decreased by 13% to $92.2m, which was driven by lower fee and other income, partially offset by lower funding costs. The change in portfolio mix to low yielding commercial also affected income.
• The divestiture of the mobile broadband business, in late 2016 and soft performance in Think Office Technology.
• Operating expenses decreased $20.7m to $60.8m due to non-recurrence of $33.5m one-off costs relating to impairment of assets and acquisition costs incurred in FY16. Excluding these one-off costs, like for like expenses increased by $12.8m, due to new product development costs in commercial managed services, Oxipay and Ireland, share of losses from associate of $2.0m and other costs to support the Group strategic plan, significantly affecting segment profitability.
• Impairment losses decreased by 14% to $15.2m, driven by lower losses in the Commercial business and improved recoveries from continuous management of arrears.
• The increase in sales volume of 25% to $205.0m was underpinned by the Commercial business. However, because of the low yield in that business, the volume increase did not offset the decline in Consumer revenue. Closing receivables however increased by 10% to $299.0m as a result of volume increase.
New Zealand Leasing
A$m June 2017 June 2016 Change %
Net portfolio income 33.1 31.0 7%
Operating expenses (16.9) (14.6) 16%
Impairment losses on receivables
(0.7) (1.2) (42%)
Volume 92.0 101.0 (9%)
Closing receivables 182.0 201.0 (9%)
Cash NPAT 11.5 11.7 (2%)
New Zealand Leasing’s Cash NPAT is $11.5m, a decrease of 2% on prior year, driven by:
• Net portfolio income increased by 7% to $33.1m, which was mainly due to strong asset management performance particularly from the Equico portfolio, the ongoing TELA performance and the full year contribution from the integration of Equipment Finance Limited (EFL) leasing portfolio purchased as part of the Fisher & Paykel Finance acquisition in Feb 2016. The decrease in sales volume and net receivables of 9% impacted overall revenue growth.
• Operating expenses increased by 16% to $16.9m, reflecting costs incurred to support sales initiatives.
• Impairment costs have reduced by 42% to $0.7m, because of diligent management of arrears and customer collections undertaken during the year.
DIRECTORS’ REPORT
35FLEXIGROUP ANNUAL REPORT 2017
For
per
sona
l use
onl
y

36
New Zealand Cards
A$m June 2017 June 2016 Change %
Net portfolio income 93.9 29.5 218%
Operating expenses (42.6) (13.1) 225%
Impairment losses on customer loans
(12.6) (4.0) 215%
Volume 594.0 136.0 337%
Closing customer loans
617.0 620.0 (0%)
Cash NPAT 27.8 9.3 199%
New Zealand Cards’ Cash NPAT is $27.8m, an increase of 199% compared to the prior corresponding year. The increase is primarily due to the full year profit contribution in current year, compared with four months in FY16. Other factors include:
• Net portfolio income of $93.9m remained steady over the year with MasterCard fee income and improved funding costs offset by a reduction in interest income due to lower receivables in the closed loop portfolios.
• Operating expenses of $42.6m were impacted by spend associated with launching two new scheme cards - Q MasterCard and Flight Centre MasterCard, as well as the development of Oxipay.
• Impairment losses were $12.6m, showing an improvement over the year as arrears continue to be closely monitored.
• Volume of $594.0m was driven by the two new MasterCard products as well as the acquisition of a number of key merchants, particularly in the food and fuel category.
• Closing loan receivables balance of $617.0m remained steady as growth in the new open loop portfolio was offset by a decline in the maturing closed loop products.
DIRECTORS’ REPORT
36FLEXIGROUP ANNUAL REPORT 2017
For
per
sona
l use
onl
y

37
INTRODUCTION FROM THE CHAIRMAN OF THE BOARD REMUNERATION COMMITTEE
This report discusses the 2017 financial year remuneration outcomes for the Group, Directors and Key Management Personnel (KMPs), including detail about our remuneration framework and performance against our strategic priorities.
DIRECTORS’ REPORT
REMUNERATION REPORT
37FLEXIGROUP ANNUAL REPORT 2017
For
per
sona
l use
onl
y

38
2017 REMUNERATION OUTCOMES
As with previous years, the Board assessed a number of factors when determining remuneration outcomes for 2017. In addition to financial results, the Committee assesses other elements of performance such as the quality of the results, key performance drivers, meeting customer needs, leadership effectiveness and the impact of the implementation of strategic initiatives in order to determine if the outcomes adequately reflect actual performance and return to shareholders.
This year performance across the Group was varied. The highlight of our FY17 performance was strong volume and customer loans growth in the Australia cards business. This growth in customer loans sets a solid foundation for future revenue growth as the portfolio mix rebalances between interest and non-interest bearing. Our Commercial teams in Australia and New Zealand continue to improve their performance, providing a solid platform for further growth in FY18. Greater integration across technology platforms and processes of the Australia and New Zealand cards teams should result in marked improvements in performance both businesses in the coming financial year. Our Certegy business did not perform in line with our expectations, which had the impact on the Group delivering at the lower end of market guidance. A review of the Certegy business has been undertaken and a number of initiatives are underway to return the business to strong performance.
It is against these outcomes that the short and long-term incentives were finalised. Short-term incentive outcomes during the FY17 financial year for the CEO and the KMPs averaged 50% of target. There was some variation in payment between divisional KMPs based on performance. This year, we also introduced the concept of deferred shares as part of our Short Term Incentive structure, with 25% of KMP STI payments being allocated to shares, further aligning performance with shareholder interests while also encouraging retention of the KMP.
In FY17, Tranche 2 of the FY14 Long Term Incentive (LTI) reached the test date based on FY15-FY16 performance periods. As the minimum performance vesting thresholds were not met, none of the FY14 LTI vested.
More specifically:
• FlexiGroup’s Total shareholder Return (TSR) applicable for tranche 2 of the LTI plan is negative. This outcome was below the 50th percentile vesting threshold, so none of the FY14 TSR hurdled rights vested.
• FlexiGroup’s Cash Earnings per Share (EPS) growth over the 2 year vesting was also below the vesting threshold of 4.5%, so none of the FY14 EPS hurdled rights vested.
• FlexiGroup’s Volume Hurdle did not vest this year. The Board reviewed the overall performance of the business for FY16 as well as reviewing each business unit’s performance in relation to volume that drives profitable growth.
The Committee continues to assess FlexiGroup’s remuneration frameworks in order to ensure that they are aligned to market expectations and the interests of shareholders.
The Board has decided that the volume hurdle is no longer necessary provided that the TSR and EPS hurdles remain in place for future plans. Accordingly, the Board has determined to retain two hurdles only for LTI awards commencing in FY18.
DIRECTORS’ REPORT
38FLEXIGROUP ANNUAL REPORT 2017
For
per
sona
l use
onl
y

39
KEY MANAGEMENT PERSONNEL CHANGES IN FY17
There have been some changes to Key Management Personnel (KMPs) in the last twelve months. During October 2016, Ken Richards joined the team as our General Manager, Commercial Sales. Ross Aucutt was appointed as our Chief Financial Officer, replacing David Stevens in January 2017 and Rob May left the role of General Manager, Certegy in January 2017.
We also introduced a new, stand-alone position of Chief Executive Officer FlexiGroup New Zealand to manage our Commercial and Cards businesses, which Chris Lamers commenced in during April 2017. Given FY17 performance, remuneration for KMPs was given a lot of consideration. We are comfortable that all KMPs are remunerated appropriately in line with their accountabilities and the size and complexity of their roles. As a result, only two KMPs received pay increases for FY18.
The Board is committed to ensuring the Remuneration Report presents an accurate and concise view of Executive remuneration, complying with requirements under the Corporations Act 2001. We are confident that the Company’s remuneration policies support the Group’s strategic and financial goals and we will continue to monitor this alignment in the coming year.
VOTING AND COMMENTS MADE AT THE COMPANY’S 2016 ANNUAL GENERAL MEETING
FlexiGroup received 98.87% of “yes” votes on its remuneration report for the 2016 financial year.
We are confident that our remuneration framework will drive positive outcomes for the Group in 2018 financial year.
This will be my final year as Chair of the Remuneration Committee and I would like to welcome Jodie Leonard, who will be taking over from me as Chair after the Annual General Meeting.
Rajeev Dhawan
Independent, Non-Executive Director
DIRECTORS’ REPORT
39FLEXIGROUP ANNUAL REPORT 2017
For
per
sona
l use
onl
y

40
PRINCIPLES AND GOVERNANCE OF REMUNERATION AT FLEXIGROUP
This section details the Group’s principles and governance in regards to remuneration.
Principles
The objective of our Remuneration policies is to focus our employees on achieving the Group’s key strategic and business objectives, while also enabling the Group to attract, motivate and retain the most talented employees and become an employer of choice in the Australasian marketplace.We recognise that having the right people in place within the organisation is a key competitive advantage and determinant of the Group’s success. As such, it is important to us that our market rates and benefits are competitive with similar sized organisations, while also ensuring that we retain our focus on managing our operational expenditures to drive the best possible outcome for our customers and shareholders.
We have a number of key principles that underpin our Remuneration Policy:
• To provide competitive remuneration packages that enable the Group to attract high calibre candidates who will make a positive impact on the performance of the Group;
• To ensure that our people are focusing on driving the short and long term goals of the Group, within the appropriate risk framework;
• All remuneration structures must be aligned to FlexiGroup’s business strategy and reinforce our values – payment of incentives must be directly linked to the achievement of specific, measurable strategic business objectives and reward must only be allocated where achievement against Key Performance Indicators (KPIs) can be demonstrated and appropriate behaviours have been displayed;
• Any decisions made regarding remuneration variations must be commercially responsible, and considerate of budget, as well as business requirements and shareholder interests; and
• Our employees should be rewarded consistently for like work against market relativities, irrespective of gender, age or other irrelevant demographic factors – the key differentiator in pay for individuals should be performance.
DIRECTORS’ REPORT
40FLEXIGROUP ANNUAL REPORT 2017
For
per
sona
l use
onl
y

41
Alignment to shareholders’ interests is a key principle for the Group when considering Executive remuneration. When considering the design of the Executive Remuneration Framework and in particular, any incentive arrangements, the Board aims to ensure that all arrangements have profitability as a core component of plan design and focus on sustained growth in shareholder wealth as measured by growth in earnings per share and other financial and non-financial performance indicators.
This is balanced with a focus on ensuring that participant’s interests are also represented in considering incentive design, by focusing on rewarding capability and experience while also providing recognition for participant contribution and effort.
Remuneration Cycle and Considerations
FlexiGroup has defined approval processes in place for all remuneration decisions. For our KMPs, any amendments to remuneration must be approved by the Remuneration Committee (this is also the case for non KMP direct reports to the CEO).
Remuneration for KMPs is reviewed annually in line with the financial year. In setting an individual’s remuneration, the Board considers:
• External and internal relativities;
• Individual and Group performance over the last year;
• Recommendations from the Group CEO on the remuneration arrangements for the Executive team; and
• Market data from comparable roles listed on the Australian Securities Exchange (ASX) against a peer group that is relevant and large enough to provide meaningful data.
Governance
We also place a strong focus on ensuring that the Group’s remuneration policies and practices are fair and meet our obligations:
• to reward employees for achieving high performance that is aligned to shareholder value and long term benefit for the Group; and
• to ensure that we meet the Group’s risk management framework and governance standards.
The Remuneration Committee is responsible for enforcing the required standards in regards to governance of FlexiGroup remuneration practices.
The Committee’s responsibilities include reviewing and making recommendations to the FlexiGroup Board on the remuneration philosophy, framework and policies for the Group. The Committee is responsible for making recommendations to the Board on remuneration policies and Directors’ as well as Executives’ remuneration.
The Remuneration Committee undertakes the following activities for the Group:
• Reviews and provides recommendations to the Board on remuneration, recruitment and retention policies for Executives;
• Reviews and provides advice regarding the Key Performance Indicators (KPIs) for the Group and for individual Executives that underpin the Short Term Incentive program;
• Reviews and provides recommendations to the Board on remuneration policies for the broader organisation (Non-Executives);
• Reviews Remuneration Policies annually to ensure that the policies comply with the Group’s objectives and risk management framework;
• Provides annual recommendations to the Board on the individual remuneration arrangements for the CEO, Executive team and any other KMP;
• Approves overall Group remuneration budgets and Short Term Incentive Scheme payments for Non-Executive Group employees; and
• Reviews and provides recommendations to the Board regarding remuneration for Non-Executive Directors.
The Remuneration Committee reviews the Remuneration Framework on an annual basis to ensure that it adheres to the Group’s overall risk management framework and that any risks identified are addressed in a timely manner.
The Remuneration Committee consists of a majority of independent Non-Executive Directors and consists of the following members:
• Rajeev Dhawan (Chairman); and
• Jodie Leonard.
DIRECTORS’ REPORT
41FLEXIGROUP ANNUAL REPORT 2017
For
per
sona
l use
onl
y

42
Independent remuneration consultant
In consultation with external remuneration consultants, the Group aims to provide an Executive remuneration framework that is market competitive and complementary to the reward strategy of the organisation. During the year, FlexiGroup Limited’s Remuneration Committee engaged the services of Mercer to continue to work with us on providing advice regarding our Long Term Incentive Plan (LTIP).
Mercer was paid $30,000 to provide advice and the recommendations were made free from undue influence by members of the Group’s KMP, with Mercer being engaged by, and reporting directly to, the Chair of the Remuneration Committee. The agreement for the provision of remuneration consulting services was executed by the Chair of the Remuneration Committee to ensure compliance with the Corporations Act 2001.
Consequently, the Board is satisfied that the recommendations were made with the required level of independence from KMP.
Key Management Personnel remuneration disclosed in this report
The remuneration of Key Management Personnel (KMP) for the Group is disclosed in this Report. In 2017 financial year, KMP comprised Non-executive Directors, the CEO and Group Executives who reported to the CEO and/or led significant parts of the business.
Directors and key management personnel disclosed in this report
Name Position Term as KMP
Non-Executive and Executive Directors
Andrew Abercrombie Chairman Full Year
Symon Brewis-Weston Chief Executive Officer Full Year
Christine Christian Independent, Non-Executive From 1 December 2016
Rajeev Dhawan Independent, Non-Executive Full Year
Jodie Leonard Independent, Non-Executive From 1 December 2016
R John Skippen Independent, Non-Executive Full Year
Other KMPs
David Stevens Chief Financial Officer Until 9 January 2017
Ross Aucutt Chief Financial Officer From 9 January 2017
Rob May General Manager - Certegy Until 31 January 2017
Verity Gilpin General Manager – Sales Full Year
Peter Lirantzis Chief Operating Officer Full Year
Ken Richards General Manager - Commercial From 10 October 2016
Chris Lamers Chief Executive Officer - New Zealand From 6 March 2017
DIRECTORS’ REPORT
42FLEXIGROUP ANNUAL REPORT 2017
For
per
sona
l use
onl
y

43
REMUNERATION SNAPSHOT 2017
This section provides an overview of the Group’s remuneration arrangements during the 2017 financial year.
FlexiGroup’s Total Reward Framework
The remuneration framework in place for the Executive team (including the CEO) is consistent with the Group’s Remuneration Policy, which is based on a Total Remuneration approach. This comprises of a mix of fixed and variable pay in the form of cash, and deferred shares and performance rights.
The framework aligns Executive rewards with achievement of strategic objectives and the creation of value for shareholders.
Total Remuneration for our Executive team is comprised of three elements:
Fixed remuneration – which includes cash salary and employer superannuation components. This amount takes into consideration a number of factors including the size and complexity of the role; the requirements of the role; the skills and experience the individual brings to the role; as well as the market relativity for like roles in the financial services industry.
Short Term Incentive – this payment is a percentage of the fixed remuneration amount and is set against risk-adjusted financial targets and non-financial targets that support the Group’s strategy. These targets are usually a mix of group and individual performance objectives for the year.
Long Term Incentive – this is comprised of performance share rights, which vest over a fixed period if performance hurdles are achieved. The performance hurdles are a combination of earnings per share and total shareholder return targets set by the Board at inception of the incentive plans.
CHART 1 HERE
Salary
(Cash)
Employer Superannuation
Contributions
Fixed Remuneration
At Risk Remuneration - Short Term Incentives (STI)
At Risk Remuneration - Long Term Incentive (LTI)
Cash STI
(75% of total STI)
Deferred STI
(25% of total STI)
Performance Rights (2014 plan)
Total remuneration framework underpinned by remuneration
principles
DIRECTORS’ REPORT
43FLEXIGROUP ANNUAL REPORT 2017
For
per
sona
l use
onl
y

44
KMP REMUNERATION IN 2017
Fixed Remuneration
The Executive team are offered competitive fixed remuneration amounts that reflect the key performance requirements of their roles. Fixed Remuneration is reviewed annually in line with the financial year (1 July to 30 June), although a review may not necessarily result in any increases to remuneration. Any increases to Executive Remuneration need to be approved by the Board Remuneration Committee and come into effect from 1 July, following an annual performance review, which is conducted at the end of the financial year.
Remuneration is benchmarked against market data provided by remuneration consultants for companies that are similar to the Group in terms of industry, size and complexity. In line with our focus on driving a pay for performance culture, a key determinant of whether any increases to Fixed Remuneration will apply year to year is performance against specific financial and non-financial metrics that are set for each individual at the beginning of the financial year.
The fixed remuneration for KMPs is set out on page 57 of this report.
Short Term Incentive
The Executive team participate in a Short Term Incentive scheme that is based on performance against key financial and non-financial measures.
The STI opportunity for the CEO is fixed at 75% of fixed remuneration and for other Executive KMPs, it is fixed at 50% of fixed remuneration (‘target’). The Board has set the maximum opportunity available to the CEO and Senior Executives to 150% of target.
In 2017, the maximum STI achieved against their target by any of the KMP was 64%.
The structure of the STI is designed to achieve alignment of organisational performance to our strategic goals. The STI contains both Group Goals (based on the Group’s strategic objectives) as well as Area Specific goals that are aligned to the Group’s strategic objectives but unique to each department. The goals are consistent across the Group and were introduced to drive a collaborative approach within the organisation to achieve business success and shareholder value within the financial year.
During 2017, a target was set for performance against four Group Goals. The policy allows for either partial payment (for performance under target) or a stretch payment (for performance over target) to be paid, subject to the below principles:
• Any partial payments made will consider the performance of the business overall and the closeness of the performance in the specific metric to the identified target: and
• Any stretch payments made will consider the performance of the business overall. For a stretch payment to be made, all metrics will need to have achieved target or above.
Discretion regarding any payments under the STI rests with the Board. The Board has the capacity to adjust STI outcomes (and reduce STI outcomes to zero if appropriate) as part of the assessment process.
Payment of the Group Goals was determined based on the Group’s results at 30 June 2017.
STI outcomes are subject to both a quantitative and qualitative assessment, including a risk management overlay, which is embedded in the scoreboard measurement process.
STI Key Objectives for 2017
The structure of the STI is designed to achieve alignment of organisational performance to our strategic goals as well as driving performance in key business segments. The Board identified these measures, as they are a critical link between achieving the Group’s strategic objectives and increasing shareholder value. An overview of the FY17 Short Term Incentive Scheme is outlined in the table below, including a summary of performance.
Components Weighting Outcomes
Group Goals 25% 0%
Segment/Functional Specific Goals 50% 35%
Growth Goals 25% 15%
DIRECTORS’ REPORT
44FLEXIGROUP ANNUAL REPORT 2017
For
per
sona
l use
onl
y

45
Update to Short Term Incentive Scheme in FY17
For the first time in 2017, KMPs will have a portion of their STI paid as deferred (restricted) shares. By deferring a portion of the STI, incentive payments are better aligned with the interests of shareholders as the ultimate value of the deferred portion is tied to the share price at the end of the restriction period. The deferred STI awards recognise past performance and are not subject to further performance conditions, but are subject to a tenure condition.
The KMPs receive dividends over the vesting period.
The STI payment will work as follows:
Plan Component Detail
Performance Period 1 July 2016 to 30 June 2017
STI Split75% paid in cash in September 2017
25% provided as restricted shares
Restriction Period 12 months for the deferred portion from grant date
Dividends/Voting Rights KMPs are entitled to dividends and voting rights during the restriction period.
ForfeitureThe deferred shares are subject to continued service (Restriction Period) which means that the shares are forfeited if the employee resigns or breaches company policies or terms of his or her employment agreement during the relevant Restriction Period.
ClawbackRestricted shares may also be forfeited if a clawback event occurs during the Restriction Period. A clawback event is a circumstance where an employee has engaged in fraud, dishonesty or gross misconduct, or where the financial results that led to the restricted shares being granted are subsequently shown to be materially misstated.
Long Term Incentive
Long-term incentives to the CEO and Senior Employees are provided via the FlexiGroup Long Term Incentive Plan (‘LTIP’). The FlexiGroup LTIP is part of FlexiGroup’s remuneration strategy and is designed to align the interests of FlexiGroup management and shareholders and assist FlexiGroup in the attraction, motivation and retention of Executives. In particular, the LTIP is designed to provide relevant Executives with an incentive for future performance, with conditions for the vesting and exercise of performance rights under the LTIP encouraging those Executives to remain with FlexiGroup and contribute to the future performance of the Group. The Company’s founding shareholders approved the terms, the implementation and the operation of the LTIP on 20 November 2006.
Under the LTIP, eligible persons participating in the LTIP may be granted options and/or performance rights on terms and conditions determined by the Board from time to time. An option and a performance right are both rights to acquire a share, subject to the satisfaction of applicable vesting and/or exercise conditions. The main difference between an option and a performance right is that an exercise price as determined by the Board is required to be paid to exercise a vested option, whereas a performance right has a nil exercise price unless otherwise determined by the Board. Options and performance rights granted under the plan carry no dividend or voting rights.
The Board is responsible for administering the LTIP in accordance with the LTIP Rules and the terms and conditions of specific grants of options and/or performance rights to participants in the LTIP. The Board may determine which persons will be eligible to participate in the LTIP from time to time. Eligible persons may be invited to apply to participate in the LTIP. The Board may in its discretion accept such applications.
DIRECTORS’ REPORT
45FLEXIGROUP ANNUAL REPORT 2017
For
per
sona
l use
onl
y

46
The following diagram sets out the performance hurdles that underpin the current LTI plan (offered in December 2014 and amended in 2015).
40%
40%
20%
LTIP PERFORMANCE
HURDLES
Cash EPS TSR Cash EPS
DIRECTORS’ REPORT
46FLEXIGROUP ANNUAL REPORT 2017
For
per
sona
l use
onl
y
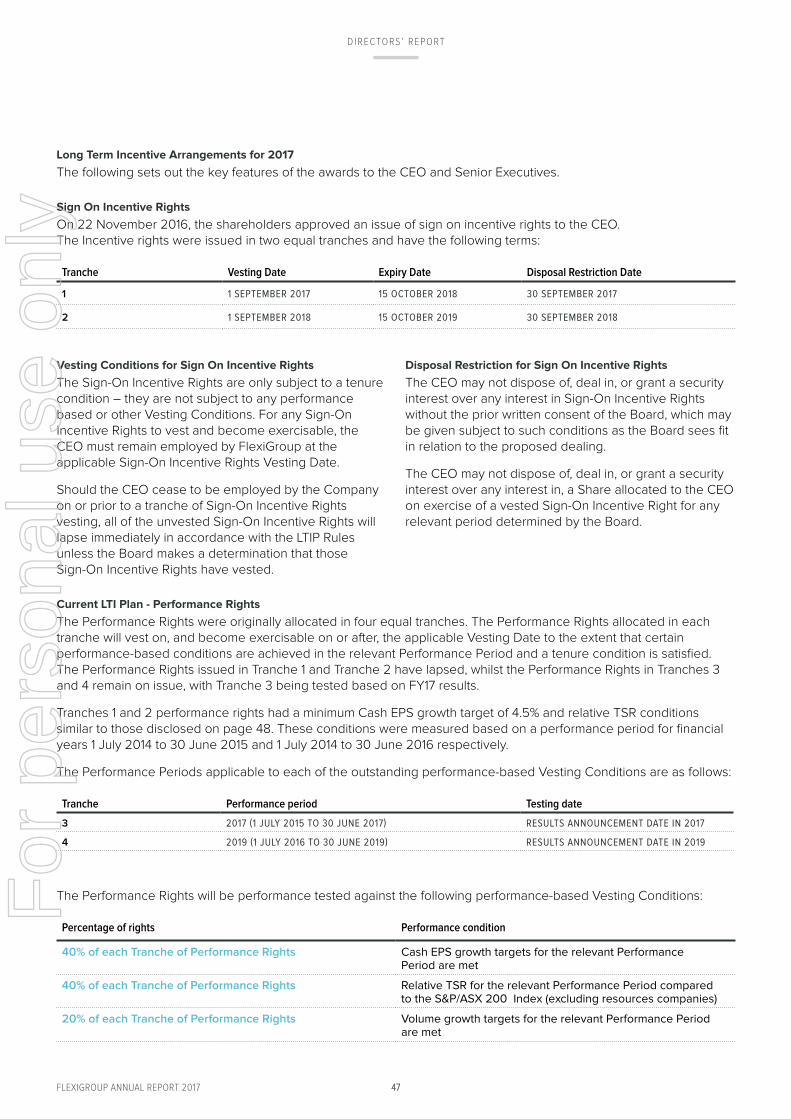
47
Long Term Incentive Arrangements for 2017
The following sets out the key features of the awards to the CEO and Senior Executives.
Sign On Incentive Rights
On 22 November 2016, the shareholders approved an issue of sign on incentive rights to the CEO. The Incentive rights were issued in two equal tranches and have the following terms:
Tranche Vesting Date Expiry Date Disposal Restriction Date
1 1 SEPTEMBER 2017 15 OCTOBER 2018 30 SEPTEMBER 2017
2 1 SEPTEMBER 2018 15 OCTOBER 2019 30 SEPTEMBER 2018
Vesting Conditions for Sign On Incentive Rights
The Sign-On Incentive Rights are only subject to a tenure condition – they are not subject to any performance based or other Vesting Conditions. For any Sign-On Incentive Rights to vest and become exercisable, the CEO must remain employed by FlexiGroup at the applicable Sign-On Incentive Rights Vesting Date.
Should the CEO cease to be employed by the Company on or prior to a tranche of Sign-On Incentive Rights vesting, all of the unvested Sign-On Incentive Rights will lapse immediately in accordance with the LTIP Rules unless the Board makes a determination that those Sign-On Incentive Rights have vested.
Disposal Restriction for Sign On Incentive Rights
The CEO may not dispose of, deal in, or grant a security interest over any interest in Sign-On Incentive Rights without the prior written consent of the Board, which may be given subject to such conditions as the Board sees fit in relation to the proposed dealing.
The CEO may not dispose of, deal in, or grant a security interest over any interest in, a Share allocated to the CEO on exercise of a vested Sign-On Incentive Right for any relevant period determined by the Board.
Current LTI Plan - Performance Rights
The Performance Rights were originally allocated in four equal tranches. The Performance Rights allocated in each tranche will vest on, and become exercisable on or after, the applicable Vesting Date to the extent that certain performance-based conditions are achieved in the relevant Performance Period and a tenure condition is satisfied. The Performance Rights issued in Tranche 1 and Tranche 2 have lapsed, whilst the Performance Rights in Tranches 3 and 4 remain on issue, with Tranche 3 being tested based on FY17 results.
Tranches 1 and 2 performance rights had a minimum Cash EPS growth target of 4.5% and relative TSR conditions similar to those disclosed on page 48. These conditions were measured based on a performance period for financial years 1 July 2014 to 30 June 2015 and 1 July 2014 to 30 June 2016 respectively.
The Performance Periods applicable to each of the outstanding performance-based Vesting Conditions are as follows:
Tranche Performance period Testing date
3 2017 (1 JULY 2015 TO 30 JUNE 2017) RESULTS ANNOUNCEMENT DATE IN 2017
4 2019 (1 JULY 2016 TO 30 JUNE 2019) RESULTS ANNOUNCEMENT DATE IN 2019
The Performance Rights will be performance tested against the following performance-based Vesting Conditions:
Percentage of rights Performance condition
40% of each Tranche of Performance Rights Cash EPS growth targets for the relevant Performance Period are met
40% of each Tranche of Performance Rights Relative TSR for the relevant Performance Period compared to the S&P/ASX 200 Index (excluding resources companies)
20% of each Tranche of Performance Rights Volume growth targets for the relevant Performance Period are met
DIRECTORS’ REPORT
47FLEXIGROUP ANNUAL REPORT 2017
For
per
sona
l use
onl
y

48
Cash EPS growth performance condition
The first performance-based Vesting Condition is based on growth on adjusted “Cash NPAT” earnings per share measure used by the Company to track earnings per share on an underlying performance basis. The Company calculates this adjusted “Cash NPAT” earnings per share measure (“Cash EPS”) for a financial year as:
the reported statutory net profit after tax for the financial year, after adding back the amount of acquired intangibles amortisation recorded in the annual accounts and after adjusting for any material one-off income or expense items the Board believes are appropriate to reflect underlying recurring earnings;
divided by the weighted average number of ordinary shares on issue during the year.
This is consistent with how the Company reports its “Cash NPAT” in its investor presentations.
The performance condition tests the growth in Cash EPS for the relevant Performance Period financial year above the Cash EPS for the immediately preceding financial year, measured as a percentage, (“Cash EPS Growth”).
The Cash EPS Growth condition will be satisfied for a Performance Period in accordance with the following table:
Cash EPS Growth targetPercentage of Performance Rights available in given year satisfying condition
COMPOUND ANNUAL GROWTH RATE IN
Cash EPS less than 4.5% Nil
COMPOUND ANNUAL GROWTH RATE IN
Cash EPS of 4.5%30%
COMPOUND ANNUAL GROWTH RATE IN
Cash EPS greater than 4.5% but less than 6.0% Pro-rata between 30% and 60%
COMPOUND ANNUAL GROWTH RATE IN
Cash EPS of 6.0%60%
COMPOUND ANNUAL GROWTH RATE IN
Cash EPS greater than 6.0% but less than 7.5%Pro-rata between 60% and 100%
COMPOUND ANNUAL GROWTH RATE IN
Cash EPS equal to or greater than 7.5%100%
Relative TSR performance condition
The second performance-based Vesting Condition for each tranche of Performance Rights relates to the Company’s Total Shareholder Return (“TSR”) for the relevant Performance Period when compared to the peer group of companies in the S&P/ASX 200 Index (excluding materials and energy companies). For each Performance Period, the TSR for the Company will be determined by calculating the amount by which the sum of:
• the 90 day volume weighted average price (“VWAP”) for FlexiGroup shares in the period up to and including the 30 June at the end of the relevant Performance Period; and
• the dividends paid on a share during the relevant Performance Period, exceeds the 90 day VWAP for the Company’s shares in the period up to and including 1 July at the beginning of the relevant Performance Period, expressed as a percentage.
Relative TSR target
Percentage of Performance Rights available in given year satisfying condition
Less than 50th percentile of companies in S&P/ASX 200 Index(excluding materials and energy companies)
Nil
50th percentile of companies in S&P/ASX 200 Index (excluding materials and energy companies)
50%
Greater than 50th percentile but less than the 75th percentile of companies in S&P/ASX 200 Index
Pro rata between 50% and 100%
Greater than or equal to 75th percentile of companies in S&P/ASX 200 Index (excluding materials and energy companies)
100%
The Board has the discretion to amend either the Cash EPS growth performance condition or the relative TSR performance condition at any time during the relevant Performance Period applicable to those Performance Rights if the Board believes it is appropriate to do so to reflect the Company’s circumstances.
DIRECTORS’ REPORT
48FLEXIGROUP ANNUAL REPORT 2017
For
per
sona
l use
onl
y

49
Volume Condition
The third performance-based Vesting Condition is based on Volume. The Volume Growth vesting condition will assess volume growth for the Company with respect to the Performance Period applicable to the relevant tranche of Performance Rights, based on performance indicators set by the Board from time to time.
Vesting Date and Expiry Date
Tranche Vesting date Expiry date
3 1 SEPT 2017 15 OCT 2019
4 1 SEPT 2019 15 OCT 2021
Vested Performance Rights that are not exercised before the relevant expiry date will lapse in accordance with the LTIP Rules.
Disposal restriction
The CEO and Senior Executives may not dispose of, deal in, or grant a security interest over any interest in, a Performance Right without the prior written consent of the Board, which may be given subject to such conditions as the Board sees fit in relation to the proposed dealing.
The CEO and Senior Executives may not dispose of, deal in, or grant a security interest over any interest in, a Share allocated on exercise of a Vested Performance Right for any relevant period determined by the Board.
The Board has imposed a disposal restriction on the Shares that are the subject of this approval, which will be granted on the exercise of any Vested Performance Rights. The disposal restriction will be enforced by placing a sale restriction over the Shares that are allocated on the exercise of the Vested Performance Rights.
The disposal restrictions on those Shares will be lifted at the relevant Restriction Period End Date as set out below:
Tranches of Shares allocated on exercise of Vested Performance Rights tranches
% of Shares allocated on vesting and exercise of Performance Rights Restriction Period End Date
Tranche 3 33% 15 OCTOBER 2017
33% 15 OCTOBER 2018
33% 15 OCTOBER 2019
Tranche 460% 15 OCTOBER 2019
40% 15 OCTOBER 2020
The Board may also implement any such other arrangements (including a holding lock) as it determines are necessary to enforce this restriction.
The Board has the discretion to amend or waive any disposal restrictions on the Shares the subject of this approval which will be granted on the exercise of any Vested Performance Rights at any time until the disposal restriction ends, if the Board believes it is appropriate to do so to reflect the Company’s or the employee’s circumstances.
Once any Board imposed restriction is removed, and subject to the Company’s Trading Policy, Shares acquired on exercise of Vested Performance Rights may be dealt with freely.
DIRECTORS’ REPORT
49FLEXIGROUP ANNUAL REPORT 2017
For
per
sona
l use
onl
y
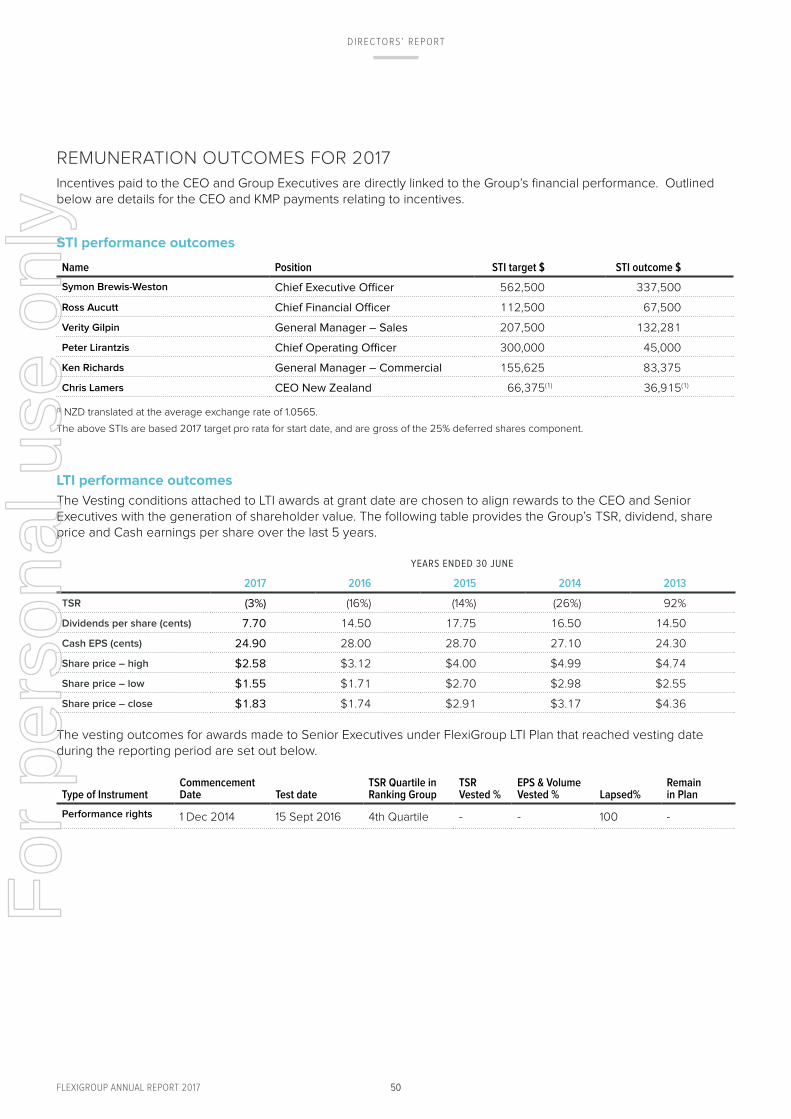
50
REMUNERATION OUTCOMES FOR 2017
Incentives paid to the CEO and Group Executives are directly linked to the Group’s financial performance. Outlined below are details for the CEO and KMP payments relating to incentives.
STI performance outcomes
Name Position STI target $ STI outcome $
Symon Brewis-Weston Chief Executive Officer 562,500 337,500
Ross Aucutt Chief Financial Officer 112,500 67,500
Verity Gilpin General Manager – Sales 207,500 132,281
Peter Lirantzis Chief Operating Officer 300,000 45,000
Ken Richards General Manager – Commercial 155,625 83,375
Chris Lamers CEO New Zealand 66,375(1) 36,915(1)
(1) NZD translated at the average exchange rate of 1.0565.
The above STIs are based 2017 target pro rata for start date, and are gross of the 25% deferred shares component.
LTI performance outcomes
The Vesting conditions attached to LTI awards at grant date are chosen to align rewards to the CEO and Senior Executives with the generation of shareholder value. The following table provides the Group’s TSR, dividend, share price and Cash earnings per share over the last 5 years.
YEARS ENDED 30 JUNE
2017 2016 2015 2014 2013
TSR (3%) (16%) (14%) (26%) 92%
Dividends per share (cents) 7.70 14.50 17.75 16.50 14.50
Cash EPS (cents) 24.90 28.00 28.70 27.10 24.30
Share price – high $2.58 $3.12 $4.00 $4.99 $4.74
Share price – low $1.55 $1.71 $2.70 $2.98 $2.55
Share price – close $1.83 $1.74 $2.91 $3.17 $4.36
The vesting outcomes for awards made to Senior Executives under FlexiGroup LTI Plan that reached vesting date during the reporting period are set out below.
Type of InstrumentCommencement Date Test date
TSR Quartile in Ranking Group
TSR Vested %
EPS & Volume Vested % Lapsed%
Remain in Plan
Performance rights 1 Dec 2014 15 Sept 2016 4th Quartile - - 100 -
DIRECTORS’ REPORT
50FLEXIGROUP ANNUAL REPORT 2017
For
per
sona
l use
onl
y

51
Options issued to top five remunerated Non-KMP officers
Details of performance rights granted to key management personnel are disclosed in the table on page 58. In financial year 2017, no instruments were issued to an officer who is among the five highest remunerated officers of the Company and the Group, and who is not a key management person.
The terms and conditions of each grant of options, performance and sign on incentive rights affecting remuneration in the previous, this or future reporting periods are as follows:
Grant date Tranche numberDate vested and exercisable Expiry date Exercise price*
Value per option, performance right
at grant date ($)
3 July 2014 1 15 Oct 2015 31 Mar 2016 Nil 3.02
1 December 2014 1 1 Sep 2015 15 Oct 2018 Nil 2.81
1 1 Sep 2015 15 Oct 2018 Nil 0.44
2 1 Sep 2016 15 Oct 2018 Nil 2.65
2 1 Sep 2016 15 Oct 2018 Nil 1.40
3 1 Sep 2017 15 Oct 2019 Nil 2.49
3 1 Sep 2017 15 Oct 2020 Nil 1.31
4 1 Sep 2018 15 Oct 2021 Nil 2.35
4 1 Sep 2018 15 Oct 2021 Nil 1.23
26 November 2015 2 1 Sep 2016 15 Oct 2018 Nil 2.61
2 1 Sep 2016 15 Oct 2018 Nil 0.27
2 1 Sep 2016 15 Oct 2018 Nil 2.61
3 1 Sep 2017 15 Oct 2019 Nil 2.46
3 1 Sep 2017 15 Oct 2019 Nil 1.04
3 1 Sep 2017 15 Oct 2019 Nil 2.46
4 1 Sep 2019 15 Oct 2021 Nil 2.17
4 1 Sep 2019 15 Oct 2021 Nil 1.34
4 1 Sep 2019 15 Oct 2021 Nil 2.17
22 November 2016 1 1 Sep 2018 15 Oct 2018 Nil 2.11
2 1 Sep 2019 15 Oct 2019 Nil 1.98
* The exercise price must be paid by the option holder to exercise the option when it vests.
Details of performance and sign on incentive rights over ordinary shares in the Company provided as remuneration to each Director of FlexiGroup Limited and each of the key management personnel of the parent entity and the Group are set out below. When exercisable, performance and sign on incentive right is convertible into one ordinary share of FlexiGroup Limited. Further information on the performance and sign on incentive rights is set out in note 24 to the financial statements.
DIRECTORS’ REPORT
51FLEXIGROUP ANNUAL REPORT 2017
For
per
sona
l use
onl
y

52
Name
Number of performance and sign on incentive rights granted during
the year
Value of performance and sign on incentive rights granted during
the year ($)
Number of performance and sign on
incentive rights vested during the year
Number of performance and sign
on incentive rights lapsed during the year
Financial years of issue of
lapsed rights
DIRECTORS OF FLEXIGROUP LIMITED
A Abercrombie - - - - -
S Brewis-Weston 72,000 147,523 - - -
R Dhawan - - - - -
R J Skippen - - - - -
C Christian - - - - -
J Leonard - - - - -
OTHER KEY MANAGEMENT PERSONNEL
D Stevens - - - 360,000 2015; 2016
R Aucutt - - - - -
R May - - - 255,000 2015; 2016
V Gilpin - - - 40,000 2016
P Lirantzis - - - 240,000 2015; 2016
K Richards - - - - -
C Lamers - - - - -
The assessed fair value at grant date of sign on incentive rights granted in 2017 is allocated equally over the period from grant date to vesting date, and the amount is included in the remuneration table on page 55. The fair value at grant date was internally determined, as the rights have no performance vesting conditions. The valuation was determined based on the term of the rights, the share price at grant date, and the expected dividend yield.
The model inputs for sign on incentive rights granted during the year ended 30 June 2017 included:
a) Exercise price: nil, sign on incentive rights issued
b) Grant date: 22 November 2016
c) Expiry date: various per sign on rights granted
d) Share price at grant date: $2.22
e) Expected price volatility of the Company’s shares: n/a
f) Expected dividend yield: 6.5%
g) Risk-free interest rate: n/a
Shares provided on exercise of remuneration options and performance rights
In current year, nil ordinary shares in the Company were issued because of the exercise of remuneration performance and sign on incentive rights. Vested performance and sign on incentive rights are settled through on market share purchases.
DIRECTORS’ REPORT
52FLEXIGROUP ANNUAL REPORT 2017
For
per
sona
l use
onl
y

53
ADDITIONAL INFORMATION
Details of remuneration: STI cash payments, performance, and sign on incentive rights
For each STI cash payment and grant of performance and sign on incentive rights, the percentage of the available bonus or grant that was paid, or that vested, in the financial year, and the percentage that was forfeited because the person did not meet the service and performance criteria is set out below. The performance and sign on incentive rights vest in accordance with the vesting schedules detailed below. No performance and/or sign on incentive rights will vest if the conditions are not satisfied, hence the minimum value of the rights yet to vest is nil. The maximum value of the rights yet to vest has been determined as the amount of the fair value at grant date of the rights that are yet to be expensed.
Name
2017 STI Cash
payment
STI Outcome as % of target
STI % of target
forfeited
LTI Year granted
Prior year equity awards Vested during
2017
Prior year equity awards
Forfeited during 2017
Financial years in which
performance and sign on incentive
rights may vest
Maximum total value of
grant yet to vest
$ % % % % $
EXECUTIVE DIRECTOR
S Brewis-Weston 253,725 60 40 2017 - - 2018; 2019 64,118
OTHER KEY MANAGEMENT PERSONNEL
D Stevens - - -2016 - 100 - -
2015 - 100 - -
R Aucutt 50,625 60 40 - - - - -
R May - - -2016 - 100 - -
2015 - 100 - -
V Gilpin 99,211 64 36 2016 - 21 2020; 2021 256,809
P Lirantzis 33,750 15 85 - - - 2020 195, 760
K Richards 62,531 54 46 - - - - -
C Lamers 27,686 56 44 - - - - -
Shares under performance rights
As at the date of this report, there were 1,792,000 unissued ordinary shares of FlexiGroup Limited subject to performance and sign on incentive rights. These unissued ordinary shares are the subject of performance and sign on incentive rights with expiry dates between 15 October 2018 and 15 October 2021.
No performance and sign on incentive shareholder has any right under the performance share to participate in any other share issues of the Company or any other entity.
Non-Executive Directors
Fees and payments to Non-Executive Directors reflect the demands that are made on and the responsibilities of the Non-Executive Directors. Non-Executive Directors’ fees and payments are reviewed annually and benchmarked where appropriate by the Board. Non-Executive Directors do not receive share options. Non-Executive Directors may opt each year to receive a percentage of their remuneration in FlexiGroup Limited shares which would be acquired on–market. Shareholders approved this arrangement on 20 November 2006 but no Directors have yet elected to participate in the arrangement.
DIRECTORS’ REPORT
53FLEXIGROUP ANNUAL REPORT 2017
For
per
sona
l use
onl
y

54
Non-Executive Directors’ fees
The current base remuneration was approved on 20 July 2011. Non-Executive Directors’ fees are determined within an aggregate Directors’ fee pool limit of $1.2 million.
The following fee structure was applicable for the 2017 financial year:
Base fees (per annum)
Chair $250,000
Other Non-Executive Directors $120,000
Additional fees (per annum)
Audit Committee – Chair $25,000
Remuneration Committee – Chair $25,000
Risk and Compliance Committee – Chair $25,000
In addition to the above fees, Directors also receive superannuation contributions required under government legislation.
A Director is entitled to reimbursement for reasonable travel, accommodation and other expenses in attending meetings and carrying out their duties.
Under clause 10.09 of the Company’s constitution, subject to the Listing Rules and Corporations Act 2001, a Director at the request of the other Directors may be remunerated for performing additional or special duties for the Company.
Under clause 10.11 of the Company’s constitution, subject to the Listing Rules and Corporations Act 2001, the Company may pay a former Director, or the personal representatives of a Director who dies in office, a retirement benefit in recognition of past services of an amount determined by the Directors. The Company may also enter into a contract with a Director providing for payment of the retiring benefit. No such contracts have been entered into to date. Despite having this clause in the Company’s constitution, the Company does not intend to pay such benefits to Directors.
DIRECTORS’ REPORT
54FLEXIGROUP ANNUAL REPORT 2017
For
per
sona
l use
onl
y
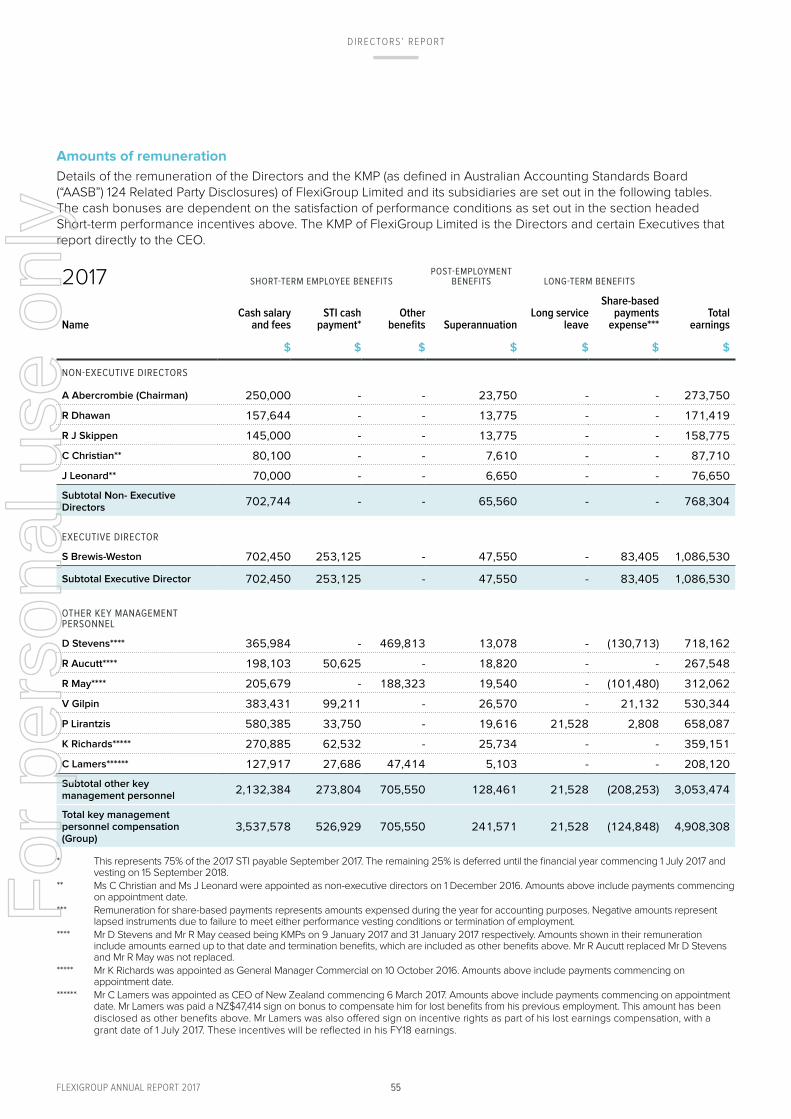
55
Amounts of remuneration
Details of the remuneration of the Directors and the KMP (as defined in Australian Accounting Standards Board (“AASB”) 124 Related Party Disclosures) of FlexiGroup Limited and its subsidiaries are set out in the following tables. The cash bonuses are dependent on the satisfaction of performance conditions as set out in the section headed Short-term performance incentives above. The KMP of FlexiGroup Limited is the Directors and certain Executives that report directly to the CEO.
2017 SHORT-TERM EMPLOYEE BENEFITSPOST-EMPLOYMENT
BENEFITS LONG-TERM BENEFITS
NameCash salary
and feesSTI cash
payment*Other
benefits SuperannuationLong service
leave
Share-based payments
expense***Total
earnings
$ $ $ $ $ $ $
NON-EXECUTIVE DIRECTORS
A Abercrombie (Chairman) 250,000 - - 23,750 - - 273,750
R Dhawan 157,644 - - 13,775 - - 171,419
R J Skippen 145,000 - - 13,775 - - 158,775
C Christian** 80,100 - - 7,610 - - 87,710
J Leonard** 70,000 - - 6,650 - - 76,650
Subtotal Non- Executive Directors
702,744 - - 65,560 - - 768,304
EXECUTIVE DIRECTOR
S Brewis-Weston 702,450 253,125 - 47,550 - 83,405 1,086,530
Subtotal Executive Director 702,450 253,125 - 47,550 - 83,405 1,086,530
OTHER KEY MANAGEMENT PERSONNEL
D Stevens**** 365,984 - 469,813 13,078 - (130,713) 718,162
R Aucutt**** 198,103 50,625 - 18,820 - - 267,548
R May**** 205,679 - 188,323 19,540 - (101,480) 312,062
V Gilpin 383,431 99,211 - 26,570 - 21,132 530,344
P Lirantzis 580,385 33,750 - 19,616 21,528 2,808 658,087
K Richards***** 270,885 62,532 - 25,734 - - 359,151
C Lamers****** 127,917 27,686 47,414 5,103 - - 208,120
Subtotal other key management personnel
2,132,384 273,804 705,550 128,461 21,528 (208,253) 3,053,474
Total key management personnel compensation (Group)
3,537,578 526,929 705,550 241,571 21,528 (124,848) 4,908,308
* This represents 75% of the 2017 STI payable September 2017. The remaining 25% is deferred until the financial year commencing 1 July 2017 and vesting on 15 September 2018.
** Ms C Christian and Ms J Leonard were appointed as non-executive directors on 1 December 2016. Amounts above include payments commencing on appointment date.
*** Remuneration for share-based payments represents amounts expensed during the year for accounting purposes. Negative amounts represent lapsed instruments due to failure to meet either performance vesting conditions or termination of employment.
**** Mr D Stevens and Mr R May ceased being KMPs on 9 January 2017 and 31 January 2017 respectively. Amounts shown in their remuneration include amounts earned up to that date and termination benefits, which are included as other benefits above. Mr R Aucutt replaced Mr D Stevens and Mr R May was not replaced.
***** Mr K Richards was appointed as General Manager Commercial on 10 October 2016. Amounts above include payments commencing on appointment date.
****** Mr C Lamers was appointed as CEO of New Zealand commencing 6 March 2017. Amounts above include payments commencing on appointment date. Mr Lamers was paid a NZ$47,414 sign on bonus to compensate him for lost benefits from his previous employment. This amount has been disclosed as other benefits above. Mr Lamers was also offered sign on incentive rights as part of his lost earnings compensation, with a grant date of 1 July 2017. These incentives will be reflected in his FY18 earnings.
DIRECTORS’ REPORT
55FLEXIGROUP ANNUAL REPORT 2017
For
per
sona
l use
onl
y

56
2016 SHORT-TERM EMPLOYEE BENEFITSPOST-EMPLOYMENT
BENEFITS LONG-TERM BENEFITS
NameCash salary
and feesSTI cash
payment*Other
benefits SuperannuationLong service
leave
Share-based payments
expense****Total
earnings
$ $ $ $ $ $ $
NON-EXECUTIVE DIRECTORS
C Beare* 26,602 - - 2,113 - - 28,715
A Abercrombie (Chairman)* 235,000 - - 22,851 - - 257,851
R Dhawan** 210,000 - - 19,950 - - 229,950
R J Skippen 145,000 - - 13,775 - - 158,775
A Ward* 12,769 - - 1,213 - - 13,982
Subtotal Non- Executive Directors 629,371 - - 59,902 - - 689,273
EXECUTIVE DIRECTORS
T Robbiati*** 92,307 - - - - - 92,307
S Brewis-Weston*** 270,459 125,000 100,000 25,694 - - 521,153
Subtotal Executive Directors 362,766 125,000 100,000 25,694 - - 613,460
OTHER KEY MANAGEMENT PERSONNEL
D Stevens***** 555,692 50,000 100,000 19,308 29,063 93,357 847,420
R May****** 334,492 50,000 42,992 31,777 7,123 67,910 534,294
P Lirantzis***** 570,995 50,000 100,000 30,000 - 110,134 861,129
M Burke******* 284,773 - 212,500 27,053 - (25,739) 498,587
V Gilpin******* 38,766 - - 3,683 - 5,576 48,025
Subtotal other key management personnel
1,784,718 150,000 455,492 111,821 36,186 251,238 2,789,455
Total key management personnel compensation (Group)
2,776,855 275,000 555,492 197,417 36,186 251,238 4,092,188
* Mr A Abercrombie was appointed Chairman effective 10 August 2015, replacing C Beare, who ceased being Chairman on that date. Ms A Ward also resigned as a director on 10 August 2015.
** Mr R Dhawan received a $65,000 payment for performing substantial additional duties in relation to Remuneration during the year.*** Mr S Brewis-Weston commenced as CEO effective 8 February 2016, and was appointed a director on 22 February 2016, replacing T Robbiati, who
resigned as CEO on 7 August 2015. Mr Brewis-Weston was paid $100,000 sign on bonus to compensate for lost benefits from his previous role.**** Remuneration for share-based payments represents amounts expensed during the year for accounting purposes. Negative amounts represent
lapsed instruments.***** Mr D Stevens and Mr P Lirantzis were paid $100,000 each for acting as CEOs from the period August 2015 to February 2016. ****** Mr R May’s other benefits include car, health and life insurances which are paid by the Company. ******* Mr M Burke ceased being KMP on 13 May 2016 upon his departure. Amounts shown in his remuneration include amounts earned up to that date
and his termination benefits, which are included as other benefits above. Ms V Gilpin replaced Mr M Burke on 23 May 2016.
DIRECTORS’ REPORT
56FLEXIGROUP ANNUAL REPORT 2017
For
per
sona
l use
onl
y

57
The relative proportions of ongoing remuneration that are linked to performance and those that are fixed are as follows:
FIXED REMUNERATION AT RISK - STI AT RISK – LTI
2017 2016 2017 2016 2017 2017 2016 2016
Rights Options Rights Options
Name % % % % % % % %
KEY MANAGEMENT PERSONNEL
S Brewis-Weston 69 76 23 24 8 - - -
D Stevens* 100 83 n/a 6 n/a n/a 13 (2)
R Aucutt 81 - 19 - - - - -
R May* 100 78 - 10 - - 16 (4)
V Gilpin 77 88 19 - 4 - 12 -
P Lirantzis 94 81 5 6 1 - 14 (1)
K Richards 83 - 17 - - - - -
C Lamers 87 - 13 - - - - -
* Mr D Stevens and Mr R May’s total remuneration is disclosed as 100% fixed remuneration. They both did not qualify for STI due to resignation and their LTIs lapsed on departure.
Service agreementsRemuneration and other terms of employment for the Chief Executive Officer and the other Key Management Personnel are formalised in service agreements. Each of these agreements can provide for the provision of short term performance incentives, eligibility for the FlexiGroup Long Term Incentive Plan (‘LTIP’), other benefits including the use of a company motor vehicle, tax advisory fees, payment of benefits forgone at a previous employer, relocation, living, tax equalisation, travel and accommodation expenses while an Executive is required to live away from their normal place of residence.
All employment agreements are unlimited in term but capable of termination at agreed notice by either the Company or the Executive. The Company can make a payment in lieu of notice. The notice period for each Executive are listed in the table below.
In the event of retrenchment, the Executives listed in the table below are entitled to the payment provided for in the service agreement. The employment of the Executives may be terminated by the Company without notice by payment in lieu of notice. Upon termination of employment, the Board exercises its discretion on payment of a pro-rata STI entitlement and early vesting of any unvested LTI’s held by the above KMP.
The service agreements also contain confidentiality and restraint of trade clauses.
The provisions of the agreements relating to notice period and remuneration are listed in the table below.
NameTerm of agreement and notice period* Total Fixed Remuneration** Termination payments***
S Brewis-Weston 6 months 750,000 6 months
R Aucutt 3 months 450,000 3 months
V Gilpin 3 months 415,000 3 months
P Lirantzis 6 months 600,000 6 months
K Richards 3 months 415,000 3 months
C Lamers**** 3 months 425,000 3 months
* Notice applies to either party** Base salaries are for financial year ended 30 June 2017. The remuneration committee reviews them annually.*** Base salary payable if the Company terminates employee with notice, and without cause, (e.g. for reasons other than unsatisfactory performance)**** Remuneration is in NZ$
DIRECTORS’ REPORT
57FLEXIGROUP ANNUAL REPORT 2017
For
per
sona
l use
onl
y

58
Other Services obtained from related parties - Rental of Melbourne premises
Flexirent Capital Pty Limited has rented premises in Melbourne owned by entities associated with Mr A Abercrombie. The rental arrangements for these premises are based on market terms. The rent paid for these premises amounted to $172,187. Refer to note 31(d) for further details.
Equity instrument disclosures relating to Directors and Key Management Personnel
Performance and sign on incentive rights holdings
2017Name Balance at start
of yearGranted as
compensation Exercised LapsedBalance at
end of yearVested and exercisable Unvested
EXECUTIVE DIRECTOR
S Brewis-Weston - 72,000 - - 72,000 - 72,000
OTHER KEY MANAGEMENT PERSONNEL
D Stevens 360,000 - - (360,000) - - -
R Aucutt - - - - - - -
R May 255,000 - - (255,000) - - -
V Gilpin 190,000 - - (40,000) 150,000 - 150,000
P Lirantzis 360,000 (240,000) 120,000 - 120,000
K Richards - - - - - - -
C Lamers - - - - - - -
2016Name
Balance at start of year
Granted as compensation Exercised Lapsed
Balance at end of year
Vested and exercisable Unvested
EXECUTIVE DIRECTOR
S Brewis-Weston - - - - - - -
OTHER KEY MANAGEMENT PERSONNEL
D Stevens 541,350 120,000 (42,275) (259,075) 360,000 - 360,000
R May 758,750 45,000 (119,625) (429,125) 255,000 - 255,000
P Lirantzis 455,000 120,000 (43,500) (171,500) 360,000 - 360,000
M Burke 300,000 38,000 (20,000) (318,000) - - -
V Gilpin - 190,000 - - 190,000 - 190,000
DIRECTORS’ REPORT
58FLEXIGROUP ANNUAL REPORT 2017
For
per
sona
l use
onl
y

59
Shareholding disclosures relating to Directors and Key Management Personnel
2017Name Balance at start of year
Received during the year on the exercise
of rights Other changes
during the year Balance at end of year
NON-EXECUTIVE DIRECTORS
A Abercrombie (Chairman) 90,000,000 - 766,593 90,766,593
R Dhawan 275,371 - - 275,371
R J Skippen 145,000 - 2,470 147,470
C Christian - - - -
J Leonard - - 3,560 3,560
EXECUTIVE DIRECTOR
S Brewis-Weston 50,000 - 852 50,852
OTHER KEY MANAGEMENT PERSONNEL
D Stevens 46,510 - (46,510) -
R Aucutt - - - -
R May 23,375 - (23,375) -
V Gilpin - - - -
P Lirantzis 103,453 - - 103,453
K Richards - - - -
C Lamers - - - -
2016Name Balance at start of year
Received during the year on the exercise of
performance rights Other changes
during the year Balance at end of year
NON-EXECUTIVE DIRECTORS
A Abercrombie (Chairman) 76,765,251 - 13,234,749 90,000,000
R Dhawan 208,048 - 67,323 275,371
R J Skippen 115,000 - 30,000 145,000
EXECUTIVE DIRECTOR
S Brewis-Weston - - 50,000 50,000
OTHER KEY MANAGEMENT PERSONNEL
D Stevens 20,000 22,025 4,485 46,510
R May - 23,375 - 23,375
P Lirantzis 60,000 20,000 23,453 103,453
M Burke - 20,000 (20,000) -
V Gilpin - - - -
DIRECTORS’ REPORT
59FLEXIGROUP ANNUAL REPORT 2017
For
per
sona
l use
onl
y

60
OTHER INFORMATION
Directors’ indemnification
During the year ended 30 June 2017, the Company paid insurance premiums in respect of a Directors’ and Officers’ Liability insurance contract. Disclosure of the total amount of the premium and the nature of the liabilities in respect of such insurance is prohibited by the policy.
Indemnity of auditors
The Company has agreed to indemnify their auditors, PricewaterhouseCoopers, to the extent permitted by law, against any claim by a third party arising from the Company’s breach of their agreement. The indemnity stipulates that the Company will meet the full amount of any such liabilities including a reasonable amount of legal costs.
Proceedings on behalf of the Company
No person has applied to the court under section 237 of the Corporations Act 2001 for leave of Court to bring proceedings on behalf of the Company, or intervene in any proceedings to which the Company is a party, for the purpose of taking responsibility on behalf of the Company for all or any part or those proceedings. The Company was not a party to any such proceedings during the year.
No proceedings have been brought or intervened in on behalf of the Company with leave of the Court under section 237 of the Corporations Act 2001.
Non-audit services
The Company may decide to employ the auditor on assignments additional to their statutory audit duties where the auditor’s expertise and experience with the Company and/or the Group are important.
Details of the amounts paid or payable to the auditor (PricewaterhouseCoopers) for audit and non-audit services provided during the year are set out in note 33 of the financial statements.
The Board of Directors has considered the position and, in accordance with advice received from the Audit Committee, is satisfied that the provision of the non-audit services is compatible with the general standard of independence for auditors imposed by the Corporations Act 2001. The Directors are satisfied that the provisions of non-audit services by the auditor, as set out in note 33 of the consolidated financial statements, did not compromise the auditor independence requirement of the Corporations Act 2001 for the following reasons:
• all non-audit services have been reviewed by the Audit Committee to ensure they do not impact the impartiality and objectivity of the auditor
• none of the services undermine the general principle relating to auditor independence as set out in APES 110 Code of Ethics for Professional Accountants.
Declaration of interests
Other than as disclosed in the financial statements, no Director of the Company has received or become entitled to receive a benefit other than remuneration by reason of a contract made by the Company or a related corporation with a Director or with a firm of which they are a member, or with a company in which they have a substantial financial interest except that Flexirent Capital Pty Limited has rented premises in Melbourne owned by a company associated with Mr A Abercrombie. The lease is on standard market terms.
Rounding of amounts
The Company is of a kind referred to in ASIC Corporations (Rounding in Financial/Directors’ Reports) Instrument 2016/191 relating to the “rounding off” of amounts in the Directors’ Report and the Annual Financial Statements. Some amounts in the Directors’ Report and the Annual Financial Statements have been rounded off in accordance with that Instrument to the nearest hundred thousand dollars.
Environmental regulationThe Group’s operations are not regulated by any significant environmental regulation under a law of the Commonwealth or of a State or Territory.
Matters subsequent to end of the financial yearNo other matter or circumstance has arisen since 30 June 2017 that has significantly affected, or may significantly affect:
a) the Company’s operations in future financial years, or
b) the results of those operations in future financial years, or
c) the Company’s state of affairs in future financial years.
DIRECTORS’ REPORT
60FLEXIGROUP ANNUAL REPORT 2017
For
per
sona
l use
onl
y

61
Auditor’s Independence DeclarationA copy of the auditor’s independence declaration as required under section 307C of the Corporations Act 2001 is set out on page 68.
AuditorPricewaterhouseCoopers continues in office in accordance with section 327 of the Corporations Act 2001.
This report is made in accordance with a resolution of Directors.
Andrew Abercrombie
Chairman
Sydney 29 September 2017
DIRECTORS’ REPORT
61FLEXIGROUP ANNUAL REPORT 2017
For
per
sona
l use
onl
y

CORPORATE GOVERNANCE STATEMENT
62FLEXIGROUP ANNUAL REPORT 2017
For
per
sona
l use
onl
y

63FLEXIGROUP ANNUAL REPORT 2017
CORPORATE GOVERNANCE STATEMENT
CORPORATE GOVERNANCE STATEMENT
This Corporate Governance Statement sets out details of FlexiGroup Limited’s (Company) corporate governance practices for the financial year ended 30 June 2017 (Reporting Period) including the Company’s position relating to each of the Australian Securities Exchange (ASX) Corporate Governance Council’s (ASX CGC) Corporate Governance Principles and Recommendations 3rd Edition (Recommendations).For the purpose of preparing this Corporate Governance Statement, the Company has reviewed its current corporate governance policies and practices against the Recommendations in respect of the Reporting Period. As recommended by the ASX CGC, further information in relation to corporate governance practices is publicly available on the Company’s website at www.flexigroup.com.au.
The Company is committed to seeking to ensure that its policies and practices meet the highest levels of disclosure and the best practice in corporate governance in a manner that achieves good governance outcomes and is appropriate to the particular circumstances of the Company.
The Board has established a framework of processes and guidelines for the governance of the Company that includes corporate policies and monitoring procedures, financial and operational business risk management and internal control systems and standards for ensuring lawful and ethical conduct.
On 1 December 2016, Ms Christine Christian and Ms Jodie Leonard were appointed as Non-Executive Independent Directors of the Company.
As such, as at the date of this Corporate Governance Statement, the Board consists of Mr Andrew Abercrombie, Mr Symon Brewis-Weston, Ms Christine Christian, Mr Rajeev Dhawan, Ms Jodie Leonard and Mr John Skippen. The Board has a majority of independent directors. The Board Committees are chaired by Non-Executive directors. The Board is represented by a majority of independent directors on all Committees.
Mr Abercrombie indirectly holds 24% of the shares currently on issue in the Company and as the Former CEO is not regarded as being an independent director. The Board believes that Mr Abercrombie is best placed to act as Chairman given his extensive corporate knowledge and understanding of, the Company and his industry knowledge and associations.
This Corporate Governance Statement is current as at 29 September 2017, and has been approved by the Board of the Company.
For
per
sona
l use
onl
y
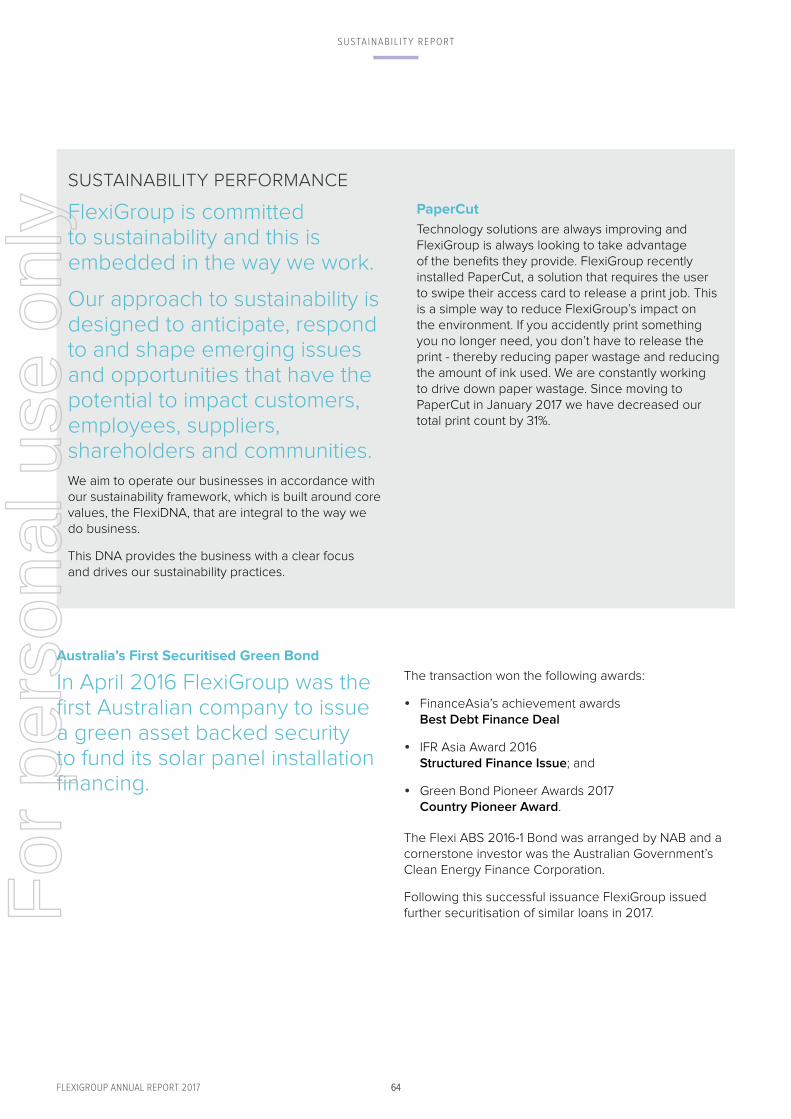
64
SUSTAINABIL ITY REPORT
SUSTAINABILITY PERFORMANCE
FlexiGroup is committed to sustainability and this is embedded in the way we work.
Our approach to sustainability is designed to anticipate, respond to and shape emerging issues and opportunities that have the potential to impact customers, employees, suppliers, shareholders and communities.We aim to operate our businesses in accordance with our sustainability framework, which is built around core values, the FlexiDNA, that are integral to the way we do business.
This DNA provides the business with a clear focus and drives our sustainability practices.
PaperCut
Technology solutions are always improving and FlexiGroup is always looking to take advantage of the benefits they provide. FlexiGroup recently installed PaperCut, a solution that requires the user to swipe their access card to release a print job. This is a simple way to reduce FlexiGroup’s impact on the environment. If you accidently print something you no longer need, you don’t have to release the print - thereby reducing paper wastage and reducing the amount of ink used. We are constantly working to drive down paper wastage. Since moving to PaperCut in January 2017 we have decreased our total print count by 31%.
Australia’s First Securitised Green Bond
In April 2016 FlexiGroup was the first Australian company to issue a green asset backed security to fund its solar panel installation financing.
The transaction won the following awards:
• FinanceAsia’s achievement awards Best Debt Finance Deal
• IFR Asia Award 2016 Structured Finance Issue; and
• Green Bond Pioneer Awards 2017 Country Pioneer Award.
The Flexi ABS 2016-1 Bond was arranged by NAB and a cornerstone investor was the Australian Government’s Clean Energy Finance Corporation.
Following this successful issuance FlexiGroup issued further securitisation of similar loans in 2017.
64FLEXIGROUP ANNUAL REPORT 2017
For
per
sona
l use
onl
y
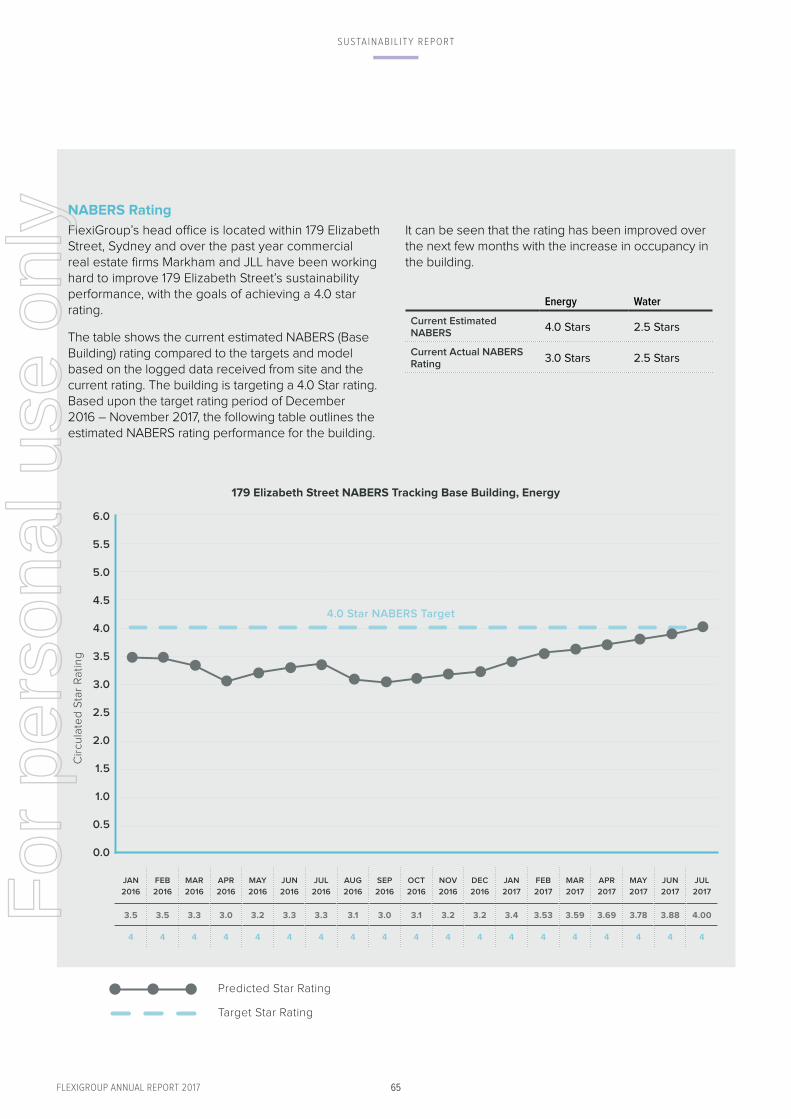
65
SUSTAINABIL ITY REPORT
NABERS Rating
FlexiGroup’s head office is located within 179 Elizabeth Street, Sydney and over the past year commercial real estate firms Markham and JLL have been working hard to improve 179 Elizabeth Street’s sustainability performance, with the goals of achieving a 4.0 star rating.
The table shows the current estimated NABERS (Base Building) rating compared to the targets and model based on the logged data received from site and the current rating. The building is targeting a 4.0 Star rating. Based upon the target rating period of December 2016 – November 2017, the following table outlines the estimated NABERS rating performance for the building.
It can be seen that the rating has been improved over the next few months with the increase in occupancy in the building.
Energy Water
Current Estimated NABERS
4.0 Stars 2.5 Stars
Current Actual NABERS Rating
3.0 Stars 2.5 Stars
179 Elizabeth Street NABERS Tracking Base Building, Energy
Predicted Star Rating
Target Star Rating
JAN
2016
FEB
2016
MAR
2016
APR
2016
MAY
2016
JUN
2016
JUL
2016
AUG
2016
SEP
2016
OCT
2016
NOV
2016
DEC
2016
JAN
2017
FEB
2017
MAR
2017
APR
2017
MAY
2017
JUN
2017
JUL
2017
3.5 3.5 3.3 3.0 3.2 3.3 3.3 3.1 3.0 3.1 3.2 3.2 3.4 3.53 3.59 3.69 3.78 3.88 4.00
4 4 4 4 4 4 4 4 4 4 4 4 4 4 4 4 4 4 4
6.0
5.5
5.0
4.5
4.0
3.5
3.0
2.5
2.0
1.5
1.0
0.5
0.0
Cir
cu
late
d S
tar
Ra
tin
g
4.0 Star NABERS Target
65FLEXIGROUP ANNUAL REPORT 2017
For
per
sona
l use
onl
y
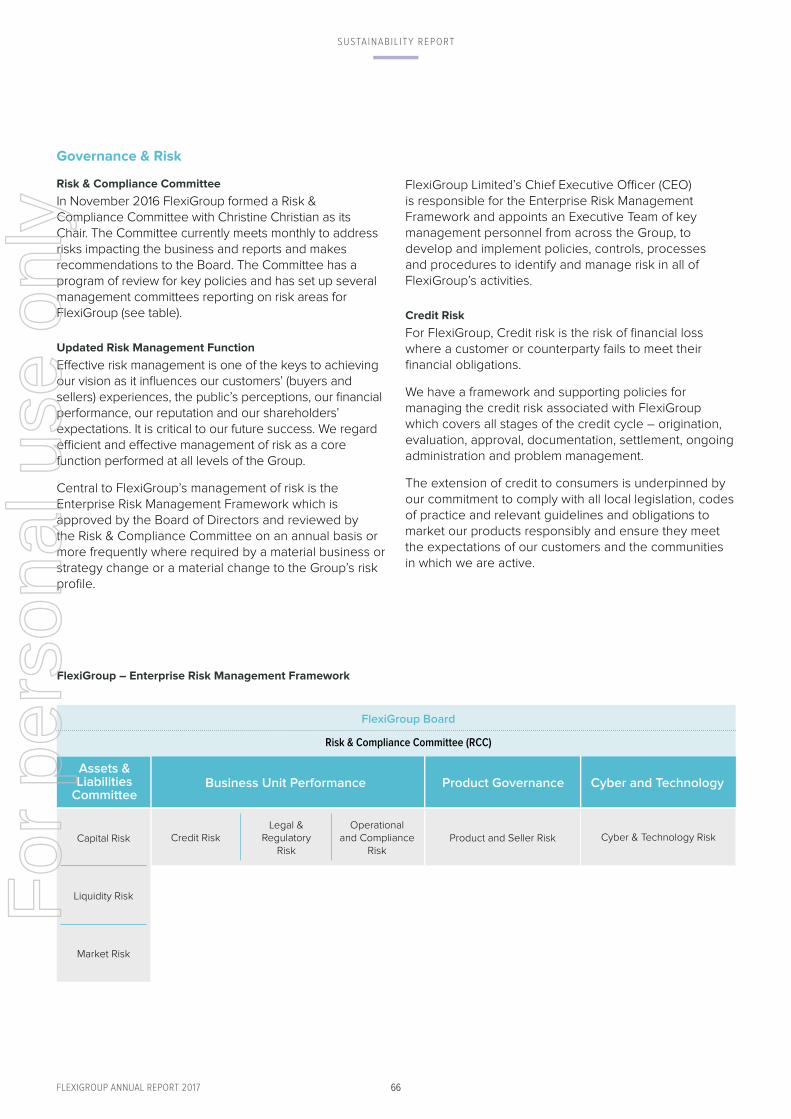
66
Governance & Risk
Risk & Compliance Committee
In November 2016 FlexiGroup formed a Risk & Compliance Committee with Christine Christian as its Chair. The Committee currently meets monthly to address risks impacting the business and reports and makes recommendations to the Board. The Committee has a program of review for key policies and has set up several management committees reporting on risk areas for FlexiGroup (see table).
Updated Risk Management Function
Effective risk management is one of the keys to achieving our vision as it influences our customers’ (buyers and sellers) experiences, the public’s perceptions, our financial performance, our reputation and our shareholders’ expectations. It is critical to our future success. We regard efficient and effective management of risk as a core function performed at all levels of the Group.
Central to FlexiGroup’s management of risk is the Enterprise Risk Management Framework which is approved by the Board of Directors and reviewed by the Risk & Compliance Committee on an annual basis or more frequently where required by a material business or strategy change or a material change to the Group’s risk profile.
FlexiGroup Limited’s Chief Executive Officer (CEO) is responsible for the Enterprise Risk Management Framework and appoints an Executive Team of key management personnel from across the Group, to develop and implement policies, controls, processes and procedures to identify and manage risk in all of FlexiGroup’s activities.
Credit Risk
For FlexiGroup, Credit risk is the risk of financial loss where a customer or counterparty fails to meet their financial obligations.
We have a framework and supporting policies for managing the credit risk associated with FlexiGroup which covers all stages of the credit cycle – origination, evaluation, approval, documentation, settlement, ongoing administration and problem management.
The extension of credit to consumers is underpinned by our commitment to comply with all local legislation, codes of practice and relevant guidelines and obligations to market our products responsibly and ensure they meet the expectations of our customers and the communities in which we are active.
Capital Risk Credit Risk Product and Seller Risk Cyber & Technology RiskLegal &
Regulatory Risk
Operational and Compliance
Risk
Liquidity Risk
Market Risk
Assets & Liabilities
CommitteeProduct Governance Cyber and TechnologyBusiness Unit Performance
FlexiGroup – Enterprise Risk Management Framework
FlexiGroup Board
Risk & Compliance Committee (RCC)
SUSTAINABIL ITY REPORT
66FLEXIGROUP ANNUAL REPORT 2017
For
per
sona
l use
onl
y
67
Liquidity and Market Risk
Liquidity risk is the risk that FlexiGroup will be unable to fund assets and meet obligations as they become due. This risk could potentially arise as a result of:
• an inability to meet both expected and unexpected current and future cash flows and collateral needs without affecting either daily operations or the financial condition of FlexiGroup; and/or
• adverse changes to contractual debt facilities when they mature.
Market risk is the risk of an adverse impact FlexiGroup’s earnings resulting from changes in market factors, such as foreign exchange rates and interest rates.
FlexiGroup has a Treasury management framework and policy that seeks to address key elements of liquidity and market risk. In addition, all liquidity and market risk is reported, discussed and approved at Assets and Liabilities Committee (ALCO), each month.
Operational Risk & Compliance Risk
Operational risk is the risk of loss resulting from FlexiGroup having inadequate internal processes, people and systems, or from external events.
The manner in which operational risk is managed has the potential to positively or negatively impact our customers (buyers and sellers), our employees, our financial performance and our reputation.
Compliance risk is the risk of FlexiGroup receiving legal or regulatory sanction, or suffering financial or reputational loss, arising from our failure to abide by the compliance obligations required of us.
The Operational Risk Management Framework and Compliance Management Framework assist FlexiGroup to achieve its objectives through the effective identification, assessment, measurement, management, monitoring, reporting, control and mitigation of its risks.
The Operational Risk Management Framework defines the organisational and governance structures, roles and responsibilities, principles, policies, processes and systems that we use to manage operational risk.
The Compliance Management Framework sets out the approach of FlexiGroup to managing compliance obligations and mitigating compliance risk, in order to achieve our compliance objective.
These frameworks are revised and enhanced on a continual basis following regular feedback from the Risk & Compliance Committee which oversees the effectiveness of the Operational Risk Management and Compliance Management Frameworks.
SUSTAINABIL ITY REPORT
67FLEXIGROUP ANNUAL REPORT 2017
For
per
sona
l use
onl
y

68FLEXIGROUP ANNUAL REPORT 2017
AUDITOR’S INDEPENDENCE DECLARATION
Auditor’s Independence Declaration
As lead auditor for the audit of FlexiGroup Limited for the year ended 30 June 2017, I declare that to the best of my knowledge and belief, there have been:
(a) no contraventions of the auditor independence requirements of the Corporations Act 2001 in relation to the audit; and
(b) no contraventions of any applicable code of professional conduct in relation to the audit.
This declaration is in respect of FlexiGroup Limited and the entities it controlled during the period.
Rob Spring
Sydney
PartnerPricewaterhouseCoopers
29 September 2017
PricewaterhouseCoopers, ABN 52 780 433 757One International Towers Sydney, Watermans Quay, Barangaroo, GPO BOX 2650, SYDNEY NSW 2001T: +61 2 8266 0000, F: +61 2 8266 9999, www.pwc.com.au
Liability limited by a scheme approved under Professional Standards Legislation.
For
per
sona
l use
onl
y

69FLEXIGROUP ANNUAL REPORT 2017
ANNUAL F INANCIAL STATEMENTS
FlexiGroup Limited and its controlled entities
ANNUAL FINANCIAL STATEMENTS
30 June 2017ABN 75 122 574 583
These financial statements are the consolidated financial statements for the group consisting of FlexiGroup Limited and its subsidiaries. A list of major subsidiaries is included in note 30. The financial statements are presented in the Australian currency.
FlexiGroup Limited is a company limited by shares, incorporated and domiciled in Australia. Its registered office and principal place of business is:
Level 7, 179 Elizabeth Street, Sydney NSW 2000
The financial statements were authorised for issue by the Directors on 29 September 2017. The directors have the power to amend and reissue the financial statements.
Through the use of the internet, we have ensured that our corporate reporting is timely, complete, and available globally at a minimum cost to the Company. All press releases, financial statements and other information are available at our Investor Centre on our website: www.flexigroup.com.auF
or p
erso
nal u
se o
nly
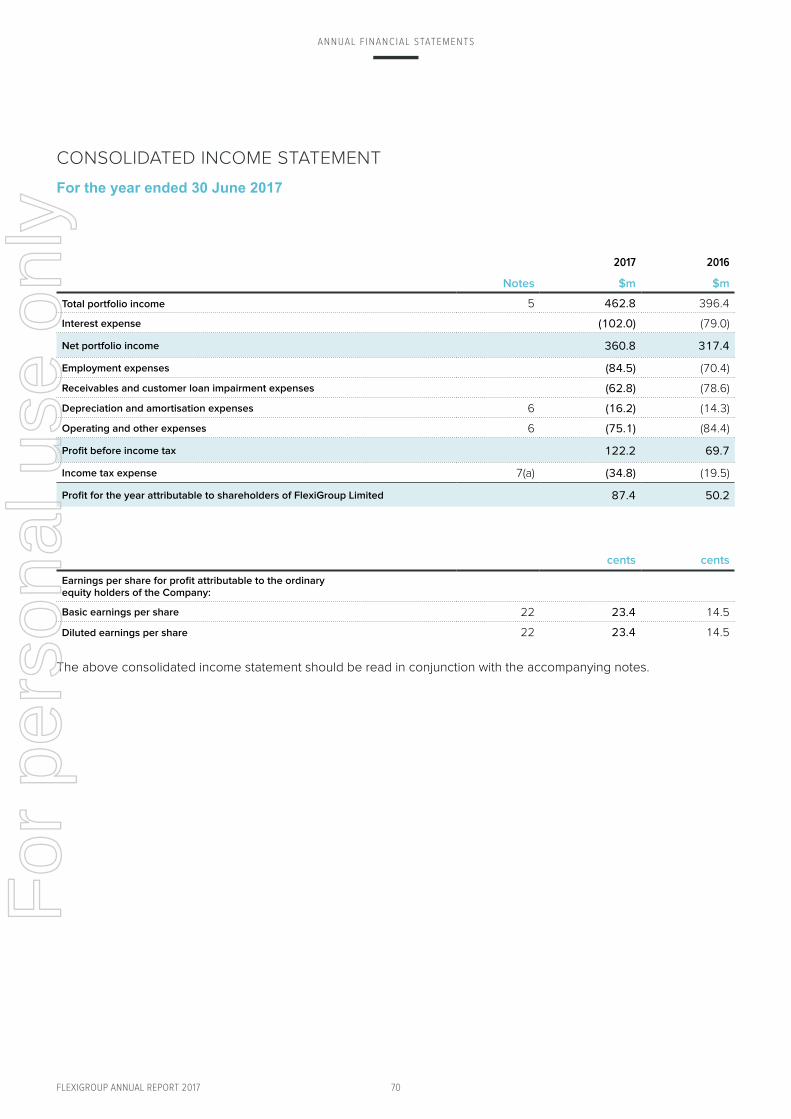
70FLEXIGROUP ANNUAL REPORT 2017
CONSOLIDATED INCOME STATEMENT
For the year ended 30 June 2017
2017 2016
Notes $m $m
Total portfolio income 5 462.8 396.4
Interest expense (102.0) (79.0)
Net portfolio income 360.8 317.4
Employment expenses (84.5) (70.4)
Receivables and customer loan impairment expenses (62.8) (78.6)
Depreciation and amortisation expenses 6 (16.2) (14.3)
Operating and other expenses 6 (75.1) (84.4)
Profit before income tax 122.2 69.7
Income tax expense 7(a) (34.8) (19.5)
Profit for the year attributable to shareholders of FlexiGroup Limited 87.4 50.2
cents cents
Earnings per share for profit attributable to the ordinary equity holders of the Company:
Basic earnings per share 22 23.4 14.5
Diluted earnings per share 22 23.4 14.5
The above consolidated income statement should be read in conjunction with the accompanying notes.
ANNUAL F INANCIAL STATEMENTS
For
per
sona
l use
onl
y

71FLEXIGROUP ANNUAL REPORT 2017
CONSOLIDATED STATEMENT OF COMPREHENSIVE INCOME
For the year ended 30 June 2017
2017 2016
$m $m
Profit for the year 87.4 50.2
OTHER COMPREHENSIVE INCOME
Items that may be reclassified to profit or loss
Exchange differences on translation of foreign operations 4.1 9.0
Changes in the fair value of cash flow hedges, net of tax 5.2 1.4
Other comprehensive income for the year, net of tax 9.3 10.4
Total comprehensive income for the year attributable to shareholders of FlexiGroup Limited 96.7 60.6
The above consolidated statement of comprehensive income should be read in conjunction with the accompanying notes.
ANNUAL F INANCIAL STATEMENTS
For
per
sona
l use
onl
y

72FLEXIGROUP ANNUAL REPORT 2017
CONSOLIDATED STATEMENT OF FINANCIAL POSITION
As at 30 June 2017
2017 2016
Notes $m $m
AssetsCash and cash equivalents 8 167.3 174.4
Inventories 9 4.7 0.9
Receivables 10 628.3 706.8
Customer loans 11 1,537.6 1,372.2
Current tax receivable 3.8 3.3
Plant and equipment 12 8.4 6.1
Goodwill 13 321.4 298.9
Other intangible assets 14 114.4 100.8
Assets of disposal group held for sale 4 - 16.2
Total assets 2,785.9 2,679.6
LiabilitiesPayables 15 50.3 49.1
Borrowings 16 2,007.7 1,948.5
Current tax liabilities 0.5 1.8
Provisions 17 7.9 7.6
Derivative financial instruments 18 12.9 20.0
Deferred and contingent consideration 10.1 8.2
Deferred tax liabilities 7(e) 24.7 25.5
Liabilities of disposal group held for sale 4 - 6.5
Total liabilities 2,114.1 2,067.2
Net assets 671.8 612.4
EquityContributed equity 19 361.2 356.8
Reserves 20(a) 17.0 8.1
Retained earnings 20(b) 293.6 247.5
Total equity 671.8 612.4
The above consolidated statement of financial position should be read in conjunction with the accompanying notes.
ANNUAL F INANCIAL STATEMENTS
For
per
sona
l use
onl
y

73FLEXIGROUP ANNUAL REPORT 2017
CONSOLIDATED STATEMENT OF CHANGES IN EQUITY
For the year ended 30 June 2017
Contributed equity Reserves Retained earnings Total
$m $m $m $m
2016Balance at the beginning of the year 161.9 (3.0) 251.6 410.5
Profit for the year - - 50.2 50.2
Other comprehensive income - 10.4 - 10.4
Total comprehensive income for the year - 10.4 50.2 60.6
Share based payment expense - 1.3 - 1.3
Issue of shares to employees on vesting of performance rights
0.5 (0.5) - -
Cash settlement on vesting of options - (0.1) - (0.1)
Issue of share capital 146.1 - - 146.1
Issue of perpetual notes as consideration for a business combination, net of transaction costs and tax
49.1 - - 49.1
Treasury shares purchased on market (0.8) - - (0.8)
Dividends provided for or paid (note 21) - - (54.3) (54.3)
Balance at the end of the year 356.8 8.1 247.5 612.4
2017Balance at the beginning of the year 356.8 8.1 247.5 612.4
Profit for the year - - 87.4 87.4
Other comprehensive income - 9.3 - 9.3
Total comprehensive income for the year - 9.3 87.4 96.7
Issue of shares on reinvestment of dividend 4.4 - - 4.4
Share based payment income - (0.4) - (0.4)
Dividends provided for or paid (note 21) - - (41.3) (41.3)
Balance at the end of the year 361.2 17.0 293.6 671.8
The above consolidated statement of changes in equity should be read in conjunction with the accompanying notes.
ANNUAL F INANCIAL STATEMENTS
For
per
sona
l use
onl
y

FLEXIGROUP ANNUAL REPORT 2017 74
CONSOLIDATED STATEMENT OF CASH FLOWS
For the year ended 30 June 2017
2017 2016
Notes $m $m
CASH FLOWS FROM OPERATING ACTIVITIES
Interest and fee income received 464.3 402.7
Payment to suppliers and employees (166.9) (131.8)
Interest paid (102.7) (79.1)
Income taxes paid (33.7) (44.4)
Net cash inflow from operating activities 23 161.0 147.4
CASH FLOWS FROM INVESTING ACTIVITIES
Payment for purchase of plant and equipment and software (24.6) (24.2)
Payment for business acquisitions, net of cash acquired (2.4) (185.3)
Payment for deferred consideration relating to business acquisitions (3.5) (1.5)
Payment for equity investment (1.7) (0.3)
Net movement in:
Customer loans (229.2) (108.6)
Receivables due from customers 70.2 50.6
Net cash outflow from investing activities (191.2) (269.3)
CASH FLOWS FROM FINANCING ACTIVITIES
Dividends paid (36.9) (54.3)
Proceeds from equity raising, net of transaction costs - 144.4
Treasury shares purchased on market - (0.8)
Cash settled share based payment - (0.1)
Drawdown of corporate borrowings 135.0 239.0
Repayment of corporate borrowings (150.8) (142.0)
Net movement in:
Non-recourse borrowings 76.3 (25.7)
Loss reserve on non-recourse borrowings (0.4) 4.3
Net cash inflow from financing activities 23.2 164.8
Net (decrease) / increase in cash and cash equivalents (7.0) 42.9
Cash and cash equivalents at the beginning of the year 174.4 130.3
Effects of exchange rate changes on cash and cash equivalents (0.1) 1.2
Cash and cash equivalents at the end of the year 8 167.3 174.4
The above consolidated statement of cash flows should be read in conjunction with the accompanying notes.
ANNUAL F INANCIAL STATEMENTS
For
per
sona
l use
onl
y
75FLEXIGROUP ANNUAL REPORT 2017
CONTENTS OF THE NOTES TO THE CONSOLIDATED FINANCIAL STATEMENTS
NOTES TO THE CONSOLIDATED ANNUAL F INANCIAL STATEMENTS
FLEXIGROUP ANNUAL REPORT 2017 75
1 . SUMMARY OF S IGNIF ICANT ACCOUNTING POL IC IES . . . . . . . . . . . . . . . . . . . . . . . . . . . . . . . . . . . . . . . . . . . . . . . 76
2. CR IT ICAL ACCOUNTING EST IMATES AND JUDGEMENTS . . . . . . . . . . . . . . . . . . . . . . . . . . . . . . . . . . . . . . . . . . 87
3. SEGMENT INFORMATION . . . . . . . . . . . . . . . . . . . . . . . . . . . . . . . . . . . . . . . . . . . . . . . . . . . . . . . . . . . . . . . . . . . . . . . . . . . . . . . . . . . .88
4 . D ISPOSAL GROUP HELD FOR SALE . . . . . . . . . . . . . . . . . . . . . . . . . . . . . . . . . . . . . . . . . . . . . . . . . . . . . . . . . . . . . . . . . . . . . . 91
5. TOTAL PORTFOLIO INCOME . . . . . . . . . . . . . . . . . . . . . . . . . . . . . . . . . . . . . . . . . . . . . . . . . . . . . . . . . . . . . . . . . . . . . . . . . . . . . . . . 91
6. EXPENSES . . . . . . . . . . . . . . . . . . . . . . . . . . . . . . . . . . . . . . . . . . . . . . . . . . . . . . . . . . . . . . . . . . . . . . . . . . . . . . . . . . . . . . . . . . . . . . . . . . . . . . . .92
7. INCOME TAX EXPENSE . . . . . . . . . . . . . . . . . . . . . . . . . . . . . . . . . . . . . . . . . . . . . . . . . . . . . . . . . . . . . . . . . . . . . . . . . . . . . . . . . . . . . . .92
8. CASH AND CASH EQUIVALENTS . . . . . . . . . . . . . . . . . . . . . . . . . . . . . . . . . . . . . . . . . . . . . . . . . . . . . . . . . . . . . . . . . . . . . . . . . . . 94
9. INVENTORIES . . . . . . . . . . . . . . . . . . . . . . . . . . . . . . . . . . . . . . . . . . . . . . . . . . . . . . . . . . . . . . . . . . . . . . . . . . . . . . . . . . . . . . . . . . . . . . . . . . . 94
10. RECEIVABLES . . . . . . . . . . . . . . . . . . . . . . . . . . . . . . . . . . . . . . . . . . . . . . . . . . . . . . . . . . . . . . . . . . . . . . . . . . . . . . . . . . . . . . . . . . . . . . . . . . . 94
1 1 . CUSTOMER LOANS . . . . . . . . . . . . . . . . . . . . . . . . . . . . . . . . . . . . . . . . . . . . . . . . . . . . . . . . . . . . . . . . . . . . . . . . . . . . . . . . . . . . . . . . . . . .95
12 . PLANT AND EQUIPMENT . . . . . . . . . . . . . . . . . . . . . . . . . . . . . . . . . . . . . . . . . . . . . . . . . . . . . . . . . . . . . . . . . . . . . . . . . . . . . . . . . . . . .95
13 . GOODWILL . . . . . . . . . . . . . . . . . . . . . . . . . . . . . . . . . . . . . . . . . . . . . . . . . . . . . . . . . . . . . . . . . . . . . . . . . . . . . . . . . . . . . . . . . . . . . . . . . . . . . . .96
14 . OTHER INTANGIBLE ASSETS . . . . . . . . . . . . . . . . . . . . . . . . . . . . . . . . . . . . . . . . . . . . . . . . . . . . . . . . . . . . . . . . . . . . . . . . . . . . . . . .98
15 . PAYABLES . . . . . . . . . . . . . . . . . . . . . . . . . . . . . . . . . . . . . . . . . . . . . . . . . . . . . . . . . . . . . . . . . . . . . . . . . . . . . . . . . . . . . . . . . . . . . . . . . . . . . . . .99
16 . BORROWINGS . . . . . . . . . . . . . . . . . . . . . . . . . . . . . . . . . . . . . . . . . . . . . . . . . . . . . . . . . . . . . . . . . . . . . . . . . . . . . . . . . . . . . . . . . . . . . . . . . . .99
17. PROVIS IONS . . . . . . . . . . . . . . . . . . . . . . . . . . . . . . . . . . . . . . . . . . . . . . . . . . . . . . . . . . . . . . . . . . . . . . . . . . . . . . . . . . . . . . . . . . . . . . . . . . . . .99
18 . DER IVAT IVE F INANCIAL INSTRUMENTS . . . . . . . . . . . . . . . . . . . . . . . . . . . . . . . . . . . . . . . . . . . . . . . . . . . . . . . . . . . . . . . . .99
19. CONTRIBUTED EQUITY . . . . . . . . . . . . . . . . . . . . . . . . . . . . . . . . . . . . . . . . . . . . . . . . . . . . . . . . . . . . . . . . . . . . . . . . . . . . . . . . . . . . . 100
20. RESERVES AND RETAINED EARNINGS . . . . . . . . . . . . . . . . . . . . . . . . . . . . . . . . . . . . . . . . . . . . . . . . . . . . . . . . . . . . . . . . . . 101
21 . D IV IDENDS . . . . . . . . . . . . . . . . . . . . . . . . . . . . . . . . . . . . . . . . . . . . . . . . . . . . . . . . . . . . . . . . . . . . . . . . . . . . . . . . . . . . . . . . . . . . . . . . . . . . . 103
22. EARNINGS PER SHARE . . . . . . . . . . . . . . . . . . . . . . . . . . . . . . . . . . . . . . . . . . . . . . . . . . . . . . . . . . . . . . . . . . . . . . . . . . . . . . . . . . . . . 104
23. RECONCIL IAT ION OF PROFIT AFTER INCOME TAX TO NET CASH INFLOW FROM OPERAT ING ACT IV IT IES . . . . . . . . . . . . . . . . . . . . . . . . . . . . . . . . . . . . . . . . . . . . . . . . 105
24. SHARE-BASED PAYMENTS . . . . . . . . . . . . . . . . . . . . . . . . . . . . . . . . . . . . . . . . . . . . . . . . . . . . . . . . . . . . . . . . . . . . . . . . . . . . . . . . . 105
25. F INANCIAL R ISK MANAGEMENT . . . . . . . . . . . . . . . . . . . . . . . . . . . . . . . . . . . . . . . . . . . . . . . . . . . . . . . . . . . . . . . . . . . . . . . . 108
26. BUSINESS COMBINAT ION . . . . . . . . . . . . . . . . . . . . . . . . . . . . . . . . . . . . . . . . . . . . . . . . . . . . . . . . . . . . . . . . . . . . . . . . . . . . . . . . . 115
27. LEASE COMMITMENTS . . . . . . . . . . . . . . . . . . . . . . . . . . . . . . . . . . . . . . . . . . . . . . . . . . . . . . . . . . . . . . . . . . . . . . . . . . . . . . . . . . . . . . 116
28. CONTINGENT L IAB IL IT IES . . . . . . . . . . . . . . . . . . . . . . . . . . . . . . . . . . . . . . . . . . . . . . . . . . . . . . . . . . . . . . . . . . . . . . . . . . . . . . . . . . 116
29. INSURANCE . . . . . . . . . . . . . . . . . . . . . . . . . . . . . . . . . . . . . . . . . . . . . . . . . . . . . . . . . . . . . . . . . . . . . . . . . . . . . . . . . . . . . . . . . . . . . . . . . . . . . 116
30. INVESTMENTS IN SUBSID IAR IES AND OTHER ENT IT IES . . . . . . . . . . . . . . . . . . . . . . . . . . . . . . . . . . . . . . . . . 117
31 . KEY MANAGEMENT PERSONNEL D ISCLOSURES . . . . . . . . . . . . . . . . . . . . . . . . . . . . . . . . . . . . . . . . . . . . . . . . . . . . . 119
32. RELATED PARTY TRANSACTIONS . . . . . . . . . . . . . . . . . . . . . . . . . . . . . . . . . . . . . . . . . . . . . . . . . . . . . . . . . . . . . . . . . . . . . . . 120
33. REMUNERATION OF AUDITORS . . . . . . . . . . . . . . . . . . . . . . . . . . . . . . . . . . . . . . . . . . . . . . . . . . . . . . . . . . . . . . . . . . . . . . . . . . 120
34 . CLOSED GROUP . . . . . . . . . . . . . . . . . . . . . . . . . . . . . . . . . . . . . . . . . . . . . . . . . . . . . . . . . . . . . . . . . . . . . . . . . . . . . . . . . . . . . . . . . . . . . . . 121
35. PARENT ENT ITY F INANCIAL INFORMATION . . . . . . . . . . . . . . . . . . . . . . . . . . . . . . . . . . . . . . . . . . . . . . . . . . . . . . . . . . 123
36. SECURIT ISAT ION AND SPECIAL PURPOSE VEHICLES . . . . . . . . . . . . . . . . . . . . . . . . . . . . . . . . . . . . . . . . . . . . 124
37. EVENTS OCCURRING AFTER THE REPORTING PERIOD . . . . . . . . . . . . . . . . . . . . . . . . . . . . . . . . . . . . . . . . . . 124For
per
sona
l use
onl
y

76FLEXIGROUP ANNUAL REPORT 2017
NOTES TO THE CONSOLIDATED ANNUAL F INANCIAL STATEMENTS
1. SUMMARY OF SIGNIFICANT ACCOUNTING POLICIES
This note provides a list of all significant accounting policies adopted in the preparation of these consolidated financial statements. These policies have been consistently applied to all the years presented, unless otherwise stated. The financial statements are for the consolidated entity (the Group) consisting of FlexiGroup Limited and its subsidiaries.
a. Basis of preparationThese general purpose financial statements have been prepared in accordance with Australian Accounting Standards and Interpretations issued by the Australian Accounting Standards Board and the Corporations Act 2001. FlexiGroup Limited is a for-profit entity for the purpose of preparing the financial statements.
(i) Compliance with IFRSThe consolidated financial statements of FlexiGroup Limited also comply with International Financial Reporting Standards (IFRS) as issued by the International Accounting Standards Board (IASB).
(ii) New and amended standards adopted by the GroupThe Group has applied the following standards and amendments for the first time for their annual reporting period commencing 1 July 2016 and they have had no material effect on its financial position or performance:
AASB 2015-1 Amendments to Australian Accounting Standards – Annual Improvements to Australian Accounting Standards 2012-2014 Cycle.
AASB 2015-2 Amendments to Australian Accounting Standards – Disclosure Initiative: Amendments to AASB 101.
(iii) New standards and interpretations not yet adoptedCertain new accounting standards and interpretations have been published that are not mandatory for 30 June 2017 reporting period and have not been early adopted by the Group.
The following new standards to be applied in future periods are set out below and the Group is in the process of determining the implications of these standards:
AASB 9 Financial instruments. This standard is mandatory for adoption by the Group for the year ending 30 June 2019 but is available for early adoption. This standard makes significant changes to the way financial assets are classified for the purpose of determining their measurement basis and also to the amounts relating to fair value changes, which are to be taken directly to equity. This standard also introduces new rules for hedge accounting and a new impairment model for financial assets. The Group has commenced an initial assessment of the classification and measurement of financial assets
and liabilities from the adoption of the standard. Based on a high level assessment, the standard is likely to have a material impact on the Group. A detailed assessment of the financial impact to the Group of adopting AASB 9 will be quantified prior to 30 June 2018. Changes in accounting policies from the adoption of the standard will be applied from 1 July 2018.
AASB 15 Revenue from contracts with customers. This standard is mandatory for adoption by the Group for the year ending 30 June 2018 but is available for early adoption. This new comprehensive standard for revenue recognition replaces AASB 111 Construction contracts, AASB 118 Revenue, AASB Interpretations 13 Customer Loyalty Programmes and AASB Interpretations 18 Transfers of Assets from Customers. The standard requires identification of discrete performance obligations within a transaction and an associated transaction price allocation to these obligations, which occurs when control of the goods or services are transferred to the customer. Revenue received for a contract that includes a variable amount is subject to revised conditions for recognition, whereby it must be highly probable that no significant reversal of the variable component may occur when uncertainties around its measurement are removed. The financial impact to the Group of adopting AASB 15 is not expected to be material.
AASB 16 Leases. This standard is mandatory for adoption by the Group for the year ending 30 June 2020 but is available for early adoption. This new standard sets out a comprehensive model for identifying lease arrangements and the subsequent measurement. A contract contains a lease if it conveys the right to control the use of an identified assets for a period of time. The majority of leases from a lessee perspective are within the scope of the standard and will require the recognition of a ‘right to use’ asset and a related lease liability, being the present value of future lease payments. Other than the leases on the Group’s premises and motor vehicles, there are no other items that are significant as the Group mainly operates as a lessor. The financial impact to the Group of adopting AASB 16 will be quantified by the Group for the year ending 30 June 2019.
For
per
sona
l use
onl
y

FLEXIGROUP ANNUAL REPORT 2017 77
NOTES TO THE CONSOLIDATED ANNUAL F INANCIAL STATEMENTS
(iv) DisclosureSome disclosures in the income statement, statement of financial position, statement of cash flows and notes to the financial statements for comparatives have been reclassified to be consistent with current period disclosures. The statement of financial position has been prepared in order of liquidity, including the comparatives.
(v) Historical cost conventionThese financial statements have been prepared under the historical cost convention, as modified by the revaluation of financial assets and liabilities (including derivative instruments) at fair value.
b. Principles of consolidation
(i) SubsidiariesThe consolidated financial statements incorporate the assets and liabilities of all subsidiaries of FlexiGroup Limited (“Company” or “parent entity”) as at 30 June 2017 and the results of all the subsidiaries for the year then ended. FlexiGroup Limited and its subsidiaries together are referred to in these financial statements as the Group or the consolidated entity.
Subsidiaries are all entities (including special purpose entities) over which the Group has control. The Group controls an entity when the Group is exposed to, or has rights to, variable returns from its involvement with the entity and has the ability to affect those returns through its power to direct the activities of the entity. Subsidiaries are fully consolidated from the date on which control is transferred to the Group. They are deconsolidated from the date that control ceases.
The acquisition method of accounting is used to account for the acquisition of subsidiaries by the Group (refer to note 1(h)).
Intercompany transactions, balances and unrealised gains on transactions between group companies are eliminated. Unrealised losses are also eliminated unless the transaction provides evidence of the impairment of the asset transferred. Accounting policies of subsidiaries have been changed where necessary to ensure consistency with the policies adopted by the Group.
(ii) Investment in associatesAn associate is an entity over which the Group has significant influence, but not control. In the consolidated financial report, it is equity accounted. It is initially recorded at cost and adjusted for the Group’s share of the associate’s post acquisition profits or losses and other comprehensive income, less any dividends received.
The carrying amount of equity accounted investments is tested for impairment in accordance with the policy described in note 1(t).
(iii) Employee Share TrustThe consolidated entity utilises a trust to administer the consolidated entity’s employee share scheme. The trust is consolidated into the consolidated entity.
c. Segment reportingOperating segments are reported in a manner consistent with the internal reporting provided to the chief operating decision maker. The chief operating decision maker, who is responsible for allocating resources and assessing performance of the operating segments, has been identified as the Chief Executive Officer. Operating segments are described in Note 3.
d. Foreign currency translation
(i) Functional and presentation currencyItems included in the financial statements of each of the Group’s entities are measured using the currency of the primary economic environment in which the entity operates (‘’the functional currency”). The consolidated financial statements are presented in Australian dollars, which is FlexiGroup Limited’s functional and presentation currency.
(ii) Transactions and balancesForeign currency transactions are translated into the functional currency using average exchange rates for the respective month. Foreign exchange gains and losses resulting from the settlement of such transactions and from the translation of monetary assets and liabilities denominated in foreign currencies at year end exchange rates are generally recognised in profit or loss. They are deferred in equity as qualifying cash flow hedges and qualifying net investment hedges or are attributable to part of the net investments in foreign operations.
Foreign exchange gains and losses are presented in the income statement on a net basis within other income or other expenses.
Non-monetary items that are measured at fair value in a foreign currency are translated using the exchange rates at the date when the fair value was determined. Translation differences on assets and liabilities carried at fair value are reported as part of the fair value gain or loss. Non-monetary items that are measured based on historical cost in a foreign currency are translated using the spot exchange rate at the date of the transaction.
For
per
sona
l use
onl
y

78FLEXIGROUP ANNUAL REPORT 2017
(iii) Group companiesThe results and financial position of all group entities (none of which has the currency of a hyperinflationary economy) that have a functional currency different from the presentation currency are translated into the presentation currency as follows:
• assets and liabilities for each balance sheet presented are translated at the closing rate at the date of the balance sheet,
• income and expenses for each income statement and statement of comprehensive income are translated at average exchange rates for the respective month (unless this is not a reasonable approximation of the cumulative effect of the rates prevailing on the transaction dates, in which case income and expenses are translated at the dates of the transactions), and
• all resulting exchange differences are recognised in other comprehensive income.
On consolidation, exchange differences arising from the translation of any net investment in foreign entities, and of borrowings and other financial instruments designated as hedges of such investments, are recognised in other comprehensive income. When a foreign operation is sold or any borrowings forming part of the net investment are repaid, a proportionate share of such exchange difference is recognised in the income statement, as part of the gain or loss on sale.
Goodwill and fair value adjustments arising on the acquisition of a foreign operation are treated as assets and liabilities of the foreign entities and as a result are expressed in the functional currency of the foreign operation and translated at the closing rate.
e. Revenue recognitionRevenue is measured at the fair value of the consideration received or receivable. Amounts disclosed as revenue are net of returns, trade allowances, rebates and amounts collected on behalf of third parties.
The Group recognises revenue when the amount of revenue can be reliably measured, it is probable that future economic benefits will flow to the entity and specific criteria have been met for each of the Group’s activities as described below. The Group bases its estimates on historical results, taking into consideration the type of customer, the type of transaction and the specifics of each arrangement.
Revenue is recognised for the major business activities as follows:
(i) Gross interest and finance lease income
FINANCE LEASE INTEREST INCOME
Finance lease interest income is recognised by applying discount rates implicit in the leases to lease balances receivable at the beginning of each payment period. Initial direct costs incurred in the origination of leases are included as part of receivables in the balance sheet and forms part of the effective interest rate calculation.
Secondary lease income, including rental income on extended rental assets, is recognised on an accruals basis. Proceeds from the sale of rental assets are recognised upon disposal of the relevant assets.
INTEREST INCOME ON CUSTOMER LOANS
Interest income on loans is recognised in the income statement using the effective interest method. The effective interest method is a method of calculating the amortised cost of a financial asset and of allocation of the interest income over the relevant period. The effective interest rate is the rate that exactly discounts estimated future cash payments or receipts through the expected life of the financial instrument or, when appropriate, a shorter period to the net carrying amount of the financial asset or financial liability. When calculating the effective interest rate, the Group estimates cash flows considering all contractual terms of the financial instrument but does not consider future credit losses.
(ii) Interest incomeInterest income on bank and loss reserve balances is recognised using an effective interest method.
(iii) Other portfolio incomeRevenue from sale of goods includes revenue from sale of equipment, parts and accessories. The revenue is recognised on delivery of goods sold.
EQUIPMENT PROTECTION PLAN REVENUE
The Group operates an equipment protection and debt waiver plan entitled Protect Plan. Protect Plan revenue is recognised on an accruals basis. A provision for outstanding expected claims is recognised in the balance sheet for the cost of Protect Plan claims which have been incurred at year end, but have not yet been notified to the Group, or which have been notified to the Group but not yet paid.
CHEQUE GUARANTEE REVENUE
Revenue is recognised when the service associated with the guarantee has been provided on an accruals basis. All monthly fees are recognised in revenue in the month to which they relate.
NOTES TO THE CONSOLIDATED ANNUAL F INANCIAL STATEMENTS
For
per
sona
l use
onl
y

79FLEXIGROUP ANNUAL REPORT 2017
PREMIUM REVENUE
Premium revenue includes amounts charged to the insured party but excludes GST and other amounts collected on behalf of third parties.
Premium revenue is recognised in the income statement when it has been earned. The unearned portion of premium revenue is recognised as an unearned premium liability on the balance sheet.
GENERAL INSURANCE ACQUISITION COSTS
Acquisition costs incurred in obtaining general insurance contracts are deferred and recognised as assets where they can be reliably measured and where it is probable that they will give rise to premium revenue that will be recognised in the income statement in subsequent reporting periods.
Deferred acquisition costs are amortised systematically in accordance with the expected pattern of the incidence of risk under the general insurance contracts to which they relate. The pattern of amortisation corresponds to the earning pattern of the corresponding premium revenue.
(iv) Sale of goodsRevenue from sale of goods includes revenue from sale of equipment, parts and accessories. The revenue is recognised on delivery of goods sold.
f. Insurance
(i) Assets backing general insurance liabilitiesAs part of its investment strategy the Group actively manages its money market deposits to ensure that sufficient liquid funds are available to meet the expected pattern of future cash flows arising from general insurance liabilities. The Group has determined that its money market deposits are held to back general insurance liabilities. These liabilities are stated at amortised costs using the effective interest rate method and is accounted for in the receivables financial statement line item on the balance sheet.
(ii) Outstanding claims liabilityThe liability for outstanding claims is measured as the central estimate of the present value of expected future payments against claims incurred at the balance date under general insurance contracts issued by the Group, with an additional risk margin to allow for the inherent uncertainty in the central estimate.
The expected future payments include those in relation to claims reported but not yet paid; claims incurred but not reported (IBNR), claims incurred but not enough reported (IBNER) and anticipated claims handling costs.
Claims handling costs include costs that can be associated directly with individual claims, such as legal and other professional fees, and costs that can be indirectly associated with individual claims, such as claims administration costs.
The expected future payments are discounted to present value using a risk free rate.
The outstanding claims liability has been determined using the Bornhuetter-Fergusson (incurred claims) methodology (an actuarial method). It has been assumed that future incurred claims patterns for each group of business will continue to follow observed historic patterns.
g. Income taxThe income tax expense or revenue for the period is the tax payable on the current period’s taxable income based on the applicable income tax rate for each jurisdiction adjusted by changes in deferred tax assets and liabilities attributable to temporary differences and to unused tax losses.
The current income tax charge is calculated based on the tax laws enacted or substantively enacted at the end of the reporting period in the countries where the Company’s subsidiaries operate and generate taxable income. Management periodically evaluates positions taken in tax returns with respect to situations in which applicable tax regulation is subject to interpretation. It establishes provisions where appropriate based on amounts expected to be paid to the tax authorities.
Deferred income tax is provided in full, using the liability method, on temporary differences arising between the tax bases of assets and liabilities and their carrying amounts in the consolidated financial statements. However, deferred tax liabilities are not recognised if they arise from the initial recognition of goodwill. Deferred income tax is also not accounted for if it arises from initial recognition of an asset or liability in a transaction other than a business combination that at the time of the transaction affects neither accounting nor taxable profit or loss. Deferred income tax is determined using tax rates (and laws) that have been enacted or substantially enacted by the end of the reporting period and are expected to apply when the related deferred income tax asset is realised or the deferred income tax liability is settled.
Deferred tax assets are recognised for deductible temporary differences and unused tax losses only if it is probable that future taxable amounts will be available to utilise those temporary differences and losses.
Deferred tax liabilities and assets are not recognised for temporary differences between the carrying amount and tax bases of investments in foreign operations where the
NOTES TO THE CONSOLIDATED ANNUAL F INANCIAL STATEMENTS
For
per
sona
l use
onl
y

80FLEXIGROUP ANNUAL REPORT 2017
parent entity is able to control the timing of the reversal of the temporary differences and it is probable that the differences will not reverse in the foreseeable future.
Deferred tax assets and liabilities are offset when there is a legally enforceable right to offset current tax assets and liabilities and when the deferred tax balances relate to the same taxation authority. Current tax assets and liabilities are offset when there is a legally enforceable right to offset and an intention to either settle the liability simultaneously.
Current and deferred tax is recognised in the income statement except to the extent that it relates to items recognised in other comprehensive income or directly in equity. In this case, the tax is also recognised in other comprehensive income or directly in equity respectively.
TAX CONSOLIDATION LEGISLATION
FlexiGroup Limited and its wholly-owned Australian controlled entities have implemented the tax consolidation legislation. As a consequence, these entities are taxed as a single entity and the deferred tax assets and liabilities of these entities are set-off in the consolidated financial statements.
The head entity, FlexiGroup Limited, and the controlled entities in the tax consolidated group account for their own current and deferred tax accounts. These tax amounts are measured as if each entity in the tax consolidation was a stand-alone taxpayer in its own right.
In addition to its own current and deferred tax amounts, FlexiGroup Limited also recognises the current tax liabilities (assets) and the deferred tax assets arising from unused tax losses and unused tax credits assumed from controlled entities in the tax consolidation group.
Assets or liabilities arising under tax funding agreements with the tax consolidated entities are recognised as amounts receivable from or payable to other entities in the Group. Details about the tax funding agreement are disclosed in note 7(f). Any difference between the amounts assumed and amounts receivable or payable under the tax funding agreement are recognised as a contribution to (or distribution from) wholly-owned tax consolidation entities.
h. Business combinations The acquisition method of accounting is used to account for all business combinations, regardless of whether equity instruments or other assets are acquired. The consideration transferred for the acquisition of a subsidiary comprises the fair values of the assets transferred, the liabilities incurred and the equity interests issued by the Group. The consideration transferred also
includes the fair value of any asset or liability resulting
from a contingent consideration arrangement and the fair
value of any pre-existing equity interest in the subsidiary.
Acquisition-related costs are expensed as incurred.
Identifiable assets acquired and liabilities and contingent
liabilities assumed in a business combination are, with
limited exceptions, measured initially at their fair values
at the acquisition date. On an acquisition-by-acquisition
basis, the Group recognises any non-controlling
interest in the acquiree either at fair value or at the
non-controlling interest’s proportionate share of the
acquiree’s net identifiable assets.
The excess of the consideration transferred, the amount
of any non-controlling interest in the acquired entity and
the acquisition-date fair value of any previous equity
interest in the acquiree over the fair value of the Group’s
share of the net identifiable assets acquired is recorded
as goodwill. If those amounts are less than the fair value
of the net identifiable assets of the subsidiary acquired,
and after the measurement of all amounts has been
reviewed, the difference is recognised directly in profit or
loss as a bargain purchase.
Where settlement of any part of cash consideration
is deferred, the amounts payable in the future are
discounted to their present value as at the date of
exchange. The discount rate used is the entity’s
incremental borrowing rate, being the rate at which a
similar borrowing could be obtained from an independent
financier under comparable terms and conditions.
Contingent consideration is classified either as equity
or a financial liability. Amounts classified as a financial
liability are subsequently remeasured to fair value with
changes in fair value recognised in profit or loss.
i. Lease receivables – Group is lessorThe Group has classified its leases as finance leases for
accounting purposes. Under a finance lease, substantially
all the risks and benefits incidental to the ownership
of the leased asset are transferred by the lessor to the
lessees. The Group recognises at the beginning of the
lease term an asset at an amount equal to the aggregate
of the present value (discounted at the interest rate
implicit in the lease) of the minimum lease payments and
an estimate of the value of any unguaranteed residual
value expected to accrue to the benefit of the Group at
the end of the lease term.
NOTES TO THE CONSOLIDATED ANNUAL F INANCIAL STATEMENTS
For
per
sona
l use
onl
y

81FLEXIGROUP ANNUAL REPORT 2017
j. Loan receivablesLoan receivables are non-derivative financial assets with fixed or determinable payments that are not quoted in an active market and that the Group did not intend to sell immediately or in the near term. They arise when the Group provides loans to customers via products such as interest free cards and Certegy Ezi-pay.
Loans and advances were initially measured at fair value plus incremental direct transaction costs, and subsequently measured at their amortised cost using the effective interest method.
k. Provision for doubtful debtsLosses on lease and loan receivables are recognised when they are incurred, which requires the Group to identify objective evidence that the receivable is impaired, and make best estimate of incurred losses inherent in the portfolio. The method for calculating the best estimate of incurred losses depends on the size, type and risk characteristics of the related financing receivable. For the majority of the receivables, the assessment is made collectively at a portfolio level, however individually significant receivables are assessed individually.
The estimate requires consideration of historical loss experience, adjusted for current conditions, and judgements about the probable effects of relevant observable data, including present economic conditions such as delinquency rates, financial health of specific customers and market sectors, and both the current and forecast employment rate. The underlying assumptions, estimates and assessments used to provide for losses are updated periodically to reflect the Group’s view of current conditions, which can result in changes to assumptions. Changes in such estimates can significantly affect the provision for doubtful debts.
l. Other DebtorsOther debtors are recognised initially at fair value and subsequently measured at amortised cost, using the effective interest rate method, less any provision for impairment. Other debtors are generally due for settlement within 30 days. They are included as receivables in the statement of financial position.
m. Leases – used by the GroupLeases of property, plant and equipment where the Group has substantially all the risks and rewards of ownership are classified as finance leases. Finance leases are capitalised at the lease’s inception at the lower of the fair value of the leased property or the present value of the minimum lease payments. The
corresponding rental obligations, net of finance charges, are included in other long-term payables. Each lease payment is allocated between the liability and finance cost. The finance cost is charged to the income statement over the lease period so as to produce a constant periodic rate of interest on the remaining balance of the liability for each period. The property, plant and equipment acquired under finance leases is depreciated over the shorter of the asset’s useful life and the lease term.
Leases in which a significant portion of the risks and rewards of ownership are retained by the lessor are classified as operating leases. Payments made under operating leases (net of any incentives received from the lessor) are charged to the income statement on a straight-line basis over the period of the lease.
In the event of the Group sub-leasing any of its operating leases, the lease income is recognised on a straight-line basis over the lease term.
n. Cash and cash equivalentsFor the purpose of presentation in the statement of cash flows, cash and cash equivalents includes cash on hand, deposits held at call with financial institutions, other short term, highly liquid investments with original maturities of three months or less that are readily convertible to known
amounts of cash.
o. InvestmentsThe Group classifies its investments in the following categories:
• financial assets at fair value through profit or loss,
• loans and receivables,
• held-to-maturity investments, and
• available-for-sale financial assets.
The classification depends on the purpose for which the investments were acquired. Management determines the classification of its investments at initial recognition and, in the case of assets classified as held-to-maturity, re-evaluates this designation at the end of each reporting period.
(i) Financial assets at fair value through profit or lossFinancial assets at fair value through profit or loss are financial assets held for trading which are acquired principally for the purpose of selling in the short term with the intention of making a profit. Derivatives are also categorised as held for trading unless they are designated as hedges.
NOTES TO THE CONSOLIDATED ANNUAL F INANCIAL STATEMENTS
For
per
sona
l use
onl
y
82FLEXIGROUP ANNUAL REPORT 2017
The Group had no assets in this category at 30 June 2017 (2016: $nil).
(ii) Loans and receivablesLoans and receivables are non-derivative financial assets with fixed or determinable payments that are not quoted in an active market. They arise when the Group provides money, goods or services directly to a debtor with no intention of selling the receivables.
The Group’s use of this class of asset is consistent with all other group of assets.
(iii) Held-to-maturity investmentsHeld-to-maturity investments are non-derivative financial assets quoted in an active market with fixed or determinable payments and fixed maturities that the Group’s management has the positive intention and ability to hold to maturity. If the Group were to sell other than an insignificant amount of held-to maturity financial assets, the whole category would be tainted and reclassified as available-for-sale.
The Group had no assets in this category at 30 June 2017 (2016: $nil).
(iv) Available-for-sale financial assetsAvailable-for-sale financial assets, comprising principally marketable equity securities, are non-derivatives that are either designated in this category or not classified in any of the other categories. Investments are designated as available-for-sale if they do not have fixed maturities and fixed or determinable payments and management intends to hold them for the medium to long-term.
The Group had no assets in this category at 30 June 2017
(2016: $nil).
p. Derivatives and hedging activitiesDerivatives are initially recognised at fair value on the date a derivative contract is entered into and are subsequently remeasured to their fair value at the end of each reporting period. The accounting for subsequent changes in fair value depends on whether the derivative is designated as a hedging instrument, and if so, the nature of the item being hedged.
The Group designates all derivatives held as at 30 June 2017 and 30 June 2016 as hedges of a particular risk associated with the cash flows of recognised assets and liabilities and highly probable forecast transactions (cash flow hedges) or hedges of a net investment in a foreign operation (net investment hedges).
The Group documents at the inception of the hedging transaction the relationship between hedging instruments
and hedged items, as well as its risk management objective and strategy for undertaking various hedge transactions. The Group also documents its assessment, both at hedge inception and on an ongoing basis, of whether the derivatives that are used in hedging transactions have been and will continue to be highly effective in offsetting changes in fair values or cash flows of hedged items.
The fair values of derivative financial instruments used for hedging purposes are disclosed in note 18. Movements in the hedging reserve in shareholders’ equity are shown in note 20(a).
The effective portion of changes in the fair value of derivatives that are designated and qualify as cash flow hedges is recognised in other comprehensive income and accumulated in reserves in equity. The gain or loss relating to the ineffective portion is recognised immediately in profit or loss within other income or other expense.
Amounts accumulated in equity are reclassified to profit or loss in the periods when the hedged item affects profit or loss (for instance when the forecast sale that is hedged takes place). The gain or loss relating to the effective portion of interest rate swaps hedging variable rate borrowings is recognised in profit or loss within interest expense.
When a hedging instrument expires or is sold or terminated, or when a hedge no longer meets the criteria for hedge accounting, any cumulative gain or loss existing in equity at that time remains in equity and is recognised when the forecast transaction is ultimately recognised in profit or loss. When a forecast transaction is no longer expected to occur, the cumulative gain or loss that was reported in equity is immediately reclassified to profit or loss.
Certain derivative instruments do not qualify for hedge accounting. Changes in the fair value of any derivative instrument that does not qualify for hedge accounting are recognised immediately in profit or loss and are included in other income or other expenses.
Hedges of net investment in foreign operations are accounted for similarly to cash flow hedges. Any gain or loss on the hedging instrument related to the effective portion of the hedge is recognised in other comprehensive income and accumulated in reserves in equity. The gain or loss relating to the ineffective portion is recognised immediately in profit or loss within other income or other expenses. Gains and losses accumulated in equity are reclassified to the income statement when the foreign operation is partly disposed or sold.
NOTES TO THE CONSOLIDATED ANNUAL F INANCIAL STATEMENTS
For
per
sona
l use
onl
y
83FLEXIGROUP ANNUAL REPORT 2017
q. InventoriesInventories are measured at lower of cost and net realisable value. The cost of inventories is based on the first-in, first-out principle. Inventories comprise of office equipment, parts and toners, returned rental equipment and extended rental equipment after the
end of the contractual rental period.
r. Plant and equipmentPlant and equipment is stated at historical cost less depreciation. Historical cost includes expenditure that is directly attributable to the acquisition of the items. Cost may also include transfers from equity of any gains/losses on qualifying cash flow hedges of foreign currency purchases of plant and equipment.
Subsequent costs are included in the asset’s carrying amount or recognised as a separate asset, as appropriate, only when it is probable that future economic benefits associated with the item will flow to the Group and the cost of the item can be measured reliably. The carrying amount of any component accounted for as a separate asset is derecognised when replaced. All repairs and maintenance are charged to the income statement during the reporting period in which they are incurred.
Depreciation is calculated using the straight line or diminishing value method to allocate their cost or revalue amounts, net of their residual values, over their estimated useful lives, as follows:
Assets Method Depreciation Rate
Computers Diminishing value 50%
Plant and equipment
Diminishing value 30%
Motor vehicles Diminishing value 25%
Leasehold improvements
Straight line 20%
Furniture and fittings
Diminishing value 15%
Software Straight line 10% - 33%
The assets’ residual values and useful lives are reviewed, and adjusted if appropriate, at each balance sheet date.
An asset’s carrying amount is written down immediately to its recoverable amount if the asset’s carrying amount is greater than its estimated recoverable amount.
Gains and losses on disposals are determined by comparing proceeds with the carrying amount of the asset disposed. These are included in the income statement.
s. Intangibles
(i) GoodwillGoodwill represents the excess of the cost of an acquisition over the fair value of the Group’s share of the net identifiable assets of the acquired subsidiary at the date of acquisition. Goodwill is not amortised. Instead, goodwill is tested for impairment annually or more frequently if events or changes in circumstances indicate that it might be impaired, and is carried at cost less accumulated impairment losses. Gains and losses on the disposal of an entity include the carrying amount of goodwill relating to the entity sold.
Goodwill is allocated to cash-generating units for the purpose of impairment testing. The allocation is made to those cash-generating units or groups of cash-generating units that are expected to benefit from the business combination in which the goodwill arose, identified according to operating segments (note 3).
(ii) IT development and software Costs incurred on software development projects (relating to the design and testing of new or improved software products) are recognised as intangible assets when it is probable that the project will be a success considering its commercial and technical feasibility and its costs can be measured reliably. The expenditure capitalised comprises all directly attributable costs, including direct labour. Other development expenditures that do not meet these criteria are recognised as an expense as incurred. Capitalised development costs are recorded as an intangible asset and amortised using straight line method from the point at which the asset is ready for use over its useful life from 3 to 10 years.
(iii) Merchant and customer relationshipsMerchant and customer relationships acquired as part of a business combination are recognised separately from goodwill. The assets are measured at fair value at the date of acquisition less accumulated amortisation and impairment losses. Amortisation is calculated based on the timing of the projected cash flows of the relationships.
• Merchant relationships from 3 to 27 years
• Customer relationships from 3 to 15 years
NOTES TO THE CONSOLIDATED ANNUAL F INANCIAL STATEMENTS
For
per
sona
l use
onl
y

84FLEXIGROUP ANNUAL REPORT 2017
t. Impairment of assetsGoodwill and intangible assets that have an indefinite useful life are not subject to amortisation and are tested annually for impairment or more frequently if events or changes in circumstances indicate that they might be impaired. Other assets are tested for impairment whenever events or changes in circumstances indicate that the carrying amount may not be recoverable. An impairment loss is recognised for the amount by which the asset’s carrying amount exceeds its recoverable amount. The recoverable amount is the higher of an asset’s fair value less costs to sell and value in use. For the purpose of assessing impairment, assets are grouped at the lowest levels for which there are separately identifiable cash inflows, which are largely independent of the cash inflows from other assets or groups of assets (cash generating units). Non-financial assets other than goodwill that suffered an impairment are reviewed for possible reversal of the impairment at each reporting period.
u. Assets held for saleNon-financial assets, or disposal groups comprising assets and liabilities, are classified as held-for-sale if it is highly probable that they will be recovered primarily through sale rather than through continuing use.
Such assets, or disposal groups, are generally, measured at the lower of their carrying amount and fair value less costs to sell. Any impairment loss on a disposal group is allocated first to goodwill, and then to the remaining assets and liabilities on a pro-rata basis, except no loss is allocated to inventories, financial assets, deferred tax assets, employee benefit assets, which continue to be measured in accordance with the Group’s other accounting policies. Impairment losses on initial classification as held-for-sale and subsequent gains and losses on remeasurement are recognised in profit or loss.
A discontinued operation is a component of the entity that has been disposed of or is classified as held for sale and that represents a separate major line of business or geographical area of operations, is part of a single co-ordinated plan to dispose of such a line of business or area of operations, or is a subsidiary acquired exclusively with a view to resale. The results of discontinued operations are presented separately in the statement of profit or loss.
v. Trade and other payablesThese amounts represent liabilities for goods and services provided to the Group prior to the end of the financial year that are unpaid. The amounts are unsecured and are usually paid within 30 days of recognition. They are recognised initially at their fair value and subsequently measured at amortised cost using the effective interest method.
w. BorrowingsBorrowings are initially recognised at fair value, net of transaction costs incurred. Borrowings are subsequently measured at amortised cost. Any difference between the proceeds (net of transaction costs) and the redemption amount is recognised in the income statement over the period of the borrowings using the effective interest method. Fees paid on the establishment of loan facilities, which are not an incremental cost relating to the actual draw-down of the facility, are recognised as prepayments and amortised on a straight-line basis over the term of the facility.
Borrowings are removed from the balance sheet when the obligation specified in the contract is discharged, cancelled or expired. The difference between the carrying amount of a financial liability that has been extinguished or transferred to another party and the consideration paid, including any non-cash assets transferred or liabilities assumed, is recognised in other income or other expenses.
Where the terms of a financial liability are renegotiated and the entity issues equity instruments to a creditor to extinguish all or part of the liability (debt for equity swap), a gain or loss is recognised in profit or loss, which is measured as the difference between the carrying amount of the financial liability and the fair value of the equity instruments issued.
x. ProvisionsProvisions for legal claims, service warranties and make good obligations are recognised when the Group has a present legal or constructive obligation as a result of past events, it is probable that an outflow of resources will be required to settle the obligation and the amount has been reliably estimated. Provisions are not recognised for future operating losses.
Where there are a number of similar obligations, the likelihood that an outflow will be required in settlement is determined by considering the class of obligations as a whole. A provision is recognised even if the likelihood of an outflow with respect to any one item included in the same class of obligations may be small.
NOTES TO THE CONSOLIDATED ANNUAL F INANCIAL STATEMENTS
For
per
sona
l use
onl
y

85FLEXIGROUP ANNUAL REPORT 2017
Provisions are measured at the present value of management’s best estimate of the expenditure required to settle the present obligation at the balance sheet date. The discount rate used to determine the present value reflects current market assessments of the time value of money and the risks specific to the liability. The increase in the provision due to the passage of time is recognised as interest expense.
y. Employee benefits
(i) Short-term obligationsLiabilities for wages and salaries, including non-monetary benefits and annual leave expected to be settled within 12 months after the end of the period in which the employees render the related service are recognised in respect of employees’ services up to the end of the reporting period and are measured at the amounts expected to be paid when the liabilities are settled. The liability for annual leave is recognised as a provision in the statement of financial position. All other short-term employee benefit obligations are presented as payables.
(ii) Other long-term employee benefit obligationsThe liability for long service leave and annual leave which is not expected to be settled within 12 months after the end of the period in which the employees render the related service is recognised in the provision for employee benefits and measured as the present value of expected future payments to be made in respect of services provided by employees up to the end of the reporting period using the projected unit credit method.
Consideration is given to expected future wage and salary levels, experience of employee departures and periods of service. Expected future payments are discounted using market yields at the end of the reporting period on government bonds with terms and currencies that match, as closely as possible, the estimated future cash outflows.
(iii) Profit-sharing and bonus plansThe Group recognises a liability and an expense for bonuses and profit-sharing based on a formula that takes into consideration the profit attributable to the Company’s shareholders after certain adjustments. The Group recognises a provision where contractually obliged or where there is a past practice that has created a constructive obligation.
(iv) Share-based paymentsShare-based compensation benefits are provided to certain employees. Information relating to these schemes is set out in note 24.
The fair value of such instruments is recognised as employment expenses in the income statement with a corresponding increase in equity. The fair value is measured at grant date and recognised over the period during which the relevant party becomes unconditionally entitled to the instruments.
Fair values at grant date are independently determined using a binomial tree option pricing methodology that takes into account the exercise price, the term of the options, the impact of dilution, the share price at grant date and expected price volatility of the underlying share, the expected dividend yield and the risk-free interest rate for the term of the options.
The fair value of the instruments granted is adjusted to reflect market vesting conditions, but excludes the impact of any non-market vesting conditions (for example, profitability and sales growth targets). Non-market vesting conditions are included in assumptions about the number and value of instruments that are expected to become exercisable. The share-based payment expense recognised each period takes into account the most recent estimate.
Upon the exercise of instruments, the balance of the share-based payments reserve relating to those instruments is transferred to share capital and the proceeds received (if any), net of any directly attributable transaction costs, are credited to share capital.
z. Contributed equityOrdinary shares and subordinated perpetual notes are classified as equity. Incremental costs directly attributable to the issue of new shares or options are shown in equity as a deduction, net of tax, from the proceeds.
Where any group company purchases the Company’s equity instruments, for example as the result of a share buy-back or a share-based payment plan, the consideration paid, including any directly attributable incremental costs (net of income taxes) is deducted from equity attributable to the owners of FlexiGroup Limited as treasury shares until the shares are cancelled or reissued. Where such ordinary shares are subsequently reissued, any consideration received, net of any directly attributable incremental transaction costs and the related income tax effects, is included in equity attributable to the owners of FlexiGroup Limited.
NOTES TO THE CONSOLIDATED ANNUAL F INANCIAL STATEMENTS
For
per
sona
l use
onl
y

86FLEXIGROUP ANNUAL REPORT 2017
aa. DividendsProvision is made for the amount of any dividend declared, being appropriately authorised and no longer at the discretion of the entity, on or before the end of the financial year but not distributed at balance date.
ab. Earnings per share
(i) Basic earnings per shareBasic earnings per share is calculated by dividing:
• the profit attributable to equity holders of the Company, excluding any costs of servicing equity other than ordinary shares,
• by the weighted average number of ordinary shares outstanding during the financial year, adjusted for bonus elements in ordinary shares issued during the year and excluding treasury shares.
(ii) Diluted earnings per shareDiluted earnings per share adjusts the figures used in the determination of basic earnings per share to take into account:
• the after income tax effect of interest and other financing costs associated with dilutive potential ordinary shares, and
• the weighted average number of additional ordinary shares that would have been outstanding assuming the conversion of all dilutive potential ordinary shares.
ac. Goods and Services Tax (GST)Revenues, expenses and assets are recognised net of the amount of associated GST, unless the GST incurred is not recoverable from the taxation authority. In this case it is recognised as part of the cost of acquisition of the asset or as part of the expense.
Receivables and payables are stated inclusive of the amount of GST receivable or payable. The net amount of GST recoverable from, or payable to, the taxation authority is included with other receivables or payables in the balance sheet.
Cash flows are presented on a gross basis. The GST components of cash flows arising from investing or financing activities, which are recoverable from, or payable, to the taxation authority are presented as operating cash flows.
ad. Rounding of amountsThe Company is of a kind referred to in ASIC Corporations (Rounding in Financial/Directors’ Reports) Instrument 2016/191, relating to the “rounding off” of amounts in the financial statements. Amounts in the financial statements have been rounded off in accordance with that Instrument to the nearest hundred thousand dollars, or in certain cases, to the nearest dollar.
ae. Parent entity financial informationThe financial information for the parent entity, FlexiGroup Limited, disclosed in note 35 has been prepared on the same basis as the consolidated financial statements, except as set out below.
(i) Investments in subsidiariesInvestments in subsidiaries are accounted for at cost less allowance for impairment in the financial statements of FlexiGroup Limited.
(ii) Tax consolidation legislationFlexiGroup Limited and its whollyowned Australian controlled entities have implemented the tax consolidation legislation.
The head entity, FlexiGroup Limited, and the controlled entities in the tax consolidated group account for their own current and deferred tax amounts. These tax amounts are measured as if each entity in the tax consolidated group continues to be a stand-alone taxpayer in its own right.
In addition to its own current and deferred tax amounts, FlexiGroup Limited also recognises the current tax liabilities (or assets) and the deferred tax assets arising from unused tax losses and unused tax credits assumed from controlled entities in the tax consolidated group.
The entities have also entered into a tax funding agreement as detailed in note 7(f).
NOTES TO THE CONSOLIDATED ANNUAL F INANCIAL STATEMENTS
For
per
sona
l use
onl
y

87FLEXIGROUP ANNUAL REPORT 2017
2. CRITICAL ACCOUNTING ESTIMATES AND JUDGEMENTS
The Group makes estimates and assumptions concerning the future. The resulting accounting estimates will, by definition, seldom equal the related actual results. Management also needs to exercise judgement in applying the Group’s accounting policies.
Estimates and judgements are continually evaluated and are based on historical experience and other factors, including expectations of future events that may have a financial impact on the entity and that are believed to be reasonable under the circumstances.
The estimates and judgements that have a significant risk of causing a material adjustment to the carrying amount of assets and liabilities within the next financial year are discussed below.
(i) Estimation of unguaranteed residuals on leasesThe Group estimates the value of unguaranteed lease residuals based on its prior experience for similar contracts. Where applicable, residual values are set at rates ranging between 0% and 20% depending on asset type and the duration of the contract.
(ii) Provision for doubtful debtsThe Group estimates losses incurred on its loans and lease receivables in accordance with the policy set out in note 1(k).
(iii) Assessment of impairment of goodwill and investments in subsidiariesUnder the accounting standards, the Group is required to perform an annual assessment as to whether there has been any impairment of its goodwill. In addition, the Group is required to perform an impairment assessment of other assets in the event it identifies an indicator of impairment. Details of the basis of performance of the assessment and the assumptions made are set out in note 13.
(iv) Acquired intangible assetsUnder the accounting standards, the assets and liabilities of businesses acquired through a business combination are to be measured at their acquisition date fair values. The Group applies judgements in selecting valuation techniques and setting valuation assumptions to determine the acquisition date fair values and to estimate the useful lives of these assets as set out in notes 1 (h), (s) and note 26.
(v) Fair value of disposal group held for saleThe disposal group held for sale is recognised and measured at fair value, being the lower of its value in use or its estimated recoverable amount through sale less costs to sell. The fair value of the disposal group held for sale is disclosed at note 4.
(vi) Fair value of financial instrumentsAll derivatives are recognised and measured at fair value. The derivatives are valued using valuation techniques that utilise observable market inputs. The fair value of financial instruments is included within note 25(e).
(vii) Share based payment expenseIn determining the share based payments expense for the period, the Group makes various assumptions in determining the fair value of the instruments and the probability of non-market vesting conditions being met as set out in note 1(y)(iv) and note 24.
(viii) TaxationJudgement is required in determining provisions held in respect of uncertain tax positions. The Group estimates its tax liabilities based on its understanding of the relevant tax law in each of the countries in which it operates and seeks independent advice where appropriate.
NOTES TO THE CONSOLIDATED ANNUAL F INANCIAL STATEMENTS
For
per
sona
l use
onl
y

88FLEXIGROUP ANNUAL REPORT 2017
3. SEGMENT INFORMATION
(a) Description of segmentsManagement has determined the operating segments based on the reports reviewed by the Chief Executive Officer (CEO) that are used to make strategic decisions. The CEO and the Board, in addition to statutory profit after tax, assess the business on a Cash NPAT basis. Cash NPAT is defined as statutory profit after tax, adjusted for the after tax effect of material one-off items that the CEO and Board believe do not reflect ongoing operations of the Group and amortisation of acquired intangible assets.
The CEO considers the business from a product perspective and has identified six reportable segments; Certegy, Australia Cards (Lombard and Once Credit), Australia Leasing (consisting of FlexiRent, SmartWay, FlexiWay, FlexiCommercial and Think Office Technology), New Zealand Leasing, New Zealand Cards (FlexiCards) and unallocated consisting of net corporate debt interest.
The Enterprise business, which was previously reported as part of Australia Leasing is now disclosed as Other, as the business is in run-off and does not form part of ongoing core operations. Prior year comparatives have been restated to reflect the changes to reportable segments. New business generated from the retained Enterprise merchant base effective 1 July 2016 is now reported in FlexiCommercial and forms part of the Australia Leasing segment.
The Group operates in Australia, New Zealand and Ireland. The operating segments are identified according to the nature of the products and services provided with New Zealand disclosed separately (based on its product offering) and Ireland included within Australia Leasing.
The segment information provided to the CEO for the reportable segments for the year ended 30 June 2017 is as follows:
NOTES TO THE CONSOLIDATED ANNUAL F INANCIAL STATEMENTS
For
per
sona
l use
onl
y

89FLEXIGROUP ANNUAL REPORT 2017
(b) Operating segments
2017CERTEGY
AUSTRALIA CARDS
AUSTRALIA LEASING
NZ LEASING
NZ CARDS
UN- ALLOCATED
SUB-TOTAL CONTINUING OPERATIONS OTHER TOTAL
$m $m $m $m $m $m $m $m $m
Total portfolio income 113.2 57.5 108.0 40.1 125.9 - 444.7 18.1 462.8
Interest expense (19.0) (13.0) (15.8) (7.0) (32.0) (9.3) (96.1) (5.9) (102.0)
Net portfolio income 94.2 44.5 92.2 33.1 93.9 (9.3) 348.6 12.2 360.8
Impairment losses on receivables and customer loans
(19.6) (12.7) (15.2) (0.7) (12.6) - (60.8) (2.0) (62.8)
Amortisation of acquired intangible assets
- (0.6) (2.2) (0.8) (1.4) - (5.0) - (5.0)
Other expenses (26.2) (17.9) (60.8) (16.9) (42.6) - (164.4) (6.4) (170.8)
Profit before income tax
48.4 13.3 14.0 14.7 37.3 (9.3) 118.4 3.8 122.2
Income tax expense (14.5) (4.0) (3.2) (4.3) (10.5) 2.8 (33.7) (1.1) (34.8)
Statutory profit for the year
33.9 9.3 10.8 10.4 26.8 (6.5) 84.7 2.7 87.4
Non-cash adjustments:
Amortisation of acquired intangible assets(1)
- 0.4 1.7 1.1 1.0 - 4.2 - 4.2
Other(2) - - 1.4 - - - 1.4 - 1.4
Cash net profit after tax
33.9 9.7 13.9 11.5 27.8 (6.5) 90.3 2.7 93.0
Total segment assets at 30 June 2017
538.0 513.5 493.7 205.3 912.9 - 2,663.4 122.5 2,785.9
( 1) The acquisition of companies over the years has resulted in the recognition of merchant and customer relationships that are amortised over
their useful lives ranging between 3 and 27 years. The amortisation of acquired intangible assets (excluding IT development and software), is a cash earnings adjustment because it is a non-cash item and does not affect cash distributions available to shareholders.
(2) The share of equity accounted losses is a non-cash, non-recurring item and is treated as an adjustment to the statutory profit for the year. The investment in associate has been fully impaired at 30 June 2017.
NOTES TO THE CONSOLIDATED ANNUAL F INANCIAL STATEMENTS
For
per
sona
l use
onl
y

90FLEXIGROUP ANNUAL REPORT 2017
2016CERTEGY
AUSTRALIA CARDS
AUSTRALIA LEASING
NZ LEASING
NZ CARDS
UN- ALLOCATED
SUB-TOTAL CONTINUING OPERATIONS OTHER TOTAL
$m $m $m $m $m $m $m $m $m
Total portfolio income 116.5 48.8 124.1 38.3 41.7 - 369.4 27.0 396.4
Interest expense (19.2) (9.4) (17.9) (7.3) (12.2) (4.0) (70.0) (9.0) (79.0)
Net portfolio income 97.3 39.4 106.2 31.0 29.5 (4.0) 299.4 18.0 317.4
Impairment losses on receivables and customer loans
(19.9) (8.5) (17.6) (1.2) (4.0) - (51.2) (27.4) (78.6)
Amortisation of acquired intangible assets
- (0.7) (8.1) (0.9) (1.9) - (11.6) - (11.6)
Other expenses (27.1) (10.9) (81.5) (14.6) (13.1) - (147.2) (10.3) (157.5)
Profit before income tax
50.3 19.3 (1.0) 14.3 10.5 (4.0) 89.4 (19.7) 69.7
Income tax expense (15.1) (5.9) 0.8 (3.5) (2.9) 1.2 (25.4) 5.9 (19.5)
Statutory profit for the year
35.2 13.4 (0.2) 10.8 7.6 (2.8) 64.0 (13.8) 50.2
Recurring non-cash adjustments:
Amortisation of acquired intangible assets(1)
- 0.6 1.0 0.8 1.3 - 3.7 - 3.7
One-off non-cash adjustments:
Acquisition and integration costs(2) 0.2 - 4.9 0.1 0.4 - 5.6 - 5.6
Impairment of goodwill and other intangible assets(3)
- - 20.8 - - - 20.8 - 20.8
Receivables provisions(4) - - - - - - - 16.7 16.7
Cash net profit after tax
35.4 14.0 26.5 11.7 9.3 (2.8) 94.1 2.9 97.0
Total segment assets at 30 June 2016
533.4 348.6 460.9 223.8 892.4 - 2,459.1 220.5 2,679.6
(1) The acquisition of companies over the years has resulted in the recognition of merchant and customer relationships that are amortised over their useful lives ranging between 3 and 7 years. The amortisation of acquired intangible assets (excluding IT development and software), is a cash earnings adjustment because it is a non-cash item and does not affect cash distributions available to shareholders.
(2) Acquisition costs incurred in business acquisitions were treated as Cash NPAT adjustments as they are not expected to impact on future earnings of the acquired entities or the Group as whole. These acquisition costs we announced to the market on 27 October 2015 and relate to the acquisition of FlexiCards.
(3) As part of the broader strategic review of the business, some business units were identified as non-core. As a result, the recoverable amounts of the assets of Enterprise, Paymate, Telco (Blink) and some Interest Free Cards systems and Think Office Technology was estimated and this resulted in goodwill and other intangible assets (including capitalised software) of $20.8m being impaired. These impairments are non-cash, non-recurring and have no impact on the Company’s ability to pay dividends and have been adjusted to arrive at a maintainable cash earnings amount.
(4) Due to the Enterprise business being run-off, an additional provision was recognised against major single exposures in the portfolio. Additionally, other one-off provisions were recognised across receivables on the back of historical trends. This is a non-cash, non-recurring item and is treated as an adjustment to the statutory profit for the year.
NOTES TO THE CONSOLIDATED ANNUAL F INANCIAL STATEMENTS
For
per
sona
l use
onl
y

91FLEXIGROUP ANNUAL REPORT 2017
4. DISPOSAL GROUP HELD FOR SALE
In current year, the Group ceased to classify Australian Print Holdings Pty Limited (trading as Think Office Technology “TOT”), a fully owned subsidiary entity within the Australia Leasing segment as a disposal group held for sale. The sale process was abandoned as management now intends to fully integrate the business and extract more value from the business through continued use of the assets.
As such TOT has been reported as part of continuing operations in the current period on the income statement and statement of financial position.
a. Impairment loss relating to the disposal groupThere were no impairments in the current year. In 2016, the $8.5m for write-downs of the disposal group to lower its carrying amount to equal its fair value less costs to sell was included in the income statement. The impairment loss was applied to reduce the carrying amount of goodwill.
b. Assets and liabilities of disposal group held for saleThe assets and liabilities as at 30 June 2017 are recognised at carrying value.
In the prior year, TOT was classified as a disposal group and the assets and liabilities of the disposal group were recognised as held for sale and measured at their fair value less costs to sell. The amounts are presented in the table below:
2017 2016
$m $m
Inventories - 3.9
Receivables - 3.1
Plant and equipment - 3.0
Deferred tax assets - 0.2
Goodwill - 1.9
Other intangible assets - 4.1
Total assets of disposal group held for sale
- 16.2
Payables - 2.5
Provisions - 0.5
Deferred and contingent consideration
- 3.5
Total liabilities of disposal group held for sale
- 6.5
c. Measurement of fair value of the disposal group held for saleThe non-recurring fair value measurement for the disposal group in the prior year was $9.7m, net of deferred and contingent consideration payable of $3.5m. The valuation technique used to arrive at a fair value for the disposal group is the market approach where the market price of comparable assets was used as the basis for the fair value of the disposal group.
5. TOTAL PORTFOLIO INCOME
2017 2016
$m $m
Gross interest and finance lease income
394.3 328.2
Amortisation of initial direct transaction costs (note 1(e)(i))
(26.9) (30.4)
Other portfolio income 85.0 84.7
Sale of goods 4.8 8.8
Interest income 3.3 3.1
Sundry income 2.3 2.0
Total portfolio income 462.8 396.4
NOTES TO THE CONSOLIDATED ANNUAL F INANCIAL STATEMENTS
For
per
sona
l use
onl
y
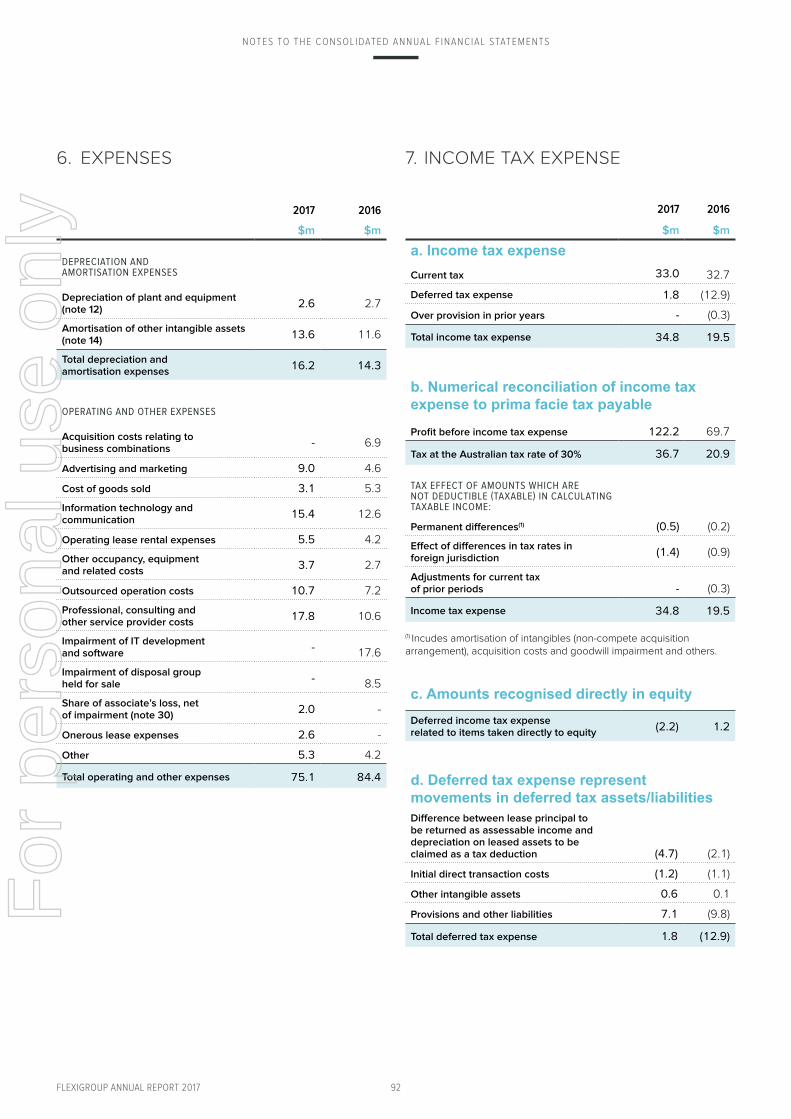
92FLEXIGROUP ANNUAL REPORT 2017
6. EXPENSES
2017 2016
$m $m
DEPRECIATION AND AMORTISATION EXPENSES
Depreciation of plant and equipment (note 12)
2.6 2.7
Amortisation of other intangible assets (note 14)
13.6 11.6
Total depreciation and amortisation expenses
16.2 14.3
OPERATING AND OTHER EXPENSES
Acquisition costs relating to business combinations
- 6.9
Advertising and marketing 9.0 4.6
Cost of goods sold 3.1 5.3
Information technology and communication
15.4 12.6
Operating lease rental expenses 5.5 4.2
Other occupancy, equipment and related costs
3.7 2.7
Outsourced operation costs 10.7 7.2
Professional, consulting and other service provider costs
17.8 10.6
Impairment of IT development and software
- 17.6
Impairment of disposal group held for sale
- 8.5
Share of associate’s loss, net of impairment (note 30)
2.0 -
Onerous lease expenses 2.6 -
Other 5.3 4.2
Total operating and other expenses 75.1 84.4
7. INCOME TAX EXPENSE
2017 2016
$m $m
a. Income tax expenseCurrent tax 33.0 32.7
Deferred tax expense 1.8 (12.9)
Over provision in prior years - (0.3)
Total income tax expense 34.8 19.5
b. Numerical reconciliation of income tax expense to prima facie tax payable
Profit before income tax expense 122.2 69.7
Tax at the Australian tax rate of 30% 36.7 20.9
TAX EFFECT OF AMOUNTS WHICH ARE NOT DEDUCTIBLE (TAXABLE) IN CALCULATING TAXABLE INCOME:
Permanent differences(1) (0.5) (0.2)
Effect of differences in tax rates in foreign jurisdiction
(1.4) (0.9)
Adjustments for current tax of prior periods - (0.3)
Income tax expense 34.8 19.5
(1) Incudes amortisation of intangibles (non-compete acquisition arrangement), acquisition costs and goodwill impairment and others.
c. Amounts recognised directly in equityDeferred income tax expense related to items taken directly to equity
(2.2) 1.2
d. Deferred tax expense represent movements in deferred tax assets/liabilitiesDifference between lease principal to be returned as assessable income and depreciation on leased assets to be claimed as a tax deduction (4.7) (2.1)
Initial direct transaction costs (1.2) (1.1)
Other intangible assets 0.6 0.1
Provisions and other liabilities 7.1 (9.8)
Total deferred tax expense 1.8 (12.9)
NOTES TO THE CONSOLIDATED ANNUAL F INANCIAL STATEMENTS
For
per
sona
l use
onl
y

93FLEXIGROUP ANNUAL REPORT 2017
e. Deferred tax assets and liabilities2017 2016
$m $m
DEFERRED TAX ASSETS
Provisions and other liabilities 31.3 35.3
Carryforward tax losses - 0.8
Reclassified to disposal group held for sale (note 4) - (0.2)
Total deferred tax assets 31.3 35.9
DEFERRED TAX LIABILITIES
Difference between lease principal to be returned as assessable income and depreciation on leased assets to be claimed as a tax deduction 33.1 37.6
Initial direct transaction costs 7.9 9.1
Plant and equipment 0.3 0.7
Other intangible assets 14.7 13.9
Others - 0.1
Total deferred tax liabilities 56.0 61.4
Net deferred tax liabilities 24.7 25.5
Amounts expected to be settled within 12 months (1.4) (3.6)
Amounts expected to be settled after more than 12 months 26.1 29.1
Net deferred tax liabilities 24.7 25.5
f. Carryforward tax lossesAs at 30 June 2016, the Group had carryforward tax losses amounting to $2.8m, which did not have an expiry date. The carryforward tax losses related to the consolidated New Zealand tax group (excluding Fisher & Paykel Finance). The Group believed that it was more likely than not that the carryforward tax losses would be realised against future taxable income and therefore recognised a deferred tax asset of $0.8m. During the year ended 30 June 2017, these carryforward losses were utilized in entirely to offset taxable income in the current year. As such, as at 30 June 2017, the balance of carryforward losses and the associated deferred tax asset were both $Nil.
As at 30 June 2017, there are no other unrecognised tax losses or temporary deductible differences.
g. Tax consolidation legislationFlexiGroup Limited and its wholly-owned Australian controlled entities implemented the tax consolidation legislation from December 2006. The accounting policy on implementation of the legislation is set out in note 1(g).
On adoption of the tax consolidation legislation, the entities in the tax consolidated group entered into a tax sharing-agreement which, in the opinion of the Directors, limits the joint and several liability of the wholly-owned entities in the case of a default by the head entity, FlexiGroup Limited.
The entities have also entered into a tax funding agreement under which the wholly-owned entities fully compensate FlexiGroup Limited for any current tax payable assumed and are compensated by FlexiGroup Limited for any current tax receivable and deferred tax assets relating to the unused tax losses or unused tax credits that are transferred to FlexiGroup Limited under the tax consolidation legislation. The funding amounts are determined by reference to the amounts recognised in the wholly-owned entities’ financial statements.
The amounts receivable/payable under the tax funding agreement is due upon receipt of the funding advice from the head entity, which is issued as soon as practicable after the end of the financial year. The head entity may also require payment of interim funding amounts to assist with its obligations to pay tax instalments. The funding amounts are recognised as intercompany receivables.
NOTES TO THE CONSOLIDATED ANNUAL F INANCIAL STATEMENTS
For
per
sona
l use
onl
y

94FLEXIGROUP ANNUAL REPORT 2017
8. CASH AND CASH EQUIVALENTS
2017 2016
$m $m
Cash at bank and on hand 167.3 174.4
RECONCILIATION TO CASH AT THE END OF THE YEAR
The above figures reconcile to cash at the end of the financial year, as shown in the statement of cash flows, as follows:
Balance as above 167.3 174.4
Balance per statement of cash flows 167.3 174.4
Included in cash at bank are amounts of $125.2 million (2016: $135.3 million) which are held as part of the Group’s funding arrangements and are not available to the Group. The restricted cash balances are distributed to various parties at a future date and are not available to the Group for any other purpose.
9. INVENTORIES
2017 2016
$m $m
Equipment, parts and accessories(1) 2.8 -
Rental equipment 1.9 0.9
Total inventories 4.7 0.9
(1) In 2016, reclassified to the disposal group held for sale in note 4.
10. RECEIVABLES
2017 2016
$m $m
Gross investment in finance lease receivables(1) 721.8 798.7
Guaranteed residuals 5.4 7.4
Unguaranteed residuals 51.3 55.9
Unamortised initial direct transaction costs 30.3 31.6
Unearned future income (176.2) (168.7)
Net investment in finance lease receivables
632.6 724.9
Provision for doubtful debts (24.0) (29.1)
Net investment in finance leases after provision for doubtful debts
608.6 695.8
Loan to associate 1.3 -
Other debtors 18.4 11.0
Total receivables 628.3 706.8
(1) Refer to note 25(c) for disclosure of impaired lease receivables, past due but not impaired lease receivables and the fair value of lease receivables.
MATURITY PROFILE OF NET INVESTMENT IN FINANCE LEASE RECEIVABLES BEFORE PROVISION FOR DOUBTFUL DEBTS:
Due within one year 413.8 437.1
Due after one year but not later than five years 394.0 454.2
Due greater than five years 1.0 2.3
Unearned future income (176.2) (168.7)
Net investment in finance lease receivables
632.6 724.9
MOVEMENT IN PROVISION FOR DOUBTFUL DEBTS:
Carrying amount at beginning of the year 29.1 14.3
Additions through business combinations - -
Provided for during the year, less write-offs previously provided for (5.1) 14.8
Carrying amount at end of the year 24.0 29.1
NOTES TO THE CONSOLIDATED ANNUAL F INANCIAL STATEMENTS
For
per
sona
l use
onl
y

95FLEXIGROUP ANNUAL REPORT 2017
11. CUSTOMER LOANS
2017 2016
$m $m
Gross customer loans (note 25 (c)) 1,655.3 1,482.1
Unearned future income (89.3) (81.6)
Net loan receivables 1,566.0 1,400.5
Provision for doubtful debts (28.4) (28.3)
Net investment in customer loans 1,537.6 1,372.2
MATURITY PROFILE OF NET CUSTOMER LOANS BEFORE PROVISION FOR DOUBTFUL DEBTS:
Due within one year 1,253.4 1,020.9
Due after one year but not later than five years
381.7 449.8
Due greater than five years 20.2 11.4
Unearned future income (89.3) (81.6)
Net loan receivables 1,566.0 1,400.5
MOVEMENT IN PROVISION FOR DOUBTFUL DEBTS
Carrying amount at beginning of the year
28.3 8.6
Additions or fair value adjustments through business combinations
12.8 18.7
Provided for during the year, less write-offs previously provided for
(12.7) 1.0
Carrying amount at end of the year 28.4 28.3
RECONCILIATION OF FAIR VALUE OF CUSTOMER LOANS AND LEASE RECEIVABLES ACQUIRED IN BUSINESS COMBINATIONS
Gross customer loans and receivables
616.4 635.1
Additions or fair value adjustments through business combinations
(12.8) (18.7)
Other fair value adjustments through business combinations
(5.2) -
Fair value (note 26 (b)) 598.4 616.4
12. PLANT AND EQUIPMENT
2017 2016
$m $m
Cost 15.8 14.1
Accumulated depreciation (7.4) (8.0)
Net book amount 8.4 6.1
MOVEMENT IN PLANT AND EQUIPMENT AT NET BOOK AMOUNT:
Balance at the beginning of the year 6.1 5.2
Additions or fair value adjustments through business combinations
(0.2) 1.3
Additions 2.7 5.5
Transfer from/(to) assets in a disposal group held for sale (note 4) 3.0 (3.0)
Disposals (0.6) (0.2)
Depreciation (note 6) (2.6) (2.7)
Balance at the end of the year 8.4 6.1
NOTES TO THE CONSOLIDATED ANNUAL F INANCIAL STATEMENTS
For
per
sona
l use
onl
y
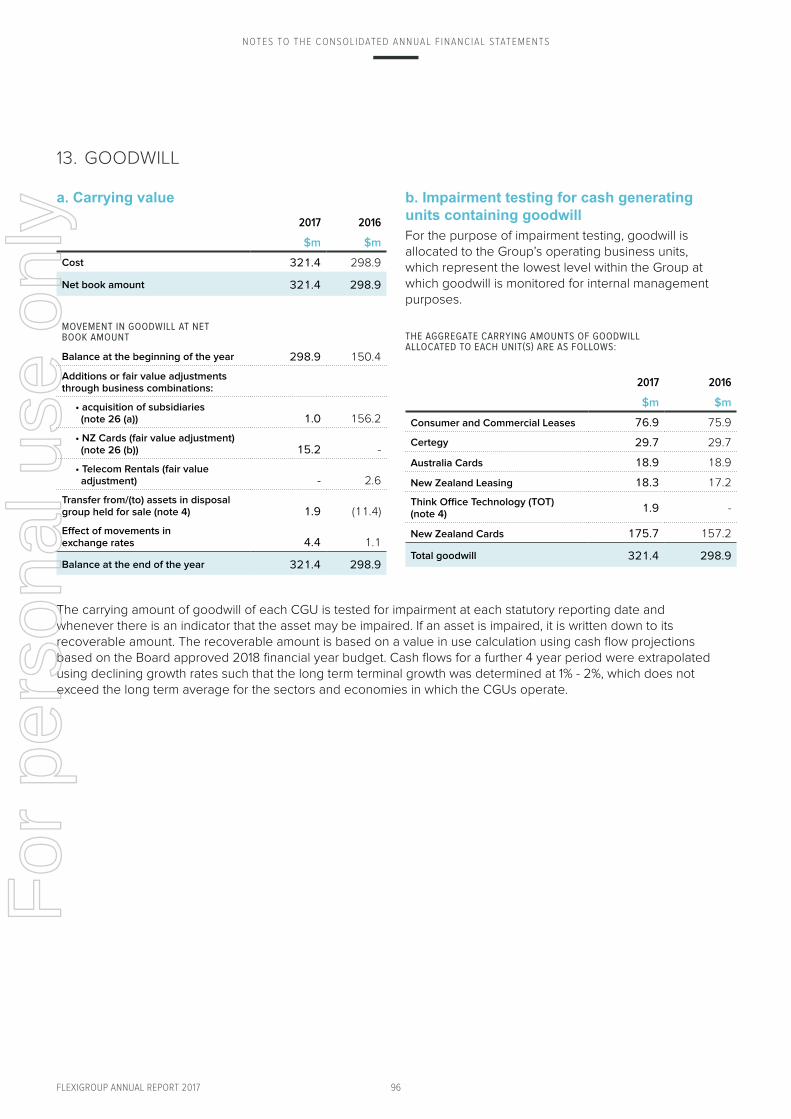
96FLEXIGROUP ANNUAL REPORT 2017
13. GOODWILL
a. Carrying value2017 2016
$m $m
Cost 321.4 298.9
Net book amount 321.4 298.9
MOVEMENT IN GOODWILL AT NET BOOK AMOUNT
Balance at the beginning of the year 298.9 150.4
Additions or fair value adjustments through business combinations:
• acquisition of subsidiaries (note 26 (a)) 1.0 156.2
• NZ Cards (fair value adjustment) (note 26 (b)) 15.2 -
• Telecom Rentals (fair value adjustment) - 2.6
Transfer from/(to) assets in disposal group held for sale (note 4) 1.9 (11.4)
Effect of movements in exchange rates 4.4 1.1
Balance at the end of the year 321.4 298.9
b. Impairment testing for cash generating units containing goodwillFor the purpose of impairment testing, goodwill is allocated to the Group’s operating business units, which represent the lowest level within the Group at which goodwill is monitored for internal management purposes.
THE AGGREGATE CARRYING AMOUNTS OF GOODWILL ALLOCATED TO EACH UNIT(S) ARE AS FOLLOWS:
2017 2016
$m $m
Consumer and Commercial Leases 76.9 75.9
Certegy 29.7 29.7
Australia Cards 18.9 18.9
New Zealand Leasing 18.3 17.2
Think Office Technology (TOT) (note 4)
1.9 -
New Zealand Cards 175.7 157.2
Total goodwill 321.4 298.9
NOTES TO THE CONSOLIDATED ANNUAL F INANCIAL STATEMENTS
The carrying amount of goodwill of each CGU is tested for impairment at each statutory reporting date and whenever there is an indicator that the asset may be impaired. If an asset is impaired, it is written down to its recoverable amount. The recoverable amount is based on a value in use calculation using cash flow projections based on the Board approved 2018 financial year budget. Cash flows for a further 4 year period were extrapolated using declining growth rates such that the long term terminal growth was determined at 1% - 2%, which does not exceed the long term average for the sectors and economies in which the CGUs operate.
For
per
sona
l use
onl
y

97FLEXIGROUP ANNUAL REPORT 2017
The key assumptions used in determining value in use for 30 June 2017 are:
Assumption How determined
Forecast revenues and expenses
Forecast revenues and expenses beyond the 2018 financial year budget period have been extrapolated using declining growth rates such that the long-term terminal growth rates are as follows:
• Consumer and Commercial Leases – 1.5% (2016: 2.0%)
• Certegy – 2.0% (2016: 3.0%)
• Australia Cards – 2.0% (2016: 3.0%)
• New Zealand Leasing – 2.0% (2016: 3.0%)
• New Zealand Cards – 2.0% (2016: 3.0%)
• TOT – 2.0% (2016: n/a)
Long-term growth rate
The above long-term growth rate for each of the CGUs does not exceed the long-term average growth rate for the sector / industry in which the CGU operates.
Cost of Equity Capital
The discount rate applied to the cash flows of each CGU is based on the risk free rate for ten year Commonwealth Government bonds, adjusted for a risk premium to reflect both the increased risk of investing in equities and the risk of the specific group operating company. In making this adjustment, inputs required are the equity markets risk premium (that is the required increased return required over and above a risk free rate by an investor who is investing in the market as a whole) and the risk adjustment, beta, applied to reflect the risk of the specific group operating company relative to the market as a whole, giving rise to the CGU specific Cost of Equity Capital.
Geared cash flows are used to calculate recoverable amounts for all CGUs, other than Think Office Technology, given that debt and interest underpin the CGUs operations.
Weighted Average Cost of Capital (WACC)
For Think Office Technology CGU, ungeared cashflows are used hence a CGU specific WACC is used to calculate recoverable amounts. WACC is calculated with reference to relative weighting of cost of equity and cost of debt (calculated based on the CGU long term capital structure).
The discount rates used for impairment testing are as follows:
• Consumer and Commercial Leases – 15.3% (2016: 15.6%)
• Certegy – 15.2% (2016: 15.7%)
• Australia Cards – 15.3% (2016: 15.7%)
• New Zealand Leasing – 13.5%% (2016: 13.4%)
• New Zealand Cards – 14.4% (2016: 14.9%)
• TOT – 13.8% (2016: n/a)
NOTES TO THE CONSOLIDATED ANNUAL F INANCIAL STATEMENTS
For
per
sona
l use
onl
y

98FLEXIGROUP ANNUAL REPORT 2017
Sensitivity analysis
The Group has conducted sensitivity analysis of +/- 100 basis point movements on the growth rates and discount rates assumptions above to assess the effect on recoverable amount of changes in the key assumptions.
The Group is satisfied that all the assumptions on which the recoverable amounts are based are fair and reasonable, and that currently, there are no reasonably possible changes to these assumptions that would cause the aggregate carrying amount to exceed the aggregate recoverable amount of any of the Group’s CGUs as at 30 June 2017.
14. OTHER INTANGIBLE ASSETS
IT development & software
Merchant & customer relationships
and other rightsNon-compete
agreements Brand name Total
$m $m $m $m $m
At 1 July 2015 36.6 7.4 0.2 0.4 44.6
Additions 24.9 - - - 24.9
Additions and changes in fair value through business combinations
16.2 46.7 - - 62.9
Impairment(1) (17.6) - - - (17.6)
Intangible assets included in a disposal group classified as held for sale
- (3.7) - (0.4) (4.1)
Amortisation (note 6) (7.0) (4.4) (0.2) - (11.6)
Effect of movements in exchange rates 0.4 1.3 - - 1.7
At 30 June 2016 53.5 47.3 - - 100.8
At 1 July 2016 53.5 47.3 - - 100.8
Additions 22.4 - - - 22.4
Additions and changes in fair value through business combinations
(5.0) 1.5 - 4.1 0.6
Reclass of intangible assets previously included in a disposal group classified as held for sale
- 3.7 - 0.4 4.1
Amortisation (note 6) (8.8) (4.8) - - (13.6)
Effect of movements in exchange rates - 0.1 - - 0.1
At 30 June 2017 62.1 47.8 - 4.5 114.4
(1) Impairment relates to the write down of software costs relating to discontinued and restructured businesses and idle assets.
NOTES TO THE CONSOLIDATED ANNUAL F INANCIAL STATEMENTS
For
per
sona
l use
onl
y

99FLEXIGROUP ANNUAL REPORT 2017
15. PAYABLES
2017 2016
$m $m
Trade payables 50.3 48.6
Other payables - 0.5
Total payables 50.3 49.1
16. BORROWINGS
2017 2016
$m $m
SECURED
Corporate debt 126.2 142.0
Secured loans 1,903.8 1,828.4
Total secured borrowings 2,030.0 1,970.4
Loss reserve (22.3) (21.9)
Total borrowings 2,007.7 1,948.5
2017 2016
$m $m
MATURITY PROFILE OF BORROWINGS, NET OF LOSS RESERVE:
Due within one year 1,200.0 1,017.6
Due after one year 807.7 930.9
Total borrowings 2,007.7 1,948.5
Assets pledged as securityThe loans are secured by rentals and payments receivable in respect of the underlying lease and loan receivable contracts. Under the terms of the funding arrangements, some of the funders retain a part of the gross amount funded as security against credit losses on the underlying leases. This amount is referred to as a ‘loss reserve’ and represents a reduction in the amount borrowed.
Financing arrangementsUnrestricted access was available at balance date to the following lines of credit before loss reserves:
2017 2016
$m $m
Total loan facilities available 2,784.4 2,459.4
Loan facilities used at balance date
(2,030.0) (1,970.4)
Loan facilities unused at balance date
754.4 489.0
17. PROVISIONS
2017 2016
$m $m
Annual leave 3.8 3.5
Long service leave 2.7 2.6
Outstanding claims liability 0.5 0.4
Unearned premium liability 0.2 0.3
Other 0.7 0.8
Total provisions 7.9 7.6
18. DERIVATIVE FINANCIAL INSTRUMENTS
2017 2016
$m $m
Interest rate swaps used for hedging
12.9 20.0
Risk exposures and fair value measurementsInformation about the Group’s exposure to credit risk, foreign exchange and interest rate risk and about the methods and assumptions used in determining fair values is provided in note 25. The maximum exposure to credit risk at the end of the reporting period is the carrying amount of each class of derivative financial liabilities mentioned above.
NOTES TO THE CONSOLIDATED ANNUAL F INANCIAL STATEMENTS
For
per
sona
l use
onl
y

100FLEXIGROUP ANNUAL REPORT 2017
19. CONTRIBUTED EQUITY
a. Share capital2017 2016 2017 2016
Shares Shares $m $m
Ordinary shares – fully paid 374,145,403 372,219,875 312.1 307.7
Subordinated perpetual notes 49,129,075 49,129,075 49.1 49.1
Total share capital 423,274,478 421,348,950 361.2 356.8
b. Movement in ordinary sharesNumber of shares (m) $m
1 July 2015 304.1 161.9
Issue of shares 68.2 150.0
Equity raising costs, net of tax
- (3.9)
Treasury shares acquired on market
(0.3) (0.8)
Issue of shares to employees from treasury shares 0.2 0.5
30 June 2016 372.2 307.7
1 July 2016 372.2 307.7
Issue of shares on reinvestment of dividend
1.9 4.4
30 June 2017 374.1 312.1
Ordinary shares entitle the holder to participate in dividends and the proceeds on winding up of the Company in proportion to the number of and amounts paid on the shares held.
On a show of hands every holder of ordinary shares present at a meeting in persons or by proxy, is entitled to one vote, and upon a poll each share is entitled to one vote. There is no current on market buy back of shares, other than shares purchased by the Share Plan Trust to satisfy vested share based payments.
c. Movement in subordinated perpetual notesNumber of
notes (m) $m
1 July 2015 - -
Issue of subordinated perpetual notes 49.1 49.1
30 June 2016 49.1 49.1
1 July 2016 49.1 49.1
30 June 2017 49.1 49.1
FlexiGroup Limited issued unsecured subordinated perpetual notes as part of the consideration for the acquisition of Fisher & Paykel Finance. The face value of the notes is $49.1m, the A$ equivalent of NZ$55.0m. Interest is payable on the perpetual notes at the sole and absolute discretion of the issuer commencing on 18 March 2018. Interest payable or capitalised is accounted for as a dividend in equity. In the unlikely event that no interest is paid or capitalised on the perpetual notes in any given year, the Group may not pay or declare any ordinary dividends to the ordinary shareholders.
FlexiGroup Limited has the option and discretion to redeem the perpetual notes through the repayment of principal and any capitalised interest, or convert the perpetual notes into 28.5 million ordinary shares. As there is no present obligation to pay any principal amount or any interest, the perpetual notes have been classified as equity. The perpetual notes have no right to share in any surplus assets or profits, ordinary dividends and no voting rights.
d. Performance and sign on incentive rights Information relating to the FlexiGroup Employee Options and Performance Rights Plan, including details of performance and sign on incentive rights exercised and lapsed during the financial year and performance and sign on incentive rights outstanding at the end of the financial year, is set out in note 24.
NOTES TO THE CONSOLIDATED ANNUAL F INANCIAL STATEMENTS
For
per
sona
l use
onl
y

101FLEXIGROUP ANNUAL REPORT 2017
e. Movement in treasury shares
Number of shares (m) $m
1 July 2015 - -
Treasury shares acquired on market 0.3 0.8
Issue of shares to employees from treasury shares
(0.2) (0.5)
30 June 2016 0.1 0.3
1 July 2016 0.1 0.3
30 June 2017 0.1 0.3
Treasury shares are shares in FlexiGroup Limited that are held by the FlexiGroup Tax Deferred Employee Share Plan Trust for the purposes of issuing shares under the FlexiGroup Long Term Incentive Plan (see note 24).
f. Capital risk managementThe Group’s objectives when managing capital are to safeguard its ability to continue as a going concern, so that it can continue to provide returns for shareholders and benefits for other stakeholders and to maintain an optimal capital structure to reduce the cost of capital. Consistent with others in the industry, the Group monitors capital on the basis of its gearing ratio. In order to maintain or adjust its capital structure, the Group considers the issue of new capital, return of capital to shareholders and dividend policy as well as its plans for acquisition and disposal of assets.
20. RESERVES AND RETAINED EARNINGS
2017 2016
$m $m
a. ReservesShare-based payment reserve
1.4 1.8
Foreign currency translation reserve
13.9 9.8
Share capital reserve 0.3 0.3
Cash flow hedge reserve 1.4 (3.8)
Balance at 30 June 17.0 8.1
MOVEMENTS:Share-based payment reserve
Balance at 1 July 1.8 1.1
Transfer to share capital - (0.5)
Share-based payment expense (0.4) 1.3
Other changes - (0.1)
Balance at 30 June 1.4 1.8
MOVEMENTS:Foreign currency translation reserve
Balance at 1 July 9.8 0.8
Other comprehensive income 4.1 9.0
Balance at 30 June 13.9 9.8
MOVEMENTS:Share capital reserve
Balance at 1 July 0.3 0.3
Balance at 30 June 0.3 0.3
MOVEMENTS:Cash flow hedge reserve
Balance at 1 July (3.8) (5.2)
Other comprehensive income 5.2 1.4
Balance at 30 June 1.4 (3.8)
b. Retained earningsMOVEMENTS IN RETAINED PROFITS WERE AS FOLLOWS:
Balance at 1 July 247.5 251.6
Net profit for the year 87.4 50.2
Dividends (note 21) (41.3) (54.3)
Balance at 30 June 293.6 247.5
NOTES TO THE CONSOLIDATED ANNUAL F INANCIAL STATEMENTS
For
per
sona
l use
onl
y
102FLEXIGROUP ANNUAL REPORT 2017
c. Nature and purpose of reserves
(i) Foreign currency translation reserve
Foreign currency translation of the foreign controlled entities is taken to the foreign currency translation reserve as described in note 1(d). The reserve is recognised in profit and loss when the net investment is disposed of.
(ii) Share-based payment reserve
The Share-based payment reserve is used to recognise:
• the fair value of options and rights issued to Directors and employees but not exercised
• the fair value of shares issued to Directors and employees
• other share-based payment transactions
(iii) Cash flow hedge reserve
The hedging reserve is used to record gains or losses on a hedging instrument in a cash flow hedge that are recognised in other comprehensive income as described in note 1(p). Amounts are reclassified to profit or loss when the associated hedge transaction affects profit or loss.
(iv) Share capital reserve
As part of the acquisition of Australian Print Holdings Pty Limited (trading as Think Office Technology), a portion of the purchase consideration is a contingent amount to be settled in equity if performance hurdles are met for the period commencing 1 July 2013 and ending 30 June 2017.
NOTES TO THE CONSOLIDATED ANNUAL F INANCIAL STATEMENTS
For
per
sona
l use
onl
y

103FLEXIGROUP ANNUAL REPORT 2017
21. DIVIDENDS
PARENT ENTITY
2017 2016
$m $m
Final dividends paid2016 final dividend paid on 14 October 2016: 7.25 cents (2015 final dividend paid on 16 October 2015: 9.0 cents) per ordinary share franked to 100%
27.0 27.3
Interim dividends paid2017 interim dividend paid on 13 April 2017: 3.85 cents (2016 interim dividend paid on 15 April 2016: 7.25 cents) per ordinary share franked to 100%:
Cash 9.9 27.0
Share capital reinvestment(2) 4.4 -
Total interim dividends paid 14.3 27.0
Total dividends paid(1) 41.3 54.3
(1) All dividends are franked at a tax rate of 30%.(2) Dividend reinvestment plan was offered at 2% discount on the volume weighted average share price for the 10 trading days commencing
15 March 2017 and ending on 28 March 2017.
Final dividends proposed but not recognised at year end
2017: 3.85 cents (2016: 7.25 cents) per ordinary share franked to 100% 14.4 27.0
Franked dividends
The franked dividends recommended after 30 June 2017 will be franked out of existing franking credits, or out of franking credits arising from the payment of income tax in the year ending 30 June 2017.
CONSOLIDATED PARENT ENTITY
2017 2016 2017 2016
$m $m $m $m
Franking credits available for subsequent financial years based on a tax rate of 30% (2016: 30%)
48.9 37.5 48.9 37.5
The above amounts are calculated from the balance of the franking account as at the end of the reporting period, adjusted for franking credits and debits that will arise from the settlement of liabilities or receivables for income tax and dividends after the end of the year. The consolidated amounts include franking credits that would be available to the parent entity if distributable profits of subsidiaries were paid as dividends.
NOTES TO THE CONSOLIDATED ANNUAL F INANCIAL STATEMENTS
For
per
sona
l use
onl
y

104FLEXIGROUP ANNUAL REPORT 2017
22. EARNINGS PER SHARE
2017 2016
Cents Cents
Earnings per shareTotal basic earnings per share attributable to the ordinary equity holders of the Company 23.4 14.5
Total diluted earnings per share attributable to the ordinary equity holders of the Company
23.4 14.5
2017 2016
$m $m
Reconciliation of earnings used in calculating earnings per sharePROFIT ATTRIBUTABLE TO THE ORDINARY EQUITY SHAREHOLDERS OF THE COMPANY USED IN CALCULATING:
• basic earnings per share 87.4 50.2
• diluted earnings per share 87.4 50.2
2017 2016
Number Number
Weighted average number of ordinary sharesWeighted average number of ordinary shares used in calculation of basic earnings per share 372,631,358 346,353,523
Add: potential ordinary shares considered dilutive - -
Weighted average number of ordinary shares used in calculating diluted earnings per share 372,631,358 346,353,523
Information concerning the classification of securitiesPerformance and sign on incentive rights
Performance and sign on incentive rights granted to employees under the FlexiGroup Long Term Incentive Plan are settled through an on-market share purchase. The performance and sign on incentive rights are not considered to be dilutive. The performance and sign on incentive rights have not been included in the determination of basic and diluted earnings per share. Details relating to the performance and sign on incentive rights are set out in note 24.
NOTES TO THE CONSOLIDATED ANNUAL F INANCIAL STATEMENTS
For
per
sona
l use
onl
y

105FLEXIGROUP ANNUAL REPORT 2017
23. RECONCILIATION OF PROFIT AFTER INCOME TAX TO NET CASH INFLOW FROM OPERATING ACTIVITIES
2017 2016
$m $m
Net profit for the year after tax 87.4 50.2
Receivables and loan impairment expenses 62.8 78.6
Depreciation and amortisation 16.2 14.3
Share of losses from associate 2.0 -
Impairment of goodwill and other intangible assets - 8.5
Loss on write-off of IT development and software - 17.6
Share-based payment (income)/expense (0.4) 1.2
Exchange differences (0.6) (1.2)
Other non-cash movements 0.4 4.6
Net cash inflows from operating activities before changes in operating assets and liabilities
167.8 173.8
CHANGE IN OPERATING ASSETS AND LIABILITIES:
Increase in other receivables (8.7) (0.8)
Increase in current tax receivables (0.5) (3.3)
(Decrease)/increase in payables (0.8) 1.1
Decrease/(increase) in inventories 0.2 (0.6)
Decrease in current tax liabilities (1.3) (8.6)
Increase/(decrease) in net deferred tax liabilities 4.3 (14.2)
Net cash inflows from operating activities 161.0 147.4
24. SHARE-BASED PAYMENTS
(a) Long Term Incentive Plan
The establishment of the FlexiGroup Long Term Incentive Plan (‘LTIP’) was approved by the founding shareholders on 20 November 2006. The LTIP is designed to provide relevant employees with an incentive for future performance, with conditions for the vesting and exercise of options and performance rights and under the LTIP encouraging those Executives to remain with FlexiGroup and contribute to the future performance of the Company. Under the plan, participants are granted either an option or right, which only vests if certain performance standards are met.
The Board may determine which persons will be eligible to participate in the LTIP from time to time. Eligible persons may be invited to apply to participate in the LTIP. The Board may in its discretion accept such applications.
The table below shows options performance and sign on incentive rights granted under the plan:
NOTES TO THE CONSOLIDATED ANNUAL F INANCIAL STATEMENTS
For
per
sona
l use
onl
y

106FLEXIGROUP ANNUAL REPORT 2017
Consolidated and parent entity – 2017
Grant date Expiry dateExercise
price
Balance at start of the
period
Granted during the
period
Exercised during the
period
Forfeited during the
period
Balance at end of the
period
Vested and exercisable at the end of the period
Number Number Number Number Number Number
3/6/11 31/12/16 $0.00 19,375 - - - 19,375* -
3/6/11 31/12/16 $2.11 426,437 - - - 426,437* -
5/8/11 31/12/16 $0.00 12,498 - - - 12,498* -
19/3/12 31/12/16 $2.18 37,500 - - - 37,500* -
23/4/12 31/12/16 $2.27 7,500 - - - 7,500* -
10/8/12 31/3/16 $3.05 571,100 - - - 571,100* -
3/7/14 31/3/16 $0.00 - - - - - -
1/12/14
15/10/18
15/10/19
31/10/20
31/10/21
$0.00 3,166,000 - - (1,354,000) 1,812,000** -
26/11/15
15/10/18
15/10/19
31/10/20
31/10/21
$0.00 1,353,000 - - (587,800) 765,200*** -
22/11/1615/10/18
15/10/19$0.00 - 72,000 - - 72,000 -
Total 5,593,410 72,000 - (1,941,800) 3,723,610 -
Weighted average exercise price**** $0.00 $0.00 $0.00
Consolidated and parent entity – 2016
Grant date Expiry dateExercise
price
Balance at start of the
period
Granted during the
period
Exercised during the
period
Forfeited during the
period
Balance at end of the
period
Vested and exercisable at the end of the period
Number Number Number Number Number Number
3/6/11 31/12/16 $0.00 38,751 - (11,475) (7,901) 19,375* -
3/6/11 31/12/16 $2.11 852,875 - (212,328) (214,110) 426,437* -
5/8/11 31/12/16 $0.00 24,998 - - (12,500) 12,498* -
19/3/12 31/12/16 $2.18 75,000 - (13,500) (24,000) 37,500* -
23/4/12 31/12/16 $2.27 15,000 - (6,750) (750) 7,500* -
10/8/12 31/3/16 $3.05 571,100 - - - 571,100* -
3/7/14 31/3/16 $0.00 140,000 20,000 (160,000) - - -
1/12/14
15/10/18
15/10/19
31/10/20
31/10/21
$0.00 4,720,000 - - (1,554,000) 3,166,000** -
26/11/15
15/10/18
15/10/19
31/10/20
31/10/21
$0.00 - 1,401,000 - (48,000) 1,353,000 -
Total 6,437,724 1,421,000 (404,053) (1,861,261) 5,593,410 -
Weighted average exercise price**** $0.58 $0.00 $0.00
* These instruments are all either TSR performance lapsed or expired and remain in share based payments reserve.** Includes 732,000 (2016: 496,000) performance rights that are TSR lapsed and remain in share based payments reserve.*** Includes 125,200 performance rights that are TSR lapsed and remain in share based payments reserve. **** Excludes the weighted average exercise price of lapsed and expired options.
NOTES TO THE CONSOLIDATED ANNUAL F INANCIAL STATEMENTS
For
per
sona
l use
onl
y

107FLEXIGROUP ANNUAL REPORT 2017
The weighted average share price at the date of exercise of performance and sign on incentive rights exercised during the year ended 30 June 2017 was $nil (2016: $2.58). The weighted average remaining contractual life of performance and sign on incentive rights outstanding at the end of the year was 1.15 years (2016: 2.6 years).
Fair value of sign on incentive rights
For the 2017 financial year, the 72,000 sign on incentive rights that were granted did not have any performance vesting conditions and were subject only to a tenure condition. The valuation was not independently determined due to its simplicity and was determined on the basis of the term of the sign on incentive rights, the share price at grant date and the expected dividend yield.
The inputs for sign on incentive rights granted during the year ended 30 June 2017 included:
(b) Exercise price: nil, sign on incentive rights issued
(c) Grant date: 22 November 2016
(d) Expiry date: various per sign on incentive rights granted, refer table on page 51
(e) Share price at grant date: $2.22
(f) Expected price volatility of the Company’s shares: n/a
(g) Expected dividend yield: 6.5%
(h) Risk-free interest rate: n/a
Shares provided on exercise of performance rights
Nil (2016: Nil) ordinary shares in the Company were issued as a result of the exercise of any remuneration performance and sign on incentive rights. Vested performance and sign on incentive rights are settled through an on market share purchase and do not result in an increase in issued share capital.
(b) Employee share plan
The Employee Share (Taxed Upfront) Plan (“ESP”) is a general employee share plan pursuant to which grants of shares may be offered to employees of FlexiGroup on terms and conditions as determined by the Board from time to time. Nil shares were issued under this plan in 2017.
The Board is responsible for administering the ESP in accordance with the ESP Rules and the terms and conditions of specific grants of shares to participants in the ESAP. The ESP Rules include the following provisions:
Eligibility
The Board may determine which persons will be eligible to be offered the opportunity to participate in the ESP from time to time. The Board may make offers to eligible persons for participation in the ESP.
Terms of offer
The Board has the discretion to determine the specific terms and conditions applying to each offer, provided that:
The terms of the offer do not vary the disposal restrictions imposed on shares under the ESP Rules under which shares acquired under the ESP cannot be transferred, sold or otherwise disposed of until the earlier of:
• The time when the participant is no longer employed by FlexiGroup or by the Company that was the employer of the participant as at the time the shares were acquired, or
• The third anniversary of the date on which the shares were acquired, and
• The offer does not include any provisions for forfeiture of shares acquired under the ESP in any circumstances
Consideration for grant
The Board may determine the price at which the shares will be offered to an employee. Shares may be granted at no cost to the employee or the Board may determine that market value or some other price is appropriate.
Allocation of shares
Shares allocated under the ESP may be existing shares or newly issued shares. Allocated shares must be held in the name of the employee. Any shares that are issued under the ESP will rank equally with those traded on the ASX at the time of issue. A participant under the ESP is entitled to receive distributions/dividends made in respect of, and exercise voting rights attaching to, shares held under the ESP (whether or not the shares are subject to disposal restrictions).
Restrictions on shares
Shares acquired under the ESP will be subject to the disposal restrictions described above. FlexiGroup will implement such arrangements (including a holding lock) as it determines are necessary to enforce this restriction.
Once the restriction is removed, and subject to FlexiGroup’s Share Trading Policy, shares acquired under the ESP may be dealt with freely. Details of FlexiGroup’s Share Trading Policy are in the Corporate Governance Statement.
NOTES TO THE CONSOLIDATED ANNUAL F INANCIAL STATEMENTS
For
per
sona
l use
onl
y

108FLEXIGROUP ANNUAL REPORT 2017
Employee gift offer
There were no employee gift offers in the year ended 30 June 2017 (2016:Nil).
(c) Expenses arising from share-based payment transactions
Total expenses arising from share-based payment transactions recognised during the period as part of employee benefit expense were as follows:
2017 2016
$ $
Performance and sign on incentive rights issued under LTIP (397,000) 1,325,000
25. FINANCIAL RISK MANAGEMENT
OverviewThe Group’s overall risk management program focuses on the unpredictability of financial markets and seeks to minimise potential adverse effects on the financial performance of the Group.
The Group’s activities expose it to a variety of financial risks: market risk (including foreign exchange risk and interest rate risk), credit risk and liquidity risk.
The Group uses derivative financial instruments – interest rate swaps – to hedge certain risk exposures. Derivatives are exclusively used for hedging purposes i.e. not as trading or other speculative instruments. The Group uses different methods to measure different types of risk to which it is exposed. These methods include sensitivity analysis in the case of interest rate and foreign exchange risk, and ageing/credit scorecard analysis for credit risk.
Risk management is primarily carried out by the finance, treasury, credit and risk departments.
NOTES TO THE CONSOLIDATED ANNUAL F INANCIAL STATEMENTS
For
per
sona
l use
onl
y

109FLEXIGROUP ANNUAL REPORT 2017
Market risk Market risk is the risk of an adverse impact on Group earnings resulting from changes in market factors, such as interest rates and foreign exchange rates, commodity prices and equity prices.
(a) Interest rate risk
Interest rate risk results principally from the repricing risk or differences in the repricing characteristics of the Group’s receivable portfolio and borrowings.
The Group’s lease receivables and customer loans consist of:
• fixed rate consumer and commercial instalment lease contracts. The interest rate is fixed for the life of the contract. Lease contracts are typically originated with maturities ranging between one and five years and generally require the customer to make equal monthly payments over the life of the contract. The majority of leases are funded within two weeks of being settled with the rental stream discounted at a fixed rate of interest to determine the borrowing amount.
• an interest free consumer loan portfolio where the payments are fixed for the term of the loan.
• an interest free cards business portfolio where the payments are variable for the term of the loan.
Borrowings to fund the receivables are a mix of fixed rate borrowings and variable rate borrowings where the rates are reset regularly to current market rates. Interest rate risk is managed on these borrowings by entering into interest rate swaps, whereby the Group pays fixed rate and receives floating rate.
The contracts require settlement of net interest receivable or payable monthly. The settlement dates coincide with the dates on which interest is payable on the underlying debt. The contracts are settled on a net basis. The gain or loss from remeasuring the hedging instruments at fair value is recognised in other comprehensive income and deferred in equity in the hedging reserve, to the extent that the hedge is effective. It is reclassified into profit or loss when the hedging relationship ceases. In the year ended 30 June 2017, nil amounts were reclassified into profit or loss (2016 – Nil) and included in interest expenses. There was no material hedge ineffectiveness in the current or prior year.
NOTES TO THE CONSOLIDATED ANNUAL F INANCIAL STATEMENTS
For
per
sona
l use
onl
y

110FLEXIGROUP ANNUAL REPORT 2017
At the end of the reporting period, the Group had the following variable rate borrowings outstanding:
2017 2016
Weighted average interest rate % $m
Weighted average interest rate % $m
Floating rate borrowings 1.80% 1,843.4 2.11% 1,772.5
Interest rate swaps (notional principal amount)
1.76% (1,240.7) 2.06% (1,289.9)
Unhedged variable borrowings
602.7 482.6
Interest rate risk sensitivity analysis
The analysis demonstrates the impact of 100 basis point change in interest rates, with all other variables held constant. A sensitivity level of +/-100 basis point change is determined considering the range of interest rates applicable to the following variable rate financial assets and financial liabilities in the Group:
2017 2016
$m $m
Cash and cash equivalents 167.3 174.4
Loss reserve on borrowings 22.3 21.9
Floating rate borrowings 1,843.4 1,772.5
Interest rate swaps (notional principal amount)
(1,240.7) (1,289.9)
Based on the variable rate financial assets and financial liabilities held at 30 June 2017, if interest rates had changed by, +/- 100 basis point from the year-end rates with all other variables held constant, the impact on the Group’s after-tax profits and equity on above exposures would have been $3.5m lower / $3.3m higher (2016: $1.3m lower / $1.3m higher).
Cash flow hedges
The Group hedges a portion of the variability in future cash flows attributable to the interest rate risk on floating rate borrowings 67% (2016 – 73%) using interest rate swaps.
There were no forecast transactions for which cash flow hedge accounting had to be ceased as a result of the forecast transaction no longer being expected to occur in the current or prior period.
(b) Foreign exchange risk
Foreign exchange risk results from an impact on the Group’s profit after tax and equity from movements in foreign exchange rates.
Changes in value would occur in respect of translating the Group’s capital invested in overseas operations into Australian dollars at reporting date (translation risk).
The Group’s only material exposure to this risk arises from its investment in its New Zealand businesses. The foreign exchange gain or loss on translation of the investment in foreign subsidiaries to Australian dollars at the end of the reporting period is recognised in other comprehensive income and accumulated in the foreign currency translation reserve, in shareholders’ equity.
Due to the expansion of the New Zealand business after the acquisition of Fisher and Paykel Finance, the Group has designated NZ$73.5m of the acquisition corporate debt as a hedging instrument against the net assets of the acquired entity. This creates a natural hedge between the underlying business cash flows and debt. Movements in foreign currency is accounted for in Other Comprehensive Income as a translation reserve in equity to the extent that the hedging relationship remains effective. The reserve will be reclassified to profit and loss on disposal of the hedged entity.
(c) Credit risk
Credit risk is the risk that a contracting party will not complete its obligations under a financial instrument and, as a result, cause the Group to incur a financial loss. The Group has exposure to credit risk on all financial assets included in its balance sheet. The Group’s maximum exposure to credit risk on its financial assets is its carrying amount.
To manage credit risk, the Group has developed a comprehensive credit assessment process. Loans and receivables consist mainly of lease and loan contracts provided to consumer and commercial customers. Credit underwriting typically includes the use of either an application score-card and credit bureau report or a detailed
NOTES TO THE CONSOLIDATED ANNUAL F INANCIAL STATEMENTS
For
per
sona
l use
onl
y
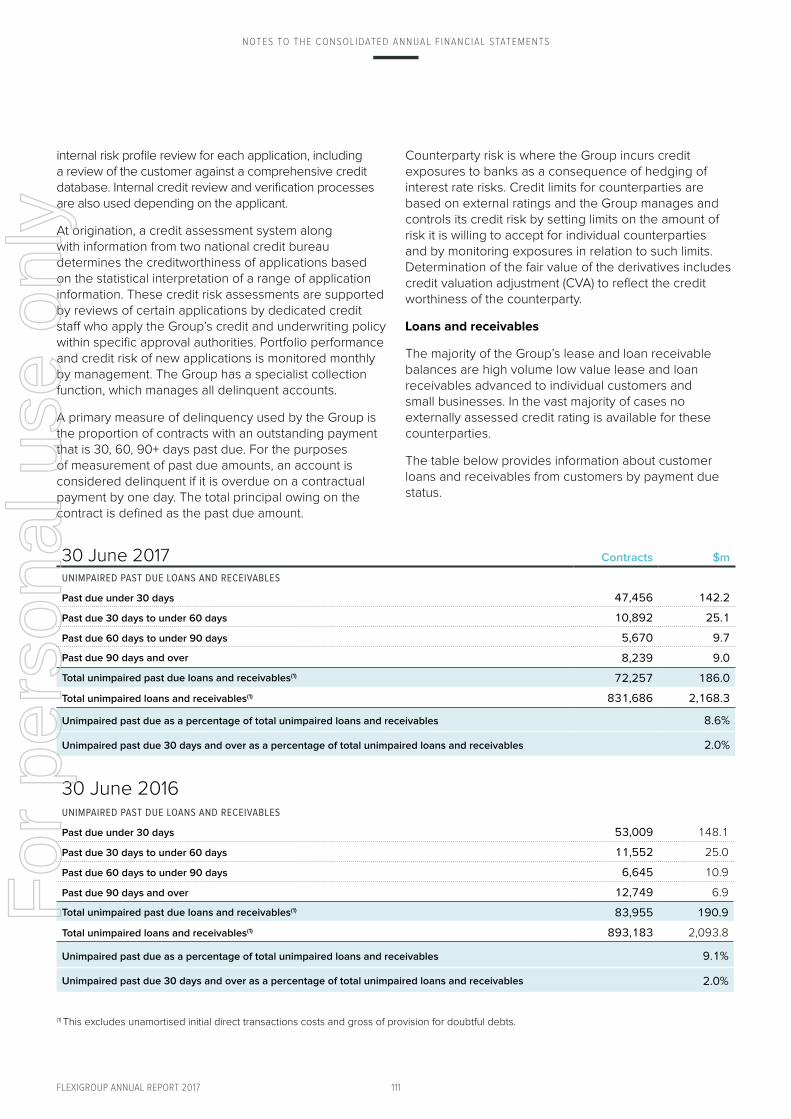
111FLEXIGROUP ANNUAL REPORT 2017
internal risk profile review for each application, including a review of the customer against a comprehensive credit database. Internal credit review and verification processes are also used depending on the applicant.
At origination, a credit assessment system along with information from two national credit bureau determines the creditworthiness of applications based on the statistical interpretation of a range of application information. These credit risk assessments are supported by reviews of certain applications by dedicated credit staff who apply the Group’s credit and underwriting policy within specific approval authorities. Portfolio performance and credit risk of new applications is monitored monthly by management. The Group has a specialist collection function, which manages all delinquent accounts.
A primary measure of delinquency used by the Group is the proportion of contracts with an outstanding payment that is 30, 60, 90+ days past due. For the purposes of measurement of past due amounts, an account is considered delinquent if it is overdue on a contractual payment by one day. The total principal owing on the contract is defined as the past due amount.
Counterparty risk is where the Group incurs credit exposures to banks as a consequence of hedging of interest rate risks. Credit limits for counterparties are based on external ratings and the Group manages and controls its credit risk by setting limits on the amount of risk it is willing to accept for individual counterparties and by monitoring exposures in relation to such limits. Determination of the fair value of the derivatives includes credit valuation adjustment (CVA) to reflect the credit worthiness of the counterparty.
Loans and receivables
The majority of the Group’s lease and loan receivable balances are high volume low value lease and loan receivables advanced to individual customers and small businesses. In the vast majority of cases no externally assessed credit rating is available for these counterparties.
The table below provides information about customer loans and receivables from customers by payment due status.
30 June 2017 Contracts $m
UNIMPAIRED PAST DUE LOANS AND RECEIVABLES
Past due under 30 days 47,456 142.2
Past due 30 days to under 60 days 10,892 25.1
Past due 60 days to under 90 days 5,670 9.7
Past due 90 days and over 8,239 9.0
Total unimpaired past due loans and receivables(1) 72,257 186.0
Total unimpaired loans and receivables(1) 831,686 2,168.3
Unimpaired past due as a percentage of total unimpaired loans and receivables 8.6%
Unimpaired past due 30 days and over as a percentage of total unimpaired loans and receivables 2.0%
30 June 2016UNIMPAIRED PAST DUE LOANS AND RECEIVABLES
Past due under 30 days 53,009 148.1
Past due 30 days to under 60 days 11,552 25.0
Past due 60 days to under 90 days 6,645 10.9
Past due 90 days and over 12,749 6.9
Total unimpaired past due loans and receivables(1) 83,955 190.9
Total unimpaired loans and receivables(1) 893,183 2,093.8
Unimpaired past due as a percentage of total unimpaired loans and receivables 9.1%
Unimpaired past due 30 days and over as a percentage of total unimpaired loans and receivables 2.0%
(1) This excludes unamortised initial direct transactions costs and gross of provision for doubtful debts.
NOTES TO THE CONSOLIDATED ANNUAL F INANCIAL STATEMENTS
For
per
sona
l use
onl
y

112FLEXIGROUP ANNUAL REPORT 2017
For impaired lease receivables, the Group has a right to recover the leased asset and for impaired loan receivables the Group, in certain instances, has access to collateral. Given the large number of small dollar accounts comprising the portfolio it is not practical to assess the value of the collateral.
For the majority of its receivables, the Group does not identify any individual receivables as significant, and accordingly for those receivables, no unimpaired past due loans are identified and the allowance for losses is calculated on a collective basis. However, a small portion of the Group’s receivables are individually significant (primarily in the Commercial and Enterprise portfolio). At 30 June 2017, there were no single exposures that were considered to be individually significant or impaired.
The Group either writes off or recognises a 100% allowance for all past due receivables between 120 and 180 days past due (2016: 120 and 180 days past due) depending on the portfolio.
(d) Liquidity risk
Liquidity risk is the risk that the Group cannot meet its financial liabilities or take advantage of investment opportunities at a reasonable cost in a timely manner. Treasury is responsible for ensuring that the Group has continuous access to funds in accordance with policies established and monitored by the Board.
Prudent liquidity risk management implies maintaining sufficient cash and marketable securities and the availability of funding through an adequate amount of committed credit facilities. Surplus funds are only invested with licensed banks in the countries in which the Group operates.
To mitigate against liquidity risk, the Group maintains cash reserves and committed undrawn credit facilities to meet anticipated funding requirements for new business. In addition, the Group can redraw against its committed credit limits if the principal outstanding is reduced by contractual amortisation payments. Details of unused available loan facilities are set out in note 16.
Amounts due to funders are repaid directly by rentals and repayments received from the Group’s customers. For the current year, the Group raised funding of $265.0m (2016: $260.0m) through the asset-backed securitisation program.
Loan covenants
The Group has complied with all debt covenants throughout the reporting period for corporate debt.
NOTES TO THE CONSOLIDATED ANNUAL F INANCIAL STATEMENTS
For
per
sona
l use
onl
y

113FLEXIGROUP ANNUAL REPORT 2017
Contractual maturity of financial liabilities on an undiscounted basis
The table below shows cashflows associated with financial liabilities including derivative financial liabilities within relevant maturity groupings based on the earliest date in which the Group may be required to pay.
The balances in the table will not agree to amounts presented in the balance sheet as amounts incorporate net cashflows on an undiscounted basis and include both principal and associated future interest payments.
It should be noted this is not how the Group manages its liquidity risk, which is detailed above.
30 June 2017
Less than 1 year 1 to 2 years 2 to 5 years 5 years plus Total
$m $m $m $m $m
NON-DERIVATIVE FINANCIAL LIABILITIES
Payables 50.3 - - - 50.3
Borrowings before loss reserves 1,271.7 511.8 415.1 - 2,198.6
DERIVATIVE FINANCIAL INSTRUMENTS
Interest rate swaps 2.7 1.2 - - 3.9
Total undiscounted financial liabilities 1,324.7 513.0 415.1 - 2,252.8
30 June 2016NON-DERIVATIVE FINANCIAL LIABILITIES
Payables 49.1 - - - 49.1
Borrowings before loss reserves 1,097.8 432.4 628.1 - 2,158.3
DERIVATIVE FINANCIAL INSTRUMENTS
Interest rate swaps 4.8 2.7 0.6 - 8.1
Total undiscounted financial liabilities 1,151.7 435.1 628.7 - 2,215.5
(e) Fair value of financial assets and financial liabilities
Fair value reflects the amount for which an asset could be exchanged or a liability settled, between knowledgeable, willing parties in an arm’s length transaction. Quoted prices or rates are used to determine fair value where an active market exists. If the market for a financial instrument is not active, fair values are estimated using present value or other valuation techniques, using inputs based on market conditions prevailing on the measurement date.
Financial instruments measured at fair value are categorised under a three level hierarchy as outlined below:
Level 1: quoted prices (unadjusted) in active markets for identical assets or liabilities.
Level 2: inputs other than quoted prices included within Level 1 that are observable for the asset or liability, either directly (i.e. as prices) or indirectly (i.e. derived from prices).
Level 3: inputs for the asset or liability that are not based on observable market data (unobservable inputs).
The Group has assessed its financial instruments recorded at fair value and are categorised as per below under fair value hierarchy.
The table below summarises the carrying amount and fair value of financial assets and financial liabilities held at amortised cost. The methodology and assumptions used in determining fair values are as follows:
NOTES TO THE CONSOLIDATED ANNUAL F INANCIAL STATEMENTS
For
per
sona
l use
onl
y

114FLEXIGROUP ANNUAL REPORT 2017
Cash and cash equivalents
The carrying amount of cash and cash equivalents is an approximation of fair value as they are short term in nature or are receivable on demand.
Receivables and customer loans
The fair value of lease receivables and customer loans are estimated by discounting the future contractual cash flows at the current market interest rate that is available to the Group. The nominal value (including unamortised initial direct transaction costs) less estimated credit
adjustments of lease receivables and customer loans are assumed to approximate their fair values.
Payables
The carrying amount of payables is an approximation of fair values as they are short term in nature.
Borrowings and derivative financial instruments
The fair value of borrowings is estimated by discounting the future contractual cash flows at the current market interest rate that is available to the Group.
2017 Note Carrying amount Fair value
$m $m
FINANCIAL ASSETS
Cash and cash equivalents 8 167.3 167.3
Receivables 10 628.3 628.3
Customer loans 11 1,537.6 1,537.6
FINANCIAL LIABILITIES
Payables 15 50.3 50.3
Borrowings(1)
• Floating interest rate(1) 1,843.4 1,843.4
• Fixed interest rate 186.6 190.3
Total borrowings before loss reserves 16 2,030.0 2,033.7
Derivative financial instruments 18 12.9 12.9
2016FINANCIAL ASSETS
Cash and cash equivalents 8 174.4 174.4
Receivables 10 706.8 706.8
Customer loans 11 1,372.2 1,372.2
FINANCIAL LIABILITIES
Payables 15 49.1 49.1
Borrowings(1)
• Floating interest rate(1) 1,772.5 1,772.5
• Fixed interest rate 197.9 200.4
Total borrowings before loss reserves 16 1,970.4 1,972.9
Derivative financial instruments 18 20.0 20.0
(1) Refer Note 25(a) for further information on how the Group manages its interest rate risk.
NOTES TO THE CONSOLIDATED ANNUAL F INANCIAL STATEMENTS
For
per
sona
l use
onl
y

115FLEXIGROUP ANNUAL REPORT 2017
Fair value hierarchy
The fair value hierarchy is determined by reference to observability of inputs into the fair value models.
(a) Receivables and customer loans
Unobservable inputs such as historic and current product margins and credit risk are considered to determine the fair value. These are classified as level 3.
(b) Borrowings and derivative financial instruments
These are classified as level 2 as the inputs into the fair value models used to determine fair value are observable. Other financial assets and financial liabilities are classified as Level 1.
26. BUSINESS COMBINATION
Acquisition 2017(a) Summary of acquisition – Take Home Layby Pty Ltd
On 29 August 2016, the Group acquired the merchant relationships of Take Home Layby Pty Ltd for a consideration of $3.4m of which $1.0m is deferred. Goodwill of $1.0m was recognised on acquisition.
Acquisition 2016(b) Summary of acquisition – FlexiCards (formerly known as Fisher & Paykel Finance)
On 18 March 2016 (consolidated effective 1 March 2016), the Group completed the acquisition of 100% of the issued share capital of Fisher & Paykel Finance Holdings Limited (FPFHL) from AF Investments Limited. FPFHL is a leading provider of non-bank consumer credit in New Zealand, which expands the distribution network of the Group’s existing business across Australia and New Zealand. Details of the purchase consideration, the net assets acquired and goodwill are as follows:
Purchase consideration $m
Cash paid 227.7
Perpetual notes (preference shares) 49.1
Deferred consideration(1) 8.1
Total consideration 284.9
(1) This relates to the deferred cash consideration that is payable on 18 March 2018. The deferred consideration is NZ$10m and has been present valued at 30 June 2016.
The carrying amounts and fair values of the assets and liabilities acquired were:
Carrying value
Provisional fair value(2)
Final fair value
$m $m $m
Cash and cash equivalents
42.4 42.4 42.4
Receivables and customer loans
616.4 616.4 598.4
Other assets 7.7 7.7 7.6
Plant and equipment 1.3 1.3 1.1
Other intangible assets
58.8 58.8 56.1
Deferred tax liabilities
(2.9) (2.9) 2.9
Trade and other payables
(24.3) (24.3) (24.3)
Loans and borrowings
(569.6) (569.6) (569.6)
Current tax liabilities (1.1) (1.1) (1.1)
Net carrying value 128.7 128.7 113.5
Consideration 284.9 284.9
Goodwill recognised 156.2 171.4
(2) The initial accounting of the acquisition of Fisher & Paykel Finance Holdings Limited was stated on a provisional basis as at 30 June 2016. The fair values have been finalised as at 30 June 2017.
The goodwill is attributable to the high profitability, market presence and distribution networks of the acquired business. It will not be deductible for tax purposes.
Transaction costs of $13.0m were incurred in the acquisition and these have been disclosed either in equity or profit and loss.
The acquired business contributed total portfolio income of $41.7m and net profit after tax of $7.6m to the Group from 1 March 2016, the date on which risks and rewards of ownership was transferred. If the acquisition had occurred on 1 July 2015, total portfolio income and profit for the year to 30 June 2016 would have been $97.1m and $23.3m respectively. These amounts have been calculated using the Group accounting policies and by adjusting the results of the subsidiary to reflect the additional depreciation and amortisation that would have been charged assuming the fair value adjustments to property, plant and equipment and intangible assets had applied from 1 July 2015, together with the consequential tax effects.
NOTES TO THE CONSOLIDATED ANNUAL F INANCIAL STATEMENTS
For
per
sona
l use
onl
y
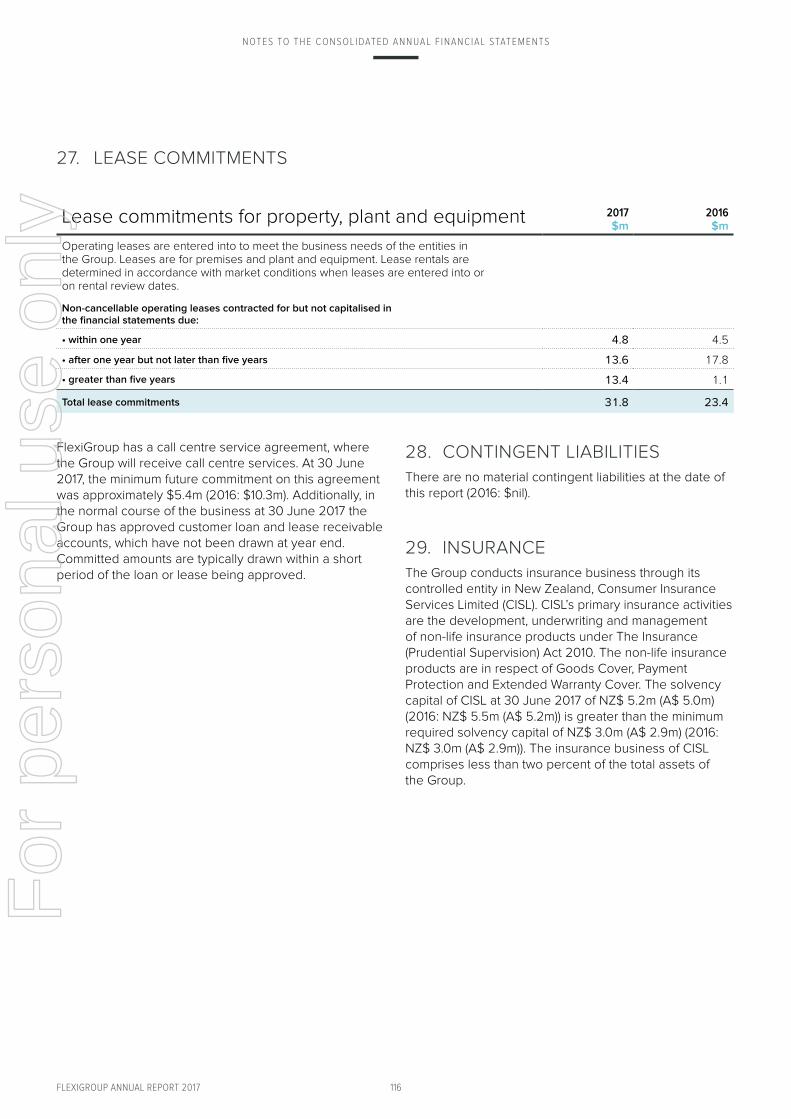
116FLEXIGROUP ANNUAL REPORT 2017
27. LEASE COMMITMENTS
Lease commitments for property, plant and equipment 2017 $m
2016 $m
Operating leases are entered into to meet the business needs of the entities in the Group. Leases are for premises and plant and equipment. Lease rentals are determined in accordance with market conditions when leases are entered into or on rental review dates.
Non-cancellable operating leases contracted for but not capitalised in the financial statements due:
• within one year 4.8 4.5
• after one year but not later than five years 13.6 17.8
• greater than five years 13.4 1.1
Total lease commitments 31.8 23.4
FlexiGroup has a call centre service agreement, where the Group will receive call centre services. At 30 June 2017, the minimum future commitment on this agreement was approximately $5.4m (2016: $10.3m). Additionally, in the normal course of the business at 30 June 2017 the Group has approved customer loan and lease receivable accounts, which have not been drawn at year end. Committed amounts are typically drawn within a short period of the loan or lease being approved.
28. CONTINGENT LIABILITIES
There are no material contingent liabilities at the date of this report (2016: $nil).
29. INSURANCE
The Group conducts insurance business through its controlled entity in New Zealand, Consumer Insurance Services Limited (CISL). CISL’s primary insurance activities are the development, underwriting and management of non-life insurance products under The Insurance (Prudential Supervision) Act 2010. The non-life insurance products are in respect of Goods Cover, Payment Protection and Extended Warranty Cover. The solvency capital of CISL at 30 June 2017 of NZ$ 5.2m (A$ 5.0m) (2016: NZ$ 5.5m (A$ 5.2m)) is greater than the minimum required solvency capital of NZ$ 3.0m (A$ 2.9m) (2016: NZ$ 3.0m (A$ 2.9m)). The insurance business of CISL comprises less than two percent of the total assets of the Group.
NOTES TO THE CONSOLIDATED ANNUAL F INANCIAL STATEMENTS
For
per
sona
l use
onl
y
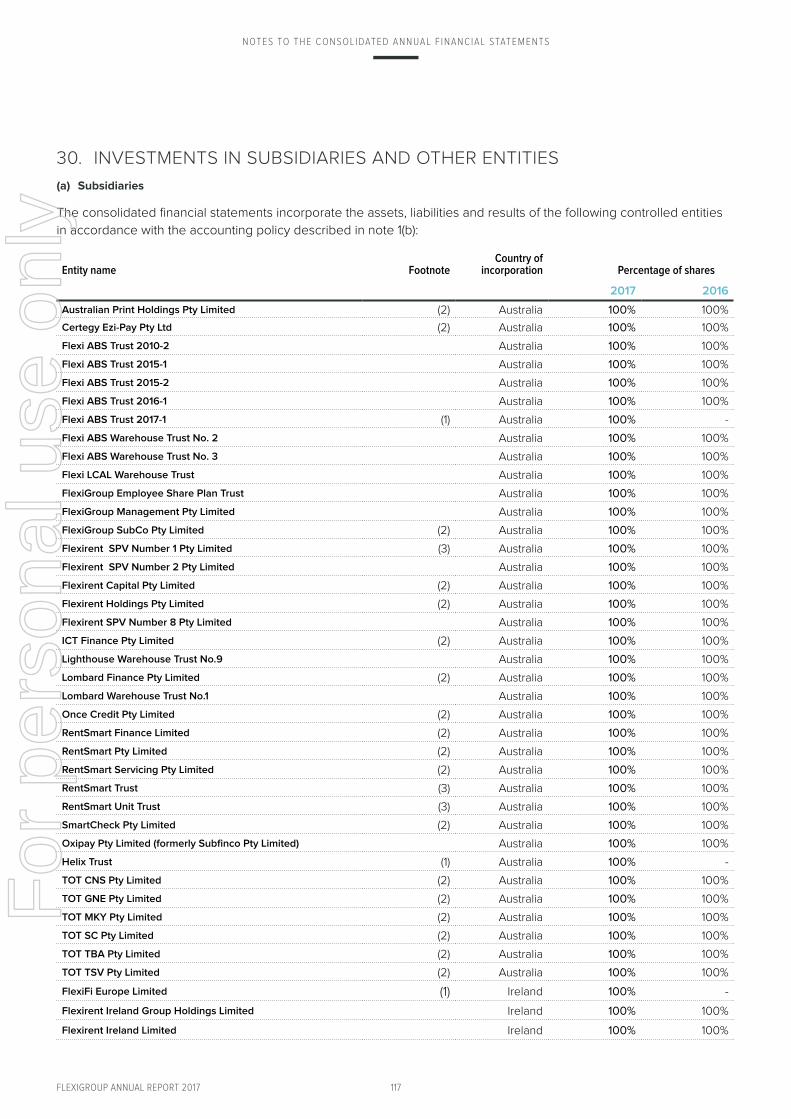
117FLEXIGROUP ANNUAL REPORT 2017
30. INVESTMENTS IN SUBSIDIARIES AND OTHER ENTITIES
(a) Subsidiaries
The consolidated financial statements incorporate the assets, liabilities and results of the following controlled entities
in accordance with the accounting policy described in note 1(b):
Entity name FootnoteCountry of
incorporation Percentage of shares
2017 2016
Australian Print Holdings Pty Limited (2) Australia 100% 100%
Certegy Ezi-Pay Pty Ltd (2) Australia 100% 100%
Flexi ABS Trust 2010-2 Australia 100% 100%
Flexi ABS Trust 2015-1 Australia 100% 100%
Flexi ABS Trust 2015-2 Australia 100% 100%
Flexi ABS Trust 2016-1 Australia 100% 100%
Flexi ABS Trust 2017-1 (1) Australia 100% -
Flexi ABS Warehouse Trust No. 2 Australia 100% 100%
Flexi ABS Warehouse Trust No. 3 Australia 100% 100%
Flexi LCAL Warehouse Trust Australia 100% 100%
FlexiGroup Employee Share Plan Trust Australia 100% 100%
FlexiGroup Management Pty Limited Australia 100% 100%
FlexiGroup SubCo Pty Limited (2) Australia 100% 100%
Flexirent SPV Number 1 Pty Limited (3) Australia 100% 100%
Flexirent SPV Number 2 Pty Limited Australia 100% 100%
Flexirent Capital Pty Limited (2) Australia 100% 100%
Flexirent Holdings Pty Limited (2) Australia 100% 100%
Flexirent SPV Number 8 Pty Limited Australia 100% 100%
ICT Finance Pty Limited (2) Australia 100% 100%
Lighthouse Warehouse Trust No.9 Australia 100% 100%
Lombard Finance Pty Limited (2) Australia 100% 100%
Lombard Warehouse Trust No.1 Australia 100% 100%
Once Credit Pty Limited (2) Australia 100% 100%
RentSmart Finance Limited (2) Australia 100% 100%
RentSmart Pty Limited (2) Australia 100% 100%
RentSmart Servicing Pty Limited (2) Australia 100% 100%
RentSmart Trust (3) Australia 100% 100%
RentSmart Unit Trust (3) Australia 100% 100%
SmartCheck Pty Limited (2) Australia 100% 100%
Oxipay Pty Limited (formerly Subfinco Pty Limited) Australia 100% 100%
Helix Trust (1) Australia 100% -
TOT CNS Pty Limited (2) Australia 100% 100%
TOT GNE Pty Limited (2) Australia 100% 100%
TOT MKY Pty Limited (2) Australia 100% 100%
TOT SC Pty Limited (2) Australia 100% 100%
TOT TBA Pty Limited (2) Australia 100% 100%
TOT TSV Pty Limited (2) Australia 100% 100%
FlexiFi Europe Limited (1) Ireland 100% -
Flexirent Ireland Group Holdings Limited Ireland 100% 100%
Flexirent Ireland Limited Ireland 100% 100%
NOTES TO THE CONSOLIDATED ANNUAL F INANCIAL STATEMENTS
For
per
sona
l use
onl
y

118FLEXIGROUP ANNUAL REPORT 2017
(a) Subsidiaries (continued)
Entity name FootnoteCountry of
incorporation Percentage of shares
2017 2016
Columbus Financial Services Limited New Zealand 100% 100%
Columbus Trust (1) New Zealand 100% -
Consumer Finance Limited New Zealand 100% 100%
Consumer Insurance Services Limited New Zealand 100% 100%
Equipment Finance Limited New Zealand 100% 100%
Fisher & Paykel Finance Holdings Limited New Zealand 100% 100%
Fisher & Paykel Financial Services Limited New Zealand 100% 100%
Fisher and Paykel Finance Limited New Zealand 100% 100%
FlexiGroup New Zealand Limited New Zealand 100% 100%
FlexiGroup NZ SPV 2 Limited New Zealand 100% 100%
FlexiGroup NZ SPV 3 Limited New Zealand 100% 100%
FlexiGroup NZ SPV1 Limited New Zealand 100% 100%
Q Card Trust New Zealand 100% 100%
RentSmart (NZ) Pty Limited New Zealand 100% 100%
Retail Financial Services Limited New Zealand 100% 100%
RFS Trust 2006-1 New Zealand 100% 100%
(1) Created during the year ended 30 June 2017.(2) These controlled entities have entered into a deed of cross guarantee (refer Note 35) with the Company pursuant to ASIC Class order 98/1418
dated 13 August 1998. These controlled entities and the Company form a closed group (closed group is defined as a group of entities comprising a holding entity and its related wholly owned entities). Relief was granted to these controlled entities from the Corporations Act 2001 (Cth) requirements for preparation, audit and publication of an annual financial report.
(3) These trusts are in the process of being wound up.
(b) Associates
The Group’s investments in associate is shown in the table below:
Entity name Country of incorporation Percentage of shares held
2017 2016
Business and Capital Pty Ltd. (“Kikka”) Australia 15.2% -
2017
$m
2016
$m
Share of associate’s loss and impairment (note 6) (2.0) -
Income tax benefit 0.6 -
Share of associate’s loss net of impairment after tax (1.4) -
On 1 August, the Group acquired a 15.2% equity interest in Business and Capital Pty Limited (Kikka) for $2m. The investment has been impaired to zero during the period. Despite having less than 20% interest in Kikka, the Group has significant influence through representation on the board of Kikka. Kikka is part of the Australia Leasing segment and the share of the associate losses are accounted for in the operating and other expenses financial statement line item on the income statement.
NOTES TO THE CONSOLIDATED ANNUAL F INANCIAL STATEMENTS
For
per
sona
l use
onl
y
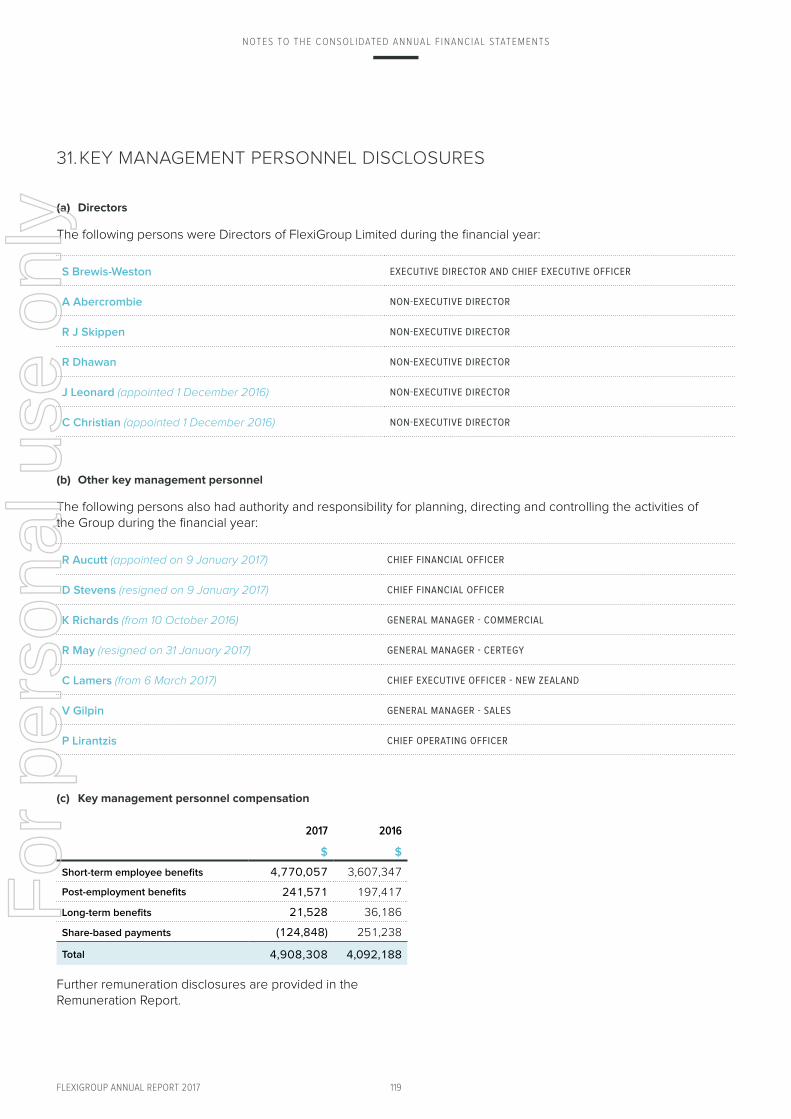
119FLEXIGROUP ANNUAL REPORT 2017
31. KEY MANAGEMENT PERSONNEL DISCLOSURES
(a) Directors
The following persons were Directors of FlexiGroup Limited during the financial year:
S Brewis-Weston EXECUTIVE DIRECTOR AND CHIEF EXECUTIVE OFFICER
A Abercrombie NON-EXECUTIVE DIRECTOR
R J Skippen NON-EXECUTIVE DIRECTOR
R Dhawan NON-EXECUTIVE DIRECTOR
J Leonard (appointed 1 December 2016) NON-EXECUTIVE DIRECTOR
C Christian (appointed 1 December 2016) NON-EXECUTIVE DIRECTOR
(b) Other key management personnel
The following persons also had authority and responsibility for planning, directing and controlling the activities of the Group during the financial year:
R Aucutt (appointed on 9 January 2017) CHIEF FINANCIAL OFFICER
D Stevens (resigned on 9 January 2017) CHIEF FINANCIAL OFFICER
K Richards (from 10 October 2016) GENERAL MANAGER - COMMERCIAL
R May (resigned on 31 January 2017) GENERAL MANAGER - CERTEGY
C Lamers (from 6 March 2017) CHIEF EXECUTIVE OFFICER - NEW ZEALAND
V Gilpin GENERAL MANAGER - SALES
P Lirantzis CHIEF OPERATING OFFICER
(c) Key management personnel compensation
2017 2016
$ $
Short-term employee benefits 4,770,057 3,607,347
Post-employment benefits 241,571 197,417
Long-term benefits 21,528 36,186
Share-based payments (124,848) 251,238
Total 4,908,308 4,092,188
Further remuneration disclosures are provided in the Remuneration Report.
NOTES TO THE CONSOLIDATED ANNUAL F INANCIAL STATEMENTS
For
per
sona
l use
onl
y

120FLEXIGROUP ANNUAL REPORT 2017
(d) Other transactions with related parties
Rental of Melbourne premises
Flexirent Capital Pty Limited has rented premises in Melbourne owned by entities associated with Mr A Abercrombie. The rental arrangements for these premises are based on market terms.
2017 2016
$ $
Rental expense for premises 172,187 172,917
32. RELATED PARTY TRANSACTIONS(a) Parent entity
The parent entity of the Group is FlexiGroup Limited.
(b) Subsidiaries and associate
Interests in Group entities are set out in note 30.
(c) Transactions with related parties
There were no transactions between the Group and related parties other than those disclosed in note 31 (d).
33. REMUNERATION OF AUDITORS
During the year the following fees were paid or payable for services provided by the auditor of the parent entity and its related parties.
2017
$
2016
$
Audit and assurance services
Audit Services
PricewaterhouseCoopers Australian firm
638,260 552,000
Network firms of PricewaterhouseCoopers
387,238 298,000
Other Assurance Services
PricewaterhouseCoopers Australian firm - 628,743
Total remuneration for audit and assurance services
1,025,498 1,478,743
Non-audit services
Taxation Services
PricewaterhouseCoopers Australian firm
8,240 11,060
Other Services
PricewaterhouseCoopers Australian firm - 6,774
Network firms of PricewaterhouseCoopers 45,351 -
Total remuneration for non-audit services
53,591 17,834
Total remuneration of PwC 1,079,089 1,496,577
It is the Group’s policy to employ PwC on assignments additional to its statutory audit duties where PwC’s expertise and experience with the Group are important. These assignments are principally regulatory audits, procedures performed as part of completing funding agreements, tax advice and due diligence reporting on acquisitions, or where PwC is awarded assignments on a competitive basis.
NOTES TO THE CONSOLIDATED ANNUAL F INANCIAL STATEMENTS
For
per
sona
l use
onl
y

121FLEXIGROUP ANNUAL REPORT 2017
34. CLOSED GROUP
The table below presents the consolidated proforma income statement and balance sheet for the Company and controlled entities, which are party to the deed of cross guarantee (referred to as a closed group). For further information refer Note 30, footnote (2). The effects of transactions between entities to the deed are eliminated in full in the consolidated income statement and consolidated statement of financial position.
(a) Statement of comprehensive income
2017 2016
$m $m
Total portfolio income 27.5 86.0
Dividend income 67.8 78.4
Interest expense (6.9) (7.1)
Net portfolio income 88.4 157.3
Employment expenses (59.1) (57.5)
Receivables and customer loan impairment expenses (12.4) (30.9)
Depreciation and amortisation expenses (11.4) (11.2)
Operating and other expenses (30.0) (13.1)
(Loss)/Profit before income tax (24.5) 44.6
Income tax expense (9.1) 8.0
(Loss)/Profit for the year (33.6) 52.6
Other comprehensive income
ITEMS THAT MAY BE RECLASSIFIED TO PROFIT OR LOSS
Changes in the fair value of cash flow hedges, net of tax 5.2 1.4
Other comprehensive income for the year, net of tax 5.2 1.4
Total comprehensive (loss)/income for the year (28.4) 54.0
NOTES TO THE CONSOLIDATED ANNUAL F INANCIAL STATEMENTS
For
per
sona
l use
onl
y

122FLEXIGROUP ANNUAL REPORT 2017
(b) Statement of financial position
2017 2016
$m $m
AssetsCash and cash equivalents 19.5 24.3
Receivables and customer loans 69.6 195.0
Inventories 3.9 4.4
Plant and equipment 6.6 7.8
Goodwill 127.4 140.3
Other intangible assets 50.4 44.3
Other financial assets 177.6 174.1
Total assets 455.0 590.2
LiabilitiesPayables 32.5 34.5
Borrowings 126.2 177.6
Current tax liabilities - -
Provisions 5.7 5.4
Deferred and contingent consideration 0.9 3.5
Deferred tax liabilities 3.7 8.8
Total liabilities 169.0 229.8
EquityContributed equity 361.2 355.2
Reserves 1.6 7.1
Accumulated losses (76.8) (1.9)
Total equity 286.0 360.4
NOTES TO THE CONSOLIDATED ANNUAL F INANCIAL STATEMENTS
For
per
sona
l use
onl
y

123FLEXIGROUP ANNUAL REPORT 2017
35. PARENT ENTITY FINANCIAL INFORMATION
(a) Summary financial information
2017 2016
$m $m
The parent entity financial information is presented as follows:
BALANCE SHEET
Current assets 531.3 596.5
Non-current assets 8.5 8.7
Total assets 539.8 605.2
Current liabilities (38.3) (33.3)
Non-current liabilities (126.2) (160.0)
Total liabilities (164.5) (193.3)
Net assets 375.3 411.9
Issued share capital(1) 763.6 759.2
Share based payment reserve (9.9) (10.2)
Accumulated losses (378.4) (337.1)
Shareholders’ equity 375.3 411.9
Profit for the year - (0.8)
Total comprehensive income - (0.8)
(1) Includes $49.1m subordinated perpetual notes that were issued as part of the acquisition consideration for the Fisher and Paykel Finance acquisition.
(b) Guarantees entered into by the parent entity
Pursuant to Australian Securities and Investment Commission Class Order 98/1418 dated 13 August 1998, relief was granted to certain controlled entities (Note 30, footnote (2)) from the Corporations Act 2001 (Cth) requirements for preparation, audit and publication of annual financial reports. It is a condition of the Class Order that the Company and each of the controlled entities enter into a deed of cross guarantee. The effect of the deed is that the Company guarantees to each creditor payment in full of any debt in the event of winding up of any of the controlled entities under certain provisions of the Corporations Act 2001 (Cth).
No liability was recognised by the parent entity or the consolidated entity in relation to the above guarantee as the fair value of the guarantee is immaterial.
(c) Contingent liabilities and contractual commitments of the parent entity
The parent entity has no contingent liabilities or contractual commitments as at 30 June 2017 (2016: $nil).
NOTES TO THE CONSOLIDATED ANNUAL F INANCIAL STATEMENTS
For
per
sona
l use
onl
y

124FLEXIGROUP ANNUAL REPORT 2017
36. SECURITISATION AND SPECIAL PURPOSE VEHICLES
The Group sells receivables and customer loans to securitisation vehicles through its asset-backed securitisation program and other special purpose vehicles. The securitisation and special purpose vehicles are consolidated as set out in Note 30 as the Group is exposed or has rights to variable returns and has the ability to affect its returns through its power over the securitisation vehicles. The Group may serve as a sponsor, server, liquidity provider, purchaser of notes and/or purchaser of residual interest units.
The table below presents assets securitised and the underlying borrowings as a result of the securitisations.
2017 2016
$m $m
Receivables 519.6 625.5
Customer loans 1,520.6 1,353.2
Cash held by securitisation vehicles 121.5 130.4
Total assets securitised 2,161.7 2,109.1
Borrowings related to receivables and customer loans 1,881.4 1,828.9
37. EVENTS OCCURRING AFTER THE REPORTING PERIOD
There have been no other significant events occurring after the end of the reporting period.
NOTES TO THE CONSOLIDATED ANNUAL F INANCIAL STATEMENTS
For
per
sona
l use
onl
y
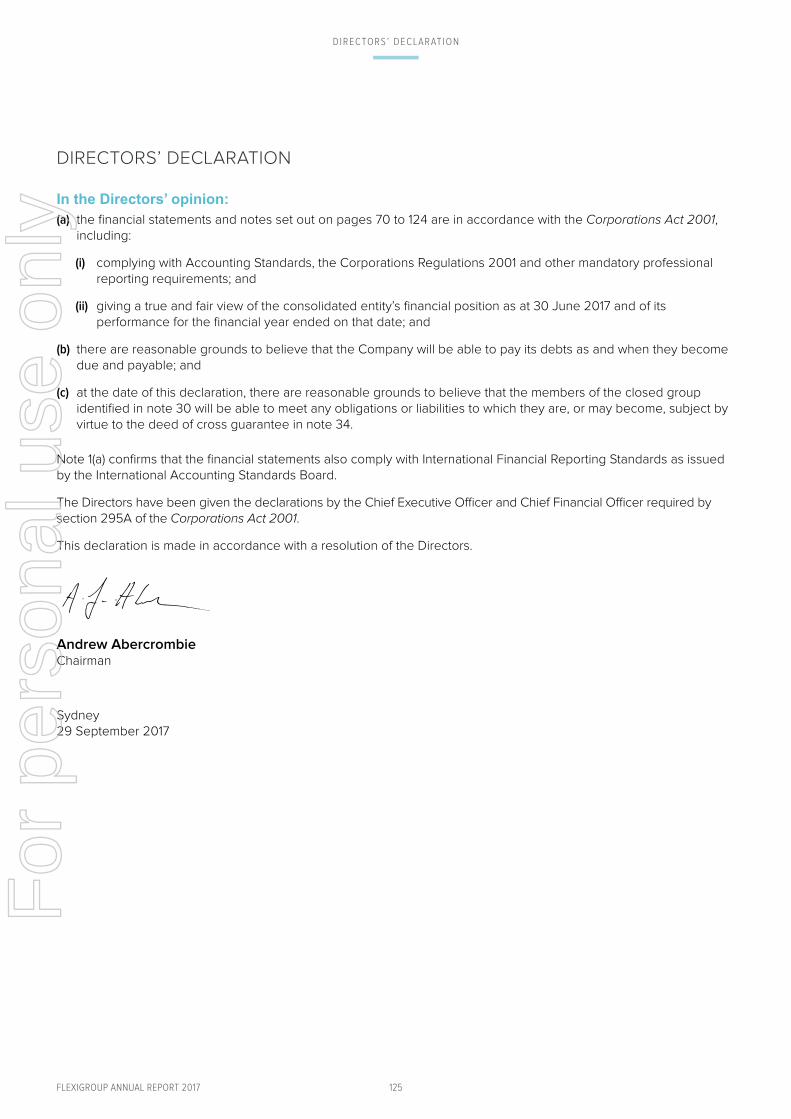
125FLEXIGROUP ANNUAL REPORT 2017
DIRECTORS’ DECLARAT ION
DIRECTORS’ DECLARATION
In the Directors’ opinion:(a) the financial statements and notes set out on pages 70 to 124 are in accordance with the Corporations Act 2001,
including:
(i) complying with Accounting Standards, the Corporations Regulations 2001 and other mandatory professional reporting requirements; and
(ii) giving a true and fair view of the consolidated entity’s financial position as at 30 June 2017 and of its performance for the financial year ended on that date; and
(b) there are reasonable grounds to believe that the Company will be able to pay its debts as and when they become due and payable; and
(c) at the date of this declaration, there are reasonable grounds to believe that the members of the closed group identified in note 30 will be able to meet any obligations or liabilities to which they are, or may become, subject by virtue to the deed of cross guarantee in note 34.
Note 1(a) confirms that the financial statements also comply with International Financial Reporting Standards as issued by the International Accounting Standards Board.
The Directors have been given the declarations by the Chief Executive Officer and Chief Financial Officer required by section 295A of the Corporations Act 2001.
This declaration is made in accordance with a resolution of the Directors.
Andrew Abercrombie Chairman
Sydney 29 September 2017
For
per
sona
l use
onl
y

126FLEXIGROUP ANNUAL REPORT 2017
INDEPENDENT AUDITOR’S REPORT
Independent auditor’s reportTo the shareholders of FlexiGroup Limited
Report on the audit of the financial report
Our opinionIn our opinion:
The accompanying financial report of FlexiGroup Limited (the Company) and its controlled entities (together the Group or FlexiGroup) is in accordance with the Corporations Act 2001, including:
(a) giving a true and fair view of the Group's financial position as at 30 June 2017 and of its financial performance for the year then ended
(b) complying with Australian Accounting Standards and the Corporations Regulations 2001.
What we have auditedThe Group financial report comprises:
• the consolidated statement of financial position as at 30 June 2017
• the consolidated income statement for the year then ended
• the consolidated statement of comprehensive income for the year then ended
• the consolidated statement of changes in equity for the year then ended
• the consolidated statement of cash flows for the year then ended
• the notes to the consolidated financial statements, which include a summary of significant accounting policies
• the directors’ declaration.
Basis for opinionWe conducted our audit in accordance with Australian Auditing Standards. Our responsibilities under those standards are further described in the Auditor’s responsibilities for the audit of the financial report section of our report.
We believe that the audit evidence we have obtained is sufficient and appropriate to provide a basis for our opinion.
IndependenceWe are independent of the Group in accordance with the auditor independence requirements of the Corporations Act 2001 and the ethical requirements of the Accounting Professional and Ethical Standards Board’s APES 110 Code of Ethics for Professional Accountants (the Code) that are relevant to our audit of the financial report in Australia. We have also fulfilled our other ethical responsibilities in accordance with the Code.
PricewaterhouseCoopers, ABN 52 780 433 757One International Towers Sydney, Watermans Quay, Barangaroo, GPO BOX 2650, SYDNEY NSW 2001T: +61 2 8266 0000, F: +61 2 8266 9999, www.pwc.com.au
Liability limited by a scheme approved under Professional Standards Legislation.
For
per
sona
l use
onl
y

127FLEXIGROUP ANNUAL REPORT 2017
INDEPENDENT AUDITOR’S REPORT
Our audit approachAn audit is designed to provide reasonable assurance about whether the financial report is free from material misstatement. Misstatements may arise due to fraud or error. They are considered material if individually or in aggregate, they could reasonably be expected to influence the economic decisions of users taken on the basis of the financial report.
We tailored the scope of our audit to ensure that we performed enough work to be able to give an opinion on the financial report as a whole, taking into account the geographic and management structure of the Group, its accounting processes and controls and the industry in which it operates.
The Group is structured along 5 core business areas – Certegy, Australia Cards, Australia Leasing(which includes the Think Office Technology, Commercial portfolio and Ireland Leasing), New Zealand Leasing and New Zealand Cards. The Group operates across 3 geographical locations –Australia, New Zealand and Ireland.
Materiality
• For the purpose of our audit we used overall Group materiality of $6,025,000, which represents approximately 5% of the Group’s profit before tax.
• We applied this threshold, together with qualitative considerations, to determine the scope of our audit and the nature, timing and extent of our audit procedures and to evaluate the effect of misstatements on the financial report as a whole.
• We chose Group profit before tax because, in our view, it is the benchmark against which the performance of the Group is most commonly measured and is a generally accepted benchmark.
• We used a 5% threshold based on our professional judgement, noting it is within the range of commonly acceptable thresholds.
Audit Scope
Our audit focused on where the Group made subjective judgements; for example, significant accounting estimates involving assumptions and inherently uncertain future events.
We decided the nature, timing and extent of work that needed to be performed by us and component auditors operating under our instruction. We then structured our audit approach as follows:
• We identified two components, FlexiGroup Core (composed of the Australia Leasing, Australia Cards, New Zealand Leasing, Certegy, Other and Unallocated segments) and New Zealand Cards, based on a combination of reportable operating segments and shared operating centres with consistent processes and controls.For
per
sona
l use
onl
y
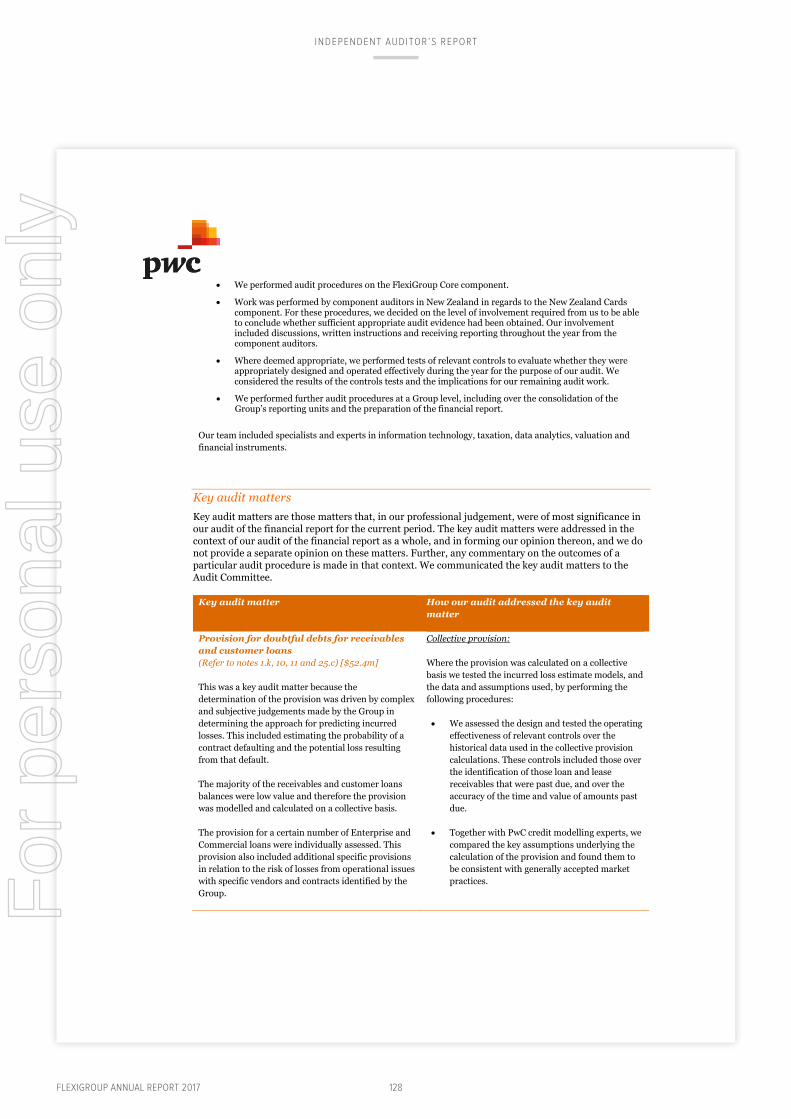
128FLEXIGROUP ANNUAL REPORT 2017
• We performed audit procedures on the FlexiGroup Core component.
• Work was performed by component auditors in New Zealand in regards to the New Zealand Cards component. For these procedures, we decided on the level of involvement required from us to be able to conclude whether sufficient appropriate audit evidence had been obtained. Our involvement included discussions, written instructions and receiving reporting throughout the year from the component auditors.
• Where deemed appropriate, we performed tests of relevant controls to evaluate whether they were appropriately designed and operated effectively during the year for the purpose of our audit. Weconsidered the results of the controls tests and the implications for our remaining audit work.
• We performed further audit procedures at a Group level, including over the consolidation of the Group’s reporting units and the preparation of the financial report.
Our team included specialists and experts in information technology, taxation, data analytics, valuation and financial instruments.
Key audit mattersKey audit matters are those matters that, in our professional judgement, were of most significance in our audit of the financial report for the current period. The key audit matters were addressed in the context of our audit of the financial report as a whole, and in forming our opinion thereon, and we do not provide a separate opinion on these matters. Further, any commentary on the outcomes of a particular audit procedure is made in that context. We communicated the key audit matters to the Audit Committee.
Key audit matter How our audit addressed the key audit matter
Provision for doubtful debts for receivables and customer loans(Refer to notes 1.k, 10, 11 and 25.c) [$52.4m]
This was a key audit matter because the determination of the provision was driven by complex and subjective judgements made by the Group in determining the approach for predicting incurred losses. This included estimating the probability of a contract defaulting and the potential loss resulting from that default.
The majority of the receivables and customer loans balances were low value and therefore the provision was modelled and calculated on a collective basis.
The provision for a certain number of Enterprise and Commercial loans were individually assessed. This provision also included additional specific provisions in relation to the risk of losses from operational issueswith specific vendors and contracts identified by the Group.
Collective provision:
Where the provision was calculated on a collective basis we tested the incurred loss estimate models, and the data and assumptions used, by performing the following procedures:
• We assessed the design and tested the operating effectiveness of relevant controls over the historical data used in the collective provision calculations. These controls included those over the identification of those loan and lease receivables that were past due, and over the accuracy of the time and value of amounts past due.
• Together with PwC credit modelling experts, wecompared the key assumptions underlying the calculation of the provision and found them to be consistent with generally accepted market practices.
INDEPENDENT AUDITOR’S REPORT
For
per
sona
l use
onl
y

129FLEXIGROUP ANNUAL REPORT 2017
Key audit matter How our audit addressed the key audit matter
• We tested the mathematical accuracy of the calculations in the models used to calculate the provision.
• We considered the potential for the provision to be affected by events which were not captured by the models and evaluated how the Group had responded to these by making further adjustments where appropriate.
• Together with PwC credit modelling experts, weevaluated the conceptual soundness of the provision model approach for estimatingincurred losses.
• We assessed how the Group aggregatedcontracts into homogeneous portfolios for the purpose of determining the collective provision.
Specific provisions:
We performed a number of procedures, including the following:
• Discussed the provisioning methodology with the Group to develop an understanding of the factors taken into account when assessing the need for and the amounts of provisions against these loans.
• Inspected evidence held by the Group and external publically available information (e.g., debtor updated financial information), as applicable, to assess the loss event leading to the provision.
• After evaluating the assumptions made by the Group, recalculated the provision and assessed its appropriateness having regard to the applicable Australian Accounting Standards.
Existence and accuracy of revenue recognition(Refer to notes 1.e and 5) [$462.8m]
FlexiGroup has three main streams of revenue:finance lease interest income, customer loans interest income and other portfolio income.
We performed tests over the operating effectiveness of the relevant controls covering the finance lease and customer loan product systems. Additionally, we performed the following procedures, amongst others:
• Re-performed the automated calculation ofinterest income for a sample of significant products.
INDEPENDENT AUDITOR’S REPORT
For
per
sona
l use
onl
y

130FLEXIGROUP ANNUAL REPORT 2017
Key audit matter How our audit addressed the key audit matter
This was a key audit matter due to the risk in revenue recognition, specifically because of:
• The significance of interest income and other portfolio income in the context of the profit of the Group.
• The judgement involved in the estimation of the finance lease residual values, which should reflect the amount the Group expects to realise at the end of the lease contractual period. The residual value is included in the calculation of the effective interest rate at the commencement of the lease contract, which affects the revenue recognition.
• Inspected and re-performed the reconciliations between the product systems and the general ledger as of 30 June 2017.
• Inspected and compared contract data contained in the product system to the signed contract for a sample of finance leases.
• For a sample of customer loans, compared the income recognised and the cash received reflected in the product system to the relevant signed contract and bank statements.
• For all open contracts at year-end with unguaranteed residuals, compared the estimateof the residual value with the actual historical experience of residual value collections of FlexiGroup.
Valuation of goodwill(Refer to notes 1.s, 1.t and 13) [$321.4]
This was a key audit matter because the carrying value of goodwill was material for the Group and the determination of its value was impacted by subjective judgements and assumptions, as further explained below.
The recoverable amount of goodwill was determined through a ‘value in use’ valuation model based on theGroup’s cash flow forecasts from the latest board approved business plans for each cash generating unit(“CGU”). The most significant judgements related to the discount rate applied together with the assumptions supporting the underlying forecast cashflows, in particular, revenue growth rates and terminal growth rates.
The Group considered that each reportable operating segment constituted its own CGU, except for Think Office Technology, which was assessed separately from the other core businesses given it was a separate standalone business managed in Queensland.
We assessed the Group’s cash flow forecasts for all CGUs disclosed in note 13 of the financial statements and the process by which they were developed.
We considered whether the cash flows were based on supportable assumptions by:
• comparing these forecasts to Board approved business plans
• comparing previous forecasts to actual results to assess the Group’s historic ability to forecast future cash flows
• performing a sensitivity analysis on the assumed growth rate in revenue, the expense cash flows and the terminal growth rate.
In testing the valuation model:
• we checked the calculations for mathematical accuracy and the consistency of the methodology with the ‘value in use’ valuation approach
• we considered the sensitivity of the calculation by varying the assumptions (e.g., discount rates) and applying other values within a reasonably possible range.
INDEPENDENT AUDITOR’S REPORT
For
per
sona
l use
onl
y

131FLEXIGROUP ANNUAL REPORT 2017
Key audit matter How our audit addressed the key audit matter
Fair value of acquired assets and liabilities innew business combinations(Refer to notes 1.h and 26) [$113.5m]
This was a key audit matter because of the judgementby the Group in determining the fair values of acquired assets and liabilities, especially intangibles and contingencies. Fisher & Paykel Finance was FlexiGroup’s largest acquisition to date and any errors in calculating the fair value of this acquisitioncould have led to a material misstatement in the financial statements.
A third party valuation expert was engaged by FlexiGroup to assist with the determination of thevaluations.
We met with management and the Group’s valuation expert to develop an understanding of the methodology at the outset and have assessed theresults of their work at its conclusion.
We assessed the basis of adjustments to the value of acquired assets and liabilities having regard to the requirements of Australian Accounting Standards. In addition, we worked with PwC valuation experts to assess the valuations performed by the Group’s experts, including the appropriateness of the valuation methodology and key assumptions utilised.
We evaluated the adequacy of the disclosures made in note 26, in light of the requirements of Australian Accounting Standards.
Current tax liabilities and deferred tax liabilities(Refer to notes 1.g and 7) [$0.5m and $24.7m, respectively]
FlexiGroup was subject to taxation in each location in which it operated. The assessment of the amounts expected to be paid to tax authorities was considered initially by FlexiGroup at a local level and then reviewed centrally, with consideration given to particular tax positions in certain jurisdictions.
In some cases, the treatment of tax positions requiredjudgement related to the determination of temporary and permanent differences, tax treatment for different locations as well as the impact of business combinations.
We considered this to be a key audit matter due to the extent of judgement involved by the Group.
Our procedures included evaluating the analysis performed by FlexiGroup which set out the basis for judgements made in respect of the ultimate amounts expected to be paid to tax authorities.
We used our understanding of the business, assisted by PwC tax specialists, and read a risk-focused selection of correspondence with tax authorities to assess the completeness and quantum of the provisions for tax.
We considered the likelihood of additional taxexposures occurring.
We assessed the appropriateness of FlexiGroup'sdisclosure in the financial report in light of the requirements of Australian Accounting Standards.
Other informationThe directors are responsible for the other information. The other information comprises the Performance highlights, Chairman’s report, CEO’s report, Executive team, Directors’ report,Corporate governance statement, Sustainability report, Shareholder information and Corporate directory included in the Group’s annual report for the year ended 30 June 2017 but does not include the financial report and our auditor’s report thereon.
INDEPENDENT AUDITOR’S REPORT
For
per
sona
l use
onl
y

132FLEXIGROUP ANNUAL REPORT 2017
Our opinion on the financial report does not cover the other information and accordingly we do not express any form of assurance conclusion thereon.
In connection with our audit of the financial report, our responsibility is to read the other information identified above and, in doing so, consider whether the other information is materially inconsistent with the financial report or our knowledge obtained in the audit, or otherwise appears to be materially misstated.
If, based on the work we have performed, we conclude that there is a material misstatement of this other information, we are required to report that fact. We have nothing to report in this regard.
Responsibilities of the directors for the financial reportThe directors of the Company are responsible for the preparation of the financial report that gives a true and fair view in accordance with Australian Accounting Standards and Corporations Act 2001and for such internal control as the directors determine is necessary to enable the preparation of the financial report that gives a true and fair view and is free from material misstatement, whether due to fraud or error.
In preparing the financial report, the directors are responsible for assessing the ability of the Group to continue as a going concern, disclosing, as applicable, matters related to going concern and using the going concern basis of accounting unless the directors either intend to liquidate the Group or to cease operations, or have no realistic alternative but to do so.
Auditor’s responsibilities for the audit of the financial reportOur objectives are to obtain reasonable assurance about whether the financial report as a whole is free from material misstatement, whether due to fraud or error, and to issue an auditor’s report that includes our opinion. Reasonable assurance is a high level of assurance, but is not a guarantee that an audit conducted in accordance with the Australian Auditing Standards will always detect a material misstatement when it exists. Misstatements can arise from fraud or error and are considered material if, individually or in the aggregate, they could reasonably be expected to influence the economic decisions of users taken on the basis of the financial report.
A further description of our responsibilities for the audit of the financial report is located at the Auditing and Assurance Standards Board website at: http://www.auasb.gov.au/auditors_responsibilities/ar1.pdf. This description forms part of our auditor's report.
Report on the remuneration report
Our opinion on the remuneration reportWe have audited the remuneration report included in pages 37 to 59 of the Directors’ report for the year ended 30 June 2017.
In our opinion, the remuneration report of FlexiGroup Limited for the year ended 30 June 2017 complies with section 300A of the Corporations Act 2001.
INDEPENDENT AUDITOR’S REPORT
For
per
sona
l use
onl
y

133FLEXIGROUP ANNUAL REPORT 2017
ResponsibilitiesThe directors of the Company are responsible for the preparation and presentation of the remuneration report in accordance with section 300A of the Corporations Act 2001. Our responsibility is to express an opinion on the remuneration report, based on our audit conducted in accordance with Australian Auditing Standards.
PricewaterhouseCoopers
Rob Spring
Sydney
Partner 29 September 2017
INDEPENDENT AUDITOR’S REPORT
For
per
sona
l use
onl
y
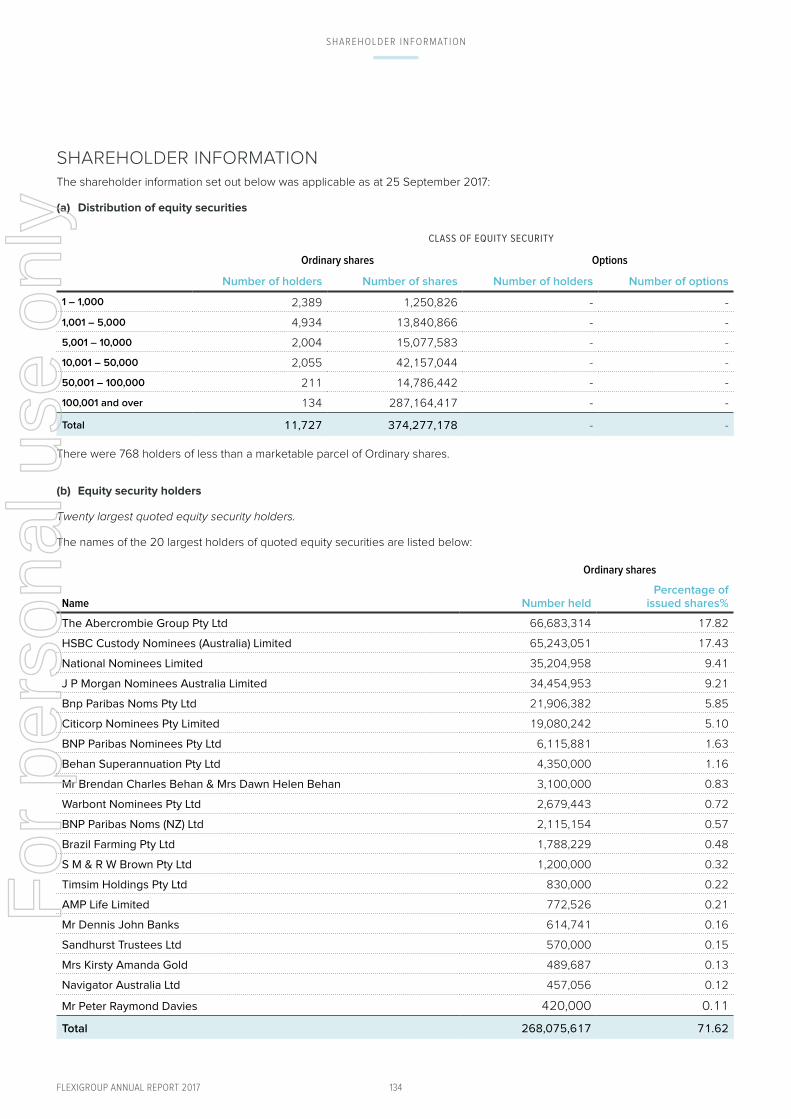
134FLEXIGROUP ANNUAL REPORT 2017
SHAREHOLDER INFORMATIONThe shareholder information set out below was applicable as at 25 September 2017:
(a) Distribution of equity securities
CLASS OF EQUITY SECURITY
Ordinary shares Options
Number of holders Number of shares Number of holders Number of options
1 – 1,000 2,389 1,250,826 - -
1,001 – 5,000 4,934 13,840,866 - -
5,001 – 10,000 2,004 15,077,583 - -
10,001 – 50,000 2,055 42,157,044 - -
50,001 – 100,000 211 14,786,442 - -
100,001 and over 134 287,164,417 - -
Total 11,727 374,277,178 - -
There were 768 holders of less than a marketable parcel of Ordinary shares.
(b) Equity security holders
Twenty largest quoted equity security holders.
The names of the 20 largest holders of quoted equity securities are listed below:
Ordinary shares
Name
Number heldPercentage of
issued shares%
The Abercrombie Group Pty Ltd 66,683,314 17.82
HSBC Custody Nominees (Australia) Limited 65,243,051 17.43
National Nominees Limited 35,204,958 9.41
J P Morgan Nominees Australia Limited 34,454,953 9.21
Bnp Paribas Noms Pty Ltd 21,906,382 5.85
Citicorp Nominees Pty Limited 19,080,242 5.10
BNP Paribas Nominees Pty Ltd 6,115,881 1.63
Behan Superannuation Pty Ltd 4,350,000 1.16
Mr Brendan Charles Behan & Mrs Dawn Helen Behan 3,100,000 0.83
Warbont Nominees Pty Ltd 2,679,443 0.72
BNP Paribas Noms (NZ) Ltd 2,115,154 0.57
Brazil Farming Pty Ltd 1,788,229 0.48
S M & R W Brown Pty Ltd 1,200,000 0.32
Timsim Holdings Pty Ltd 830,000 0.22
AMP Life Limited 772,526 0.21
Mr Dennis John Banks 614,741 0.16
Sandhurst Trustees Ltd 570,000 0.15
Mrs Kirsty Amanda Gold 489,687 0.13
Navigator Australia Ltd 457,056 0.12
Mr Peter Raymond Davies 420,000 0.11
Total 268,075,617 71.62
SHAREHOLDER INFORMATION
For
per
sona
l use
onl
y

135FLEXIGROUP ANNUAL REPORT 2017
Unquoted equity securities
Number on issue
Number of holders
Options and performance rights issued under the FlexiGroup Limited Long Term Incentive Plan to take up ordinary shares
1,792,000 38
The Company has no other unquoted equity securities.
(c) Substantial holders
Substantial holder in the Company is set out below:
Number held Percentage %
The Abercrombie Group 90,766,593 24.25
(d) Voting rights
The voting rights attaching to equity securities are set out below:
a) Ordinary shares
On a show of hands, every member present at a meeting in person or by proxy shall have one vote and upon a poll, each share shall have one vote.
b) Options, performance rights and subordinated perpetual notes
No voting rights.
SHAREHOLDER INFORMATION
For
per
sona
l use
onl
y

136FLEXIGROUP ANNUAL REPORT 2017
CORPORATE D IRECTORY
CORPORATE DIRECTORY
Directors Andrew Abercrombie (Chairman)
Symon Brewis-Weston
Rajeev Dhawan
Christine Christian
Jodie Leonard
R John Skippen
Secretary Melissa Robinson
Notice of Annual General Meeting
The Annual General Meeting of FlexiGroup Limited will be held at the offices of:
PwC, 2 Riverside Quay, Southbank, Melbourne, Victoria 3006 at 4.00pm on 27 November 2017.
Principal registered office in Australia
Level 7
179 Elizabeth Street
Sydney NSW 2000
Australia
Share Register Link Market Services Limited
Level 12
680 George Street
Sydney NSW 2000
Australia
Auditor PricewaterhouseCoopers
One International Towers
Watermans Quay, Barangaroo
Sydney NSW 2000
Australia
Solicitors King & Wood Mallesons
Level 60, Governor Phillip Tower
1 Farrer Place
Sydney NSW 2000
Australia
Bankers Commonwealth Bank of Australia
Westpac Banking Corporation
Stock Exchanges listing FlexiGroup Limited shares are listed on the Australian Securities Exchange
Website www.flexigroup.com.au
For
per
sona
l use
onl
y

f lexigroup.com.au
ABN 75 122 574 583
For
per
sona
l use
onl
y