for personal use only - asx.com.au · for personal use only normalised numbers exclude the $17.1m...
TRANSCRIPT

Presentation by McMillan Shakespeare Limited
CLSA Presentation
September 2010
For
per
sona
l use
onl
y

Company overview
Key points
� MMS is a unique provider of workplace benefits in Australia.
� Fleet management business of Interleasing Australia acquired in April 2010.� Fleet management business of Interleasing Australia acquired in April 2010.
� The combined business provides salary packaging administration and integrated fleet management services. It is the only company of its type.
� Clients include a variety of state and federal government agencies, hospitals, charities and large private sector organisations.
� Employs around 600 staff, with offices in every state in Australia.
� Services delivered through “a house of brands”.
P 1 September2010
For
per
sona
l use
onl
y
Financial performance
FY05 FY06 FY07 FY08 FY09 FY10
$’000 $’000 $’000 $’000 $’000 $’000
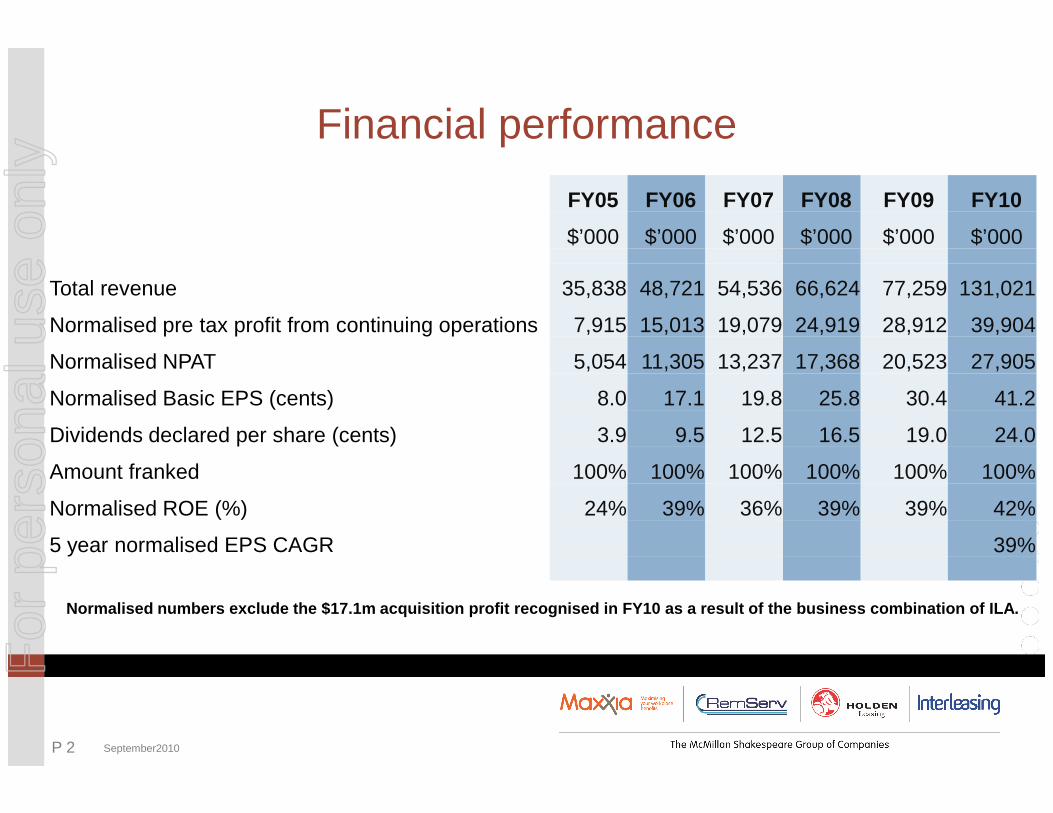
Total revenue 35,838 48,721 54,536 66,624 77,259 131,021
Normalised pre tax profit from continuing operations 7,915 15,013 19,079 24,919 28,912 39,904
Normalised NPAT 5,054 11,305 13,237 17,368 20,523 27,905
Normalised Basic EPS (cents) 8.0 17.1 19.8 25.8 30.4 41.2
P 2 September2010
Normalised Basic EPS (cents) 8.0 17.1 19.8 25.8 30.4 41.2
Dividends declared per share (cents) 3.9 9.5 12.5 16.5 19.0 24.0
Amount franked 100% 100% 100% 100% 100% 100%
Normalised ROE (%) 24% 39% 36% 39% 39% 42%
5 year normalised EPS CAGR 39%
Normalised numbers exclude the $17.1m acquisition pr ofit recognised in FY10 as a result of the business combination of ILA.
For
per
sona
l use
onl
y

Historical normalised NPAT(1)
27.9
17.1
20
30
40
$ m
Profit recognised onILA business combination
Normalised NPAT 5-year CAGR of 39.9%
P 3 September2010
Note 1: Normalised numbers exclude the $17.1m acquisition profit recognised in FY10 as a result of the business combination of ILA
5.2
11.313.2
17.4
20.5
0
10
20
FY05 FY06 FY07 FY08 FY09 FY10NPAT (continuing operations) Acquisition Gain
For
per
sona
l use
onl
y
Earnings and dividends per share
25.0
30.0
35.0
40.0
45.0
50.0
cent
s
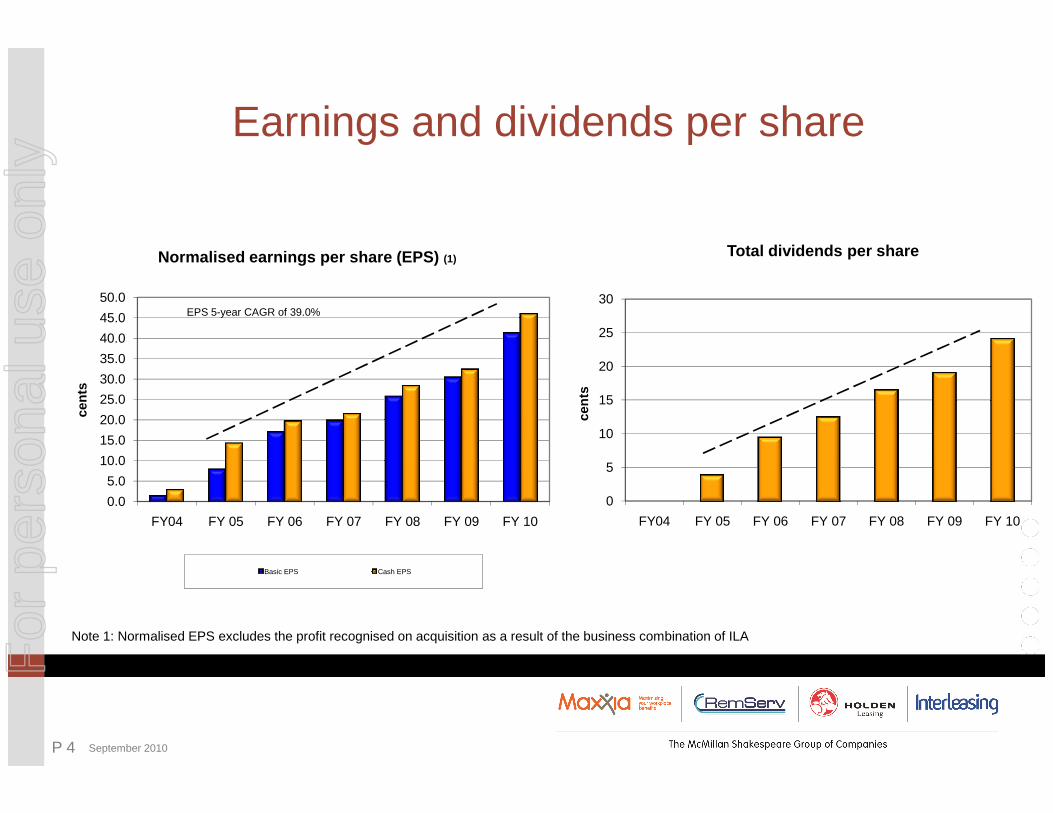
Normalised earnings per share (EPS) (1)
EPS 5-year CAGR of 39.0%
15
20
25
30
cent
s
Total dividends per share
Note 1: Normalised EPS excludes the profit recognised on acquisition as a result of the business combination of ILA
0.0
5.0
10.0
15.0
20.0
FY04 FY 05 FY 06 FY 07 FY 08 FY 09 FY 10
cent
s
Basic EPS Cash EPS
0
5
10
15
FY04 FY 05 FY 06 FY 07 FY 08 FY 09 FY 10
cent
s
P 4 September 2010
Note 1: Normalised EPS excludes the profit recognised on acquisition as a result of the business combination of ILA
For
per
sona
l use
onl
y
What is salary packaging?
� Australia’s taxation system allows tax concessions for certain employee benefits and for certain industry sectors which makes salary packaging attractive.
� Eligible employees increase their disposable income by using pre-tax salary to pay for goods or services.
� Employers use these benefits to attract and retain staff in a tight employment market.
� Payroll systems do not cope well with salary packaging i.e. a bespoke system is
P 5 September2010
� Payroll systems do not cope well with salary packaging i.e. a bespoke system is required.
� MMS with its knowledge, people and systems, administers budgets; deducts pre-tax salary; makes payments to service providers on behalf of an employee; and accurately reports transactions for tax purposes.
� A high transaction load, a complex business process and the tax implications leads many employers to outsource this task.
For
per
sona
l use
onl
y
What is fleet management?
� MMS finances and manages vehicle fleets for its large corporate customers and charges a monthly “rental” fee.
� “Management” includes:
- maintenance;
- fuel;
- tyres;
P 6 September2010
- tyres;
- traffic fines;
- registration;
- insurance; and
- accident management.
� Fleet management is a complex and capital intensive task. Many corporations choose to outsource management and/or lease their fleet.
For
per
sona
l use
onl
y
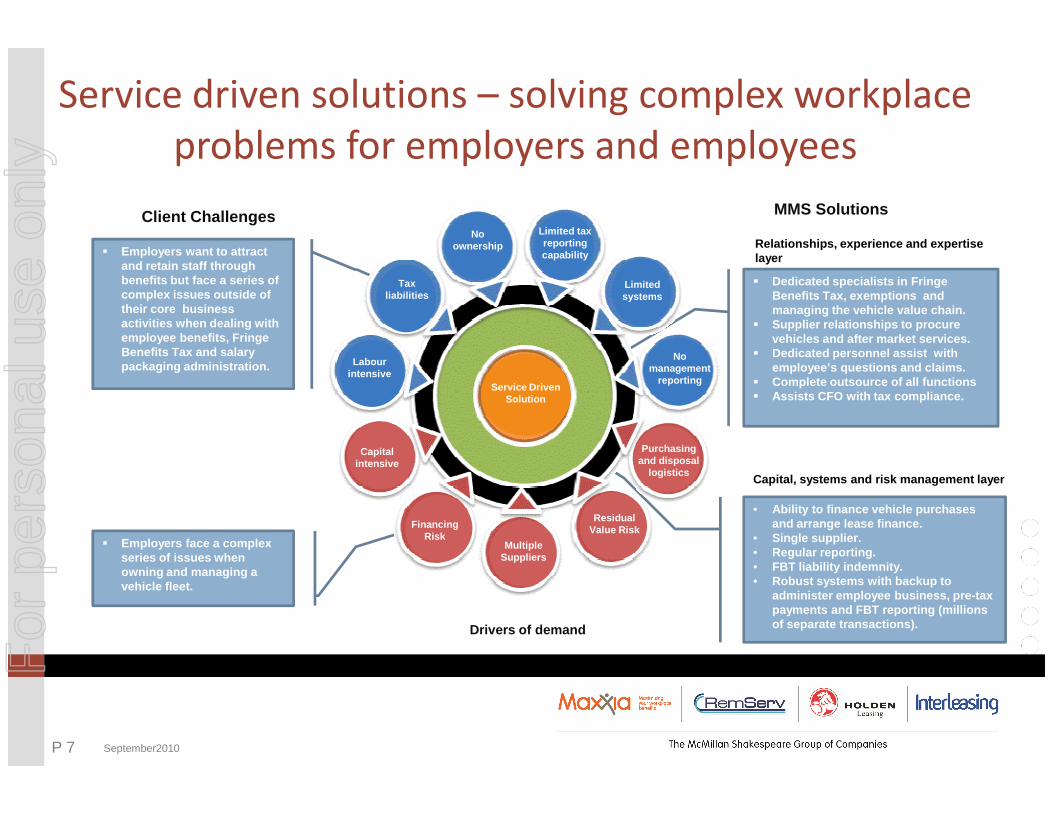
Service driven solutions – solving complex workplace
problems for employers and employees
Client Challenges MMS Solutions
� Dedicated specialists in Fringe Benefits Tax, exemptions and managing the vehicle value chain.
� Supplier relationships to procure vehicles and after market services.
� Dedicated personnel assist with employee’s questions and claims.
� Complete outsource of all functions� Assists CFO with tax compliance.
� Employers want to attract and retain staff through benefits but face a series of complex issues outside of their core business activities when dealing with employee benefits, Fringe Benefits Tax and salary packaging administration.
Relationships, experience and expertise layer
Limited tax reporting capability
Limited systems
No ownership
Tax liabilities
No management
reporting
Labour intensive
Service Driven Solution
P 7 September2010
Drivers of demand
• Ability to finance vehicle purchases and arrange lease finance.
• Single supplier.• Regular reporting.• FBT liability indemnity.• Robust systems with backup to
administer employee business, pre-tax payments and FBT reporting (millions of separate transactions).
� Employers face a complex series of issues when owning and managing a vehicle fleet.
Capital, systems and risk management layer
Capital intensive
Financing Risk
Multiple Suppliers
Residual Value Risk
Purchasing and disposal
logistics
For
per
sona
l use
onl
y
Revenue sources
� Salary packaging administration fees:
- annuity income stream; paid directly from employees’ salary.
� Facilitation and procurement fees for assisting with novated lease settlements.
� Net interest margin on financed vehicles.
� Fees for managing customer vehicle fleets.
P 8 September2010
� Fees for managing customer vehicle fleets.
� Supplier rebates based on transaction volumes e.g. fuel, tyres, maintenance.
� See Appendix I for further details.
For
per
sona
l use
onl
y

What is MMS’s comparative/competitive advantage?
� A unique market position: the only integrated provider of salary packaging and “company car” solutions.
� Industry leading service levels.
� Scale in BPO business/dominant player (MMS is over twice the size of its nearest competitor - lower delivered cost).
P 9 September2010
� Proprietary, scalable salary packaging IT systems. Difficult and costly to replicate.
For
per
sona
l use
onl
y
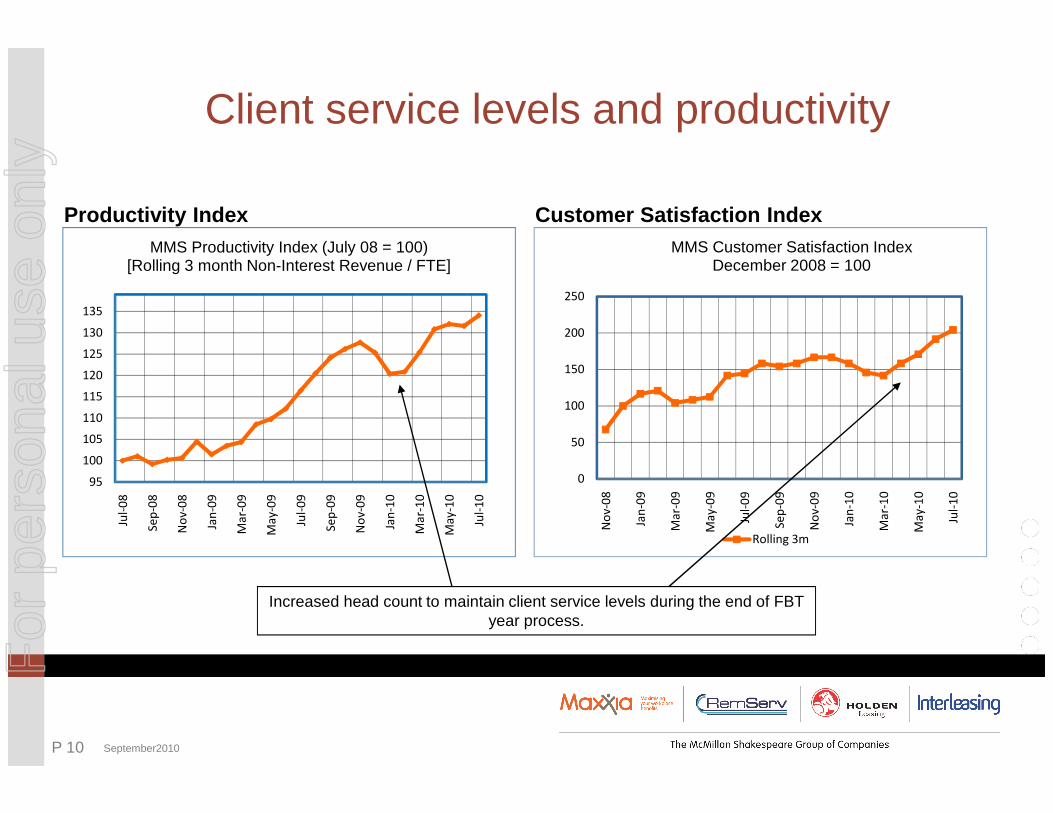
Client service levels and productivity
Customer Satisfaction IndexProductivity Index
115
120
125
130
135
MMS Productivity Index (July 08 = 100)[Rolling 3 month Non-Interest Revenue / FTE]
100
150
200
250
MMS Customer Satisfaction IndexDecember 2008 = 100
Increased head count to maintain client service levels during the end of FBT year process.
95
100
105
110
Jul-
08
Se
p-0
8
No
v-0
8
Jan
-09
Ma
r-0
9
Ma
y-0
9
Jul-
09
Se
p-0
9
No
v-0
9
Jan
-10
Ma
r-1
0
Ma
y-1
0
Jul-
10
0
50
100
No
v-0
8
Jan
-09
Ma
r-0
9
Ma
y-0
9
Jul-
09
Se
p-0
9
No
v-0
9
Jan
-10
Ma
r-1
0
Ma
y-1
0
Jul-
10
Rolling 3m
P 10 September2010
For
per
sona
l use
onl
y
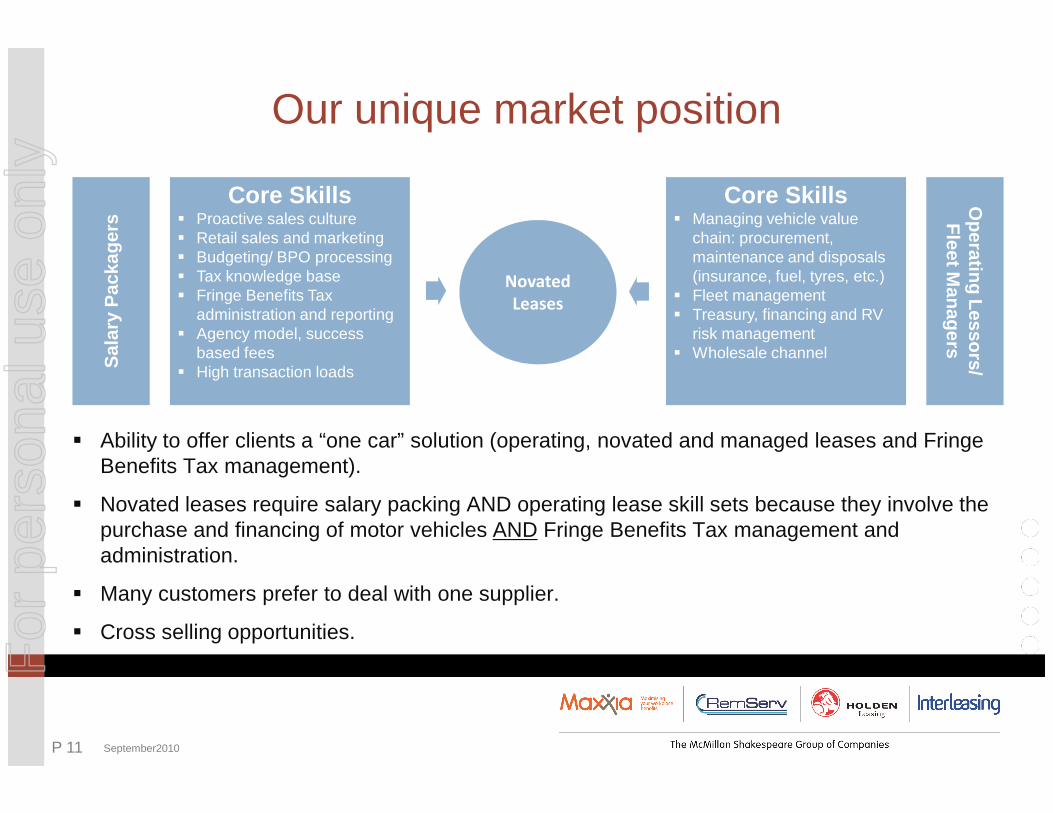
Our unique market positionS
alar
y P
acka
gers
Operating Lessors/ F
leet Managers
Core Skills� Proactive sales culture� Retail sales and marketing� Budgeting/ BPO processing� Tax knowledge base� Fringe Benefits Tax
administration and reporting� Agency model, success
based fees� High transaction loads
Core Skills� Managing vehicle value
chain: procurement, maintenance and disposals (insurance, fuel, tyres, etc.)
� Fleet management� Treasury, financing and RV
risk management� Wholesale channel
Novated
Leases
� Ability to offer clients a “one car” solution (operating, novated and managed leases and Fringe Benefits Tax management).
� Novated leases require salary packing AND operating lease skill sets because they involve the purchase and financing of motor vehicles AND Fringe Benefits Tax management and administration.
� Many customers prefer to deal with one supplier.
� Cross selling opportunities.
P 11 September2010
For
per
sona
l use
onl
y

Interleasing Australia (ILA)
Key Points
� Acquired in April 2010 for $208m, at a discount to net assets.
� Major passenger car and light commercial vehicle owner and fleet manager.
� Multi-brand fleet with exclusive rights to Holden Leasing brand.
� Provides operating and managed leases to corporate clients.
� Track record of managing the vehicle value chain.� Track record of managing the vehicle value chain.
� Conservative accounting, robust second hand car values, counter party risk controls.
� Salary packaging cashflows provide attractive debt market terms.
� Financing will include on balance sheet and off balance sheet facilities.
P 12 September2010
For
per
sona
l use
onl
y

Growth opportunities
Salary Packaging Synergies Asset Management
� Increase salary packages through higher penetration rate and new client wins.
� Cross-sell salary packaging and novated leases to ILA client base.
� Grow the loan book over time with operating and managed leases.
� Provide broader workplace benefits to clients’ employees.
� Cross-sell operating and managed leases to salary packaging client base.
� Grow in-life car services, reduce maintenance costs and manage the clients’ employees. packaging client base. costs and manage the vehicle value chain.
� Increase procurement, supply and financing of cars under novated leases.
� Deployment of purchasing power to generate greater procurement discounts and distribution fees.
� Conservative management of residual, credit and interest rate risk.
P 13 September2010
For
per
sona
l use
onl
y

How will MMS continue to grow?
� Market grows at 3-8%pa depending on economic conditions.
� See Appendices II and III for market overviews.
� Only around 12-14% of MMS target salary packaging market is outsourced.
� Improving employee participation rates with existing customers.
� Unique market offering creates new business and cross sell opportunities.
P 14 September2010
� Unique market offering creates new business and cross sell opportunities. Since the acquisition of Interleasing and Holden Leasing (1 April 2010) 8 new business contracts and 10 cross sell contracts achieved.
� High service levels/word of mouth promotion.
For
per
sona
l use
onl
y
Key Sensitivities
� New car sales market.
� Second hand car values.
� Interest rates.
� Interest rate margin on operating leases.
P 15 September2010
� Key contract tender.
� Economic conditions generally.
For
per
sona
l use
onl
y
AppendicesI Sources of Revenue
II Market opportunity
III Market opportunity (cont’d)
IV Credit Risk
V Interest Rate Risk
VI Residual Value Risk
VII Regulatory themes post Henry Inquiry
VIII Gearing
IX Debt facilities
X Share price chart
P 16 September2010
For
per
sona
l use
onl
y
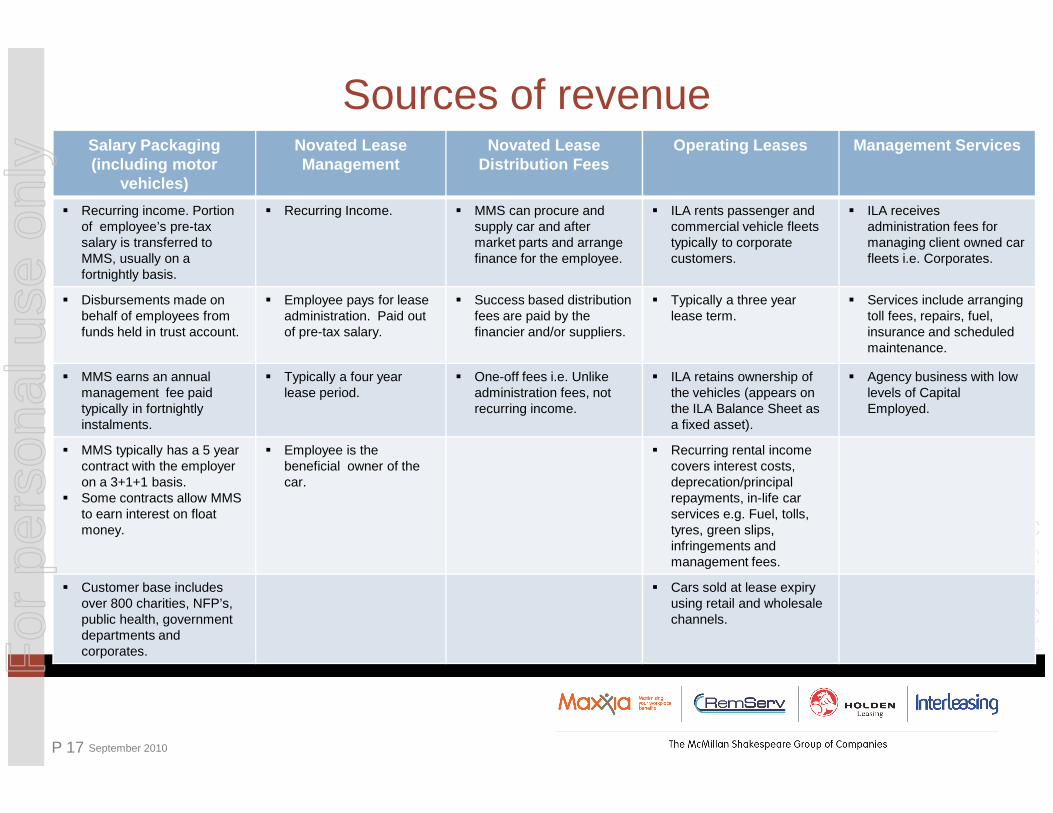
Sources of revenueSalary Packaging (including motor
vehicles)
Novated Lease Management
Novated Lease Distribution Fees
Operating Leases Management Services
� Recurring income. Portion of employee’s pre-tax salary is transferred to MMS, usually on a fortnightly basis.
� Recurring Income. � MMS can procure and supply car and after market parts and arrange finance for the employee.
� ILA rents passenger and commercial vehicle fleets typically to corporate customers.
� ILA receives administration fees for managing client owned car fleets i.e. Corporates.
� Disbursements made on behalf of employees from funds held in trust account.
� Employee pays for lease administration. Paid out of pre-tax salary.
� Success based distribution fees are paid by the financier and/or suppliers.
� Typically a three year lease term.
� Services include arranging toll fees, repairs, fuel, insurance and scheduled maintenance.
� MMS earns an annual management fee paid typically in fortnightly
� Typically a four year lease period.
� One-off fees i.e. Unlike administration fees, not recurring income.
� ILA retains ownership of the vehicles (appears on the ILA Balance Sheet as
� Agency business with low levels of Capital Employed.
P 17 September 2010
typically in fortnightly instalments.
recurring income. the ILA Balance Sheet as a fixed asset).
Employed.
� MMS typically has a 5 year contract with the employer on a 3+1+1 basis.
� Some contracts allow MMS to earn interest on float money.
� Employee is the beneficial owner of the car.
� Recurring rental income covers interest costs, deprecation/principal repayments, in-life car services e.g. Fuel, tolls, tyres, green slips, infringements and management fees.
� Customer base includes over 800 charities, NFP’s, public health, government departments and corporates.
� Cars sold at lease expiry using retail and wholesale channels.
For
per
sona
l use
onl
y

Full FBT Rebatable FBT $17,000 Exempt $30,000 Exemp t
Types of Employers Government departments.
Private companies.
Public companies.
Independent schools.
Sporting clubs.
Religious institutions.
Trade unions.
Public hospitals.
Private not-for-profit hospitals.
Public benevolent institutions.
Charities.
FBT Treatment FBT rate 46.5% on taxable value of benefits.
Certain benefits, including motor vehicles on novated leases are concessionally taxed.
Rebatable FBT on first $30,000 of grossed-up taxable value of benefits (46.5% rebate).
Equates to $16,050 of benefits concessionally taxed.
Full FBT on excess over $30,000.
FBT exempt on first $17,000 of grossed-up taxable value of benefits.
Equates to $9,095 of benefits.
Full FBT on excess over $17,000.
FBT exempt on first $30,000 of grossed-up taxable value of benefits.
Equates to $16,050 of benefits.
Full FBT on excess over $30,000.
Common Fringe Benefits Novated leases.
Associate leases.
Novated leases.
Additional superannuation.
Additional superannuation.
Mortgage/rent.
Additional superannuation.
Mortgage/rent.
Market opportunity
P 18 September 2010
Associate leases.
Additional superannuation.
Professional association membership fees.
Living away from home allowance.
Remote area housing allowance.
Additional superannuation.
Mortgage/rent.
In-house school fees.
Mortgage/rent.
Meal entertainment and venue hire.
Personal loans.
Living expenses.
Novated leases (not part of cap).
Mortgage/rent.
Meal entertainment and venue hire.
Personal loans.
Living expenses.
Novated leases (not part of cap).
Total workforce 10.7mBy sector 9.5m 1.2mMMS target market 2.5m 1.0mTypical participation 0-20% 59-90%Target participation 5-25% 80-90%Estimated outsourced participants 0.45mConclusion Large untapped market to exploitF
or p
erso
nal u
se o
nly
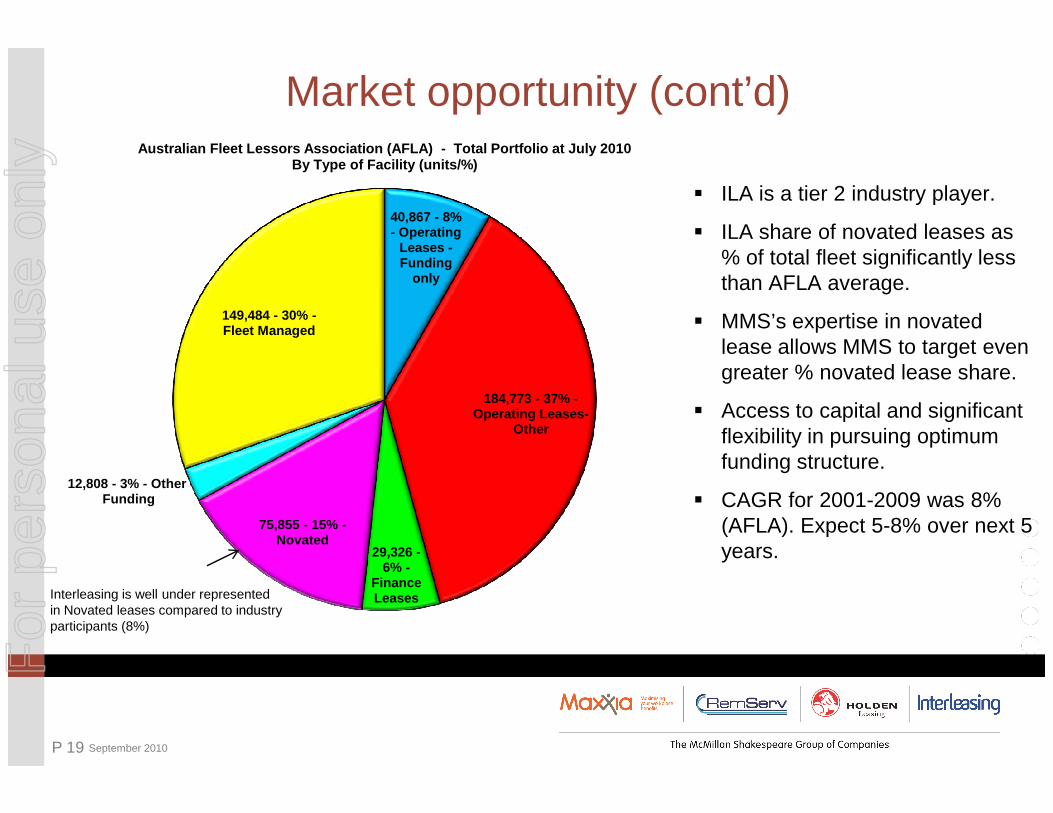
40,867 - 8% - Operating
Leases -Funding
only
184,773 - 37% -Operating Leases -
149,484 - 30% -Fleet Managed
Australian Fleet Lessors Association (AFLA) - Total Portfolio at July 2010 By Type of Facility (units/%)
Market opportunity (cont’d)
� ILA is a tier 2 industry player.
� ILA share of novated leases as % of total fleet significantly less than AFLA average.
� MMS’s expertise in novated lease allows MMS to target even greater % novated lease share.
� Access to capital and significant Operating Leases -Other
29,326 -6% -
Finance Leases
75,855 - 15% -Novated
12,808 - 3% - OtherFunding
P 19 September 2010
Interleasing is well under represented in Novated leases compared to industry participants (8%)
� Access to capital and significant flexibility in pursuing optimum funding structure.
� CAGR for 2001-2009 was 8% (AFLA). Expect 5-8% over next 5 years.
For
per
sona
l use
onl
y

Credit Risk
� All new business proposals reviewed prior to credit advanced, using robust rules.
� Annual reviews of all credit line facilities undertaken and more often if required.
� Credit default experience minimal over past 4 years.
� Appropriate securities such as guarantees, security deposits obtained where required.
The risk that customers can not pay their lease ins tallments or do notpay on time, resulting in losses on collecting moni es owed
� Appropriate securities such as guarantees, security deposits obtained where required.
� Direct debit is used to a high degree, increasing surety of payment.
� Credit Committee monitors risk and reports to Board monthly in accordance with Board approved policy.
� Defaults mitigated by fact that assets can be sold in liquid resale markets.
P 20 September 2010
For
per
sona
l use
onl
y

Interest Rate Risk
� Leases are for fixed terms at fixed interest rates.
� Revenue side locked in.
� McMillan matches to the profile of how leases amortise, the funding term of what we borrow.
The risk that as interest rates move up or down, th e net profit of thebusiness moves likewise
borrow.
� Derivatives can be used for this (ie: Interest Rate Swaps; Forward Rate Agreements) or funds can be borrowed for varying terms direct from lenders (i.e.: bullet terms to 5 years at a fixed rate).
ACCORDINGLY:
� Negligible interest rate risk results.
� Board policy in place – monitored monthly.
P 21 September 2010
For
per
sona
l use
onl
y

Residual Value Risk
� Approach used – highly professional and disciplined approach to pricing.
� People assessing and monitoring are car people with car knowledge.
� Monitoring of resale prices on a month to month basis.
The risk that the estimated future value used to ca lculate the monthly rentals higher than the actual sales proceeds recei ved on disposal of the
asset
� Monitoring of resale prices on a month to month basis.
� Reviewing future values of current leases on a quarterly basis.
� Monthly rental can be re-priced during term via reviewing actual versus estimated usage of the asset, as determined at inception.
P 22 September 2010
For
per
sona
l use
onl
y

Regulatory themes post Henry Inquiry
� Government has ruled out changes to Fringe Benefits Tax exemptions for Not-for-Profit’s “at any time”.
� Henry has recommended flat rate (20%) for FBT on motor vehicles. No government response, however, no material impact envisaged.
� Henry recommended government consider taxing fringe benefits via
P 23 September 2010
� Henry recommended government consider taxing fringe benefits via employees’ income tax returns rather the employers’ FBT return. No government response. MMS service still required under either scenario; salary packaged superannuation already taxed via employee.
For
per
sona
l use
onl
y
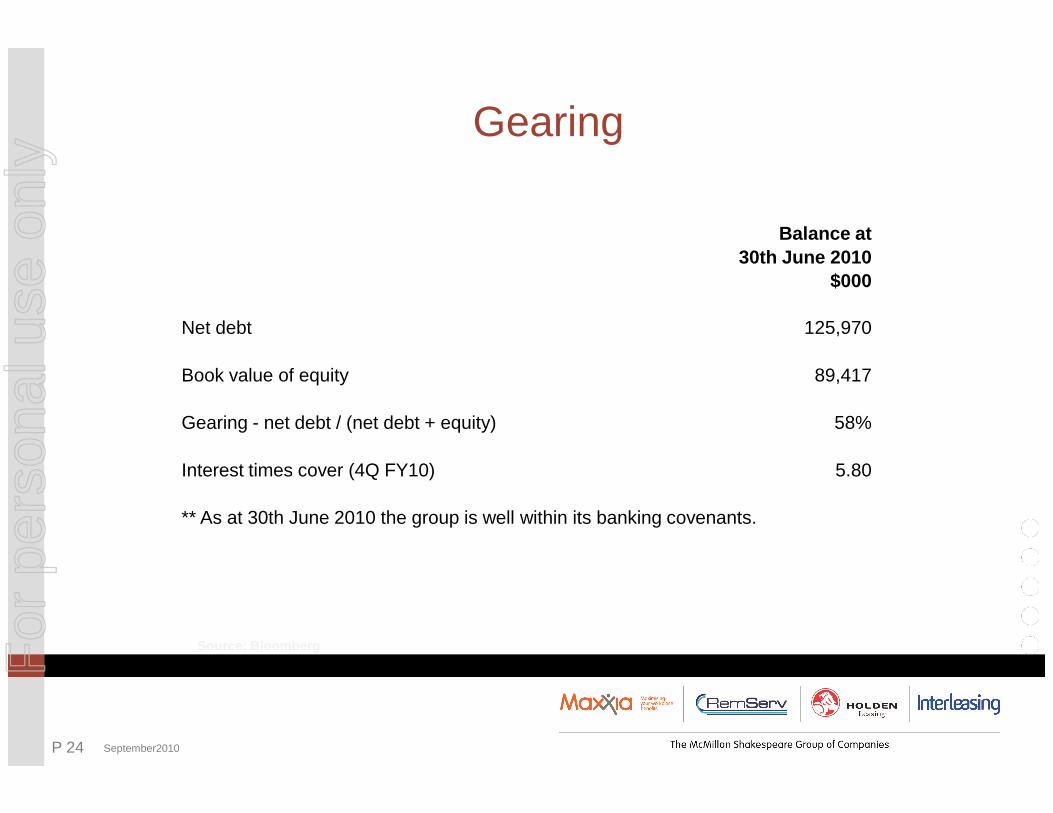
Gearing
Balance at 30th June 2010
$000
Net debt 125,970
Book value of equity 89,417
Source: Bloomberg
P 24 September2010
Gearing - net debt / (net debt + equity) 58%
Interest times cover (4Q FY10) 5.80
** As at 30th June 2010 the group is well within its banking covenants.
For
per
sona
l use
onl
y

Debt facilities
Existing bank facilities include:
� Facility A - $30.0 million debt funding provided to MMS(Termination date 31 March 2013) - amortises $4m every 6 months commencing December, 2010.
� Facility B - $5.0 million working capital facility provided to MMS (Termination
Source: Bloomberg
P 25 September2010
� Facility B - $5.0 million working capital facility provided to MMS (Termination date 31 March 2011).
� Facility C - $180.0 million debt funding provided to ILA (Termination date 2 years from commencement of facility).
Significant headroom within debt facilities to deliver on business plan.
For
per
sona
l use
onl
y

Share price chart
Source: Bloomberg
P 26 September2010
For
per
sona
l use
onl
y