for personal use only - australian securities exchange · blue energy’s sapphire block of atp814p...
TRANSCRIPT

F I N A N C I A L R E P O R T F O R T H E Y E A R
E N D E D 3 0 J U N E 2 0 1 3
BLUE ENERGY LIMITED ACN 054 800 378
For
per
sona
l use
onl
y

C O N T E N T S
BLUE ENERGY LIMITED AND CONTROLLED ENTITIES 2
Page
Directors’ Report 3
Corporate Governance Statement 14
Auditor’s Independence Declaration 18
Consolidated Statement of Comprehensive Income 19
Consolidated Statement of Financial Position 20
Consolidated Statement of Changes in Equity 21
Consolidated Statement of Cash Flows 22
Notes to the Financial Statements 23
Directors’ Declaration 42
Independent Auditor’s Report 43
Additional Shareholder Information 45
Corporate Directory 46
For
per
sona
l use
onl
y

D I R E C T O R S ’ R E P O R T
BLUE ENERGY LIMITED AND CONTROLLED ENTITIES
3
The Directors of Blue Energy Limited (“the Company”, “Blue Energy” or “BUL”) submit herewith their report on the Company and its controlled entities (“the Group” or “the Consolidated Entity”) with respect to the financial year ended 30 June 2013. DIRECTORS The names and particulars of the Directors of the Company in office during or since the end of the financial year are as follows:
Name Position Date Appointed Date Resigned/Retired
Peter Cockcroft Non-executive Chairman* 21/08/2008 31/12/2012 John Ellice-Flint ExecutiveDirector– Technical (Chairman*) 05/04/2012 Paul Massarotto Non-executive Director 13/02/2009 15/11/2012 Heung-Bog Lee Non-executive Director 01/10/2009 12/02/2013 John Phillips Managing Director (Executive) 28/06/2010 Karen Johnson Non-executive Director 30/09/2011 Rodney Cameron Non-executive Director 15/11/2011 Johoo Maeng Non-executive Director 12/02/2013
* Mr Peter Cockcroft stepped down as Chairman on 9 October 2012 at which time Mr John Ellice-Flint assumed the Chair. John Ellice-Flint BSc (Hons) Harvard, AMP Mr John Ellice-Flint is an Australian-born business man whose foresight and wide-ranging oil and gas industry credentials are recognised internationally. John has over 40 years of exploration, production, operations and commercial experience in the oil and gas industry and has held many senior positions with multinational exploration and production companies. John’s achievements in the oil and gas industry are well-known and highly respected. Following a 26 year international career at Unocal Corporation, serving in a variety of senior executive roles within strategic planning, exploration and technology functions, John became Managing Director and CEO of Santos Limited, Australia’s largest domestic gas producer, from 2000 – 2008. John guided Santos Limited through a major growth period which culminated in the recognition of the potential of coal seam gas development through the Gladstone LNG export project in Queensland. John Phillips BSc (Hons), GAICD John is a Petroleum Geologist with 30 years experience in the oil and gas industry. John joined Blue Energy as Chief Operating Officer in May 2009, was promoted to CEO in April 2010 and joined the Board of Blue Energy in June 2010. John’s career in indus try has involved conventional oil and gas and coal seam gas experience in a variety of petroleum basins both domestically and internationally. John has gained extensive operational experience through his involvement with Delhi Petroleum, Esso, Conoco, Petroz and Novus, culminating in his role as Chief Operating Officer with Sunshine Gas before its takeover by QGC and subsequently by the BG Group. Rodney Cameron BComm (Hons), MBA, MFM, FAICD, CPA Rodney has over 30 years industry experience, particularly in the energy and resources industries. He is a seasoned financial execut ive having been CFO for an ASX listed multi-national renewable energy company, as well as an executive director and CFO for a US multi-national independent power generation company. Rodney has also worked in various management capacities for National Australia Bank, Rio Tinto, Telstra, and Atlantic Richfield Inc. Karen Johnson BComm, FCA Over the last 20 years Karen has held senior roles specialising in audit, assurance, technical and corporate governance consulting and financial accounting engagements within Chartered Accounting firms, public sector entities and public companies.Karen brings to the Board strong technical accounting skills through knowledge and application of Australian Accounting and Auditing Standards and an ability to quickly grasp complex business operations and identify the key risk areas for analysis, risk assessment and critical evaluation. Jooho Maeng B.Man, MBA Mr Jooho Maeng is the nominee of Korea Gas Corporation (KOGAS), the largest LNG importer in the world. He has gained his extensive knowledge and experience in Asian LNG Markets over the last 20 years in roles within KOGAS. During this time, he has built st rong relationships with LNG companies in Japan and China. He also has over 10 years’ experience in the development of projects such as DS LNG, LNG Canada, Prelude and GLNG. With respect to the Prelude and GLNG Project, Mr Maeng has been involved from the beginning of these projects. This keen interest in the Australian gas industry has led to his appointment as a director of KOGAS Australia, one of the four shareholders in the GLNG Project. Directorships of other listed companies Directorships of other listed companies held by current Directors in the three years immediately before the end of the financial year are as follows: Name Company Period of directorship John Ellice-Flint Clean Seas Tuna Limited (ASX:CSS) Dec 2009 to May 2012 COMPANY SECRETARY The Company Secretary is Stuart Owen,appointed 14 July 2010. Mr Owen is also Chief Financial Officerand has a wide experience in the energy sector in coal and gas fired power generation including the use of landfill gas and liquefied natural gas. Stuart has held wide ranging commercial management and finance roles, including as Commercial Manager for Energy Developments Limited. Prior to this role, Stuart was commercial manager on the delivery of a multi-site gas fired power generation project and micro LNG plant. Stuart also has experience in the project financing, mergers and acquisitions and project development. EARNINGS PER SHARE 2013 2012
(Cents) (Cents)
Basic loss per share (1.14) (1.21)
Diluted loss per share (1.14) (1.21)
For
per
sona
l use
onl
y

D I R E C T O R S ’ R E P O R T
BLUE ENERGY LIMITED AND CONTROLLED ENTITIES
4
DIVIDENDS No dividends were paid or declared by the Company during the financial year. The Directors do not recommend the payment of a dividend (2012: $Nil). PRINCIPAL ACTIVITIES Blue Energy Limited is an energy company that undertakes the exploration, evaluation and development of conventional and unconventional oil and gas resources. This activity is carried out in a single significant geographical segment, being Australia, principally in Queensland. There has been no change in the principal activities of the Company from the prior year. OPERATING AND FINANCIAL REVIEW Marburg Oil Prospect ATP854P (100% Blue Energy) The Blue Energy technical team has identified a large untested conventional structural trap within the southern part of the wholly-owned ATP854P permit following the Company’s normal technical review process of existing data. Blue Energy is currently undertaking negotiations for access to the land to drill Marburg 1.Named the Marburg Prospect, this feature has been mapped using different vintage pre-existing seismic data and adjacent well data. The mapping has resulted in the delineation of structural closure with up to 55 metres of vertical relief and over an area of approximately 39km2. The location of the Marburg Prospect is immediately adjacent to the basin bounding fault which separates the Taroom Trough source rock depocentre from the Roma Shelf area. Volumetric estimation of potential mean recoverable oil reserves for the Marburg Prospect is 14 million barrels (mmstb). The volumetric range of reserves is assessed (internally) to be 1.7mmstb (P90) to 35mmstb (P10). This case envisages both gas and oil fill of the structure. Should the structure be filled with oil only, the upside potential (P10) could be in the order of 80-90mmstb. Blue Energy has also assessed the geological chance of success of this oil exploration prospect at approximately 13% on the drilling and test ing of the Marburg 1 well.
Location of the Marburg Oil Prospect ATP854P Seismic line AR91-2 displays robust structural feature with
up to 55m vertical relief
For
per
sona
l use
onl
y

D I R E C T O R S ’ R E P O R T
BLUE ENERGY LIMITED AND CONTROLLED ENTITIES
5
Reserve and Resource Upgrades During the year the Company achieved its maiden 2P gas reserves of 50 Petajoules (PJ) and a 149% increase in its 3P gas reserves to 187PJ in the Company’s wholly-owned ATP814P in the Bowen Basin, Queensland.The upgraded gas reserves follow an independent annual review of data associated with the Sapphire and South Blocks of ATP814P by Netherland, Sewell and Associates Inc. (NSAI). Blue Energy’s Sapphire Block of ATP814P is located immediately adjacent to Arrow Energy’s Moranbah Gas Project which currently supplies gas to Townsville users but is also targeted to provide feed gas for Arrow Energy’s proposed LNG export facility in Gladstone.
Permit Block 1C (PJ) 1P (PJ) 2C (PJ) 2P (PJ) 3C (PJ) 3P (PJ)
ATP854P 23 - 49 - 103 -
ATP813P - - 43 - 544 -
ATP814P Sapphire 76 - 128 50 225 179.7
Central 28 - 102 - 463 -
Monslatt - - 481 - 1,711 -
Lancewood 5 - 23 - 439 0.8
South 15 - 27 - 30 6.5
Total (PJ) 146 - 852 50 3,516 187
Total (bcf) 146 - 852 50 3,516 187
Competent Person Statement The estimates of Reserves and Contingent Resources have been provided by Mr John Hattner of NSAI. Mr Hattner is a full time employee of NSAI, has over 30 years of industry experience and 20 years experience in reserve estimation, is a licensed geologist, and has consented to the use of the information presented herein. The estimates in the report by Mr Hattner have been prepared in accordance with the definitions and guidelines set forth in the 2007 Petroleum and Resource Management System (PRMS) approved by the Society of Petroleum Engineers (SPE). ATP814P
Work has continued within the Monslatt Block to gather data to allow the currently identified contingent resources to be converted into reserves for the P-seam. Production testing has been ongoing with the aim of establishing commercial gas flow rates. To date flow rates achieved have not reach the commerciality threshold. Further analysis and testing will be undertaken during 2013. The vertical Monslatt 7 and its in-seam Monslatt 8H is continued to be tested during the year. To date there has been no material increase in gas flow rates from that achieved during initial testing. The testing was initially suspended for a period during the second half of 2012 and then again in April 2013, with a significant amount of reservoir data gathered. This data is currently being assessed to determine future plans for the well. Production testing of the Sapphire 4 Pilot Production Test well (drilled late 2011) continued during the year, with gas flowing continuously, but at rates which remain below commercial levels from the Fort Cooper Coal Measures. A hydraulic fracture stimulation process on the perforated interval in the well has been undertaken and the well placed back in testwith a significant amount of reservoir data gathered. The well is currently suspended and the data is being assessed to determine future plans for the well.
For
per
sona
l use
onl
y

D I R E C T O R S ’ R E P O R T
BLUE ENERGY LIMITED AND CONTROLLED ENTITIES
6
ATP1114A, 1117A, 1123A – Southern Georgina Basin Qld
The Company was successful in securing three large exploration blocks in the Queensland sector of the Southern Georgina Basin. The blocks secured by Blue Energy cover an area of approximately 5,630,000 acres (22,788km2). At this stage, award of the blocks requires both Native Title Agreements to be negotiated and Environmental Authorities to be issued by the Queensland Government. Blue Energy has initiated discussions with the representatives of the Bularnu Waluwarra and Wangkayujuru People with a view to commencing negotiations shortly. Blue Energy’s Georgina Basin blocks are located on the Queensland / Northern Territory border and partly adjoin the permits recently farmed out by Petrofrontier to Statoil, the Norwegian national oil company, for US$210 million. The potential of the basin has been documented by Ryder Scott in a report for Petrofrontier which estimates potential of up to 40 billion barrels of oil (unrisked high side prospective resource) in their acreage. During the June 2013 quarter Statoil renegotiated the farm-in agreement with Petrofrontier which will see Statoil take a larger interest in the permits and also become Operator from 1 September 2013. Statoil’s commitment to the farm-in agreement and the Georgina basin indicates that it believes in the prospectivity and potential of the basin and is prepared to commit significant capital expenditure to explore the region. The hydrocarbon potential of the area has been identified with both conventional and unconventional hydrocarbon plays being developed by various Operators in the basin and confirmed by the intersection of oil and gas bearing sections in wells drilled recently in the western portion of the basin and wells drilled in the eastern section. ATP613P, 674P & 733P
The Company entered in a farm-in agreement with Magellan Petroleum (Eastern) Pty Ltd and is currently earning into these Maryborough Basin exploration permits through completion of the work program. Magellan subsequently sold these assets to Australian Unconventional Gas Limited, a subsidiary of Adelaide Energy Limited which has now been taken over by Beach Energy Limited (“Beach”) and as such the farm-in agreement is now between the Company and Beach Energy Limited. In late December 2012 the two application areas (ATP674A and ATP733A) were granted and planning is being undertaken to identify suitable location for exploration and evaluation activity on these permits. Cooper Basin 600 Series With Native Title Agreements now in place for all of Blue Energy’s Cooper Basin Application areas, the next step before grant of these areas is the issuing of Environmental Authorities by the Queensland Government. Once this is completed Blue Energy will be in a position to commence its year one work program. Drillsearch Energy Limited (“Drillsearch”), Senex Energy Limited and Beach are all active in the area on both the South Australia and Queensland sides of the boarder. The recent farm-in deal between Santos Ltd and Drillsearch on ATP549P (adjacent to Blue Energy’s ATP656A) adds to the interest in the region. Significant potential exists in these permit areas, as evidenced by the nearby Inland oil field (production from the Jurassic Birkhead Formation, Namur Sandstone Member as well as the Murta Member), the Cook Oil Field (Hutton oil pool) and the Cuisinier Oilfield (Murta oil) to the south east. Blue Energy will be targeting these plays, together with the Permian and Triassic sequences and the unconventional Tertiary Toolebuc Formation shale play. Activity on this northern flank of the Cooper Basin is beginning to ramp up as Operators recognise that this area has similar potent ial to the western, eastern and southern flanks of the Cooper Basin, where Permian generated liquids have migrated into the overlying Jurassic reservoirs on the flanks of the basin. The key to unlocking the Northern Flank area of the Cooper Basin in Queensland will be the acquisition processing and interpretation of modern 2D and especially 3D seismic data. These techniques have been successfully used elsewhere on the margins of the basin and yielded exceptionally high drilling success ratios. Other ATP’s
The Company is continuing to undertake geological and geophysical activities on the remainder of the ATP’s to prioritise exploration and evaluation expenditure and ensure the most cost effective and timely identification of reserves. The Board made a decision to fully impair the carrying values of ATP817P, ATP818P and ATP819P as it is unlikely that further exploration activities will be undertaken in these permits and that they will be surrendered to the Government on expiry of the current 4 year permit duration in February 2014. KOGAS KOGAS exercised its farm-in option in relation to ATP814P, bringing the option period to a close. Discussions between the parties, on a non-exclusive basis, were undertaken, however KOGAS was not in a position to enter into a farm-in agreement.
Settlement of ODIN Litigation In November 2008 Odin Energy Limited (“Odin”) commenced proceedings in the Federal Court in Perth relating to a Sub -Farm-in Agreement between Odin and Blue Energy regarding the Spinel Block on PEL 106. During September 2012 Odin and Blue Energy reached a mediated settlement on terms confidential to the parties.The proceedings were otherwise dismissed. Funding Arrangements The Company continues to hold sufficient cash reserves to enable the rollout of its planned work programs. Future capital raising activities will take place if and when the Board deem that such a raising of funds is appropriate. Financial Position The net assets of the Consolidated Entity have decreased by $10.750 million from 30 June 2012 to $73.485 million at 30 June 2013. The decrease has largely resulted from operational costs incurred during the financial year. The Consolidated Entity incurred a loss after income tax for the year of $13.0 million (2012: $9.9 million).
For
per
sona
l use
onl
y

D I R E C T O R S ’ R E P O R T
BLUE ENERGY LIMITED AND CONTROLLED ENTITIES
7
SIGNIFICANT CHANGES IN THE STATE OF AFFAIRS There have been no significantchanges in the state of affairs of the Company and Consolidated Entity during the financial year. EVENTS AFTER BALANCE DATE From 1 July to the date of this report there have been no material events other than those detailed below. Wiso Basin Farm-in On 8 August 2013 the Company announced that it had entered into a binding term sheet with Australian Oil and Gas Limited (“AOG”) in relation to nine large exploration blocks in the Wiso Basin in the Northern Territory. The proposed farm-in agreement – to be undertaken by a Blue Energy wholly-owned subsidiary – involves a total area of 111,887 square kilometres (27.6 million acres) of the Northern Territory (NT). Key Points:
· 111,887km2 (27.6 million acres) in area, with conventional and unconventional oil and gas potential over 9 contiguous blocks
· Dominant basin position
· Staged farm-in agreement
· 50% equity on completion of farm-in work program
· Blue Energy to become operator at commencement of farm-in
· The cost of the farmin in the first 2 years (from award of the permits) is estimated at $3 million
LIKELY DEVELOPMENTS AND EXPECTED RESULTS The Company expects to continue to operate as an oil and gas exploration company with specific operational focus on conventional and unconventional exploration within Queensland and the Northern Territory. ENVIRONMENTAL REGULATION AND PERFORMANCE The Group holds various licences to regulate its exploration activities in Australia. These licences include conditions and regulations with respect to the rehabilitation of areas disturbed during the course of its exploration activities. All exploration activities have been undertaken in compliance with all relevant environmental regulations. INDEMNIFICATION AND INSURANCE OF DIRECTORS AND OFFICERS The Company has an insurance policy in place to provide Directors’ and Officers’ liability insurance pursuant to a Deed of Indemnity entered into by the Company with each Director and certain Officers of the Group. The Directors have not included details of the nature of the liabilities covered or the amount of the premium paid in respect of the Directors’ and Officers’ liability as such disclosures are prohibited under the terms of the contract. Other than stated above, the Grouphas not during, or since the financial year ended, agreed to indemnify an Officer of the Group and the auditor against a liability arising from acts carried out in their position as an Officer of the Group.
For
per
sona
l use
onl
y

D I R E C T O R S ’ R E P O R T
BLUE ENERGY LIMITED AND CONTROLLED ENTITIES
8
REMUNERATION REPORT (Audited) The Company’s broad remuneration policy is to ensure each remuneration package properly reflects the person’s duties and responsibilities and that remuneration is competitive in attracting, retaining and motivating people of the highest quality. The objective of the Company’s executive reward framework, which currently applies to Mr John Phillips (MD), Mr Stuart Owen (CFO and Company Secretary) and Mr John Ellice-Flint (Technical Director), is to ensure reward for performance is competitive and appropriate for the results delivered. The framework aligns executive reward with achievement of strategic objectives and the creation of value for shareholders, and conforms to market best practice for delivery of reward. The Board ensures that executive reward satisfies the following key criteria for good reward governance practices: • competitiveness and reasonableness, • acceptability to shareholders, • transparency, and • capital management. The Company has structured an executive remuneration framework that is market competitive and compliments to the reward strategy of the organisation. An independent review of the Company’s executive remuneration framework has recently been undertaken and the findings will be implemented in the coming year.
2013
Short-Term Post
Employment Share-based
Payments
Proportion of Remuneration Performance
Related
Value of Options/Rights as a Proportion
of Remuneration
Salary & fees
Cash bonus
Other benefits
Super- annuation
Termination benefits
Options/ Rights
Total
$’000 $’000 $’000 $’000 $’000 $’000 $’000 % % Directors P Cockcroft(1) 37 - - - - - 37 0% 0% P Massarotto(2) 26 - - - - - 26 0% 0% HB Lee(3) 5 - - - - - 5 - - K Johnson 60 - - 5 - - 65 - - R Cameron 65 - - - - - 65 - - J Maeng(4) - - - - - - - - - TOTAL 193 - - 5 - - 198 0% 0%
Executive Directors
J Phillips 375 - 15 25 - 310 725 39% 43% J Ellice-Flint 200 - - 18 - 1,231 1,449 85% 85% TOTAL 575 - 15 43 - 1,541 2,174 70% 71%
Executives S Owen(5) 282 1 5 20 - 210 518 36% 40% C Hefner(6) 234 - 17 21 - 174 446 31% 39% TOTAL 516 1 22 41 - 384 964 34% 40%
TOTAL 1,284 1 37 89 - 1,925 3,336 55% 58%
(1) Mr Cockcroft retired from the Board on 31 December 2012. (2) Mr Massarotto retired from the Board on 15 November 2012. (3) Mr Lee retired from the Board on 12 February 2013. (4) Mr Maeng was appointed to the Board on 12 February 2013. (5) Mr Owen was paid a cash bonus in accordance with the exercise conditions of the Employee Incentive Rights Plan. (6) Mr Hefner left the Company on 1 May 2013 at the expiration of his contract.
For
per
sona
l use
onl
y

D I R E C T O R S ’ R E P O R T
BLUE ENERGY LIMITED AND CONTROLLED ENTITIES
9
2012
Short-Term Post
Employment Share-based
Payments
Proportion of Remuneration Performance
Related
Value of Options/Rights as a Proportion
of Remuneration
Salary & fees
Cash bonus
Other benefits
Super- annuation
Termination benefits
Options/ Rights
Total
$’000 $’000 $’000 $’000 $’000 $’000 $’000 % % Directors P Cockcroft 90 - - - - 92 182 50% 50% P Massarotto 75 - - - - 31 106 29% 29% HB Lee 60 - - - - - 60 - - K Johnson(1) 41 - - 4 - - 45 - - R Cameron(2) 51 - - - - - 51 - - TOTAL 317 - - 4 - 123 444 28% 28%
Executive Directors
J Phillips 353 - 25 49 - 134 561 22% 24% J Ellice-Flint(3) 47 - - 4 - 3,150 3,201 4% 4% TOTAL 400 - 25 53 - 3,284 3,762 4% 7%
Executives(4) S Owen 279 3 10 24 - 180 496 31% 36% C Hefner 256 3 25 24 - 35 343 9% 10% TOTAL 535 6 35 48 - 215 839 22% 26%
TOTAL 1,252 6 60 105 - 3,622 5,045 11% 12%
(1) Mrs Johnson joined the Board on 30 September 2011. (2) Mr Cameron joined the Board on 15 November 2011. (3) Mr Ellice-Flint joined the Board on 5 April 2012. His share-based payments number includes 41,236,500 shares issued on sign on
valued at $3,010,265. (4) Mr Owen and Mr Hefner were paid discretionary cash bonuses based on individual and company performance for the year ended
30 June 2011 in line with other Blue Energy employees.
Details of Remuneration of Directors and Other Key Management Personnel Directors On appointment to the Board, all Directors agree to terms of appointment as set out in a letter of appointment. The letter sets out the remuneration applicable and other matters such as general Directors’ duties, compliance with the Company’s Corporate Governance Policies, access to independent professional advice and confidentiality obligations. The Chairman, provided they are Non-executive, receives fees of $85,000 (2012: $85,000) per annum and Directors receive fees of $60,000 (2012: $60,000) per annum, inclusive of compulsory superannuation where applicable. Directors who are appointed to committees of the Board receive an additional $5,000 (2012: $5,000) per annum per committee position inclusive of compulsory superannuation where applicable. There are no termination payments applicable. The terms of appointment also include the reimbursement of reasonable business-related expenses including accommodation and other expenses that a Director or other Executive properly incurs in attending meetings of Directors or any meetings of committees of Directors, in attending any meetings of Members and in connection with the business of the Company. A Director may be paid fees or other amounts as the Directors determine where a Director performs duties or provides services outside the scope of their normal Director’s duties. Mr John Phillips (MD/CEO) – The contract entered into with Mr Phillips for 3 years commencing 1 April 2010 has been extended for an additional year to 31 March 2014 and incorporates termination clauses in the event of breaches by either party up to a maximum of six months’ total fixed remuneration or otherwise on three months’ notice. Mr John Ellice-Flint (Technical Director) - On 15 February 2012, the Company entered into an employment agreement with Mr John Ellice-Flint which was subject to Shareholders approving his appointment as a Director. His appointment as Executive Director and his remuneration package was approved by shareholders at the General Meeting held on 5 April 2012.The employment agreement provides thata termination payment equal to one year’s base salary if the Company terminates Mr Ellice-Flint’s employment other than in certain circumstances. Mr Ellice-Flint can terminate the agreement by giving one month’s notice to the Company. The agreement terminates automatically if he is removed as a Director under Part 2D.6 of the Corporations Act and Mr Ellice-Flint must resign as a director if his employment agreement is terminated for any reason. Mr Ellice-Flint does not receive any additional fees as Chairman. Other Key Management Personnel Key Management Personnel may be employed by the Company under a contract. At the date of this report, the following contract had been entered into with the following key management personnel: Mr Stuart Owen (CFO/Company Secretary) – A contract has been entered into with Mr Owen for 3 years commencing 1 July 2011 incorporating a termination clause in the event of breaches by either party up to a maximum of six months’ total fixed remuneration or otherwise on three months’ notice.
For
per
sona
l use
onl
y

D I R E C T O R S ’ R E P O R T
BLUE ENERGY LIMITED AND CONTROLLED ENTITIES
10
Elements of Remuneration Related to Performance No element of the Director’s or Executive’s remuneration is currently dependent on the satisfaction of a related individual performance condition. Interests in Options and Employee Incentive Rights of the Company The movement in the number of options and employee incentive rights over ordinary shares in Blue Energy Limited held directly, indirectly or beneficially, by each Key Management Person, including their related parties, is as follows: 2013 Balance at
30 June 2012
Granted as compensation
Exercised Expired
Ceased being KMP
Balance at 30 June
2013
Vested and Exercisable at 30 June
2013
Expensed during year ended 30 June 2013
Percentage remuneration
represented as options/rights
Number Number Number Number Number Number Number $’000 % Directors P Cockcroft 4,000,000 - - - 4,000,000 - - - 0% J Phillips 9,434,000 3,467,000 - - - 12,901,000 267,000 310 43% P Massarotto 1,200,000 - - - 1,200,000 - - - 0% J Ellice-Flint 82,473,000 - - - - 82,473,000 - 1,231 85% TOTAL 97,107,000 3,467,000 - - 5,200,000 95,374,000 267,000 1,541 69%
Executives S Owen 6,427,000 1,791,000 167,000 2,833,000 - 5,218,000 187,000 210 40% C Hefner 3,270,000 1,676,000 - 4,427,000 519,000 - - 174 39% TOTAL 9,697,000 3,467,000 167,000 7,260,000 519,000 5,218,000 187,000 384 40%
Value of Employee Incentive Rights issued to Directors and Other Key Management Personnel During the financial year employee incentive rights were granted as equity compensation benefits under the terms of agreements with key management personnel as disclosed below. The employee incentive rights were granted for $nil consideration. Each employee incentive right entitles the holder to subscribe for one fully paid ordinary share in Blue Energy at the stated exercise price.
2013 Vested Granted Terms and Conditions of Each Grant
Number
Number
Grant Date
Fair Value per right at grant date
$
Exercise price per share
$ Directors
J Phillips A - 267,000 15/11/2012 0.059 nil
B - 3,200,000 15/11/2012 0.012 nil
- 3,467,000
Executives
S Owen A - 199,000 15/11/2012 0.059 nil B - 1,592,000 15/11/2012 0.012 nil - 1,791,000
C Hefner A - 186,000 15/11/2012 0.059 nil B - 1,490,000 15/11/2012 0.012 nil - 1,676,000
None of the options or employee incentive rights issued during the financial year by the Company to current Directors or Key Management Personnel are quoted on the Australian Stock Exchange or had been exercised during the financial year or up to the date of this report. Interests in Shares of the Company The movement during the year in the number of ordinary shares in the Company held directly, indirectly or beneficially, by each key management person, including their related parties, is as follows:
2013
Balance at 30 June 2012
Granted as compensation
On exercise of Rights
On Market Purchase
Net Change Other*
Balance at 30 June 2013
Number Number Number Number Number Number
Directors
P Cockcroft * 149,178 - - - (149,178) - J Phillips 294,799 - - - - 294,799
P Massarotto * 1,752,000 - - - (1,752,000) - John Ellice-Flint 57,211,615 - - 745,000 - 57,956,615 TOTAL 59,407,592 - - 745,000 (1,901,178) 58,251,414
Executives
S Owen 456,198 - 150,870 400,000 - 1,007,068 C Hefner * 131,000 - - - (131,000) - 587,198 - 150,870 400,000 (131,000) 1,007,068
* No longer key management person.
For
per
sona
l use
onl
y

D I R E C T O R S ’ R E P O R T
BLUE ENERGY LIMITED AND CONTROLLED ENTITIES
11
Unissued Shares At balance date there were 90,673,000 unissued ordinary shares under option and 17,734,000 unissued ordinary shares under employee incentive rights (90,673,000 and 15,893,000 respectively at the date of this report). Refer to the table below and Note 13 – Issued Capital for details. Option Details
Grant Date Exercise Date Expiry Date
Exercise Price
$
Fair value
at Grant Date
$
Number of options at beginning of period
Options Granted
Options Lapsed
Options Exercised
Number of options at 30 June
2013
Number of options
vested and exercisable at 30 June
2013
Sep-08 Qtr(a) Aug-10 Aug-13 0.25 0.22 1,133,334 - 1,133,334 - - -
Sep-08 Qtr(a) Sep-10 to Aug-11 Sep-12 to Aug-13 0.25 0.22 1,133,334 - 1,133,334 - - -
Sep-08 Qtr(a) Sep-11 to Aug-12 Sep-12 to Aug-13 0.25 0.21 1,133,332 - 1,133,332 - - -
9-Jan-09(a) 9-Jan-10 8-Jan-14 0.25 0.13 20,000 - 20,000 - - -
9-Jan-09(a) 9-Jan-11 8-Jan-14 0.25 0.13 20,000 - 20,000 - - -
9-Jan-09(a) 9-Jan-12 8-Jan-14 0.25 0.13 20,000 - 20,000 - - -
1-May-09(a) 1-May-10 30-Apr-14 0.25 0.17 833,333 - - -
- 833,333 -
1-May-09(a) 1-May-11 30-Apr-14 0.25 0.17 833,333 - - -
- 833,333 -
1-May-09(a) 1-May-12 30-Apr-14 0.25 0.16 833,334 - - -
- 833,334 -
4-Dec-09(a) 4-Dec-10 4-Dec-14 0.25 0.12 3,866,666 - --- - 3,866,666 -
4-Dec-09(a) 4-Dec-11 4-Dec-14 0.25 0.12 666,667 - - -
- 666,667 -
4-Dec-09(a) 4-Dec-12 4-Dec-14 0.25 0.11 666,667 - - - 666,667 -
17-Feb-10 17-Feb-10 17-Feb-13 0.25 0.07 4,000,000 - 4,000,000 - - -
12-Mar-10(a) 12-Mar-11 11-Mar-15 0.25 0.11 546,664 - 379,998 - 166,666 -
12-Mar-10(a) 12-Mar-12 11-Mar-15 0.25 0.10 546,667 - 380,000 - 166,667 -
12-Mar-10(a) 12-Mar-13 11-Mar-15 0.25 0.10 546,669 - 380,002 - 166,667 -
5-Apr-12 5-Apr-12 14-Feb-17 0.0625 0.05 82,473,000 - - - 82,473,000 -
99,273,000 - 8,600,000 - 90,673,000 -
Weighted average exercise price 0.09 - 0.25 - 0.08 -
Weighted average remaining contract life is 1,247 days
Total expense recognised $1,340,918 (2012: $690,705)
No options were granted during the year
Fair value of options lapsed during the year was $1,245,572
(a) Options granted under the current Employee Share Option Plan (ESOP)
None of the options issued by the Company are quoted on the Australian Stock Exchange. No options over shares lapsed between 30 June 2013 and the date of this report. The options do not entitle the holder to participate in any dividends or pro-rata share issues of the Company. For comparative information, refer to Note 13. Rights Details
Effective Grant Date
Exercise Date
Type of Right
Exercise Price
$
Fair value at Grant Date
$
Number of Rights at beginning of period
Rights Granted
Rights Lapsed
Rights Vested
Number of Rights at 30 June
2012
01-Jul 10 30-Jun-13 Retention nil $0.135 1,145,000 - - 1,145,000 -
01-Jul 10 30-Jun-13 Performance nil $0.095 1,333,000 - 1,333,000 - -
01-Jul 10 30-Jun-13 Performance nil $0.095 6,146,000 - 1,453,000 - 4,693,000
01-Jul-11 30-Jun-14 Retention nil $0.064 1,311,000 - 96,000 395,000 820,000
01-Jul-11 30-Jun-14 Performance nil $0.026 6,206,000 - 1,453,000 - 4,753,000
01-Jul-12 30-Jun-15 Retention nil $0.059 - 1,337,000 201,000 301,000 835,000
01-Jul-12 30-Jun-15 Performance nil $0.012 - 6,282,000 1,490,000 4,792,000
16,141,000 7,619,000 6,026,000 1,841,000 15,893,000
Weighted average exercise price – nil
Weighted average remaining contract life is 386 days
Total expense recognised $717,599 (2012: $204,328)
Fair value of rights granted during the year was $154,267
Fair value of rights lapsed during the year was $356,090
Fair value of rights exercised during the year was $22,545. 150,870 shares were issued on the exercise of rights. 1,841,000 rights vested at 30 June
2013 and were exercised during August 2013. For comparative information, refer to Note 13.
For
per
sona
l use
onl
y

D I R E C T O R S ’ R E P O R T
BLUE ENERGY LIMITED AND CONTROLLED ENTITIES
12
The fair value of performance rights granted during the year was calculated using the Binomial pricing model utilising the following inputs:
Note - Exercise price - Current Share Price - Barrier - Exercise date
1 2
$0.00 $0.059 $0.51
30 June 2015 - Vesting Period 3 Years - Expected share price volatility 3 70% - Risk free interest rate - Dividend yield
4 5
2.42% 0%
1. In substance, the performance rights is an option with a zero exercise price. 2. The underlying share price is based on the price of the security on the ASX on 30 June 2012. 3. The recent volatility of the share price of Blue Energy was calculated using Hoadley’s volatility calculator, using data extracted from
Bloomberg. 4. The risk free rate is the Commonwealth Government securities rate with a maturity date approximating that of the expiration period of
the options. (Source: Reserve Bank of Australia) 5. The Company’s best estimate of dividend yield, representing a discount to long-term dividend policy to reflect build-up of dividend
payout over the life of the performance rights. None of the employee incentive rights issued by the Company are quoted on the Australian Stock Exchange. No employee incentive rights over shares lapsed between 30 June 2013 and the date of this report. During August 2013, 1,841,000 incentive rights that vested on 30 June 2013 were converted to 1,545,539 ordinary shares and the payment of $14,000 cash in accordance with the Employee Incentive Rights Plan rules. Employee Options and Incentive Rights From previous years the Company has an Employee Share Option Plan (ESOP) in place, as well as an Employee Incentive Rights Plan (EIRP) implemented during 2010/11. During the financial year 7,619,000 employee incentive rights were granted. A total of 8,600,000 options and 6,026,000 employee incentive rights with a fair value of $1,601,662 expired under the ESOP and EIRP. No optionswere exercised during the year. A total of167,000 employee incentive rights were exercised during the year. Options issued under the ESOP from 12 March 2008 onwards have two vesting conditions. The first of these being an exercise date no earlier than either 1, 2 or 3 years from grant date and secondly, the shares of the Company must trade for thirty consecutive days on the Australian Stock Exchange with a weighted average share price greater than certain share price hurdles determined by the Company. Incentive rights under the EIRP comprise retention rights and performance rights. For retention rights to vest the employee must remain with the Company for a period of 3 years from the effective issue date. The portion of performance rights that vest is determined by Blue Energy’s total shareholder return (TSR) as determined by an independent advisor over the 3 year period from the effective issue date. The minimum compound annual TSR for the three years is 15% which results in a 25% vesting rate for the employee. At present, the Board has determined that the issue of performance rights will be limited to those individuals (Key Management Personnel) who have a direct ability to influence the performance of the Company. On vesting, the Company will either issue Restricted Shares or arrange for them to be acquired for the employee’s benefit by the trustee of the Blue Energy Employee Share Trust (Blue Energy EST). When Shares are to be acquired by the Blue Energy EST, the employer or Blue Energy will contribute the market value of the Shares at the time to be acquired to the trustee of the Blue Energy EST and the trustee shall apply those funds to acquire Shares by on-market purchase or subscription to a new issue as directed by the Board of Blue Energy. Restricted Shares means that they may not be sold or otherwise disposed of until first advised by the Company, which the Company shall do at the first opportunity to do so, when Shares may be soldwithout breaching the insider trading provisions of the Corporations Act 2001 or the Company’s securities trading policy. DIRECTORS’ MEETINGS The number of meetings of Directors (and Committees of Directors) held and number of meetings attended by each of the Directors of the Company during the financial year was as follows:
* Not a member of the relevant Committee. The Nomination and EnvironmentalCommittee functions are currently handled by the full Board of Directors. This is considered appropriate at the current stage of the Company’s development but will be reviewed from time to time.
Numbers of meetings of full Board
Risk and Audit Committee
Held Attended Held Attended
J Ellice-Flint 13 13 * *
J Phillips 13 13 * *
R Cameron 13 13 4 4
K Johnson 13 13 4 4
J Maeng (Appointed 12 February 2013) 4 3 * *
P Cockcroft (Retired 31 December 2012) 8 6 * *
P Massarotto (Resigned 15 November 2012) 7 7 2 2
HB Lee (Resigned 12 February 2013) 9 8 * *
For
per
sona
l use
onl
y

For
per
sona
l use
onl
y
C O R P O R A T E G O V E R N A N C E S T A T E M E N T
BLUE ENERGY LIMITED AND CONTROLLED ENTITIES
14
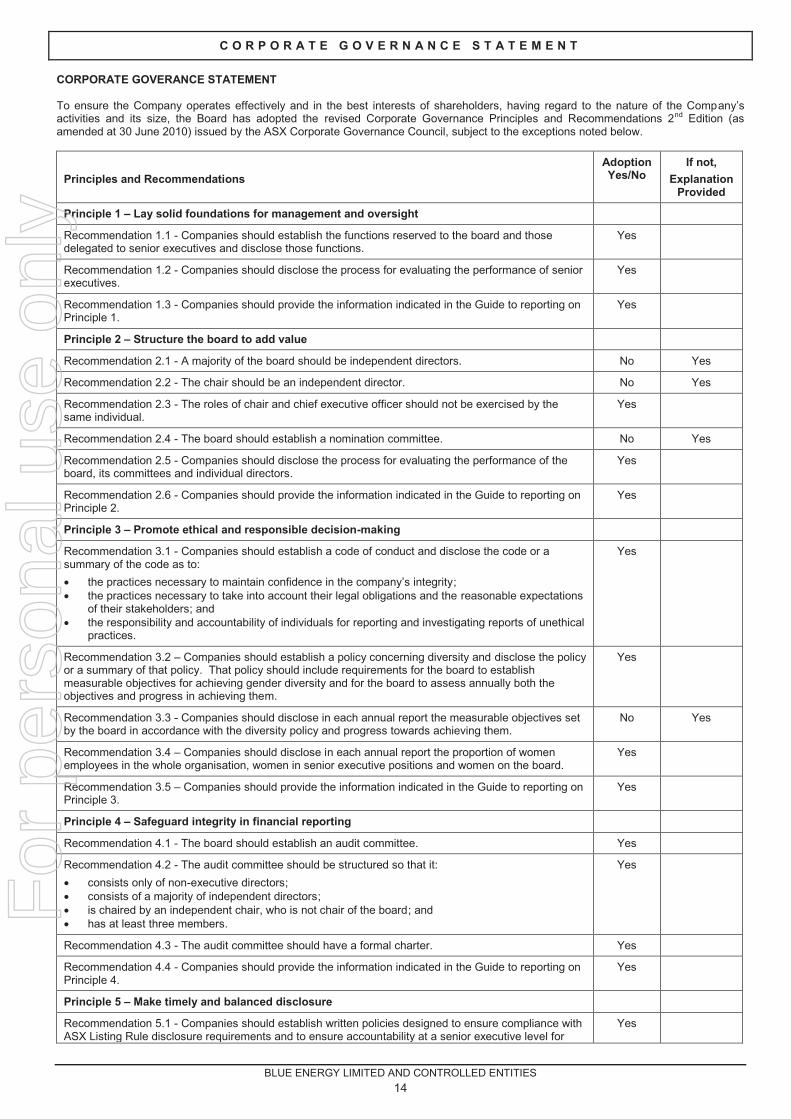
CORPORATE GOVERANCE STATEMENT To ensure the Company operates effectively and in the best interests of shareholders, having regard to the nature of the Company’s activities and its size, the Board has adopted the revised Corporate Governance Principles and Recommendations 2nd Edition (as amended at 30 June 2010) issued by the ASX Corporate Governance Council, subject to the exceptions noted below.
Principles and Recommendations
Adoption Yes/No
If not,
Explanation Provided
Principle 1 – Lay solid foundations for management and oversight
Recommendation 1.1 - Companies should establish the functions reserved to the board and those delegated to senior executives and disclose those functions.
Yes
Recommendation 1.2 - Companies should disclose the process for evaluating the performance of senior executives.
Yes
Recommendation 1.3 - Companies should provide the information indicated in the Guide to reporting on Principle 1.
Yes
Principle 2 – Structure the board to add value
Recommendation 2.1 - A majority of the board should be independent directors. No Yes
Recommendation 2.2 - The chair should be an independent director. No Yes
Recommendation 2.3 - The roles of chair and chief executive officer should not be exercised by the same individual.
Yes
Recommendation 2.4 - The board should establish a nomination committee. No Yes
Recommendation 2.5 - Companies should disclose the process for evaluating the performance of the board, its committees and individual directors.
Yes
Recommendation 2.6 - Companies should provide the information indicated in the Guide to reporting on Principle 2.
Yes
Principle 3 – Promote ethical and responsible decision-making
Recommendation 3.1 - Companies should establish a code of conduct and disclose the code or a summary of the code as to:
· the practices necessary to maintain confidence in the company’s integrity; · the practices necessary to take into account their legal obligations and the reasonable expectations
of their stakeholders; and · the responsibility and accountability of individuals for reporting and investigating reports of unethical
practices.
Yes
Recommendation 3.2 – Companies should establish a policy concerning diversity and disclose the policy or a summary of that policy. That policy should include requirements for the board to establish measurable objectives for achieving gender diversity and for the board to assess annually both the objectives and progress in achieving them.
Yes
Recommendation 3.3 - Companies should disclose in each annual report the measurable objectives set by the board in accordance with the diversity policy and progress towards achieving them.
No Yes
Recommendation 3.4 – Companies should disclose in each annual report the proportion of women employees in the whole organisation, women in senior executive positions and women on the board.
Yes
Recommendation 3.5 – Companies should provide the information indicated in the Guide to reporting on Principle 3.
Yes
Principle 4 – Safeguard integrity in financial reporting
Recommendation 4.1 - The board should establish an audit committee. Yes
Recommendation 4.2 - The audit committee should be structured so that it:
· consists only of non-executive directors; · consists of a majority of independent directors; · is chaired by an independent chair, who is not chair of the board; and · has at least three members.
Yes
Recommendation 4.3 - The audit committee should have a formal charter. Yes
Recommendation 4.4 - Companies should provide the information indicated in the Guide to reporting on Principle 4.
Yes
Principle 5 – Make timely and balanced disclosure
Recommendation 5.1 - Companies should establish written policies designed to ensure compliance with ASX Listing Rule disclosure requirements and to ensure accountability at a senior executive level for
Yes
For
per
sona
l use
onl
y

C O R P O R A T E G O V E R N A N C E S T A T E M E N T
BLUE ENERGY LIMITED AND CONTROLLED ENTITIES
15
Principles and Recommendations
Adoption Yes/No
If not,
Explanation Provided
that compliance and disclose those policies or a summary of those policies.
Recommendation 5.2 - Companies should provide the information indicated in the Guide to reporting on Principle 5.
Yes
Principle 6 – Respect the rights of shareholders
Recommendation 6.1 - Companies should design a communications policy for promoting effective communication with shareholders and encouraging their participation at general meetings and disclose their policy or a summary of that policy.
Yes
Recommendation 6.2 - Companies should provide the information indicated in the Guide to reporting on Principle 6.
Yes
Principle 7 – Recognise and manage risk
Recommendation 7.1 - Companies should establish policies for the oversight and management of material business risks and disclose a summary of those policies.
Yes
Recommendation 7.2 - The board should require management to design and implement the risk management and internal control system to manage the company's material business risks and report to it on whether those risks are being managed effectively. The board should disclose that management has reported to it as to the effectiveness of the company's management of its material business risks.
Yes
Recommendation 7.3 - The board should disclose whether it has received assurance from the chief executive officer (or equivalent) and the chief financial officer (or equivalent) that the declaration provided in accordance with section 295A of the Corporations Act is founded on a sound system of risk management and internal control and that the system is operating effectively in all material respects in relation to financial reporting risks.
Yes
Recommendation 7.4 - Companies should provide the information indicated in the Guide to reporting on Principle 7.
Yes
Principle 8 – Remunerate fairly and responsibly
Recommendation 8.1 - The board should establish a remuneration committee. No Yes
Recommendation 8.2 - The remuneration committee should be structured so that it:
· consists of a majority of independent directors; · is chaired by an independent director; and · has at least three members
No Yes
Recommendation 8.3 - Companies should clearly distinguish the structure of non-executive director’s remuneration from that of executive directors and senior executives.
Yes
Recommendation 8.4 – Companies should provide the information indicated in the Guide to reporting on Principle 8.
Yes
Principle 1 – Lay solid foundations for management and oversight The Company has formalised the respective roles and responsibilities of the Board and Management in a Board Charter. A copy of the Board Charter is available in the Corporate Governance section of the Company’s public website. The Company has established a formal process for evaluating the performance of senior executives which involves a performance and development review cycle where responsibilities and performance objectives are defined and regular feedback is provided through structured performance review meetings which are held in July each year. The performance of all senior executives has been reviewed in accordance with this process. Principle 2 – Structure the board to add value The skills, experience and expertise relevant to the position of each Director who is in office at the date of the annual report and their period in office are detailed in the Directors’ Report. Due to the size of the Company, there is not a clear majority of the Board who are independent directors. Given the relative size of the Company, the interests of the shareholders and the stage of its development, the Directors consider the current Board composition as appropriate. The situation will be monitored and changed in line with best practice as and when the Directors feel the company is of sufficient size. The Company’s Chairman is not an independent director as recommended by recommendation 2.2. The Board believes that given Mr Ellice-Flint’s vast executive and board experience in public companies and specifically oil and gas companies that Mr Ellice-Flint is best positioned to Chair the Company’s Board of Directors. The Board believes that Mr Ellice-Flint appropriately discharges his duties as Chairman. The Board has two independent Directors and three non-independent Directors. The names of the Directors considered to be independent are:
Karen Johnson Rodney Cameron
For
per
sona
l use
onl
y

C O R P O R A T E G O V E R N A N C E S T A T E M E N T
BLUE ENERGY LIMITED AND CONTROLLED ENTITIES
16
Each Director has the right to access all relevant information and, subject to prior consultation with theChairman, may seek independent professional advice at the entity’s expense. A copy of advice received by the Director is made available to all other members of the Board. A nomination committee has not been formed under recommendation 2.4. The Board as a whole considers the composition of the Board and appointment of new Directors. The Board identifies suitable candidates to fill vacancies as they arise. A board performance evaluation program has been designed to evaluate the performance of the board as a whole, individual directors and board committees on an annual basis. All evaluations have regard to the collective nature of board work, the operation of governance processes established in our board charters and the attainment of any goals set by the board. Board evaluation is conducted at a number of levels using a combination of assessment questionnaires and face-to-face meetings. The performance of the board, individual directors and committees has been reviewed in accordance with this process. The Board Charter, which includes the Company’s criteria for independence of directors, is available in the Corporate Governance section of the Company’s public website. Principle 3 – Promote ethical and responsible decision-making The Company has established a Code of Conduct which sets out the Company’s key values and how they should be applied within the workplace and in dealings with those outside of the Company. A summary of the Code of Conduct is available in the Corporate Governance section of the Company’s public website.
Blue Energy has established a diversity policy having regard to the suggestions set out in the new ASX Corporate Governance Principles and Recommendations. Our diversity policy covers gender, age, ethnicity and cultural background. It includes a requirement that the Company establish measurable objectives for achieving gender diversity, with progress in achieving these objectives assessed annually.
As at 30 June 2013 the company had the following proportions of women:
On the board of directors 20%
In senior management positions 0%
In the whole organisation 31%
The Company has notset measureable objectives in accordance with the diversity policy due to the size of the Company. These objectives of the diversity policy are continually monitored by the Company.
Principle 4 – Safeguard integrity in financial reporting The Company has formed a Risk and Audit Committee consisting of two non-executive Directors of whom all are independent as defined by the ASX Corporate Governance Council’s Principles. The members of the Risk and Audit Committee during the 2012 -2013 financial year were:
Karen Johnson Chairman, Independent Director Paul Massarotto Non-Executive Director, Independent Director(resigned 15 November 2012) Rodney Cameron Non-Executive Director, Independent Director
The skills, experience and expertise relevant to the position of each Director who is in office at the date of the annual report and their term in office are detailed in the Directors’ Report. The Risk and Audit Committee formally reports to the Board after each of its meetings. Details of the number of meetings of the Audit Committee during the 2013 financial year and attendance of members are set out in the Directors’ Report. The external audit firm partner or an appropriate delegate responsible for the Company audit attends meetings of the Board and Audit Committee by invitation. The Risk and Audit Committee Charter, which includes information on procedures for the selection and appointment of the external auditor, and for the rotation of external audit engagement partners, is available in the Corporate Governance section of the Company’s public website. Principle 5 – Make timely and balanced disclosure The Company has established a continuous disclosure policy to ensure compliance with the continuous disclosure obligations under the ASX Listing Rules and the Corporations Act and to ensure all investors have equal and timely access to material information concerning the Company and that Company announcements are factual and presented in a clear and balanced way. A summary of the Continuous Disclosure Policy is available in the Corporate Governance section of the Company’s public website. Principle 6 – Respect the rights of shareholders The Board aims to ensure that the shareholders are informed of all major developments affecting the Company’s state of affairs. Information is communicated to shareholders through the: • Company website; • ASX Company Announcements platform; • Quarterly Operations Reports; • Half-year Report; • Annual Report; and • other correspondence regarding matters impacting on shareholders as required.
For
per
sona
l use
onl
y

C O R P O R A T E G O V E R N A N C E S T A T E M E N T
BLUE ENERGY LIMITED AND CONTROLLED ENTITIES
17
The Board encourages full participation of shareholders at the Annual General Meeting to ensure a high level of accountability and association with the Company’s strategy and goals. The Shareholder Communications Policy, designed to promote effective communication with shareholders, is available in the Corporate Governance section of the Company’s public website. Principle 7 – Recognise and manage risk The Company has an established enterprise risk management program that during the 2010 financial year was upgraded in accordance with the new International Risk Standard AS/NZS ISO 31000:2009. It also has an established internal control program based upon the principles set out in the Australian Compliance Standard AS 3806:2006. The Company’s enterprise risk management program addresses its material business risks. Each identified risk is individually assessed in terms of the likelihood of the risk event occurring and the potential consequences in the event that the risk event was to occur. The CompliSpace Assurance software has been implemented through which material business risks are linked to mitigating controls. This software gives the Company the ability to monitor the performance of its enterprise risk and compliance programs in real time. It also ensures transparency of data and ease of reporting to the board. Management has provided to the Board a report as to the overall effectiveness of the Company’s management of its material business risks during the 2013 financial year. The Board has received assurance from the CEO and CFO that in their view:
· the declaration provided in accordance with section 295A of the Corporations Act 2001is founded on a sound system of risk management and internal control; and
· the system of risk management and internal control, to the extent that they relate to financial reporting, are operating effectively and efficiently in all material respects.
A summary of our risk management program is available in the Corporate Governance section of the Company’s public website. Principle 8 – Remunerate fairly and responsibly The Company does not have a dedicated Remuneration Committee but rather the task of ensuring that the level of director and executive remuneration is sufficient and reasonable and that its relationship to performance is clear and is dealt with by the full Board. The Board Charter is available on the Company’s public website. Senior executives and directors are prohibited from entering into transactions in associated products which limit the economic risk of participating in unvested entitlements under any equity based remuneration packages, such as options and employee incentive r ights.
- ▪ -
For
per
sona
l use
onl
y

Crowe Horwath Brisbane is a member of Crowe Horwath International, a Swiss verein. Each member of Crowe Horwath is a separate and independent legal entity. Liability limited by a scheme approved under Professional Standards Legislation other than for the acts or omissions of financial services licensees.
Crowe Horwath Brisbane ABN 79 981 227 862 Member Crowe Horwath International
Level 16 120 Edward Street Brisbane QLD 4000 Australia GPO Box 736 Brisbane QLD 4001 Australia Tel +61 7 3233 3555 Fax +61 7 3233 3567 www.crowehorwath.com.au
18
Auditor’s Independence Declaration
As auditor of Blue Energy Limited and its controlled entities for the year ended 30 June 2013, I declare
that, to the best of my knowledge and belief, there have been:
i. no contraventions of the auditor independence requirements as set out in the
Corporations Act 2001 in relation to the review; and
ii. no contraventions of any applicable code of professional conduct in relation to the
review.
This declaration is in respect of Blue Energy Limited and the entities it controlled during the year.
CROWE HORWATH BRISBANE
BRENDAN WORRALL
Partner
Signed at Brisbane, 17 September 2013
For
per
sona
l use
onl
y

F I N A N C I A L S T A T E M E N T S
BLUE ENERGY LIMITED AND CONTROLLED ENTITIES
19
Consolidated Statement of Comprehensive Income FOR YEAR ENDED 30 JUNE 2013 Note 2013
$’000 2012 $’000
Revenue 3 863 627
Other income 3 76 (3)
Total Revenue 939 624
Operating and administration expenses 4a (3,846) (4,919)
Asset impairment expense 4b (10,589) (1,678)
Impairment of financial assets 7b - (451)
Executive Director placement expense 13 - (3,010)
Equity settled share based payments (2,059) (895)
Loss from continuing operations before income tax (15,555) (10,329)
Income tax benefit
5
2,579 413
Loss after income tax expense (12,976) (9,916)
Other comprehensive income - -
Total comprehensive loss for the year (12,976) (9,916)
Loss for the year attributable to:
Owners of the parent (12,976) (9,916)
Non-controlling interests - -
Total loss for the year (12,976) (9,916)
Total comprehensive loss for the year attributable to: Owners of the parent (12,976) (9,916)
Non-controlling interests - -
Total comprehensive loss for the year (12,976) (9,916)
Earnings per share (cents per share):
- basic 21 (1.14) (1.21)
- diluted 21 (1.14) (1.21)
The above Consolidated Statement of Comprehensive Income should be read in conjunction with the accompanying notes.
For
per
sona
l use
onl
y

F I N A N C I A L S T A T E M E N T S
BLUE ENERGY LIMITED AND CONTROLLED ENTITIES
20
Consolidated Statement of Financial Position AS AT 30 JUNE 2013
Note 2013 $’000
2012 $’000
ASSETS
Current Assets
Cash and cash equivalents 6 16,945 21,909
Trade and other receivables 7a 262 304
Inventories 8 873 773
Total Current Assets 18,080 22,986
Non-Current Assets
Property, plant and equipment 9 362 452
Trade and other receivables 7b 133 133
Exploration & evaluation expenditure 10 56,566 63,704
Total Non-Current Assets 57,061 64,289
TOTAL ASSETS 75,141 87,275
LIABILITIES
Current Liabilities
Trade and other payables 11 504 1,358
Short term provisions 12a&b 433 684
Total Current Liabilities 937 2,042
Non-Current Liabilities
Long term provisions 12c&d 719 998
Total Non-Current Liabilities 719 998
TOTAL LIABILITIES 1,656 3,040
NET ASSETS 73,485 84,235
EQUITY
Issued Capital 13 130,245 130,055
Reserves 14 6,650 4,614
Accumulated losses (63,410) (50,434)
TOTAL EQUITY 73,485 84,235
The above ConsolidatedStatement of Financial Position should be read in conjunction with the accompanying notes.
For
per
sona
l use
onl
y

F I N A N C I A L S T A T E M E N T S
BLUE ENERGY LIMITED AND CONTROLLED ENTITIES
21
Consolidated Statement of Changes in Equity FOR THE YEAR ENDED 30 JUNE 2013
Issued Capital
Accumulated Losses Reserves
Total Equity
$’000 $’000 $’000 $’000
Balance at 1 July 2011 104,668 (40,518) 3,719 67,869
Total comprehensive loss
Loss for the year - (9,916) - (9,916)
Other comprehensive income - - - -
Total comprehensive loss for the year - (9,916) - (9,916)
Transaction with owners in their capacity as owners
Issue of share capital – capital raising 23,473 - - 23,473
Issue of share capital – sign on share issue 3,010 - - 3,010
Share issue costs (1,336) - - (1,336)
Income tax expense reported in equity 240 - - 240
Option expense – share based payments - - 895 895
Total transactions with owners 25,387 - 895 26,282
Balance at 30 June 2012 130,055 (50,434) 4,614 84,235
Total comprehensive loss
Loss for the year - (12,976) - (12,976)
Other comprehensive income - - - -
Total comprehensive loss for the year - (12,976) - (12,976)
Transaction with owners in their capacity as owners
Income tax expense reported in equity 167 - - 167
Option expense – share based payments - - 2,059 2,059
Transfer from options reserve to share capital
23 - (23) -
Total transactions with owners 190 - 2,036 2,226
Balance at 30 June 2013 130,245 (63,410) 6,650 73,485
The above Consolidated Statement of Changes in Equity should be read in conjunction with the accompanying notes.
For
per
sona
l use
onl
y

F I N A N C I A L S T A T E M E N T S
BLUE ENERGY LIMITED AND CONTROLLED ENTITIES
22
Consolidated Statement of Cash Flows FOR THE YEAR ENDED 30 JUNE 2012
Note 2013 $’000
2012 $’000
Cash flows from operating activities
Receipts of refunds of GST and other tax credits 635 1,284
Receipt of R&D tax refund 2,746 653
Payments to suppliers and employees (5,223) (6,594)
Interest received 876 526
Net cash flows used in operating activities 6a (966) (4,131)
Cash flows from investing activities
Purchase of property, plant and equipment (14) (160)
Funds provided for exploration and evaluation (3,984) (10,871)
Net cash flows used in investing activities (3,998) (11,031)
Cash flows from financing activities
Proceeds from Share Issue - 23,473
Capital raising costs - (1,336)
Net cash flows provided by financing activities - 22,137
Net(decrease) / increase in cash and cash equivalents held (4,964) 6,975
Effects of exchange rate changes on cash - (3)
Cash and cash equivalents at beginning of financial year 6 21,909 14,937
Cash and cash equivalents at end of financial year 6 16,945 21,909
The above Consolidated Statement of Cash Flows should be read in conjunction with the accompanying notes.
For
per
sona
l use
onl
y

N O T E S T O T H E F I N A N C I A L S T A T E M E N T S
For the year ended 30 June 2013
BLUE ENERGY LIMITED AND CONTROLLED ENTITIES
23
Notes to the Financial Statements
FOR THE YEARENDED30 JUNE 2012 1. BASIS OF PREPARATION AND STATEMENT OF COMPLIANCE
Basis of Preparation The financial statements of Blue Energy Limited and its controlled entitiesare general purpose financial statements which have been prepared in accordance with the requirements of the Corporations Act 2001, Australian Accounting Standards, Australian Accounting Interpretations, other authoritative pronouncements of the Australian Accounting Standards Board. The financial statements have been prepared on an accrual and historical costs basis, modified by the revaluation of selected non-current assets, financial assets and financial liabilities for which the fair value basis of accounting has been applied. The financial statements are presented in Australian dollars. The financial statements of Blue Energy Limited and controlled entities for the financial year ended 30June 2013 were authorised for issue in accordance with a resolution of the directors on 17 September 2013. Blue Energy Limited is a company limited by shares, incorporated and domiciled in Australia and whose shares are publicly traded on the Australian Stock Exchange. The Group has one business activity, being the exploration for gas and petroleum resources. This activity is carried out in a single significant geographical segment, being Australia, principally in Queensland. The Company is of a kind referred to in ASIC Class Order 98/100 dated 10 July 1998 (updated by CO 05/641 effective 28 July 2005 and CO 06/51 effective 31 January 2006) and in accordance with that Class Order, amounts in the financial statements and Directors’ Report have been rounded off to the nearest thousand dollars, unless otherwise stated. Statement of compliance The financial statements of Blue Energy Limited and controlled entities and Blue Energy Limited as an individual parent entity, complies with International Financial Reporting Standards (IFRS) in their entirety.
2. SUMMARY OF SIGNIFICANT ACCOUNTING POLICIES
(a) Comparatives
Thefinancial report is for the period 1 July 2012 to 30 June 2013. Comparatives between the 2012 and the 2013 year-end balance dates are provided for the ConsolidatedEntity. When required by accounting standards, comparative figures have been adjusted to conform to changes in presentation for the current financial year. (b) Basis of consolidation
The consolidated financial statements comprise the financial statements of Blue Energy Limited and its subsidiaries as at 30 June 2013 (the “Group” or the “ConsolidatedEntity”) (see note 15). Subsidiaries are all those entities over which the Parent has the power to govern the financial and operating policies, generally accompanying a shareholding of more than one half of the voting rights. The existence and effect of potential voting rights that are currently exercisable or convertible are considered when assessing whether the Group controls another entity. The financial statements of subsidiaries are prepared for the same reporting period as the parent company, using consistent accounting policies. In preparing the consolidated financial statements allintercompany balances and transactions, including any unrealised profits arising from intra-group transactions, have been eliminated in full. The subsidiaries were consolidated from the date on which control was transferred to the Group and will cease to be consolidated from the date on which control is transferred out of the Group. Investments in subsidiaries are accounted for at cost in the individual financial statements of Blue Energy Limited.
(c) Property, plant and equipment
Each class ofplant and equipment is carried at cost or fair value, less, where applicable, any accumulated depreciation and impairment losses.
Plant and equipment are measured on the cost basis. The carrying amount of plant and equipment is reviewed annually by directors to
ensure it is not in excess of the recoverable amount from theseassets. The recoverable amount is assessed on the basis of the expected net cash flows that will be received from the assets employment and subsequent disposal. The expected net cash flows have been discounted to their present values in determining recoverable amounts.
Subsequent costs are included in the asset’s carrying amount or recognised as a separate asset, as appropriate, only when it is
probable that future economic benefits associated with the item will flow to the group and the cost of the item can be measured reliably. All other repairs and maintenance are charged to the Statement of Comprehensive Income during the financial period in which they are incurred.
For
per
sona
l use
onl
y

N O T E S T O T H E F I N A N C I A L S T A T E M E N T S
For the year ended 30 June 2013
BLUE ENERGY LIMITED AND CONTROLLED ENTITIES
24
Depreciation
The depreciable amount of all fixed assets are depreciated on either a straight-line or diminishing value basis over their useful lives commencing from the time the asset is held ready for use.
The depreciation rates used for each class of depreciable assets are:
Class of Fixed Asset Depreciation Rate Furniture and Fittings 30% to 40% Plant and Equipment 30% to 50% Computer Software 30% to 40% Leasehold Improvements 50%
The assets’ residual values and useful lives are reviewed, and adjusted if appropriate, at each balance date. An asset’s carrying amount is written down immediately to its recoverable amount if the asset’s carrying amount is greater than its estimated recoverable amount. Gains or losses on disposal are determined by comparing proceeds with the carrying amount. These gains and losses are included in the statement of comprehensive income. (d) Exploration and evaluation expenditure
Exploration, evaluation and development expenditure incurred is accumulated in respect of each identifiable area of interest. These costs are only carried forward to the extent that they are expected to be recouped through the successful development of the area or where activities in the area have not yet reached a stage that permits reasonable assessment of the existence of economical ly recoverable reserves. Accumulated costs in relation to an abandoned area are written off in full against profit in the year in which the decision to abandon the area is made. When production commences, the accumulated costs for the relevant area of interest are amortised over the life of the area according to the rate of depletion of the economically recoverable reserves. A regular review is undertaken of each area of interest to determine the appropriateness of continuing to carry forward costs in relation to that area of interest. Costs of site restoration are provided over the life of the facility from when exploration commences and are included in the costs of that stage. Site restoration costs include the dismantling and removalof mining plant, equipment and building structures, waste removal, and rehabilitation of the site in accordance with clauses of the mining permits. Such costs have been determined using estimates of future costs, current legal requirements and technology on a discounted basis. Any changes in the estimates for the costs are accounted on a prospective basis. In determining the costs of site restoration, there is uncertainty regarding the nature and extent of the restoration due tocommunity expectations and future legislation. Accordingly the costs have been determined on the basis that the restoration will be completed within one year of abandoning the site.
(e) Income tax The charge for current income tax expense is based on the profit/(loss) for the year adjusted for any non-assessable or disallowed items. It is calculated using the tax rates that have been enacted or are substantially enacted by the balance date. Deferred tax is accounted for using the liability method in respect of temporary differences arising between the tax bases of assets and liabilities and their carrying amounts in the financial statements. No deferred tax will be recognised from the initial recognition of an asset or liability, excluding a business combination, where there is no effect on accounting or taxable profit or loss. Deferred tax is calculated at the tax rates that are expected to apply to the period when the asset is realised or liability is settled. Deferred tax is credited in the statement of comprehensive income except where it relates to items that may be credited directly to equity, in which case the deferred tax is adjusted directly against equity. Deferred tax assets are recognised to the extent that it is probable that future tax profits will be available against which deductible temporary differences can be utilised. The amount of benefits brought to account or which may be realised in the future is based on the assumption that no adverse change will occur in income taxation legislation and the anticipation that the ConsolidatedEntity will derive sufficient future assessable income to enable the benefit to be realised and comply with the conditions of deductibility imposed by the law. Blue Energy Limited and its wholly-owned Australian subsidiaries have formed a tax consolidated group under the tax consolidation regime. Each entity in the group recognises its own current and deferred tax assets and liabilities, except for any deferred tax assets resulting from unused tax losses and tax credits, which are immediately assumed by the head entity. The current tax liability of each group entity is then subsequently assumed by the parent entity. The group has notified the Australian Tax Office that it formed an income tax consolidated group to apply from 1 April 2006. The tax consolidated group has entered a tax sharing agreement whereby each company in the group contributes to the income tax payable in proportion to their contribution to the net profit before tax of the tax consolidated group. Blue Energy Limited is the head entity of the tax consolidated group.
For
per
sona
l use
onl
y

N O T E S T O T H E F I N A N C I A L S T A T E M E N T S
For the year ended 30 June 2013
BLUE ENERGY LIMITED AND CONTROLLED ENTITIES
25
(f) Inventories Inventories are measured at the lower of cost and net realisable value. All inventories are being held for application to exploration expenditure. (g) Revenue Revenue is recognised at the fair value of the consideration received or receivable and to the extent that it is probable that the economic benefits will flow to the Consolidated Entity and the revenue can be reliably measured. The following specific recognition criteria must also be met before revenue is recognised: Interest revenue is recognised as the interest accrues to the net carrying amount of the financial asset. All revenue is stated net of the amount of goods and services tax (GST).
(h) Issued Capital
Issued Capital is recognised at the fair value of the consideration received by the company. Any transaction costs arising on the issue of shares are recognised directly in equity as a reduction of the share proceeds received. For equity-settled share-based payment transactions for goods or services received, excluding employee services, the Consolidated Entity recognises and measures the increase in equity at the fair value of the goods or services received, unless that fair value cannot be estimated reliably, in which case the Consolidated Entity measures the value of the goods or services received, by reference to the fair value of the equity instrument granted. The Company has granted options over shares to employees under an employee share option plan. The fair value of options granted is recognised as an expense with a corresponding increase in equity reserves. The fair value is measured at grant date and spread over the life of the option taking into account the probability of the options vesting. The fair value of options granted is measured using the Binomial pricing model, taking into account the terms and conditions upon which the options were granted. The Company has ceased to grant options over shares to employees under an employee share option plan and has implemented an Employee Incentive Rights Plan in its place. The fair value of rights granted is recognised as an expense with a corresponding increase in equity reserves. The fair value is measured at grant date and spread over the life of the right taking into account the probability of the rights vesting. The fair value of rights granted is measured using the Binomial pricing model, taking into account the terms and conditions upon which the rights were granted.
(i) Leases
The determination of whether an arrangement is or contains a lease is based on the substance of the arrangement and requires an assessment of whether the fulfilment of the arrangement is dependent on the use of a specific asset or assets and whether the arrangement conveys a right to use the asset. Leases where the lessor retains substantially all the risks and benefits of ownership of the asset are classified as operating leases. Operating lease payments are recognised as an expense in the statement of comprehensive income on a straight-line basis over the lease term.
(j) Interest in joint ventures
The ConsolidatedEntity’s interests in joint venture entities are bought to account using the equity method. The parent entity’s interests are bought to account using the cost method. (k) Trade and other receivables
Trade receivables, which generally have 30-90 day terms, are recognised and carried at original invoice amount less an allowance for any uncollectible amounts. An estimate of the doubtful debts is made when collection of the full amount is no longer probable. Bad debts are written off when identified. (l) Cash and cash equivalents
Cash and cash equivalents in the statement of financial position comprise cash at bank and short term deposits with an original maturity of six months or less.
(m) Trade and other payables
Trade payables and other payables are carried at cost and represent liabilities for goods and services provided to the Consolidated Entity prior to the end of the financial year that are unpaid and arise when the Consolidated Entity becomes obliged to make future payments in respect of the purchase of these goods and services.
(n) Financial instruments Recognition Financial assets are initially measured at cost on trade date, which includes transaction costs, when the related contractual rights or obligation exist. Subsequent to initial recognition these instruments are measured as set out below.
For
per
sona
l use
onl
y

N O T E S T O T H E F I N A N C I A L S T A T E M E N T S
For the year ended 30 June 2013
BLUE ENERGY LIMITED AND CONTROLLED ENTITIES
26
Financial assets at fair value through profit and loss A financial asset is classified in this category if acquired principally for the purpose of selling in the short term, or if so designated by management and within the requirements of AASB 139 “Recognition and Measurement of financial assets”. Realised and unrealised gains and losses arising from change in the fair value of these assets are included in the statement of comprehensive income in the period in which they arise. Loans and receivables Loans and receivables are non-derivative financial assets with fixed or determinable payments that are not quoted in an active market and are stated at amortised cost using the effective interest rate method. Financial liabilities Non-derivative financial liabilities are recognised at amortised cost, comprising original debt less principal payments and amortisation. Fair value Fair value is determined based on current bid prices for all quoted investments. Valuation techniques are applied to determine the fair value for all unlisted securities, including recent arm’s length transactions, reference to similar instruments and option pricing models. Impairment At each reporting date the Consolidated Entity assesses whether there is objective evidence that a financial instrument has been impaired. In the case of available for sale instruments, a prolonged decline in the value of the instrument is considered to determine whether an impairment has arisen. Impairment losses are recognised in the statement of comprehensive income.
(o) Impairment of Assets At each reporting date, the Consolidated Entity reviews the carrying amount of its tangible and intangible assets to determine whether there is any indication that those assets have been impaired. If such an indication exists, the recoverable amount of the asset, being the higher of the asset’s fair value less costs to sell and value in use, is compared to the asset’s carrying value. Any excess of the asset’s carrying value over its recoverable amount is expensed to the statement of comprehensive income. Where it is not possible to estimate the recoverable amount of an individual asset, the group estimates the recoverable amount of the cash generating unit to which the asset belongs. (p) Employee benefits Provision is made for the Consolidated Entity’s liability for employee benefits arising from services rendered by employees to balance date. Employee benefits that are expected to be settled within one year have been measured at the amounts expected to be paid when the liability is settled. Employee benefits payable later than one year have been measured at present value of the estimated future cash outflows to be made for those benefits.
(q) Goods and Services Tax (GST) Revenues, expenses and assets are recognised net of the amount of GST, except where the amount of GST incurred is not recoverable from the Australian Tax Office. In these circumstances the GST is recognised as part of the cost of acquisition of the asset or as part of an item of the expense. Receivables and payables in the statement of financial position are shown inclusive of GST. Cash flows are presented in the statement of cash flows on a gross basis, except for the GST component of investing and financing activities, which are disclosed as operating cash flows. (r) Critical accounting judgements and key sources of estimation uncertainty In the application of the Group’s accounting policies, which are described in Note 2, the Directors make judgements, estimates and assumptions about the carrying amounts of assets and liabilities that are not readily apparent from other sources. The estimates and associated assumptions are based on historical experience, the best available current information and other factors that are considered to be relevant. Actual results may differ from these estimates. The estimates and underlying assumptions are reviewed on an ongoing basis. Revisions to accounting estimates are recognised in the period in which the estimate is revised if the revision affects only that period, or in the period of the revision and future periods if the revision affects both current and future periods. Critical judgements in applying the entity’s accounting policies The following are the critical judgements that management has made in the process of applying the Group’s accounting policies and that have the most significant effect on the amounts recognised in the financial statements: Exploration and evaluation assets The Group’s policy for exploration and evaluation is outlined in Note 2(d). The application of this policy requires management to make certain estimates and assumptions as to future events and circumstances. Any such estimates and assumptions may change as new information becomes available. If, after having capitalised exploration and evaluation expenditure, management concludes that the capitalised expenditure is unlikely to be recovered by future sale or exploitation, then the relevant capitalised amount will be written off through the Statement of Comprehensive Income. During the year ended 30 June 2013an impairment charge was recognised for ATP817P, ATP818P and ATP819P. Management have made the decision to relinquish these ATP’s so the amount previously capitalised of $10,589,645was written off.
For
per
sona
l use
onl
y

N O T E S T O T H E F I N A N C I A L S T A T E M E N T S
For the year ended 30 June 2013
BLUE ENERGY LIMITED AND CONTROLLED ENTITIES
27
Legal disputes During the year ended 30 June 2013 a legal dispute was settled on terms confidential to both parties. Currently management is not aware of any legal disputes or pending legal action concerning the Group. (s) Parent entity financial information
The financial information for the parent entity, Blue Energy Limited, disclosed in Note 27 has been prepared on the same basis as the
consolidated financial statements.
3. REVENUE 2013
$’000 2012 $’000
Revenue Interest received from other persons 863 627 Total 863 627
Other Income
Fuel Tax Credits 76 - Net Foreign exchange gain/(loss) (8) (3) Other income 8 - Total 76 (3)
Total Revenue 939 624
4. PROFIT / (LOSS) FOR THE YEAR
(a) Operating & administration expenses 2013
$’000 2012
$’000
Employee benefit expenses Superannuation expense Legal fees Consultants’ fees Business development costs Depreciation expense Travel costs Directors’ fees Accounting and compliance fees Occupancy costs Insurance costs Information systems costs Communications costs Investor relations costs Other
1,492 170 427 92
5 102 151 204 458 322 121 137 55 20 89
1,528 194 228 590 209 194 195 309 348 326 271 95 93 68
271 Total 3,846 4,919
(b) Asset impairment expense
2013 $’000
2012 $’000
Exploration expenditure written off (Refer Note 2(r)) 10,589 1,678 Total 10,589 1,678
5. INCOME TAX
a) The components of tax expense comprise: 2013
$’000 2012
$’000
Current income tax Current income tax charge (2,201) (5,741) Adjustments in respect of current income tax of previous years (2,746) (653) Deferred income tax
Relating to origination and reversal of temporary differences (1,845) 2,918 Current year tax losses not recognised in the current year 4,213 3,063 Income tax benefit reported in statement of comprehensive income (2,579) (413)
For
per
sona
l use
onl
y

N O T E S T O T H E F I N A N C I A L S T A T E M E N T S
For the year ended 30 June 2013
BLUE ENERGY LIMITED AND CONTROLLED ENTITIES
28
b) The prima facie tax on profit / (loss) before income tax is reconciled to the income tax expense as follows: 2013
$’000 2012
$’000
Accounting loss before income tax (15,555) (10,329) Prima facie income tax payable on loss before income tax at 30% (2012: 30%) (4,666) (3,098) Sundry non-deductible expenses 621 275 Benefit of tax losses and temporary differences not brought to account 4,213 3,063 Benefit of prior year tax losses brought to account in the current year (2,746) (653) Income Tax benefit (2,579) (413)
c) Assets
Deferred tax assets include: 2013 $’000
2012 $’000
Temporary differences, excluding benefits of tax losses, attributable to: Provisions 494 575 Accruals 4 6 Business related costs 325 432 Other 299 466
Total deferred tax assets 1,122 1,479
d) Liabilities
Deferred tax liabilities include: 2013 $’000
2012 $’000
Temporary differences attributable to: Exploration and evaluation expenditure 14,354 16,491 Property plant and equipment 136 159 Interest receivable 56 64
Total deferred tax liabilities 14,546 16,714
e) Gross Movements in deferred tax accounts
The overall movement in the deferred tax account is as follows: 2013 $’000
2012 $’000
Opening Balance - - Equity (2,579) (413) Charged to statement of comprehensive income 2,579 413
Closing Balance - -
f) Deferred Tax Assets
2013 $’000
2012 $’000
Unrecognised Deferred Tax Balances the benefits of which will be realised when conditions in Note 2(e) are realised:
Unrecognised deferred tax assets - Losses 30,668 31,040 Unrecognised deferred tax assets - Capital Losses 15 15 Unrecognised deferred tax assets - Other 1,122 1,479 Unrecognised deferred tax liabilities (14,546) (16,714) Net unrecognised deferred tax assets 17,259 15,820
There are no franking credits available to shareholders of the Company. 6. CASH AND CASH EQUIVALENTS For the purposes of the Consolidated Statement of Financial Position and theConsolidated Statement of Cash Flows, cash and cash equivalents comprise the following at 30 June 2013:
2013 $’000
2012 $’000
Cash at bank and in hand 1,168 2,620 Short-term deposits 15,777 19,289 Total 16,945 21,909
Cash at bank earns interest at floating rates based on daily bank deposit rates. Short-term deposits are made for varying periods of up to six months at a time and earn interest at the short-term deposit rate. Effective interest rate on the short-term deposits was 4.37% (2012:5.66%). The fair value of cash and cash equivalents of the Group is $16.945m (2012: $21.909m).
For
per
sona
l use
onl
y

N O T E S T O T H E F I N A N C I A L S T A T E M E N T S
For the year ended 30 June 2013
BLUE ENERGY LIMITED AND CONTROLLED ENTITIES
29
a) Reconciliation of the loss after tax to the net cash flows from operations
2013 $’000
2012 $’000
Loss after income tax (12,975) (9,916) Adjustments for non-cash items
Cash flows excluded from profit/(loss) attributable to operating activities: Depreciation 102 194 Net Exchange differences - 3 Share options expensed 2,059 895 Asset impairment expense 10,589 1,678 Executive Director placement expense - 3,010 Impairment of financial assets - 451 Income tax expense credited to equity 167 240 Changes in assets and liabilities
Increase in trade debtors and receivables (256) (86) Decrease in trade creditors, accruals sundry provisions (623) (620) Increase/(decrease) in provisions and employee entitlements (29) 20 Net cash used in operating activities (966) (4,131)
7. TRADE AND OTHER RECEIVABLES
a) Current: 2013 $’000
2012 $’000
Goods and services tax receivable 25 59 Interest receivable 199 212 Rental bonds and deposits 18 24 Other receivables 20 9 Total 262 304
b) Non-current: 2013
$’000 2012
$’000
Receivables from Farm-in Partners - 451 Less: Provision for impairment - (451) - - Tenement related performance bonds 133 133 133 133
Trade receivables are non-interest bearing and are generally on 30-90 day terms. A provision for impairment loss is recognised when there is objective evidence that an individual trade receivable is impaired. No allowance (2012: $451,676) for impairment of receivables has been recognised as at 30 June 2013. 8. INVENTORIES
Current at lower of cost and net realisable value 2013 $’000
2012 $’000
Stores and consumables 1,216 816 Less: Inventory allowance for obsolescence (343) (43) Total 873 773
9. PROPERTY, PLANT AND EQUIPMENT
2013 $’000
2012 $’000
Furniture and fittings at cost 33 33 Less: Accumulated depreciation (33) (33) Net carrying amount - -
Plant and equipment at cost 1,038 1,029 Less: Accumulated depreciation (714) (648) Net carrying amount 324 381
Computer software at cost 466 463 Less: Accumulated depreciation (428) (392) Net carrying amount 38 71
Leasehold improvements at cost 65 65 Less: Accumulated depreciation (65) (65) Net carrying amount - -
Total Cost 1,602 1,590 Total Accumulated depreciation (1,240) (1,138)
Net carrying amount 362 452
For
per
sona
l use
onl
y

N O T E S T O T H E F I N A N C I A L S T A T E M E N T S
For the year ended 30 June 2013
BLUE ENERGY LIMITED AND CONTROLLED ENTITIES
30
Movements in carrying amounts 2013 $’000
2012 $’000
Furniture and fittings at cost Carrying amount at beginning of year - 1 Additions - - Disposals - - Depreciation expense (1) Carrying amount at the end of the year - -
Plant and equipment at cost Carrying amount at beginning of year 381 409 Additions 10 80 Disposals - - Depreciation expense (67) (108) Carrying amount at the end of the year 324 381
Computer software at cost Carrying amount at beginning of year 71 68 Additions 3 75 Disposals - - Depreciation expense (36) (72) Carrying amount at the end of the year 38 71
Leasehold improvements at cost Carrying amount at beginning of year - 13 Additions - - Disposals - - Depreciation expense (13) Carrying amount at the end of the year - -
Total Property, Plant and Equipment Carrying amount at beginning of year 452 491 Additions 13 155 Disposals - - Depreciation expense (103) (194) Carrying amount at the end of the year 362 452
10. EXPLORATION AND EVALUATION EXPENDITURE The ultimate recoupment of the expenditure on oil and gas interests is dependent upon successful development and commercial exploitation or alternatively the sale of the respective areas of interest at amounts at least equal to the book value.
2013 $’000
2012 $’000
Exploration and evaluation expenditure acquired and recognised on consolidation 13,648 13,648 Other exploration and evaluation expenditure capitalised Restoration asset (Note 12b&c)
68,594 1,142
65,286 998
Less:Impairment of exploration & evaluation expenditure previously capitalised (26,818) (16,228) Total exploration & evaluation expenditure 56,566 63,704
Exploration and evaluation expenditure incurred is accumulated in respect of each identifiable area of interest. These costs are only carried forward to the extent that they are expected to be recouped through the successful development of the area or where activities in the area have not yet reached a stage that permits reasonable assessment of the existence of economically recoverable reserves.
11. TRADE AND OTHER PAYABLES
Current: 2013 $’000
2012 $’000
Trade payables(1) 231 475 Joint venture payables - 359 Sundry payables and accrued expenses(2) 55 233 Employee cost & expenses payable 218 291 Total 504 1,358
(1) Trade payables include nil amounts payable to key management at the end of the financial year (2012: $665). (2) Sundry payables and accrued expenses include amounts payable to key management of $48,171 at the end of the financial
year (2012: $53,021).
Trade payables are non-interest bearing and are normally settled on 30 day terms.
For
per
sona
l use
onl
y

N O T E S T O T H E F I N A N C I A L S T A T E M E N T S
For the year ended 30 June 2013
BLUE ENERGY LIMITED AND CONTROLLED ENTITIES
31
12. PROVISIONS
2013 $’000
2012 $’000
Current Provision for legal fees - 684 Provision for restoration and rehabilitation(1) 433 - Total Current 433 684
Non Current Provision for restoration and rehabilitation(1) 709 998 Provision for long service leave 10 - Total Non Current 719 998
Balance at 30 June 2013 1,152 1,682
a) Current
2013 $’000
2012 $’000
Provision for legal fees Opening balance at 1 July 2012 684 1,043 Additional provisions recognised - - Amounts used (684) (305) Unused amounts reversed - (54) Balance at 30 June 2013 - 684
b) Current
2013 $’000
2012 $’000
Provision for restoration and rehabilitation(1) Opening balance at 1 July 2012 - - Balance transferred from non-current provisions 433 - Balance at 30 June 2013 433 -
c) Non Current: 2013 $’000
2012 $’000
Provision for restoration and rehabilitation(1) Opening balance at 1 July 2012 998 684 Additional provisions recognised 362 314 Unused amounts reversed (197) - Balance transferred from non-current provisions (433) - Amounts used (21) - Balance at 30 June 2013 709 998
(1) Future estimated costs for the restoration and rehabilitation of areas affected by exploration activities.
d) Non Current
2013 $’000
2012 $’000
Provision for long service leave Opening balance at 1 July 2012 - - Additional provision recognised 10 - Balance at 30 June 2013 10 -
13. ISSUED CAPITAL
2013 2012
Ordinary Shares: Number of
Shares $’000 Number of
Shares $’000
Issued & Fully Paid 1,139,447,698 130,245 1,139,296,828 129,815
Movements in ordinary shares on issue: Opening balance 1,139,296,828 130,055 722,488,256 104,668 Issue on Exercise of Employee Incentive Rights 150,870 23 Issued shares at 6.25 cents (placement) - - 160,000,000 10,000 Issued shares at 6.25 cents (SPP) - - 215,572,072 13,473 Issued shares to John Ellice-Flint on appointment at 7.3 cents - - 41,236,500 3,010 Capital raising costs - - - (1,336) Income tax expense reported in equity (Capital raising costs) - 167 - 240 Closing balance 1,139,447,698 130,245 1,139,296,828 130,055
Ordinary shares have no par value. There is no limit to the authorised share capital of the Company. At the shareholders meetings each ordinary share is entitled to one vote when a poll is called, otherwise each shareholder has one vote on a show of hands. The Company did not pay a dividend during the year ended 30 June 2013, nor has any dividend been proposed up to the reporting date (2012: $Nil). Ordinary shares would participate in dividends and the proceeds on any winding up of the parent entity in proportion to the number of shares held. From 30 June 2013 to the date of this report 1,545,539 shares have been issued through the exercise of Employee Incentive Rights.
For
per
sona
l use
onl
y

N O T E S T O T H E F I N A N C I A L S T A T E M E N T S
For the year ended 30 June 2013
BLUE ENERGY LIMITED AND CONTROLLED ENTITIES
32
Options over shares During the year no options were granted (2012: 82,473,000). A total 8,600,000 options lapsed (2012: 600,000) and no options were exercised during the year (2012: Nil). None of the options are listed. From 30 June 2013 to the date of this report no shares have been issued as a result of the exercise of options and no options over shares havelapsed in this period. The following table lists the unexpired options at balance date: 2013Option Details
Grant Date Exercise Date Expiry Date
Exercise Price
$
Fair value
at Grant Date
$
Number of options at beginning of period
Options Granted
Options Lapsed
Options Exercised
Number of options at 30 June
2013
Number of options
vested and exercisable at 30 June
2013
Sep-08 Qtr(a) Aug-10 Aug-13 0.25 0.22 1,133,334 - 1,133,334 - - -
Sep-08 Qtr(a) Sep-10 to Aug-11 Sep-12 to Aug-13 0.25 0.22 1,133,334 - 1,133,334 - - -
Sep-08 Qtr(a) Sep-11 to Aug-12 Sep-12 to Aug-13 0.25 0.21 1,133,332 - 1,133,332 - - -
9-Jan-09(a) 9-Jan-10 8-Jan-14 0.25 0.13 20,000 - 20,000 - - -
9-Jan-09(a) 9-Jan-11 8-Jan-14 0.25 0.13 20,000 - 20,000 - - -
9-Jan-09(a) 9-Jan-12 8-Jan-14 0.25 0.13 20,000 - 20,000 - - -
1-May-09(a) 1-May-10 30-Apr-14 0.25 0.17 833,333 - - - 833,333 -
1-May-09(a) 1-May-11 30-Apr-14 0.25 0.17 833,333 - - - 833,333 -
1-May-09(a) 1-May-12 30-Apr-14 0.25 0.16 833,334 - - - 833,334 -
4-Dec-09(a) 4-Dec-10 4-Dec-14 0.25 0.12 3,866,666 - - - 3,866,666 -
4-Dec-09(a) 4-Dec-11 4-Dec-14 0.25 0.12 666,667 - - - 666,667 -
4-Dec-09(a) 4-Dec-12 4-Dec-14 0.25 0.11 666,667 - - - 666,667 -
17-Feb-10 17-Feb-10 17-Feb-13 0.25 0.07 4,000,000 - 4,000,000 - - -
12-Mar-10(a) 12-Mar-11 11-Mar-15 0.25 0.11 546,664 - 379,998 - 166,666 -
12-Mar-10(a) 12-Mar-12 11-Mar-15 0.25 0.10 546,667 - 380,000 - 166,667 -
12-Mar-10(a) 12-Mar-13 11-Mar-15 0.25 0.10 546,669 - 382,000 - 166,667 -
5-Apr-12 5-Apr-12 14-Feb-17 0.0625 0.05 82,473,000 - - - 82,473,000 -
99,273,000 - 8,600,000 - 90,673,000 -
Weighted average exercise price 0.09 - 0.25 0.08 -
Weighted average remaining contract life is 1,247 days
Total expense recognised $1,340,918 (2012: $690,705)
Fair value of options granted during the year was nil (none granted)
Fair value of options lapsed during the year was $1,245,572
(a) Options granted under the current Employee Share Option Plan (ESOP)
For
per
sona
l use
onl
y

N O T E S T O T H E F I N A N C I A L S T A T E M E N T S
For the year ended 30 June 2013
BLUE ENERGY LIMITED AND CONTROLLED ENTITIES
33
2012 Option Details
Grant Date Exercise Date Expiry Date
Exercise Price
$
Fair value
at Grant Date
$
Number of options at beginning of period
Options Granted
Options Lapsed
Options Exercised
Number of options at 30 June
2012
Number of options
vested and exercisable at 30 June
2012
Sep-08 Qtr(a) Aug-10 Aug-13 0.25 0.22 1,333,334 - 200,000 - 1,133,334 -
Sep-08 Qtr(a) Sep-10 to Aug-11 Sep-12 to Aug-13 0.25 0.22 1,333,334 - 200,000 - 1,133,334 -
Sep-08 Qtr(a) Sep-11 to Aug-12 Sep-12 to Aug-13 0.25 0.21 1,333,332 - 200,000 - 1,133,332 -
9-Jan-09(a) 9-Jan-10 8-Jan-14 0.25 0.13 20,000 - -
- 20,000 -
9-Jan-09(a) 9-Jan-11 8-Jan-14 0.25 0.13 20,000 - -
- 20,000 -
9-Jan-09(a) 9-Jan-12 8-Jan-14 0.25 0.13 20,000 - -
- 20,000 -
1-May-09(a) 1-May-10 30-Apr-14 0.25 0.17 833,333 - -
- 833,333 -
1-May-09(a) 1-May-11 30-Apr-14 0.25 0.17 833,333 - -
- 833,333 -
1-May-09(a) 1-May-12 30-Apr-14 0.25 0.16 833,334 - -
- 833,334 -
4-Dec-09(a) 4-Dec-10 4-Dec-14 0.25 0.12 3,866,666 - -
- 3,866,666 -
4-Dec-09(a) 4-Dec-11 4-Dec-14 0.25 0.12 666,667 - -
- 666,667 -
4-Dec-09(a) 4-Dec-12 4-Dec-14 0.25 0.11 666,667 - - - 666,667 -
17-Feb-10 17-Feb-10 17-Feb-13 0.25 0.07 4,000,000 - - - 4,000,000 -
12-Mar-10(a) 12-Mar-11 11-Mar-15 0.25 0.11 546,664 - - - 546,664 -
12-Mar-10(a) 12-Mar-12 11-Mar-15 0.25 0.10 546,667 - - - 546,667 -
12-Mar-10(a) 12-Mar-13 11-Mar-15 0.25 0.10 546,669 - - - 546,669 -
5-Apr-12 5-Apr-12 14-Feb-17 0.0625 0.05 - 82,473,000 - - 82,473,000 -
17,400,000 82,473,000 600,000 - 99,273,000 -
Weighted average exercise price 0.25 0.0625 0.25 0.09
Weighted average remaining contract life is 1,568 days
Total expense recognised $690,705 (2011: $698,231)
Fair value of options granted during the year was $4,123,650
Fair value of options lapsed during the year was $117,982
(b) Options granted under the current Employee Share Option Plan (ESOP) These options do not entitle the holder to participate in any share issue of the Company. Options issued under the Employee Share Option Plan from 12 March 2008 onwards have two vesting conditions. The first of these being an exercise date no earlier than either 1, 2 or 3 years from grant date and secondly the shares of the Company must trade for thirty consecutive days on the Australian Stock Exchange with a weighted average share price greater than certain share price hurdles determined by the Company. All other options vest and are exercisable on grant date up to expiry date.
For
per
sona
l use
onl
y

N O T E S T O T H E F I N A N C I A L S T A T E M E N T S
For the year ended 30 June 2013
BLUE ENERGY LIMITED AND CONTROLLED ENTITIES
34
Rights over shares During the year the Company granted7,619,000 employee incentive rights (2012: 7,517,000). A total of 6,026,000 employee incentive rights (2012: 93,000) lapsed. A total of 167,000 employee incentive rights were exercised during the year (2012: Nil). A total of 1,841,000 employee incentive rights vested on 30 June 2013. None of the employee incentive rights are listed. From 30 June 2013 to the date of this report a total of 1,545,539 shares have been issued via the conversion of the 1,841,000 vested employee incentives rights and the payment of $14,000 cash in line with the EIRP rules. No employee incentive rights over shares have lapsed in this period. The following table lists the unexpired employee incentive rights at reporting date: 2013 Rights Details
Effective Grant Date
Exercise Date
Type of Right
Exercise Price
$
Fair value at Grant Date
$
Number of Rights at beginning of period
Rights Granted
Rights Lapsed
Rights Exercised
or Exercisable
Number of Rights at
reporting date
01-Jul 10 30-Jun-13 Retention nil $0.135 1,145,000 - - 1,145,000 -
01-Jul 10 30-Jun-13 Performance nil $0.095 1,333,000 - 1,333,000 - -
01-Jul 10 30-Jun-13 Performance nil $0.095 6,146,000 - 1,453,000 - 4,693,000
01-Jul-11 30-Jun-14 Retention nil $0.064 1,311,000 - 96,000 395,000 820,000
01-Jul-11 30-Jun-14 Performance nil $0.026 6,206,000 - 1,453,000 - 4,753,000
01-Jul-12 30-Jun-15 Retention nil $0.059 - 1,337,000 201,000 301,000 835,000
01-Jul-12 30-Jun-15 Performance nil $0.012 - 6,282,000 1,490,000 - 4,792,000
16,141,000 7,619,000 6,026,000 1,841,000 15,893,000
Weighted average exercise price – nil
Weighted average remaining contract life is 386 days
Total expense recognised $717,599 (2012: $204,328)
Fair value of rights granted during the year was $154,267
Fair value of rights lapsed during the year was $356,090 Fair value of rights exercised during the year was $22,545. 150,870 shares were issued on the exercise of rights. 1,841,000 rights vested at 30 June 2013 and were exercised during August 2013. 2012 Rights Details
Effective Grant Date
Exercise Date
Type of Right
Exercise Price
$
Fair value at Grant Date
$
Number of Rights at beginning of period
Rights Granted
Rights Lapsed
Rights Exercised
or Exercisable
Number of Rights at
reporting date
01-Jul 10 30-Jun-12 Retention nil $0.135 167,000 - - 167,000 -
01-Jul 10 30-Jun-14 Retention nil $0.135 1,238,000 - 93,000 - 1,145,000
01-Jul 10 30-Jun-12 Performance nil $0.095 1,333,000 - - - 1,333,000
01-Jul 10 30-Jun-13 Performance nil $0.095 6,146,000 - - - 6,146,000
01-Jul-11 30-Jun-14 Retention nil $0.064 - 1,311,000 - - 1,311,000
01-Jul-11 30-Jun-14 Performance nil $0.026 - 6,206,000 - - 6,206,000
8,884,000 7,517,000 93,000 167,000 16,141,000
Weighted average exercise price – nil
Weighted average remaining contract life is 535 days
Total expense recognised $204,328 (2011: $160,475)
Fair value of rights granted during the year was $245,260
Fair value of rights lapsed during the year was $12,555 Fair value of rights exercised during the year was $Nil. Nil shares were issued on the exercise of rights. 167,000 rights vested at 30 June 2012 and were exercised during July 2012. Incentive rights under the EIRP comprise retention rights and performance rights. For retention rights to vest the employee must remain with the Company for a period of 3 years from the effective issue date. The portion of performance rights that vest is determined by Blue Energy’s total shareholder return (TSR) as determined by an independent advisor over the 3 year period from the effective issue date. The minimum compound annual TSR for the three years is 15% which results in a 25% vesting rate for the employee. At present, the Board has determined that the issue of performance rights will be limited to those individuals (Key Management Personnel) who have a direct ability to influence the performance of the Company. The weighted average fair value of employee incentive rights issued during the year was $0.026(2012: $0.026). The value of retention rights granted was calculated based upon the maximum number of retention rights issued multiplied by the prevailing share price as at the date of issue.
For
per
sona
l use
onl
y

N O T E S T O T H E F I N A N C I A L S T A T E M E N T S
For the year ended 30 June 2013
BLUE ENERGY LIMITED AND CONTROLLED ENTITIES
35
The fair value of performance rights granted was calculated using the Binomial pricing model utilising the following inputs:
Note 2013 2012 - Exercise price - Current Stock Price - Barrier - Expiry date
1 2
$0.00 $0.059 $0.51
30 June 2015
$0.00 $0.064 $0.51
30 June 2014 - Expiry Period 3 Years 3 Years - Expected share price volatility 3 70% 85% - Risk free interest rate - Dividend yield
4 5
2.42% 0%
4.76% 0%
1. In substance, the performance rights is an option with a zero exercise price. 2. The underlying share price is based on the price of the security on the ASX on 30 June 2012 (2011: 30 June 2011). 3. The recent volatility of the share price of Blue Energy was calculated using Hoadley’s volatility calculator, using data extracted from
Bloomberg. 4. The risk free rate is the Commonwealth Government securities rate with a maturity date approximating that of the expiration period
of the options. (Source: Reserve Bank of Australia) 5. The Company’s best estimate of dividend yield, representing a discount to long-term dividend policy to reflect build up of dividend
payout over the life of the performance rights. 14. RESERVES Option Reserve The option reserve is used to recognise the fair value of share options and employee incentive rights granted.
2013 $’000
2012 $’000
Reserves: Options Reserve 6,650 4,614 Total Reserves 6,650 4,614
15. CONTROLLED ENTITIES The consolidated financial statements include the financial statements of Blue Energy Limited and the subsidiaries listed in the following table.
Percentage Owned (%)
Name State/Country of
Incorporation 2013
2012
Blue Energy (Qld) Pty Ltd New South Wales 100% 100% Eureka Petroleum Pty Ltd Queensland 100% 100% Kompliment Pty Ltd Western Australia 100% 100% Everdue Pty Ltd Western Australia 100% 100% Energy Investments PNG Pty Ltd Western Australia 100% 100% Galilee Pipelines Pty Ltd Queensland 100% 100% Mardian Pty Ltd * Queensland 100% 100%
* Effective 30 August 2013 Mardian Pty Ltd changed name to Blue Energy Wiso Pty Ltd. 16. INTERESTS IN JOINT VENTURE OPERATIONS
Joint Venture Partner Interest Interest 2013 2012
Burrum CSM Joint Venture Beach Energy Limited 75% 75% The joint venture interests amount to exploration and evaluation expenditure. The recoverability of the carrying amount of the exploration and evaluation assets is dependent on successful development and commercial exploitation, or alternatively, sale of the respective areas of interest. There are no joint venture assets or liabilities as the respective parties are in the process of earning their relevant interests, therefore joint venture interests have been recognised at cost. Details of arrangements entered into with farminees ATP 613P, 674P, 733P – Maryborough Basin, Queensland The Company farmed in to the sections of ATP 613P, 674P and 733P in 2006, as a non-operating participant. During 2009 the Company executed an amendment to the farm-in agreement that now sees the Company as the operator of the tenements and outlines an agreed work program for the Company to earn a 75% interest in the entire area covered by the ATP’s.
For
per
sona
l use
onl
y

N O T E S T O T H E F I N A N C I A L S T A T E M E N T S
For the year ended 30 June 2013
BLUE ENERGY LIMITED AND CONTROLLED ENTITIES
36
17. COMMITMENTS (a) Operating Lease Commitments The Consolidated Entity leases office premises and car parking under a non-cancellable operating lease. The lease terminates on 28 March 2014 and has an escalation clause of 5% per annum. There are no renewal rights on the leases.
18. RELATED PARTY DISCLOSURE
During the financial year the following related party transactions occurred: Key Management Personnel
Director or Consulting fees were paid to or accrued by the following and are related party transactions:
2013 $’000
2012 $’000
Tripenta Energy Solutions – an entity associated with Paul Massarotto (Director of Blue Energy Limited - February 2009 to November2012)
26 75
Decambruns Pty Ltd – an entity associated with Rodney Cameron (Director of Blue Energy Limited – November 2011 to present)
65 51
KOGAS Australia Pty Ltd – a company associated with Heung-Bog Lee (Director of Blue Energy Limited – October 2009 to February 2013)
5 60
Other than disclosed above there have been no other transactions with related parties during the year. The ultimate parent The ultimate parent entity is Blue Energy Limited. Subsidiaries Blue Energy Limited provides funding for the subsidiaries to continue to develop their respective oil and gas exploration and evaluation activities. Terms and conditions of transactions with related parties Transactions with related parties are made in arms length transactions both at normal market prices and on commercial terms. 19. KEY MANAGEMENT PERSONNEL (a) Key Management Personnel Compensation Key Management Personnel compensation included in employee benefits is as follows:
Details of key management persons and remuneration policies are included in the Directors’Report.
2013 $’000
2012 $’000
Within 1 year 211 270 After 1 year but no more than 5 years - 211 Total 211 481
2013 $’000
2012 $’000
Short term employee benefits 1,322 1,318 Post employment benefits 89 105 Termination benefits - - Share based payments 1,925 3,622 Total 3,336 5,045
For
per
sona
l use
onl
y

N O T E S T O T H E F I N A N C I A L S T A T E M E N T S
For the year ended 30 June 2013
BLUE ENERGY LIMITED AND CONTROLLED ENTITIES
37
(b) Number of options/incentive rights held byKey Management Personnel at the reporting date The movement in the number of options/incentive rights over ordinary shares in Blue Energy Limited held, directly, indirectly or beneficially, by each Key Management Person, including their related parties, is as follows: 2013 Balance at
30 June 2012 Granted as
Compensation Exercised Expired Ceased
being KMP Balance at
30 June 2013 Vested and Exercisable
at 30 June 2013 Number Number Number Number Number Number Number Directors P Cockcroft 4,000,000 - - - 4,000,000 - - J Phillips 9,434,000 3,467,000 - - - 12,901,000 267,000 P Massarotto 1,200,000 - - - 1,200,000 - - J Ellice-Flint 82,473,000 - - - - 82,473,000 - Total 97,107,000 3,467,000 - - 5,200,000 95,374,000 267,000
Executives S Owen 6,427,000 1,791,000 167,000 2,833,000 - 5,218,000 187,000 C Hefner 3,270,000 1,676,000 - 4,427,000 519,000 - - Total 9,697,000 3,467,000 167,000 7,260,000 519,000 5,218,000 187,000
2012 Balance at
30 June 2011 Granted as
Compensation Expired Balance at
30 June 2012 Vested and Exercisable
at 30 June 2012 Number Number Number Number Number Directors P Cockcroft 4,000,000 - - 4,000,000 - J Phillips 5,967,000 3,467,000 - 9,434,000 - P Massarotto 1,200,000 - - 1,200,000 - J Ellice-Flint - 82,473,000 - 82,473,000 - Total 11,167,000 85,940,000 - 97,107,000 -
Executives S Owen 4,680,000 1,747,000 - 6,427,000 167,000 C Hefner 1,635,000 1,635,000 - 3,270,000 - Total 6,315,000 3,382,000 - 9,697,000 167,000
The fair value of options/incentive rights is provided in the Remuneration Report section of the Directors’ Report and in Note 13. (c) Shareholdings of Key Management Personnel at the reporting date The movement during the year in the number of ordinary shares in Blue Energy Limited held, directly, indirectly or beneficial ly, by each Key Management Person, including their related parties, is as follows:
2013
Balance at 30 June 2012
Granted as compensation
On exercise of Options
On Market Purchase
Net Change Other
Balance at 30 June 2013
Number Number Number Number Number* Number Directors P Cockcroft * 149,178 - - - (149,178) - J Phillips 294,799 - - - - 294,799
P Massarotto * 1,752,000 - - - (1,752,000) - John Ellice-Flint 57,211,615 - - 745,000 - 57,956,615 Total 59,407,592 - - 745,000 (1,901,178) 58,251,414
Executives
S Owen 456,198 - 150,870 400,000 - 1,007,068 C Hefner * 131,000 - - - (131,000) - Total 587,198 - 150,870 400,000 (131,000) 1,007,068
* No longer key management person.
2012 Balance at 30 June 2011
Granted as Compensation
On exercise of Options
Net Change Other
Balance at 30 June 2012
Number Number Number Number** Number Directors
P Cockcroft 149,178 - - - 149,178 J Phillips 54,799 - - 240,000 294,799
P Massarotto 1,490,000 - - 262,000 1,752,000 J Ellice-Flint - 41,236,500 - 15,975,115 57,211,615 Total 1,693,977 41,236,500 - 16,477,115 59,407,592
Executives
S Owen 216,198 - - 240,000 456,198 C Hefner 83,000 - - 48,000 131,000 Total 299,198 - - 288,000 587,198
** Purchased or held on appointment. There were no other transactions with Key Management Personnel during the year.
For
per
sona
l use
onl
y
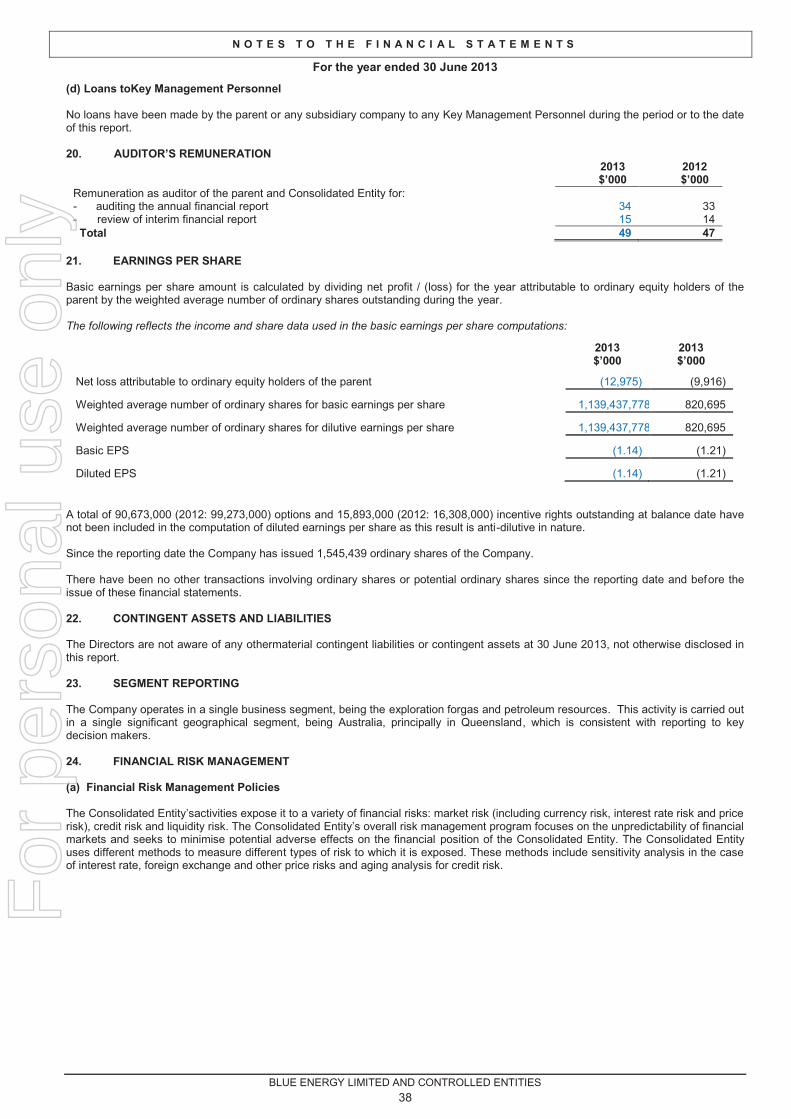
N O T E S T O T H E F I N A N C I A L S T A T E M E N T S
For the year ended 30 June 2013
BLUE ENERGY LIMITED AND CONTROLLED ENTITIES
38
(d) Loans toKey Management Personnel No loans have been made by the parent or any subsidiary company to any Key Management Personnel during the period or to the date of this report. 20. AUDITOR’S REMUNERATION
2013 $’000
2012 $’000
Remuneration as auditor of the parent and Consolidated Entity for: - auditing the annual financial report 34 33 - review of interim financial report 15 14 Total 49 47
21. EARNINGS PER SHARE Basic earnings per share amount is calculated by dividing net profit / (loss) for the year attributable to ordinary equity holders of the parent by the weighted average number of ordinary shares outstanding during the year. The following reflects the income and share data used in the basic earnings per share computations:
A total of 90,673,000 (2012: 99,273,000) options and 15,893,000 (2012: 16,308,000) incentive rights outstanding at balance date have not been included in the computation of diluted earnings per share as this result is anti-dilutive in nature. Since the reporting date the Company has issued 1,545,439 ordinary shares of the Company. There have been no other transactions involving ordinary shares or potential ordinary shares since the reporting date and before the issue of these financial statements. 22. CONTINGENT ASSETS AND LIABILITIES The Directors are not aware of any othermaterial contingent liabilities or contingent assets at 30 June 2013, not otherwise disclosed in this report. 23. SEGMENT REPORTING The Company operates in a single business segment, being the exploration forgas and petroleum resources. This activity is carried out in a single significant geographical segment, being Australia, principally in Queensland, which is consistent with reporting to key decision makers. 24. FINANCIAL RISK MANAGEMENT (a) Financial Risk Management Policies The Consolidated Entity’sactivities expose it to a variety of financial risks: market risk (including currency risk, interest rate risk and price risk), credit risk and liquidity risk. The Consolidated Entity’s overall risk management program focuses on the unpredictability of financial markets and seeks to minimise potential adverse effects on the financial position of the Consolidated Entity. The Consolidated Entity uses different methods to measure different types of risk to which it is exposed. These methods include sensitivity analysis in the case of interest rate, foreign exchange and other price risks and aging analysis for credit risk.
2013 $’000
2013 $’000
Net loss attributable to ordinary equity holders of the parent (12,975) (9,916)
Weighted average number of ordinary shares for basic earnings per share 1,139,437,778 820,695
Weighted average number of ordinary shares for dilutive earnings per share 1,139,437,778 820,695
Basic EPS (1.14) (1.21)
Diluted EPS (1.14) (1.21)
For
per
sona
l use
onl
y

N O T E S T O T H E F I N A N C I A L S T A T E M E N T S
For the year ended 30 June 2013
BLUE ENERGY LIMITED AND CONTROLLED ENTITIES
39
(a)(i) Financial Risk Exposures and Management The main risksthe Consolidated Entity is exposed to through its financial instruments is interest rate risk, liquidity risk and credit risk. Interest Rate Risk The following table sets out the carrying amountof the Consolidated Entity’s financial instruments that are exposed to interest rate risk:
Interest on financial instruments classified as floating rate is re-priced at intervals of less than one year. Liquidity Risk The group and parent entity manages liquidity risk by monitoring and managing forecast cash flows. Credit Risk At balance date the maximum exposure to credit risk to recognised financial assets is the carrying amount, net of any provisions for impairment of those assets, as disclosed in the statement of financial position and notes to the financial statements. (a)(ii) Capital Management The ConsolidatedEntitymaintains a system of controls which provide for continual monitoring of future cash flow requirements, allowing it to put in place appropriate facilities to ensure that sufficient funds are available to fund the Company’s activities in the short to medium term. The Consolidated Entity’s underlying objectives with respect to managing capital are to safeguard their ability to continue as a going concern to enable the Consolidated Entity to operate to increase shareholder value. While the Consolidated Entity’s activities comprise mainly exploration and appraisal operations, funding through equity, rather than debt, is considered to be the most appropriate capital structure. There were no changes to the Consolidated Entity’s approach to capital management or the financial risk management policies during the year. Neither the Company nor any of its subsidiaries are subject to externally imposed capital requirements. (a)(iii) Price Risk There is no price risk exposure as at 30 June 2013 (2012: $Nil).
2013 Note Weighted Average
Interest Rate
Fixed Interest Rate
$’000
Floating Interest Rate
$’000
Non- Interest Bearing
$’000
Total
$’000
Financial Assets Cash at bank and in hand 6 2.36% - 1,168 - 1,168 Short-term deposits 6 4.37% 15,777 - - 15,777 Trade and other receivables 7 - - - 395 395 Total 15,777 1,168 395 17,340
Financial Liabilities Trade and other payables 11 - - - 504 504 Total - - 504 504
2012 Note Weighted Average
Interest Rate
Fixed Interest Rate
$’000
Floating Interest Rate
$’000
Non- Interest Bearing
$’000
Total
$’000
Financial Assets Cash at bank and in hand 6 3.50% - 2,620 - 2,620 Short-term deposits 6 5.66% 19,289 - - 19,289 Trade and other receivables 7 - - - 437 437 Total - 19,289 2,620 437 22,346
Financial Liabilities Trade and other payables 11 - - - 999 999 Joint venture commitments 11 - - - 359 359 Total - - - 1,358 1,358
For
per
sona
l use
onl
y

N O T E S T O T H E F I N A N C I A L S T A T E M E N T S
For the year ended 30 June 2013
BLUE ENERGY LIMITED AND CONTROLLED ENTITIES
40
(b) Financial Instruments (b)(i) Financial Instrument Composition and Maturity Analysis The following tables reflect the undiscounted contractual settlement terms for financial instruments of a fixed period of maturity, as well as management’s expectations of the settlement period for all other financial instruments. As such, the amounts may not reconcile to the statement of financial position. The ageing analysis of trade and other receivables is as follows:
2013 2012 Note $’000 $’000
0 – 30 days 7a 262 304 31 – 60 days - - 61 – 90 days - - 91 days + 7b 133 584
Trade and other receivables 395 888
Movement in Carrying Amounts
2013 2012 $’000 $’000
Trade and other receivables assessed as impaired at the beginning of the year - - Impairment expense included in the consolidated statement of comprehensive income - 451
Trade and other receivables assessed as impaired at the end of the year - 451
Trade and other payables are expected to be settled as follows:
Note 2013 2012 $’000 $’000
Less than 6 months 11 504 1,358
Current trade and other payables 504 1,358
(b)(ii) Net Fair Values Net fair values of financial assets and liabilities are materially in line with carrying values at 30 June 2013 and 30 June 2012. (b)(iii) Interest Rate Sensitivity Analysis The Consolidated Entityhas performed a sensitivity analysis relating to exposure to interest rate risk at balance date. This sensitivity analysis demonstrates the effect on the current year results and equity which could result from a change in these risks. At 30 June 2013, the effect on profit and equity as a result of changes in the interest rate, with all other variables remaining constant are estimated as follows:
2013 $’000
2012 $’000
Change in profit/(loss) - Increase in interest rate by 2% - Decrease in interest rate by 2%
339
(339)
438
(438) Change in equity
- Increase in interest rate by 2% - Decrease in interest rate by 2%
339 (339)
438 (438)
25. EVENTS SUBSEQUENT TO REPORTING DATE From 1 July to the date of this report there have been no material events other than those detailed below. Wiso Basin Farm in On 8 August 2013 the Company announced that it had entered into a binding term sheet with Australian Oil and Gas Limited (“AOG”) in relation to nine large exploration blocks in the Wiso Basin in the Northern Territory.The proposed farm-in agreement – to be undertaken by a Blue Energy wholly-owned subsidiary – involves a total area of 111,887 square kilometres (27.6 million acres) of the Northern Territory (NT). Key Points:
· 111,887km2 (27.6 million acres) in area, with conventional and unconventional oil and gas potential over 9 contiguous blocks
· Dominant basin position
· Stage farm-in agreement
· 50% equity on completion of farm-in work program
· Blue Energy to become operator at commencement of farm-in
· The cost of the farmin in the first 2 years (from award of the permits) is estimated at $3 million
For
per
sona
l use
onl
y

N O T E S T O T H E F I N A N C I A L S T A T E M E N T S
For the year ended 30 June 2013
BLUE ENERGY LIMITED AND CONTROLLED ENTITIES
41
26. CHANGE IN ACCOUNTING POLICIES Certain new accounting Standards and Interpretations have been published that are not mandatory for 30 June 2013 reporting periods.As at balance date, the following Standards and Interpretations had been issued/revised but were not yet effective: Title Issue Date Effective Date
AASB 9: Financial Instruments AASB 10: Consolidated Financial Statements AASB 11: Joint Arrangements AASB 12: Disclosure of Interests in Other Entities
December 2009 August 2011 August 2011 August 2011
1 January 2015 1 January 2013 1 January 2013 1 January 2013
AASB 1053: Application of Tiers of Australian Accounting Standards AASB 2011-4: Amendments to Australian Accounting Standards – Removal of Individual Key Management Personnel Disclosure Requirements
June 2010
July 2011
1 July 2013
1 July 2013
It is anticipated that the above Standards and Interpretations are either not applicable to the Company or that adoption in future periods will have no material impact on the Company’s financial report, with the possible exception of AASB 11 and AASB 12.AASB 11 may need to be adopted (replacing AASB 131) if any joint venture arrangements are entered into in the future. AASB 12 may require Blue Energy to make additional disclosures in respect of interests in other entities. Blue Energy is currently evaluating the potential impact of these new accounting standards and a closer assessment will be performed prior to the effective dates of these standards. 27. PARENT ENTITY FINANCIAL INFORMATION (a) Summary financial information The individual financial report for the parent entity shows the following aggregate amounts:
2013 2012 Statement of Financial Position $’000 $’000
Current assets 17,695 22,592 Total assets 73,360 85,778 Current liabilities 504 1,624 Total liabilities 514 1,624 Shareholders’ equity Issued capital 130,245 130,055 Reserves 6,649 4,614* Accumulated losses (64,048) (50,515)* 72,846 84,154 Statement of Comprehensive Income Loss for the year attributable to owners of the parent (13,533) (9,448) Total comprehensive loss attributable to owners of the parent (13,533) (9,448)
* A prior period restatement of $0.805 million between retained earnings and reserves was made during the half-year ended 31 December 2012. Full disclosure of the nature of this restatement was made at this time. (b) Guarantees entered into by the parent entity There are no parent entity guarantees (2012: $Nil). (c) Contingent liabilities of the parent entity See Note 22. (d) Contractual commitments for the acquisition of property, plant and equipment As at 30 June 2013, the parent entity had no contractual commitments for the acquisition of property, plant and equipment (2012: $Nil). 28. COMPANY DETAILS REGISTERED OFFICE and PRINCIPAL PLACE OF BUSINESS
Level 3 410Queen Street Brisbane QLD 4000
For
per
sona
l use
onl
y

For
per
sona
l use
onl
y

Crowe Horwath Brisbane is a member of Crowe Horwath International, a Swiss verein. Each member of Crowe Horwath is a separate and independent legal entity. Liability limited by a scheme approved under Professional Standards Legislation other than for the acts or omissions of financial services licensees.
Crowe Horwath Brisbane ABN 79 981 227 862 Member Crowe Horwath International Level 16 120 Edward Street Brisbane QLD 4000 Australia GPO Box 736 Brisbane QLD 4001 Australia Tel +61 7 3233 3555 Fax +61 7 3233 3567 www.crowehorwath.com.au
43
Independent Auditor’s Report
To the members of Blue Energy Limited
Report on the Financial Statements
We have audited the accompanying financial report of Blue Energy Limited, which comprises the consolidated statement of financial position as at 30 June 2013, the consolidated statement of comprehensive income, the consolidated statement of changes in equity and the consolidated statement of cash flows for the year then ended, notes comprising a summary of significant accounting policies and other explanatory information, and the directors’ declaration of the consolidated entity comprising the company and the entities it controlled at the year’s end or from time to time during the financial year. Directors’ Responsibility for the Financial Report
The directors of the company are responsible for the preparation of a financial report that gives a true and fair view in accordance with Australian Accounting Standards and the Corporations Act 2001 and for such internal control as the directors determine is necessary to enable the preparation of the financial a report that gives a true and fair view and is free from material misstatement, whether due to fraud or error. In Note 1, the directors also state, in accordance with Accounting Standard AASB 101 Presentation of Financial Statements, that the financial statements comply with International Financial Reporting Standards. Auditor’s Responsibility
Our responsibility is to express an opinion on the financial report based on our audit. We conducted our audit in accordance with Australian Auditing Standards. Those standards require that we comply with relevant ethical requirements relating to audit engagements and plan and perform the audit to obtain reasonable assurance about whether the financial report is free from material misstatement. An audit involves performing procedures to obtain audit evidence about the amounts and disclosures in the financial report. The procedures selected depend on the auditor’s judgement, including the assessment of the risks of material misstatement of the financial report, whether due to fraud or error. In making those risk assessments, the auditor considers internal control relevant to the company’s preparation of the financial report that give a true and fair view in order to design audit procedures that are appropriate in the circumstances, but not for the purpose of expressing an opinion on the effectiveness of the company’s internal control. An audit also includes evaluating the appropriateness of accounting policies used and the reasonableness of accounting estimates made by the directors, as well as evaluating the overall presentation of the financial report. We believe that the audit evidence we have obtained is sufficient and appropriate to provide a basis for our audit opinion.
For
per
sona
l use
onl
y

44
Independence
In conducting our audit, we have complied with the independence requirements of the Corporations Act 2001. We confirm that the independence declaration required by the Corporations Act 2001, which has been given to the members of Blue Energy Limited, would be in the same terms if given to the directors as at the time of this auditor’s report. Opinion
In our opinion: a) the financial report of Blue Energy Limited is in accordance with the Corporations Act 2001,
including:
i. giving a true and fair view of the company and consolidated entity’s financial position as at 30 June 2013 and of it’s performance for the year ended on that date; and
ii. complying with Australian Accounting Standards, and the Corporations Regulations 2001; and
b) the consolidated financial report also complies with International Financial Reporting Standards as disclosed in Note 1.
Report on the Remuneration Report
We have audited the Remuneration Report included in pages 9 to 14 of the directors’ report for the year ended 30 June 2013. The directors of the company are responsible for the preparation and presentation of the Remuneration Report in accordance with section 300A of the Corporations Act 2001. Our responsibility is to express an opinion on the Remuneration Report, based on our audit conducted in accordance with Australian Auditing Standards. Opinion
In our opinion, the Remuneration Report of Blue Energy Limited and its controlled entities for the year ended 30 June 2013, complies with section 300A of the Corporations Act 2001.
CROWE HORWATH BRISBANE
BRENDAN WORRALL Partner Signed at Brisbane, 17 September 2013
For
per
sona
l use
onl
y

A D D I T I O N A L S H A R E H O L D E R I N F O R M A T I O N
BLUE ENERGY LIMITED AND CONTROLLED ENTITIES
45
Additional Shareholder Information Additional information required by the ASX Ltd and not shown elsewhere in this report is as follows. The information is current as at 30 August 2013. (a) Distribution of Equity Securities Ordinary Share Capital There are 1,140,993,237 fully paid ordinary shares, held by 5,486individual shareholders. There is no current on-market buy-back. All issued ordinary shares carry one vote per share and carry the rights to dividends. The number of holders of ordinary shares by range is:
Mr John Ellice-Flint holds 82,473,000 (83%) of the Unlisted Options. (b) Substantial Shareholders
(c) Twenty Largest Holders of Quoted Equity Securities
(d) Voting Rights Ordinary shares carry one vote per share and carry the rights to dividends. Options and rights have no voting rights or rights to dividends.
Ordinary Shares Unlisted Options Unlisted Rights
Range Total
holdersUnits
Total
holdersUnits
Total
holdersUnits
1 - 1,000 236 37,704
1,001 - 5,000 743 2,531,043
5,001 - 10,000 745 6,320,527
10,001 - 100,000 2,538 106,055,014
100,001 - 9,999,999,999 1,224 1,026,048,949 5 90,673,000 5 15,893,000
Total 5,486 1,140,993,237 5 90,673,000 5 15,893,000
Unmarketable Parcels
Minimum
Parcel Size
Holders Units
Minimum $ 500.00 parcel at $ 0.0880 per unit 5,682 1,031 2,846,596
ANZ NOMINEES LIMITED <PRIMEBROKER-PSL NO3 HLDG A/C> 114,062,417 10.00
STANWELL CORPORATION LIMITED 87,359,198 7.66
KOGAS AUSTRALIA PTY LTD 62,855,000 5.51
Paradice Investment Management Pty Ltd 57,584,901 5.05
Total 321,861,516 28.22
Name Units % of Units
ANZ NOMINEES LIMITED <PRIMEBROKER-PSL NO3 HLDG A/C> 114,062,417 10.00
STANWELL CORPORATION LIMITED 87,359,198 7.66
NATIONAL NOMINEES LIMITED 70,810,253 6.21
KOGAS AUSTRALIA PTY LTD 62,855,000 5.51
JEACH PTY LTD <THE PIPPI SUPER FUND A/C> 51,976,500 4.56
J P MORGAN NOMINEES AUSTRALIA LIMITED 26,322,078 2.31
UBS WEALTH MANAGEMENT AUSTRALIA NOMINEES PTY LTD 25,646,941 2.25
ASPAC MINING LIMITED 20,275,198 1.78
BT PORTFOLIO SERVICES LIMITED <WARRELL HOLDINGS S/F A/C> 16,100,000 1.41
MR NEIL KENNETH WATSON + MS MARGARET HELEN MORONEY
<ROSSDALE SUPER FUND A/C>14,280,000 1.25
GIRDIS SUPERANNUATION PTY LTD <GIRDIS SUPER FUND A/C> 13,439,847 1.18
MR CLEMENT MICHAEL HODDA 12,408,150 1.09
HSBC CUSTODY NOMINEES (AUSTRALIA) LIMITED 12,397,475 1.09
MIRRABOOKA INVESTMENTS LIMITED 9,030,118 0.79
MRS MYFANWY ANN JONES 5,000,000 0.44
MAPT PTY LIMITED <MAP THOM SUPER FUND A/C> 5,000,000 0.44
NOVASC PTY LTD <BELLIS AUSTRALIA SUPER A/C> 4,060,483 0.36
BETA GAMMA PTY LTD <WALSH STREET SUPER FUND A/C> 4,000,000 0.35
BOND STREET CUSTODIANS LIMITED <BPETEF - V02077 A/C> 4,000,000 0.35
JCI PTY LTD <THE MS FAMILY A/C> 4,000,000 0.35
Total 563,023,658 49.38
Name Units % of Units
For
per
sona
l use
onl
y
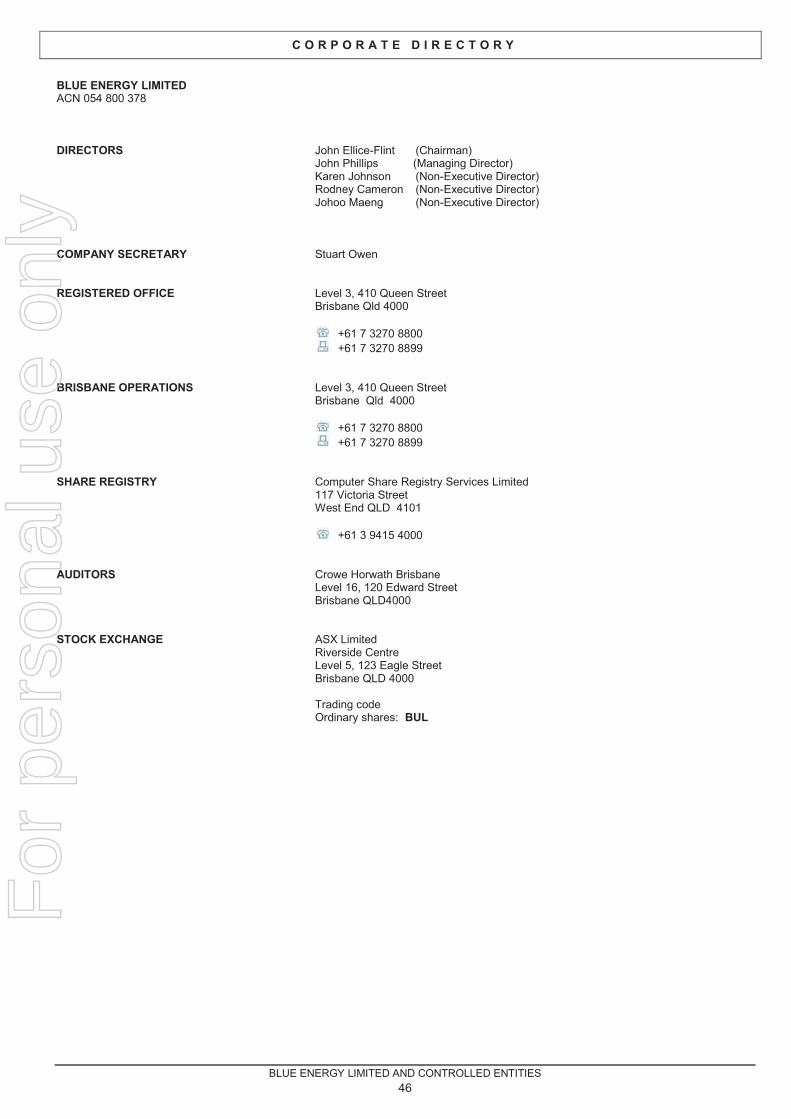
C O R P O R A T E D I R E C T O R Y
BLUE ENERGY LIMITED AND CONTROLLED ENTITIES
46
BLUE ENERGY LIMITED ACN 054 800 378
DIRECTORS
John Ellice-Flint (Chairman) John Phillips (Managing Director) Karen Johnson (Non-Executive Director) Rodney Cameron (Non-Executive Director) Johoo Maeng (Non-Executive Director)
COMPANY SECRETARY
Stuart Owen
REGISTERED OFFICE
Level 3, 410 Queen Street Brisbane Qld 4000
+61 7 3270 8800
+61 7 3270 8899
BRISBANE OPERATIONS
Level 3, 410 Queen Street Brisbane Qld 4000
+61 7 3270 8800
+61 7 3270 8899
SHARE REGISTRY
Computer Share Registry Services Limited 117 Victoria Street West End QLD 4101
+61 3 9415 4000
AUDITORS
Crowe Horwath Brisbane Level 16, 120 Edward Street Brisbane QLD4000
STOCK EXCHANGE
ASX Limited Riverside Centre Level 5, 123 Eagle Street Brisbane QLD 4000 Trading code Ordinary shares: BUL
For
per
sona
l use
onl
y